br for dummies
TRANSCRIPT

7/27/2019 BR for Dummies
http://slidepdf.com/reader/full/br-for-dummies 1/16
Theory
1) One sample test
used when one organization or one sector.It is used to test average value. Mu=3
To frame hypo, Descriptive stats table check mean(average) value. Whatever values less
than 3 take ;
H0 : mu <=3 [to interpret, for this particular parameter the average response of respondents
is negative] alpha one sided 0.05
2) Independent sample:
The data is of one organization, for single parameter. Data will be same Eg:
gender(male/female) (Delhi/Mumbai). Used for comparative study.(variance alpla 2 sided=
0.025) ( t test one sided)
H0: mu(male)=mu(female) [there is no difference in perception of respondents]
3) Paired sample t test:
Same objective. Respondents are giving response 2 times.
Product before use and after use
H0= taste in ghatkop outlet = taste in andheri
F test are used to check the variance. F test is always 2 sided hypothesis

7/27/2019 BR for Dummies
http://slidepdf.com/reader/full/br-for-dummies 2/16
PERCEPTION
One Sample Test
Analyse> compare means> one sample t test> take all 6 params>>Test value =3
One-Sample Statistics
N Mean Std.
Deviation
Std. Error
Mean
What are your views
about plastic bags
since the ban [Plastic
Bag is must when
buying
groceries/vegetables ]
44 2.7955 1.37383 .20711
[Plastic Bag is harmful
for environment]44 1.4091 .87120 .13134
[I do not wish to quit
using Plastic Bags] 44 3.5000 1.15134 .17357
[I try to avoid Plastic
Bags as much as I can]44 2.7727 1.13841 .17162
[Plastic Bag Ban is not
enforced properly]44 1.7955 .92960 .14014
[Paper Bag is not a
useful substitute for
plastic bag ]
44 3.1591 1.32846 .20027
7/27/2019 BR for Dummies
http://slidepdf.com/reader/full/br-for-dummies 3/16
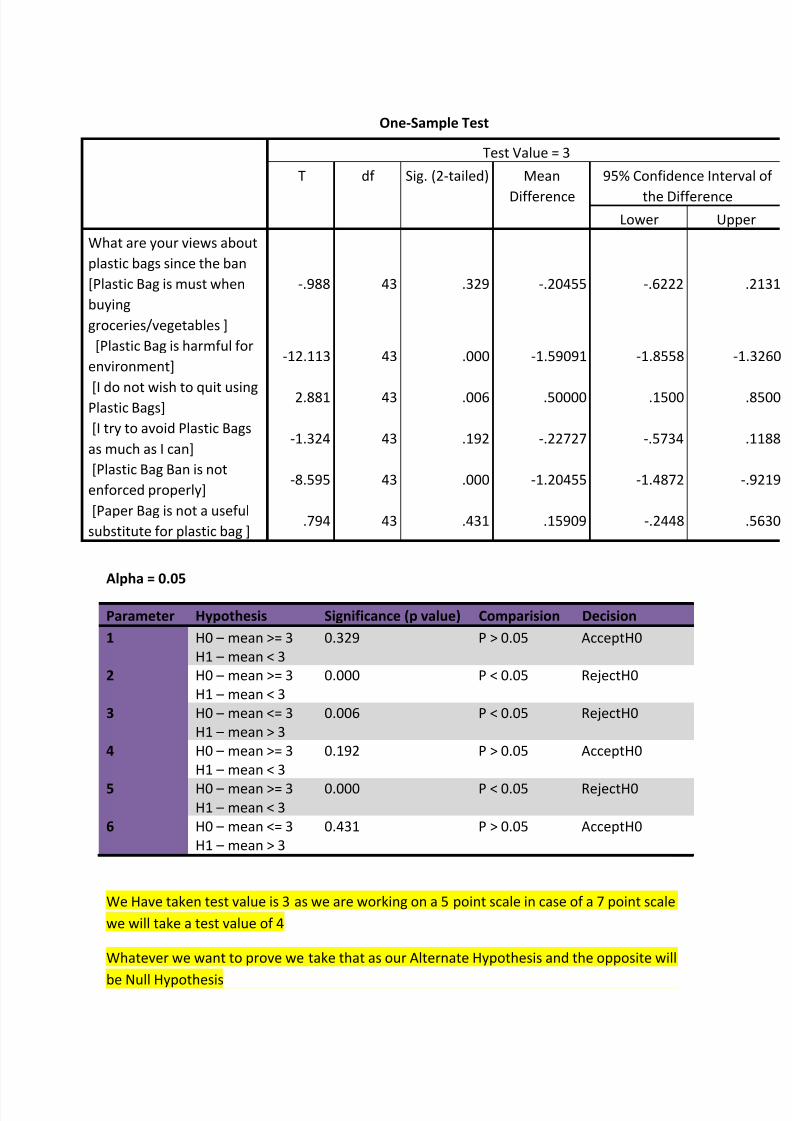
One-Sample Test
Test Value = 3
T df Sig. (2-tailed) Mean
Difference
95% Confidence Interval of
the Difference
Lower Upper
What are your views about
plastic bags since the ban
[Plastic Bag is must when
buying
groceries/vegetables ]
-.988 43 .329 -.20455 -.6222 .2131
[Plastic Bag is harmful for
environment]-12.113 43 .000 -1.59091 -1.8558 -1.3260
[I do not wish to quit using
Plastic Bags]2.881 43 .006 .50000 .1500 .8500
[I try to avoid Plastic Bags
as much as I can]-1.324 43 .192 -.22727 -.5734 .1188
[Plastic Bag Ban is not
enforced properly]-8.595 43 .000 -1.20455 -1.4872 -.9219
[Paper Bag is not a useful
substitute for plastic bag ].794 43 .431 .15909 -.2448 .5630
Alpha = 0.05
Parameter Hypothesis Significance (p value) Comparision Decision
1 H0 – mean >= 3
H1 – mean < 3
0.329 P > 0.05 AcceptH0
2 H0 – mean >= 3
H1 – mean < 3
0.000 P < 0.05 RejectH0
3 H0 – mean <= 3
H1 – mean > 3
0.006 P < 0.05 RejectH0
4 H0 – mean >= 3
H1 –
mean < 3
0.192 P > 0.05 AcceptH0
5 H0 – mean >= 3
H1 – mean < 3
0.000 P < 0.05 RejectH0
6 H0 – mean <= 3
H1 – mean > 3
0.431 P > 0.05 AcceptH0
We Have taken test value is 3 as we are working on a 5 point scale in case of a 7 point scale
we will take a test value of 4
Whatever we want to prove we take that as our Alternate Hypothesis and the opposite willbe Null Hypothesis
7/27/2019 BR for Dummies
http://slidepdf.com/reader/full/br-for-dummies 4/16
For 1st
question Mean is less than 3 and hence H1 is U(Mean)<3 and hence H0 is
U(Mean)>=3
But for 3rd
question Mean is greater than 3 and hence H1 is U(Mean)>3 and hence H0 is
U(Mean)<=3
Interpretation
Interpret only those statements that are on the positive side that is Strongly Agree side Do
not interpret statements that are on the negative side.
That the consumers are in favourable agreement that plastic bags are harmful for
environment, ban is not enforced properly and paper bags are not useful substitute of
plastic bags, the results are found to be statistically significant.
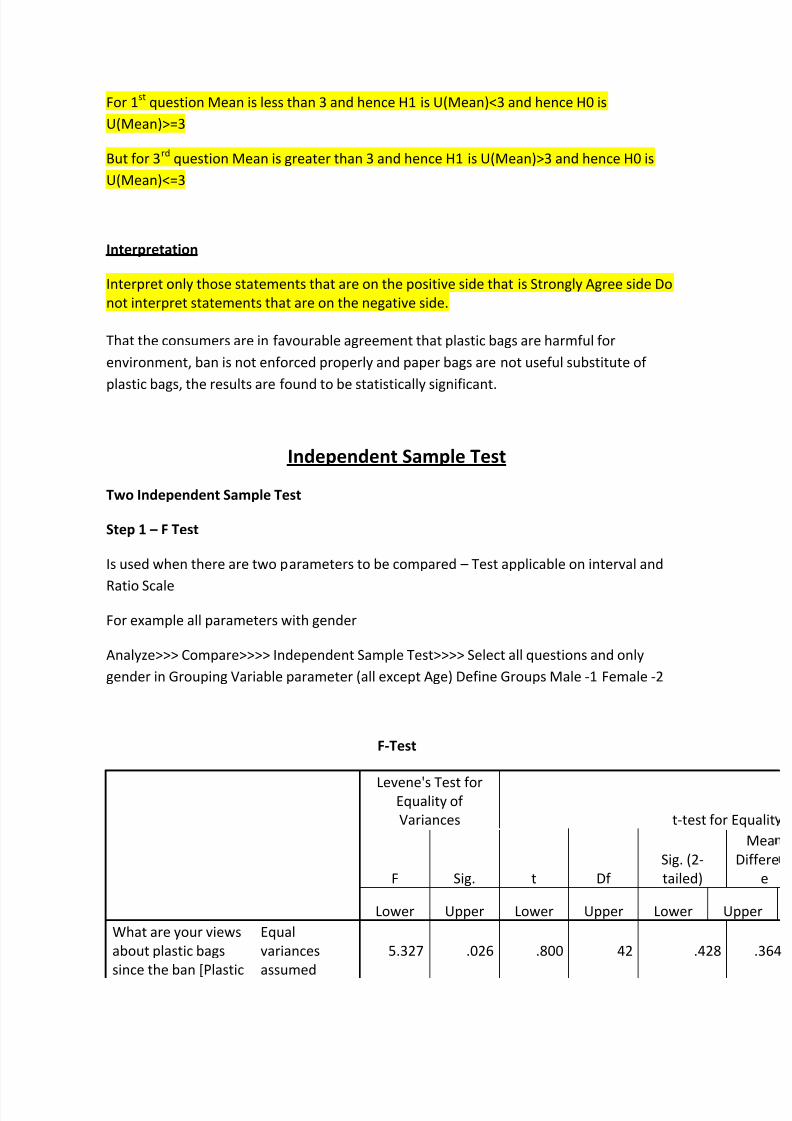
Independent Sample Test
Two Independent Sample Test
Step 1 – F Test
Is used when there are two parameters to be compared – Test applicable on interval and
Ratio Scale
For example all parameters with gender
Analyze>>> Compare>>>> Independent Sample Test>>>> Select all questions and only
gender in Grouping Variable parameter (all except Age) Define Groups Male -1 Female -2
F-Test
Levene's Test for
Equality of
Variances t-test for Equalit
F Sig. t Df
Sig. (2-
tailed)
Mea
Differe
e
Lower Upper Lower Upper Lower Upper
What are your views
about plastic bagssince the ban [Plastic
Equal
variancesassumed 5.327 .026 .800 42 .428 .364
7/27/2019 BR for Dummies
http://slidepdf.com/reader/full/br-for-dummies 5/16
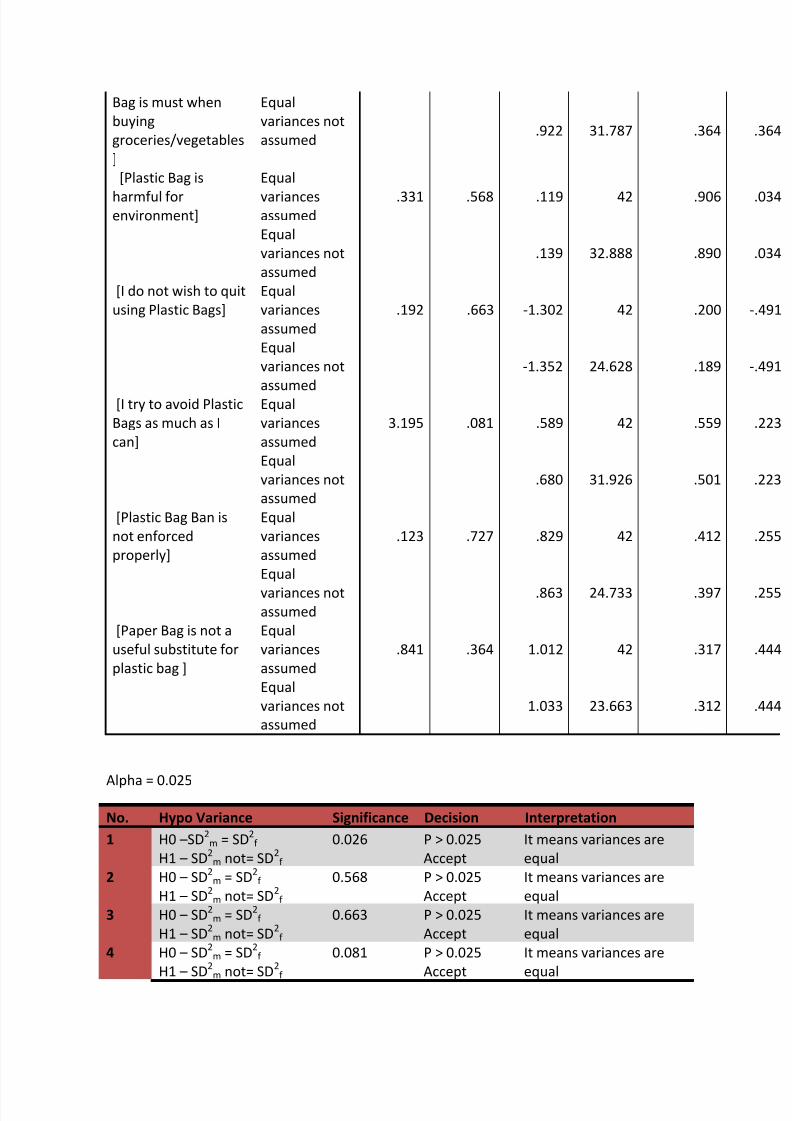
Bag is must when
buying
groceries/vegetables
]
Equal
variances not
assumed.922 31.787 .364 .364
[Plastic Bag is
harmful for
environment]
Equal
variances
assumed
.331 .568 .119 42 .906 .034
Equal
variances not
assumed
.139 32.888 .890 .034
[I do not wish to quit
using Plastic Bags]
Equal
variances
assumed
.192 .663 -1.302 42 .200 -.491
Equal
variances not
assumed
-1.352 24.628 .189 -.491
[I try to avoid Plastic
Bags as much as I
can]
Equal
variances
assumed
3.195 .081 .589 42 .559 .223
Equal
variances not
assumed
.680 31.926 .501 .223
[Plastic Bag Ban is
not enforced
properly]
Equal
variances
assumed
.123 .727 .829 42 .412 .255
Equalvariances not
assumed
.863 24.733 .397 .255
[Paper Bag is not a
useful substitute for
plastic bag ]
Equal
variances
assumed
.841 .364 1.012 42 .317 .444
Equal
variances not
assumed
1.033 23.663 .312 .444
Alpha = 0.025
No. Hypo Variance Significance Decision Interpretation
1 H0 –SD2
m = SD2
f
H1 – SD2
m not= SD2
f
0.026 P > 0.025
Accept
It means variances are
equal
2 H0 – SD2
m = SD2
f
H1 – SD2
m not= SD2
f
0.568 P > 0.025
Accept
It means variances are
equal
3 H0 – SD2
m = SD2
f
H1 – SD2
m not= SD2
f
0.663 P > 0.025
Accept
It means variances are
equal
4 H0 –
SD
2
m = SD
2
f H1 – SD
2m not= SD
2f
0.081 P > 0.025Accept
It means variances areequal
7/27/2019 BR for Dummies
http://slidepdf.com/reader/full/br-for-dummies 6/16
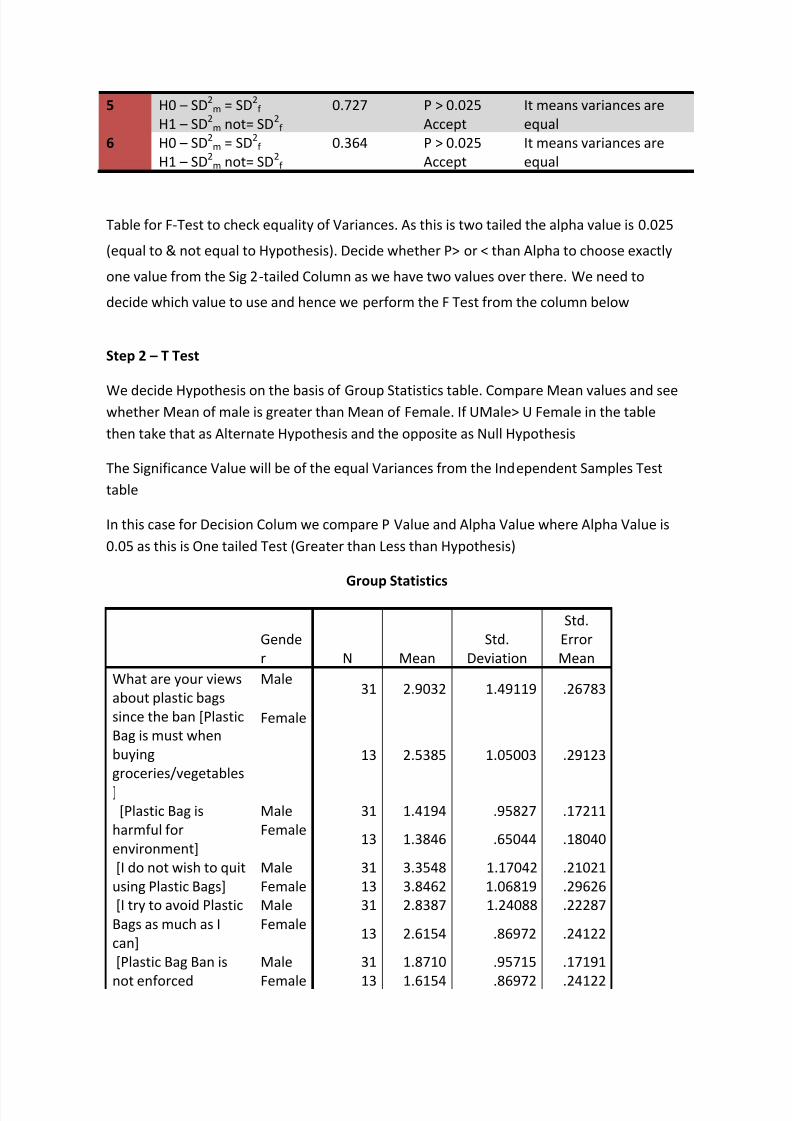
5 H0 – SD2
m = SD2
f
H1 – SD2
m not= SD2
f
0.727 P > 0.025
Accept
It means variances are
equal
6 H0 – SD2
m = SD2
f
H1 – SD2
m not= SD2
f
0.364 P > 0.025
Accept
It means variances are
equal
Table for F-Test to check equality of Variances. As this is two tailed the alpha value is 0.025
(equal to & not equal to Hypothesis). Decide whether P> or < than Alpha to choose exactly
one value from the Sig 2-tailed Column as we have two values over there. We need to
decide which value to use and hence we perform the F Test from the column below
Step 2 – T Test
We decide Hypothesis on the basis of Group Statistics table. Compare Mean values and see
whether Mean of male is greater than Mean of Female. If UMale> U Female in the table
then take that as Alternate Hypothesis and the opposite as Null Hypothesis
The Significance Value will be of the equal Variances from the Independent Samples Test
table
In this case for Decision Colum we compare P Value and Alpha Value where Alpha Value is
0.05 as this is One tailed Test (Greater than Less than Hypothesis)
Group Statistics
Gende
r N Mean
Std.
Deviation
Std.
Error
Mean
What are your views
about plastic bags
since the ban [Plastic
Bag is must when
buying
groceries/vegetables
]
Male31 2.9032 1.49119 .26783
Female
13 2.5385 1.05003 .29123
[Plastic Bag is
harmful for
environment]
Male 31 1.4194 .95827 .17211
Female13 1.3846 .65044 .18040
[I do not wish to quit
using Plastic Bags]
Male 31 3.3548 1.17042 .21021
Female 13 3.8462 1.06819 .29626
[I try to avoid Plastic
Bags as much as I
can]
Male 31 2.8387 1.24088 .22287
Female13 2.6154 .86972 .24122
[Plastic Bag Ban is
not enforced
Male 31 1.8710 .95715 .17191
Female 13 1.6154 .86972 .24122

7/27/2019 BR for Dummies
http://slidepdf.com/reader/full/br-for-dummies 7/16
properly]
[Paper Bag is not a
useful substitute for
plastic bag ]
Male 31 3.2903 1.34644 .24183
Female13 2.8462 1.28103 .35529
Alpha = 0.05
No. Hypo Mean Significance Decision Interpretation
1 H0 – Um<= Uf
H1 – Um> Uf
0.428 P > 0.05
Accept
The perception of the male consumers
for the 1st
parameter i.e. plastic bag is a
must, is less than perception of female
consumers.
2 H0 – Um<= Uf
H1 – Um> Uf
0.906 P > 0.05
Accept
The perception of the male consumers
for the 2nd
parameter i.e. plastic bag is
harmful, is less than perception of female consumers.
3 H0 – Um>= Uf
H1 – Um< Uf
0.200 P > 0.05
Accept
The perception of the male consumers
for the 3rd
parameter i.e. I do wish to
quit plastic bag, is more than perception
of female consumers.
4 H0 – Um<= Uf
H1 – Um> Uf
0.589 P > 0.05
Accept
The perception of the male consumers
for the 4th
parameter i.e. I try to avoid
plastic bag, is less than perception of
female consumers.
5 H0 –
Um<= Uf H1 – Um> Uf
0.412 P > 0.05Accept
The perception of the male consumersfor the 5
thparameter i.e. plastic bag ban
is not enforced properly, is less than
perception of female consumers.
6 H0 – Um<= Uf
H1 – Um> Uf
0.317 P > 0.05
Accept
The perception of the male consumers
for the 6th
parameter i.e. paper bag is
not a substitute of plastic bag, is less
than perception of female consumers.

7/27/2019 BR for Dummies
http://slidepdf.com/reader/full/br-for-dummies 8/16
COMPARATIVE PERCEPTION
Taste:
Check mean>> frame hypothesis
H1: Average of dhaba is > average of mess in terms of taste
H0: opposite of H1
This is one sided, so value of alpha is 0.05. One sided cos >, < signs are used.
H0 – U (D Taste) <= U (M Taste)
H1 –
U (D Taste) > U (M Taste)
Alpha is 0.05 because test is one sided hypothesis since we have ><
P < Alpha, which means we reject H0 and Accept H1
So we conclude that average satisfaction rating of dhaba is more than Mess with respect to taste.
Mean N Std. DeviationStd. Error
Mean
Pair 1 Rating of mess on taste 2.27 45 1.116 .166
Rating of dhaba on taste 3.93 45 .889 .133
Pair 2 Rating of mess on menu 2.31 45 1.164 .174
Rating of dhaba on menu 3.73 45 .939 .140
Pair 3 Rating of mess on cost 3.20 45 1.036 .154
Rating of dhaba on cost 3.13 45 .968 .144
Pair 4 Rating of mess on qualityof ingredients 2.69 45 .821 .122
Rating of dhaba on qualityof ingredients 2.69 45 .763 .114
Pair 5 Rating of mess on hygiene2.89 45 .959 .143
Rating of dhaba on
hygiene 2.09 45 .793 .118Pair 6 Rating of mess on service
quality 3.11 45 .959 .143
Rating of dhaba on servicequality 2.98 45 .839 .125
Pair 7 Rating of mess onambience 3.18 45 .936 .140
Rating of dhaba onambience 2.62 45 .960 .143
Pair 8 Rating of mess on nutrition2.96 45 .976 .145
Rating of dhaba on
nutrition 2.49 45 .815 .122
7/27/2019 BR for Dummies
http://slidepdf.com/reader/full/br-for-dummies 9/16
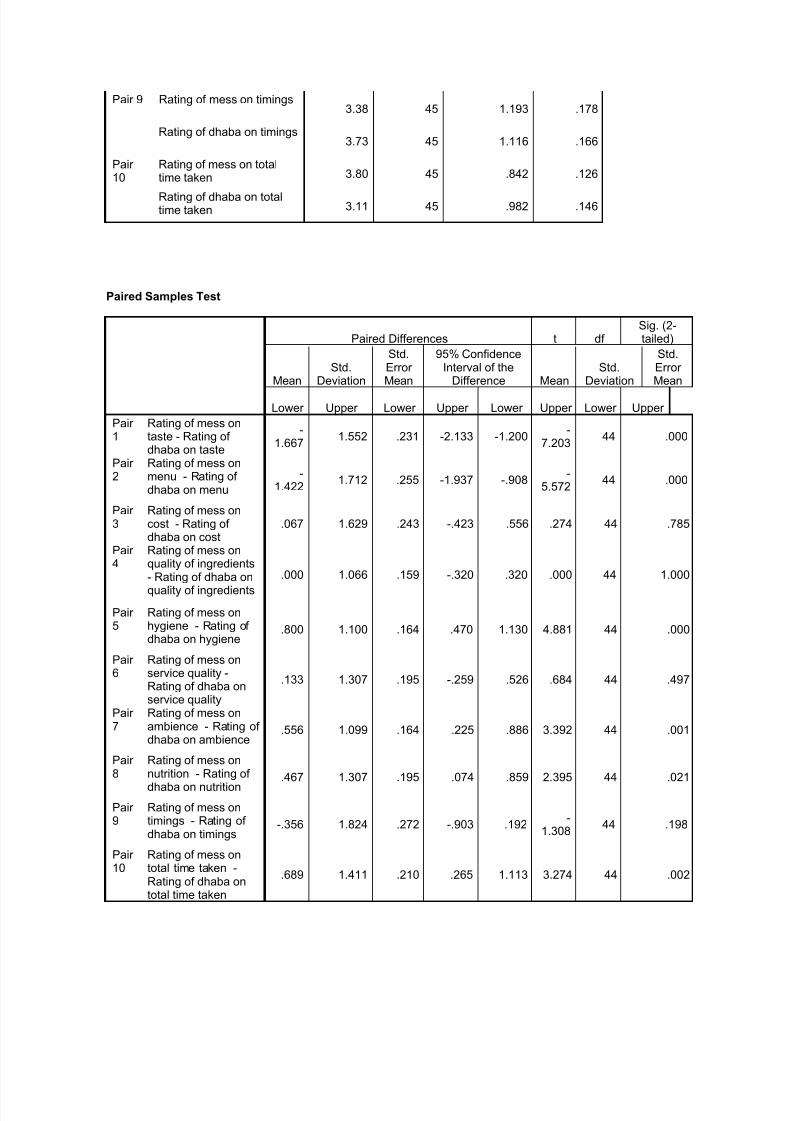
Pair 9 Rating of mess on timings3.38 45 1.193 .178
Rating of dhaba on timings3.73 45 1.116 .166
Pair 10
Rating of mess on totaltime taken 3.80 45 .842 .126
Rating of dhaba on totaltime taken 3.11 45 .982 .146
Paired Samples Test
Paired Differences t df Sig. (2-tailed)
Mean
Std.
Deviation
Std.Error
Mean
95% ConfidenceInterval of the
Difference Mean
Std.
Deviation
Std.Error
Mean
Lower Upper Lower Upper Lower Upper Lower Upper
Pair 1
Rating of mess ontaste - Rating of dhaba on taste
-1.667
1.552 .231 -2.133 -1.200-
7.20344 .000
Pair 2
Rating of mess onmenu - Rating of dhaba on menu
-1.422
1.712 .255 -1.937 -.908-
5.57244 .000
Pair 3
Rating of mess oncost - Rating of dhaba on cost
.067 1.629 .243 -.423 .556 .274 44 .785
Pair 4
Rating of mess onquality of ingredients
- Rating of dhaba onquality of ingredients
.000 1.066 .159 -.320 .320 .000 44 1.000
Pair 5
Rating of mess onhygiene - Rating of dhaba on hygiene
.800 1.100 .164 .470 1.130 4.881 44 .000
Pair 6
Rating of mess onservice quality -Rating of dhaba onservice quality
.133 1.307 .195 -.259 .526 .684 44 .497
Pair 7
Rating of mess onambience - Rating of dhaba on ambience
.556 1.099 .164 .225 .886 3.392 44 .001
Pair 8 Rating of mess onnutrition - Rating of dhaba on nutrition
.467 1.307 .195 .074 .859 2.395 44 .021
Pair 9
Rating of mess ontimings - Rating of dhaba on timings
-.356 1.824 .272 -.903 .192-
1.30844 .198
Pair 10
Rating of mess ontotal time taken -Rating of dhaba ontotal time taken
.689 1.411 .210 .265 1.113 3.274 44 .002
7/27/2019 BR for Dummies
http://slidepdf.com/reader/full/br-for-dummies 10/16
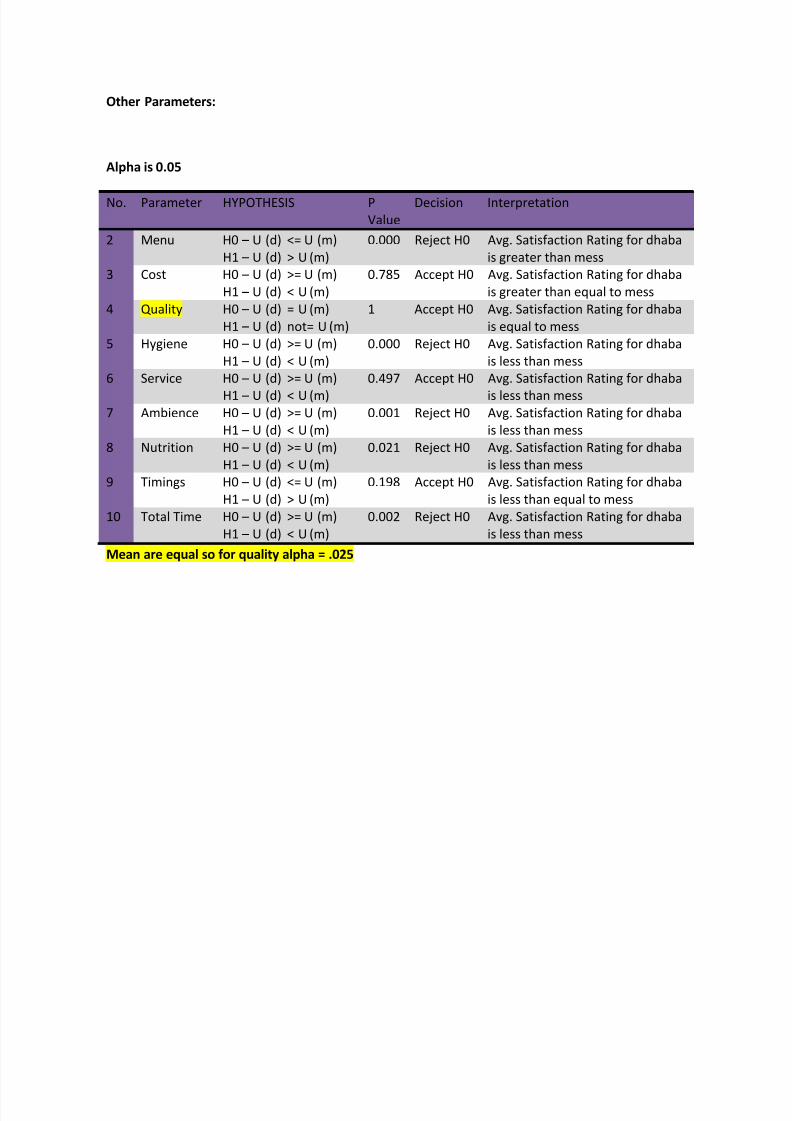
Other Parameters:
Alpha is 0.05
No. Parameter HYPOTHESIS P
Value
Decision Interpretation
2 Menu H0 – U (d) <= U (m)
H1 – U (d) > U (m)
0.000 Reject H0 Avg. Satisfaction Rating for dhaba
is greater than mess
3 Cost H0 – U (d) >= U (m)
H1 – U (d) < U (m)
0.785 Accept H0 Avg. Satisfaction Rating for dhaba
is greater than equal to mess
4 Quality H0 – U (d) = U (m)
H1 – U (d) not= U (m)
1 Accept H0 Avg. Satisfaction Rating for dhaba
is equal to mess
5 Hygiene H0 – U (d) >= U (m)
H1 – U (d) < U (m)
0.000 Reject H0 Avg. Satisfaction Rating for dhaba
is less than mess
6 Service H0 –
U (d) >= U (m)H1 – U (d) < U (m)
0.497 Accept H0 Avg. Satisfaction Rating for dhabais less than mess
7 Ambience H0 – U (d) >= U (m)
H1 – U (d) < U (m)
0.001 Reject H0 Avg. Satisfaction Rating for dhaba
is less than mess
8 Nutrition H0 – U (d) >= U (m)
H1 – U (d) < U (m)
0.021 Reject H0 Avg. Satisfaction Rating for dhaba
is less than mess
9 Timings H0 – U (d) <= U (m)
H1 – U (d) > U (m)
0.198 Accept H0 Avg. Satisfaction Rating for dhaba
is less than equal to mess
10 Total Time H0 – U (d) >= U (m)
H1 – U (d) < U (m)
0.002 Reject H0 Avg. Satisfaction Rating for dhaba
is less than mess
Mean are equal so for quality alpha = .025
7/27/2019 BR for Dummies
http://slidepdf.com/reader/full/br-for-dummies 11/16
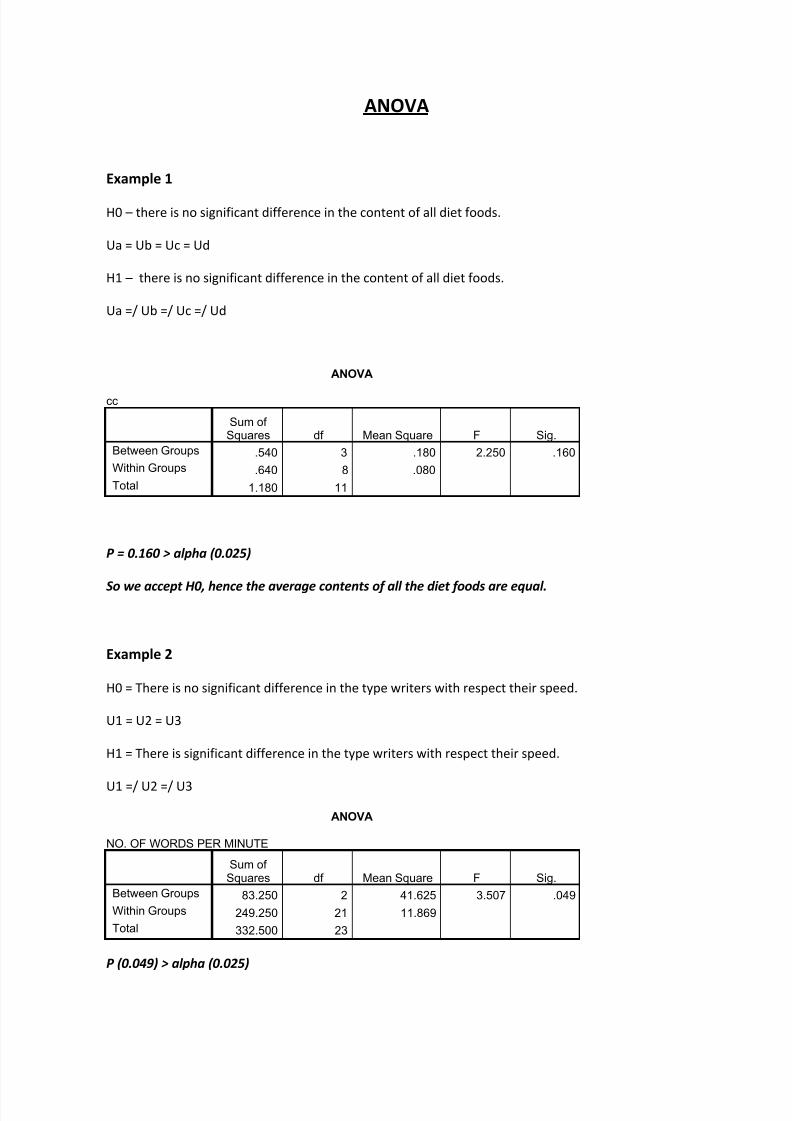
ANOVA
Example 1
H0 – there is no significant difference in the content of all diet foods.
Ua = Ub = Uc = Ud
H1 – there is no significant difference in the content of all diet foods.
Ua =/ Ub =/ Uc =/ Ud
ANOVA
cc
Sum of Squares df Mean Square F Sig.
Between Groups .540 3 .180 2.250 .160
Within Groups .640 8 .080
Total 1.180 11
P = 0.160 > alpha (0.025)
So we accept H0, hence the average contents of all the diet foods are equal.
Example 2
H0 = There is no significant difference in the type writers with respect their speed.
U1 = U2 = U3
H1 = There is significant difference in the type writers with respect their speed.
U1 =/ U2 =/ U3
ANOVA
NO. OF WORDS PER MINUTE
Sum of Squares df Mean Square F Sig.
Between Groups 83.250 2 41.625 3.507 .049
Within Groups 249.250 21 11.869
Total 332.500 23
P (0.049) > alpha (0.025)
7/27/2019 BR for Dummies
http://slidepdf.com/reader/full/br-for-dummies 12/16
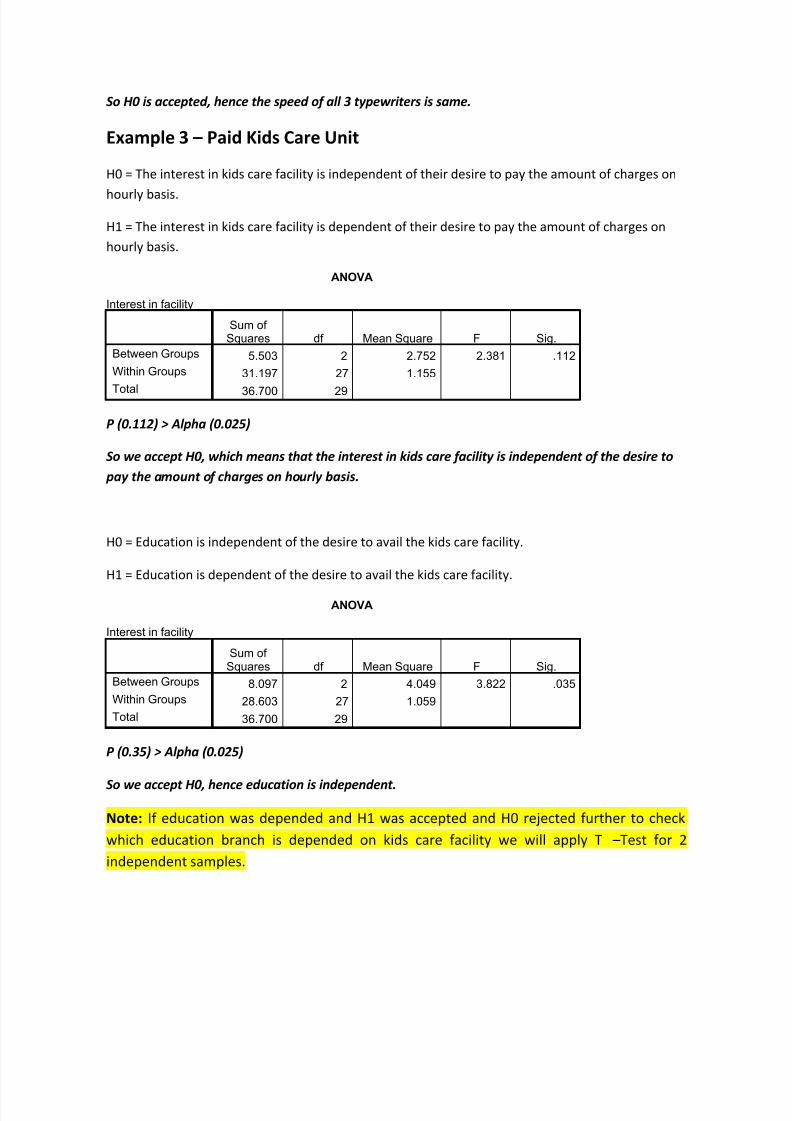
So H0 is accepted, hence the speed of all 3 typewriters is same.
Example 3 – Paid Kids Care Unit
H0 = The interest in kids care facility is independent of their desire to pay the amount of charges on
hourly basis.
H1 = The interest in kids care facility is dependent of their desire to pay the amount of charges on
hourly basis.
ANOVA
Interest in facility
Sum of Squares df Mean Square F Sig.
Between Groups 5.503 2 2.752 2.381 .112
Within Groups 31.197 27 1.155
Total 36.700 29
P (0.112) > Alpha (0.025)
So we accept H0, which means that the interest in kids care facility is independent of the desire to
pay the amount of charges on hourly basis.
H0 = Education is independent of the desire to avail the kids care facility.
H1 = Education is dependent of the desire to avail the kids care facility.
ANOVA
Interest in facility
Sum of Squares df Mean Square F Sig.
Between Groups 8.097 2 4.049 3.822 .035
Within Groups 28.603 27 1.059
Total 36.700 29
P (0.35) > Alpha (0.025)
So we accept H0, hence education is independent.
Note: If education was depended and H1 was accepted and H0 rejected further to check
which education branch is depended on kids care facility we will apply T –Test for 2
independent samples.
7/27/2019 BR for Dummies
http://slidepdf.com/reader/full/br-for-dummies 13/16
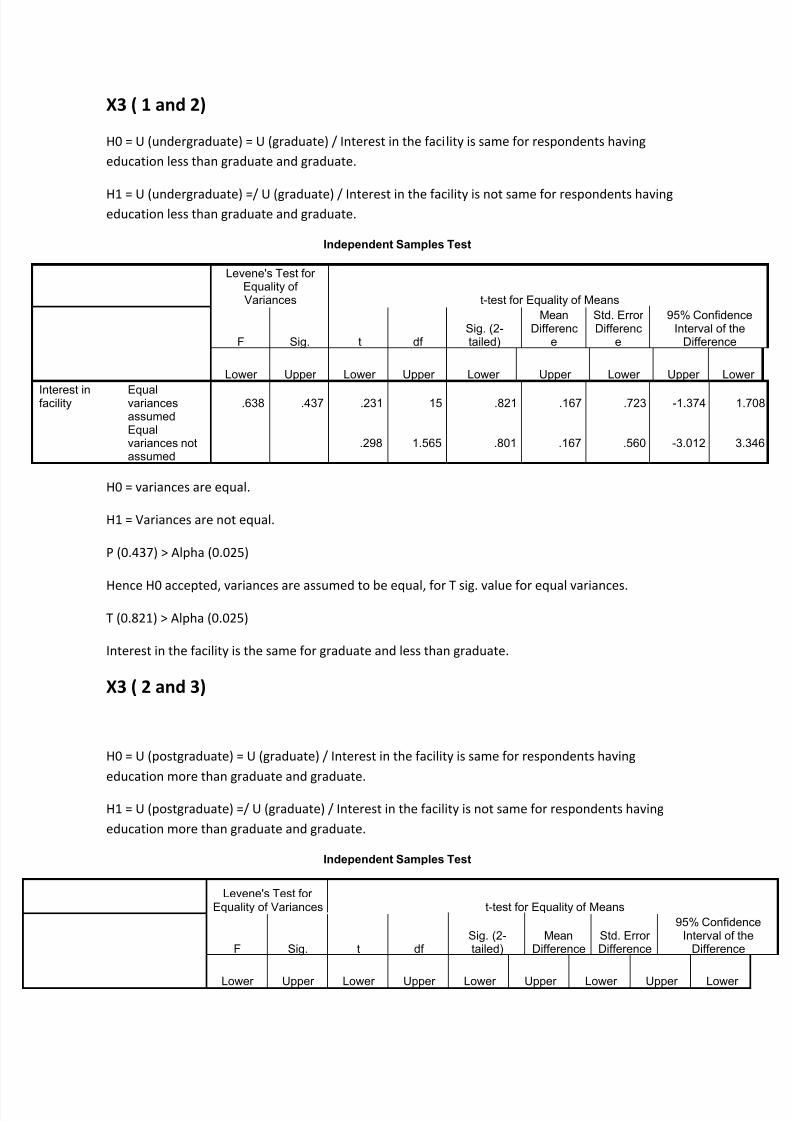
X3 ( 1 and 2)
H0 = U (undergraduate) = U (graduate) / Interest in the facility is same for respondents having
education less than graduate and graduate.
H1 = U (undergraduate) =/ U (graduate) / Interest in the facility is not same for respondents having
education less than graduate and graduate.
Independent Samples Test
Levene's Test for Equality of Variances t-test for Equality of Means
F Sig. t df Sig. (2-tailed)
MeanDifferenc
e
Std. Error Differenc
e
95% ConfidenceInterval of the
Difference
Lower Upper Lower Upper Lower Upper Lower Upper Lower
Interest infacility
Equalvariancesassumed
.638 .437 .231 15 .821 .167 .723 -1.374 1.708
Equalvariances notassumed
.298 1.565 .801 .167 .560 -3.012 3.346
H0 = variances are equal.
H1 = Variances are not equal.
P (0.437) > Alpha (0.025)
Hence H0 accepted, variances are assumed to be equal, for T sig. value for equal variances.
T (0.821) > Alpha (0.025)
Interest in the facility is the same for graduate and less than graduate.
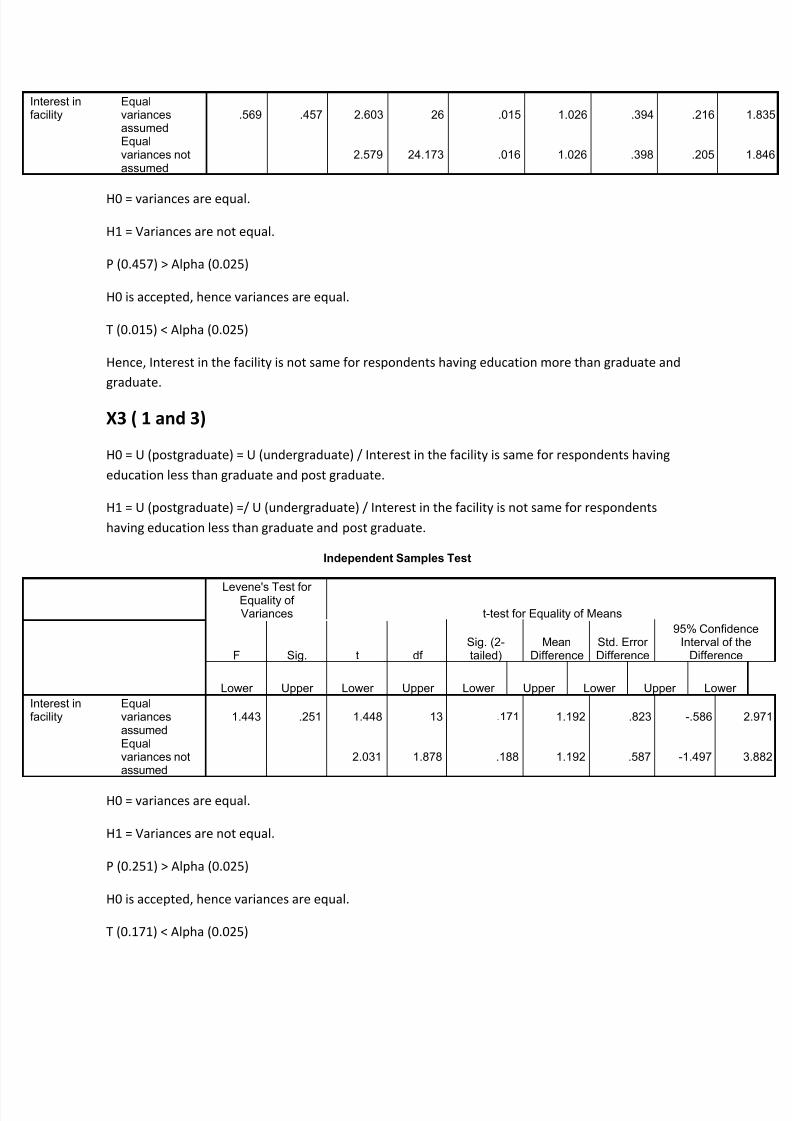
X3 ( 2 and 3)
H0 = U (postgraduate) = U (graduate) / Interest in the facility is same for respondents having
education more than graduate and graduate.
H1 = U (postgraduate) =/ U (graduate) / Interest in the facility is not same for respondents having
education more than graduate and graduate.
Independent Samples Test
Levene's Test for Equality of Variances t-test for Equality of Means
F Sig. t df Sig. (2-tailed)
MeanDifference
Std. Error Difference
95% ConfidenceInterval of the
Difference
Lower Upper Lower Upper Lower Upper Lower Upper Lower
7/27/2019 BR for Dummies
http://slidepdf.com/reader/full/br-for-dummies 14/16
nterest inacility
Equalvariancesassumed
.569 .457 2.603 26 .015 1.026 .394 .216 1.835
Equalvariances notassumed
2.579 24.173 .016 1.026 .398 .205 1.846
H0 = variances are equal.
H1 = Variances are not equal.
P (0.457) > Alpha (0.025)
H0 is accepted, hence variances are equal.
T (0.015) < Alpha (0.025)
Hence, Interest in the facility is not same for respondents having education more than graduate and
graduate.
X3 ( 1 and 3)
H0 = U (postgraduate) = U (undergraduate) / Interest in the facility is same for respondents having
education less than graduate and post graduate.
H1 = U (postgraduate) =/ U (undergraduate) / Interest in the facility is not same for respondents
having education less than graduate and post graduate.
Independent Samples Test
Levene's Test for Equality of Variances t-test for Equality of Means
F Sig. t df Sig. (2-tailed)
MeanDifference
Std. Error Difference
95% ConfidenceInterval of the
Difference
Lower Upper Lower Upper Lower Upper Lower Upper Lower
nterest inacility
Equalvariancesassumed
1.443 .251 1.448 13 .171 1.192 .823 -.586 2.971
Equalvariances notassumed
2.031 1.878 .188 1.192 .587 -1.497 3.882
H0 = variances are equal.
H1 = Variances are not equal.
P (0.251) > Alpha (0.025)
H0 is accepted, hence variances are equal.
T (0.171) < Alpha (0.025)
7/27/2019 BR for Dummies
http://slidepdf.com/reader/full/br-for-dummies 15/16
7/27/2019 BR for Dummies
http://slidepdf.com/reader/full/br-for-dummies 16/16
nterest inacility
Equalvariancesassumed
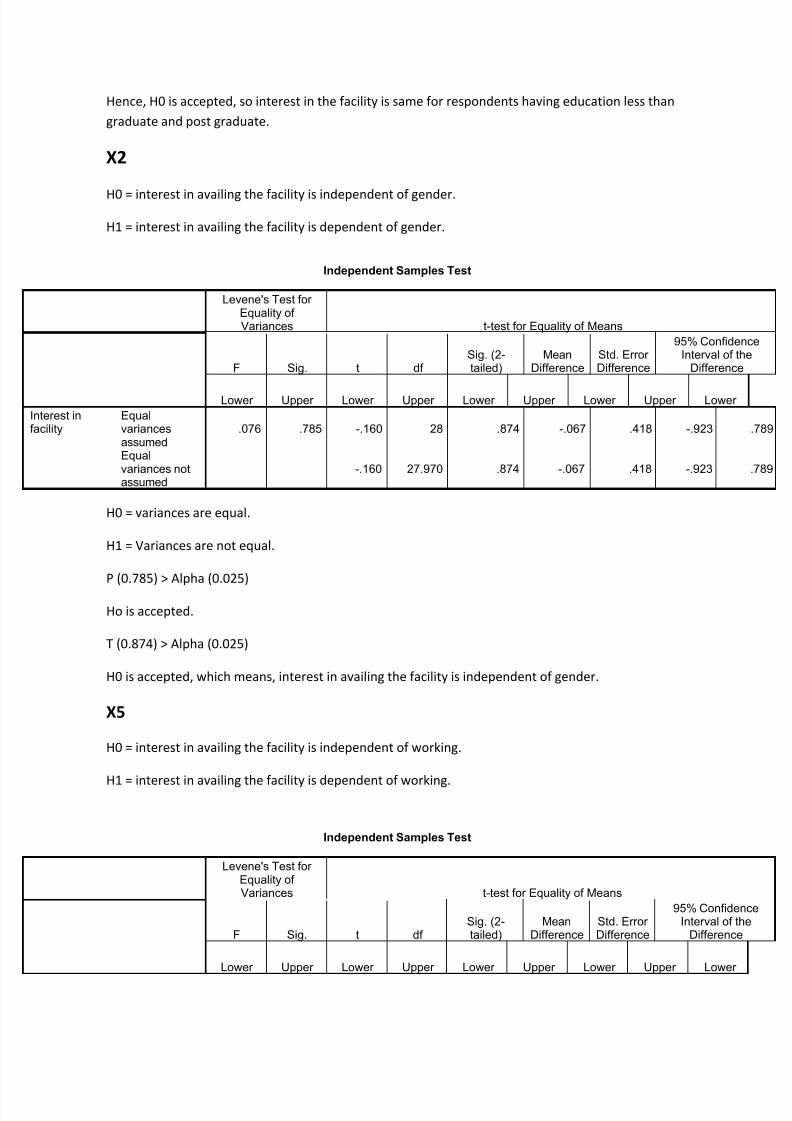
2.183 .151 -.261 28 .796 -.111 .426 -.984 .762
Equalvariances notassumed
-.270 26.217 .790 -.111 .412 -.958 .736
H0 = variances are equal.
H1 = Variances are not equal.
P (0.151) > Alpha (0.025)
H0 is accepted.
T (0.796) > Alpha (0.025)
We accept H0, which means, interest in availing the facility is independent of working.
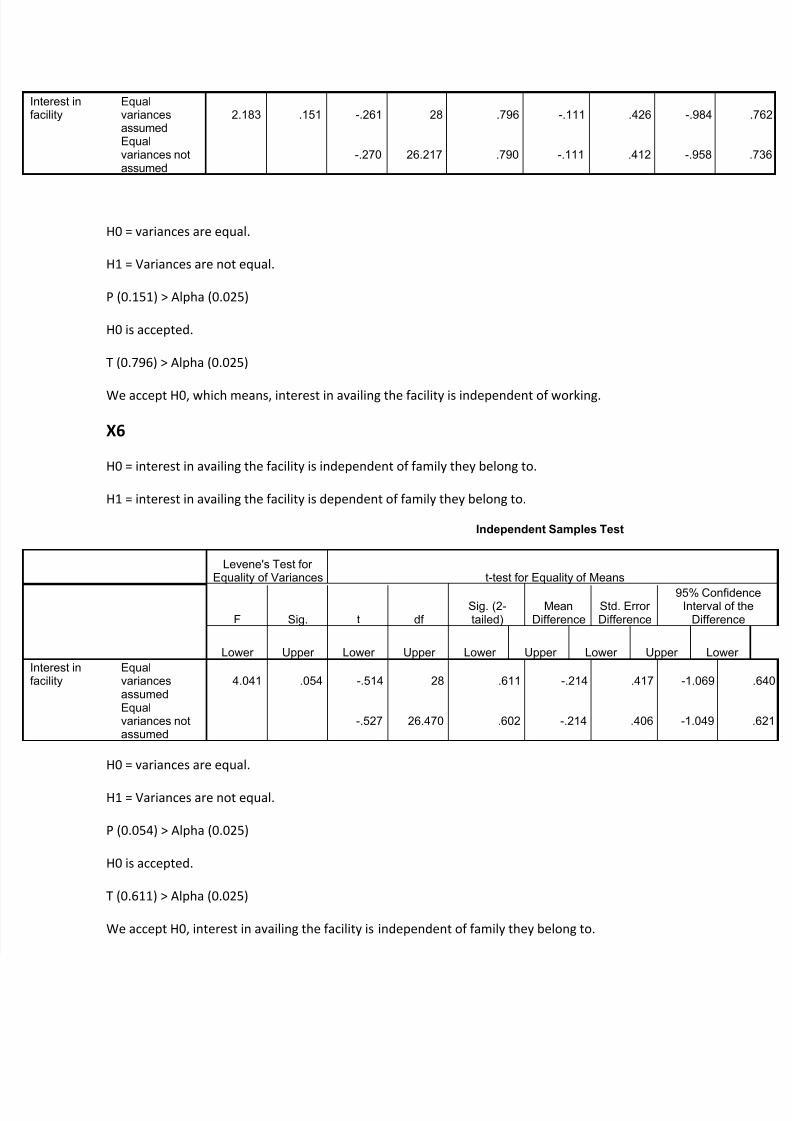
X6
H0 = interest in availing the facility is independent of family they belong to.
H1 = interest in availing the facility is dependent of family they belong to.
Independent Samples Test
Levene's Test for
Equality of Variances t-test for Equality of Means
F Sig. t df Sig. (2-tailed)
MeanDifference
Std. Error Difference
95% ConfidenceInterval of the
Difference
Lower Upper Lower Upper Lower Upper Lower Upper Lower
nterest inacility
Equalvariancesassumed
4.041 .054 -.514 28 .611 -.214 .417 -1.069 .640
Equalvariances notassumed
-.527 26.470 .602 -.214 .406 -1.049 .621
H0 = variances are equal.
H1 = Variances are not equal.
P (0.054) > Alpha (0.025)
H0 is accepted.
T (0.611) > Alpha (0.025)
We accept H0, interest in availing the facility is independent of family they belong to.