bpx14097 wo12 petsmartcvr:psi148 petsmart '07 annual cvrs
TRANSCRIPT

PE
TS
MA
RT
,I
NC
.2
00
8
AN
NU
AL
R
EP
OR
T
Our Promise
2008 Annual Report
19601 North 27th Avenue Phoenix, AZ 85027(623) 580-6100
www.PetSmart.com
©2009 PetSmart Store Support Group, Inc. All rights reserved.

Financial Highlights
2 0 0 8 2 0 0 7 2 0 0 6
Total Results (in thousands, except margins and per-share amounts)
Net Sales $ 5,065,293 $ 4,672,656 $ 4,233,857
Services Sales $ 526,730 $ 454,940 $ 373,681
Gross Margin 29.5 30.7 30.9
Net Income $ 192,670 $ 258,684 $ 185,069
Earnings Per Share $ 1.52 $ 1.95 $ 1.33
Operating Cash Flow $ 420,700 $ 332,716 $ 289,291
Other Highlights
Total Stores 1,112
Total Employees 46,100
Total 2008 in-store Pet Adoptions 392,175
Total in-store Pet Adoptions since 1994 3,653,784
PetSmart, Inc. is the largest specialty pet retailer of services and solutions for the lifetime needs of pets. The company operates more than 1,112
pet stores in the United States and Canada, 142 in-store PetSmart PetsHotels® cat and dog boarding facilities, and is a leading online provider of
pet supplies and pet care information (www.petsmart.com). PetSmart provides a broad range of competitively priced pet food and pet products;
and offers complete pet training, pet grooming, pet boarding, doggie day camp and pet adoption services. Since 1994, PetSmart Charities, Inc.,
an independent 501(c)(3) non-profit animal welfare organization, has funded more than $87 million in grants and programs benefiting animal
welfare organizations and, through its in-store pet adoption programs, has helped save the lives of more than 3.5 million pets.
% % %
Directors and Officers Stockholder Information
Directors
Lawrence A. Del SantoRetired President andChief Executive OfficerVons Companies, Inc.
Rita V. Foley Retired PresidentConsumer Packaging GroupSenior Vice PresidentMeadWestvaco Corporation
Philip L. FrancisChairman and ChiefExecutive OfficerPetSmart, Inc.
Rakesh GangwalFormer Chairman, Presidentand Chief Executive OfficerWorldspan Technologies, Inc.Former President and Chief Executive Officer US Airways Group
Joseph S. Hardin, Jr.Retired President and Chief Executive OfficerKinko’s, Inc.
Gregory P. JosefowiczRetired Chairman, Presidentand Chief Executive OfficerBorders Group, Inc.
Amin I. KhalifaPrincipalKhalifa ManagementConsulting
Richard K. LochridgePresidentLochridge & Company, Inc.
Barbara A. MunderExecutive Director Institutional Investor Institute& Euromoney InstitutionalInvestor PLC
Thomas G. StembergManaging General PartnerHighland Capital Consumer FundChairman EmeritusStaples, Inc.
Executive Officers
Philip L. FrancisChairman and ChiefExecutive Officer
Robert F. MoranPresident and ChiefOperating Officer
Lawrence P. MolloySenior Vice President, Chief Financial Officer
Donald E. BeaverSenior Vice President, Chief Information Officer
Scott A. CrozierSenior Vice President, General Counsel, Secretary and ChiefCompliance Officer
Kenneth T. HallSenior Vice President
David K. LenhardtSenior Vice President, Store Operations andHuman Resources
Mary L. MillerSenior Vice President, Chief Marketing Officer
Joseph D. O’LearySenior Vice President,Merchandising and Supply Chain
Jaye D. PerriconeSenior Vice President, Real Estate andDevelopment
Neil A. StaceySenior Vice President,Human Resources
Corporate Information
Corporate Offices19601 North 27th Avenue Phoenix, AZ 85027 (623) 580-6100
Transfer Agent and Registrar Wells Fargo Bank, N.A. Wells Fargo Shareowner Services P.O. Box 64854 St. Paul, MN 55164-0854 www.wellsfargo.com/com/shareowner_services
Independent AccountantsDeloitte & Touche LLP 2901 North Central Avenue Suite 1200 Phoenix, AZ 85012
Stockholder InquiriesPetSmart Investor Relations 19601 North 27th Avenue Phoenix, AZ 85027 (623) 587-2025 [email protected]
PetSmart Common StockThe company’s common stockis traded on the NASDAQGlobal Select Market underthe symbol “PETM.”
PetSmart Websitewww.PetSmart.com
Letter to Stockholders
“Over the past few years we have worked hard to build the foundation, refineour execution, and ensure the consistency of our brand in all we do. Our TotalLifetime Care promise stands stronger than ever, as we work to continuallymeet the evolving needs of our customer.”
April 20, 2009
Dear Fellow Stockholders:
In 2008, PetSmart focused on right-sizing our cost structure, without negatively impacting our relationship withour customers and our commitment to Total Lifetime CareSM for every pet, every parent, every time. Despite achallenging retail environment, we feel that our performance for the year is a great indication of the strength ofour Total Lifetime Care promise.
On the financial front, we delivered comp store sales growth of 3.8 percent. We ended the year with $421 million inoperating cash flow, bought back 2.3 million shares of our stock, and paid quarterly dividends of 3 cents per share.We created a more cost conscious culture as we migrated from our mindset of “how much can we do” to “how much canwe afford to do.” We worked to leverage expenses by removing non-customer facing tasks from our stores and drivingefficiencies in our supply chain. We also reduced our capital expenditures from a historical high of $294 million in2007, to $238 million in 2008.
We added 104 net new stores in 2008, ending the year with 1,112 stores in the United States and Canada. As we look forward to 2009, we remain committed to slowing our unit growth and carefully managing our capital,our productivity, and our expenses. Our 2009 capital expenditures are expected to be $115 million to $125million, which is a reduction of approximately 50% when compared to 2008. We plan to use approximately 80%to build 40 to 42 net new stores and 20 PetsHotels as well as other remodel type projects. The remaining 20%will be spent on supply chain, IT and other infrastructure improvements.
Fundamentally, we remain in an attractive competitive position against our competitors. But, as always, we remainhumble, yet prepared to retain and grow our market share. Over the past few years we have worked hard to build the foundation, refine our execution, and ensure the consistency of our brand in all we do. Our Total Lifetime Carepromise stands stronger than ever, as we work to continually meet the evolving needs of our customer.
Under the umbrella of Total Lifetime Care, we expect to widen the differentiation between ourselves and ourcompetitors. We are focused on providing more innovative products, increasing product speed to market,
Every Pet, Every Parent, Every Time
strengthening our relationship with Banfield, The Pet Hospital®, telling compelling stories about our products andcreating excitement in our stores for both customers and our selling associates. As a result, we believe we cancontinue to grow our market share and drive more productivity through our current assets.
We understand that our differentiation and strength comes from knowing our customers and the passion that theyhave for their pets. For this reason, we are beginning our journey toward a deeper focus on the customer and themany ways we can strengthen the relationship and lifetime care we offer to pet parents.
Our customer database has continually allowed us to deepen our understanding of who our customers are, howthey shop and what they are looking for. With the use of our extensive database and consumer research, we nowhave the ability to segment our customers, while developing targeted strategies to drive incremental behavior. Thisdata is impacting how we invest to reach our customers, while driving many of our everyday business decisions.These efforts will remain at the forefront of our 2009 focus, as we seek to strengthen our customer base, andincrease the overall value of our brand to our customers.
Despite some slowing related to the economic environment, our services offerings still remain a very “sticky” part of our business, as pet parents remain loyal to us when they are in need of services. Total services sales were$527 million in 2008, up 15.8 percent from 2007. Grooming remains strong, as the Christmas holiday weekproduced the highest single week of grooming sales in our history. We also reached another milestone this year, as one of our grooming salons hit $1 million in sales for the year.
We are very fortunate here at PetSmart. We are a leader in an industry that services a strong emotional bondbetween pet parents and their loved ones. Our associates understand that bond and take pride in supporting it.
Despite the macro economy, we expect to look back at this time as one that helped us focus on what is critical tostrengthen our market position, while solidifying our long-term growth potential. Our management team andassociates remain committed to stay the course. We expect to efficiently use our capital, while remaining adaptableto our rapidly changing environment. As a result, we remain confident that our promise of Total Lifetime Care forevery pet, every parent, every time, will produce long-lasting results and shareholder value.
Sincerely,
Philip L. FrancisChairman and Chief Executive Officer
Robert F. MoranPresident and Chief Operating Officer

UNITED STATES SECURITIES AND EXCHANGE COMMISSIONWashington, D.C. 20549
Form 10-K(Mark One)
¥ ANNUAL REPORT PURSUANT TO SECTION 13 OR 15(d)OF THE SECURITIES EXCHANGE ACT OF 1934For the Fiscal Year Ended February 1, 2009
orn TRANSITION REPORT PURSUANT TO SECTION 13 OR 15(d)
OF THE SECURITIES EXCHANGE ACT OF 1934For the transition period from to
Commission file number 0-21888
PetSmart, Inc.(Exact name of registrant as specified in its charter)
Delaware(State or other jurisdiction ofincorporation or organization)
94-3024325(I.R.S. Employer
Identification No.)
19601 N. 27th AvenuePhoenix, Arizona
(Address of principal executive offices)
85027(Zip Code)
Registrant’s telephone number, including area code:(623) 580-6100
Securities registered pursuant to Section 12(b) of the Act:Title of Each Class Name of Each Exchange on Which Registered
Common Stock, $.0001 par value The NASDAQ Stock Market LLC(NASDAQ Global Select Market)
Securities registered pursuant to Section 12(g) of the Act:None
Indicate by check mark if the registrant is a well-known seasoned issuer, as defined in Rule 405 of the Securities Act. Yes ¥ No n
Indicate by check mark if the registrant is not required to file reports pursuant to Section 13 or Section 15(d) of the Act. Yes n No ¥
Note — Checking the box above will not relieve any registrant required to file reports pursuant to Section 13 or Section 15(d) of theExchange Act from their obligations under those sections.
Indicate by check mark whether the registrant (1) has filed all reports required to be filed by Section 13 or 15(d) of the Securities ExchangeAct of 1934 during the preceding 12 months (or for such shorter period that the registrant was required to file such reports), and (2) has beensubject to such filing requirements for the past 90 days. Yes ¥ No n
Indicate by check mark if disclosure of delinquent filers pursuant to Item 405 of Regulation S-K (§ 229.405 of this chapter) is not containedherein, and will not be contained, to the best of registrant’s knowledge, in definitive proxy or information statements incorporated by reference inPart III of this Form 10-K or any amendment to this Form 10-K. n
Indicate by check mark whether the registrant is a large accelerated filer, an accelerated filer, a non-accelerated filer, or a smaller reportingcompany. See the definitions of “large accelerated filer,” “accelerated filer” and “smaller reporting company” in Rule 12b-2 of the Exchange Act.
Large accelerated filer ¥ Accelerated filer n Non-accelerated filer n Smaller reporting company n
(Do not check if a smaller reporting company)Indicate by check mark whether the registrant is a shell company (as defined in Rule 12b-2 of the Act). Yes n No ¥
The aggregate market value of the common stock held by non-affiliates of the registrant, based on the closing sale price of the registrant’s commonstock on August 3, 2008, the last business day of the registrant’s most recently completed second fiscal quarter, as reported on the NASDAQ Global SelectMarket was approximately $2,875,236,000. This calculation excludes approximately 1,556,000 shares held by directors and executive officers of theregistrant. This calculation does not exclude shares held by such organizations whose ownership exceeds 5% of the registrant’s outstanding common stock asof December 31, 2008 that have represented to the registrant that they are registered investment advisers or investment companies registered under Section 8of the Investment Company Act of 1940.
The number of shares of the registrant’s common stock outstanding as of March 16, 2009 was 127,301,557DOCUMENTS INCORPORATED BY REFERENCE
Portions of the Proxy Statement for the 2009 Annual Meeting of Stockholders to be held on June 17, 2009, to be filed on or about May 4,2009, have been incorporated by reference into Part III of this Annual Report on Form 10-K.

TABLE OF CONTENTS
Item Page
PART I1. Business . . . . . . . . . . . . . . . . . . . . . . . . . . . . . . . . . . . . . . . . . . . . . . . . . . . . . . . . . . . . . . . . . . . 1
1A. Risk Factors . . . . . . . . . . . . . . . . . . . . . . . . . . . . . . . . . . . . . . . . . . . . . . . . . . . . . . . . . . . . . . . . 8
1B. Unresolved Staff Comments . . . . . . . . . . . . . . . . . . . . . . . . . . . . . . . . . . . . . . . . . . . . . . . . . . . . 18
2. Properties . . . . . . . . . . . . . . . . . . . . . . . . . . . . . . . . . . . . . . . . . . . . . . . . . . . . . . . . . . . . . . . . . . 19
3. Legal Proceedings . . . . . . . . . . . . . . . . . . . . . . . . . . . . . . . . . . . . . . . . . . . . . . . . . . . . . . . . . . . . 20
4. Submission of Matters to a Vote of Security Holders . . . . . . . . . . . . . . . . . . . . . . . . . . . . . . . . . . 21
PART II5. Market for the Registrant’s Common Equity, Related Stockholder Matters and Issuer Purchases of
Equity Securities . . . . . . . . . . . . . . . . . . . . . . . . . . . . . . . . . . . . . . . . . . . . . . . . . . . . . . . . . . . . . 21
6. Selected Financial Data . . . . . . . . . . . . . . . . . . . . . . . . . . . . . . . . . . . . . . . . . . . . . . . . . . . . . . . . 24
7. Management’s Discussion and Analysis of Financial Condition and Results of Operations . . . . . . . 25
7A. Quantitative and Qualitative Disclosures About Market Risk. . . . . . . . . . . . . . . . . . . . . . . . . . . . . 36
8. Financial Statements and Supplementary Data . . . . . . . . . . . . . . . . . . . . . . . . . . . . . . . . . . . . . . . 36
9. Changes in and Disagreements with Accountants on Accounting and Financial Disclosure . . . . . . 36
9A. Controls and Procedures . . . . . . . . . . . . . . . . . . . . . . . . . . . . . . . . . . . . . . . . . . . . . . . . . . . . . . . 36
9B. Other Information . . . . . . . . . . . . . . . . . . . . . . . . . . . . . . . . . . . . . . . . . . . . . . . . . . . . . . . . . . . . 39
PART III10. Directors, Executive Officers and Corporate Governance . . . . . . . . . . . . . . . . . . . . . . . . . . . . . . . 39
11. Executive Compensation . . . . . . . . . . . . . . . . . . . . . . . . . . . . . . . . . . . . . . . . . . . . . . . . . . . . . . 39
12. Security Ownership of Certain Beneficial Owners and Management and Related StockholderMatters . . . . . . . . . . . . . . . . . . . . . . . . . . . . . . . . . . . . . . . . . . . . . . . . . . . . . . . . . . . . . . . . . . . . 39
13. Certain Relationships and Related Transactions, and Director Independence . . . . . . . . . . . . . . . . . 39
14. Principal Accounting Fees and Services . . . . . . . . . . . . . . . . . . . . . . . . . . . . . . . . . . . . . . . . . . . . 39
PART IV15. Exhibits, Financial Statement Schedules. . . . . . . . . . . . . . . . . . . . . . . . . . . . . . . . . . . . . . . . . . . . 39

PART I
This Annual Report on Form 10-K contains forward-looking statements within the meaning of Section 27A ofthe Securities Act of 1933 and Section 21E of the Securities Exchange Act of 1934. These statements are based onmanagement’s current expectations and beliefs about future events or future financial performance. We haveattempted to identify forward-looking statements by words such as: “anticipate,” “believe,” “can,” “continue,”“could,” “estimate,” “expect,” “intend,” “may,” “plan,” “potential,” “predict,” “should,” “will,” or other com-parable terminology. These statements are not guarantees of future performance or results and involve known andunknown risks, uncertainties and other factors, including the risks outlined under “Item 1A. Risk Factors”contained in Part I of this Annual Report, that may cause our actual results, levels of activity, performance orachievements to be materially different from any future results, levels of activity, performance or achievementsexpressed or implied by these forward-looking statements.
Although we believe the expectations and beliefs reflected in the forward-looking statements are reasonable,such statements speak only as of the date this Annual Report on Form 10-K is filed, and we disclaim any intent orobligation to update any of the forward-looking statements after such date, whether as a result of new information,actual results, future events or otherwise, unless required by law.
Our fiscal year consists of the 52 or 53 weeks ending on the Sunday nearest January 31 of the following year.The 2008 fiscal year ended on February 1, 2009, and was a 52-week year. The 2007 fiscal year was a 53-week year,while the 2006 fiscal year was a 52-week year. Unless otherwise specified, all references in this Annual Report onForm 10-K to years are to fiscal years.
Item 1. Business
General
During 2008, we generated net sales of $5.1 billion, making us North America’s leading specialty provider ofproducts, services and solutions for the lifetime needs of pets. We have identified a large group of pet owners we call“pet parents,” who are passionately committed to their pets and consider their pets members of the family. Ourstrategy is to attract and keep these customers by becoming the preferred provider for the Total Lifetime CareSM ofpets. As part of this strategy, we focus on delighting our customers, operating our business efficiently, and growingour pet services business.
We opened 104 net new stores in 2008 and at the end of the year operated 1,112 retail stores in North America.Square footage in 2008 increased 2.3 million to 25.1 million compared to 22.8 million in 2007. Our stores typicallyrange in size from 18,000 to 27,500 square feet and carry a broad and deep selection of high-quality pet supplies ateveryday low prices. We offer more than 10,500 distinct items, including nationally recognized brand names, aswell as an extensive selection of proprietary, or private label, brands across a range of product categories.
We complement our strong product assortment with value-added pet services, including grooming, training,boarding and day camp. All our stores offer complete pet training services and virtually all our stores feature petstyling salons that provide high-quality grooming services. As of February 1, 2009, we offered pet boarding at 142of our stores through our PetSmart PetsHotels», or “PetsHotels.” As of February 1, 2009, there were full-serviceveterinary hospitals in 734 of our stores. Medical Management International, Inc., an operator of veterinaryhospitals, operated 722 of the hospitals under the registered trade name of “Banfield, The Pet Hospital.” Theremaining 12 hospitals are operated by other third parties in Canada.
Our PetPerks» loyalty program enables us to understand the needs of our customers and target offers directly to them.We also reach customers through PetSmart.com», our pet e-commerce site, as well as pets.com, our pet community site.
The Pet Industry
The pet industry serves a large and growing market. The American Pet Products Association, or “APPA,”estimated the calendar year 2009 market at approximately $45.4 billion, an increase of more than 165% sincecalendar year 1994. Based on the 2007/2008 APPA National Pet Owners Survey, more than 71 million households
1
in the United States own a pet. In total, there are approximately 88 million cats and 75 million dogs owned as pets inthe United States.
The pet industry can be divided into the following categories: food and treats, supplies and medicines,veterinary care, pet services (such as grooming and boarding) and purchases of pets. The APPA estimates that foodand treats for dogs and cats are the largest volume categories of pet-related products and, in calendar year 2008,approximated $16.8 billion in sales, or 38.9% of the market.
Pet supplies and medicine sales account for approximately 23.1%, or $10.0 billion, of the market. These salesinclude dog and cat toys, collars and leashes, cages and habitats, books, vitamins and supplements, shampoos, fleaand tick control and aquatic supplies. Veterinary care, pet services, and purchases of pets represent approximately25.7%, 7.4% and 4.9%, respectively, of the market.
Competition
Based on total net sales, we are North America’s leading specialty retailer of products, services and solutionsfor the lifetime needs of pets. The pet products retail industry is highly competitive and can be organized into eightdifferent categories:
• Warehouse clubs and other mass merchandisers;
• Supermarkets (grocery stores);
• Specialty pet supply stores;
• Independent pet stores;
• Veterinarians;
• General retail merchandisers;
• Catalog retailers; and
• E-commerce retailers.
We believe the principal competitive factors influencing our business are product selection and quality,convenience of store locations, store environment, customer service, price and availability of other services. Manypremium pet food brands, which offer higher levels of nutrition than non-premium brands, are not currently soldthrough supermarkets, warehouse clubs and other mass and general retail merchandisers due to manufacturers’restrictions, but are sold primarily through specialty pet supply stores, veterinarians and farm and feed stores. Webelieve our pet services business is a competitive advantage that cannot be easily duplicated. We believe wecompete effectively in our various markets; however, some of our supermarket, warehouse club and other mass andgeneral retail merchandise competitors are much larger in terms of overall sales volume and may have access togreater capital.
Our Strategy
Our strategy is to be the preferred provider for the lifetime needs of pets. Our primary initiatives include:
Add stores in existing multi-store, new multi-store and new single-store markets. Our expansion strategyincludes increasing our share in existing multi-store markets, penetrating new multi-store and single-store marketsand achieving operating efficiencies and economies of scale in distribution, information systems, procurement,marketing and store operations. During 2008, we opened 104 net new stores, and in 2009, we expect to openapproximately 40 net new stores. In 2009, we plan to slow our store growth by about 60% as we work to balanceinvesting for the future and maximizing our greatest opportunity to deliver consistent stockholder returns.
Provide the right store format to meet the needs of our customers. We completed the conversion of our storebase to a specialty store format in 2003. We believe our reformatted stores, combined with our other strategicinitiatives, contribute to higher comparable store sales growth, profitability and return on investment. Wecontinually evaluate our store format to ensure we are meeting the needs and expectations of our customers,
2

while providing a return on investment to our stockholders. In 2005, we tested a store refresh program that builds onthe initial reformat and emphasizes our highly differentiated training and adoption services. We refreshed many ofour existing stores with this new format in 2006, 2007 and 2008 and expect to continue the refresh of stores in 2009and 2010.
Expand our pet services business. Based on net sales, we are North America’s leading specialty provider ofpet services, which include professional grooming, training, boarding and day camp. Pet services are an integralpart of our strategy, and we are focused on driving profitable growth in our services business. We believe servicesdifferentiate us from our competitors, drive traffic and repeat visits to our stores, provide cross-selling opportunities,allow us to forge a strong relationship with our customers, increase transaction size and enhance operating margins.In 2005, we began the roll out of PetsHotel, a full-service in-store boarding facility for dogs and cats. The PetsHotelexperience includes 24-hour supervision by our trained caregivers as well as an on-call veterinarian, temperature-controlled rooms and suites, daily specialty treats and playtime. In addition, each PetsHotel offers Doggie DayCampSM, a day camp service for dogs in climate-controlled play rooms with other dogs and our pet-loving stafftrained in behavior assessment. As of February 1, 2009, we operated 142 PetsHotels. Pet services net sales grew by16%, 22% and 26% in 2008, 2007 and 2006, respectively. We expect our ability to expand the pet services businesswill continue in 2009.
Offer superior customer service. Our emphasis on the customer is designed to provide our customers with anunparalleled shopping experience every time they visit our stores. Using a detailed associate learning curriculumand role-playing techniques, we educate store associates to identify customer needs and provide appropriatesolutions. We measure their success in every store, and a portion of the annual incentive program for the storemanagement team is linked to customer satisfaction. By providing pet parents with expertise and solutions, webelieve we are strengthening our relationships with customers, building loyalty and enhancing our leading marketposition, thus differentiating ourselves from grocery and other mass retailers.
Create meaningful differentiation that drives brand preference. We are focused on developing and strength-ening our brand identity and enhancing the emotional connection pet parents make with their pets and withPetSmart. In August 2005, we repositioned the PetSmart brand from its reputation as a “Mart” to “Smart,” toemphasize our capabilities as a resource of information, services and solutions. Our marketing and advertisingefforts since have focused not only on emphasizing our unique offerings for customers, but also in promoting ourstrong value proposition. Through extensive and on-going customer research, we are gaining valuable insights intothe wants and needs of our customers and developing solutions and communication strategies to address them. OurPetPerks» customer loyalty program, which is available in all PetSmart stores, plays a central role in this effort. Wehave increasingly greater capacity to customize offers more relevant to our customers, helping them build a strongerand more meaningful bond with their pet and a greater loyalty to PetSmart.
Drive efficiency and create a consistent customer experience by focusing on operating excellence. Ouroperating excellence initiative — which emphasizes retail basics like store cleanliness, short check-out lines, astrong in-stock position, an effective supply chain and the care of the pets in our stores — allows us to provide aconsistently superior shopping experience, even as we grow. It simplifies processes, makes our stores more efficientand easier to operate and allows associates to be more productive.
We believe these strategic initiatives will continue to drive comparable store sales, profitability and return oninvestment.
3
Our Stores
Our stores are generally located at sites co-anchored by strong destination superstores and typically are in ornear major regional shopping centers. We are engaged in an ongoing expansion program, opening new stores in bothnew and existing markets and relocating existing stores. Store activity was as follows:
2008 2007 2006
Store count at beginning of year . . . . . . . . . . . . . . . . . . . . . . . . . . . . . . . . . 1,008 908 826
New, relocated and acquired stores opened . . . . . . . . . . . . . . . . . . . . . . . . . 112 115 92
Stores closed . . . . . . . . . . . . . . . . . . . . . . . . . . . . . . . . . . . . . . . . . . . . . . . (8) (15) (10)
Store count at end of year . . . . . . . . . . . . . . . . . . . . . . . . . . . . . . . . . . . . . . 1,112 1,008 908
Distribution
Our distribution network and information systems are designed to optimize store inventory, drive the efficientuse of store labor, facilitate a high in-stock position and promote high distribution center productivity. We currentlyship product to our stores in full truckloads, some of which contain multiple store deliveries. We operate two kindsof distribution centers: forward distribution centers and combination centers. Our forward distribution centershandle consumable products that require rapid replenishment, while our combination distribution centers handleboth consumable and non-consumable products. We believe the combination distribution centers drive efficienciesin transportation costs and store labor. Our suppliers generally ship merchandise to one of our distribution centers,which receive and allocate merchandise to our stores. We contract the transportation of merchandise from ourdistribution centers to stores through third-party vendors.
Merchandise
Merchandise sales, which have been decreasing as a percentage of net sales due to the higher growth rate inservices, represented approximately 89.6%, 90.3% and 91.2% of our net sales in 2008, 2007 and 2006, respectively.Merchandise generally falls into three main categories:
• Consumables. Consumables merchandise sales includes pet food, treats, and litter. We emphasize pre-mium dog and cat foods, many of which are not available in supermarkets, warehouse clubs or other massand general retail merchandisers, as well as our private label foods. We also offer quality national brandstraditionally found in supermarkets and pet stores. Consumables merchandise sales comprised 57%, 54%and 53% of our net sales in 2008, 2007 and 2006, respectively.
• Hardgoods. Hardgoods merchandise sales includes pet supplies and other goods. Our broad assortment of petsupplies, including private label products, includes collars, leashes, health care supplies, grooming and beauty aids,toys, and apparel, as well as pet beds and carriers. We also offer a complete line of supplies for fish, birds, reptilesand small pets. These products include aquariums and habitats, as well as accessories, décor and filters. Hardgoodsmerchandise sales comprised 40%, 43% and 44% of our net sales in 2008, 2007 and 2006, respectively.
• Pets. Our stores feature fresh-water tropical fish, birds, reptiles and small pets. Pets comprised 3% of ournet sales in 2008, 2007 and 2006. We do not sell dogs or cats, but provide space in most stores for adoptionand animal welfare organizations to use.
Pet Services
Pet services, which include grooming, training, boarding and day camp, represented 10.4%, 9.7% and 8.8% ofour net sales in 2008, 2007 and 2006, respectively. Net sales from pet services increased 15.8% from $454.9 millionin 2007 to $526.7 million in 2008.
We offer full-service grooming and training services in virtually all our stores. We typically allocateapproximately 900 square feet per store for high-quality, full-service grooming, including precision cuts, baths,toenail trimming and grinding, and toothbrushing. Depending on their experience, our pet stylists are educated aspart of a comprehensive program that teaches exceptional grooming skills using safe and gentle techniques. Pet
4

training services range from puppy classes to advanced and private courses, led by our accredited pet traininginstructors who are passionate about pets.
PetsHotels provide boarding for dogs and cats, which includes 24-hour supervision by caregivers who arePetSmart trained to provide personalized pet care, an on-call veterinarian, temperature controlled rooms and suites,daily specialty treats and play time, as well as day camp for dogs. As of February 1, 2009, we operated 142PetsHotels, and we plan to open approximately 20 PetsHotels in 2009.
Veterinary Services
The availability of comprehensive veterinary care in our stores further differentiates us, drives sales in our stores andreflects our overall commitment to pet care. Full-service veterinary hospitals in 734 of our stores offer routineexaminations and vaccinations, dental care, a pharmacy, and routine and complex surgical procedures. As of February 1,2009, Medical Management International, Inc. operated 722 of the hospitals under the registered trade name of “Banfield,The Pet Hospital.” Medical Management International, Inc. is a wholly-owned subsidiary of MMI Holdings, Inc.,collectively referred to as “MMIH.” The remaining 12 hospitals are located in Canada and are operated by other thirdparties. See Note 3 in the Notes to Consolidated Financial Statements for a discussion of our ownership interest in MMIH.
PetSmart Charities and Adoptions
Through PetSmart Charities, Inc., an independent 501(c)(3) organization, we support the activities of animalwelfare organizations in North America. PetSmart Charities creates and supports programs to help find a lifelongloving home for every pet by:
• Raising awareness of companion animal welfare issues;
• Funding programs to further individual animal welfare organizations’ missions; and
• Facilitating adoptions through in-store programs and pet transport programs.
Since 1994, PetSmart Charities has funded more than $87 million in grants and programs benefiting animal welfareorganizations and, through its in-store adoption programs, has helped save the lives of more than 3.5 million pets.
Government Regulation
We are subject to various federal, state, provincial and local laws and regulations governing, among otherthings: our relationships with employees, including minimum wage requirements, overtime, working conditionsand citizenship requirements; veterinary practices or the operation of veterinary hospitals in retail stores that mayimpact our ability to operate veterinary hospitals in certain facilities; the transportation, handling and sale of smallpets; the generation, handling, storage, transportation and disposal of waste and biohazardous materials; thedistribution, import/export and sale of products; the handling, security, protection and use of customer and associateinformation; and the licensing and certification of services.
We seek to structure our operations to comply with all federal, state, provincial and local laws and regulationsof each jurisdiction in which we operate. Given varying and uncertain interpretations of these laws and regulations,and the fact the laws and regulations are enforced by the courts and by regulatory authorities with broad discretion,we can make no assurances we would be found to be in compliance in all jurisdictions at all times. We also could besubject to costs, including fines, penalties or sanctions and third-party claims as a result of violations of, or liabilitiesunder, these laws and regulations.
Intellectual Property
We believe our intellectual property has significant value and is an important component in our merchandisingand marketing strategies. Some of our intellectual property includes numerous servicemarks and trademarksregistered with the United States Patent and Trademark Office, or “USPTO,” including: PetSmart», PetSmart.com»,PetSmart PetsHotel», PetPerks», and Where Pets Are Family», as well as many others. We also own severalservicemark and trademark applications that are pending with the USPTO and anticipate filing additional applicationsin the future. We also own numerous registered servicemarks, trademarks and pending applications in other countries,including Canada, as well as several trade names, domain names, and copyrights for use in our business.
5

Employees
As of February 1, 2009, we employed approximately 46,000 associates, approximately 22,000 of whom wereemployed full-time. We continue to invest in education for our full and part-time associates as part of our emphasison customer service and providing pet care solutions. We are subject to no collective bargaining agreements andhave experienced no work stoppages. We consider our relationship with our associates to be good. Increases in thefederal and state minimum wage in recent years have not had a material effect on our business.
Financial Information by Business Segment and Geographic Data
Financial Accounting Standards Board, or “FASB,” Statement of Financial Accounting Standards, or “SFAS,”No. 131, “Disclosures about Segments of an Enterprise and Related Information,” requires that a public companyreport annual and interim financial and descriptive information about its reportable operating segments. Operatingsegments, as defined, are components of an enterprise about which separate financial information is available that isevaluated regularly by the chief operating decision maker in deciding how to allocate resources and in assessingperformance. Utilizing these criteria, we manage our business on the basis of one reportable operating segment.
Net sales in the United States were $4.9 billion, $4.5 billion and $4.1 billion for 2008, 2007 and 2006, respectively.Net sales in Canada, denominated in United States dollars, were $217.6 million, $188.6 million and $133.0 million for2008, 2007 and 2006, respectively. Substantially all our long-lived assets are located in the United States.
Available Information
We make available, free of charge through our investor relations internet website (www.petm.com), ourAnnual Report on Form 10-K, our Quarterly Reports on Form 10-Q, our current reports on Form 8-K andamendments to those reports, as soon as reasonably practicable after we electronically file such material, or furnishit to the Securities and Exchange Commission, or “SEC.”
The public may read and copy materials that we file with the SEC at the SEC’s Public Reference Room at100 F Street, NW, Washington, DC 20549. The public may obtain information on the operation of the PublicReference Room by calling the SEC at 1-800-SEC-0330. The SEC maintains an internet website(http://www.sec.gov) that contains reports, proxy and information statements, and other information regardingissuers that file electronically with the SEC.
Management
Our executive officers and their ages and positions on March 18, 2009, are as follows:Name Age Position
Philip L. Francis . . . . . . . . . . . . . . . . . . 62 Chairman and Chief Executive Officer
Robert F. Moran . . . . . . . . . . . . . . . . . . 58 President and Chief Operating Officer
Lawrence P. Molloy. . . . . . . . . . . . . . . . 47 Senior Vice President, Chief Financial Officer
Scott A. Crozier . . . . . . . . . . . . . . . . . . 58 Senior Vice President, General Counsel, Secretaryand Chief Compliance Officer
Donald E. Beaver . . . . . . . . . . . . . . . . . 50 Senior Vice President, Chief Information Officer
Kenneth T. Hall . . . . . . . . . . . . . . . . . . . 40 Senior Vice President
David K. Lenhardt. . . . . . . . . . . . . . . . . 39 Senior Vice President, Store Operations and HumanResources
Mary L. Miller . . . . . . . . . . . . . . . . . . . 48 Senior Vice President, Chief Marketing Officer
Joseph D. O’Leary . . . . . . . . . . . . . . . . 50 Senior Vice President, Merchandising and SupplyChain
Jaye D. Perricone . . . . . . . . . . . . . . . . . 50 Senior Vice President, Real Estate andDevelopment
Francesca M. Spinelli . . . . . . . . . . . . . . 55 Senior Vice President, People
Neil H. Stacey. . . . . . . . . . . . . . . . . . . . 55 Senior Vice President, Human Resources
Philip L. Francis has been a director of PetSmart since 1989, and Chief Executive Officer since March 1998.He was President from 1998 to 2001 and was named Chairman of the Board in 1999. From 1991 to 1998, he held
6

various positions with Shaw’s Supermarkets, Inc., a subsidiary of J. Sainsbury plc., including Chief ExecutiveOfficer, Chief Operating Officer and President. Prior to that, he held several senior management positions forRoundy’s Supermarket, Inc., Cardinal Health, Inc. and the Jewel Companies, Inc.
Robert F. Moran was appointed President and Chief Operating Officer in December 2001. He joined PetSmartas President of North American Stores in July 1999. From 1998 to 1999, he was President of Toys ‘R’ Us, Ltd.,Canada. Prior to 1991 and from 1993 to 1998, for a total of 20 years, he was with Sears, Roebuck and Company in avariety of financial and merchandising positions, including President and Chief Executive Officer of Sears deMexico. He was also Chief Financial Officer and Executive Vice President of Galerias Preciados of Madrid, Spainfrom 1991 through 1993.
Lawrence P. Molloy joined PetSmart as Senior Vice President and Chief Financial Officer in September 2007.Prior to joining PetSmart, Mr. Molloy served four years in leadership roles at Circuit City Stores, Inc., a nationalconsumer electronics retailer, including the last year as Vice President and Chief Financial Officer of retail. Prior toCircuit City, he served in various leadership, planning and strategy roles for Capital One Financial Corporation;AGL Capital Investments, LLC; Deloitte & Touche Consulting Group; and the United States Navy. He served tenyears in the Navy as a fighter pilot, later retiring from the Navy Reserve with a rank of Commander.
Scott A. Crozier joined PetSmart as Senior Vice President and General Counsel in June 1999, and wasappointed Secretary in June 2000 and Chief Compliance Officer in March 2005. From 1998 to 1999, Mr. Crozierwas Chairman and Chief Executive Officer of Westpac Consulting, L.L.C., a real estate services company. From1987 to 1998, Mr. Crozier served in various positions and finally as Vice President and General Counsel for PhelpsDodge Corporation, a global mining and manufacturing company. Prior to that, he was Counsel for TalleyIndustries, Inc., and served as an enforcement attorney with the Securities Division of the Arizona CorporationCommission and during that time, was also appointed as Special Assistant Attorney General with the ArizonaAttorney General’s Office. In January 2009, Mr. Crozier announced that he would retire in 2009.
Donald E. Beaver joined PetSmart as Senior Vice President and Chief Information Officer in May 2005. Priorto joining PetSmart, Mr. Beaver was employed by H.E. Butt Grocery Company where he held the position of SeniorVice President and Chief Information Officer starting in 1999. Prior to that, he served 14 years at Allied SignalAerospace, Inc. in various information systems leadership roles, the last being the CIO for the aftermarket supportdivision.
Kenneth T. Hall is currently serving a one-year executive rotational assignment in the field in Store Operations.Mr. Hall joined PetSmart in October 2000 as Vice President, Strategic Planning and Customer Relationships. InJanuary 2003, Mr. Hall was appointed Senior Vice President and Chief Marketing Officer, after serving in the rolefrom October 2002 on an interim basis. He was appointed Senior Vice President of Merchandising in February 2006and began his executive rotation in Store Operations in September 2008. Prior to PetSmart, he worked with Bain &Company, where he developed business and customer loyalty strategies and programs for major retail, automotiveand financial services companies. He began his career with Exxon Company, where he held a variety of operationsand financial roles.
David K. Lenhardt was appointed Senior Vice President, Store Operations and Human Resources in February2009. He joined PetSmart as Senior Vice President of Services, Strategic Planning and Business Development inSeptember 2000, and was appointed Senior Vice President, Store Operations and Services in February 2007. From1996 to 2000, Mr. Lenhardt was a manager with Bain & Company, Inc., where he led consulting teams for retail,technology and e-commerce clients. Prior to that, he worked in the corporate finance and Latin American groups ofMerrill Lynch & Co., Inc.’s investment banking division.
Mary L. Miller joined PetSmart as Senior Vice President and Chief Marketing Officer in July 2006. Ms. Millercame to PetSmart from Best Buy Co., Inc., a national consumer electronics company, where she last served as VicePresident of Strategic Marketing Services from 2004 to 2006. Prior to that, Ms. Miller served as Vice President ofCustomer Loyalty Marketing from 2002 to 2004 and served as Vice President of Consumer and Brand Marketingfrom 2000 to 2002. She started at Best Buy Co., Inc. in 1998. Previously, Ms. Miller served 13 years at The PillsburyCompany, where she began her career as a financial analyst.
7

Joseph D. O’Leary was appointed Senior Vice President, Merchandising and Supply Chain in October 2008.He joined PetSmart as Senior Vice President of Supply Chain in September 2006. Prior to joining PetSmart,Mr. O’Leary was Chief Operating Officer for Interactive Health, a manufacturer of robotic massage chairs. Prior tothat, he served as Senior Vice President of Supply Chain Strategy and Global Logistics for the Gap, Inc. from 2003to 2005, and Senior Vice President of Global Logistics from 2000 to 2003. Prior to 1999, Mr. O’Leary held positionsat Mothercare plc, Coopers & Lybrand LLP and BP International.
Jaye D. Perricone was appointed Senior Vice President, Real Estate and Development in December 2007,serving as Vice President, Real Estate during the year prior. Ms. Perricone joined PetSmart in 1995, and served in anumber of leadership roles including Regional Vice President, Vice President of Services Operations, VicePresident of Customer Service and Store Operations and Vice President of Property Management and Store Design.Prior to joining PetSmart, Ms. Perricone held various positions with Target Corporation, Pace MembershipWarehouse, Inc. and Bizmart, Inc.
Francesca M. Spinelli joined PetSmart as Senior Vice President of People in September 2003. She served asVice President of People for Radio Shack Corporation from 1998 to 1999, and Senior Vice President of People from1999 to 2003. Previously, Ms. Spinelli was with Wal-Mart Stores, Inc., where she held the positions of CorporateVice President, Organizational Development and Vice President, Human Resources — McLane Company, Inc., aformer division of Wal-Mart. Prior to 1993, Ms. Spinelli held human resources positions with Dillashaw, Hawthornand Company, P.C., and APS, Inc. In January 2009, Ms. Spinelli announced that she would retire in 2009.
Neil H. Stacey was appointed Senior Vice President of Human Resources in February 2009. He joinedPetSmart in 1995 and served in a number of leadership roles including Vice President General MerchandiseManager from 1995 to 1999, Senior Vice President of Merchandising Consumables from 1999 to 2000, RegionalVice President from 2000 to 2007, and Divisional Vice President of Operations from 2007 to 2009. Prior to joiningPetSmart, Mr. Stacey was employed at American Stores, a national food and drug retailer, where he held severalleadership positions including Vice President of Advertising and Market Development, Vice President of Mer-chandising and Vice President of Business Process Redesign.
Item 1A. Risk Factors
In the normal course of business, our operations, financial condition and results of operations are routinelysubjected to a variety of risks. Our actual financial results could differ materially from projected results due to someor all of the factors discussed below. You should carefully consider the risks and uncertainties described below, aswell as those discussed in the “Competition,” “Our Stores,” “Distribution” and “Government Regulation” sectionsof this Annual Report on Form 10-K. In addition, the current global economic conditions amplify many of theserisks.
A decline in consumer spending or a change in consumer preferences could reduce our sales or profitabilityand harm our business.
Our sales depend on consumer spending, which is influenced by factors beyond our control, including generaleconomic conditions, the availability of discretionary income and credit, weather, consumer confidence andunemployment levels. We may experience declines in sales or changes in the types of products sold duringeconomic downturns. Any material decline in the amount of consumer spending could reduce our sales, and adecrease in the sales of higher-margin products could reduce profitability, and, in each case, harm our business. Thesuccess of our business depends in part on our ability to identify and respond to evolving trends in demographics andconsumer preferences. Failure to timely identify or effectively respond to changing consumer tastes, preferences,spending patterns and pet care needs could adversely affect our relationship with our customers, the demand for ourproducts and services, our market share and our profitability.
The pet products and services retail industry is very competitive and continued competitive forces mayadversely impact our business and financial results.
The pet products and services retail industry is very competitive. We compete with supermarkets, warehouseclubs and other mass and general retail merchandisers, many of which are larger and have significantly greater
8
resources than we have. We also compete with a number of specialty pet supply stores and independent pet stores,veterinarians, catalog retailers and e-commerce retailers. The pet products and services retail industry has becomeincreasingly competitive due to the expansion of pet-related product offerings by certain supermarkets, warehouseclubs and other mass and retail merchandisers and the entrance of other specialty retailers into the pet food and petsupply market, some of which have developed store formats similar to ours. We can make no assurances we will notface greater competition from these or other retailers in the future. In particular, if supermarket, warehouse club orother mass and retail merchandiser competitors seek to gain or retain market share by reducing prices, we wouldlikely reduce our prices on similar product offerings in order to remain competitive, which may result in a decreasein our market share, sales, operating results and profitability and require a change in our operating strategies.
Comparable store sales growth may decrease as stores grow older. If we are unable to increase sales at ourexisting stores, our results of operations could be harmed.
We can make no assurances that our stores will meet forecasted levels of sales and profitability. As a result ofnew store openings in existing markets, and because older stores will represent an increasing proportion of our storebase over time, our comparable store sales performance may be severely impacted in future periods. In addition, aportion of a typical new store’s sales comes from customers who previously shopped at other PetSmart stores in theexisting market.
We may be unable to continue to open new stores and enter new markets successfully. If we are unable tosuccessfully reformat existing stores and open new stores, our results of operations could be harmed. Also,store development may place increasing demands on management and operating systems and may erodesales at existing stores.
We currently operate stores in most of the major market areas of the United States and Canada. Our ability to besuccessful with our store development efforts is dependent on various factors, some of which are outside of ourcontrol, including:
• Identifying store sites that offer attractive returns on our investment including the impact of cannibalizationof our existing stores;
• Competition for those sites;
• Successfully negotiating with landlords and obtaining any necessary governmental, regulatory or privateapprovals;
• Timely construction of stores; and
• Our ability to attract and retain qualified store personnel.
To the extent we are unable to accomplish any of the above, our ability to open new stores and hotels may beharmed and our future sales and profits may be adversely affected. In addition, we can make no assurances that wewill be able to meet the forecasted level of sales or operate our new stores or hotels profitably.
The increased demands placed on existing systems and procedures, and on management by our storedevelopment plans, also could result in operational inefficiencies and less effective management of our businessand associates, which could in turn adversely affect our financial performance. Opening new stores in a market willattract some customers away from other stores already operated by us in that market and diminish their sales. Anincrease in construction costs and/or building material costs could also adversely affect our financial performance.
Our leases are typically signed approximately 12 months before a store opens. Because of that timing, we maybe unable to adjust our store opening schedule to new economic conditions or a change in strategy in a timelymanner.
9

Our quarterly operating results may fluctuate due to seasonal changes associated with the pet products andservices retail industry and the timing of expenses, new store openings and store closures.
Our business is subject to seasonal fluctuation. We typically realize a higher portion of our net sales andoperating profit during the fourth fiscal quarter. Sales of certain products and services are seasonal and because ourstores typically draw customers from a large area, sales may also be impacted by adverse weather or travelconditions, which are more prevalent during certain seasons of the year. As a result of this seasonality, we believethat quarter-to-quarter comparisons of our operating results are not necessarily meaningful and that thesecomparisons cannot be relied upon as indicators of future performance. Also, controllable expenses, such asadvertising, may fluctuate from quarter to quarter within a year. As a result of our expansion plans, the timing ofnew store openings and related preopening expenses, the amount of revenue contributed by new and existing stores,and the timing and estimated obligations of store closures, our quarterly results of operations may fluctuate. Finally,because new stores tend to experience higher payroll, advertising and other store level expenses as a percentage ofnet sales than mature stores, new store openings will also contribute to lower store operating margins until thesestores become established.
Failure to successfully manage and execute our marketing initiatives could have a negative impact on ourbusiness.
Our continued success and growth depend on improving customer traffic to gain sales momentum in our storesand on our e-commerce web site. Historically, we have utilized various media to reach the consumer, and we haveexperienced varying levels of favorable response to our marketing efforts. Often, media placement decisions aremade months in advance, and our inability to accurately predict our consumers’ preferred method of communi-cation may result in fewer customers shopping at our stores and thereby negatively impact our business andfinancial performance.
Our operating margins at new stores may be lower than those of existing stores.
Preopening expenses and lower sales volumes associated with newly opened stores can impact operatingmargins. In some geographic regions, we expect certain new store operating costs, particularly those related tooccupancy, to be higher than in the past. As a result of our new stores and the impact of these rising costs, our totalstore contribution and operating margins may be lower in future periods than they have been in the past.
A disruption, malfunction or increased costs in the operation, expansion or replenishment of our distribu-tion centers or our supply chain would impact our ability to deliver to our stores or increase our expenses,which could harm our sales and results of operations.
Our vendors generally ship merchandise to one of our distribution centers, which receive and allocatemerchandise to our stores. Any interruption or malfunction in our distribution operations, including, but not limitedto, the loss of a key vendor that provides transportation of merchandise to or from our distribution centers, couldharm our sales and the results of our operations. We seek to optimize inventory levels to operate our businesssuccessfully. An interruption in the supply chain could result in out-of-stock or excess merchandise inventory levelsthat could harm our sales and the results of operations. We operate two fish distribution centers and have two fishdistribution centers that are operated by a third-party vendor, and an interruption or malfunction in these operationsor in the fulfillment of fish orders could harm our sales and results of operations. Operating the fish distributioncenters is a very complex process, and if we lose the third-party operator, we can make no assurances that we couldcontract with another third-party to operate the fish distribution centers on favorable terms, if at all, or that we couldsuccessfully operate the fish distribution centers ourselves. In addition, our growth plans require the development ofnew distribution centers to service the increasing number of stores. If we are unable to successfully expand ourdistribution network in a timely manner, our sales or results of operations could be harmed.
Failure to successfully manage our inventory could harm our business.
In addition to the risks described elsewhere in this Item 1A relating to our distribution centers and inventoryoptimization by us and third parties, we are exposed to inventory risks that may adversely affect our operating
10

results as a result of seasonality, new product launches, changes in customer demand and consumer spendingpatterns, changes in consumer tastes with respect to our products and other factors. We endeavor to accuratelypredict these trends and avoid overstocking or understocking products that we sell. Demand for products, however,can change between the time inventory is ordered and the date of sale. In addition, when we begin selling a newproduct, it may be difficult to establish vendor relationships, determine appropriate product selection, andaccurately forecast demand. We carry a broad selection of certain products, and we may be unable to sell productsin sufficient quantities or during the relevant selling seasons. Any one of the inventory risk factors set forth abovemay adversely affect our operating results.
If our information systems fail to perform as designed or are interrupted for a significant period of time,our business could be harmed.
The efficient operation of our business is dependent on our information systems. In particular, we rely on ourinformation systems to effectively manage our financial and operational data and to maintain our in-stock positions.We possess disaster recovery capabilities for our key information systems and take measures to prevent securitybreaches and computer viruses. The failure of our information systems to perform as designed, loss of data or anyinterruption of our information systems for a significant period of time could disrupt our business.
We continue to invest in our information systems. Enhancement to or replacement of our major financial oroperational information systems could have a significant impact on our ability to conduct our core businessoperations and increase our risk of loss resulting from disruptions of normal operating processes and procedures thatmay occur during the implementation of new information systems. We can make no assurances that the costs ofinvestments in our information systems will not exceed estimates, that the systems will be implemented withoutmaterial disruption, or that the systems will be as beneficial as predicted. If any of these events occur, our results ofoperations could be harmed.
If we fail to protect the integrity and security of customer and associate information, we could be exposedto litigation and our business could be adversely impacted.
The increasing costs associated with information security, such as increased investment in technology, thecosts of compliance with consumer protection laws, and costs resulting from consumer fraud, could adverselyimpact our business. We also routinely possess sensitive customer and associate information and, while we havetaken reasonable and appropriate steps to protect that information, if our security procedures and controls werecompromised, it could harm our business, reputation, operating results and financial condition and may increase thecosts we incur to protect against such information security breaches.
The disruption of the relationship with or the loss of any of our key vendors, a decision by our vendors tomake their products available in supermarkets or through warehouse clubs and other mass and retail mer-chandisers, or the inability of our vendors to provide quality products in a timely or cost-effective manneror risks associated with the suppliers from whom products are sourced, could harm our business.
Sales of premium pet food for dogs and cats comprise a significant portion of our net sales. Currently, mostmajor vendors of premium pet food do not permit their products to be sold in supermarkets, warehouse clubs, orthrough other mass and retail merchandisers. If any premium pet food or pet supply vendor was to make its productsavailable in supermarkets or through warehouse clubs and other mass and retail merchandisers, our business couldbe harmed. In addition, if the grocery brands currently available to such retailers were to gain market share at theexpense of the premium brands sold only through specialty pet food and pet supply outlets, our business could beharmed.
We purchase a substantial amount of pet supplies from a number of vendors with limited supply capabilities,and two of our largest vendors account for a material amount of products sold. We can make no assurances that wewill be able to find new qualified vendors who meet our standards or that our current pet supply vendors will be ableto accommodate our anticipated needs or comply with existing or any new regulatory requirements. In addition, wepurchase a substantial amount of pet supplies from vendors outside of the United States. Effective global sourcing ofmany of the products we sell is an important factor in our financial performance. We can make no assurances that
11

our international vendors will be able to satisfy our requirements including, but not limited to, timeliness ofdelivery, acceptable product quality, packaging and labeling requirements. Any inability of our existing vendors toprovide products meeting such requirements in a timely or cost-effective manner could harm our business. Whilewe believe our vendor relationships are good, we have no material long-term supply commitments from ourvendors, and any vendor could discontinue selling to us at any time.
Many factors relating to our vendors and the countries in which they are located are beyond our control,including the stability of the political, economic and financial environments where they are located, their ability tooperate in challenging economic environments or meet our standards and applicable legal requirements, theavailability of labor and raw materials, merchandise quality issues, currency exchange rates, transport availabilityand cost, inflation and other factors. In addition, Canada’s and the United States’ foreign trade policies, tariffs andother impositions on imported goods, trade sanctions imposed on certain countries, the limitation on the import ofcertain types of goods or of goods containing certain materials from other countries and other factors relating toforeign trade are beyond our control. These factors affecting our vendors and our access to products could adverselyaffect our operations and our financial performance.
Our expanded offering of proprietary branded products may not improve our financial performance andmay expose us to product liability claims.
We offer various proprietary branded products, for which we rely on third-party manufacturers. Such third-party manufacturers may prove to be unreliable, or the quality of the products may not meet our expectations. Inaddition, our proprietary branded products compete with other manufacturers’ branded items that we offer. As wecontinue to evaluate the number and types of proprietary branded products that we sell, we may adversely affect ourrelationships with our vendors, who may decide to reduce their product offerings through us and increase theirproduct offerings through our competitors. Finally, if any of our customers are harmed by our proprietary brandedproducts, they may bring product liability and other claims against us. Any of these circumstances could have anadverse effect on our business and financial performance.
Food safety, quality and health concerns could affect our business.
We could be adversely affected if consumers lose confidence in the safety and quality of certain vendor-supplied food products and hard-good products. Adverse publicity about these types of concerns, whether valid ornot, may discourage consumers from buying the products in our stores or cause vendor production and deliverydisruptions. The real or perceived sale of contaminated food products by us could result in product liability claimsagainst our vendors or us and a loss of consumer confidence, which could have an adverse effect on our sales andoperations.
Our failure to successfully anticipate merchandise returns could have a negative impact on our business.
We record a reserve for merchandise returns based on historical return trends together with current productsales performance in each reporting period. If actual returns are greater than those projected by management,additional sales returns might be recorded in the future. Actual merchandise returns may exceed our reserves. Inaddition, to the extent that returned merchandise is damaged, we often do not receive full retail value from the resaleor liquidation of the merchandise. Further, the introduction of new merchandise, changes in merchandise mix,changes in consumer confidence, or other competitive and general economic conditions may cause actual returns toexceed merchandise return reserves. Any significant increase in merchandise returns that exceeds our reservescould harm our business and operating results.
We depend on key executives, store managers and other personnel and may not be able to retain or replacethese employees or recruit additional qualified personnel, which could harm our business.
Our success is largely dependent on the efforts and abilities of our senior executive group and other keypersonnel. The loss of the services of one or more of our key executives or personnel, or the increased demandsplaced on our key executives and personnel by our continued growth, could adversely impact our financialperformance and our ability to execute our strategies. In addition, our future success depends on our ability to
12

attract, train, manage and retain highly skilled store managers and qualified services personnel such as pet trainersand groomers. There is a high level of competition for these employees, and our ability to operate our stores andexpand our services depends on our ability to attract and retain these personnel. Competition for qualifiedmanagement and services personnel could require us to pay higher wages or other compensation to attract asufficient number of employees. Turnover, which has historically been high among entry-level or part-timeassociates at our stores and distribution centers, increases the risk associates will not have the training andexperience needed to provide competitive, high-quality customer service. Our ability to meet our labor needs whilecontrolling our labor costs is subject to numerous external factors, including unemployment levels, prevailing wagerates, changing demographics and changes in employment legislation. If we are unable to retain qualified associatesor our labor costs increase significantly, our business operations and our financial performance could be adverselyimpacted. In addition, there historically has been a shortage of qualified veterinarians. If third party veterinaryservices providers cannot attract and retain a sufficient number of qualified veterinarians, their ability to provideveterinary services in our stores and our ability to increase the number of stores in which veterinary services areprovided, may be impacted.
Our international operations may result in additional market risks, which may harm our business.
We entered the Canadian market in 1996 and operate 61 stores in Canada as of February 1, 2009. As theseoperations grow, they may require greater management and financial resources. International operations require theintegration of personnel with varying cultural and business backgrounds and an understanding of the relevantdifferences in the cultural, legal, and regulatory environments. Our results may be increasingly affected by the risksof our international activities, including:
• Fluctuations in currency exchange rates;
• Changes in international staffing and employment issues;
• Tariff and other trade barriers;
• Greater difficulty in utilizing and enforcing our intellectual property rights;
• Failure to understand the local culture and market;
• The burden of complying with foreign laws, including tax laws and financial accounting standards; and
• Political and economic instability and developments.
Our business may be harmed if the operation of veterinary hospitals at our stores is limited or fails tocontinue.
We and MMIH, the third-party operator of Banfield, The Pet Hospital, and our other third-party operators aresubject to statutes and regulations in various states and Canadian provinces regulating the ownership of veterinarypractices, or the operation of veterinary hospitals in retail stores, that may impact our ability to host and MMIH’sability to operate veterinary hospitals within our facilities. A determination that we, or MMIH, are in violation ofany of these applicable statutes and regulations could require us, or MMIH, to restructure our operations to comply,or render us, or MMIH, unable to operate veterinary hospitals in a given location. If MMIH were to experiencefinancial or other operating difficulties that would force it to limit its operations, or if MMIH were to ceaseoperating the veterinary hospitals in our stores, our business may be harmed. We can make no assurances that wecould contract with another third-party to operate the veterinary hospitals on favorable terms, if at all, or that wecould successfully operate the veterinary hospitals ourselves.
We currently account for our investment in MMIH under the equity method of accounting under AccountingPrinciples Board Opinion, or “APB,” No. 18, “The Equity Method of Accounting for Investments in Common Stock.”Any significant decrease in MMIH’s financial results may negatively impact our financial performance.
13

We face various risks as an e-commerce retailer.
We may require additional capital in the future to sustain or grow our e-commerce business. We have engaged athird-party to maintain our e-commerce website and process all customer orders placed through that site. Businessrisks related to our e-commerce business include our ability to keep pace with rapid technological change; failure inour, or any third-party processor’s, security procedures and operational controls; failure or inadequacy in our, or anythird-party processor’s, systems or ability to process customer orders; government regulation and legal uncertaintieswith respect to e-commerce; and collection of sales or other taxes by one or more states or foreign jurisdictions. Ifany of these risks materialize, it could have an adverse effect on our business.
Our business could be harmed if we were unable to effectively manage our cash flow and raise any neededadditional capital on acceptable terms.
We expect to fund our currently planned operations with existing capital resources, including cash flows fromoperations and the borrowing capacity under our credit facility. If, however, we are unable to effectively manage ourcash flows or generate and maintain positive operating cash flows and operating income in the future, we may needadditional funding. We may also choose to raise additional capital due to market conditions or strategic consid-erations even if we believe that we have sufficient funds for our current or future operating plans. Our credit facilityand letter of credit facility are secured by substantially all our personal property assets, our subsidiaries and certainreal property. This could limit our ability to obtain, or obtain on favorable terms, additional financing and may makeadditional debt financing outside our credit facility and letter of credit facility more costly. If additional capital wereneeded, an inability to raise capital on favorable terms could harm our business and financial condition. In addition,to the extent that we raise additional capital through the sale of equity or debt securities convertible into equity, theissuance of these securities could result in dilution or accretion to our stockholders.
Failure to successfully integrate any business we acquire could have an adverse impact on our financialresults.
We may, from time to time, acquire businesses we believe to be complementary to our business. Acquisitionsmay result in difficulties in assimilating acquired companies and may result in the diversion of our capital and ourmanagement’s attention from other business issues and opportunities. We may not be able to successfully integrateoperations that we acquire, including their personnel, financial systems, distribution, operations and generaloperating procedures. If we fail to successfully integrate acquisitions, we could experience increased costsassociated with operating inefficiencies which could have an adverse effect on our financial results. Also, whilewe employ several different methodologies to assess potential business opportunities, the new businesses may notpositively affect our financial performance.
Changes to estimates related to our property and equipment, or operating results, that are lower than ourcurrent estimates at certain store locations, may cause us to incur impairment charges.
We make estimates and projections in connection with impairment analyses for our store locations inaccordance with accounting principles generally accepted in the United States of America, or “GAAP.” Wereview all stores for potential impairment. An impairment charge is required when the carrying value of the assetexceeds the undiscounted future cash flows over the life of the asset. These calculations require us to make a numberof estimates and projections of future results. If these estimates or projections change or prove inaccurate, we maybe, and have been, required to record impairment charges on certain of these store locations. If these impairmentcharges are significant, our results of operations would be adversely affected.
Our inability or failure to protect our intellectual property could have a negative impact on our operatingresults.
Our trademarks, servicemarks, copyrights, patents, trade secrets, domain names and other intellectual propertyare valuable assets that are critical to our success. The unauthorized reproduction or other misappropriation of ourintellectual property could diminish the value of our brands or goodwill and cause a decline in our revenue oroperating results. Protecting our intellectual property outside the United States could be time-consuming and costly,
14

and the local laws and regulations outside the United States may not fully protect our rights in such intellectualproperty. Any infringement or other intellectual property claim made against us, whether or not it has merit, couldbe time-consuming, result in costly litigation, cause product delays or require us to enter into royalty or licensingagreements. As a result, any such claim could have an adverse effect on our operating results.
A determination that we are in violation of any contractual obligations or government regulations couldresult in a disruption to our operations and could harm our business.
We are subject to various contractual obligations with third-party providers and federal, state, provincial andlocal laws and regulations governing, among other things: our relationships with employees, including minimumwage requirements, overtime, terms and conditions of employment, working conditions and citizenship require-ments; veterinary practices, or the operation of veterinary hospitals in retail stores, that may impact our ability tooperate veterinary hospitals in certain facilities; the transportation, handling and sale of small pets; the generation,handling, storage, transportation and disposal of waste and biohazardous materials; the distribution, import/exportand sale of products; providing services to our customers; contracted services with various third-party providers;credit and debit card processing; the handling, security, protection and use of customer information; and thelicensing and certification of services.
We seek to structure our operations to comply with all applicable federal, state, provincial and local laws andregulations of each jurisdiction in which we operate. Given varying and uncertain interpretations of these laws andregulations and the fact that the laws and regulations are enforced by the courts and by regulatory authorities withbroad discretion, we can make no assurances that we would be found to be in compliance in all jurisdictions. Wealso could be subject to costs, including fines, penalties or sanctions and third-party claims as a result of violationsof, or liabilities under, the above referenced contracts, laws and regulations.
Failure of our internal controls over financial reporting could harm our business and financial results.
We have documented and tested our internal controls over financial reporting to assess their design andoperating effectiveness. Internal controls over financial reporting have inherent limitations and are not intended toprovide absolute assurance that a misstatement of our financial statements would be prevented or detected. We mayencounter problems or delays in completing the review and evaluation and implementing improvements. Addi-tionally, we may identify deficiencies that need to be addressed in our internal controls over financial reporting orother matters that may raise concerns for investors. Should we, or our independent registered public accountingfirm, determine in future periods that we have a material weakness in our internal controls over financial reporting,our results of operations or financial condition may be adversely affected and the price of our common stock maydecline.
Changes in laws, accounting standards and subjective assumptions, estimates, and judgments by manage-ment related to complex accounting matters could significantly affect our financial results.
GAAP and related accounting pronouncements, implementation guidelines and interpretations with regard to awide range of matters relevant to our business are highly complex, continually evolving and involve manysubjective assumptions, estimates and judgments by us. Changes in these rules or their interpretation, or changes inunderlying assumptions, estimates or judgments by us could significantly impact our reported or expected financialperformance.
An unfavorable determination by tax regulators may cause our provision for income and other taxes to beinadequate and may result in a material impact to our financial results.
We operate in multiple tax jurisdictions and believe we have made adequate provision for income and othertaxes. If, however, tax regulators in these jurisdictions determine a position we have taken on an issue isinappropriate, our financial results may be adversely affected.
15

Our business exposes us to claims, litigation and risk of loss that could result in adverse publicity, harm toour brand and impact our financial results.
We are occasionally subject to claims due to the injury or death of a pet in our stores or while under our care.We may also be subject to claims resulting from the transfer of diseases to other animals, associates and customersin our stores. From time to time we have been subject to class action lawsuits, governmental action, intellectualproperty infringement claims, product liability claims for some of the products we sell and general liability claimsresulting from store based incidents. Any negative publicity or claims relating to any of the foregoing could harmour reputation and business, as well as expose us to litigation expenses and damages.
There is a risk of loss from breaches in the security or other failures resulting from inadequate or failedprocesses or systems, theft or fraud. These can occur in many forms including, among others, errors, businessinterruptions, inappropriate behavior of or misconduct by our associates or those contracted to perform services forus, and vendors that do not perform in accordance with their contractual agreements. These events can potentiallyresult in financial losses or other damages.
We procure insurance to help manage a variety of risks including many of the foregoing claims. A failure ofinsurance to provide coverage for these risks may expose us to expensive defense costs and the costs of the ultimateoutcome of the matter. Furthermore, in connection with our insurance policies, we are subject to decisions made bythe insurance companies that may result in an increase in our costs that are outside of our control, which may impactour financial results.
Our inability to obtain commercial insurance at acceptable prices or our failure to adequately reserve forself-insured exposures may have a negative impact on our business.
Insurance costs continue to be volatile, affected by natural catastrophes, fear of terrorism, financial irreg-ularities and fraud at other publicly traded companies and fiscal viability of insurers. We believe that commercialinsurance coverage is prudent for risk management, and insurance costs may increase substantially in the future. Inaddition, for certain types or levels of risk, such as risks associated with earthquakes, hurricanes or terrorist attacks,we may determine that we cannot obtain commercial insurance at acceptable prices. Therefore, we may choose toforego or limit our purchase of relevant commercial insurance, choosing instead to self-insure one or more types orlevels of risks. Provisions for losses related to self-insured risks are based upon independent actuarially determinedestimates. We maintain stop-loss coverage to limit the exposure related to certain risks. The assumptions underlyingthe ultimate costs of existing claim losses are subject to a high degree of unpredictability, which can affect theliability recorded for such claims. For example, variability in inflation rates of health care costs inherent in theseclaims can affect the amounts realized. Similarly, changes in legal trends and interpretations, as well as a change inthe nature and method of how claims are settled can impact ultimate costs. Although our estimates of liabilitiesincurred do not anticipate significant changes in historical trends for these variables, any changes could have aconsiderable effect upon future claim costs and currently recorded liabilities and could have a material impact onour consolidated financial statements.
Pending legislation, weather, catastrophic events, disease, or other factors, could disrupt our operations,supply chain and the supply of small pets and products we sell, which could harm our reputation anddecrease sales.
There is generally a significant amount of legislation pending at the federal, state, provincial and local levelsregarding the handling of pets. This legislation may impair our ability to transport the small pets we sell in ourstores. The small pets we sell in our stores are susceptible to health risks and diseases that can quickly decrease ordestroy the supply of these pets. In addition, our supply of products may be negatively impacted by weather,catastrophic events, disease, supply chain malfunctions, contamination or trade barriers. Any disruption in ouroperations or the supply of products to our stores could harm our reputation and decrease our sales.
16

Fluctuations in the stock market, as well as general economic and market conditions, may impact our oper-ations, sales, financial results and market price of our common stock.
Over the last several years, the market price of our common stock has been subject to significant fluctuations.The market price of our common stock may continue to be subject to significant fluctuations in response to theimpact on our operations, sales and financial results of a variety of factors including, but not limited to:
• General economic changes;
• Actions taken by our competitors, including new product introductions and pricing changes;
• Changes in the strategy and capability of our competitors;
• Our ability to successfully integrate acquisitions;
• The prospects of our industry;
• Natural disasters, hostilities and acts of terrorism; and
• National or regional catastrophes or circumstances, such as a pandemic or other public health or welfarescare.
In addition, the stock market in recent years has experienced price and volume fluctuations that often havebeen unrelated or disproportionate to the operating performance of companies. These fluctuations, as well asgeneral economic and market conditions, including but not limited to those listed above, may harm the market priceof our common stock.
Continued volatility and disruption to the global capital and credit markets may adversely affect our abilityto access credit and the financial soundness of our suppliers.
Financial turmoil affecting the banking system and financial markets and the risk that additional financialinstitutions may consolidate or become insolvent has resulted in a tightening in the credit markets, a low level ofliquidity in many financial markets, and volatility in credit, currency and equity markets. In such an environment,there is a risk that lenders, even those with strong balance sheets and sound lending practices, could fail or refuse tohonor their legal commitments and obligations under existing credit commitments, including but not limited to:extending credit up to the maximum permitted by credit facility, allowing access to additional credit features andotherwise accessing capital and/or honoring loan commitments. If our lender fails to honor its legal commitmentsunder our credit facility, it could be difficult in this environment to replace our credit facility on similar terms. And ifour suppliers or key third party vendors of necessary services and technical systems encounter similar difficultieswith credit or liquidity in their own businesses, our business may also be adversely affected.
Our operating and financial performance in any given period may differ from the guidance we have pro-vided to the public.
We provide public guidance on our expected operating and financial results for future periods. Although webelieve that this guidance provides investors and analysts with a better understanding of management’s expectationsfor the future and is useful to our stockholders and potential stockholders, such guidance is comprised of forward-looking statements subject to the risks and uncertainties described in this report and in our other public filings andpublic statements. If our operating or financial results for a particular period differ from our guidance or theexpectations of investment analysts, or if we change our guidance for future periods, the market price of ourcommon stock could decline.
17

We have implemented some anti-takeover provisions that may prevent or delay an acquisition of us that maynot be beneficial to our stockholders.
Our restated certificate of incorporation and bylaws include provisions that may delay, defer or prevent achange in management or control that our stockholders may not believe is in their best interests. These provisionsinclude:
• A classified board of directors consisting of three classes;
• The ability of our board of directors to issue, without stockholder approval, up to 10,000,000 shares ofpreferred stock in one or more series with rights, obligations and preferences determined by the board ofdirectors;
• No right of stockholders to call special meetings of stockholders;
• No right of stockholders to act by written consent;
• Certain advance notice procedures for nominating candidates for election to the board of directors; and
• No right to cumulative voting.
In addition, our restated certificate of incorporation requires a 662⁄3% vote of stockholders to:
• alter or amend our bylaws;
• remove a director without cause; or
• alter, amend or repeal certain provisions of our restated certificate of incorporation.
We are also subject to the anti-takeover provisions of Section 203 of the Delaware General Corporation Law,and the application of Section 203 could delay or prevent an acquisition of PetSmart.
Item 1B. Unresolved Staff Comments
None.
18

Item 2. Properties
Our stores are generally located at sites co-anchored by strong destination superstores and typically are in ornear major regional shopping centers. The following table summarizes the locations of the stores by country andstate as of February 1, 2009:
United States:Number of
Stores
Alabama . . . . . . . . . . . . . . . . . . . . . . . . . . . . . . . . . . . . . . . . . . . . . . . . . . . . . . . . . . . . . . . . . . . . . . . . 13Arizona . . . . . . . . . . . . . . . . . . . . . . . . . . . . . . . . . . . . . . . . . . . . . . . . . . . . . . . . . . . . . . . . . . . . . . . . 47Arkansas . . . . . . . . . . . . . . . . . . . . . . . . . . . . . . . . . . . . . . . . . . . . . . . . . . . . . . . . . . . . . . . . . . . . . . . . 5California . . . . . . . . . . . . . . . . . . . . . . . . . . . . . . . . . . . . . . . . . . . . . . . . . . . . . . . . . . . . . . . . . . . . . . . 122Colorado. . . . . . . . . . . . . . . . . . . . . . . . . . . . . . . . . . . . . . . . . . . . . . . . . . . . . . . . . . . . . . . . . . . . . . . . 33Connecticut . . . . . . . . . . . . . . . . . . . . . . . . . . . . . . . . . . . . . . . . . . . . . . . . . . . . . . . . . . . . . . . . . . . . . . 7Delaware . . . . . . . . . . . . . . . . . . . . . . . . . . . . . . . . . . . . . . . . . . . . . . . . . . . . . . . . . . . . . . . . . . . . . . . 3Florida . . . . . . . . . . . . . . . . . . . . . . . . . . . . . . . . . . . . . . . . . . . . . . . . . . . . . . . . . . . . . . . . . . . . . . . . . 67Georgia . . . . . . . . . . . . . . . . . . . . . . . . . . . . . . . . . . . . . . . . . . . . . . . . . . . . . . . . . . . . . . . . . . . . . . . . 36Idaho . . . . . . . . . . . . . . . . . . . . . . . . . . . . . . . . . . . . . . . . . . . . . . . . . . . . . . . . . . . . . . . . . . . . . . . . . . 4Illinois . . . . . . . . . . . . . . . . . . . . . . . . . . . . . . . . . . . . . . . . . . . . . . . . . . . . . . . . . . . . . . . . . . . . . . . . . 49Indiana . . . . . . . . . . . . . . . . . . . . . . . . . . . . . . . . . . . . . . . . . . . . . . . . . . . . . . . . . . . . . . . . . . . . . . . . . 21Iowa. . . . . . . . . . . . . . . . . . . . . . . . . . . . . . . . . . . . . . . . . . . . . . . . . . . . . . . . . . . . . . . . . . . . . . . . . . . 8Kansas . . . . . . . . . . . . . . . . . . . . . . . . . . . . . . . . . . . . . . . . . . . . . . . . . . . . . . . . . . . . . . . . . . . . . . . . . 7Kentucky . . . . . . . . . . . . . . . . . . . . . . . . . . . . . . . . . . . . . . . . . . . . . . . . . . . . . . . . . . . . . . . . . . . . . . . 8Louisiana . . . . . . . . . . . . . . . . . . . . . . . . . . . . . . . . . . . . . . . . . . . . . . . . . . . . . . . . . . . . . . . . . . . . . . . 14Maine. . . . . . . . . . . . . . . . . . . . . . . . . . . . . . . . . . . . . . . . . . . . . . . . . . . . . . . . . . . . . . . . . . . . . . . . . . 2Maryland . . . . . . . . . . . . . . . . . . . . . . . . . . . . . . . . . . . . . . . . . . . . . . . . . . . . . . . . . . . . . . . . . . . . . . . 29Massachusetts . . . . . . . . . . . . . . . . . . . . . . . . . . . . . . . . . . . . . . . . . . . . . . . . . . . . . . . . . . . . . . . . . . . . 14Michigan . . . . . . . . . . . . . . . . . . . . . . . . . . . . . . . . . . . . . . . . . . . . . . . . . . . . . . . . . . . . . . . . . . . . . . . 32Minnesota . . . . . . . . . . . . . . . . . . . . . . . . . . . . . . . . . . . . . . . . . . . . . . . . . . . . . . . . . . . . . . . . . . . . . . . 15Mississippi . . . . . . . . . . . . . . . . . . . . . . . . . . . . . . . . . . . . . . . . . . . . . . . . . . . . . . . . . . . . . . . . . . . . . . 5Missouri . . . . . . . . . . . . . . . . . . . . . . . . . . . . . . . . . . . . . . . . . . . . . . . . . . . . . . . . . . . . . . . . . . . . . . . . 17Montana . . . . . . . . . . . . . . . . . . . . . . . . . . . . . . . . . . . . . . . . . . . . . . . . . . . . . . . . . . . . . . . . . . . . . . . . 3Nebraska . . . . . . . . . . . . . . . . . . . . . . . . . . . . . . . . . . . . . . . . . . . . . . . . . . . . . . . . . . . . . . . . . . . . . . . 6Nevada . . . . . . . . . . . . . . . . . . . . . . . . . . . . . . . . . . . . . . . . . . . . . . . . . . . . . . . . . . . . . . . . . . . . . . . . . 15New Hampshire . . . . . . . . . . . . . . . . . . . . . . . . . . . . . . . . . . . . . . . . . . . . . . . . . . . . . . . . . . . . . . . . . . . 5New Jersey . . . . . . . . . . . . . . . . . . . . . . . . . . . . . . . . . . . . . . . . . . . . . . . . . . . . . . . . . . . . . . . . . . . . . . 37New Mexico . . . . . . . . . . . . . . . . . . . . . . . . . . . . . . . . . . . . . . . . . . . . . . . . . . . . . . . . . . . . . . . . . . . . . 6New York . . . . . . . . . . . . . . . . . . . . . . . . . . . . . . . . . . . . . . . . . . . . . . . . . . . . . . . . . . . . . . . . . . . . . . . 37North Carolina . . . . . . . . . . . . . . . . . . . . . . . . . . . . . . . . . . . . . . . . . . . . . . . . . . . . . . . . . . . . . . . . . . . 37North Dakota . . . . . . . . . . . . . . . . . . . . . . . . . . . . . . . . . . . . . . . . . . . . . . . . . . . . . . . . . . . . . . . . . . . . 2Ohio. . . . . . . . . . . . . . . . . . . . . . . . . . . . . . . . . . . . . . . . . . . . . . . . . . . . . . . . . . . . . . . . . . . . . . . . . . . 39Oklahoma . . . . . . . . . . . . . . . . . . . . . . . . . . . . . . . . . . . . . . . . . . . . . . . . . . . . . . . . . . . . . . . . . . . . . . . 13Oregon . . . . . . . . . . . . . . . . . . . . . . . . . . . . . . . . . . . . . . . . . . . . . . . . . . . . . . . . . . . . . . . . . . . . . . . . . 14Pennsylvania . . . . . . . . . . . . . . . . . . . . . . . . . . . . . . . . . . . . . . . . . . . . . . . . . . . . . . . . . . . . . . . . . . . . . 44Rhode Island . . . . . . . . . . . . . . . . . . . . . . . . . . . . . . . . . . . . . . . . . . . . . . . . . . . . . . . . . . . . . . . . . . . . . 2South Carolina . . . . . . . . . . . . . . . . . . . . . . . . . . . . . . . . . . . . . . . . . . . . . . . . . . . . . . . . . . . . . . . . . . . 15South Dakota . . . . . . . . . . . . . . . . . . . . . . . . . . . . . . . . . . . . . . . . . . . . . . . . . . . . . . . . . . . . . . . . . . . . 2Tennessee . . . . . . . . . . . . . . . . . . . . . . . . . . . . . . . . . . . . . . . . . . . . . . . . . . . . . . . . . . . . . . . . . . . . . . . 20Texas . . . . . . . . . . . . . . . . . . . . . . . . . . . . . . . . . . . . . . . . . . . . . . . . . . . . . . . . . . . . . . . . . . . . . . . . . . 107Utah . . . . . . . . . . . . . . . . . . . . . . . . . . . . . . . . . . . . . . . . . . . . . . . . . . . . . . . . . . . . . . . . . . . . . . . . . . . 11Vermont . . . . . . . . . . . . . . . . . . . . . . . . . . . . . . . . . . . . . . . . . . . . . . . . . . . . . . . . . . . . . . . . . . . . . . . . 1Virginia . . . . . . . . . . . . . . . . . . . . . . . . . . . . . . . . . . . . . . . . . . . . . . . . . . . . . . . . . . . . . . . . . . . . . . . . 43Washington . . . . . . . . . . . . . . . . . . . . . . . . . . . . . . . . . . . . . . . . . . . . . . . . . . . . . . . . . . . . . . . . . . . . . . 22West Virginia . . . . . . . . . . . . . . . . . . . . . . . . . . . . . . . . . . . . . . . . . . . . . . . . . . . . . . . . . . . . . . . . . . . . 1Wisconsin . . . . . . . . . . . . . . . . . . . . . . . . . . . . . . . . . . . . . . . . . . . . . . . . . . . . . . . . . . . . . . . . . . . . . . . 11Total U.S. stores . . . . . . . . . . . . . . . . . . . . . . . . . . . . . . . . . . . . . . . . . . . . . . . . . . . . . . . . . . . . . . . . . . 1,051Canada . . . . . . . . . . . . . . . . . . . . . . . . . . . . . . . . . . . . . . . . . . . . . . . . . . . . . . . . . . . . . . . . . . . . . . . . . 61Total stores . . . . . . . . . . . . . . . . . . . . . . . . . . . . . . . . . . . . . . . . . . . . . . . . . . . . . . . . . . . . . . . . . . . . . 1,112
19

We lease substantially all of our stores, distribution centers, and corporate offices under non-cancelable leases.The terms of the store leases generally range from 10 to 15 years and typically allow us to renew for two to threeadditional five-year terms. Store leases, excluding renewal options, expire at various dates through 2025. Certainleases require payment of property taxes, utilities, common area maintenance, and insurance and, if annual sales atcertain stores exceed specified amounts, provide for additional rent. We have paid minimal additional rent underthese provisions during 2008, 2007 and 2006.
Our corporate offices currently contain approximately 250,000 square feet. In July 2006, we entered into15 year lease agreements to expand our corporate offices and renovate the existing offices. The project is expectedto be completed in April 2009 and add approximately 115,000 square feet.
Our distribution centers and respective lease expirations as of February 1, 2009, were as follows:
LocationSquareFootage Date Opened Distribution Type Lease Expiration
(In thousands)
Ennis, Texas . . . . . . . . . . . 230 May 1996 Combination distribution center 2012
Phoenix, Arizona . . . . . . . 620 November 1999 Forward distribution center 2021
Columbus, Ohio . . . . . . . . 613 September 2000 Combination distribution center 2010
Gahanna, Ohio . . . . . . . . . 276 October 2000 Forward distribution center 2010
Hagerstown, Maryland . . . 252 October 2000 Forward distribution center 2010
Ottawa, Illinois . . . . . . . . . 1,000 August 2005 Combination distribution center 2015
Newnan, Georgia . . . . . . . 878 July 2007 Combination distribution center 2022
Reno, Nevada . . . . . . . . . . 873 April 2008 Combination distribution center 2023
Total . . . . . . . . . . . . . . . . 4,742
We opened our 878,000 square foot combination distribution center in Newnan, Georgia in July 2007,replacing the 200,000 square foot forward distribution center previously leased in Newnan, Georgia. In April 2008,we replaced a 199,000 square foot forward distribution center in Reno, Nevada with an 873,000 square footcombination distribution center in Reno, Nevada.
In February 2007, we decided to exit the State Line Tack equine product line and closed our e-commercefulfillment, equine catalog fulfillment and equine distribution center in Brockport, New York during 2007. SeeNote 18 in the Notes to Consolidated Financial Statements for additional information.
Item 3. Legal Proceedings
In October 2006, two lawsuits were filed against us in California State Court on behalf of putative classes ofcurrent and former California employees. The first suit, Sorenson v. PetSmart, was filed on October 3, 2006. Theplaintiff, a former dog groomer, alleges that she and other non-exempt employees failed to receive their meal andrest breaks as required by law. The second suit, Enabnit v. PetSmart, was filed on October 12, 2006, and alleges mealand rest period violations and that employee paychecks were not compliant with the California Labor Code. Theplaintiff seeks compensatory damages, penalties under the California Labor Code, restitution, attorney’s fees, costsand prejudgment interest. In November 2006, we removed both actions to the United States District Court for theEastern District of California. The parties have reached an agreement in principle to settle both of these matters foran amount that will not be material to our consolidated financial statements and has been accrued. The Sorensonsettlement was preliminarily approved by the court on August 5, 2008, while the Enabnit settlement waspreliminarily approved on December 8, 2008.
On January 12, 2009, a former groomer filed a lawsuit on behalf of herself and a putative class of current andformer groomers in California State Court entitled Langton v. PetSmart. The plaintiff alleges that she and other non-exempt groomers did not receive payment for all hours worked, did not receive meal and rest breaks, did not receiveall wages due upon termination, did not receive accurate wage statements as required by law, and were not providedwith necessary tools and equipment. The plaintiff seeks compensatory damages, penalties under the California
20
Labor Code, restitution, attorney’s fees and costs, and prejudgment interest. On February 17, 2009, we removed theaction to the United States District Court for the Central District of California.
We are also a party to several lawsuits arising from the pet food recalls announced by several manufacturersbeginning in March 2007. The named plaintiffs sued the major pet food manufacturers and retailers claiming thattheir pets suffered injury and/or death as a result of consuming allegedly contaminated pet food and pet snackproducts.
Bruski v. Nutro Products, et al., USDC, N.D. IL (filed 3/23/07)Rozman v. Menu Foods, et al., USDC, MN (filed 4/9/07)Ford v. Menu Foods, et al., USDC, S.D. CA (filed 4/23/07)Wahl, et al. v. Wal-Mart Stores Inc., et al., USDC, C.D. CA (filed 4/10/07)Demith v. Nestle, et al., USDC, N.D. IL (filed 4/23/07)Thompkins v. Menu Foods, et al., USDC, CO (filed 4/11/07)McBain v. Menu Foods, et al., Judicial Centre of Regina, Canada (filed 7/11/07)Dayman v. Hills Pet Nutrition Inc., et al. Ontario Superior Court of Justice (filed 8/8/07)Esau v. Menu Foods, et al., Supreme Court of Newfoundland and Labrador (filed 9/5/07)Ewasew v. MenuFoods, et al., Supreme Court of British Colombia (filed 3/23/07)Silva v. Menu foods, et al., Canada Province of Manitoba (filed 3/30/07)Powell v. Menu Foods, et al., Ontario Superior Court of Justice (filed 3/28/07)
By order dated June 28, 2007, the Bruski, Rozman, Ford, Wahl, Demith and Thompkins cases were transferredto the U.S. District Court for the District of New Jersey and consolidated with other pet food class actions under thefederal rules for multi-district litigation (In re: Pet Food Product Liability Litigation, Civil No. 07-2867). TheCanadian cases were not consolidated.
On May 21, 2008, the parties to the U.S. lawsuits comprising the In re: Pet Food Product Liability Litigationand the Canadian cases jointly submitted a comprehensive settlement arrangement for court approval. Preliminarycourt approval was received from the U.S. District Court on May 3, 2008, and from all of the Canadian courts as ofJuly 8, 2008. On October 14, 2008, the U.S. court approved the settlement, and the Canadian courts gave finalapproval on November 3, 2008.
Two different groups of objectors filed notices of appeal with respect to the U.S. District Court’s approval ofthe U.S. settlement. Upon expiration of the prescribed appeal process, these cases should be resolved, and wecontinue to believe they will not have a material adverse impact on our consolidated financial statements.
There have been no appeals filed in Canada.
We are involved in the defense of various other legal proceedings that we do not believe are material to ourconsolidated financial statements.
Item 4. Submission of Matters to a Vote of Security Holders
No matters were submitted to a vote of our security holders during the thirteen weeks ended February 1, 2009.
PART II
Item 5. Market for the Registrant’s Common Equity, Related Stockholder Matters and Issuer Purchases ofEquity Securities
Price Range of Common Stock. Our common stock is traded on the NASDAQ Global Select Market underthe symbol PETM. The following table indicates the intra-day quarterly high and low price per share of our common
21

stock. These prices represent quotations among dealers without adjustments for retail mark-ups, markdowns orcommissions, and may not represent actual transactions.
High Low
Year Ended February 1, 2009First Quarter ended May 4, 2008. . . . . . . . . . . . . . . . . . . . . . . . . . . . . . . . . . . . . $24.81 $18.75
Second Quarter ended August 3, 2008. . . . . . . . . . . . . . . . . . . . . . . . . . . . . . . . . $24.94 $18.78
Third Quarter ended November 2, 2008. . . . . . . . . . . . . . . . . . . . . . . . . . . . . . . . $28.86 $16.73
Fourth Quarter ended February 1, 2009 . . . . . . . . . . . . . . . . . . . . . . . . . . . . . . . . $19.89 $13.27
Year Ended February 3, 2008First Quarter ended April 29, 2007 . . . . . . . . . . . . . . . . . . . . . . . . . . . . . . . . . . . $34.69 $28.50
Second Quarter ended July 29, 2007 . . . . . . . . . . . . . . . . . . . . . . . . . . . . . . . . . . $35.48 $31.15
Third Quarter ended October 28, 2007 . . . . . . . . . . . . . . . . . . . . . . . . . . . . . . . . $35.01 $27.57
Fourth Quarter ended February 3, 2008 . . . . . . . . . . . . . . . . . . . . . . . . . . . . . . . . $29.98 $21.12
Common Stock Dividends. We believe our ability to generate cash allows us to invest in the growth of thebusiness and, at the same time, distribute a quarterly dividend. Our credit facility and letter of credit facility permitus to pay dividends, as long as we are not in default and the payment of dividends would not result in default.
In 2008, the following dividends were declared by the Board of Directors:
Date Declared
DividendAmount per
ShareStockholders of
Record Date Date Paid
March 25, 2008 . . . . . . . . . . . . . . . . . . . . . $0.03 May 2, 2008 May 16, 2008
June 18, 2008. . . . . . . . . . . . . . . . . . . . . . . $0.03 August 1, 2008 August 15, 2008
September 24, 2008 . . . . . . . . . . . . . . . . . . $0.03 October 31, 2008 November 14, 2008
December 17, 2008 . . . . . . . . . . . . . . . . . . $0.03 January 30, 2009 February 13, 2009
In 2007, the following dividends were declared by the Board of Directors:
Date Declared
DividendAmount per
ShareStockholders of
Record Date Date Paid
March 27, 2007 . . . . . . . . . . . . . . . . . . . . . . $0.03 April 27, 2007 May 11, 2007
June 20, 2007 . . . . . . . . . . . . . . . . . . . . . . . $0.03 July 27, 2007 August 10, 2007
September 19, 2007 . . . . . . . . . . . . . . . . . . . $0.03 October 26, 2007 November 9, 2007
December 13, 2007 . . . . . . . . . . . . . . . . . . . $0.03 February 1, 2008 February 15, 2008
On March 24, 2009, the Board of Directors declared a quarterly cash dividend of $0.03 per share payable onMay 15, 2009 to stockholders of record on May 1, 2009.
Holders. On March 16, 2009, there were 3,539 holders of record of our common stock.
Equity Compensation Plan Information. Information regarding our equity compensation plans will beincluded in our proxy statement with respect to our Annual Meeting of Stockholders to be held on June 17, 2009under the caption “Equity Compensation Plans” and is incorporated by reference in this Annual Report onForm 10-K.
Stock Purchase Program. In August 2007, the Board of Directors approved a share purchase programauthorizing the purchase of up to $300.0 million of our common stock through August 2, 2009. We did not purchaseany of our common stock during the thirteen weeks ended February 1, 2009. As of February 1, 2009, the value thatmay yet be purchased under the program is $25.0 million.
22

Stock Performance Graph. The following performance graph and related information shall not be deemed“filed” with the Securities and Exchange Commission, nor shall such information be incorporated by reference intoany future filing under the Securities Act of 1933 or Securities Exchange Act of 1934, each as amended, except to theextent that we specifically incorporate it by reference into such filing.
The following graph shows a five-year comparison of the cumulative total stockholders’ returns for ourcommon stock, the S&P 500 Index, and the S&P Specialty Stores Index based on a $100 investment on February 1,2004 in stock or on January 31, 2004 in the index. The comparison of the total cumulative return on investmentincludes reinvestment of dividends. Indices are calculated on a month-end basis.
COMPARISON OF 5 YEAR CUMULATIVE TOTAL RETURNAmong PetSmart, Inc., The S & P 500 Index
And The S & P Specialty Stores Index
2/1/04 1/30/05 1/29/06 1/28/07 2/3/08 2/1/09
PetSmart, Inc. S & P 500 S & P Specialty Stores
$0
$20
$40
$60
$80
$100
$140
$120
$160
$180
2/1/04 1/30/05 1/29/06 1/28/07 2/3/08 2/1/09
PetSmart, Inc. . . . . . . . . . . . . . . . . . . . . . . . . . . . 100.00 128.87 107.76 130.48 103.43 81.43
S & P 500 . . . . . . . . . . . . . . . . . . . . . . . . . . . . . . 100.00 106.23 117.26 134.28 131.17 80.50
S & P Specialty Stores . . . . . . . . . . . . . . . . . . . . . 100.00 109.03 135.63 154.04 117.56 64.74
23

Item 6. Selected Financial Data
The following selected financial data is derived from our consolidated financial statements. The data belowshould be read in conjunction with Item 7. “Management’s Discussion and Analysis of Financial Condition andResults of Operations” and our consolidated financial statements and notes thereto.
February 1,2009
February 3,2008
January 28,2007
January 29,2006
January 30,2005
As of and for the Year Ended(1)
(In thousands, except per share amounts and operating data)
Statement of Operations Data:Net sales . . . . . . . . . . . . . . . . . . . . $ 5,065,293 $ 4,672,656 $ 4,233,857 $ 3,760,499 $ 3,363,452
Gross profit . . . . . . . . . . . . . . . . . . 1,495,433 1,436,821 1,307,770 1,173,001 1,038,587Operating, general and
administrative expenses . . . . . . . 1,125,579 1,085,308 985,936 861,621 781,248
Operating income . . . . . . . . . . . . . 369,854 351,513 321,834 311,380 257,339Gain on sale of equity
investment . . . . . . . . . . . . . . . . . — 95,363 — — —Interest income . . . . . . . . . . . . . . . 579 6,813 10,551 9,037 4,791Interest expense. . . . . . . . . . . . . . . (59,336) (51,496) (42,268) (31,208) (21,326)
Income before income tax expenseand equity in income frominvestee . . . . . . . . . . . . . . . . . . . 311,097 402,193 290,117 289,209 240,804
Income tax expense . . . . . . . . . . . . (121,019) (145,180) (105,048) (106,719) (83,351)Equity in income from investee . . . 2,592 1,671 — — —
Net income . . . . . . . . . . . . . . . . . . $ 192,670 $ 258,684 $ 185,069 $ 182,490 $ 157,453
Earnings Per Common Share Data:Basic . . . . . . . . . . . . . . . . . . . . . $ 1.55 $ 1.99 $ 1.36 $ 1.30 $ 1.09Diluted . . . . . . . . . . . . . . . . . . . $ 1.52 $ 1.95 $ 1.33 $ 1.25 $ 1.05
Dividends declared per commonshare . . . . . . . . . . . . . . . . . . . . . . . $ 0.12 $ 0.12 $ 0.12 $ 0.12 $ 0.12
Weighted average shares outstanding:Basic . . . . . . . . . . . . . . . . . . . . . 124,342 129,851 135,836 140,791 143,888Diluted . . . . . . . . . . . . . . . . . . . 126,751 132,954 139,537 145,577 149,652
Selected Operating Data:Stores open at end of period . . . . . 1,112 1,008 908 826 726Square footage at end of period . . . 25,102,528 22,825,783 20,787,903 19,029,359 16,967,480Net sales per square foot(2) . . . . . . $ 202 $ 210 $ 208 $ 206 $ 205Net sales growth . . . . . . . . . . . . . . 8.4% 10.4% 12.6% 11.8% 12.4%Increase in comparable store
sales(3) . . . . . . . . . . . . . . . . . . . 3.8% 2.4% 5.0% 4.2% 6.3%Selected Balance Sheet Data:
Merchandise inventories . . . . . . . . $ 584,011 $ 501,212 $ 487,400 $ 399,413 $ 337,281Working capital . . . . . . . . . . . . . . . $ 396,677 $ 214,404 $ 324,887 $ 377,766 $ 477,929Total assets . . . . . . . . . . . . . . . . . . $ 2,357,653 $ 2,167,257 $ 2,053,477 $ 1,863,691 $ 1,678,407Total debt(4) . . . . . . . . . . . . . . . . . $ 585,993 $ 563,747 $ 449,001 $ 364,123 $ 250,735Total stockholders’ equity . . . . . . . $ 1,144,136 $ 986,597 $ 1,000,894 $ 940,750 $ 973,947Current ratio . . . . . . . . . . . . . . . . . 1.83 1.31 1.63 1.82 2.36Long-term debt-to-equity . . . . . . . . 48% 52% 43% 37% 25%Total debt-to-capital . . . . . . . . . . . . 34% 36% 31% 28% 20%
(1) 2007 consisted of 53 weeks while all other periods presented consisted of 52 weeks. As a result, all comparisonsother than comparable store sales which was calculated on an equivalent 52 week basis, also reflect the impactof one additional week in 2007. The estimated impact of the additional week in 2007 resulted in the following
24

increases: net sales, $89.7 million; gross profit, $34.4 million; operating, general and administrative expenses,$18.3 million; income before income tax expense and equity in income from investee, $16.0 million; netincome, $9.8 million; and diluted earnings per common share, $0.07.
(2) Net sales per square foot were calculated by dividing net sales, excluding catalog and e-commerce sales, byaverage square footage.
(3) Retail stores only, excludes catalog and e-commerce sales in all periods. For 2007, includes sales throughweek 52.
(4) Represents borrowings under credit facility and capital lease obligations.
Item 7. Management’s Discussion and Analysis of Financial Condition and Results of Operations
Except for historical information, the following discussion contains forward-looking statements that involverisks and uncertainties. Our actual results could materially differ from those discussed here. Factors that couldcause or contribute to such differences include, but are not limited to, those discussed in this section, as well as inthe sections entitled “Competition,” “Distribution” and “Government Regulation” included in Item 1 Part I andRisk Factors included in Item 1 Part 1A of this Annual Report on Form 10-K.
Overview
Based on our 2008 net sales of $5.1 billion, we are North America’s leading specialty provider of products,services and solutions for the lifetime needs of pets. As of February 1, 2009, we operated 1,112 stores, and weanticipate opening approximately 40 net new stores in 2009. Our stores carry a broad and deep selection of high-quality pet supplies at everyday low prices. We offer more than 10,500 distinct items, including nationallyrecognized brand names, as well as an extensive selection of private label brands across a range of productcategories.
We complement our extensive product assortment with a wide selection of value-added pet services, includinggrooming, training, boarding and day camp. All our stores offer complete pet training services, and virtually all ourstores feature pet styling salons that provide high-quality grooming services. Our PetsHotels provide boarding fordogs and cats, which includes 24-hour supervision, an on-call veterinarian, temperature controlled rooms andsuites, daily specialty treats and play time, as well as day camp for dogs. As of February 1, 2009, we operated 142PetsHotels, and we anticipate opening approximately 20 PetsHotels in 2009.
We make full-service veterinary care available through our strategic relationship with certain third-partyoperators. As of February 1, 2009, full-service veterinary hospitals were in 734 of our stores. MMIH operated 722 ofthe veterinary hospitals. The remaining 12 hospitals are operated by other third parties in Canada.
Executive Summary
• Diluted earnings per common share for 2008 were $1.52 on net income of $192.7 million compared todiluted earnings per common share of $1.95 on net income of $258.7 million in 2007. The 2007 dilutedearnings per share included benefits of $0.48 per common share for the sale of a portion of our non-votingshares in MMI Holdings, Inc., and $0.07 for the 53rd week in 2007, which was partially offset by the $0.07charge for the sale of the State Line Tack business.
• Net sales increased 8.4% to $5.1 billion in 2008 compared to $4.7 billion in 2007 due to new store openingsand an increase in comparable store sales. The 53rd week in 2007 increased sales by approximately$89.7 million.
• We added 104 net new stores during 2008 and operated 1,112 stores at the end of the year.
• Comparable store sales, or sales in stores open at least one year, increased 3.8% during 2008 compared to a2.4% increase during 2007.
• Services sales increased 15.8% to $526.7 million, or 10.4% of net sales, for 2008 compared to$454.9 million, or 9.7% of net sales, during 2007. The 53rd week in 2007 increased services sales by$8.4 million.
25

• We purchased 2.3 million and 9.8 million shares of our common stock for $50.0 million and $315.0 millionduring 2008 and 2007, respectively.
Critical Accounting Policies and Estimates
The discussion and analysis of our financial condition and results of operations are based on our consolidatedfinancial statements, which have been prepared in accordance with GAAP. The preparation of these consolidatedfinancial statements requires us to make estimates and judgments that affect the reported amounts of assets,liabilities, revenues and expenses. On an on-going basis, we evaluate our estimates for inventory valuation reserves,insurance liabilities and reserves, asset impairments, reserve for closed stores, reserves against deferred tax assetsand uncertain tax positions. We base our estimates on historical experience and on various other assumptions webelieve to be reasonable under the circumstances, the results of which form the basis for making judgments aboutthe carrying values of assets and liabilities that are not readily apparent from other sources. Under differentassumptions or conditions, actual results may differ from these estimates. We believe the following criticalaccounting policies reflect the more significant judgments and estimates we use in preparing our consolidatedfinancial statements.
Inventory Valuation Reserves
We have established reserves for estimated inventory shrinkage between physical inventories. Distributioncenters perform cycle counts encompassing all inventory items at least once every quarter. Stores perform physicalinventories at least once a year, and between the physical inventories, stores perform counts on certain inventoryitems. Most of the stores do not perform physical inventories during the last quarter of the year due to the holidayseason, but continue to perform counts on certain inventory items. As of the end of a reporting period, there will bestores with certain inventory items that have not been counted. For each reporting period presented, we estimate theinventory shrinkage based on a two-year historical trend analysis. Changes in shrink results or market conditionscould cause actual results to vary from estimates used to establish the inventory reserves.
We also have reserves for estimated obsolescence and to reduce merchandise inventory to the lower of cost ormarket. We evaluate inventories for excess, obsolescence or other factors that may render inventories unmarketableat their historical cost. Factors included in determining obsolescence reserves include current and anticipateddemand, customer preferences, age of merchandise, seasonal trends and decisions to discontinue certain products. Ifassumptions about future demand change or actual market conditions are less favorable than those projected bymanagement, we may require additional reserves.
As of February 1, 2009, and February 3, 2008, we had inventory valuation reserves of $14.6 million and$13.3 million, respectively.
Asset Impairments
We review long-lived assets for impairment in accordance with Financial Accounting Standards Board, or“FASB,” Statement of Financial Accounting Standards, or “SFAS,” No. 144, “Accounting for the Impairment orDisposal of Long-Lived Assets.” We conduct this review quarterly and whenever events or changes in circumstancesindicate that the book value of such assets may not be recoverable. There were no material asset impairmentsidentified during 2008.
Reserve for Closed Stores
We continuously evaluate the performance of our stores and periodically close those that are under-perform-ing. Closed stores are generally replaced by a new store in a nearby location. We establish reserves for futureoccupancy payments on closed stores in the period the store is closed, in accordance with SFAS No. 146,“Accounting for Costs Associated with Exit or Disposal Activities.” These costs are classified in operating, generaland administrative expenses in the Consolidated Statements of Operations and Comprehensive Income. As ofFebruary 1, 2009, and February 3, 2008, our reserve for closed stores was $6.4 million and $6.2 million,respectively. We can make no assurances that additional charges for these stores will not be required based onthe changing real estate environment.
26

Insurance Liabilities and Reserves
We maintain standard property and casualty insurance on all our properties and leasehold interests, productliability insurance that covers products and the sale of pets, self-insured health plans, employer’s professionalliability, and workers’ compensation insurance. Property insurance covers approximately $2.1 billion in buildingsand contents, including furniture and fixtures, leasehold improvements, and inventory. Under our casualty andworkers’ compensation insurance policies as of February 1, 2009, we retained an initial risk of loss of $0.5 millionper occurrence for general liability and $1.0 million per occurrence for workers’ compensation. We establishreserves for losses based on periodic actuarial estimates of the amount of loss inherent in that period’s claims,including losses for which claims have been incurred but not reported. Loss estimates rely on actuarial observationsof ultimate loss experience for similar historical events and changes in such assumptions could result in anadjustment to the reserves. As of February 1, 2009, and February 3, 2008, we had approximately $92.5 million and$86.7 million, respectively, in reserves related to casualty, self-insured health plans, employer’s professionalliability, and workers’ compensation insurance policies.
Income Taxes
We establish deferred income tax assets and liabilities for temporary differences between the financialreporting bases and the income tax bases of our assets and liabilities at enacted tax rates expected to be in effectwhen such assets or liabilities are realized or settled. We record a valuation allowance on the deferred income taxassets to reduce the total to an amount we believe is more likely than not to be realized. Valuation allowances atFebruary 1, 2009, and February 3, 2008, were principally to offset certain deferred income tax assets for netoperating and capital loss carryforwards.
As of January 29, 2007, we adopted FASB Interpretation, or “FIN,” No. 48, “Accounting for Uncertainty inIncome Taxes — an Interpretation of FASB Statement No. 109,” which addresses the determination of whether taxbenefits claimed or expected to be claimed on a tax return should be recorded in the financial statements. UnderFIN No. 48, the tax benefit from an uncertain tax position may be recognized only if it is more likely than not thatthe tax position will be sustained on examination by the taxing authorities. The determination is based on thetechnical merits of the position and presumes that each uncertain tax position will be examined by the relevanttaxing authority that has full knowledge of all relevant information. Although we believe the estimates arereasonable, no assurance can be given that the final outcome of these matters will not be different than what isreflected in the historical income tax provisions and accruals.
We operate in multiple tax jurisdictions and could be subject to audit in any of these jurisdictions. These auditscan involve complex issues that may require an extended period of time to resolve and may cover multiple years.
27

Results of Operations
The following table presents the percent to net sales of certain items included in our Consolidated Statementsof Operations and Comprehensive Income:
February 1,2009
February 3,2008
January 28,2007
Year Ended
(52 weeks) (53 weeks) (52 weeks)
Statement of Operations Data:Net sales . . . . . . . . . . . . . . . . . . . . . . . . . . . . . . . . . . . . . . . 100.0% 100.0% 100.0%
Cost of sales . . . . . . . . . . . . . . . . . . . . . . . . . . . . . . . . . . . . 70.5 69.3 69.1
Gross profit . . . . . . . . . . . . . . . . . . . . . . . . . . . . . . . . . . . . . 29.5 30.7 30.9
Operating, general and administrative expenses . . . . . . . . . . . 22.2 23.2 23.3
Operating income . . . . . . . . . . . . . . . . . . . . . . . . . . . . . . . . . 7.3 7.5 7.6
Gain on sale of investment . . . . . . . . . . . . . . . . . . . . . . . . . . — 2.0 —
Interest income. . . . . . . . . . . . . . . . . . . . . . . . . . . . . . . . . . . 0.0 0.1 0.2Interest expense . . . . . . . . . . . . . . . . . . . . . . . . . . . . . . . . . . (1.2) (1.1) (1.0)
Income before income tax expense and equity in incomefrom investee . . . . . . . . . . . . . . . . . . . . . . . . . . . . . . . . . . 6.1 8.6 6.9
Income tax expense . . . . . . . . . . . . . . . . . . . . . . . . . . . . . . . (2.4) (3.1) (2.5)
Equity in income from investee. . . . . . . . . . . . . . . . . . . . . . . 0.1 0.0 —
Net income . . . . . . . . . . . . . . . . . . . . . . . . . . . . . . . . . . . . . 3.8% 5.5% 4.4%
2008 (52 weeks) compared to 2007 (53 weeks)
Net Sales
Net sales increased $392.6 million, or 8.4%, to $5.1 billion in 2008, compared to net sales of $4.7 billion in2007. The sales increase is primarily due to the addition of 104 net new stores since February 3, 2008, partiallyoffset by the 53rd week of sales in 2007 and a 3.8% increase in comparable store sales for 2008. The 53rd week in2007 increased net sales by approximately $89.7 million. Our comparable store sales growth was 2.4% for 2007.The increase in our comparable sales growth rate was due to inflation and pricing strategies, partially offset byeconomic conditions and a slow down in consumer spending, primarily in our hardgoods category.
Services sales, which are included in our net sales amount discussed above and include grooming, training,boarding and day camp, increased by 15.8%, or $71.8 million, to $526.7 million in 2008 compared to $454.9 millionin 2007. The increase during 2008 was primarily due to continued strong demand for our grooming services, theaddition of 104 net new stores, and 45 new PetsHotels, partially offset by the 53rd week in 2007, which increasedservices sales by $8.4 million.
Gross Profit
Gross profit decreased to 29.5% of net sales for 2008 from 30.7% for 2007.
In 2008, store occupancy costs increased as a percentage of net sales, as we opened 104 net new stores and 45PetsHotels. The increase in store occupancy costs as a percentage of net sales is due to the addition of new stores inmore expensive regions, as well as higher real property taxes and lower reimbursements from MMIH for vet clinicexpenses.
Warehouse and distribution costs were flat as a percentage of net sales. We realized cost savings fromincreased productivity and efficiency across the distribution network due to our new replacement distributioncenters in Newnan, Georgia and Reno, Nevada, offset by pressure from higher fuel prices during 2008 compared to2007.
28

Services sales were essentially flat as a percentage of net sales. We also opened 45 PetsHotels in 2008compared to 35 in 2007. PetsHotels have higher costs as a percentage of net sales in the first several years.
Merchandise margin decreased due to an increase of consumables merchandise sales relative to total net sales.Consumables merchandise sales typically generate a lower gross margin compared to hardgoods merchandise.Macroeconomic conditions, including a decrease in consumer spending, challenged our merchandise margins. As aresult, we have experienced softness in our higher margin hardgoods merchandise sales.
Operating, General and Administrative Expenses
Operating, general and administrative expenses decreased as a percentage of net sales to 22.2% for 2008 from23.2% for 2007.
The decrease in operating, general and administrative expenses as a percentage of net sales was attributable tovarious cost savings initiatives, including a new store labor management process, combined with reducedprofessional fees, renegotiated maintenance and supply contracts, and lower insurance-related costs. These expensedecreases were partially offset by higher payroll and benefit costs for additional headcount at our corporateheadquarters, and higher stock-based compensation expense.
Interest Income
Interest income decreased to $0.6 million for 2008 compared to $6.8 million for 2007, as our investments werelimited to short-term, highly liquid, money market funds. Cash available for short-term investments was lowerduring 2008 compared to 2007 primarily due to cash used to partially fund our accelerated share repurchase, or“ASR,” agreement, in August 2007, payments on the revolving line of credit, and the purchase of 2.3 million sharesof our common stock for $50.0 million during 2008.
Interest Expense
Interest expense, which is primarily related to capital leases, increased to $59.3 million for 2008 compared to$51.5 million for 2007. The increase is primarily attributable to continued increases in capital lease obligations.
Income Tax Expense
In 2008, the $121.0 million income tax expense represents an effective tax rate of 38.9%, compared with 2007income tax expense of $145.2 million, which represented an effective tax rate of 36.1%. The effective tax rate for2007 includes a benefit from the use of capital loss carryforwards to reduce the tax on the gain from the sale ofMMIH non-voting shares and benefits from the release of uncertain tax positions as a result of settlements withtaxing authorities and from the expiration of the statute of limitations for certain tax positions. The effective tax rateis calculated by dividing our income tax expense, which includes the income tax expense related to our equity inincome from investee, by income before income tax expense and equity in income from investee.
Equity in Income from Investee
Our equity in income from our investment in MMIH was $2.6 million and $1.7 million for 2008 and 2007,respectively.
2007 (53 weeks) compared to 2006 (52 weeks)
Net Sales
Net sales increased $438.8 million, or 10.4%, to $4.7 billion in 2007, compared to net sales of $4.2 billion in2006. The sales increase is primarily due to the addition of 100 net new stores since January 28, 2007, the 53rd weekof sales and a 2.4% increase in comparable store sales for 2007. The 53rd week increased net sales by approximately$89.7 million. Our comparable store sales growth was 5.0% for 2006. The decrease in our comparable sales growth
29

rate was due to economic conditions, a slow down in consumer spending and the impact of the recall of certain petfood products during the twenty-six weeks ended July 29, 2007, as well as reduced sales of equine products as aresult of our decision to exit that product line.
Services sales, which are included in our net sales amount discussed above and include grooming, training,boarding and day camp, increased by 22.0%, or $82.8 million, to $458.7 million. This increase was primarily due tocontinued strong demand for our grooming and training services, the addition of 35 new PetsHotels during 2007 andthe 53rd week, which increased services sales by $8.4 million.
Gross Profit
Gross profit decreased to 30.7% of net sales for 2007 from 30.9% for 2006.
Fixed costs in cost of sales, including store occupancy costs and warehouse and distribution costs, increased asa percentage of net sales. In 2007, we opened 100 net new stores, 35 PetsHotels and a new distribution center andcompleted a portion of the store remodel projects. These investments increased the amount of rent and otheroccupancy costs and increased depreciation expense. These additional expenses coupled with a slower growth ratein net sales decreased our gross profit as a percentage of net sales.
Additionally, services sales increased as a percentage of net sales. Services sales generate lower gross marginsthan merchandise sales as we include service-related labor in cost of sales; however, services generate higheroperating margins than merchandise sales. We also opened 35 PetsHotels in 2007 compared to 30 in 2006.PetsHotels have higher costs as a percentage of net sales in the first several years.
These decreases in the gross profit percentages were partially offset by improvements in merchandise margins.Merchandise margins continued to benefit from pricing initiatives, partially offset by a change in product mix.Hardgoods sales, which generally have higher gross margins than consumable merchandise, grew at a slower ratethan consumable sales.
In 2007, we entered into a new master operating agreement with MMIH that has an initial 15-year term and hasresulted in higher license fees. We charge MMIH license fees for the space used by the veterinary hospitals and fortheir portion of utilities costs. We treat these amounts as a reduction of the retail stores’ occupancy costs, which areincluded as a component of cost of sales in the Consolidated Statement of Operations and Comprehensive Income.We also charge MMIH for its portion of specific operating expenses and treat the reimbursement as a reduction ofthe stores’ operating expense.
Operating, General and Administrative Expenses
Operating, general and administrative expenses decreased as a percentage of net sales to 23.2% for 2007 from23.3% for 2006.
During 2007, we experienced lower expense for general liability and health insurance compared to 2006 due tolower average claims during the year. The improvements in claim activity resulted in a smaller increase in theactuarial assessments of our required reserves than in the prior year. In addition, bonus expense decreased in 2007.
We also recognized $6.0 million of gift card breakage income in 2007. Gift card breakage income isrecognized based upon historical redemption patterns and represents the balance of gift cards for which we believethe likelihood of redemption by the customer is remote. During 2007, we obtained sufficient historical redemptiondata for our gift card program to make a reasonable estimate of the ultimate redemption patterns and breakage rate.2007 was the first year in which we recognized gift card breakage income.
In addition, expenses decreased in our e-commerce business due to the exit of our equine product line. Thisbusiness, which has higher operating expenses as a percentage of net sales, decreased as a percentage of total sales.
These expense decreases were offset by expenses incurred to exit our equine product line and by highercorporate payroll and other expenses. The expenses to exit the equine product line included accelerated depre-ciations of assets, severance and costs to remerchandise the equine sections of our stores. Corporate payroll andother expenses continues to increase as our revenue growth slowed.
30
Gain on Sale of Equity Investment and Equity in Income from Investee
During the thirteen weeks ended April 29, 2007, we sold a portion of our non-voting shares in MMIH resultingin a pre-tax gain of $95.4 million. In connection with this transaction, we also converted our remaining MMIH non-voting shares to voting shares. The increase in voting shares caused us to exceed the significant influence thresholdas defined by GAAP, which required us to account for our investment in MMIH using the equity method ofaccounting instead of the previously applied cost method in accordance with APB No. 18.
Conversion to the equity method of accounting would typically require a restatement of prior years’consolidated financial statements for the MMIH earnings. However, since the amounts are not material, we havenot restated prior year financial statements.
Interest Income
Interest income decreased to $6.8 million for 2007 compared to $10.6 million for 2006, primarily due to loweraverage investments in auction rate securities during the year, partially due to our use of available cash to fund aportion of the ASR. As of February 3, 2008, we had no investments in auction rate securities.
Interest Expense
Interest expense, which is primarily related to capital leases, increased to $51.5 million for 2007 compared to$42.3 million for 2006. The increase is primarily attributable to continued increases in capital lease obligations andnew bank borrowings during 2007 to fund a portion of the ASR.
Income Tax Expense
In 2007, the $145.2 million income tax expense represents an effective tax rate of 36.1%, compared with 2006income tax expense of $105.0 million, which represents an effective tax rate of 36.2%. The effective tax rate iscalculated by dividing our income tax expense, which includes the income tax expense related to our equity inincome from investee, by income before income tax expense and equity in income from investee.
The effective tax rate for 2007 includes a benefit from the use of capital loss carryforwards to reduce the tax onthe gain from the sale of MMIH non-voting shares and benefits from the release of uncertain tax positions as a resultof settlements with taxing authorities and from the expiration of the statute of limitations for certain tax positions.The effective tax rate for 2006 includes the settlement of an audit with the Internal Revenue Service and tax benefitsprimarily due to the expiration of the statute of limitations for certain tax positions and additional federal and statetax credits.
Liquidity and Capital Resources
Cash Flow
Global capital and credit markets have recently experienced increased volatility and disruption. Despite thisvolatility and disruption, we have continued to have full access to our credit facility and to generate operating cashflow sufficient to meet our financing needs. We believe that our operating cash flow and cash on hand will beadequate to meet our operating, investing and financing needs in the foreseeable future. In addition, we also haveaccess to our $350.0 million five-year revolving credit facility, although there can be no assurance that continued orincreased volatility and disruption in the global capital and credit markets will not impair our ability to access thesemarkets on commercially acceptable terms.
We finance our operations, new store and PetsHotel growth, store remodels and other expenditures to supportour growth initiatives primarily through cash generated by operating activities. Net cash provided by operatingactivities was $420.7 million for 2008, $332.7 million for 2007 and $289.3 million for 2006. Included in net cashprovided by operating activities for 2008 were $27.1 million of tax benefits from the Economic Stimulus Act of2008, which provided for an accelerated depreciation deduction for certain qualifying property. Receipts from oursales come from cash, checks and third-party debit and credit cards, and therefore provide a significant source of
31

liquidity. Cash is used in operating activities primarily to fund procurement of merchandise inventories and otherassets, net of accounts payable and other accrued liabilities.
Net cash used in investing activities was $235.2 million for 2008, $139.2 million for 2007 and $103.9 millionfor 2006. The net cash used in 2008 consisted primarily of capital expenditures. Capital expenditures consistedprimarily of expenditures associated with opening or acquiring new stores, reformatting existing stores, expen-ditures associated with equipment and computer software in support of our system initiatives, PetsHotel con-struction costs, costs to expand our distribution network and other expenditures to support our growth plans andinitiatives. The primary differences between 2008 and 2007 were cash received from the sale of MMIH stock during2007, cash used to purchase the Canadian store locations during 2007, no purchases of short-term investmentsduring 2008, and less cash used to purchase property and equipment during 2008.
Net cash used in financing activities was $113.8 million for 2008, $293.7 million for 2007 and $145.0 millionfor 2006. The net cash used in 2008 consisted primarily of the purchase of treasury stock, payments on capital leaseobligations, a decrease in our bank overdraft, payments of cash dividends and net payments from common stockissued under equity incentive plans. These activities were partially offset by a net increase in our credit facilityborrowings and proceeds from tax deductions in excess of the compensation cost recognized. The primarydifferences between 2008 and 2007 were lower purchases of treasury stock in 2008, lower proceeds from commonstock issued under stock incentive plans, a smaller decrease in bank overdrafts, and lower tax deductions in excessof the compensation cost recognized.
Common Stock Purchase Program
In June 2005, the Board of Directors approved a program authorizing the purchase of up to $270.0 million ofour common stock through 2006. During 2006, we purchased approximately 6.3 million shares of our commonstock for approximately $161.9 million. In August 2006, the Board of Directors increased the amount remainingunder that share purchase program by $141.7 million, to bring the share purchase capacity under the program to$250.0 million and extended the term of the program to August 9, 2007. From January 29, 2007 through June 4,2007, we purchased 2.8 million shares of our common stock for $89.9 million under the $250.0 million program,completing the program.
In August 2007, the Board of Directors approved a new program authorizing the purchase of up to$300.0 million of our common stock through August 2, 2009. On August 19, 2007, we entered into a $225.0 millionASR agreement. The ASR contained provisions that established the minimum and maximum number of sharespurchased during its term. Pursuant to the terms of the ASR, on August 20, 2007, we paid $225.0 million to the ASRcounterparty. The ASR was initially funded with $125.0 million in cash and $100.0 million in borrowings under ournew credit facility. We received 7.0 million shares of common stock between August 20, 2007 and January 31, 2008which were recorded as treasury stock in the Consolidated Balance Sheets, completing the ASR.
During 2008, we purchased 2.3 million shares of our common stock for $50.0 million. As of February 1, 2009,$25.0 million remained available under the $300.0 million program.
Common Stock Dividends
We presently believe our ability to generate cash allows us to invest in the growth of the business and, at thesame time, distribute a quarterly dividend. Our credit facility and letter of credit facility permit us to pay dividends,so long as we are not in default and the payment of dividends would not result in default. During each of 2008, 2007,and 2006, we paid aggregate dividends of $0.12 per share.
Operating Capital and Capital Expenditure Requirements
Substantially all our stores are leased facilities. We opened 112 new stores and closed 8 stores in 2008.Generally, each new store requires capital expenditures of approximately $0.7 million for fixtures, equipment andleasehold improvements, approximately $0.3 million for inventory and approximately $0.1 million for preopeningcosts. We expect total capital spending to be approximately $115.0 to $125.0 million for 2009, based on our plan toopen approximately 40 net new stores and 20 new PetsHotels, continuing our investment in the development of our
32
information systems, adding to our services capacity with the expansion of certain grooming salons, remodeling orreplacing certain store assets and continuing our store refresh program.
Our ability to fund our operations and make planned capital expenditures depends on our future operatingperformance and cash flow, which are subject to prevailing economic conditions and to financial, business and otherfactors, some of which are beyond our control.
The following table presents our capital expenditures for each of the past three years (in thousands):
February 1,2009
February 3,2008
January 28,2007
Year Ended
(52 weeks) (53 weeks) (52 weeks)
Capital Expenditures:New stores . . . . . . . . . . . . . . . . . . . . . . . . . . . . . . . . . . . . . . $ 83,124 $114,398 $ 78,389
Store-related projects(1) . . . . . . . . . . . . . . . . . . . . . . . . . . . . 51,908 68,612 51,482
PetsHotel(2) . . . . . . . . . . . . . . . . . . . . . . . . . . . . . . . . . . . . . 43,098 44,039 29,999
Information technology . . . . . . . . . . . . . . . . . . . . . . . . . . . . . 27,464 34,187 61,522Supply chain . . . . . . . . . . . . . . . . . . . . . . . . . . . . . . . . . . . . 20,480 30,316 18,420
Other(3) . . . . . . . . . . . . . . . . . . . . . . . . . . . . . . . . . . . . . . . . 12,114 2,885 1,294
Total capital expenditures . . . . . . . . . . . . . . . . . . . . . . . . . $238,188 $294,437 $241,106
(1) Includes store remodels, grooming salon expansion, equipment replacement, relocations, and various mer-chandising projects.
(2) For new and existing stores.
(3) Includes corporate office related expenses, including costs related to the expansion and renovation of ourcorporate offices during 2008.
Lease and Other Commitments
Operating and Capital Lease Commitments and Other Obligations
The following table summarizes our contractual obligations, net of estimated sublease income, and includesobligations for executed agreements for which we do not yet have the right to control the use of the property atFebruary 1, 2009, and the effect that such obligations are expected to have on our liquidity and cash flows in futureperiods (in thousands):
Contractual Obligation 20092010 &
20112012 &
20132014 andBeyond Other Total
Operating lease obligations . . . . $257,829 $549,452 $526,092 $ 970,522 $ — $2,303,895
Capital lease obligations(1) . . . . 88,990 195,234 198,034 481,065 — 963,323
Purchase obligations(2) . . . . . . . 20,448 — — — — 20,448
Uncertain tax positions(3) . . . . . — — — — 8,127 8,127
Insurance obligations(4) . . . . . . . 21,369 — — — 63,199 84,568
Total . . . . . . . . . . . . . . . . . . . . . $388,636 $744,686 $724,126 $1,451,587 $71,326 $3,380,361
Less: Sublease income . . . . . . . . 3,488 6,610 4,730 4,688 — 19,516
Net Total . . . . . . . . . . . . . . . . . . $385,148 $738,076 $719,396 $1,446,899 $71,326 $3,360,845
(1) Includes $377.3 million in interest.
(2) Represents purchase obligations for advertising commitments.
(3) Approximately $8.1 million of unrecognized tax benefits, as shown in “Other,” have been recorded as liabilitiesin accordance with FIN No. 48, and we are uncertain as to if or when such amounts may be settled.
33

(4) Approximately $63.2 million of insurance obligations, as shown in “Other” have been classified as noncurrentliabilities. We are unable to estimate the specific year to which the obligations will relate beyond 2009.
Letters of Credit
We issue letters of credit for guarantees provided for insurance programs, capital lease agreements andutilities. As of February 1, 2009, $91.3 million was outstanding under our letters of credit.
Related Party Transactions
We have an investment in MMIH which, through a wholly-owned subsidiary, Medical Management Inter-national, Inc., operates full-service veterinary hospitals inside 722 of our stores. Our investment consists of commonand convertible preferred stock.
During the thirteen weeks ended April 29, 2007, we sold a portion of our non-voting shares in MMIH resultingin a pre-tax gain of $95.4 million. In connection with this transaction, we also converted our remaining MMIH non-voting shares to voting shares. The increase in voting shares caused us to exceed the significant influence thresholdas defined by GAAP, which required us to account for our investment in MMIH using the equity method ofaccounting instead of the previously applied cost method in accordance with APB No. 18. As of February 1, 2009,we owned approximately 21.5% of the voting stock and approximately 21.0% of the combined voting and non-voting stock of MMIH.
Conversion to the equity method of accounting would typically require a restatement of prior years’consolidated financial statements for MMIH earnings. However, because the amounts are not material, we havenot restated prior year financial statements. Our equity income from our investment in MMIH, which is recordedone month in arrears, was $2.6 million for 2008.
We charge MMIH license fees for the space used by the veterinary hospitals and for their portion of utilitiescosts. We treat these amounts as a reduction of the retail stores’ occupancy costs, which are included as a componentof cost of sales in the Consolidated Statements of Operations and Comprehensive Income. We also charge MMIHfor its portion of specific operating expenses, and treat the reimbursement as a reduction of the stores’ operatingexpense.
In June 2007, we entered into a new master operating agreement with MMIH that has an initial 15-year termand was retroactive to February 2007. The new agreement includes a change to the calculation of license feescharged to MMIH and a provision for MMIH to pay their portion of utilities costs.
We recognized license fees, utilities and other cost reimbursements of $30.1 million and $32.9 million during2008 and 2007, respectively. Receivables from MMIH totaled $3.3 million and $4.5 million at February 1, 2009,and February 3, 2008, respectively, and were included in the receivables in the accompanying Consolidated BalanceSheets.
The master operating agreement also includes a provision for the sharing of profits on the sales of therapeuticpet foods sold in all stores with a hospital operated by MMIH.
Credit Facility
In August 2007, we replaced our existing $125.0 million credit facility with a $350.0 million five-yearrevolving credit facility which expires on August 15, 2012. Borrowings under the credit facility are subject to aborrowing base and bear interest, at our option, at a bank’s prime rate plus 0% to 0.25% or LIBOR plus 0.875% to1.25%. We are subject to fees payable to lenders each quarter at an annual rate of 0.20% of the unused amount of thecredit facility. The credit facility also gives us the ability to issue letters of credit, which reduce the amount availableunder the credit facility. Letter of credit issuances under the credit facility are subject to interest payable to thelenders and bear interest of 0.875% to 1.25% for standby letters of credit or 0.438% to 0.625% for commercialletters of credit. As of February 1, 2009, we had no borrowings and $91.3 million in stand-by letter of creditissuances under our $350.0 million five-year revolving credit facility.
34

We also have a $70.0 million stand-alone letter of credit facility that expires on June 30, 2009. We are subjectto fees payable to the lenders each quarter at an annual rate of 0.20% of the average daily face amount of the lettersof credit outstanding during the preceding calendar quarter. In addition, we are required to maintain a deposit withthe lenders equal to the amount of outstanding letters of credit or we may use other approved investments ascollateral. If we use other approved investments as collateral, we must have an amount on deposit which, whenmultiplied by the advance rate of 85%, is equal to the amount of the outstanding letters of credit under this stand-alone letter of credit facility. As of February 1, 2009, we had no outstanding letters of credit under this stand-aloneletter of credit facility, no restricted cash and short-term investments on deposit with the lenders, and no otherapproved investments related to this facility.
We issue letters of credit for guarantees provided for insurance programs, capital lease agreements andutilities.
The credit facility and letter of credit facility permit the payment of dividends, so long as we are not in defaultand the payment of dividends would not result in default of the credit facility and stand-alone letter of credit facility.As of February 1, 2009, we were in compliance with the terms and covenants of our credit facility and letter of creditfacility. The credit facility and letter of credit facility are secured by substantially all our personal property assets,our wholly owned subsidiaries and certain real property.
Seasonality and Inflation
Our business is subject to seasonal fluctuations. We typically realize a higher portion of our net sales andoperating profits during the fourth quarter. As a result of this seasonality, we believe that quarter-to-quartercomparisons of our operating results are not necessarily meaningful, and that these comparisons cannot be reliedupon as indicators of future performance. Controllable expenses could fluctuate from quarter-to-quarter in a year.Since our stores typically draw customers from a large trade area, sales also may be impacted by adverse weather ortravel conditions, which are more prevalent during certain seasons of the year. As a result of our expansion plans, thetiming of new store and PetsHotel openings and related preopening costs, the amount of revenue contributed by newand existing stores and PetsHotels and the timing and estimated obligations of store closures, our quarterly results ofoperations may fluctuate. Finally, because new stores tend to experience higher payroll, advertising and other storelevel expenses as a percentage of sales than mature stores, new store openings will also contribute to lower storeoperating margins until these stores become established. We expense preopening costs associated with each newlocation as the costs are incurred.
While we have experienced inflationary pressure in 2008, we have been able to largely mitigate the effect byincreasing retail prices accordingly. Although neither inflation nor deflation has had a material impact on netoperating results, we can make no assurance that our business will not be affected by inflation or deflation in thefuture.
Recent Accounting Pronouncements
In December 2007, the FASB issued SFAS No. 141 (revised 2007), “Business Combinations.”SFAS No. 141(R) establishes principles and requirements for how the acquirer in a business combinationrecognizes and measures in its financial statements the identifiable assets acquired, the liabilities assumed andany noncontrolling interest in the acquiree at the acquisition date fair value. SFAS No. 141(R) determines whatinformation to disclose to enable users of the financial statements to evaluate the nature and financial effects of thebusiness combination. SFAS No. 141(R) applies prospectively to business combinations for which the acquisitiondate is on or after the beginning of the first annual reporting period beginning on or after December 15, 2008.
In December 2007, the FASB issued SFAS No. 160, “Noncontrolling Interests in Consolidated FinancialStatements, an Amendment of ARB No. 51.” SFAS No. 160 amends Accounting Research Bulletin, or “ARB,”No. 51 to establish accounting and reporting standards for the noncontrolling interest in a subsidiary and for thedeconsolidation of a subsidiary. The provisions of SFAS No. 160 must be applied retrospectively upon adoption.SFAS No. 160 is effective for fiscal years beginning after December 15, 2008. Early adoption of SFAS No. 160 isnot permitted. We do not believe the impact of adopting SFAS No. 160 will be material to our consolidated financialstatements.
35

In June 2008, the FASB issued FASB Staff Position, or “FSP,” No. EITF 03-6-1, “Determining WhetherInstruments Granted in Share-Based Payment Transactions Are Participating Securities.” FSP No. EITF 03-6-1clarifies that unvested share-based payment awards that contain nonforfeitable rights to dividends or dividendequivalents, whether paid or unpaid, are participating securities and requires such awards be included in thecomputation of earnings per share pursuant to the two-class method. FSP No. EITF 03-6-1 is effective for financialstatements issued for fiscal years beginning after December 15, 2008, and interim periods within those years. FSPNo. EITF 03-6-1 requires all prior-period earnings per share data presented to be adjusted retrospectively and earlyapplication is not permitted. We believe the adoption of FSP No. EITF 03-6-1 will not have a material impact on ourconsolidated financial statements or disclosures.
Item 7A. Quantitative and Qualitative Disclosures About Market Risk
We are subject to certain market risks arising from transactions in the normal course of our business. Such riskis principally associated with interest rate and foreign exchange fluctuations, as well as changes in our creditstanding. In addition, a market risk is associated with fuel prices. Recent developments in the global capital andcredit markets, however, have rendered risks less predictable.
Energy Costs
Increased fuel prices have negatively impacted our results of operations during the first half of 2008. Offsettingthe increase in fuel prices was a decrease in average miles driven per store as a result of our new distributions centerin Newnan, Georgia and Reno, Nevada and better truck space utilization. Our results will be negatively impacted ifenergy prices increase in the future.
Foreign Currency Risk
Our Canadian subsidiary operates 61 stores and uses the Canadian dollar as the functional currency and theUnited States dollar as the reporting currency. We have certain exposures to foreign currency risk. Net sales inCanada, denominated in United States dollars, were $217.6 million, or 4.3%, of our consolidated net sales for 2008.Transaction gains and losses denominated in the United States dollar are recorded in cost of sales or operating,general and administrative expenses in the Consolidated Statements of Operations and Comprehensive Incomedepending on the nature of the underlying transaction.
Net exchange gains and losses were not material in 2008, 2007 and 2006.
Interest Rate Risk
We have the ability to use a revolving line of credit and short-term bank borrowings to support seasonalworking capital needs and to finance capital requirements of the business. Borrowings under the credit facility bearinterest at a bank’s prime rate plus 0% to 0.25% or LIBOR plus 0.875% to 1.25%. Therefore, we have exposure tochanges in interest rates. During 2008, we borrowed $576.0 million as needed to support seasonal working capitalneeds. As of February 1, 2009, there were no borrowings under the revolving line of credit. We had $100.0 millionof borrowings under the line of credit during 2007 to partially fund our ASR, in addition to occasional borrowings asneeded to support seasonal working capital needs.
Item 8. Financial Statements and Supplementary Data
The information required by this Item is attached as Appendix F.
Item 9. Changes in and Disagreements with Accountants on Accounting and Financial Disclosure
None.
Item 9A. Controls and Procedures
We maintain disclosure controls and procedures that are designed to provide reasonable assurance thatinformation required to be disclosed in our reports under the Securities Exchange Act of 1934, as amended, or the
36

Exchange Act, is recorded, processed, summarized and reported within the time periods specified in the SEC’s rulesand forms, and that such information is accumulated and communicated to our management, including our ChiefExecutive Officer, or CEO, and Chief Financial Officer, or CFO, as appropriate, to allow timely decisions regardingrequired disclosure.
As required by Rule 13a-15(b) under the Exchange Act, our management conducted an evaluation (under thesupervision and with the participation of our CEO and our CFO) as of the end of the period covered by this report, ofthe effectiveness of our disclosure controls and procedures as defined in Rule 13a-15(e) under the Exchange Act. Inperforming this evaluation, our CEO and CFO concluded that, as of February 1, 2009, our disclosure controls andprocedures were (1) designed to ensure that material information relating to us, including our consolidatedsubsidiaries, is made known to our CEO and CFO by others within the entities, particularly during the period inwhich this report was being prepared and (2) effective, in that they provide reasonable assurance that informationrequired to be discussed by us in the reports that we file or submit under the Exchange Act is recorded, processed,summarized and reported within the time periods specified in the SEC’s rules and forms.
Management’s Report on Internal Control Over Financial Reporting
We are responsible for the preparation and integrity of the consolidated financial statements appearing in ourAnnual Report on Form 10-K. The consolidated financial statements were prepared in conformity with accountingprinciples generally accepted in the United States of America appropriate in the circumstances and, accordingly,include certain amounts based on our best judgments and estimates. Financial information in this Annual Report onForm 10-K is consistent with that in the consolidated financial statements.
We are responsible for establishing and maintaining adequate internal control over financial reporting as suchterm is defined in Rules 13a-15(f) under the Exchange Act. Our internal controls over financial reporting aredesigned to provide reasonable assurance regarding the reliability of financial reporting and the preparation of theconsolidated financial statements. Our internal control over financial reporting is supported by a program of internalaudits and appropriate reviews by management, written policies and guidelines, careful selection and training ofqualified personnel and a written Code of Business Conduct adopted by our Board of Directors, applicable to all ourDirectors, officers, employees and subsidiaries. Because of its inherent limitations, internal control over financialreporting may not prevent or detect misstatements and even when determined to be effective, can only providereasonable assurance with respect to financial statement preparation and presentation. Also, projections of anyevaluation of effectiveness to future periods are subject to the risk that controls may become inadequate because ofchanges in conditions, or that the degree of compliance with the policies or procedures may deteriorate.
We assessed the effectiveness of our internal control over financial reporting as of February 1, 2009. In makingthis assessment, we used the criteria set forth by the Committee of Sponsoring Organizations of the TreadwayCommission (COSO) in Internal Control — Integrated Framework. Based on our assessment, we believe that wemaintained effective internal control over financial reporting as of February 1, 2009.
The effectiveness of our internal control over financial reporting as of February 1, 2009, has been audited byDeloitte & Touche, LLP, an independent registered accounting firm, as stated in their attestation report, which isincluded herein.
Changes in Internal Control Over Financial Reporting
There was no change in our internal control over financial reporting, as defined in Rule 13a-15(f) of theExchange Act during the thirteen weeks ended February 1, 2009, that has materially affected, or is reasonably likelyto materially affect, our internal control over financial reporting.
37
REPORT OF INDEPENDENT REGISTERED PUBLIC ACCOUNTING FIRM
To the Board of Directors and Stockholders ofPetSmart, Inc.Phoenix, Arizona
We have audited the internal control over financial reporting of PetSmart, Inc. and subsidiaries (the“Company”) as of February 1, 2009, based on criteria established in Internal Control — Integrated Frameworkissued by the Committee of Sponsoring Organizations of the Treadway Commission. The Company’s managementis responsible for maintaining effective internal control over financial reporting and for its assessment of theeffectiveness of internal control over financial reporting, included in the accompanying Management’s Report onInternal Control over Financial Reporting. Our responsibility is to express an opinion on the Company’s internalcontrol over financial reporting based on our audit.
We conducted our audit in accordance with the standards of the Public Company Accounting Oversight Board(United States). Those standards require that we plan and perform the audit to obtain reasonable assurance aboutwhether effective internal control over financial reporting was maintained in all material respects. Our auditincluded obtaining an understanding of internal control over financial reporting, assessing the risk that a materialweakness exists, testing and evaluating the design and operating effectiveness of internal control based on theassessed risk, and performing such other procedures as we considered necessary in the circumstances. We believethat our audit provides a reasonable basis for our opinion.
A company’s internal control over financial reporting is a process designed by, or under the supervision of, thecompany’s principal executive and principal financial officers, or persons performing similar functions, andeffected by the company’s board of directors, management, and other personnel to provide reasonable assuranceregarding the reliability of financial reporting and the preparation of financial statements for external purposes inaccordance with generally accepted accounting principles. A company’s internal control over financial reportingincludes those policies and procedures that (1) pertain to the maintenance of records that, in reasonable detail,accurately and fairly reflect the transactions and dispositions of the assets of the company; (2) provide reasonableassurance that transactions are recorded as necessary to permit preparation of financial statements in accordancewith generally accepted accounting principles, and that receipts and expenditures of the company are being madeonly in accordance with authorizations of management and directors of the company; and (3) provide reasonableassurance regarding prevention or timely detection of unauthorized acquisition, use, or disposition of the company’sassets that could have a material effect on the financial statements.
Because of the inherent limitations of internal control over financial reporting, including the possibility ofcollusion or improper management override of controls, material misstatements due to error or fraud may not beprevented or detected on a timely basis. Also, projections of any evaluation of the effectiveness of the internalcontrol over financial reporting to future periods are subject to the risk that the controls may become inadequatebecause of changes in conditions, or that the degree of compliance with the policies or procedures may deteriorate.
In our opinion, the Company maintained, in all material respects, effective internal control over financialreporting as of February 1, 2009, based on the criteria established in Internal Control — Integrated Frameworkissued by the Committee of Sponsoring Organizations of the Treadway Commission.
We have also audited, in accordance with the standards of the Public Company Accounting Oversight Board(United States), the consolidated financial statements and financial statement schedule as of and for the year endedFebruary 1, 2009 of the Company and our reports dated March 26, 2009 expressed unqualified opinions on thosefinancial statements and financial statement schedule.
/s/ DELOITTE & TOUCHE LLP
Phoenix, ArizonaMarch 26, 2009
38

Item 9B. Other Information
None
PART III
Item 10. Directors, Executive Officers and Corporate Governance
The required information concerning our executive officers is contained in Item 1, Part I of this Annual Reporton Form 10-K.
The remaining information required by this item is incorporated by reference from the information under thecaptions “Corporate Governance and the Board of Directors,” “Audit Committee,” “Report of the Audit Committeeof the Board of Directors,” and “Section 16(a) Beneficial Ownership Reporting Compliance” in our proxy statementfor our Annual Meeting of Stockholders to be held on June 17, 2009.
Our associates must act ethically at all times and in accordance with the policies in PetSmart’s Code ofBusiness Ethics and Policies. We require full compliance with this policy and all designated associates includingour CEO, CFO and other individuals performing similar positions, to sign a certificate acknowledging that theyhave read, understand and will continue to comply with the policy. We publish the policy, and any amendments orwaivers to the policy, in the Corporate Governance section of our Internet Website located at www.petm.com.
Item 11. Executive Compensation
The information required by this item is incorporated by reference from the information under the captions“Compensation Discussion and Analysis,” “Executive Compensation,” “Stock Award Grants,” “Exercises andPlans,” “Employment and Severance Agreements,” “Director Compensation,” “Compensation Committee Inter-locks and Insider Participation,” and “Report of the Compensation Committee of the Board of Directors” in ourproxy statement.
Item 12. Security Ownership of Certain Beneficial Owners and Management and Related StockholderMatters
The information required by this item is incorporated by reference from the information under the captions“Security Ownership of Certain Beneficial Owners and Management” and “Equity Compensation Plans” in ourproxy statement.
Item 13. Certain Relationships and Related Transactions, and Director Independence
The information required by this item is incorporated by reference from the information under the captions“Certain Relationships and Transactions” and “Corporate Governance and the Board of Directors Independence” inour proxy statement.
Item 14. Principal Accounting Fees and Services
The information required by this item is incorporated by reference from the information under caption “Fees toIndependent Registered Public Accounting Firm for Fiscal Years 2008 and 2007” in our proxy statement.
PART IV
Item 15. Exhibits, Financial Statement Schedule
(a) The following documents are filed as part of this Annual Report on Form 10-K.
1. Consolidated Financial Statements: Our consolidated financial statements are included as Appendix F ofthis Annual Report. See Index to Consolidated Financial Statements and Financial Statement Schedule on page F-1.
2. Consolidated Financial Statement Schedule: The financial statement schedule required under the relatedinstructions is included within Appendix F of this Annual Report. See Index to Consolidated Financial Statementsand Financial Statement Schedule on page F-1.
3. Exhibits: The exhibits which are filed with this Annual Report or which are incorporated herein byreference are set forth in the Exhibit Index on page E-1.
39

SIGNATURES
Pursuant to the requirements of Section 13 or 15(d) of the Securities Exchange Act of 1934, the registrant hasduly caused this report to be signed on its behalf by the undersigned, thereunto duly authorized, on March 26, 2009.
PetSmart, Inc.
By: /s/ PHILIP L. FRANCIS
Philip L. FrancisChairman of the Board of Directors,
and Chief Executive Officer
POWER OF ATTORNEY
KNOWALL PERSONS BY THESE PRESENTS, that each person whose signature appears below constitutesand appoints Philip L. Francis and Lawrence P. Molloy, and each of them, as his or her true and lawful attorneys-in-fact and agents, with full power of substitution and resubstitution, for him or her and in his or her name, place, andstead, in any and all capacities, to sign any and all amendments to this Annual Report on Form 10-K and to file thesame, with all exhibits thereto and other documents in connection therewith, with the Securities and ExchangeCommission, granting unto said attorneys-in-fact and agents and each of them, full power and authority to do andperform each and every act and thing requisite and necessary to be done in connection therewith as fully to allintents and purposes as he or she might or could do in person, hereby ratifying and confirming all that said attorneys-in-fact and agents, or any of them, or their or his or her substitute or substitutes, may lawfully do or cause to be doneby virtue hereof.
Pursuant to the requirements of the Securities Exchange Act of 1934, this report has been signed below by thefollowing persons on behalf of the registrant and in the capacities and on the dates indicated.
Signature Title Date
/s/ PHILIP L. FRANCIS
Philip L. Francis
Chairman of the Board of Directors, and ChiefExecutive Officer (Principal Executive Officer)
March 26, 2009
/s/ LAWRENCE P. MOLLOY
Lawrence P. Molloy
Senior Vice President, Chief Financial Officer(Principal Financial Officer)
March 26, 2009
/s/ LAWRENCE A. DEL SANTO
Lawrence A. Del Santo
Director March 26, 2009
/s/ RITA V. FOLEY
Rita V. Foley
Director March 26, 2009
/s/ RAKESH GANGWAL
Rakesh Gangwal
Director March 26, 2009
/s/ JOSEPH S. HARDIN, JR.
Joseph S. Hardin, Jr.
Director March 26, 2009
/s/ GREGORY P. JOSEFOWICZ
Gregory P. Josefowicz
Director March 26, 2009
40

Signature Title Date
/s/ AMIN I. KHALIFA
Amin I. Khalifa
Director March 26, 2009
/s/ RICHARD K. LOCHRIDGE
Richard K. Lochridge
Director March 26, 2009
/s/ BARBARA A. MUNDER
Barbara A. Munder
Director March 26, 2009
/s/ THOMAS G. STEMBERG
Thomas G. Stemberg
Director March 26, 2009
41

(This page intentionally left blank)

APPENDIX F
PetSmart, Inc. and Subsidiaries
Index to Consolidated Financial Statements andFinancial Statement Schedule
Page
Report of Independent Registered Public Accounting Firm. . . . . . . . . . . . . . . . . . . . . . . . . . . . . . . . . . . F-2
Consolidated Balance Sheets as of February 1, 2009, and February 3, 2008 . . . . . . . . . . . . . . . . . . . . . . F-3
Consolidated Statements of Operations and Comprehensive Income for the years ended February 1,2009, February 3, 2008, and January 28, 2007 . . . . . . . . . . . . . . . . . . . . . . . . . . . . . . . . . . . . . . . . . . F-4
Consolidated Statements of Stockholders’ Equity for the years ended February 1, 2009, February 3,2008, and January 28, 2007. . . . . . . . . . . . . . . . . . . . . . . . . . . . . . . . . . . . . . . . . . . . . . . . . . . . . . . . F-5
Consolidated Statements of Cash Flows for the years ended February 1, 2009, February 3, 2008, andJanuary 28, 2007 . . . . . . . . . . . . . . . . . . . . . . . . . . . . . . . . . . . . . . . . . . . . . . . . . . . . . . . . . . . . . . . F-6
Notes to Consolidated Financial Statements . . . . . . . . . . . . . . . . . . . . . . . . . . . . . . . . . . . . . . . . . . . . . . F-7
Report of Independent Registered Public Accounting Firm on Supplemental Schedule . . . . . . . . . . . . . . A-1
Schedule II — Valuation and Qualifying Accounts . . . . . . . . . . . . . . . . . . . . . . . . . . . . . . . . . . . . . . . . . A-2
F-1

REPORT OF INDEPENDENT REGISTERED PUBLIC ACCOUNTING FIRM
To the Board of Directors and Stockholders ofPetSmart, Inc.Phoenix, Arizona
We have audited the accompanying consolidated balance sheets of PetSmart, Inc. and subsidiaries (the“Company”) as of February 1, 2009 and February 3, 2008, and the related consolidated statements of operations andcomprehensive income, stockholders’ equity, and cash flows for each of the three years in the period endedFebruary 1, 2009. These financial statements are the responsibility of the Company’s management. Our respon-sibility is to express an opinion on these financial statements based on our audits.
We conducted our audits in accordance with the standards of the Public Company Accounting Oversight Board(United States). Those standards require that we plan and perform the audit to obtain reasonable assurance aboutwhether the financial statements are free of material misstatement. An audit includes examining, on a test basis,evidence supporting the amounts and disclosures in the financial statements. An audit also includes assessing theaccounting principles used and significant estimates made by management, as well as evaluating the overallfinancial statement presentation. We believe that our audits provide a reasonable basis for our opinion.
In our opinion, such consolidated financial statements present fairly, in all material respects, the financialposition of PetSmart, Inc. and subsidiaries as of February 1, 2009 and February 3, 2008, and the results of theiroperations and their cash flows for each of the three years in the period ended February 1, 2009, in conformity withaccounting principles generally accepted in the United States of America.
We have also audited, in accordance with the standards of the Public Company Accounting Oversight Board(United States), the Company’s internal control over financial reporting as of February 1, 2009, based on the criteriaestablished in Internal Control — Integrated Framework issued by the Committee of Sponsoring Organizations ofthe Treadway Commission and our report dated March 26, 2009 expressed an unqualified opinion on theCompany’s internal control over financial reporting.
/s/ DELOITTE & TOUCHE LLP
Phoenix, ArizonaMarch 26, 2009
F-2

PetSmart, Inc. and Subsidiaries
Consolidated Balance Sheets(In thousands, except par value)
February 1,2009
February 3,2008
ASSETSCash and cash equivalents . . . . . . . . . . . . . . . . . . . . . . . . . . . . . . . . . . . . . . . . . . $ 126,314 $ 58,322
Receivables, net . . . . . . . . . . . . . . . . . . . . . . . . . . . . . . . . . . . . . . . . . . . . . . . . . . 48,609 49,341
Merchandise inventories . . . . . . . . . . . . . . . . . . . . . . . . . . . . . . . . . . . . . . . . . . . . 584,011 501,212
Deferred income taxes . . . . . . . . . . . . . . . . . . . . . . . . . . . . . . . . . . . . . . . . . . . . . 28,223 28,644
Prepaid expenses and other current assets . . . . . . . . . . . . . . . . . . . . . . . . . . . . . . . 87,677 73,231
Total current assets . . . . . . . . . . . . . . . . . . . . . . . . . . . . . . . . . . . . . . . . . . . . . . 874,834 710,750Property and equipment, net . . . . . . . . . . . . . . . . . . . . . . . . . . . . . . . . . . . . . . . . . 1,302,245 1,230,770
Equity investment in affiliate . . . . . . . . . . . . . . . . . . . . . . . . . . . . . . . . . . . . . . . . 25,938 23,346
Deferred income taxes . . . . . . . . . . . . . . . . . . . . . . . . . . . . . . . . . . . . . . . . . . . . . 93,128 126,665
Goodwill . . . . . . . . . . . . . . . . . . . . . . . . . . . . . . . . . . . . . . . . . . . . . . . . . . . . . . . 38,645 44,333
Other noncurrent assets . . . . . . . . . . . . . . . . . . . . . . . . . . . . . . . . . . . . . . . . . . . . 22,863 31,393
Total assets . . . . . . . . . . . . . . . . . . . . . . . . . . . . . . . . . . . . . . . . . . . . . . . . . . . . $2,357,653 $2,167,257
LIABILITIES AND STOCKHOLDERS’ EQUITYAccounts payable and bank overdraft. . . . . . . . . . . . . . . . . . . . . . . . . . . . . . . . . . $ 194,630 $ 172,352
Accrued payroll, bonus and employee benefits . . . . . . . . . . . . . . . . . . . . . . . . . . . 88,337 84,727
Accrued occupancy expenses and deferred rents . . . . . . . . . . . . . . . . . . . . . . . . . . 55,642 46,955
Short-term debt . . . . . . . . . . . . . . . . . . . . . . . . . . . . . . . . . . . . . . . . . . . . . . . . . . — 30,000
Current maturities of capital lease obligations . . . . . . . . . . . . . . . . . . . . . . . . . . . . 32,233 24,982
Other current liabilities . . . . . . . . . . . . . . . . . . . . . . . . . . . . . . . . . . . . . . . . . . . . . 107,315 137,330
Total current liabilities . . . . . . . . . . . . . . . . . . . . . . . . . . . . . . . . . . . . . . . . . . . 478,157 496,346
Capital lease obligations . . . . . . . . . . . . . . . . . . . . . . . . . . . . . . . . . . . . . . . . . . . . 553,760 508,765
Deferred rents . . . . . . . . . . . . . . . . . . . . . . . . . . . . . . . . . . . . . . . . . . . . . . . . . . . 92,155 88,954
Other noncurrent liabilities . . . . . . . . . . . . . . . . . . . . . . . . . . . . . . . . . . . . . . . . . . 89,445 86,595
Total liabilities . . . . . . . . . . . . . . . . . . . . . . . . . . . . . . . . . . . . . . . . . . . . . . . . . 1,213,517 1,180,660
Commitments and contingencies
Stockholders’ equity:
Preferred stock; $.0001 par value; 10,000 shares authorized, none issued andoutstanding . . . . . . . . . . . . . . . . . . . . . . . . . . . . . . . . . . . . . . . . . . . . . . . . . . — —
Common stock; $.0001 par value; 625,000 shares authorized, 159,770 and158,104 shares issued . . . . . . . . . . . . . . . . . . . . . . . . . . . . . . . . . . . . . . . . . . 16 16
Additional paid-in capital . . . . . . . . . . . . . . . . . . . . . . . . . . . . . . . . . . . . . . . . . 1,117,557 1,079,190
Retained earnings . . . . . . . . . . . . . . . . . . . . . . . . . . . . . . . . . . . . . . . . . . . . . . . 936,100 758,674
Accumulated other comprehensive (loss) income . . . . . . . . . . . . . . . . . . . . . . . . (2,714) 5,585Less: treasury stock, at cost, 32,408 and 30,066 shares. . . . . . . . . . . . . . . . . . . . (906,823) (856,868)
Total stockholders’ equity . . . . . . . . . . . . . . . . . . . . . . . . . . . . . . . . . . . . . . . 1,144,136 986,597
Total liabilities and stockholders’ equity . . . . . . . . . . . . . . . . . . . . . . . . . . . . $2,357,653 $2,167,257
The accompanying notes are an integral part of these consolidated financial statements.
F-3

PetSmart, Inc. and Subsidiaries
Consolidated Statements of Operations and Comprehensive Income
February 1,2009
February 3,2008
January 28,2007
Year Ended
(52 weeks) (53 weeks) (52 weeks)(In thousands, except per share data)
Merchandise sales. . . . . . . . . . . . . . . . . . . . . . . . . . . . . . . . . . . . . . $4,538,563 $4,217,716 $3,860,176
Services sales . . . . . . . . . . . . . . . . . . . . . . . . . . . . . . . . . . . . . . . . . 526,730 454,940 373,681
Net sales . . . . . . . . . . . . . . . . . . . . . . . . . . . . . . . . . . . . . . . . . . . . 5,065,293 4,672,656 4,233,857
Cost of merchandise sales . . . . . . . . . . . . . . . . . . . . . . . . . . . . . . . . 3,184,819 2,901,415 2,654,171
Cost of services sales . . . . . . . . . . . . . . . . . . . . . . . . . . . . . . . . . . . 385,041 334,420 271,916
Total cost of sales . . . . . . . . . . . . . . . . . . . . . . . . . . . . . . . . . . . . . . 3,569,860 3,235,835 2,926,087
Gross profit . . . . . . . . . . . . . . . . . . . . . . . . . . . . . . . . . . . . . . . . . . 1,495,433 1,436,821 1,307,770
Operating, general and administrative expenses . . . . . . . . . . . . . . . . 1,125,579 1,085,308 985,936
Operating income . . . . . . . . . . . . . . . . . . . . . . . . . . . . . . . . . . . . . . 369,854 351,513 321,834
Gain on sale of equity investment . . . . . . . . . . . . . . . . . . . . . . . . . . — 95,363 —
Interest income . . . . . . . . . . . . . . . . . . . . . . . . . . . . . . . . . . . . . . . . 579 6,813 10,551
Interest expense . . . . . . . . . . . . . . . . . . . . . . . . . . . . . . . . . . . . . . . (59,336) (51,496) (42,268)
Income before income tax expense and equity in income frominvestee . . . . . . . . . . . . . . . . . . . . . . . . . . . . . . . . . . . . . . . . . . . 311,097 402,193 290,117
Income tax expense . . . . . . . . . . . . . . . . . . . . . . . . . . . . . . . . . . . . (121,019) (145,180) (105,048)
Equity in income from investee . . . . . . . . . . . . . . . . . . . . . . . . . . . . 2,592 1,671 —
Net income . . . . . . . . . . . . . . . . . . . . . . . . . . . . . . . . . . . . . . . . . . 192,670 258,684 185,069
Other comprehensive income, net of income tax:
Foreign currency translation adjustments . . . . . . . . . . . . . . . . . . . (8,299) 4,457 (478)
Comprehensive income . . . . . . . . . . . . . . . . . . . . . . . . . . . . . . . . $ 184,371 $ 263,141 $ 184,591
Earnings per common share:
Basic . . . . . . . . . . . . . . . . . . . . . . . . . . . . . . . . . . . . . . . . . . . . . $ 1.55 $ 1.99 $ 1.36
Diluted . . . . . . . . . . . . . . . . . . . . . . . . . . . . . . . . . . . . . . . . . . . . $ 1.52 $ 1.95 $ 1.33
Weighted average shares outstanding:
Basic . . . . . . . . . . . . . . . . . . . . . . . . . . . . . . . . . . . . . . . . . . . . . 124,342 129,851 135,836
Diluted . . . . . . . . . . . . . . . . . . . . . . . . . . . . . . . . . . . . . . . . . . . . 126,751 132,954 139,537
The accompanying notes are an integral part of these consolidated financial statements.
F-4

PetSmart, Inc. and Subsidiaries
Consolidated Statements of Stockholders’ Equity
CommonStock
TreasuryStock
CommonStock
AdditionalPaid-InCapital
RetainedEarnings
AccumulatedOther
Comprehensive(Loss)
IncomeTreasury
Stock Total
Shares
(In thousands, except per share data)
BALANCE AT JANUARY 29, 2006 . . . . . . . . 153,024 (14,027) $15 $ 970,664 $348,442 $ 1,606 $(379,977) $ 940,750Stock options and employee stock purchase plan
compensation cost . . . . . . . . . . . . . . . . . . 9,936 9,936Net tax benefits from tax deductions in excess
of the compensation cost recognized . . . . . . . 5,989 5,989Issuance of common stock under stock incentive
plans . . . . . . . . . . . . . . . . . . . . . . . . . . . 2,172 1 28,625 28,626Issuance of restricted stock and compensation
cost, net of award reacquisitions andadjustments . . . . . . . . . . . . . . . . . . . . . . . 586 9,416 9,416
Dividends declared ($0.12 per share) . . . . . . . . (16,550) (16,550)Other comprehensive income, net of income tax:
Foreign currency translation adjustments . . . . (478) (478)Purchase of treasury stock, at cost . . . . . . . . . . (6,286) (161,864) (161,864)Net income. . . . . . . . . . . . . . . . . . . . . . . . . 185,069 185,069
BALANCE AT JANUARY 28, 2007 . . . . . . . . 155,782 (20,313) 16 1,024,630 516,961 1,128 (541,841) 1,000,894Cumulative effect of FIN No. 48 adoption . . . . (1,164) (1,164)Stock options and employee stock purchase plan
compensation cost . . . . . . . . . . . . . . . . . . 5,137 5,137Net tax benefits from tax deductions in excess
of the compensation cost recognized . . . . . . . 9,921 9,921Issuance of common stock under stock incentive
plans . . . . . . . . . . . . . . . . . . . . . . . . . . . 2,031 31,576 31,576Issuance of restricted stock and compensation
cost, net of award reacquisitions andadjustments . . . . . . . . . . . . . . . . . . . . . . . 291 7,926 7,926
Dividends declared ($0.12 per share) . . . . . . . . (15,807) (15,807)Other comprehensive income, net of income tax:
Foreign currency translation adjustments . . . . 4,457 4,457Purchase of treasury stock, at cost . . . . . . . . . . (9,753) (315,027) (315,027)Net income. . . . . . . . . . . . . . . . . . . . . . . . . 258,684 258,684
BALANCE AT FEBRUARY 3, 2008 . . . . . . . . 158,104 (30,066) 16 1,079,190 758,674 5,585 (856,868) 986,597Stock options and employee stock purchase plan
compensation cost . . . . . . . . . . . . . . . . . . 10,074 10,074Net tax benefits from tax deductions in excess
of the compensation cost recognized . . . . . . . 1,980 1,980Issuance of common stock under stock incentive
plans . . . . . . . . . . . . . . . . . . . . . . . . . . . 1,109 1 14,108 14,109Issuance of restricted stock and compensation
cost, net of award reacquisitions andadjustments . . . . . . . . . . . . . . . . . . . . . . . 557 (1) 12,205 12,204
Dividends declared ($0.12 per share) . . . . . . . . (15,244) (15,244)Other comprehensive income, net of income tax:
Foreign currency translation adjustments . . . . (8,299) (8,299)Purchase of treasury stock, at cost . . . . . . . . . . (2,342) (49,955) (49,955)Net income. . . . . . . . . . . . . . . . . . . . . . . . . 192,670 192,670
BALANCE AT FEBRUARY 1, 2009 . . . . . . . . 159,770 (32,408) $16 $1,117,557 $936,100 $(2,714) $(906,823) $1,144,136
The accompanying notes are an integral part of these consolidated financial statements.
F-5

PetSmart, Inc. and Subsidiaries
Consolidated Statements of Cash Flows(In thousands)
February 1,2009
February 3,2008
January 28,2007
Year Ended
(52 weeks) (53 weeks) (52 weeks)
CASH FLOWS FROM OPERATING ACTIVITIES:Net income . . . . . . . . . . . . . . . . . . . . . . . . . . . . . . . . . . . . . . . . . . . . . . $ 192,670 $ 258,684 $ 185,069Adjustments to reconcile net income to net cash provided by operating
activities:Depreciation and amortization . . . . . . . . . . . . . . . . . . . . . . . . . . . . . . 225,054 195,980 156,941Gain on sale of equity investment . . . . . . . . . . . . . . . . . . . . . . . . . . . . — (95,363) —Loss on disposal of property and equipment . . . . . . . . . . . . . . . . . . . . 5,589 6,914 8,727Stock-based compensation expense . . . . . . . . . . . . . . . . . . . . . . . . . . . 24,301 18,333 19,320Deferred income taxes . . . . . . . . . . . . . . . . . . . . . . . . . . . . . . . . . . . . 33,957 (15,251) (18,882)Equity in income from investee . . . . . . . . . . . . . . . . . . . . . . . . . . . . . (2,592) (1,671) —Tax benefits from tax deductions in excess of the compensation cost
recognized . . . . . . . . . . . . . . . . . . . . . . . . . . . . . . . . . . . . . . . . . . . (3,215) (10,715) (8,222)Non-cash interest expense . . . . . . . . . . . . . . . . . . . . . . . . . . . . . . . . . 4,576 2,589 5,647Changes in assets and liabilities, excluding the effect of the
acquisition of store locations in Canada:Receivables, net . . . . . . . . . . . . . . . . . . . . . . . . . . . . . . . . . . . . . . . 1,694 (11,793) 1,832Merchandise inventories . . . . . . . . . . . . . . . . . . . . . . . . . . . . . . . . . (86,151) (9,005) (87,867)Prepaid expenses and other current assets . . . . . . . . . . . . . . . . . . . . (13,758) (22,549) (3,276)Other noncurrent assets. . . . . . . . . . . . . . . . . . . . . . . . . . . . . . . . . . 8,057 (4,238) (2,555)Accounts payable . . . . . . . . . . . . . . . . . . . . . . . . . . . . . . . . . . . . . . 25,201 (1,515) 9,732Accrued payroll, bonus and employee benefits . . . . . . . . . . . . . . . . 4,280 (1,851) 9,129Accrued occupancy expenses and current deferred rents . . . . . . . . . . 9,632 1,722 1,222Other current liabilities . . . . . . . . . . . . . . . . . . . . . . . . . . . . . . . . . . (17,559) 12,865 19,030Deferred rents . . . . . . . . . . . . . . . . . . . . . . . . . . . . . . . . . . . . . . . . 4,208 3,883 359Other noncurrent liabilities . . . . . . . . . . . . . . . . . . . . . . . . . . . . . . . 4,756 5,697 (6,915)
Net cash provided by operating activities . . . . . . . . . . . . . . . . . . . . . . . . 420,700 332,716 289,291CASH FLOWS FROM INVESTING ACTIVITIES:
Cash paid for short-term available-for-sale investments . . . . . . . . . . . . . . — (285,205) (2,114,035)Proceeds from sales of short-term available-for-sale investments . . . . . . . — 304,405 2,314,735Decrease (increase) in restricted cash and short-term investments . . . . . . — 60,700 (60,700)Cash paid for property and equipment . . . . . . . . . . . . . . . . . . . . . . . . . . (238,188) (294,437) (241,106)Cash paid for acquisition of store locations in Canada. . . . . . . . . . . . . . . — (36,963) —Proceeds from sales of property and equipment . . . . . . . . . . . . . . . . . . . 2,951 539 1,579Cash paid for equity investment . . . . . . . . . . . . . . . . . . . . . . . . . . . . . . . — — (4,398)Proceeds from sale of equity investment . . . . . . . . . . . . . . . . . . . . . . . . . — 111,752 —Net cash used in investing activities . . . . . . . . . . . . . . . . . . . . . . . . . . . . (235,237) (139,209) (103,925)
CASH FLOWS FROM FINANCING ACTIVITIES:Net proceeds from common stock traded under stock incentive plans . . . 12,082 31,576 28,626Cash paid for treasury stock . . . . . . . . . . . . . . . . . . . . . . . . . . . . . . . . . . (49,955) (315,027) (161,864)Payments of capital lease obligations . . . . . . . . . . . . . . . . . . . . . . . . . . . (33,853) (26,483) (19,046)Proceeds from short-term debt . . . . . . . . . . . . . . . . . . . . . . . . . . . . . . . . 576,000 185,000 —Payments on short-term debt . . . . . . . . . . . . . . . . . . . . . . . . . . . . . . . . . (606,000) (155,000) —Increase (decrease) in bank overdraft. . . . . . . . . . . . . . . . . . . . . . . . . . . 15 (8,461) 15,707Tax benefits from tax deductions in excess of the compensation cost
recognized . . . . . . . . . . . . . . . . . . . . . . . . . . . . . . . . . . . . . . . . . . . . . 3,215 10,715 8,222Cash dividends paid to stockholders . . . . . . . . . . . . . . . . . . . . . . . . . . . . (15,265) (16,034) (16,654)Net cash used in financing activities . . . . . . . . . . . . . . . . . . . . . . . . . . . . (113,761) (293,714) (145,009)
EFFECT OF EXCHANGE RATE CHANGES ON CASH AND CASHEQUIVALENTS . . . . . . . . . . . . . . . . . . . . . . . . . . . . . . . . . . . . . . . . . . (3,710) 9,730 (1,973)
INCREASE (DECREASE) IN CASH AND CASH EQUIVALENTS. . . . . . 67,992 (90,477) 38,384CASH AND CASH EQUIVALENTS AT BEGINNING OF YEAR . . . . . . . 58,322 148,799 110,415CASH AND CASH EQUIVALENTS AT END OF YEAR . . . . . . . . . . . . . $ 126,314 $ 58,322 $ 148,799
The accompanying notes are an integral part of these consolidated financial statements.
F-6
PetSmart, Inc. and Subsidiaries
Notes to Consolidated Financial Statements
Note 1 — The Company and its Significant Accounting Policies
Business
PetSmart, Inc., including its wholly-owned subsidiaries (the “Company,” “PetSmart” or “we”), is a leadingspecialty provider of products, services and solutions for the lifetime needs of pets. We offer a broad line of productsfor all the life stages of pets and offer various pet services, including professional grooming, training, boarding andday camp. We also offer pet products through an e-commerce site. As of February 1, 2009, we operated 1,112 retailstores and had full-service veterinary hospitals in 734 of our stores. Medical Management International, Inc.,operated 722 of the veterinary hospitals under the registered trade name of “Banfield, The Pet Hospital.” See Note 3for a discussion of our ownership interest in Medical Management International, Inc. The remaining 12 hospitals areoperated by other third parties in Canada.
Principles of Consolidation
Our consolidated financial statements include the accounts of PetSmart and our wholly-owned subsidiaries.We have eliminated all intercompany accounts and transactions.
During 2007, we sold a portion of our non-voting shares in MMI Holdings, Inc. or “MMIH.” In connectionwith this transaction, we also converted our remaining MMIH non-voting shares to voting shares. The increase invoting shares caused us to exceed the significant influence threshold as defined by accounting principles generallyaccepted in the United States of America, or “GAAP,” which required us to account for our investment in MMIHusing the equity method of accounting, instead of the previously applied cost method, in accordance withAccounting Principles Board Opinion, or “APB,” No. 18, “The Equity Method of Accounting for Investmentsin Common Stock.” However, since the amounts are not material, we have not restated the 2006 consolidatedfinancial statements. The equity income from our investment in MMIH is recorded one month in arrears. See Note 3for additional information.
Fiscal Year
Our fiscal year consists of the 52 or 53 weeks ending on the Sunday nearest January 31. The 2008 fiscal yearended on February 1, 2009, and was a 52-week year. The 2007 fiscal year was a 53-week year, while the 2006 fiscalyear was a 52-week year. Unless otherwise specified, all references in these consolidated financial statements toyears are to fiscal years.
Reclassifications
We have presented deferred rents and other noncurrent liabilities as separate line items instead of thepreviously reported single line item of deferred rents and other noncurrent liabilities in the Consolidated Statementsof Cash Flows. Merchandise and services sales and cost of sales have been disclosed in the prior years to conform tothe current year presentation in our Consolidated Statements of Operations and Comprehensive Income. The long-term portion of the workers’ compensation and general liability insurance accruals, previously classified as short-term and included in accrued payroll, bonus and employee benefits and other current liabilities, respectively, havebeen reclassified to other noncurrent liabilities in our Consolidated Balance Sheets and Consolidated Statements ofCash Flows. The long-term portion of deferred income taxes related to the reclassification of the workers’compensation and general liability insurance accruals has been reclassified from current to long-term deferredincome taxes in our Consolidated Balance Sheets. Intangible assets, previously reported as a single line item on theConsolidated Balance Sheets, has been combined with other noncurrent assets due to its immaterial nature.
Use of Estimates
The preparation of financial statements in conformity with GAAP requires management to make estimates andassumptions that affect the reported amounts of assets and liabilities, disclosure of contingent assets and liabilities at
F-7
the date of the financial statements and the reported amounts of revenues and expenses during the reporting period.Management bases its estimates on historical experience and on various other assumptions it believes to bereasonable under the circumstances, the results of which form the basis for making judgments about the carryingvalues of assets and liabilities that are not readily apparent from other sources. Under different assumptions orconditions, actual results could differ from these estimates.
Segment Reporting
The Financial Accounting Standards Board, or “FASB,” Statement of Financial Accounting Standards, or“SFAS,” No. 131, “Disclosures about Segments of an Enterprise and Related Information,” requires that a publiccompany report annual and interim financial and descriptive information about its reportable operating segments.Operating segments, as defined, are components of an enterprise about which separate financial information isavailable that is evaluated regularly by the chief operating decision maker in deciding how to allocate resources andin assessing performance. Utilizing these criteria, we manage our business on the basis of one reportable operatingsegment.
Financial Instruments
Our financial instruments consist primarily of cash and cash equivalents, receivables, and accounts payable.These balances, as presented in the consolidated financial statements at February 1, 2009, and February 3, 2008,approximate fair value because of the short-term nature.
Cash and Cash Equivalents
Under our cash management system, a bank overdraft balance exists for our primary disbursement accounts.This overdraft represents uncleared checks in excess of cash balances in the related bank accounts. Our funds aretransferred on an as-needed basis to pay for clearing checks. As of February 1, 2009, and February 3, 2008, bankoverdrafts of $47.6 million and $47.5 million respectively, were included in accounts payable and bank overdraft inthe Consolidated Balance Sheets.
We consider any liquid investments with a maturity of three months or less at purchase to be cash equivalents.Included in cash and cash equivalents are credit and debit card receivables from banks, which typically settle withinfive business days, of $43.0 million and $40.0 million as of February 1, 2009, and February 3, 2008, respectively.
Vendor Rebates and Cooperative Advertising Incentives
We receive vendor allowances, in the form of purchase rebates and cooperative advertising incentives, fromagreements made with certain merchandise suppliers. Rebate incentives are initially deferred as a reduction of thecost of inventory purchased and then recognized as a reduction of cost of sales as the related inventory is sold.Cooperative advertising incentives are recorded as a reduction of operating, general and administrative expenses inthe Consolidated Statements of Operations and Comprehensive Income. Unearned purchase rebates recorded as areduction of inventory and rebate and cooperative advertising incentives remaining in receivables in the Consol-idated Balance Sheets as of February 1, 2009, and February 3, 2008, were not material.
Merchandise Inventories and Valuation Reserves
Merchandise inventories represent finished goods and are recorded at the lower of cost or market. Cost isdetermined by the moving average cost method and includes inbound freight, as well as certain procurement anddistribution costs related to the processing of merchandise.
We have established reserves for estimated inventory shrinkage between physical inventories. Physicalinventory counts are taken on a regular basis, and inventory is adjusted accordingly. For each reporting period
F-8
PetSmart, Inc. and Subsidiaries
Notes to Consolidated Financial Statements — (Continued)

presented, we estimate the inventory shrinkage based on a two-year historical trend analysis. Changes in shrinkresults or market conditions could cause actual results to vary from estimates used to establish the reserves.
We have reserves for estimated obsolescence and to reduce inventory to the lower of cost or market. Weevaluate inventory for excess, obsolescence or other factors that may render inventories unmarketable at theirhistorical cost. If assumptions about future demand change or actual market conditions are less favorable than thoseprojected by management, we may require additional reserves.
As of February 1, 2009, and February 3, 2008, our inventory valuation reserves were $14.6 million and$13.3 million, respectively.
Property and Equipment
Property and equipment are recorded at cost less accumulated depreciation and amortization. Depreciation isprovided on buildings, furniture, fixtures and equipment and computer software using the straight-line method overthe estimated useful lives of the related assets. Leasehold improvements and capital lease assets are amortized usingthe straight-line method over the shorter of the lease term or the estimated useful lives of the related assets.Computer software consists primarily of third-party software purchased for internal use. Costs associated with thepreliminary stage of a project are expensed as incurred. Once the project is in the development phase, externalconsulting costs, as well as qualifying internal labor costs, are capitalized. Training costs, data conversion costs andmaintenance costs are expensed as incurred. Maintenance and repairs to furniture, fixtures and equipment areexpensed as incurred.
Long-lived assets are reviewed for impairment, based on undiscounted cash flows. We conduct this reviewquarterly and whenever events or changes in circumstances indicate that the carrying amount of such assets may notbe recoverable. If this review indicates that the carrying amount of the long-lived assets is not recoverable, we willrecognize an impairment loss, measured at fair value by estimated discounted cash flows or market appraisals.
Our property and equipment are depreciated using the following estimated useful lives:
Buildings . . . . . . . . . . . . . . . . . . . . . . . . . . . . . . . . . . . . . . . . . . . . . . . . 39 years or term of lease
Furniture, fixtures and equipment . . . . . . . . . . . . . . . . . . . . . . . . . . . . . . 2 - 12 years
Leasehold improvements . . . . . . . . . . . . . . . . . . . . . . . . . . . . . . . . . . . . . 1 - 20 years
Computer software . . . . . . . . . . . . . . . . . . . . . . . . . . . . . . . . . . . . . . . . . 3 - 7 years
Goodwill
We account for goodwill and intangible assets in accordance with SFAS No. 142, “Goodwill and OtherIntangible Assets.” The carrying value of goodwill of $38.7 million and $44.3 million as of February 1, 2009, andFebruary 3, 2008, respectively, represents the excess of the cost of acquired businesses over the fair market value oftheir net assets. In 2007, we purchased 19 store locations, which added 18 net new stores in Canada and increasedgoodwill by $27.7 million. During 2008, goodwill decreased approximately $5.6 million as a result of foreigncurrency translation. Other than the effects of foreign currency translation, we have had no other changes ingoodwill.
Insurance Liabilities and Reserves
We maintain standard property and casualty insurance on all our properties and leasehold interests, productliability insurance that covers products and the sale of pets, self-insured health plans, employer’s professionalliability, and workers’ compensation insurance. Property insurance covers approximately $2.1 billion in buildingsand contents, including furniture and fixtures, leasehold improvements and inventory. Under our casualty andworkers’ compensation insurance policies as of February 1, 2009, we retained an initial risk of loss of $0.5 millionfor general liability per occurrence and $1.0 million per occurrence for workers’ compensation. We establish
F-9
PetSmart, Inc. and Subsidiaries
Notes to Consolidated Financial Statements — (Continued)

reserves for losses based on periodic actuarial estimates of the amount of loss inherent in that period’s claims,including losses for which claims have been incurred but not reported. Loss estimates rely on actuarial observationsof ultimate loss experience for similar historical events, and changes in such assumptions could result in anadjustment to the reserves. As of February 1, 2009, and February 3, 2008, we had approximately $92.5 million and$86.7 million, respectively, in reserves related to casualty, self-insured health plans, employer’s professionalliability, and workers’ compensation insurance policies, of which $63.2 million and $59.5 million were classified asother noncurrent liabilities in the Consolidated Balance Sheets.
Reserve for Closed Stores
We continuously evaluate the performance of our retail stores and periodically close those that are under-performing. Closed stores are generally replaced by a new store in a nearby location. We establish reserves forfuture occupancy payments on closed stores in the period the store closes in accordance with SFAS No. 146,“Accounting for Costs Associated with Exit or Disposal Activities.” The costs for future occupancy payments arereported in operating, general and administrative expenses in the Consolidated Statements of Operations andComprehensive Income. We calculate the cost for future occupancy payments, net of expected sublease income,associated with closed stores using the net present value method at a credit-adjusted risk-free interest rate over theremaining life of the lease. Judgment is used to estimate the underlying real estate market related to the expectedsublease income, and we can make no assurances that additional charges will not be required based on the changingreal estate environment.
Property and equipment retirement losses at closed stores are recorded as operating, general and administrativeexpenses in the Consolidated Statements of Operations and Comprehensive Income.
Income Taxes
We establish deferred income tax assets and liabilities for temporary differences between the financialreporting bases and the income tax bases of our assets and liabilities at enacted tax rates expected to be in effectwhen such assets or liabilities are realized or settled. We record a valuation allowance on the deferred income taxassets to reduce the total to an amount we believe is more likely than not to be realized. Valuation allowances atFebruary 1, 2009, and February 3, 2008, were principally to offset deferred income tax assets for net operating losscarryforwards.
As of January 29, 2007, we adopted FASB Interpretation, or “FIN,” No. 48, “Accounting for Uncertainty inIncome Taxes — an Interpretation of FASB Statement No. 109,” which addresses the determination of whether taxbenefits claimed or expected to be claimed on a tax return should be recorded in the financial statements. UnderFIN No. 48, the tax benefit from an uncertain tax position may be recognized only if it is more likely than not thatthe tax position will be sustained on examination by the taxing authorities. The determination is based on thetechnical merits of the position and presumes that each uncertain tax position will be examined by the relevanttaxing authority that has full knowledge of all relevant information. Although we believe the estimates arereasonable, no assurance can be given that the final outcome of these matters will not be different than what isreflected in the historical income tax provisions and accruals.
We operate in multiple tax jurisdictions and could be subject to audit in any of these jurisdictions. These auditscan involve complex issues that may require an extended period of time to resolve and may cover multiple years.
F-10
PetSmart, Inc. and Subsidiaries
Notes to Consolidated Financial Statements — (Continued)

Other Current Liabilities
Other current liabilities consisted of the following (in thousands):
February 1,2009
February 3,2008
Accrued income and sales tax . . . . . . . . . . . . . . . . . . . . . . . . . . . . . . . . . . $ 19,313 $ 24,812
Accounts payable — operating expenses . . . . . . . . . . . . . . . . . . . . . . . . . . 17,183 21,584
Accrued capital purchases . . . . . . . . . . . . . . . . . . . . . . . . . . . . . . . . . . . . . 14,255 21,419
Accrued general liability insurance reserve . . . . . . . . . . . . . . . . . . . . . . . . 5,137 4,557
Gift card liability . . . . . . . . . . . . . . . . . . . . . . . . . . . . . . . . . . . . . . . . . . . 8,472 9,325
Deferred revenue . . . . . . . . . . . . . . . . . . . . . . . . . . . . . . . . . . . . . . . . . . . 6,692 7,686Other . . . . . . . . . . . . . . . . . . . . . . . . . . . . . . . . . . . . . . . . . . . . . . . . . . . . 36,263 47,947
$107,315 $137,330
Revenue Recognition
We recognize revenue and the related cost of sales (including shipping costs) in accordance with the provisionsof Staff Accounting Bulletin, or “SAB,” No. 101, “Revenue Recognition in Financial Statements,” as amended bySAB No. 104, “Revenue Recognition.” We recognize revenue for store merchandise sales when the customerreceives and pays for the merchandise at the register. Services sales are recognized at the time the service isprovided. E-commerce sales are recognized at the time we estimate that the customer receives the product. Weestimate and defer revenue and the related product costs for shipments that are in-transit to the customer. Customerstypically receive goods within a few days of shipment. Such amounts were immaterial as of February 1, 2009, andFebruary 3, 2008. Amounts related to shipping and handling that are billed to customers are reflected inmerchandise sales, and the related costs are reflected in cost of merchandise sales.
We record deferred revenue for the sale of gift cards and recognize this revenue in net sales when cards areredeemed. Gift card breakage income is recognized based upon historical redemption patterns and represents thebalance of gift cards for which we believe the likelihood of redemption by the customer is remote. During 2007, weobtained sufficient historical redemption data for our gift card program to make a reasonable estimate of theultimate redemption patterns and breakage rate. Accordingly, we recognized $6.0 million of gift card breakageincome in 2007, which includes the gift card breakage income related to gift cards sold since the inception of the giftcard program in 2000. During 2008, we recognized $2.0 million of gift card breakage income. Gift card breakage isrecorded monthly and is included in the Consolidated Statements of Operations and Comprehensive Income as areduction in operating, general and administrative expenses.
We record allowances for estimated returns based on historical return patterns.
Revenue is recognized net of applicable sales tax in the Consolidated Statements of Operations andComprehensive Income. We record the sales tax liability in other current liabilities on the Consolidated BalanceSheets.
Cost of Merchandise Sales
Cost of merchandise sales includes the following types of expenses:
• Purchase price of inventory sold;
• Transportation costs associated with moving inventory;
• Inventory shrinkage costs and valuation adjustments;
F-11
PetSmart, Inc. and Subsidiaries
Notes to Consolidated Financial Statements — (Continued)

• Costs associated with operating our distribution network, including payroll and benefit costs, occupancycosts, utilities costs and depreciation;
• Procurement costs, including merchandising and other costs directly associated with the procurement,storage and handling of inventory;
• Store occupancy costs, including rent, common area maintenance, real estate taxes, utilities and depreciationof leasehold improvements and capitalized lease assets; and
• Reductions for vendor rebates, promotions and discounts.
Cost of Services Sales
Costs of services sales includes payroll and benefits costs, and training and professional fees for groomers,trainers and PetsHotel associates.
Vendor Concentration Risk
We purchase merchandise inventories from several hundred vendors worldwide. Sales of products from ourtwo largest vendors approximated 21.9%, 20.5% and 15.7% of our net sales for 2008, 2007 and 2006, respectively.
Advertising
We charge advertising costs to expense as incurred, except for direct response advertising, which is capitalizedand amortized over its expected period of future benefit. Advertising costs are classified within operating, generaland administrative expenses. Total advertising expenditures, net of cooperative income and including directresponse advertising, were $79.5 million, $85.8 million and $86.3 million for 2008, 2007 and 2006, respectively.Direct response advertising consists primarily of product catalogs. The capitalized costs of the direct responseadvertising were amortized over the six-month to one-year period following the mailing of the respective catalog,and were not material as of February 1, 2009, and February 3, 2008. In 2007, we exited our equine product line,including the equine catalog, and had no catalog operations since that time.
Stock-based Compensation
We apply the fair value recognition provisions of SFAS No. 123 (revised 2004), “Share-Based Payment.”Stock-based compensation costs include: (a) compensation cost for all share-based payments granted on or beforeJanuary 30, 2005, based on the grant-date fair value estimated in accordance with the original provisions ofSFAS No. 123, “Accounting for Stock-Based Compensation,” and (b) compensation cost for all share-basedpayments granted subsequent to January 30, 2005, based on the grant-date fair value estimated in accordance withthe provisions of SFAS No. 123(R).
Foreign Currency Translation and Transactions
The local currency has been used as the functional currency in Canada. We translate assets and liabilitiesdenominated in foreign currency into United States dollars at the current rate of exchange at year-end, and translaterevenues and expenses at the average exchange rate during the year. Translation gains and losses are included as aseparate component of other comprehensive income, and transaction gains and losses are included in net income.
Other Comprehensive Income
Foreign currency translation adjustments were the only component of other comprehensive income and arereported separately in stockholders’ equity. The income tax expense related to the foreign currency translationadjustments was $5.3 million and $2.9 million for 2008 and 2007, respectively, and not material for 2006.
F-12
PetSmart, Inc. and Subsidiaries
Notes to Consolidated Financial Statements — (Continued)

Earnings Per Common Share
Basic earnings per common share is calculated by dividing net income by the weighted average of sharesoutstanding during each period. Diluted earnings per common share reflects the potential dilution of securities thatcould share in earnings, such as potentially dilutive common shares that may be issuable upon the exercise ofoutstanding common stock options and unvested restricted stock, and is calculated by dividing net income by theweighted average shares, including dilutive securities, outstanding during the period.
Recently Issued Accounting Pronouncements
In December 2007, the FASB issued SFAS No. 141 (revised 2007), “Business Combinations.”SFAS No. 141(R) establishes principles and requirements for how the acquirer in a business combinationrecognizes and measures in its financial statements the identifiable assets acquired, the liabilities assumed andany noncontrolling interest in the acquiree at the acquisition date fair value. SFAS No. 141(R) determines whatinformation to disclose to enable users of the financial statements to evaluate the nature and financial effects of thebusiness combination. SFAS No. 141(R) applies prospectively to business combinations for which the acquisitiondate is on or after the beginning of the first annual reporting period beginning on or after December 15, 2008.
In December 2007, the FASB issued SFAS No. 160, “Noncontrolling Interests in Consolidated FinancialStatements, an Amendment of ARB No. 51.” SFAS No. 160 amends Accounting Research Bulletin, or “ARB,”No. 51 to establish accounting and reporting standards for the noncontrolling interest in a subsidiary and for thedeconsolidation of a subsidiary. The provisions of SFAS No. 160 must be applied retrospectively upon adoption.SFAS No. 160 is effective for fiscal years beginning after December 15, 2008. Early adoption of SFAS No. 160 isnot permitted. We do not believe the impact of adopting SFAS No. 160 will be material to our consolidated financialstatements.
In June 2008, the FASB issued FASB Staff Position, or “FSP,” No. EITF 03-6-1, “Determining WhetherInstruments Granted in Share-Based Payment Transactions Are Participating Securities.” FSP No. EITF 03-6-1clarifies that unvested share-based payment awards that contain nonforfeitable rights to dividends or dividendequivalents, whether paid or unpaid, are participating securities and requires such awards be included in thecomputation of earnings per share pursuant to the two-class method. FSP No. EITF 03-6-1 is effective for financialstatements issued for fiscal years beginning after December 15, 2008, and interim periods within those years. FSPNo. EITF 03-6-1 requires all prior-period earnings per share data presented to be adjusted retrospectively and earlyapplication is not permitted. We believe the adoption of FSP No. EITF 03-6-1 will not have a material impact on ourconsolidated financial statements or disclosures.
Note 2 — Fair Value Measurements
SFAS No. 157, “Fair Value Meansurements,” defines and establishes a framework for measuring fair value andexpands related disclosures. This Statement does not require any new fair value measurements. SFAS No. 157 waseffective for our financial assets and financial liabilities beginning in 2008. In February 2008, FSP No. 157-2,“Effective Date of Statement 157,” deferred the effective date of SFAS No. 157 for all nonfinancial assets andnonfinancial liabilities to fiscal years beginning after November 15, 2008.
SFAS No. 157 defines fair value as the price that would be received to sell an asset or paid to transfer a liabilityin the principal or most advantageous market for the asset or liability in an orderly transaction between marketparticipants at the measurement date. SFAS No. 157 establishes a fair value hierarchy, which prioritizes the inputsused in measuring fair value into three broad levels as follows:
Level 1: Quoted prices in active markets for identical assets or liabilities;
F-13
PetSmart, Inc. and Subsidiaries
Notes to Consolidated Financial Statements — (Continued)

Level 2: Quoted prices for similar assets and liabilities in active markets or inputs that are observable for theasset or liability, either directly or indirectly through market corroboration, for substantially the full term of thefinancial instrument; and
Level 3: Unobservable inputs based on the Company’s own assumptions used to measure assets andliabilities at fair value.
We adopted SFAS No. 157 as of February 4, 2008, for the recorded financial assets and financial liabilities. Theadoption of SFAS No. 157 did not have a material impact on our fair value measurements of financial assets andfinancial liabilities. We will adopt the provisions of SFAS No. 157 for nonfinancial assets and nonfinancialliabilities in the first quarter of 2009 and are currently evaluating the impact of the provisions of SFAS No. 157 fornonfinancial assets and nonfinancial liabilities.
The following table provides the fair value hierarchy for financial assets measured at fair value on a recurringbasis (in thousands):
Total CarryingValue at February 1,
2009
Quoted Prices inActive Markets
(Level 1)
SignificantObservable
Other Inputs(Level 2)
SignificantUnobservableOther Inputs
(Level 3)
Fair Value Measurements at February 1, 2009, using:
Money market funds . . . . . . . . . . $72,227 $72,227 — —
Note 3 — Investments
We have an investment in MMI Holdings, Inc., a provider of veterinary and other pet-related services. MMIHoldings, Inc., through a wholly-owned subsidiary, Medical Management International, Inc., collectively referredto as “MMIH,” operates full-service veterinary hospitals inside 722 of our stores, under the registered trademark of“Banfield, The Pet Hospital.” Philip L. Francis, PetSmart’s Chairman and Chief Executive Officer, and Robert F.Moran, PetSmart’s President and Chief Operating Officer, are members of the board of directors of MMIH.
During the thirteen weeks ended April 29, 2007, we sold a portion of our non-voting shares in MMIH for$111.8 million. The cost basis of the non-voting shares was $16.4 million, which resulted in a pre-tax gain of$95.4 million, or an after tax gain of approximately $64.3 million. In connection with this transaction, we alsoconverted our remaining MMIH non-voting shares to voting shares. The increase in voting shares caused us toexceed the significant influence threshold as defined by GAAP, which required us to account for our investment inMMIH using the equity method of accounting, instead of the previously applied cost method, in accordance withAPB No. 18, “The Equity Method of Accounting for Investments in Common Stock.”
Our ownership interest in the stock of MMIH was as follows (in thousands):
Shares Amount Shares AmountFebruary 1, 2009 February 3, 2008
Voting common stock and convertible preferred stock. . . . . . 4,693 $21,675 4,693 $21,675
Equity in income from investee . . . . . . . . . . . . . . . . . . . . . . — 4,263 — 1,671
Total equity investment in affiliate . . . . . . . . . . . . . . . . . . . . 4,693 $25,938 4,693 $23,346
All of our investment as of February 1, 2009, and February 3, 2008, consisted of voting common stock, totaling21.5% ownership of that class of stock. Our ownership percentage as of February 1, 2009, and February 3, 2008,considering all classes of stock, was 21.0%. Our investment in MMIH includes goodwill of $15.9 million. Thegoodwill is calculated as the excess of the purchase price for each step of our acquisition of our ownership interest inMMIH relative to that step’s portion of MMIH’s net assets at the respective acquisition date.
F-14
PetSmart, Inc. and Subsidiaries
Notes to Consolidated Financial Statements — (Continued)

Of the 4.7 million shares of voting stock of MMIH, we held:
(a) 2.9 million shares of voting convertible preferred stock that may be converted into voting commonstock at any time at our option; and
(b) 1.8 million shares of voting common stock.
MMIH’s financial data is summarized as follows (in thousands):
December 27,2008
February 3,2008
Current assets . . . . . . . . . . . . . . . . . . . . . . . . . . . . . . . . . . . . . . . . . . . . . $187,066 $163,083
Noncurrent assets . . . . . . . . . . . . . . . . . . . . . . . . . . . . . . . . . . . . . . . . . . 121,932 120,204
Current liabilities . . . . . . . . . . . . . . . . . . . . . . . . . . . . . . . . . . . . . . . . . . 196,070 183,540
Noncurrent liabilities . . . . . . . . . . . . . . . . . . . . . . . . . . . . . . . . . . . . . . . 14,070 13,631
December 27,2008
February 3,2008
January 29,2007
(52 weeks) (52 weeks) (53 weeks)
Year Ended
Net sales . . . . . . . . . . . . . . . . . . . . . . . . . . . . . . . . . . . . . . $448,528 $407,634 $336,464
Gross profit . . . . . . . . . . . . . . . . . . . . . . . . . . . . . . . . . . . . 65,917 52,104 55,962
Net income before minority interest . . . . . . . . . . . . . . . . . . $ 13,626 $ 7,898 $ 9,763
During 2008, MMIH changed their fiscal year end to December 27, 2008. Therefore, MMIH’s financial datapresented for the year-ended December 27, 2008, represents the eleven month period from February 4, 2008, toDecember 27, 2008. Our equity in income from investee for 2008 was calculated based on our ownership share ofMMIH’s net income for the twelve month period from December 31, 2007, to December 27, 2008, as we record ourequity income on a one-month lag.
In June 2007, we entered into a new master operating agreement with MMIH that has an initial 15-year termand is retroactive to February 2007. We charge MMIH license fees for the space used by the veterinary hospitals andfor their portion of utilities costs. We treat these amounts as a reduction of the retail stores’ occupancy costs, whichare included as a component of cost of sales in the Consolidated Statements of Operations and ComprehensiveIncome. We also charge MMIH for its portion of specific operating expenses and treat the reimbursement as areduction of the stores’ operating expense.
We recognized license fees, utilities and other cost reimbursements of $30.1 million, $32.9 million and$21.4 million during 2008, 2007 and 2006, respectively. Receivables from MMIH totaled $3.3 million and$4.5 million at February 1, 2009, and February 3, 2008, respectively, and were included in receivables in theConsolidated Balance Sheets.
The master operating agreement also includes a provision for the sharing of profits on the sales of therapeuticpet foods sold in all stores with a Banfield hospital.
F-15
PetSmart, Inc. and Subsidiaries
Notes to Consolidated Financial Statements — (Continued)
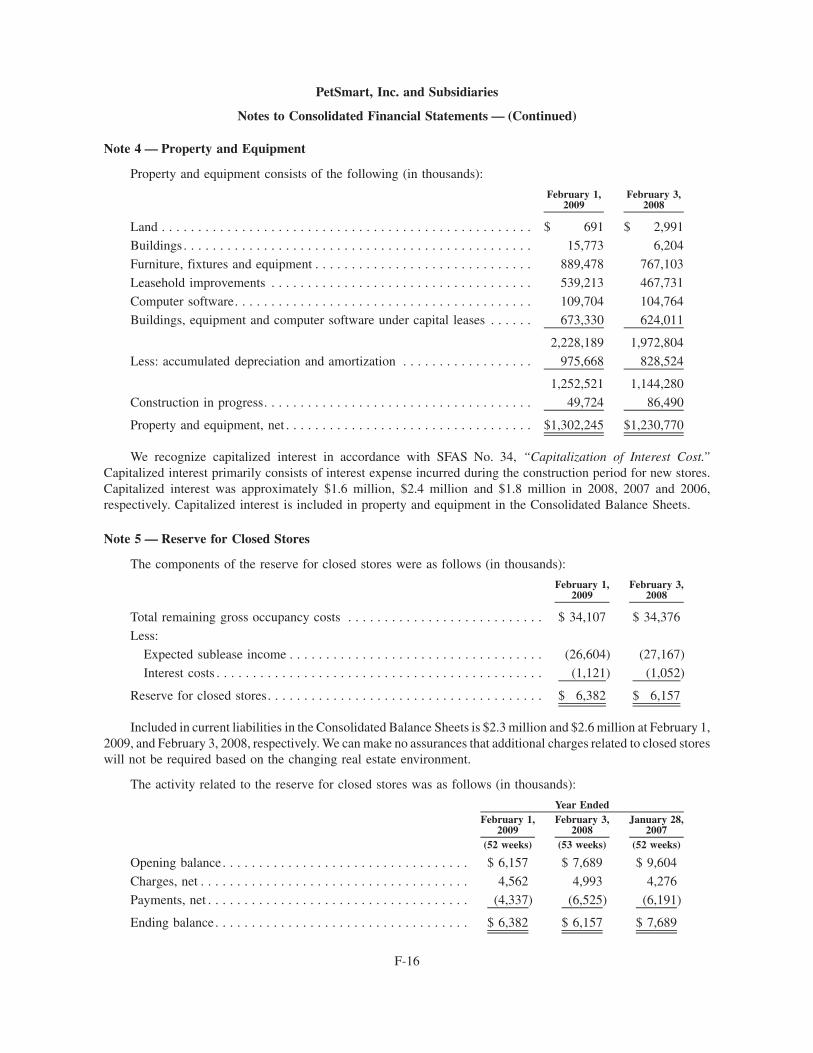
Note 4 — Property and Equipment
Property and equipment consists of the following (in thousands):
February 1,2009
February 3,2008
Land . . . . . . . . . . . . . . . . . . . . . . . . . . . . . . . . . . . . . . . . . . . . . . . . . . . $ 691 $ 2,991
Buildings . . . . . . . . . . . . . . . . . . . . . . . . . . . . . . . . . . . . . . . . . . . . . . . . 15,773 6,204
Furniture, fixtures and equipment . . . . . . . . . . . . . . . . . . . . . . . . . . . . . . 889,478 767,103
Leasehold improvements . . . . . . . . . . . . . . . . . . . . . . . . . . . . . . . . . . . . 539,213 467,731
Computer software. . . . . . . . . . . . . . . . . . . . . . . . . . . . . . . . . . . . . . . . . 109,704 104,764
Buildings, equipment and computer software under capital leases . . . . . . 673,330 624,011
2,228,189 1,972,804
Less: accumulated depreciation and amortization . . . . . . . . . . . . . . . . . . 975,668 828,524
1,252,521 1,144,280
Construction in progress. . . . . . . . . . . . . . . . . . . . . . . . . . . . . . . . . . . . . 49,724 86,490
Property and equipment, net . . . . . . . . . . . . . . . . . . . . . . . . . . . . . . . . . . $1,302,245 $1,230,770
We recognize capitalized interest in accordance with SFAS No. 34, “Capitalization of Interest Cost.”Capitalized interest primarily consists of interest expense incurred during the construction period for new stores.Capitalized interest was approximately $1.6 million, $2.4 million and $1.8 million in 2008, 2007 and 2006,respectively. Capitalized interest is included in property and equipment in the Consolidated Balance Sheets.
Note 5 — Reserve for Closed Stores
The components of the reserve for closed stores were as follows (in thousands):
February 1,2009
February 3,2008
Total remaining gross occupancy costs . . . . . . . . . . . . . . . . . . . . . . . . . . . $ 34,107 $ 34,376
Less:
Expected sublease income . . . . . . . . . . . . . . . . . . . . . . . . . . . . . . . . . . . (26,604) (27,167)
Interest costs . . . . . . . . . . . . . . . . . . . . . . . . . . . . . . . . . . . . . . . . . . . . . (1,121) (1,052)
Reserve for closed stores. . . . . . . . . . . . . . . . . . . . . . . . . . . . . . . . . . . . . . $ 6,382 $ 6,157
Included in current liabilities in the Consolidated Balance Sheets is $2.3 million and $2.6 million at February 1,2009, and February 3, 2008, respectively. We can make no assurances that additional charges related to closed storeswill not be required based on the changing real estate environment.
The activity related to the reserve for closed stores was as follows (in thousands):
February 1,2009
February 3,2008
January 28,2007
(52 weeks) (53 weeks) (52 weeks)
Year Ended
Opening balance. . . . . . . . . . . . . . . . . . . . . . . . . . . . . . . . . . $ 6,157 $ 7,689 $ 9,604
Charges, net . . . . . . . . . . . . . . . . . . . . . . . . . . . . . . . . . . . . . 4,562 4,993 4,276
Payments, net . . . . . . . . . . . . . . . . . . . . . . . . . . . . . . . . . . . . (4,337) (6,525) (6,191)
Ending balance . . . . . . . . . . . . . . . . . . . . . . . . . . . . . . . . . . . $ 6,382 $ 6,157 $ 7,689
F-16
PetSmart, Inc. and Subsidiaries
Notes to Consolidated Financial Statements — (Continued)

We record a charge for new closures and adjustments related to changes in subtenant assumptions and otheroccupancy payments in operating, general and administrative expenses in the Consolidated Statements of Oper-ations and Comprehensive Income.
We made payments of approximately $0.6 million, $3.2 million and $1.8 million in 2008, 2007 and 2006,respectively, for the buyout of previously reserved lease obligations.
Note 6 — Impairment of Long-Lived Assets and Asset Write-Downs
During 2008, impairment of long-lived assets and asset write-downs were not material. During 2007, werecorded expense of $7.5 million for accelerated depreciation of assets related to the exit of our equine product line.During 2006, we recorded expense of $2.8 million related to the replacement of telecommunications equipment.
Note 7 — Income Taxes
Income before income tax expense and equity in income from investee was as follows (in thousands):
February 1,2009
February 3,2008
January 28,2007
Year Ended
(52 weeks) (53 weeks) (52 weeks)
United States . . . . . . . . . . . . . . . . . . . . . . . . . . . . . . . . . . . . $309,311 $401,079 $283,545
Foreign . . . . . . . . . . . . . . . . . . . . . . . . . . . . . . . . . . . . . . . . 1,786 1,114 6,572
$311,097 $402,193 $290,117
Income tax expense consisted of the following (in thousands):
February 1,2009
February 3,2008
January 28,2007
Year Ended
(52 weeks) (53 weeks) (52 weeks)
Current provision:
Federal . . . . . . . . . . . . . . . . . . . . . . . . . . . . . . . . . . . . . . . $ 73,017 $144,961 $108,940
State/Foreign . . . . . . . . . . . . . . . . . . . . . . . . . . . . . . . . . . 9,056 18,325 14,693
82,073 163,286 123,633
Deferred:
Federal . . . . . . . . . . . . . . . . . . . . . . . . . . . . . . . . . . . . . . . 34,372 (15,139) (19,180)
State/Foreign . . . . . . . . . . . . . . . . . . . . . . . . . . . . . . . . . . 4,574 (2,967) 595
38,946 (18,106) (18,585)
Income tax expense . . . . . . . . . . . . . . . . . . . . . . . . . . . . . . . $121,019 $145,180 $105,048
F-17
PetSmart, Inc. and Subsidiaries
Notes to Consolidated Financial Statements — (Continued)

A reconciliation of the federal statutory income tax rate to our effective tax rate is as follows (dollars inthousands):
Dollars % Dollars % Dollars %(52 weeks) (53 weeks) (52 weeks)
February 1,2009
February 3,2008
January 28,2007
Year Ended
Provision at federal statutory tax rate. . . $108,882 35.0% $140,768 35.0% $101,541 35.0%State income taxes, net of federal
income tax benefit . . . . . . . . . . . . . . 8,860 2.8 12,788 3.2 8,327 2.9Adjustments to tax reserves. . . . . . . . . . (486) (0.2) (2,446) (0.6) (826) (0.3)
Adjustments to deferred tax assets . . . . . — — — — 1,494 0.5
Tax exempt interest income . . . . . . . . . . — — (1,676) (0.4) (2,834) (1.0)
Adjustment to valuation allowance . . . . 158 0.1 (701) (0.2) 337 0.1
Utilization of capital loss . . . . . . . . . . . — — (4,974) (1.2) (3,033) (1.0)
Tax on equity income from investee . . . 907 0.3 652 0.1 — —
Other . . . . . . . . . . . . . . . . . . . . . . . . . . 2,698 0.9 769 0.2 42 0.0
$121,019 38.9% $145,180 36.1% $105,048 36.2%
The components of the net deferred income tax assets (liabilities) included in the Consolidated Balance Sheetsare as follows (in thousands):
February 1,2009
February 3,2008
Deferred income tax assets:Capital lease obligations . . . . . . . . . . . . . . . . . . . . . . . . . . . . . . . . . . . . $ 180,775 $ 149,002
Employee benefit expense . . . . . . . . . . . . . . . . . . . . . . . . . . . . . . . . . . . 70,945 68,331
Deferred rents . . . . . . . . . . . . . . . . . . . . . . . . . . . . . . . . . . . . . . . . . . . . 39,888 37,576
Net operating loss carryforwards . . . . . . . . . . . . . . . . . . . . . . . . . . . . . . 19,742 20,859
Reserve for closed stores . . . . . . . . . . . . . . . . . . . . . . . . . . . . . . . . . . . . 2,600 2,017
Miscellaneous reserves and accruals. . . . . . . . . . . . . . . . . . . . . . . . . . . . 8,211 2,180
Tenant incentives . . . . . . . . . . . . . . . . . . . . . . . . . . . . . . . . . . . . . . . . . 13,706 10,075
Other . . . . . . . . . . . . . . . . . . . . . . . . . . . . . . . . . . . . . . . . . . . . . . . . . . 9,379 4,115
Total deferred income tax assets. . . . . . . . . . . . . . . . . . . . . . . . . . . . . 345,246 294,155
Valuation allowance. . . . . . . . . . . . . . . . . . . . . . . . . . . . . . . . . . . . . . (8,036) (7,878)
Deferred income tax assets, net of valuation allowance . . . . . . . . . . . . 337,210 286,277
Deferred income tax liabilities:
Property and equipment . . . . . . . . . . . . . . . . . . . . . . . . . . . . . . . . . . . . . (191,610) (113,392)
Inventory . . . . . . . . . . . . . . . . . . . . . . . . . . . . . . . . . . . . . . . . . . . . . . . (11,399) (13,726)
Prepaid expenses . . . . . . . . . . . . . . . . . . . . . . . . . . . . . . . . . . . . . . . . . . (6,337) —
Other . . . . . . . . . . . . . . . . . . . . . . . . . . . . . . . . . . . . . . . . . . . . . . . . . . (6,513) (3,850)
Total deferred income tax liabilities . . . . . . . . . . . . . . . . . . . . . . . . . . (215,859) (130,968)
Net deferred income tax assets . . . . . . . . . . . . . . . . . . . . . . . . . . . . . . $ 121,351 $ 155,309
F-18
PetSmart, Inc. and Subsidiaries
Notes to Consolidated Financial Statements — (Continued)

We are subject to United States of America federal income tax, as well as the income tax of multiple state andforeign jurisdictions. We have substantially settled all federal income tax matters through 2004, state and localjurisdictions through 1998 and foreign jurisdictions through 2003. We could be subject to audits in thesejurisdictions. These audits can involve complex issues that may require an extended period of time to resolveand may cover multiple years. During 2008, we recorded a net benefit of approximately $1.2 million from thesettlement of uncertain tax positions and lapse of statute of limitations with various federal and state taxjurisdictions. During 2007, we recorded a net benefit of approximately $4.0 million from the settlement ofuncertain tax positions with various state tax jurisdictions and the lapse of the statute of limitations for certain taxpositions. During 2006, we settled an audit with the Internal Revenue Service. This included settlement of anaffirmative issue we raised during 2005 with respect to the characterization of certain losses. The settlement resultedin an overall benefit of $3.4 million. Also included in 2006 were $3.0 million of net tax benefits primarily due to theexpiration of the statute of limitations for certain tax positions and additional federal and state tax credits. The netbenefits are reflected in income tax expense in the Consolidated Statements of Operations and ComprehensiveIncome. We cannot make an estimate of the range of possible changes that may result from other audits.
A reconciliation of the beginning and ending amount of unrecognized tax benefits is as follows (in thousands):
February 1,2009
February 3,2008
Unrecognized tax benefits at February 3, 2008. . . . . . . . . . . . . . . . . . . . . . $8,824 $12,334
Gross increases — tax positions related to the current year . . . . . . . . . . . . . 1,314 1,115
Gross increases — tax positions in prior periods . . . . . . . . . . . . . . . . . . . . 290 —
Gross decreases — tax positions in prior periods . . . . . . . . . . . . . . . . . . . . (674) (4,200)
Gross settlements . . . . . . . . . . . . . . . . . . . . . . . . . . . . . . . . . . . . . . . . . . . (663) —
Lapse of statute of limitations . . . . . . . . . . . . . . . . . . . . . . . . . . . . . . . . . . (558) (741)
Gross (decreases) increases — foreign currency translation . . . . . . . . . . . . . (406) 316
Balance at February 1, 2009 . . . . . . . . . . . . . . . . . . . . . . . . . . . . . . . . . . . $8,127 $ 8,824
Included in the balance of unrecognized tax benefits at February 1, 2009, and February 3, 2008, are$7.3 million and $7.8 million, respectively, of tax benefits that, if recognized, would affect the effective tax rate.
We continue to recognize penalties and interest accrued related to unrecognized tax benefits as income taxexpense. During 2008, the impact of accrued interest and penalties related to unrecognized tax benefits on theConsolidated Statement of Operations was immaterial. In total, as of February 1, 2009, we had recognized a liabilityfor penalties of $0.8 million and interest of $1.8 million.
Our unrecognized tax benefits largely include state exposures from filing positions taken on state tax returnsand characterization of income and timing of deductions on federal and state tax returns. We believe that it isreasonably possible that approximately $2.0 million of our currently remaining unrecognized tax positions, each ofwhich are individually insignificant, may be recognized by the end of 2009 as a result of settlements or a lapse of thestatute of limitations.
As of February 1, 2009, we had, for income tax reporting purposes, federal net operating loss carryforwards of$56.4 million which expire in varying amounts between 2019 and 2020. The federal net operating loss carryfor-wards are subject to certain limitations on their utilization pursuant to Section 382 of the Internal Revenue Code of1986, as amended.
F-19
PetSmart, Inc. and Subsidiaries
Notes to Consolidated Financial Statements — (Continued)

Note 8 — Earnings Per Common Share
The following table presents a reconciliation of the weighted average shares outstanding used to calculateearnings per common share (in thousands):
February 1,2009
February 3,2008
January 28,2007
Year Ended
(52 weeks) (53 weeks) (52 weeks)
Basic . . . . . . . . . . . . . . . . . . . . . . . . . . . . . . . . . . . . . . . . . . 124,342 129,851 135,836
Effect of dilutive securities:
Stock options, restricted stock and ESPP . . . . . . . . . . . . . . 2,409 3,103 3,701
Diluted. . . . . . . . . . . . . . . . . . . . . . . . . . . . . . . . . . . . . . . . . 126,751 132,954 139,537
Certain stock-based compensation awards representing 4.8 million, 1.1 million and 1.8 million shares ofcommon stock in 2008, 2007 and 2006, respectively, were not included in the calculation of diluted earnings percommon share because the inclusion of the awards would have been antidilutive for the periods presented.
Note 9 — Stockholders’ Equity
Share Purchase Programs
In June 2005, the Board of Directors approved a program authorizing the purchase of up to $270.0 million ofour common stock through 2006. In August 2006, the Board of Directors increased the amount remaining under theJune 2005 share purchase program by $141.7 million to bring the share purchase capacity under the June 2005 sharepurchase program to $250.0 million and extended the term of the June 2005 share purchase program to August 9,2007. During 2006, we purchased approximately 6.3 million shares of our common stock for $161.9 million. AtJanuary 28, 2007, the amount remaining under the June 2005 share purchase program was $89.9 million. FromJanuary 29, 2007 through June 4, 2007, we purchased 2.8 million shares of our common stock for $89.9 millionunder our $250.0 million share purchase program, completing the program.
In August 2007, the Board of Directors approved a new share purchase program authorizing the purchase of upto $300.0 million of our common stock through August 2, 2009. On August 19, 2007, we entered into a$225.0 million fixed dollar accelerated share repurchase, or “ASR,” agreement. The ASR agreement containedprovisions that established the minimum and maximum number of shares to be purchased during its term. Pursuantto the terms of the ASR agreement, on August 20, 2007, we paid $225.0 million to the ASR counterparty for thepurchase of shares and $0.2 million in related fees. The ASR agreement was funded with $125.0 million in existingcash and cash equivalents and $100.0 million in borrowings under our $350.0 million revolving credit facility. Wereceived 7.0 million shares of common stock under the ASR agreement which was completed on January 31, 2008.
During 2008, we purchased 2.3 million shares of our common stock for $50.0 million. As of February 1, 2009,the amount remaining under the August 2007 share purchase authorization was $25.0 million.
F-20
PetSmart, Inc. and Subsidiaries
Notes to Consolidated Financial Statements — (Continued)

Dividends
In 2008 and 2007, the Board of Directors declared the following dividends:
Date Declared
DividendAmount per
ShareStockholders of
Record Date Date Paid
2008:
March 25 . . . . . . . . . . . . . . . . . . . . . . . . $0.03 May 2, 2008 May 16, 2008
June 18 . . . . . . . . . . . . . . . . . . . . . . . . . $0.03 August 1, 2008 August 15, 2008September 24 . . . . . . . . . . . . . . . . . . . . . $0.03 October 31, 2008 November 14, 2008
December 17 . . . . . . . . . . . . . . . . . . . . . $0.03 January 30, 2009 February 13, 2009
2007:
March 27 . . . . . . . . . . . . . . . . . . . . . . . . $0.03 April 27, 2007 May 11, 2007
June 20 . . . . . . . . . . . . . . . . . . . . . . . . . $0.03 July 27, 2007 August 10, 2007
September 19 . . . . . . . . . . . . . . . . . . . . . $0.03 October 26, 2007 November 9, 2007
December 13 . . . . . . . . . . . . . . . . . . . . . $0.03 February 1, 2008 February 15, 2008
Note 10 — Employee Benefit Plans
We have a defined contribution plan pursuant to Section 401(k) of the Internal Revenue Code, or the “Plan.”The Plan covers substantially all employees that meet certain service requirements. We match employee contri-butions, up to specified percentages of those contributions, as approved by the Board of Directors. In addition,certain employees can elect to defer receipt of certain salary and cash bonus payments pursuant to our Non-Qualified Deferred Compensation Plan. We match employee contributions up to certain amounts as defined in theNon-Qualified Deferred Compensation Plan documents. During 2008, 2007 and 2006, we recognized expenserelated to matching contributions under these Plans of $4.9 million, $3.7 million, and $4.4 million, respectively.
Note 11 — Financing Arrangements and Lease Obligations
Short-term Debt and Letters of Credit
In August 2007, we replaced our existing $125.0 million credit facility with a $350.0 million revolving creditfacility that expires on August 15, 2012. Borrowings under the credit facility are subject to a borrowing base andbear interest, at our option, at a bank’s prime rate plus 0% to 0.25% or LIBOR plus 0.875% to 1.25%. We are subjectto fees payable to lenders each quarter at an annual rate of 0.20% of the unused amount of the credit facility. Thecredit facility also gives us the ability to issue letters of credit up to $100.0 million, which reduce the amountavailable under the credit facility. Letter of credit issuances under the credit facility are subject to interest payable tothe lenders and bear interest of 0.875% to 1.25% for standby letters of credit or 0.438% to 0.625% for commercialletters of credit.
As of February 1, 2009, we had no short-term debt and $91.3 million in letter of credit issuances outstandingunder our $350 million revolving credit facility. In accordance with Accounting Research Bulletin, or “ARB,”No. 43, “Restatement and Revisions of Accounting Research Bulletins,” any borrowings under the revolving creditfacility that we intend to repay within 12 months would be classified as short-term debt in the Consolidated BalanceSheets.
We also have a $70.0 million stand-alone letter of credit facility that expires on June 30, 2009. We are subjectto fees payable to the lenders each quarter at an annual rate of 0.20% of the average daily face amount of the lettersof credit outstanding during the preceding calendar quarter. In addition, we are required to maintain a deposit withthe lenders equal to the amount of outstanding letters of credit or we may use other approved investments ascollateral. If we use other approved investments as collateral, we must have an amount on deposit which, when
F-21
PetSmart, Inc. and Subsidiaries
Notes to Consolidated Financial Statements — (Continued)

multiplied by the advance rate of 85%, is equal to the amount of outstanding letters of credit under this stand-aloneletter of credit facility. As of February 1, 2009, we had no outstanding letters of credit under this stand-alone letter ofcredit facility, no restricted cash or short-term investments on deposit with the lenders, and no other investmentsrelated to this credit facility.
As of February 1, 2009, we were in compliance with the terms and covenants of our credit facility and letter ofcredit facility. The credit facility and letter of credit facility are secured by substantially all our personal propertyassets, our subsidiaries and certain real property.
Operating and Capital Leases
We lease substantially all our stores, distribution centers and corporate offices under noncancelable leases. Theterms of the store leases generally range from 10 to 15 years and typically allow us to renew for 2 to 3 additionalfive-year terms. Store leases, excluding renewal options, expire at various dates through 2025. Generally, the leasesrequire payment of property taxes, utilities, common area maintenance, insurance and, if annual sales at certainstores exceed specified amounts, provide for additional rents. We also lease certain equipment under operatingleases. Total operating lease expense incurred, net of sublease income, during 2008, 2007 and 2006 was$275.1 million, $245.9 million and $221.1 million, respectively. Additional rent included in those amounts wasnot material.
At February 1, 2009, the future minimum annual rental commitments under all noncancelable leases were asfollows (in thousands):
OperatingLeases
CapitalLeases
2009 . . . . . . . . . . . . . . . . . . . . . . . . . . . . . . . . . . . . . . . . . . . . . . . . . . . . $ 257,829 $ 88,990
2010 . . . . . . . . . . . . . . . . . . . . . . . . . . . . . . . . . . . . . . . . . . . . . . . . . . . . 277,837 96,971
2011 . . . . . . . . . . . . . . . . . . . . . . . . . . . . . . . . . . . . . . . . . . . . . . . . . . . . 271,615 98,263
2012 . . . . . . . . . . . . . . . . . . . . . . . . . . . . . . . . . . . . . . . . . . . . . . . . . . . . 268,928 99,316
2013 . . . . . . . . . . . . . . . . . . . . . . . . . . . . . . . . . . . . . . . . . . . . . . . . . . . . 257,164 98,718
Thereafter . . . . . . . . . . . . . . . . . . . . . . . . . . . . . . . . . . . . . . . . . . . . . . . . 970,522 481,065
Total minimum rental commitments . . . . . . . . . . . . . . . . . . . . . . . . . . . . . $2,303,895 963,323
Less: amounts representing interest . . . . . . . . . . . . . . . . . . . . . . . . . . . . . (377,330)
Present value of minimum lease payments . . . . . . . . . . . . . . . . . . . . . . . . 585,993
Less: current portion . . . . . . . . . . . . . . . . . . . . . . . . . . . . . . . . . . . . . . . . (32,233)
Long-term obligations . . . . . . . . . . . . . . . . . . . . . . . . . . . . . . . . . . . . . . . $ 553,760
The rental commitments schedule includes all locations for which we have the right to control the use of theproperty and includes open stores, closed stores, stores to be opened in the future, distribution centers and corporateoffices. We have recorded accrued rent of $1.4 million and $1.6 million in the Consolidated Balance Sheets as ofFebruary 1, 2009, and February 3, 2008, respectively. In addition to the commitments scheduled above, we haveexecuted lease agreements with total minimum lease payments of $154.8 million. The typical lease term for theseagreements is 10 to 15 years. We do not have the right to control the use of the property under these leases atFebruary 1, 2009.
F-22
PetSmart, Inc. and Subsidiaries
Notes to Consolidated Financial Statements — (Continued)

Future minimum annual rental commitments have not been reduced by amounts expected to be received fromsubtenants. At February 1, 2009, the future annual payments expected to be collected from subtenants are as follows(in thousands):
2009 . . . . . . . . . . . . . . . . . . . . . . . . . . . . . . . . . . . . . . . . . . . . . . . . . . . . . . . . . . . . . . . . $ 3,488
2010 . . . . . . . . . . . . . . . . . . . . . . . . . . . . . . . . . . . . . . . . . . . . . . . . . . . . . . . . . . . . . . . . 3,304
2011 . . . . . . . . . . . . . . . . . . . . . . . . . . . . . . . . . . . . . . . . . . . . . . . . . . . . . . . . . . . . . . . . 3,306
2012 . . . . . . . . . . . . . . . . . . . . . . . . . . . . . . . . . . . . . . . . . . . . . . . . . . . . . . . . . . . . . . . . 2,602
2013 . . . . . . . . . . . . . . . . . . . . . . . . . . . . . . . . . . . . . . . . . . . . . . . . . . . . . . . . . . . . . . . . 2,128
Thereafter . . . . . . . . . . . . . . . . . . . . . . . . . . . . . . . . . . . . . . . . . . . . . . . . . . . . . . . . . . . . 4,688
$19,516
Note 12 — Litigation and Settlements
In October 2006, two lawsuits were filed against us in California State Court on behalf of putative classes of currentand former California employees. The first suit, Sorenson v. PetSmart, was filed on October 3, 2006. The plaintiff, aformer dog groomer, alleges that she and other non-exempt employees failed to receive their meal and rest breaks asrequired by law. The second suit, Enabnit v. PetSmart, was filed on October 12, 2006, and alleges meal and rest periodviolations and that employee paychecks were not compliant with the California Labor Code. The plaintiff seekscompensatory damages, penalties under the California Labor Code, restitution, attorney’s fees, costs and prejudgmentinterest. In November 2006, we removed both actions to the United States District Court for the Eastern District ofCalifornia. The parties have reached an agreement in principle to settle both of these matters for an amount that will notbe material to our consolidated financial statements and has been accrued for. The Sorenson settlement was preliminarilyapproved by the court on August 5, 2008, while the Enabnit settlement was preliminarily approved on December 8, 2008.
On January 12, 2009, a former groomer filed a lawsuit on behalf of herself and a putative class of current andformer groomers in California State Court entitled Langton v. PetSmart. The plaintiff alleges that she and other non-exempt groomers did not receive payment for all hours worked, did not receive meal and rest breaks, did not receiveall wages due upon termination, did not receive accurate wage statements as required by law, and were not providedwith necessary tools and equipment. The plaintiff seeks compensatory damages, penalties under the CaliforniaLabor Code, restitution, attorney’s fees and costs, and prejudgment interest. On February 17, 2009, we removed theaction to the United States District Court for the Central District of California.
We are also a party to several lawsuits arising from the pet food recalls announced by several manufacturersbeginning in March 2007. The named plaintiffs sued the major pet food manufacturers and retailers claiming that theirpets suffered injury and/or death as a result of consuming allegedly contaminated pet food and pet snack products.
Bruski v. Nutro Products, et al., USDC, N.D. IL (filed 3/23/07)Rozman v. Menu Foods, et al., USDC, MN (filed 4/9/07)Ford v. Menu Foods, et al., USDC, S.D. CA (filed 4/23/07)Wahl, et al. v. Wal-Mart Stores Inc., et al., USDC, C.D. CA (filed 4/10/07)Demith v. Nestle, et al., USDC, N.D. IL (filed 4/23/07)Thompkins v. Menu Foods, et al., USDC, CO (filed 4/11/07)McBain v. Menu Foods, et al., Judicial Centre of Regina, Canada (filed 7/11/07)Dayman v. Hills Pet Nutrition Inc., et al. Ontario Superior Court of Justice (filed 8/8/07)Esau v. Menu Foods, et al., Supreme Court of Newfoundland and Labrador (filed 9/5/07)Ewasew v. MenuFoods, et al., Supreme Court of British Colombia (filed 3/23/07)Silva v. Menu foods, et al., Canada Province of Manitoba (filed 3/30/07)Powell v. Menu Foods, et al., Ontario Superior Court of Justice (filed 3/28/07)
F-23
PetSmart, Inc. and Subsidiaries
Notes to Consolidated Financial Statements — (Continued)

By order dated June 28, 2007, the Bruski, Rozman, Ford, Wahl, Demith and Thompkins cases were transferredto the U.S. District Court for the District of New Jersey and consolidated with other pet food class actions under thefederal rules for multi-district litigation (In re: Pet Food Product Liability Litigation, Civil No. 07-2867). TheCanadian cases were not consolidated.
On May 21, 2008, the parties to the U.S. lawsuits comprising the In re: Pet Food Product Liability Litigationand the Canadian cases jointly submitted a comprehensive settlement arrangement for court approval. Preliminarycourt approval was received from the U.S. District Court on May 3, 2008, and from all of the Canadian courts as ofJuly 8, 2008. On October 14, 2008, the U.S. court approved the settlement, and the Canadian courts gave finalapproval on November 3, 2008.
Two different groups of objectors filed notices of appeal with respect to the U.S. District Court’s approval ofthe U.S. settlement. Upon expiration of the prescribed appeal process, these cases should be resolved, and wecontinue to believe they will not have a material adverse impact on our consolidated financial statements.
There have been no appeals filed in Canada.
We are involved in the defense of various other legal proceedings that we do not believe are material to ourconsolidated financial statements.
Note 13 — Commitments and Contingencies
Letters of Credit
As of February 1, 2009, a total of $91.3 million was outstanding under letters of credit to guarantee insurancepolicies, capital lease agreements and utilities.
Advertising Purchase Commitments
We have advertising commitments of approximately $20.4 million in 2009.
Product Purchase Commitments
On May 31, 2007, we entered into a three-year product purchase agreement with a vendor. During the thirteenweeks ended February 1, 2009, we paid an immaterial amount to settle all future purchase obligations under theagreement.
Note 14 — Stock Incentive Plans
We have several stock incentive plans, including plans for stock options, restricted stock and employee stockpurchases. Shares issued under our stock incentive plans are issued from new shares, rather than treasury stock.During 2006, our stockholders approved the 2006 Equity Incentive Plan which combined the remaining shares fromthe 2003 Equity Incentive Plan and the 1997 Equity Incentive Plan and included an additional 2.5 million shares ofcommon stock authorized for issuance. We also have stock options outstanding under our 1996 Non-EmployeeDirectors Equity Plan, which expired on May 11, 2002. No further stock options may be granted under the 1996Non-Employee Directors Equity Plan.
Stock Options
At February 1, 2009, stock option grants representing 7.1 million shares of common stock were outstandingunder all of the stock option plans, and 6.3 million of additional stock options or awards may be issued under the2006 Equity Incentive Plan. These grants are made to employees, including officers and our Directors, at the fairmarket value on the date of the grant.
F-24
PetSmart, Inc. and Subsidiaries
Notes to Consolidated Financial Statements — (Continued)

Activity in all of our stock option plans is as follows (in thousands, except per share data):
SharesWeighted-Average
Exercise Price
Weighted-AverageRemaining
Contractual TermAggregate
Intrinsic Value
2006 (52 weeks)
Outstanding at beginning of year . . . . 8,784 $15.27
Granted . . . . . . . . . . . . . . . . . . . . . . . 1,014 $24.33
Exercised. . . . . . . . . . . . . . . . . . . . . . (1,919) $12.36 $ 31,061
Forfeited/cancelled . . . . . . . . . . . . . . . (552) $25.19
Outstanding at end of year . . . . . . . . . 7,327 $16.54 5.45 $101,603
Vested and expected to vest at end ofyear . . . . . . . . . . . . . . . . . . . . . . . . 7,024 $16.15 5.39 $100,180
Exercisable at end of year . . . . . . . . . 5,354 $13.21 4.93 $ 92,051
SharesWeighted-Average
Exercise Price
Weighted-AverageRemaining
Contractual TermAggregate
Intrinsic Value
2007 (53 weeks)
Outstanding at beginning of year . . . . 7,327 $16.54
Granted . . . . . . . . . . . . . . . . . . . . . . . 993 $31.38
Exercised. . . . . . . . . . . . . . . . . . . . . . (1,665) $14.23 $30,623
Forfeited/cancelled . . . . . . . . . . . . . . . (333) $23.91
Outstanding at end of year . . . . . . . . . 6,322 $19.10 4.80 $42,282
Vested and expected to vest at end ofyear . . . . . . . . . . . . . . . . . . . . . . . . 5,674 $18.02 4.68 $42,268
Exercisable at end of year . . . . . . . . . 4,613 $15.53 4.41 $42,250
SharesWeighted-Average
Exercise Price
Weighted-AverageRemaining
Contractual TermAggregate
Intrinsic Value
2008 (52 weeks)
Outstanding at beginning of year . . . . . 6,322 $19.10
Granted . . . . . . . . . . . . . . . . . . . . . . . 1,816 $19.10
Exercised . . . . . . . . . . . . . . . . . . . . . . (755) $10.42 $28,316
Forfeited/cancelled . . . . . . . . . . . . . . . (303) $25.12
Outstanding at end of year . . . . . . . . . 7,080 $19.77 4.56 $19,736
Vested and expected to vest at end ofyear . . . . . . . . . . . . . . . . . . . . . . . . 6,367 $19.35 4.45 $19,732
Exercisable at end of year . . . . . . . . . . 4,238 $17.60 3.84 $19,719
Restricted Stock
We may grant restricted stock under the 2006 Equity Incentive Plan. Under the terms of the plan, employeesmay be awarded shares of our common stock, subject to approval by the Board of Directors. The employee may be
F-25
PetSmart, Inc. and Subsidiaries
Notes to Consolidated Financial Statements — (Continued)

required to pay par value for the shares depending on their length of service. The shares of common stock awardedunder the plan are subject to a reacquisition right held by us. In the event that the award recipient’s employment by,or service to, us is terminated for any reason, we are entitled to simultaneously and automatically reacquire for noconsideration all of the unvested shares of restricted common stock previously awarded to the recipient.
Activity in our restricted stock plan is as follows (in thousands):
Shares
Weighted-AverageGrant DateFair Value Shares
Weighted-AverageGrant DateFair Value Shares
Weighted- AverageGrant DateFair Value
2008 (52 weeks) 2007 (53 weeks) 2006 (52 weeks)
Nonvested at beginning ofyear . . . . . . . . . . . . . . . . . . . . 2,391 $27.92 2,380 $24.33 1,800 $24.41
Granted . . . . . . . . . . . . . . . . . . . 978 $19.33 886 $31.39 1,000 $24.47
Vested . . . . . . . . . . . . . . . . . . . . (367) $24.85 (448) $16.15 (7) $25.66
Forfeited . . . . . . . . . . . . . . . . . . (317) $25.48 (427) $27.44 (413) $25.01
Nonvested at end of year . . . . . . 2,685 $25.50 2,391 $27.92 2,380 $24.33
The total fair value of restricted stock which vested during 2008 and 2007 was $7.2 million and $14.1 million,respectively. 2006 was the first year in which restricted stock vested, and was not material.
Employee Stock Purchase Plan
We have an Employee Stock Purchase Plan, or ESPP, that allows essentially all employees who meet certainservice requirements to purchase our common stock on semi-annual offering dates at a discount. Prior to February 2,2009, the ESPP allowed employees to purchase shares at 85% of the fair market value of the shares on the offering dateor, if lower, at 85% of the fair market value of the shares on the purchase date. Effective February 2, 2009, the discountrate changed to 5%, allowing participants to purchase our common stock on semi-annual offering dates at 95% of thefair market value of the shares on the purchase date. A maximum of 4.0 million shares is authorized for purchase untilthe ESPP plan termination date of July 31, 2012. Share purchases and proceeds were as follows (in thousands):
2008 2007 2006(52 weeks) (53 weeks) (52 weeks)
Shares purchased . . . . . . . . . . . . . . . . . . . . . . . . . . . . . . . . . . . . 338 246 216
Aggregate proceeds . . . . . . . . . . . . . . . . . . . . . . . . . . . . . . . . . . $5,918 $5,368 $4,334
2009 Stock-based Incentive Programs
In January 2009, the Board of Directors approved two new stock-based incentive programs for 2009 which willreplace the existing restricted stock program. The new stock-based incentive programs include the 2009 Perfor-mance Share Unit Program and Management Equity Units.
The 2009 Performance Share Unit Program, or the “Program,” provides for the issuance of performance shareunits under the 2006 Equity Incentive Plan to executive officers and certain other members of our management teambased on the established end-of-year net cash threshold for 2009. The actual number of performance share unitsawarded to each participant will be set at a minimum threshold of 50% of his or her target number of performanceshare units, regardless of performance results, and can increase up to 150% based upon performance results. TheProgram initially provides for up to 567,000 of targeted performance share units with a fair value of approximately$9.5 million. The performance share units will be awarded upon certification by the Board of Directors of actualperformance achievement following our 2009 year-end. Thereafter, these awarded performance share units are subjectto time-based vesting and will cliff vest on the third anniversary of the grant date. Our performance against the definedperformance threshold will be evaluated on a quarterly basis throughout 2009 and share-based compensation expense
F-26
PetSmart, Inc. and Subsidiaries
Notes to Consolidated Financial Statements — (Continued)

recognized over the requisite service period that runs from March 9, 2009, the grant date of the award, throughMarch 9, 2012, pursuant to the guidance in SFAS No. 123(R). If we achieve 100% of the defined performancethreshold, we would expect to recognize approximately $2.2 million as share-based compensation expense in 2009.
Beginning in 2009, certain other members of our management will receive Management Equity Units or“MEUs.” The value of one MEU is equal to the value of one share of our common stock and cliff vests on the thirdanniversary of the grant date. The payout value, of the vested MEU grant, will be determined using our closing stockprice on the vest date and will be paid out in cash. On March 9, 2009, we granted 281,000 MEUs, with a fair value ofapproximately $4.7 million. Share-based compensation expense for MEUs will be recognized over the requisiteservice period and evaluated quarterly based upon the current market price of our common stock, pursuant to theguidance in SFAS No. 123(R).
Note 15 — Stock-Based Compensation
Stock-based compensation charged against operating, general and administrative expense and the total incometax benefit recognized in the Consolidated Statement of Operations and Comprehensive Income were as follows(in thousands):
2008 2007 2006(52 weeks) (53 weeks) (52 weeks)
Stock options expense . . . . . . . . . . . . . . . . . . . . . . . . . . . . . . . . $ 7,959 $ 3,408 $ 8,625
Restricted stock expense . . . . . . . . . . . . . . . . . . . . . . . . . . . . . . 14,227 13,196 9,384
Employee stock purchase plan expense . . . . . . . . . . . . . . . . . . . 2,115 1,729 1,311
Total stock-based compensation cost. . . . . . . . . . . . . . . . . . . . $24,301 $18,333 $19,320
Tax benefit . . . . . . . . . . . . . . . . . . . . . . . . . . . . . . . . . . . . . . . . $ 8,304 $ 6,168 $ 6,330
At February 1, 2009, the total unrecognized stock options expense and restricted stock expense, net ofestimated forfeitures, was $36.4 million and is expected to be recognized over a weighted average period of2.1 years.
We estimated the fair value of stock options issued after January 30, 2005 using a lattice option pricing model.Expected volatilities are based on implied volatilities from traded call options on our stock, historical volatility ofour stock and other factors. We use historical data to estimate option exercises and employee terminations within thevaluation model. The expected term of options granted is derived from the output of the option valuation model andrepresents the period of time we expect options granted to be outstanding. The risk-free rates for the periods withinthe contractual life of the option are based on the monthly U.S. Treasury yield curve in effect at the time of theoption grant using the expected life of the option. Stock options are amortized straight-line over the vesting period
F-27
PetSmart, Inc. and Subsidiaries
Notes to Consolidated Financial Statements — (Continued)

net of estimated forfeitures by a charge to income. Actual values of grants could vary significantly from the resultsof the calculations. The following assumptions were used to value grants:
2008 2007 2006(52 weeks) (53 weeks) (52 weeks)
Dividend yield. . . . . . . . . . . . . . . . . . . . . . . . . . . . . . . . . . . 0.42% 0.42% 0.48%
Expected volatility. . . . . . . . . . . . . . . . . . . . . . . . . . . . . . . . 36.2% 32.0% 34.6%
Risk-free interest rate . . . . . . . . . . . . . . . . . . . . . . . . . . . . . 1.96% 4.83% 4.64%
Forfeiture rate . . . . . . . . . . . . . . . . . . . . . . . . . . . . . . . . . . . 15.4% 16.0% 14.7%
Expected lives . . . . . . . . . . . . . . . . . . . . . . . . . . . . . . . . . . . 5.2 years 5.2 years 4.6 years
Vesting periods . . . . . . . . . . . . . . . . . . . . . . . . . . . . . . . . . . 4.0 years 4.0 years 4.0 years
Term . . . . . . . . . . . . . . . . . . . . . . . . . . . . . . . . . . . . . . . . . . 7.0 years 7.0 years 7.0 years
Weighted average fair value . . . . . . . . . . . . . . . . . . . . . . . . . $ 6.44 $ 10.86 $ 8.63
Restricted stock expense, which reflects the fair market value on the date of the grant net of estimatedforfeitures and cliff vests after four years, is being amortized ratably by a charge to income over the four-year termof the restricted stock awards.
We estimated the fair value of employee stock plan purchases using the Black-Scholes option pricing model.The valuation model requires the input of subjective assumptions including the expected volatility and lives. Actualvalues of purchases could vary significantly from the results of the calculations. Employee stock plan purchasesgenerally vest over a six-month period and have no expiration. The following assumptions were used to valuepurchases:
2008 2007 2006(52 weeks) (53 weeks) (52 weeks)
Dividend yield . . . . . . . . . . . . . . . . . . . . . . . . . . . . . . . . . . . . . 0.52% 0.37% 0.48%
Expected volatility . . . . . . . . . . . . . . . . . . . . . . . . . . . . . . . . . . 43.4% 22.2% 29.3%Risk-free interest rate . . . . . . . . . . . . . . . . . . . . . . . . . . . . . . . . 1.97% 5.06% 5.15%
Expected lives . . . . . . . . . . . . . . . . . . . . . . . . . . . . . . . . . . . . . 0.5 years 0.5 years 0.5 years
Note 16 — Supplemental Schedule of Cash Flows
Supplemental cash flow information for 2008, 2007 and 2006 was as follows (in thousands):
2008 2007 2006(52 weeks) (53 weeks) (52 weeks)
Interest paid . . . . . . . . . . . . . . . . . . . . . . . . . . . . . . . . . . . . . . . $55,937 $ 50,812 $ 37,913
Income taxes paid, net of refunds . . . . . . . . . . . . . . . . . . . . . . . $92,786 $171,303 $125,468
Assets acquired using capital lease obligations. . . . . . . . . . . . . . $86,083 $100,506 $ 98,628
Accruals and accounts payable for capital expenditures . . . . . . . $19,770 $ 27,560 $ 32,903
Dividends declared but unpaid . . . . . . . . . . . . . . . . . . . . . . . . . $ 3,816 $ 3,837 $ 4,064
Note 17 — Acquisition of Store Locations in Canada
We completed the purchase of 19 store locations which added 18 net new stores in Canada on May 31, 2007,for approximately $37.0 million after all adjustments. The acquisition has been accounted for pursuant toSFAS No. 141, “Business Combinations,” and accordingly, the operating results of the acquired stores are includedin the consolidated financial statements from the date of acquisition. In connection with the acquisition, we initiallyrecorded $27.5 million of goodwill. During the thirteen weeks ended October 28, 2007, we decreased ourpreliminary purchase price by $0.5 million as a result of adjustments to inventory. The purchase price allocation
F-28
PetSmart, Inc. and Subsidiaries
Notes to Consolidated Financial Statements — (Continued)

was finalized during the fourteen weeks ended February 3, 2008, with further adjustments to the carrying values ofassets and liabilities acquired, the useful lives of intangible assets and the residual amount allocated to goodwill.The impact of the acquisition on our results of operations is immaterial, and the goodwill is expected to bedeductible for tax purposes.
Note 18 — Discontinuation of Equine Product Line
On February 28, 2007, we announced plans to exit our equine product line, including the sale or discon-tinuation of StateLineTack.com and our equine catalog, and the sale of a warehouse, call center and store facility inBrockport, New York.
On April 29, 2007, we entered into an agreement to sell a portion of the equine product line, including the StateLine Tack brand, certain inventory, customer lists and certain other assets to a third-party. The gain recognized wasnot material.
During the thirteen weeks ended April 29, 2007, we performed an impairment analysis on the remaining assetssupporting the equine product line, including the Brockport, New York facility, in accordance with SFAS No. 144,“Accounting for the Impairment or Disposal of Long-Lived Assets,” that indicated no impairment existed. Weaccelerated the depreciation on these assets, and they were fully depreciated to their estimated salvage value as ofFebruary 3, 2008.
We also recognized a charge to income to reduce the remaining equine inventory to the lower of cost or marketvalue and recorded operating expenses related to the exit of the equine product line, remerchandising of the storespace previously used for equine inventory and severance costs in accordance with SFAS No. 146, “Accounting forCosts Associated with Exit or Disposal Activities.” The net effect of the gain on sale of the assets, inventoryvaluation adjustments, accelerated depreciation, severance and operating expenses was an after-tax loss of$9.8 million for 2007. The inventory valuation adjustments and accelerated depreciation of certain assets wererecorded in cost of sales, and the operating expenses, severance and accelerated depreciation on certain assets wererecorded in operating, general and administrative expenses in the Consolidated Statements of Operations andComprehensive Income.
Note 19 — Selected Quarterly Financial Data (Unaudited)
Summarized quarterly financial information for 2008 and 2007 is as follows:
Year Ended February 1, 2009 (52 weeks)First
QuarterSecondQuarter
ThirdQuarter
FourthQuarter
(13 weeks) (13 weeks) (13 weeks) (13 weeks)(In thousands, except per share data)
Net sales . . . . . . . . . . . . . . . . . . . . . . . . . . $1,212,931 $1,241,948 $1,251,144 $1,359,270
Gross profit . . . . . . . . . . . . . . . . . . . . . . . . $ 356,368 $ 366,406 $ 357,696 $ 414,963
Operating income . . . . . . . . . . . . . . . . . . . . $ 80,269 $ 75,399 $ 72,125 $ 142,061
Income before income tax expense andequity in income from investee . . . . . . . . $ 66,527 $ 60,188 $ 57,356 $ 127,026
Net income . . . . . . . . . . . . . . . . . . . . . . . . $ 41,211 $ 37,248 $ 35,823 $ 78,388
Earnings per common share:
Basic . . . . . . . . . . . . . . . . . . . . . . . . . . . $ 0.33 $ 0.30 $ 0.29 $ 0.63
Diluted. . . . . . . . . . . . . . . . . . . . . . . . . . $ 0.32 $ 0.30 $ 0.28 $ 0.62
Weighted average shares outstanding:
Basic . . . . . . . . . . . . . . . . . . . . . . . . . . . 125,050 123,751 124,122 124,444
Diluted. . . . . . . . . . . . . . . . . . . . . . . . . . 127,419 126,210 126,795 126,783
F-29
PetSmart, Inc. and Subsidiaries
Notes to Consolidated Financial Statements — (Continued)

Year Ended February 3, 2008 (53 weeks)First
Quarter(1, 2)Second
Quarter(1, 2)Third
Quarter(1, 2)Fourth
Quarter(1, 2, 3)(13 weeks) (13 weeks) (13 weeks) (14 weeks)
(In thousands, except per share data)
Net sales . . . . . . . . . . . . . . . . . . . . . . . . $1,111,625 $1,116,681 $1,115,916 $1,328,434Gross profit . . . . . . . . . . . . . . . . . . . . . . $ 338,479 $ 346,323 $ 331,529 $ 420,490
Operating income . . . . . . . . . . . . . . . . . $ 76,585 $ 84,736 $ 59,609 $ 130,583
Income before income tax expense andequity in income from investee . . . . . . $ 163,123 $ 76,004 $ 46,863 $ 116,203
Net income . . . . . . . . . . . . . . . . . . . . . . $ 106,707 $ 47,125 $ 29,452 $ 75,400
Earnings per common share:
Basic . . . . . . . . . . . . . . . . . . . . . . . . . $ 0.80 $ 0.36 $ 0.23 $ 0.60
Diluted . . . . . . . . . . . . . . . . . . . . . . . $ 0.78 $ 0.35 $ 0.23 $ 0.59
Weighted average shares outstanding:
Basic . . . . . . . . . . . . . . . . . . . . . . . . . 133,316 132,262 127,431 126,134
Diluted . . . . . . . . . . . . . . . . . . . . . . . 136,672 135,514 130,528 128,867
(1) The first quarter of 2007 included a pre-tax gain of $95.4 million, which is reflected in income before incometax expense and equity in income from investee and an after-tax gain of $64.3 million, which is reflected in netincome for the sale of non-voting shares in MMIH. During the second quarter of 2007, a new agreement withMMIH was finalized which impacted license fees and utility reimbursements reflected in gross profit.
(2) Our decision to exit our equine product line during the first quarter of 2007 impacted operating income for thefull year as follows: $6.3 million in the first quarter, $3.6 million in the second quarter, $4.7 million in the thirdquarter, and $1.4 million in the fourth quarter.
(3) The estimated impact of the additional week in the fourth quarter of 2007 was: net sales, $89.7 million; grossprofit, $34.4 million; operating income, $16.0 million; income before income tax expense and equity in incomefrom investee, $16.0 million; and net income, $9.8 million.
F-30
PetSmart, Inc. and Subsidiaries
Notes to Consolidated Financial Statements — (Continued)

REPORT OF INDEPENDENT REGISTERED PUBLIC ACCOUNTING FIRM
To the Board of Directors and Stockholders ofPetSmart, Inc.Phoenix, Arizona
We have audited the consolidated financial statements of PetSmart, Inc. and subsidiaries (the “Company”) asof February 1, 2009 and February 3, 2008, and for each of the three years in the period ended February 1, 2009, andthe Company’s internal control over financial reporting as of February 1, 2009, and have issued our reports thereondated March 26, 2009; such reports are included elsewhere in this Form 10-K. Our audits also included theconsolidated financial statement schedule of the Company listed in Item 15. This consolidated financial statementschedule is the responsibility of the Company’s management. Our responsibility is to express an opinion based onour audits. In our opinion, such consolidated financial statement schedule, when considered in relation to the basicconsolidated financial statements taken as a whole, presents fairly, in all material respects, the information set forththerein.
/s/ DELOITTE & TOUCHE LLP
Phoenix, ArizonaMarch 26, 2009
A-1

SCHEDULE II
PetSmart, Inc. and Subsidiaries
Valuation and Qualifying Accounts
Description
Balance atBeginningof Period
Charged toExpense Deductions
Balance atEnd ofPeriod
(In thousands)
Valuation reserves deducted in the Consolidated BalanceSheets from the asset to which it applies:
Merchandise inventories:
Lower of cost or market
2006. . . . . . . . . . . . . . . . . . . . . . . . . . . . . . . . . . . . . $8,534 $ 1,716 $ (1,107) $9,143
2007. . . . . . . . . . . . . . . . . . . . . . . . . . . . . . . . . . . . . $9,143 $ 1,117 $ (4,392) $5,868
2008. . . . . . . . . . . . . . . . . . . . . . . . . . . . . . . . . . . . . $5,868 $ 4,736 $ (2,827) $7,777
Shrink
2006. . . . . . . . . . . . . . . . . . . . . . . . . . . . . . . . . . . . . $5,731 $25,881 $(24,017) $7,595
2007. . . . . . . . . . . . . . . . . . . . . . . . . . . . . . . . . . . . . $7,595 $30,188 $(30,359) $7,424
2008. . . . . . . . . . . . . . . . . . . . . . . . . . . . . . . . . . . . . $7,424 $26,430 $(27,032) $6,822
A-2

APPENDIX E
PetSmart, Inc.
ANNUAL REPORT ON FORM 10-K
EXHIBIT INDEX
ExhibitNumber Exhibit Description Form File No. Exhibit Filing Date
FiledHerewith
Incorporated By Reference
3.1 Restated Certificate of Incorporation ofPetSmart
S-1 33-63912 3.3(i) 6/4/1993
3.2 Certificate of Amendment of RestatedCertificate of Incorporation ofPetSmart
10-Q 0-21888 3.5 9/7/2005
3.3 Form of Certificate of Designation ofSeries A Junior Participating PreferredStock of PetSmart
8-K 0-21888 99.3 8/21/1997
3.4 Bylaws of PetSmart, as amended 10-K 0-21888 3.4 3/28/2007
4.1 Reference is made to Exhibit 3.1through 3.4
4.2 Form of Stock Certificate S-1 33-63912 4.4 6/4/1993
10.1† Form of Indemnity Agreementbetween PetSmart and its Directorsand Officers
S-1 33-63912 10.1 6/4/1993
10.2† 2003 Equity Incentive Plan ProxyStatement
0-21888 Appendix B 5/12/2003
10.3† 1996 Non-Employee Directors’ EquityPlan, as amended
S-8 333-58605 10.5 7/7/1998
10.4† 1997 Equity Incentive Plan, asamended
10-K 0-21888 10.4 4/18/2003
10.5† 2002 Employee Stock Purchase Plan,as amended
10-K
10.6† Non-Qualified 2005 DeferredCompensation Plan, as amended
10-Q 0-21888 10.10 11/30/2007
10.7† Executive Short-Term Incentive Plan,as amended
ProxyStatement
0-21888 Appendix A 5/7/2007
10.8† Amended and Restated EmploymentAgreement, between PetSmart andPhilip L. Francis, Chairman of theBoard of Directors and ChiefExecutive Officer
10-Q 0-21888 10.12 11/26/2008
10.9† Amended and Restated EmploymentAgreement, between PetSmart andRobert F. Moran, President and ChiefOperating Officer
10-Q 0-21888 10.13 11/26/2008
10.10† Form of Performance Share Unit GrantNotice and Performance Share UnitAgreement
8-K 0-21888 10.1 2/19/2009
10.11† Form of Offer Letter betweenPetSmart and executive officers
10-K 0-21888 10.15 4/18/2003
E-1

ExhibitNumber Exhibit Description Form File No. Exhibit Filing Date
FiledHerewith
Incorporated By Reference
10.12† Amended and Restated ExecutiveChange in Control and SeveranceBenefit Plan
10-Q 0-21888 10.16 11/26/2008
10.13† Forms of Stock Award GrantAgreements for the 2003 EquityIncentive Plan and 1997 EquityIncentive Plan
10-Q 0-21888 10.17 9/8/2004
10.14† Forms of Revised Stock Option GrantAgreements for the 2003 EquityIncentive Plan and 1997 EquityIncentive Plan
8-K 0-21888 10.20 2/3/2006
10.15† Forms of Revised Restricted StockGrant Agreements for the 2003 EquityIncentive Plan and 1997 EquityIncentive Plan
8-K 0-21888 10.19 2/7/2005
10.16† 2006 Equity Incentive Plan 10-K 0-21888 10.21 3/28/2007
10.17† Form of Nonstatutory StockAgreement for 2006 Equity IncentivePlan
8-K 0-21888 10.2 6/28/2006
10.18† Form of Restricted Stock Agreementfor 2006 Equity Incentive Plan
8-K 0-21888 10.3 6/28/2006
10.19† Offer letter to Lawrence “Chip”Molloy dated August 23, 2007
8-K 0-21888 10.27 9/7/2007
10.20 Letter of Credit Agreement, datedJune 30, 2006, between PetSmart, Inc.and Bank of America, N.A.
8-K 0-21888 10.21 7/3/2006
10.21 Credit Agreement dated as ofAugust 15, 2007 among PetSmart,Inc., PetSmart Store Support Group,Inc., the Lenders Party thereto, Bankof America, N.A., as issuing bank,administrative agent and collateralagent, and Banc of America SecuritiesLLC, as sole arranger and solebookrunner.
8-K 0-21888 10.2 8/17/2007
23.1 Consent of Deloitte & Touche LLP,Independent Registered PublicAccounting Firm
X
31.1 Certification of Chief ExecutiveOfficer as required by Rule 13a-14(a)of the Securities Exchange Act of1934, as amended
X
31.2 Certification of Chief Financial Officeras required by Rule 13a-14(a) of theSecurities Exchange Act of 1934, asamended
X
E-2

ExhibitNumber Exhibit Description Form File No. Exhibit Filing Date
FiledHerewith
Incorporated By Reference
32.1* Certification of Chief ExecutiveOfficer as required by Rule 13a-14(b)of the Securities Exchange Act of1934, as amended
X
32.2* Certification of Chief Financial Officeras required by Rule 13a-14(b) of theSecurities Exchange Act of 1934, asamended
X
† Compensation plans or arrangements in which directors or executive officers are eligible to participate.
* The certifications attached as Exhibit 32.1 and Exhibit 32.2 accompany this Annual Report on Form 10-K, are notdeemed filed with the Securities and Exchange Commission and are not to be incorporated by reference into anyfiling of PetSmart, Inc., under the Securities Act of 1933, as amended, or the Securities Exchange Act of 1934, asamended, whether made before or after the date of this Annual Report on Form 10-K, irrespective of any generalincorporation language contained in such filing.
E-3

(This page intentionally left blank)

Financial Highlights
2 0 0 8 2 0 0 7 2 0 0 6
Total Results (in thousands, except margins and per-share amounts)
Net Sales $ 5,065,293 $ 4,672,656 $ 4,233,857
Services Sales $ 526,730 $ 454,940 $ 373,681
Gross Margin 29.5 30.7 30.9
Net Income $ 192,670 $ 258,684 $ 185,069
Earnings Per Share $ 1.52 $ 1.95 $ 1.33
Operating Cash Flow $ 420,700 $ 332,716 $ 289,291
Other Highlights
Total Stores 1,112
Total Employees 46,100
Total 2008 in-store Pet Adoptions 392,175
Total in-store Pet Adoptions since 1994 3,653,784
PetSmart, Inc. is the largest specialty pet retailer of services and solutions for the lifetime needs of pets. The company operates more than 1,112
pet stores in the United States and Canada, 142 in-store PetSmart PetsHotels® cat and dog boarding facilities, and is a leading online provider of
pet supplies and pet care information (www.petsmart.com). PetSmart provides a broad range of competitively priced pet food and pet products;
and offers complete pet training, pet grooming, pet boarding, doggie day camp and pet adoption services. Since 1994, PetSmart Charities, Inc.,
an independent 501(c)(3) non-profit animal welfare organization, has funded more than $87 million in grants and programs benefiting animal
welfare organizations and, through its in-store pet adoption programs, has helped save the lives of more than 3.5 million pets.
% % %
Directors and Officers Stockholder Information
Directors
Lawrence A. Del SantoRetired President andChief Executive OfficerVons Companies, Inc.
Rita V. Foley Retired PresidentConsumer Packaging GroupSenior Vice PresidentMeadWestvaco Corporation
Philip L. FrancisChairman and ChiefExecutive OfficerPetSmart, Inc.
Rakesh GangwalFormer Chairman, Presidentand Chief Executive OfficerWorldspan Technologies, Inc.Former President and Chief Executive Officer US Airways Group
Joseph S. Hardin, Jr.Retired President and Chief Executive OfficerKinko’s, Inc.
Gregory P. JosefowiczRetired Chairman, Presidentand Chief Executive OfficerBorders Group, Inc.
Amin I. KhalifaPrincipalKhalifa ManagementConsulting
Richard K. LochridgePresidentLochridge & Company, Inc.
Barbara A. MunderExecutive Director Institutional Investor Institute& Euromoney InstitutionalInvestor PLC
Thomas G. StembergManaging General PartnerHighland Capital Consumer FundChairman EmeritusStaples, Inc.
Executive Officers
Philip L. FrancisChairman and ChiefExecutive Officer
Robert F. MoranPresident and ChiefOperating Officer
Lawrence P. MolloySenior Vice President, Chief Financial Officer
Donald E. BeaverSenior Vice President, Chief Information Officer
Scott A. CrozierSenior Vice President, General Counsel, Secretary and ChiefCompliance Officer
Kenneth T. HallSenior Vice President
David K. LenhardtSenior Vice President, Store Operations andHuman Resources
Mary L. MillerSenior Vice President, Chief Marketing Officer
Joseph D. O’LearySenior Vice President,Merchandising and Supply Chain
Jaye D. PerriconeSenior Vice President, Real Estate andDevelopment
Neil A. StaceySenior Vice President,Human Resources
Corporate Information
Corporate Offices19601 North 27th Avenue Phoenix, AZ 85027 (623) 580-6100
Transfer Agent and Registrar Wells Fargo Bank, N.A. Wells Fargo Shareowner Services P.O. Box 64854 St. Paul, MN 55164-0854 www.wellsfargo.com/com/shareowner_services
Independent AccountantsDeloitte & Touche LLP 2901 North Central Avenue Suite 1200 Phoenix, AZ 85012
Stockholder InquiriesPetSmart Investor Relations 19601 North 27th Avenue Phoenix, AZ 85027 (623) 587-2025 [email protected]
PetSmart Common StockThe company’s common stockis traded on the NASDAQGlobal Select Market underthe symbol “PETM.”
PetSmart Websitewww.PetSmart.com

PE
TS
MA
RT
,I
NC
.2
00
8
AN
NU
AL
R
EP
OR
T
Our Promise
2008 Annual Report
19601 North 27th Avenue Phoenix, AZ 85027(623) 580-6100
www.PetSmart.com
©2009 PetSmart Store Support Group, Inc. All rights reserved.