bpr at pt sarandi – process innovation at a manufacturing...
TRANSCRIPT


BPR at PT Sarandi – Process innovation at a manufacturing company in Indonesia
G.J. van Viegen
M.A.G van den Brandt
BPR at PT Sarandi Final Report Bachelor Assignment
Enschede, October 2007
Supervisor PT Sarandi:
Mr. Isep Gojali
Supervisors University of Twente:
Mr. S.J. Maathuis MSc
Mrs. M.E. Iacob MSc
2

BPR at PT Sarandi – Process innovation at a manufacturing company in Indonesia
Management Summary
Most of the problems at Sarandi found their roots in inefficient and ineffective processes. For this
reason, process innovation was performed. The manufacturing process was selected for innovation.
Business Process Reengineering (BPR) is inherent to process innovation and offered a framework for
this research. The purpose of this paper is to perform a BPR cycle within the company and to make
Sarandi familiar with BPR so they can apply this method to other processes later on.
Three pathologies were selected from the manufacturing process: excessive number of job cards,
insufficient inherent process quality and inadequate performance measurement. In the new process
these pathologies no longer exist. There are two categories for the proposed changes:
- A new workplace environment for operators: computers will be installed in the divisions of
machining, welding, finishing, painting and assembly. New software will be developed for these
computers that will enable the operators to retrieve their next job and keep track of their start and
finish times. The job card on paper will disappear as a result of this. The new software makes it
easy to generate performance reports.
- A new quality control procedure: operators will perform the quality checks by themselves. This
means that the quality control department becomes redundant. A new department called quality
improvement will be introduced, where the quality control employees and one employee from
production administration will shift to. This new quality improvement department will have a focus
towards improving quality and finding ways of more efficient producing. Besides the new tasks,
quality improvement will still perform quality checks for critical areas in the manufacturing process
like painting and assembly.
The changes will lead to the following improvements:
- No more time lost by production administration for manually making and adjusting job cards.
- All relevant information for the operator will be visible on the computer screen in the workplace,
including drawings.
- Accurate registration of start and finish times of the jobs of operators is possible.
- Ability to generate performance reports on total process times and amount of errors by operator.
- Increased quality focus by operators, because they will be judged on the objective quality rate
data from the system.
A selection of the most important recommendations that have been formulated is given below:
- Finish the BPR cycle and measure the manufacturing process lead times when finished.
- Continue with the Total Quality Management (TQM) program.
- Apply BPR in the future to other processes when necessary.
- Develop an automated planning system for automatic job card generation purposes.
Summarising, the proposed changes will lead to more efficient and effective processes for Sarandi.
3

BPR at PT Sarandi – Process innovation at a manufacturing company in Indonesia
Table of contents Management Summary .............................................................................................................. 3 Table of contents ........................................................................................................................ 4 Preface........................................................................................................................................ 6 Part I: Introduction ..................................................................................................................... 7 1. Introduction ............................................................................................................................ 8
1.1 General overview of PT Sarandi ...................................................................................... 8 1.2 Previous researches .......................................................................................................... 8 1.3 Process-based approach.................................................................................................... 9 1.4 Framework choice ............................................................................................................ 9 1.5 Objective and central problem ....................................................................................... 10
2. Research approach................................................................................................................ 12 2.1 BPR Methodology choice .............................................................................................. 12 2.2 Research Steps................................................................................................................ 14
3. Theoretical background........................................................................................................ 15 3.1 Phases in Business Process Reengineering .................................................................... 15
3.1.1 Envision................................................................................................................... 15 3.1.2 Initiate...................................................................................................................... 15 3.1.3 Diagnose.................................................................................................................. 16 3.1.4 Redesign .................................................................................................................. 18 3.1.5 Reconstruct.............................................................................................................. 20 3.1.6 Monitor.................................................................................................................... 20 3.1.7 Summary of the research steps, techniques and tools ............................................. 21
3.2 Success factors BPR....................................................................................................... 22 3.3 Cultural aspects .............................................................................................................. 23
Part II: PRLC steps................................................................................................................... 25 4. Envision................................................................................................................................ 26
4.1 Secure management commitment .................................................................................. 26 4.2 Identify reengineering possibilities ................................................................................ 26 4.3 Identify enabling technologies ....................................................................................... 27 4.4 Align with corporate strategy......................................................................................... 27
4.4.1 Mission and Strategy............................................................................................... 27 4.4.3 Alignment................................................................................................................ 28
5. Initiate................................................................................................................................... 29 5.1 Organise reengineering team.......................................................................................... 29 5.2 Set performance goals .................................................................................................... 29
5.2.1. Lead times of sub processes of hospital beds......................................................... 30 5.2.2 Reject rates of the quality control procedure of hospital beds ................................ 31
6. Diagnose............................................................................................................................... 32 6.1 Document existing process............................................................................................. 32
6.1.1 Manufacturing process flows .................................................................................. 32 6.2 Document existing Human Resource architecture ......................................................... 35 6.3 Document existing Information Technology ................................................................. 36
6.3.1 Information Systems ............................................................................................... 36 6.3.2 IT architecture ......................................................................................................... 37
6.4 Uncover pathologies....................................................................................................... 37 6.4.1 Pathologies definition.............................................................................................. 38 6.4.2 Pathologies choice................................................................................................... 39
7. Redesign ............................................................................................................................... 42
4

BPR at PT Sarandi – Process innovation at a manufacturing company in Indonesia
7.1 Explore alternative designs ............................................................................................ 42 7.1.1 Road to the alternative designs................................................................................ 42 7.1.2 Alternative designs.................................................................................................. 43
7.2 Design the new process .................................................................................................. 44 7.2.1 Detailed description of the new process.................................................................. 44 7.2.2 Performance of the new process.............................................................................. 45
7.3 Design the human resource architecture ........................................................................ 46 7.3.1 Organisational Changes........................................................................................... 46 7.3.2 Reward System........................................................................................................ 47
7.4 Uncover pathologies....................................................................................................... 47 7.5 Prototyping ..................................................................................................................... 47
7.4.1 UML Class Diagram ............................................................................................... 48 7.4.2. UML Sequence Diagram........................................................................................ 49 7.4.3 Graphical User Interface (GUI) Operator ............................................................... 50 7.4.4 Microsoft Access Prototype .................................................................................... 50
8. Reconstruct........................................................................................................................... 52 8.1 Install IT ......................................................................................................................... 52 8.2 Reorganise...................................................................................................................... 53
8.2.1 New job descriptions............................................................................................... 54 8.2.2 New task descriptions.............................................................................................. 54 8.2.3 Shift to the new quality control procedure .............................................................. 55 8.2.4 Managing the change: cultural aspects.................................................................... 56
Part III: ..................................................................................................................................... 58 Conclusions and Recommendations......................................................................................... 58 9. Conclusions .......................................................................................................................... 59
9.1. General conclusions ...................................................................................................... 59 9.2 Conclusions regarding success factors and cultural aspects .......................................... 60 9.3 Conclusions regarding BPR in the manufacturing process............................................ 60 9.4 Summarising conclusion regarding the objective .......................................................... 61
10. Recommendations .............................................................................................................. 62 10.1 Current BPR Cycle....................................................................................................... 62 10.2 General Recommendations .......................................................................................... 62 10.3 Recommendation on methodology............................................................................... 63
Figures and Tables ................................................................................................................... 65 Figures.................................................................................................................................. 65 Tables ................................................................................................................................... 65
Reference list............................................................................................................................ 66 Appendix A: Organisational chart............................................................................................ 67 Appendix B: Success factors BPR ........................................................................................... 68 Appendix C: SMART............................................................................................................... 69
5

BPR at PT Sarandi – Process innovation at a manufacturing company in Indonesia
Preface
As a part of our bachelor Industrial Engineering & Management, we have done our bachelor
assignment in Sukabumi, Indonesia at PT Sarandi. The company invited us to do a research on
improvements in the factory. This was a great opportunity for us to bring some of our learned theories
in practice and to make an actual contribution in a professional environment. We are pleased with the
results of this research and hope that we have contributed to Sarandi’s organisational health right now
and in the future.
Doing our bachelor assignment abroad posed several challenges for us, but this was also one of the
reasons for going abroad. Indonesia is a great country to work and live. As expected there were a lot
of differences in both working and national culture, but because of the openness of all the people at
Sarandi, this was more an opportunity to learn from each other and to exchange experiences than a
problem.
The people at Sarandi welcomed us and were interested in taking part in this project. We are very
thankful for all the help that we have received before, during and after the project, by all the people at
Sarandi. We would especially like to thank Mr. Arief for supporting us throughout our time in
Indonesia.
Besides all the people in Indonesia, we would like to thank the students who conducted researches at
Sarandi in the previous years: Gerben Meutstege, Rob Golbach, Michel Bieze and Johan Jongejan.
Their reports and suggestions helped during the complete process. Lastly we would like to thank Mr.
Maathuis and Mrs. Iacob, our supervisors at the Twente University, for providing us with feedback and
ideas during the research.
As Mr. Isep would say: “It was a good challenge!”
Enschede, October 2007,
Marcel and Mark
6

BPR at PT Sarandi – Process innovation at a manufacturing company in Indonesia
Part I: Introduction The first part of the report functions as an introduction. This part contains the general
introduction to the company, the research approach and the theoretical background.
7

BPR at PT Sarandi – Process innovation at a manufacturing company in Indonesia
1. Introduction
1.1 General overview of PT Sarandi
PT Sarandi is a manufacturing company located in Indonesia, with around 200 employees. The
company exists of two offices: a production facility based in Sukabumi and a marketing office located
in Jakarta. The company produces medical equipment, mostly for the domestic market. Sarandi offers
a variety of products; from hospital beds to ambulance interiors and infusion stands. However, the
core business is producing all kinds of hospital beds. Different hospital beds vary in, for example, type
of steel, number of cranks, or electrical/manual. Almost all products by Sarandi have a basis of a
metal frame, and a large part of the manufacturing process exists of machining metal. The choice for
the factory in Sukabumi is not so strange, since Sukabumi is famous for its metal industry. The
production process consists of only one production line, because all the products follow the same
sequence of production steps. The order of the steps is: cutting, machining, welding, finishing,
chemical treatment, painting and assembly. Sarandi has recently started with producing parts made of
fibres instead of metal and is still in the process of improving methods to produce fibre parts. At the
moment the company is in the process of seeking possibilities for selling their products internationally,
like in Europe and the Arabic region. The end users of Sarandi’s products are hospitals. Sarandi
sometimes sells to hospitals directly, but in most cases they sell to distributors.
1.2 Previous researches
The focus of this project is partly derived from earlier researches performed by students in 2005 and
2006. Important problems that were stated by those researches are low productivity, non-reliable
delivery times and insufficient interdepartmental communication. Sarandi's goal for this research was
improvements in the factory in Sukabumi. Some of the internal problems that were stated in the
previous researches are not yet solved, therefore the focus of this research will be internal. When the
internal situation of Sarandi is improved in total, it is possible to look one step further towards
investigating external factors, such as the strategies concerning customer relations and marketing.
Research towards those aspects should be performed at Sarandi's marketing office in Jakarta.
The research of Rob Golbach and Gerben Meutstege1 in 2005 defined five problem areas: no clear
planning/scheduling system, purchasing method/inventory control, departmental structure,
subcontractor problems and many different products. The research of Michel Bieze and Johan
Jongejan2 in 2006 states a few other problems besides those: poor interdepartmental communication,
short term financial problems due to a high amount of accounts receivable and poor performance
indicators.
1 Golbach & Meutstege, “Improving planning and control systems at PT Sarandi” 2 Bieze & Jongejan, “Supporting the company by improving their organizational performance”
8
BPR at PT Sarandi – Process innovation at a manufacturing company in Indonesia
1.3 Process-based approach
Both researches were successful in tackling the stated problems. However, not every implemented
solution had the same impact. The poor interdepartmental communication still seemed to be an
existing problem and causing miscommunication between departments.
Early observations during this research showed that besides interdepartmental communication, there
are also problems with intradepartmental communication, especially within production. Next to this, an
important finding was that Sarandi had grown a lot in the past few years, but the different processes
have remained unchanged. These problems ask for a process-based approach. Due to the
interdepartmental problems, a process based approach would lead to more benefits than
improvements within a single business function.
1.4 Framework choice
Process enhancement can broadly be split up into two streams: process improvement and process
innovation. Two methods are generally accepted for these streams, although sometimes slightly
different names for the same methods are used. For process improvement, that is Total Quality
Management3 (TQM) and Business Process Reengineering4 (BPR) for process innovation. A study
was done on which method best fits the desired end results. TQM is a method to perform every
existing process in the best way. It focuses on employee participation and empowerment to ensure
quality throughout the production process. Besides that, it uses detailed statistical information to
monitor the process. Implementing TQM is difficult because it needs a paradigm shift from the
employees. They will have the option to influence the process more, for instance by means of quality
groups, but they will also have more responsibility. Sarandi is already trying to implement TQM within
production. BPR on the other hand, has a more cross functional approach than TQM. BPR is a way of
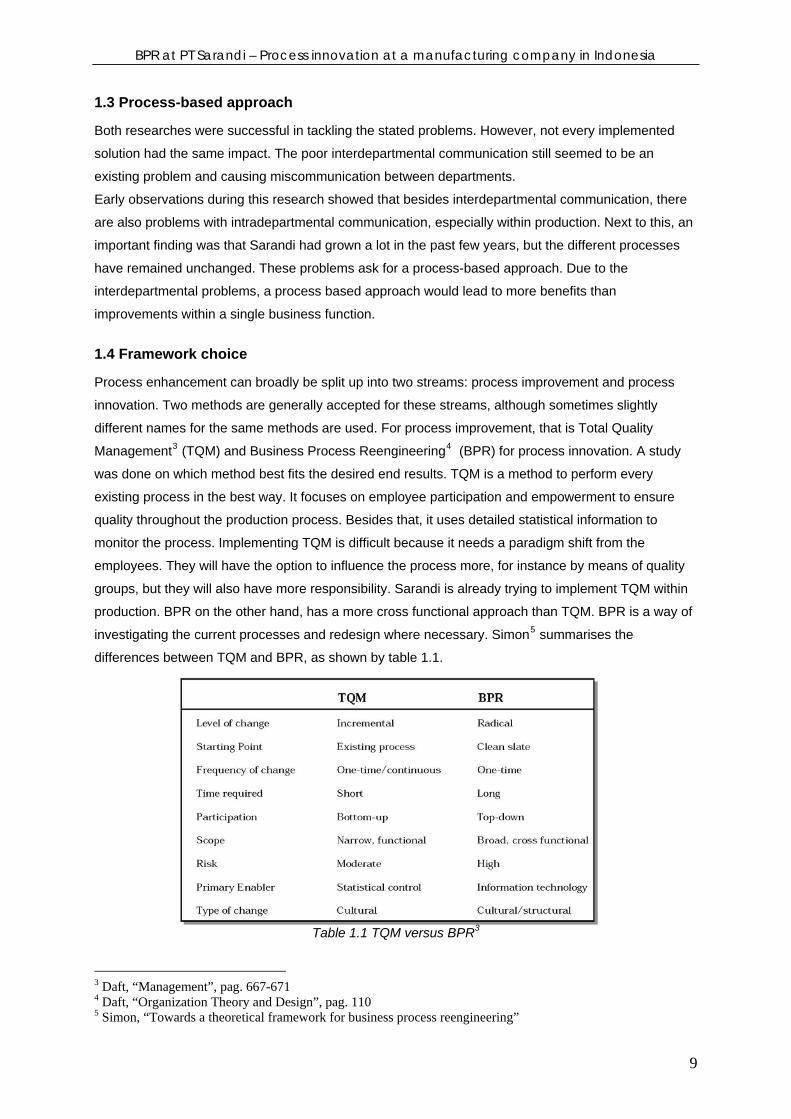
investigating the current processes and redesign where necessary. Simon5 summarises the
differences between TQM and BPR, as shown by table 1.1.
Table 1.1 TQM versus BPR3
3 Daft, “Management”, pag. 667-671 4 Daft, “Organization Theory and Design”, pag. 110 5 Simon, “Towards a theoretical framework for business process reengineering”
9
BPR at PT Sarandi – Process innovation at a manufacturing company in Indonesia
For Sarandi, a cross functional approach is necessary because a lot of the problems have their roots
in interdepartmental miscommunication. The framework for improving processes will therefore be
BPR. Performing BPR takes a long time according to Davenport6. Because of our time restrictions, we
will only be able to perform BPR on selected areas. This will give Sarandi insight in how the method
works so they can apply it to other areas where necessary.
1.5 Objective and central problem
Now that is clear that some business processes need reconsideration and that this will be done by
process innovation, the objective can be formulated. The research has both scientific targets and
goals for society. The most important scientific goal is to perform a BPR cycle in Indonesia. When
BPR is applied at Sarandi, we serve the practical goal of improving the position of Sarandi.
Objective
Enhancing competitive advantages for Sarandi by performing a BPR cycle that will improve
effectiveness and efficiency of business processes at the company.
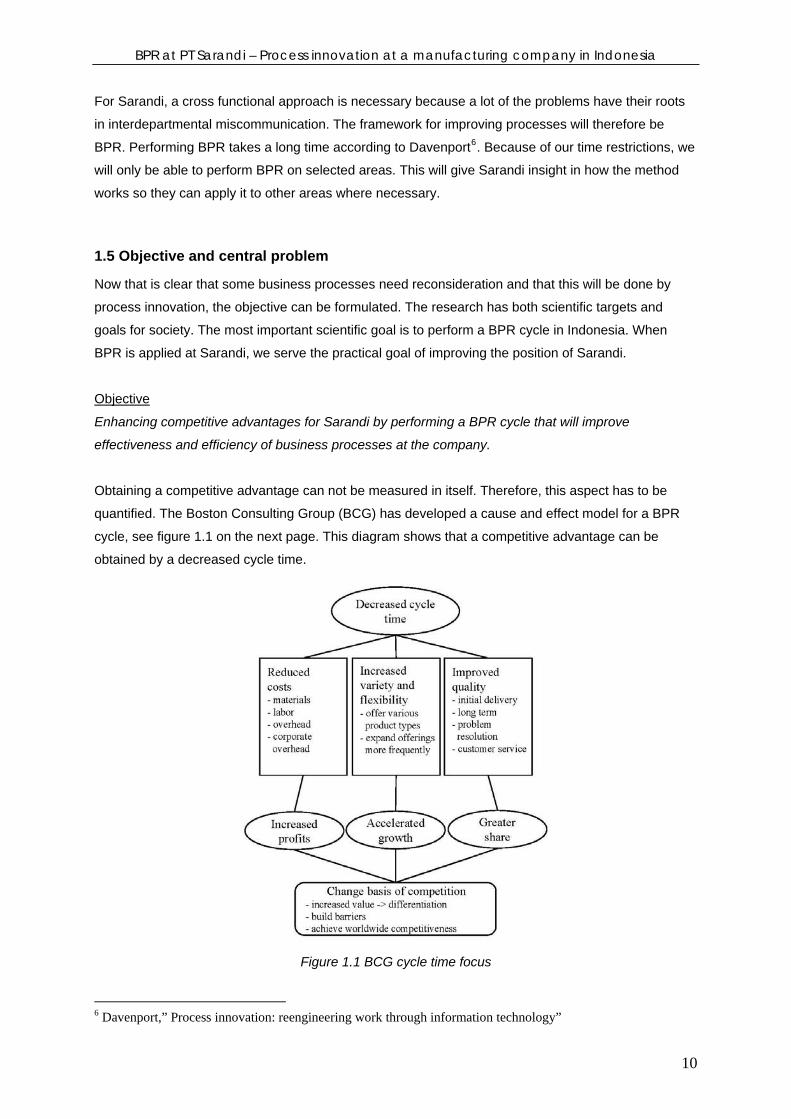
Obtaining a competitive advantage can not be measured in itself. Therefore, this aspect has to be
quantified. The Boston Consulting Group (BCG) has developed a cause and effect model for a BPR
cycle, see figure 1.1 on the next page. This diagram shows that a competitive advantage can be
obtained by a decreased cycle time.
Figure 1.1 BCG cycle time focus
6 Davenport,” Process innovation: reengineering work through information technology”
10

BPR at PT Sarandi – Process innovation at a manufacturing company in Indonesia
When performing BPR, cycle time reduction is the basis for solving many problems. Solving these
problems lead to a competitive advantage which was stated as a goal in the objective. This leads to
our central problem:
Central problem
How can Sarandi's internal business processes be reengineered to realise a cycle time reduction?
Our focus area is therefore (inter)departmental processes. These processes contain information,
communication and product flows. BPR focuses on information and communication flows and less on
product flows. The stated problem is a multidisciplinary problem. Within a BPR cycle, Human
Resource Management (HRM) and information systems are equally important to solve the problem.
In summary, a process innovation method called BPR is chosen for Sarandi for reengineering some
processes. The goal is to obtain a competitive advantage. This is realised by reducing the cycle time
within some yet to be identified processes.
11
BPR at PT Sarandi – Process innovation at a manufacturing company in Indonesia
2. Research approach
The BPR framework needs a methodology. Therefore, this chapter will first elaborate on the selection
of a methodology and the detailed research steps will be described in the second part.
2.1 BPR Methodology choice
For choosing a BPR methodology for Sarandi, several methodologies have been compared. The
methodologies from Guha7, Davenport8 and a commercial methodology by Visible Systems9 have
been the subject of further research. The methodologies contain similar steps. Therefore the choice
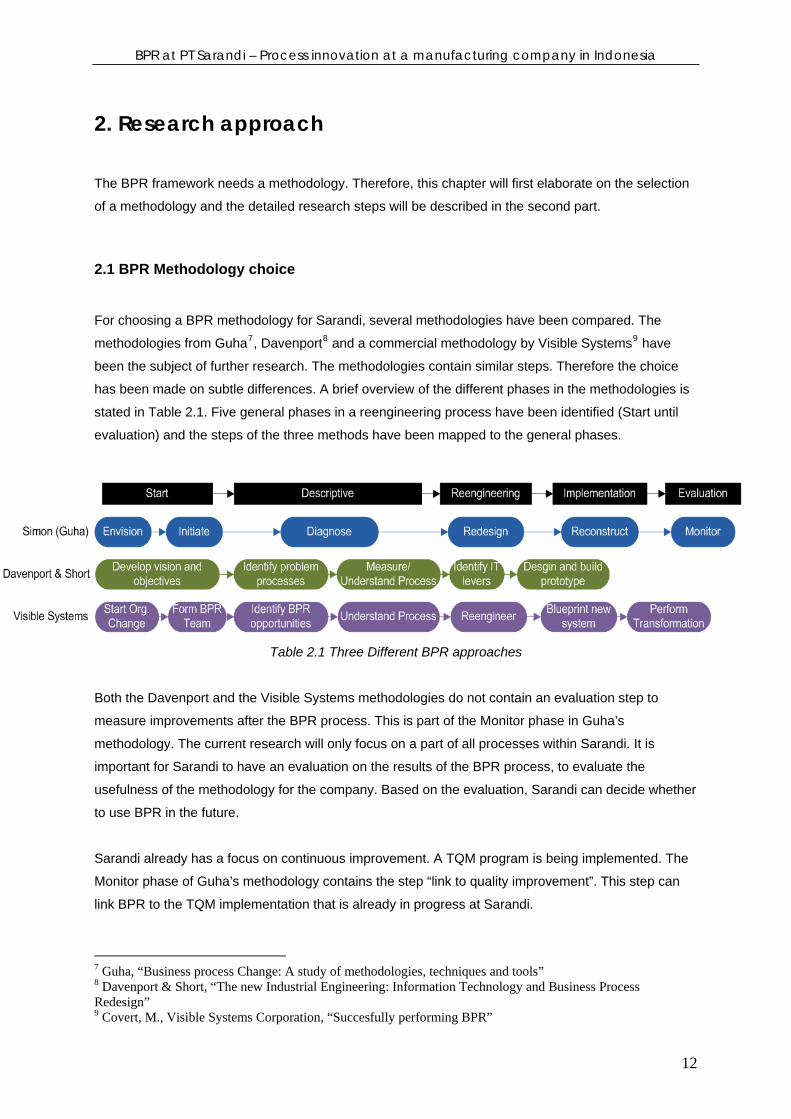
has been made on subtle differences. A brief overview of the different phases in the methodologies is
stated in Table 2.1. Five general phases in a reengineering process have been identified (Start until
evaluation) and the steps of the three methods have been mapped to the general phases.
Table 2.1 Three Different BPR approaches
Both the Davenport and the Visible Systems methodologies do not contain an evaluation step to
measure improvements after the BPR process. This is part of the Monitor phase in Guha’s
methodology. The current research will only focus on a part of all processes within Sarandi. It is
important for Sarandi to have an evaluation on the results of the BPR process, to evaluate the
usefulness of the methodology for the company. Based on the evaluation, Sarandi can decide whether
to use BPR in the future.
Sarandi already has a focus on continuous improvement. A TQM program is being implemented. The
Monitor phase of Guha’s methodology contains the step “link to quality improvement”. This step can
link BPR to the TQM implementation that is already in progress at Sarandi.
7 Guha, “Business process Change: A study of methodologies, techniques and tools” 8 Davenport & Short, “The new Industrial Engineering: Information Technology and Business Process Redesign” 9 Covert, M., Visible Systems Corporation, “Succesfully performing BPR”
12

BPR at PT Sarandi – Process innovation at a manufacturing company in Indonesia
The differences between the methodologies point out that Guha’s methodology has a good fit with the
needs at Sarandi. From a practical point of view it is useful that Guha offers clear techniques and tools
that can be used to actually perform BPR. A graphical representation of Guha’s methodology is the
Process Reengineering Lifeycle10.
Figure 2.1 Process Reengineering Life Cycle
10 Guha, S.; Kettinger, W.J. & Teng, T.C., “Business Process Reengineering: Building a Comprehensive Methodology”
13

BPR at PT Sarandi – Process innovation at a manufacturing company in Indonesia
2.2 Research Steps
1. Envision
1.1. Ensure management commitment
1.2. Identify reengineering possibilities
1.3. Identify enabling technologies
1.4. Align possibilities with corporate strategy.
2. Initiate
2.1. Organise reengineering team
2.2. Set performance goals
3. Diagnose
3.1. Document existing processes
3.2. Uncover pathologies
4. Redesign
4.1. Explore alternative designs
4.2. Design the new process
4.3. Design the human resource architecture
4.4. Prototyping
5. Reconstruct
5.1. Install IT
5.2. Reorganise
6. Monitor
Because of the limited time of the research and because actual development of an IT system is not
our specialism, the research will fully contain the first 4 steps, until redesign. Reconstruction will be
done mostly by the IT and HRM departments in Sarandi, based on the alternative chosen in the
redesign phase. However, some advice about the reconstruction will be given in this report.
It is important to make sure top management is committed to the change throughout the process. It is
also important to convince middle management of the importance of every decision taken and
changes made throughout the process. The reengineering approach of the BCG has a name for this
parallel process: manage transformation. Constant communication is necessary besides the steps in
the process of redesign.
One of the most important findings in the earlier researches is the difficulty to design a solution that
will be used in the company practically. Besides the scientific goals, it is important to strive for a
pragmatic, useful solution.
14
BPR at PT Sarandi – Process innovation at a manufacturing company in Indonesia
3. Theoretical background
In this chapter, the different theories that are used for investigating the research steps regarding the
BPR approach will be presented. The techniques and tools used for the BPR will be explained.
Section 3.2 evaluates the success factors for BPR that are relevant for Sarandi. The chapter
concludes with an evaluation of cultural aspects that are important to consider throughout the project.
3.1 Phases in Business Process Reengineering
In this part of the theoretical background, the different techniques and tools that will be used for the
BPR approach will be described. The steps are:
3.1.1 Envision
Secure Management Commitment
There is a need for some kind of persuasion technique. Guha does not propose any tool for
persuasion. At Sarandi, meetings have been organised with top en middle management to present the
plan.
Identify reengineering opportunities
When identifying reengineering opportunities, the different processes of Sarandi have been mapped.
Brainstorming and a semi-structured interview technique have been used to select a process. A semi-
structured interview is an interview with partly predetermined questions and partly open for
suggestion.
Identify enabling technologies
At the identify enabling technology stage, the different information technologies that Sarandi uses are
described. The goal is to find out if Sarandi will be able to develop the new software or is able to
develop it as an extension of the old software system.
Align with corporate strategies
Aligning with corporate strategy is done by reflecting the company’s strategy against our plans.
3.1.2 Initiate
Organise reengineering team
For organising the reengineering team, the relevant departments are determined and the heads of
those departments have become member of the reengineering team. Periodic meetings are used to
keep all the members of the team up to date and to ensure commitment throughout the process.
15
BPR at PT Sarandi – Process innovation at a manufacturing company in Indonesia
Set performance goals
The second activity in the initiate phase consists of setting performance goals. The most important
performance indicator for this research is the decrease in cycle time. Therefore, the lead times of the
sub processes in the manufacturing process have been calculated to act as comparison with the lead
times after the research. As was mentioned in the introduction, Sarandi has a wide variety of products.
Sarandi has a few products with relatively very high sales numbers compared to the other products.
The decrease in lead time for those core products is the indicator for general improvement. To identify
the most important product(group), a Pareto analysis has been performed. Pareto’s theory states that
around ten to twenty percent of the products account for sixty to eighty percent of the sales.
3.1.3 Diagnose
Document existing process
For documenting existing processes the tool BiZZdesigner has been used. This tool is loosely based
on the Business Process Modelling Notation (BPMN)11. This tool makes it possible to visualise
business processes in a structured way. BiZZdesigner also uses Unified Modelling Language12 to
model class diagrams.
The PRLC does not contain an investigation of the current situation on the areas of HRM and IT in the
Diagnose phase. When BPR is performed with a completely clean slate (IT and HRM systems are
designed from scratch), thorough research on the current situation of IT and HRM is not necessary,
because there will be no adjustments to the old systems, but completely new systems. This research
is a ‘dirty’ slate approach, because it is not possible to completely replace the existing systems with
new ones. The risk involved in such a clean slate approach would be high, due to high development
costs and the lack of knowledge about BPR within the organisation. BPR cycles performed by Sarandi
in the future could use a clean slate, to make more radical improvements possible. The dirty slate
approach requires an investigation of the current HRM and IT systems in the diagnose phase,
because these systems have to be modified in the redesign and reconstruct phase. Therefore two
subchapters have been added: Current HRM situation and Current IT situation.
Document existing human resource architecture
This step and the next step are added to the PRLC. The necessity of adding these steps was
explained in the previous paragraph. There are several methods to evaluate the human resource
management (HRM) situation within Sarandi. The first method is analysing the organisational structure
within the company. An organisational chart will give insight in the way the company is set up. From
this chart it is possible to derive whether Sarandi has a functional, divisional or other structure. This
top-down approach gives insight in whether the individual task responsibilities fit with the
organisational structure.
11 White, IBM corporation, “Introduction to BPMN” 12 Odeh, Beeson, Green and Sa, “Modelling processes using RAD and UML activity diagrams: an exploratory study”
16

BPR at PT Sarandi – Process innovation at a manufacturing company in Indonesia
Afterwards it is possible to analyse the HRM situation with the model of strategic human resource
management by Daft13.
Company Strategy
Attracting an Effective Workforce- HRM Planning- Job analysis- Forecasting- Recruiting- Selecting
Develop an Effective Workforce- Training
- Development- Appraisal
Maintain an Effective Workforce- Wage and salary
- Benefits- Labor Relations
- Terminations
Figure 3.1 Strategic Human Resource Management
The focus of the research will be on the areas ‘job analysis’, ‘training & development’ and ‘labour
relations’, because these areas are important for further research on job description, willingness for
change in the organisation and the possible responsibilities for employees.
Document existing IT
Laudon & Laudon propose a model for analysing the information systems within an organisation. They
define six levels of information systems.
1. Executive Support Systems (long term strategy and planning)
2. Business Information Systems (provide management with reports)
3. Decision-Support Systems (data analysis systems that support management in decision
making)
4. Knowledge Work Systems (help employees to find and integrate new knowledge)
5. Office Systems (word processors, e-mail etc. to increase productivity)
6. Transaction Processing Systems (perform routine operational tasks)
Mapping the information systems within Sarandi in these categories, provides an overview of the
systems that are present and how they are related.
13 Daft, “Management, pag. 407”
17

BPR at PT Sarandi – Process innovation at a manufacturing company in Indonesia
Uncover pathologies
Uncovering pathologies has been done with the BiZZdesigner tool and with meetings with the
reengineering team. The uncovered pathologies will be prioritised using a Multi Criteria Decision
Analysis (MCDA). Examples of MCDA are the Simple Multi-attribute Rating Technique14 (SMART) and
the Analytical Hierarchy Process15(AHP). AHP is a precise, comprehensive but complicated
framework. Sarandi does not have a lot of experience with MCDA. Therefore SMART is chosen as the
MCDA, because the technique is easier to understand for the end users than AHP, with a relatively
small loss in accuracy. The pathologies will be rated by employees of Sarandi. It is too complicated
and unnecessary to spend a lot of time learning them AHP, with the risk of misunderstandings and
incorrect entries.
SMART consists of eight stages:
1. Identify the decision maker
2. Identify the alternative courses of action
3. Identify the attributes which are relevant to the decision problem
4. Assign values to measure the performance
5. Determine a weight for each attribute
6. Take the weighted average of the values assigned to every alternative
7. Make a provisional decision
8. Perform sensitivity analysis to see how robust the decision is to changes
3.1.4 Redesign
Explore alternative design
BiZZdesigner is used to explore alternative designs.
Design the new process & Uncover pathologies
The new process will be designed with BiZZdesigner. During the design, pathologies that come up will
be handled.
Design the new human resource architecture
The new human resource architecture will be designed using the diagnose about the current human
resource situation, combined with the new process.
Prototyping
Prototyping will be done using the UML diagrams. The models from those diagrams will be transferred
to a working application using Microsoft Access. This application functions only as an example of how
the final system will work.
14 Goodwin & Wright, “Decision analysis for management judgment”, p. 7-26 15 Harker, “The art and science of decision making: the analytic hierarchy process”
18

BPR at PT Sarandi – Process innovation at a manufacturing company in Indonesia
The new requirements for the IT system will be designed. This will be done by constructing class
diagrams and sequence diagrams. The language used for these techniques is Unified Modelling
Language (UML).
UML is developed to replace the different modelling languages that are not compatible with each
other. UML is widely used and makes inter organisational communication possible. Several tutorials
for using UML can be found on the Internet, we have used Practical UML: A Hands-On Introduction for
Developers16.
UML exists of several types of diagrams. This BPR cycle uses a structure diagram, UML Class
Diagram and an interaction diagram, a UML Sequence Diagram.
UML Class Diagrams
Class Diagrams are used to model objects in an IT system. Class Diagrams are static, this means
they model the classes that interact, but do not model the actual steps when they do interact. The
different classes contain attributes and operations. Attributes are variables in the classes and
operations allow changes to attributes.
Different associations are possible between the classes, as stated in Table 3.1.
Association Type Visual representation Description
Standard association UML Class 1 UML Class 2 This indicates a relation between two
classes at the same level
Aggregation relation UML Class 1 UML Class 2 Class 1 has a collection of classes 2, but
class 2 can also exist without the parent
class 1.
Composition relation UML Class 1 UML Class 2 Class 2 is completely dependent on class
1. If class 1 disappears, class 2 does too.
Generalisation relation UML Class 1 UML Class 2 Class 1 is a superclass of class 2
Table 3.1 Class diagram associations
The interaction between classes is done using multiplicities. A multiplicity indicates the number of
instances of the class associated with one instance of the class on the other end of the association.
Table 3.2 states the four most used multiplicities.
16 Miller, R. (Dec 1, 2003) “Practical UML: A Hands-On Introduction for Developers”, retrieved June 30, 2007, from http://dn.codegear.com/article/31863
19
BPR at PT Sarandi – Process innovation at a manufacturing company in Indonesia
Multiplicities Meaning
0..1 Zero or one instance
0..* or * Zero until an infinite number of instances
1 Exactly one instance
1..* One until an infinite number of instances
Table 3.2 Class diagram multiplicities
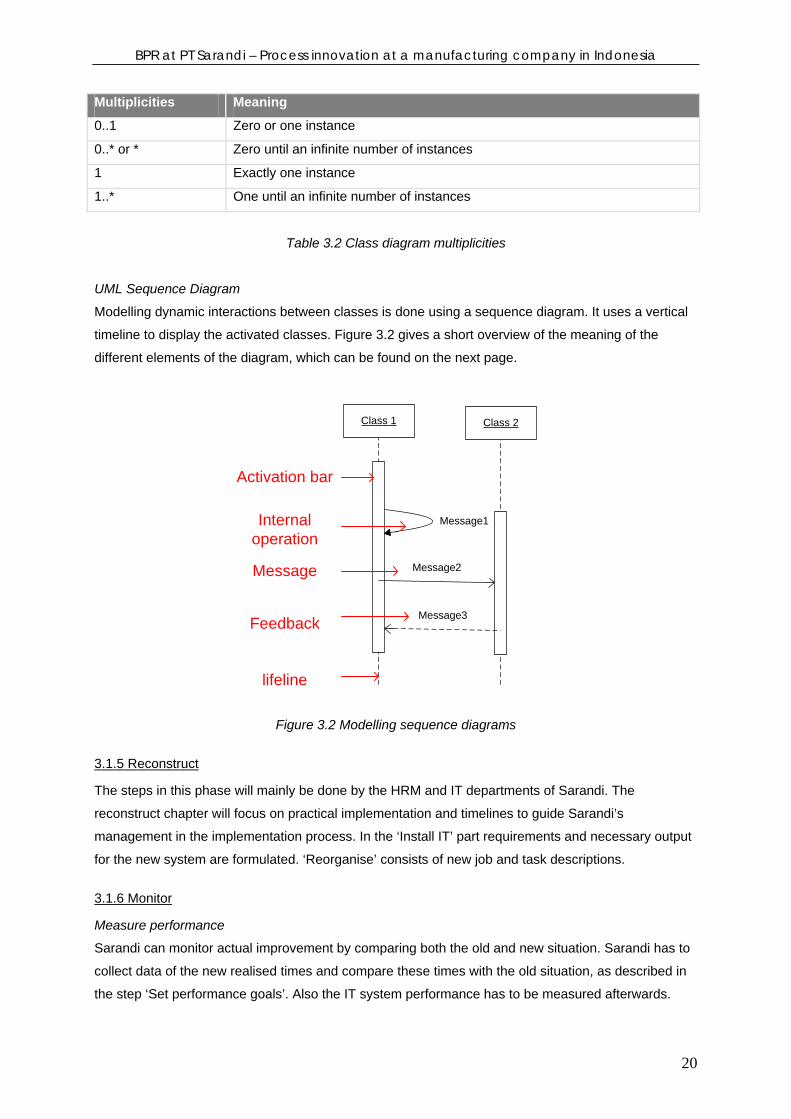
UML Sequence Diagram
Modelling dynamic interactions between classes is done using a sequence diagram. It uses a vertical
timeline to display the activated classes. Figure 3.2 gives a short overview of the meaning of the
different elements of the diagram, which can be found on the next page.
Class 1 Class 2
Message1
Message2
Message3
lifeline
Activation bar
Internal operation
Message
Feedback
Figure 3.2 Modelling sequence diagrams
3.1.5 Reconstruct
The steps in this phase will mainly be done by the HRM and IT departments of Sarandi. The
reconstruct chapter will focus on practical implementation and timelines to guide Sarandi’s
management in the implementation process. In the ‘Install IT’ part requirements and necessary output
for the new system are formulated. ‘Reorganise’ consists of new job and task descriptions.
3.1.6 Monitor
Measure performance
Sarandi can monitor actual improvement by comparing both the old and new situation. Sarandi has to
collect data of the new realised times and compare these times with the old situation, as described in
the step ‘Set performance goals’. Also the IT system performance has to be measured afterwards.
20

BPR at PT Sarandi – Process innovation at a manufacturing company in Indonesia
This can be done by interviewing the persons working with the system and determining the usability
and questioning if there are any new or old unsolved problems.
Link to quality improvement
The final step is the link to quality improvement. Both BPR and TQM focus on processes. While BPR
is concerned with abrupt changes and improvement, TQM is concerned with continuous improvement.
After the BPR project is completed, the program of TQM can be continued.
3.1.7 Summary of the research steps, techniques and tools
Research steps Techniques Tools
Envision Meetings Secure management commitment
Trainings
Brainstorming
Semi-structured interviews
Identify reengineering possibilities
Identify enabling technology IT analysis
Align with corporate strategies BCG model for BPR approach
Initiate Organise reengineering team Teambuilding
Lead time analysis Set performance goals
Pareto analysis
Diagnose Flow diagramming BiZZdesigner Document existing process
Semi-structured interviews
Document HRM situation Strategic human resource
management
Document IT situation Six levels of Information
Systems
Flow analysis BiZZdesigner
Semi-structured interviews
Brainstorming
Uncover pathologies
SMART analysis
Redesign Explore alternative designs Flow diagramming BiZZdesigner
21

BPR at PT Sarandi – Process innovation at a manufacturing company in Indonesia
Design the new process Flow diagramming BiZZdesigner
Design human resource architecture Job design
UML diagramming Microsoft Visio Prototype
Simulating Microsoft
Access
Reconstruct Install IT Requirements analysis
Reorganise Job design
Monitor Measure performance Collecting actual times
Structured interviews
Link to quality improvement TQM program
Table 3.3 Methodologies, techniques and tools applied at Sarandi
3.2 Success factors BPR
The methodology for BPR that is used in this research does not state the critical success factors or
failure factors for BPR implementation. Therefore it is necessary to define those factors and keep
them in mind during the BPR cycle, both to obtain good results and to prevent mistakes. It is possible
to draw conclusions on which factors need more attention during and after the implementation.
Defining the success and failure factors has been done by Al-Mashari and Zairi17, who reviewed the
literature on success and failure in BPR implementations. They defined five dimensions of success
factors (and corresponding failure factors):
- Change management, systems and culture
- Management competence factors
- Organisational structure factors
- BPR Project management factors
- IT Infrastructure factors
The five dimensions contain the different factors. The full list of these factors is given in Appendix B.
The most important factors for Sarandi are obviously those on which the company scores low at the
moment. Two dimensions for Sarandi that will be troublesome are ‘Change management, systems
and culture’ and ‘Organisational structure factors’. The first dimension will be troublesome because
17 Al-Mashari, M., Zairi, M. (1999), “BPR Implementation process: an analysis of key success and failure factors”
22
BPR at PT Sarandi – Process innovation at a manufacturing company in Indonesia
Sarandi has difficulties with some success factors in this dimension. These success factors are:
Effective communication, Empowerment and Creating an effective culture for organisational change.
Organisational structure factors that can undermine the results are problems with job definition and
responsibilities, also areas in which Sarandi has difficulties at the moment.
During the BPR cycle the focus will be on the two dimensions of success factors mentioned above.
After the complete BPR cycle it is possible to conclude which factors contributed to the success or
failure of the project.
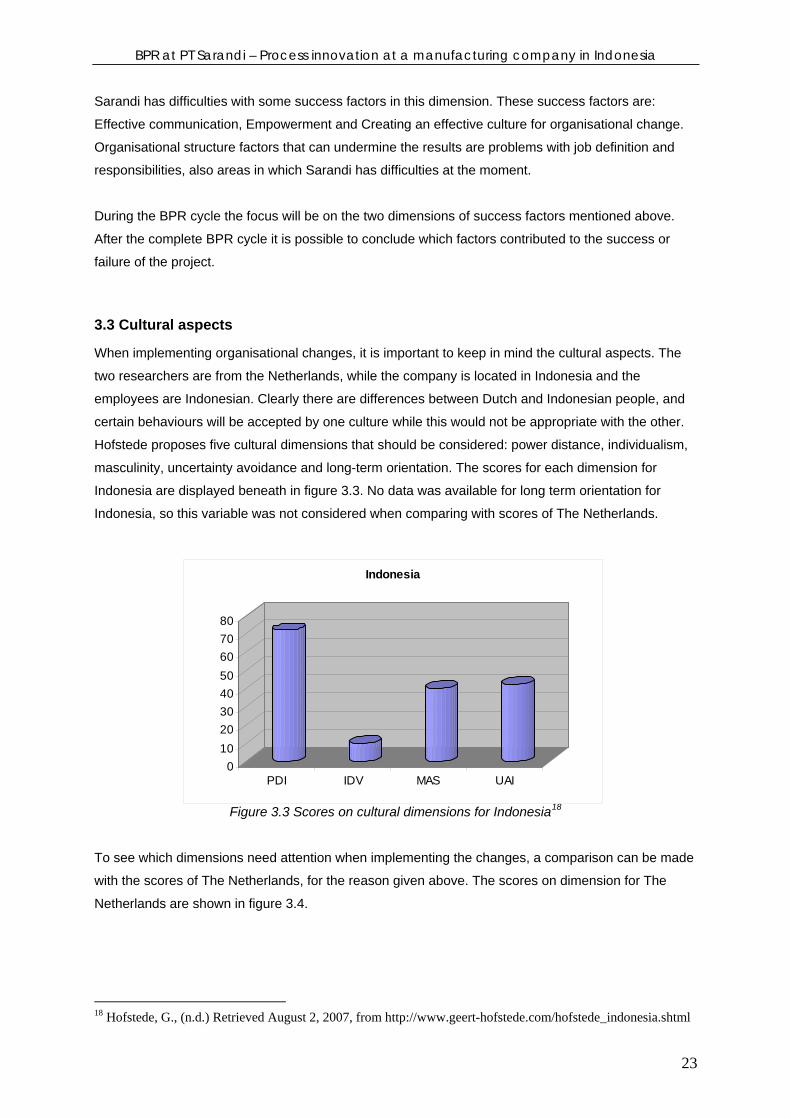
3.3 Cultural aspects
When implementing organisational changes, it is important to keep in mind the cultural aspects. The
two researchers are from the Netherlands, while the company is located in Indonesia and the
employees are Indonesian. Clearly there are differences between Dutch and Indonesian people, and
certain behaviours will be accepted by one culture while this would not be appropriate with the other.
Hofstede proposes five cultural dimensions that should be considered: power distance, individualism,
masculinity, uncertainty avoidance and long-term orientation. The scores for each dimension for
Indonesia are displayed beneath in figure 3.3. No data was available for long term orientation for
Indonesia, so this variable was not considered when comparing with scores of The Netherlands.
Figure 3.3 Scores on cultural dimensions for Indonesia18
01020304050607080
PDI IDV MAS UAI
Indonesia
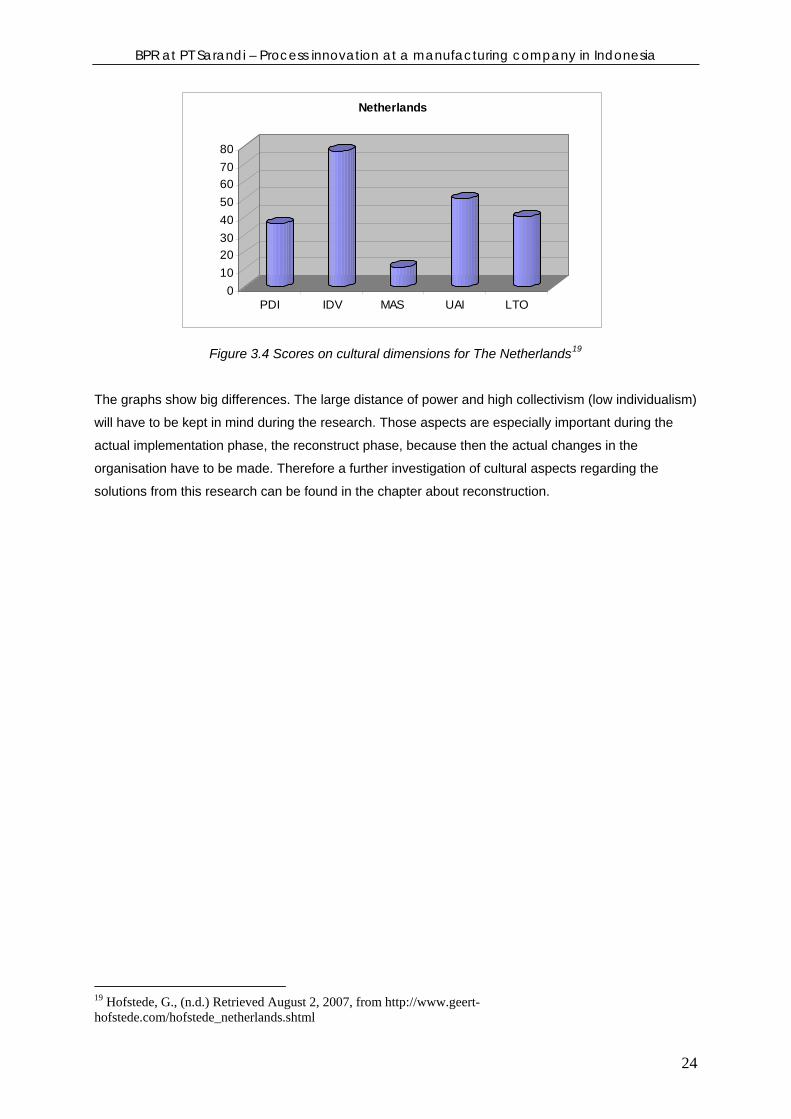
To see which dimensions need attention when implementing the changes, a comparison can be made
with the scores of The Netherlands, for the reason given above. The scores on dimension for The
Netherlands are shown in figure 3.4.
18 Hofstede, G., (n.d.) Retrieved August 2, 2007, from http://www.geert-hofstede.com/hofstede_indonesia.shtml
23
BPR at PT Sarandi – Process innovation at a manufacturing company in Indonesia
01020304050607080
PDI IDV MAS UAI LTO
Netherlands
Figure 3.4 Scores on cultural dimensions for The Netherlands19
The graphs show big differences. The large distance of power and high collectivism (low individualism)
will have to be kept in mind during the research. Those aspects are especially important during the
actual implementation phase, the reconstruct phase, because then the actual changes in the
organisation have to be made. Therefore a further investigation of cultural aspects regarding the
solutions from this research can be found in the chapter about reconstruction.
19 Hofstede, G., (n.d.) Retrieved August 2, 2007, from http://www.geert-hofstede.com/hofstede_netherlands.shtml
24

BPR at PT Sarandi – Process innovation at a manufacturing company in Indonesia
Part II: PRLC steps Part two contains all the steps of the Process Reengineering Life Cycle (PRLC). The chapters four to
eight all describe the execution of a step of the PRLC.
25
BPR at PT Sarandi – Process innovation at a manufacturing company in Indonesia
4. Envision
The Envision phase consists of four steps: Secure management
commitment, identify reengineering possibilities, identify enabling
technologies and align with corporate strategies. The outcomes on all of
these stages are described in chronological order.
Envision is the first step of the PRLC. The main goal of this phase is to select a specific process that
will continue the reengineering process.
4.1 Secure management commitment
Sarandi has a focus on continuous improvement. Top management is the idea champion for this
attitude. It is most important to convince top management of the necessity of BPR. Top management
at Sarandi consists of three persons: The CEO, the General Director and the Director Finance &
Marketing. The CEO and the General Director work in Sukabumi, the Director Finance & Marketing is
head of the office in Jakarta.
Both The CEO and the General Director propagate continuous improvement in the factory in
Sukabumi. The method of improvement is TQM. Process Innovation instead of process improvement
is relatively new within Sarandi. A presentation about the advantages and risks of BPR and a
comparison with TQM has been given to top management to clarify the possibilities of reengineering
and process innovation.
Afterwards a presentation has been given to top management and the heads of relevant departments
including a workshop about successful reengineering at Ford. The attendants of the meeting also
explained their vision about the opportunities for reengineering.
4.2 Identify reengineering possibilities
The first step in identifying possibilities for reengineering is to map the different processes, to analyse
where information and communication flows are not optimal. This has been done by semi-structured
interviews with the department heads. The tool BiZZdesigner has been used to give a broad
description of every process. The crucial position of both the production and production planning and
inventory control (PPIC) departments became clear after the interviews. Both departments
communicate intensively with almost all other departments.
26

BPR at PT Sarandi – Process innovation at a manufacturing company in Indonesia
The next step after mapping the processes was a meeting and brainstorm session with Sarandi’s
management, to combine the insights from mapping the different processes with their vision. The
focus of improvement within Sarandi is on the production department. According to top management
most of the problems occur within production or at the communication moments with the different
other departments. An example is unclear communication between production and engineering about
drawings. The production department is the main actor for the manufacturing process. Both top
management and the researchers concluded after a brainstorm session that only applying process
improvement techniques like TQM on manufacturing is insufficient because of Sarandi’s growth in the
past years, and when companies grow their processes are likely to change. According to the research
of Grover20 et al. BPR is seldom performed on the manufacturing process, even in manufacturing
companies. There are a few reasons for this phenomenon. The most important one is that a
manufacturing process also exists of a physical stream (the physical product), which is difficult to
reengineer. This research is therefore an opportunity to investigate the possibilities of business
process innovation and specifically BPR techniques in a relatively new context, namely the
manufacturing process.
4.3 Identify enabling technologies
The primary enabler of BPR is IT. The current IT system in Sarandi is developed in-house. Sarandi
has a general scheduling system, which allows departments like warehouse, purchasing and
production to view the production planning and stock levels. It also allows production administration to
enter manufacturing times for the different divisions and Quality Control (QC) can enter repair and
reject rates. The system does not allow automatic resource planning after order entry. Planning is
therefore done manually.
The complete system is developed in-house and has been modified continuously by the IT
department. This means that there is a lot of knowledge about the structure of the system and that it is
relatively easy to change the system in-house.
The general system is closely linked to the manufacturing process. The primary enabling technology
for improvements in the manufacturing process is therefore the general system.
4.4 Align with corporate strategy
Sarandi has stated both the mission and strategy in the company profile21.
4.4.1 Mission and Strategy
Sarandi’s mission consists of two parts:
20 Grover et al., “The implementation of Business Process Reengineering”, page 17 21 PT Sarandi Karya Nugraha, Company Profile
27
BPR at PT Sarandi – Process innovation at a manufacturing company in Indonesia
• To advance in technology, production process, and to enhance human resource skills
• To provide the best possible profit for the employees, shareholders and community
The best possible profit can be described as the most added value for employees, shareholders and
the community.
Sarandi’s strategy is also stated in the company profile: The company’s main concern is to serve
customers by enhancing the quality of production and admit as a trustworthy business partner.
4.4.3 Alignment
Both the mission and strategy of Sarandi mention improvements in the production process as a main
focus for Sarandi. This also follows from the interviews conducted with the management of the
company. A BPR track focused on the manufacturing process will improve the IT that supports the
production process. Besides this, there will also be changes in the human resource area, that will
acquire new skills from operators and possibly from management. This ensures that the first element
of Sarandi’s mission is covered by this research, namely advancement in technology, the production
process en enhancement of human resource skills.
Sarandi has also included improvements in the production process in their strategy. The focus of this
BPR cycle will be on improvements in the manufacturing process, which also includes the production
process. Therefore, this BPR project is aligned with the corporate strategy of Sarandi.
28
BPR at PT Sarandi – Process innovation at a manufacturing company in Indonesia
5. Initiate
The Initiate phase consists of two steps: Organise reengineering team and
Set performance goals. This phase within BPR takes relatively little time. It
is important to maintain management commitment ensured in the Envision
phase throughout this phase.
The manufacturing process was chosen for reengineering. The end result of this phase will be a
selection of quantitative variables that can be used for reflection and performance measure after the
completion of the BPR cycle.
5.1 Organise reengineering team
After the Envision phase it became clear that the focus of this BPR cycle will be on the manufacturing
process. Besides the production department, PPIC plays a major role in planning and monitoring
production. Specific knowledge of IT is necessary to ensure that the implementation plan for IT can
actually be performed. Therefore the reengineering team will exist of the following persons: CEO
(director production), the head of the production department, the head of production planning, the
head of IT and both researchers.
5.2 Set performance goals
The central problem placed cycle time reduction in a central role. For this to happen, measurements of
the times of the different steps in the manufacturing process are needed. It is too extensive to
measure the lead times and the duration of all the sub processes for every product. Therefore a
Pareto analysis has been performed to choose the products for which all durations of the sub
processes will be measured. The sales numbers of the main 20% of the products in 2006 are
analysed. They add up to account for 74,57% of total sales revenue.
Name Product SubTotal Percentage
Hospital Bed 5,221,446,075 27.24%
Instrument Cabinet 1,227,518,967 6.40%
Bedside Cabinet 1,150,570,085 6.00%
Ambulance 973,250,000 5.08%
Gynaecological Chair 971,234,364 5.07%
Operating Table 926,450,900 4.83%
Examination Table 741,028,647 3.87%
ICU – Iccu Bed 692,602,501 3.61%
Instrument Trolley 628,288,086 3.28%
Emergency Stretcher 619,610,534 3.23%
Verlosbed 573,061,946 2.99%
29

BPR at PT Sarandi – Process innovation at a manufacturing company in Indonesia
Infusion Stand 568,515,680 2.97%
Total 74,57%
Table 5.1 Pareto Analysis
The analysis makes clear that hospital beds are by far the most important product. Measurement of
the duration of every sub process within manufacturing will be done by measuring the times of the
process for hospital beds. This will provide a way of measuring achieved results. Next to the lead
times of the sub processes, reject rates of quality control will be mapped. The choice for reject rates is
because these rates are indirectly responsible for variability in the lead times.
5.2.1. Lead times of sub processes of hospital beds
Data regarding stainless steel and painted hospital beds were collected. The difference between the
two types is that the head and foot unit of the stainless steel beds are polished and that these units of
the painted bed are painted. This results in a slight difference in finishing time and painting time for
these types of beds, but not a difference that affected the results. For these types, data of all beds
produced and finished in 2007 were collected. The total data amount consists of 23 orders and a little
over 300 beds. For each sub process, the earliest start dates and latest finish dates are calculated to
determine the total time the sub processes take.
Next to comparing the before and after lead times for the project, it is also convenient to use the data
for estimating future delivery times. Therefore, the lead times were calculated per hospital bed. At the
moment Sarandi does not know how long the different sub processes take, they only estimate that, for
example, machining/KB takes five days for an average order. The real lead times are very different.
There was found that is takes 3.55 days per hospital bed to complete the whole manufacturing
process. The average order quantity used to get this result is 20 hospital beds. In this average of 20
hospital beds, there are also some outliers included. Because the order amount of around 10 beds is
the most common amount for ordering, and the expectancy that producing 10 beds will take a longer
time per bed, it is useful to also know the average producing time per bed for an order amount of 10
beds. The result for this order amount was a lead time of 4.25 days.
The lead times of the manufacturing process and individual lead times of the sub processes are
shown beneath for the average order amount (20 beds) and order of 10 beds.
Figure 5.1 Lead times of manufacturing process of the average order amount (20 beds)
30

BPR at PT Sarandi – Process innovation at a manufacturing company in Indonesia
Figure 5.2 Lead times of manufacturing process of the most common ordering amount (10 beds)
As can be seen in the above two figures, the different sub processes are not in a full sequential order.
The percentage of overlap was calculated using the production data, and applied at the average lead
times.
5.2.2 Reject rates of the quality control procedure of hospital beds
The quality control procedure can be split up into two different moments of quality check. The first is
the quality check by the production operators themselves and the second is the quality check by the
quality control department. Production checks their own jobs after finishing it, and quality control
checks batches of products. There is no standard procedure for the total quality control procedure; the
quality control department performs checks depending on their available capacity.
The first step in finding the data is getting relevant reports. The quality control department did provide
some reports, but when calculating the exact data, those numbers did not seem to reflect the reality
because of double registration with the production department. The separate reject rates were
calculated for every process. The results are presented in the table below.
Machining Welding Finishing Painting Assembly Production QC dept. Production QC dept. Production QC dept. Production QC dept. Production QC dept.
0.3% 0.4% 1.2% 3.4% 0.4% 0.4% 10.4% 4.7% 0.7% 1.1%
Table 5.2 Reject rates of the quality control procedure
So for example, the welding operators check their own work, and in 1.2% of the cases they find a
mistake, make a note of it on the job cards and repair it themselves. After a batch of welding is
finished, the quality control department checks it again and in 3.4% of the cases they find mistakes,
which have to be repaired again by the operators.
31

BPR at PT Sarandi – Process innovation at a manufacturing company in Indonesia
6. Diagnose
The Diagnose phase consists of two steps: Document existing process and
Uncover pathologies. The ‘dirty slate’ approach makes documenting the
existing processes very important. Therefore two steps have been added:
Document existing human resource architecture and Document existing IT.
Up until now, the manufacturing process was chosen for reengineering and lead times and reject rates
of hospital beds were selected for performance measure. In the diagnose phase, the manufacturing
process, current HRM and current IT situation will be documented. Next to this, pathologies in the
manufacturing process will be uncovered.
6.1 Document existing process
This step of the BPR cycle at Sarandi is the most time-consuming because of a lack of process
documentation. Quantitative research on the lead times, repair and reject rates has been done in the
phase about setting performance goals. This already gave insight in the manufacturing process. More
in-depth research has been done by interviewing the heads of departments and drawing the process
in the tool BiZZdesigner.
6.1.1 Manufacturing process flows
The manufacturing process is documented by investigating the physical product flows and the
information and communication flows. The BiZZdesigner tool was used for this research step.
BiZZdesigner is a useful modelling tool, because the graphical representation of the process also
includes information and communication flows. This is important, because the focus of this BPR
project is redesigning the information and communication flows and not physical product flows. After
the documentation was finished, interviews with the relevant departments were organised again. The
purpose of these interviews was to check if the modelled process is the same as the real process
within Sarandi. This is an important step because continuing the BPR process with an incorrect model
would obviously lead to unreliable results. Some adjustments were made after the interview sessions
on the section about wet painting in the quality control procedure.
A concise summary of the manufacturing process can be described as follows: after an order, PPIC
makes the production planning, SPK and DKK (Indonesian abbreviations). The SPK is the document
that states that Sarandi will deliver the product to the customer. The DKK is the document that states
that a certain order will be fulfilled by production in-house. The remaining orders are produced by
subcontractors. Engineering refreshes the bill of material, and checks the drawings. After both are
finished, warehouse administration checks inventory and makes the job card for the cutting process.
After the cutting process, production administration makes job cards for the other production sub
steps. The process of making these job cards is not necessarily sequential, but is dependent of the
32

BPR at PT Sarandi – Process innovation at a manufacturing company in Indonesia
production schedule. After most of the production sub steps, quality control checks samples of the
semi-finished products. There is a special department for painting repair. Also, if after assembling
quality control finds damages, the product returns to painting repair where also packaging and storing
take place.
The graphical representation of the manufacturing process is presented on the next page.
33

Figure 6.2 Model manufacturing process

6.2 Document existing Human Resource architecture
Within BPR, redesign is also done on the human resource process. The PRLC does not contain this
step. The necessity of this step comes from an important difference in the PRLC approach, which is
‘clean slate’, and this approach, which is ‘dirty slate’. The goal of this BPR cycle is not to completely
design the HR architecture from scratch, but to make improvements to the current situation. Therefore
it is necessary to map the current human resource situation. A graphical representation of the
company, in the form of an organisational chart can be found in Appendix A. The figure is based on
the chart made during the previous research by Golbach and Meutstege22.
The evaluation of HRM is done by analysing the different aspects of the model of strategic human
resource management. The summary of this model can be found in the theoretical background. A
systematic approach is followed to determine the policy of Sarandi on the different aspects.
The first part is ´Attracting an Effective Workforce´. Sarandi uses a strict procedure to attract new
employees that consists of several sequential steps:
1. Departments communicate the need for new employees to the HRM department.
2. The approval of top management is needed to determine whether to hire new employees and
the number of new employees for the department.
3. The necessary skills of the new employee are determined.
4. An advertisement in the local newspaper is placed. Recruitment is also done by radio, internet
and internal communication.
5. 1st Job interview (only with the head of HRM).
6. Writing test
7. 2nd Job interview (HRM, Head of the relevant division, one of the directors).
8. Informing the candidate about the contents of the labour contract.
9. Signing of the contract.
10. A test period of three months including training skills necessary in that department.
11. Contract for one year.
All the steps of the recruitment process have to be completed successfully to continue to the next
step. Surprisingly, forecasting is a step that is not performed by Sarandi.
Developing an Effective Workforce is done at Sarandi by organising trainings. The initiative for
organising trainings comes from the departments themselves. The heads of departments let the HRM
department know if they need trainings for their department. Permission for actually organising
trainings has to be given by both the head of HRM and the general director. Examples of trainings that
already have taken place are a powder coating training (painting division), a 5S training (Japanese
method for clean workplaces) and a customer training (sales department).
22 Golbach & Meutstege, “Improving planning and control systems at PT Sarandi”
BPR at PT Sarandi – Process innovation at a manufacturing company in Indonesia
The last element in the strategic human resource management model is maintaining an effective
workforce. Sarandi evaluates every employee each six months. This is done by an evaluation team,
consisting of the relevant head of department, the HRM head and one of the directors. Every
employee is scored on several criteria. An absence penalty is deducted from the added scores to
calculate the final score. There are four score categories:
- A: one year extension of the contract and a bonus
- B: 6-12 months extension and a special skills training
- C: three months extension with training and an extra evaluation
- D: termination or replacement to another department
In practice, termination never occurs. Every year Sarandi adjusts salary for the inflation rate and
performance bonuses if applicable. The existing HR structure at Sarandi is relevant for this research in
the sense that it functions as a framework in which the proposed solutions have to fit.
6.3 Document existing Information Technology
The decision to add this step to the methodology is based on the same logic that is used in the
previous section on human resource architecture. This research also starts with a dirty slate for IT,
improvements will be made on the current situation. To make sure these improvements and
adjustments are possible and compatible with the other already existing systems, an investigation of
the current information technology that is being used in the company is necessary.
The PRLC does not contain this step, so there are also no techniques and tools directly available to
use. This research therefore proposes a technique to perform this step in the BPR cycle. Information
technology is split up in two main parts: Information systems and Information architecture. Information
systems gives a description on what kind of systems, or software, are used in the company.
Information architecture describes what kind of hardware is used.
6.3.1 Information Systems
Laudon & Laudon23 propose a model that consists of six levels of information systems (IS). Sarandi’s
systems have been mapped to those six categories. This is done on the two processes of
manufacturing and HRM because those systems are subject for redesign. It is possible to draw the
relations between the systems in an UML Component Diagram24. This showed not to provide extra
clarity and therefore Table 6.1 shows the mapping of Sarandi’s systems to the six levels of IS.
23 Laudon & Laudon, “Bedrijfsinformatiesystemen” p.43 24 Bell, D. (Dec 15, 2004) “UML basics: the component diagram”, retrieved November 21, 2007, from http://www.ibm.com/developerworks/rational/library/dec04/bell/
36

BPR at PT Sarandi – Process innovation at a manufacturing company in Indonesia
Types of IS Manufacturing HRM Executive Support Systems (ESS) - -
Business Information Systems (BIS) Lead time reports
Quality Control reports
-
Decision Support Systems (DSS) - -
Knowledge Work Systems (KWS) Quality control system
Computer aided design (CAD)
-
Office Systems Production planning spreadsheets Employee feedback spreadsheets
Transaction Processing Systems (TPS) Planning system
Purchasing system
Warehousing system
Quality control system
Employee database
Employee presence system
Table 6.1 Information systems
There are three other systems that are slightly linked to production and HRM besides the systems
mentioned in table 6.1. Those are the research and development and the financial system. The
relationships with these systems have to be kept in mind, while redesigning the production and HRM
systems.
The four TPS within manufacturing are compatible. They store data in the same general system. The
department of engineering uses a separate CAD system.
Table 6.1 makes clear that there are little high level information systems used in Sarandi, especially
because the reports that function as a business information system often can not be generated from
the production data. This leaves management with little knowledge about the process and
performance.
6.3.2 IT architecture
Sarandi makes limited use of IT hardware. The office functions make extensive use of computers.
Also the engineering and research and development departments are computer intensive. The use of
computer technology in the actual manufacturing process is very limited. Research and development
is in the process of designing a automatic cutting machine (computer numerical controlled (CNC)). At
this moment however, operators perform their tasks purely manually.
6.4 Uncover pathologies
After diagnosing the current situation at Sarandi, the reengineering team defined several pathologies
in the manufacturing process. The pathologies were located both in the production department itself,
as in the communication flows with other departments. Some of the pathologies were derived directly
from the BiZZDesigner flowchart, others were mentioned by the head of departments in the interviews
and from the pathologies brainstorm session with the head of departments (also including the
reengineering team).
37
BPR at PT Sarandi – Process innovation at a manufacturing company in Indonesia
The pathologies brainstorm session was performed using the brainstorming process outline by
Hicks25. A pre-meeting with the problem owners, the heads of the relevant departments was already
done in the form of the semi-structured interviews. A warm-up session on a different subject (in this
case: things in life that annoy you) was performed to make the attendants familiar with the
brainstorming framework and to stimulate creativity. The acquisition of on-topic ideas resulted in a list
of pathologies.
Selection of the pathologies to be tackled within this BPR cycle has been done using the SMART
technique, a multi criteria decision analysis (MCDA). This selection step is further explained in section
6.4.2.
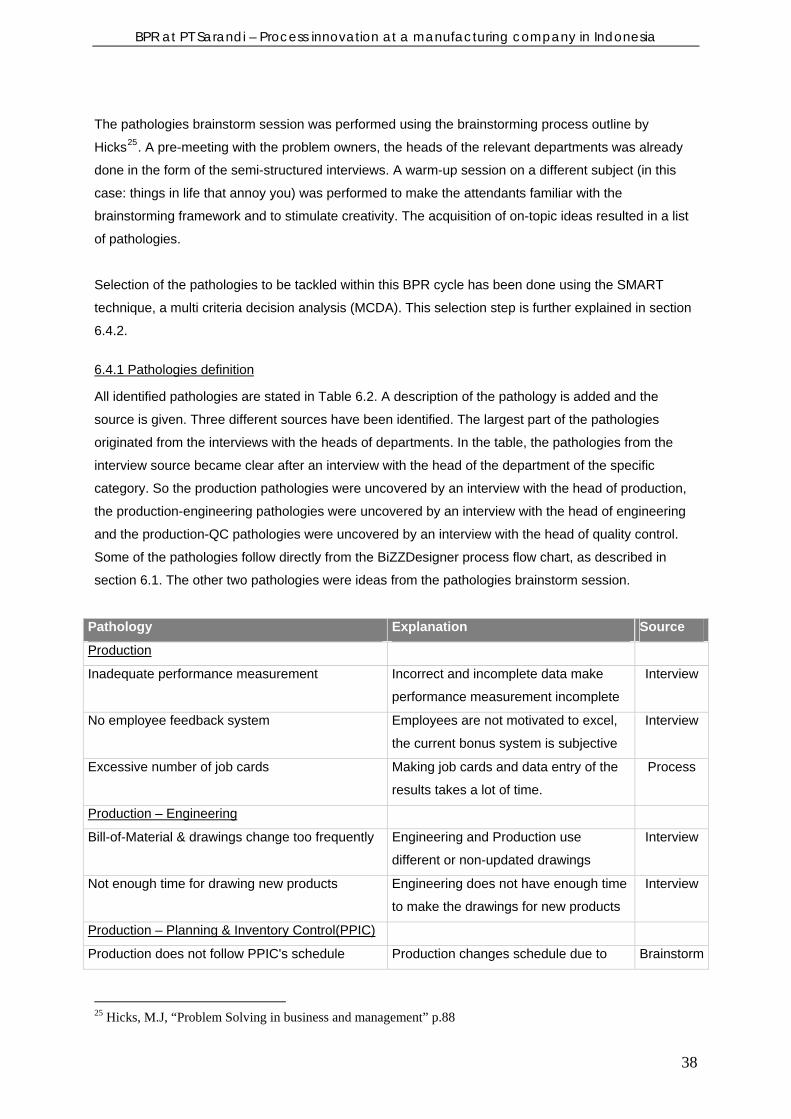
6.4.1 Pathologies definition
All identified pathologies are stated in Table 6.2. A description of the pathology is added and the
source is given. Three different sources have been identified. The largest part of the pathologies
originated from the interviews with the heads of departments. In the table, the pathologies from the
interview source became clear after an interview with the head of the department of the specific
category. So the production pathologies were uncovered by an interview with the head of production,
the production-engineering pathologies were uncovered by an interview with the head of engineering
and the production-QC pathologies were uncovered by an interview with the head of quality control.
Some of the pathologies follow directly from the BiZZDesigner process flow chart, as described in
section 6.1. The other two pathologies were ideas from the pathologies brainstorm session.
Pathology Explanation Source
Production
Inadequate performance measurement Incorrect and incomplete data make
performance measurement incomplete
Interview
No employee feedback system Employees are not motivated to excel,
the current bonus system is subjective
Interview
Excessive number of job cards Making job cards and data entry of the
results takes a lot of time.
Process
Production – Engineering
Bill-of-Material & drawings change too frequently Engineering and Production use
different or non-updated drawings
Interview
Not enough time for drawing new products Engineering does not have enough time
to make the drawings for new products
Interview
Production – Planning & Inventory Control(PPIC)
Production does not follow PPIC's schedule Production changes schedule due to Brainstorm
25 Hicks, M.J, “Problem Solving in business and management” p.88
38

BPR at PT Sarandi – Process innovation at a manufacturing company in Indonesia
problems or delays in manufacturing,
which messes up PPIC`s planning
Production – Warehouse
Incorrect data from warehouse to production The IT system for warehouse is not
working flawless. In practice, manual
data is mostly used
Brainstorm
Production – Quality Control (QC)
Procedures are not clear (inconsistent QC) Not enough manpower to perform
consistent QC, QC is done sometimes
and less in high season
Interview
Insufficient inherent process quality No quality focus by employees, QC
checks after almost every step
Process
Table 6.2 Pathologies
6.4.2 Pathologies choice
The decision maker for this choice is the reengineering team. The members of the reengineering team
represent the different departments and interests of the company and will all have an equal vote. This
ensures an objective choice, instead of a possibly subjective choice based on the vision of one person
or department. The alternative courses of action are the pathologies subject to improvement.
SMART has been used to prioritise the pathologies and to choose a limited number of pathologies to
tackle. The members of the reengineering team were asked to rate the pathologies on three attributes.
Covert states these attributes are general attributes that are often used to prioritise BPR alternatives26.
Feasibility – the easiness to redesign and solve the problem. Feasibility is important, especially in the
first BPR cycle, to create positive momentum for BPR. A high rating on feasibility also implies that it is
possible to solve the pathology in relatively short time, which is especially important in this BPR cycle,
due to the limited amount of time.
Impact on process time – the amount of extra time added to the process caused by the pathology.
The core target of the research is to decrease the manufacturing process time and therefore this
criteria is the most important. The weight of this criteria is double, relatively to the other two.
Dysfunction – ineffectiveness. The relative amount of errors that are caused by the pathology.
Pathologies that score high on this criteria cause a lot of quality problems and are disruptive for the
process.
26 Covert, M., Visible Systems Corporation, “Succesfully performing BPR”
39

BPR at PT Sarandi – Process innovation at a manufacturing company in Indonesia
Because shortening cycle time is the focus of this BPR cycle, impact on process time is the most
important attribute. It is weighted twice as important as the other two attributes, that are considered to
be of equal importance.
The criteria were rated individually (0-100). Afterwards, the individual ratings were added and
weighted to calculate the total score. Table 6.3 states the highest scoring pathologies and their
SMART scores. The complete table can be found in Appendix C.
Please rate on 0-100 Feasibility Normalised
factor 0,25
Impact on
process
time
Normalised
factor 0,5 Dysfunction
Normalised
factor 0.25 Total
Production
Inadequate performance
measurement 570 142,5 440 220 450 112,5 475
Excessive number of job cards 540 135 590 295 565 141,25 571,25
Production - QC
Insufficient inherent process quality 595 148,75 550 275 450 112,5 536,25
Table 6.3 SMART Table
The provisional decision contains the three highest scoring pathologies:
• Excessive number of job cards: from the BiZZDesigner model it becomes clear that there are job
cards for every sub process and that those are made separately and manually. This takes a lot of time
from production administration. This pathology finds its roots in the cooperation with the production
planning department (PPIC). Production administration gets a scheduled start and finish date from
PPIC and their task is to manually make job cards from this information. After every workday
production administration collects all the job cards again and enters the start and finish times of the
jobs of the operators in the system. These two activities obviously take a lot of time and next to this, it
does not even provide optimal job cards (schedules) and no functionality for performance reports.
• Insufficient inherent process quality: The department for quality control (QC) is fully responsible for
quality and checks after almost every step. There is no focus on quality by the employees. In the last
decades in manufacturing companies around the world, there is a shift towards quality control by the
operators themselves. Sarandi should also start implementing this, because this method has proven to
lead to less errors and a decrease in time for quality control.
• Inadequate performance measurement: the current IT system can supply various raw data, but the
information is often incorrect due to mistakes in manual entry and there are no summarising reports
available on the duration of sub processes or errors made.
40

BPR at PT Sarandi – Process innovation at a manufacturing company in Indonesia
Sensitivity analysis has been performed to see how robust the priorities are to changes. Impact on
process time is the most important criterion and has therefore been chosen for the analysis. In this
way it is possible to see if the priorities for the different pathologies change if the weight for this
criterion is altered. The sensitivity analysis can be found in figure 6.3.
Sensitivity analysis
0
100
200
300
400
500
600
700
0 100Weight placed on Impact on process time
Valu
e
Inadequate performancemeasurement
No employee feedback system
Excess job cards
DKB Draw ings change toofrequently
Not enough time for draw ingnew products
IT system w orks until Welding
Production does not followPPIC's schedule
Incorrect data from w arehouseto production
Procedures are not clear(inconsistent quality control)
Insuff icient inherent processquality
1 2
Figure 6.3 Sensitivity analysis
The graph shows that the top two pathologies are constantly valued higher (despite changes in the
weight). Line one represents the chosen weight for impact on process time, fifty percent. When the
weight is 64 percent or higher, priorities three and four switch. ‘Production does not follow PPIC’s
schedule’ becomes number three then. This occurs because this pathology scores low on feasibility. It
will take a lot of time to tackle this problem and therefore it is not suitable enough for this BPR cycle.
The focus will stay on the top three pathologies given by line one:
- Excessive number of job cards
- Insufficient inherent process quality
- Inadequate performance measurement
The three main pathologies are tackled by redesigning them in the next phase of the BPR cycle.
41

BPR at PT Sarandi – Process innovation at a manufacturing company in Indonesia
7. Redesign
The Redesign phase is the step in which the process and the human
resource architecture are changed to solve the pathologies found in the
Diagnose phase. The pathologies for this research are: Excessive number of
job cards, Insufficient inherent process quality and Inadequate performance
measurement.
After documentation, the manufacturing process is ready to be redesigned in this phase. This will be
done by exploring alternative designs and redesigning the process. Also, a new human resource
architecture will be designed and a prototype of the new process will be developed.
7.1 Explore alternative designs
In the previous section many pathologies were discovered and three of them were selected to
continue the process of reengineering. The next step is to design new processes that will translate
these pathologies into more effective and efficient processes. The result is a standard design and an
extended version of this design. The choice for one of these will depend on the preference of Sarandi
and the willingness to put available resources in the change process. The first paragraph in this
chapter will explain the steps of how the new process designs were developed. Then, the two designs
will be described.
7.1.1 Road to the alternative designs
The steps of designing the new process will now be explained. In the diagnose phase a model of the
manufacturing process flows was developed and the most important pathologies were identified. In the
redesign phase a more in-depth process flow diagram was developed, which can be found in figure
7.1 at the end of this section. This diagram was developed by investigating the departments related to
the three pathologies and modelling the current process. When the current sub process is clear, new
optimised processes can be described.
Summarised, the new process that will be designed is a sub process of the total manufacturing
process. This process will include the departments that share a relation with the identified pathologies.
Next, the graphical representation of the current process will be shown and explained. After that, the
different new designs will be described.
42

BPR at PT Sarandi – Process innovation at a manufacturing company in Indonesia
Job Card
MakeJob Card Data entry
SendJob Card
ReceiveJob Card
Production Administration
Manufacturingbatch
Check byDivision Head
ReceiveJob Card
Alert QC
ProductionQuality System
SendJob Card
Repair
DataEntry
error
ok
Manufacturing
Quality Control
InformDivison Head
ok
error
QC
QC System
Planning System
End
Newplanning
Planning
Figure 7.1 Current sub process flow chart
Explanation of the flow chart
In the current situation, the planning department makes a planning for the new incoming order. This
planning only includes a scheduled start en finish date for the total order. The result is a list of start
and finish dates for the current scheduled orders. This list is passed to the production administration.
Then production administration makes job cards for the new order. This is done manually, by
searching in the system for the earliest available operator. This is done for every division separately,
so for machining, welding etc. This obviously takes a lot of time and is not very effective. Next the job
card is given to the operator, who starts working on the next scheduled job and writes down the
starting time on the job card. After finishing the job, the operator writes down the finish time. At the end
of the working day, the operator brings the job card to the production administration and they enter the
data from the job card into the IT system.
When the operator finishes a job, he calls the division head who checks the finished work for visual
errors. If an error is found, the operator repairs it and the QC department is alerted. When no error is
found, also the QC department is alerted. QC performs the full quality control and when errors are
found, the division head is informed. The division head then makes sure the job will be repaired.
7.1.2 Alternative designs
Alternative 1 (standard version)
This process will let operators retrieve their own next scheduled job. The job cards are still made
manually by production administration. While operating the job, the operators have to repair errors
when they see them during the operation. When they are finished, the operators enter the data on a
computer in their own workplace. In the beginning the QC department will still check every job finished
by operators, but they will gradually shift to a new department for prevention of errors, working more
43

BPR at PT Sarandi – Process innovation at a manufacturing company in Indonesia
efficient and finding causes of errors made by operators. This design will lead to the improvement of
all of the issues related to the three pathologies mentioned in section 6.4, except for the large amount
of time of making the job cards manually.
Alternative 2 (extended version)
In this second alternative the job cards will be generated automatically from the production planning.
The rest of the process will be equal to the first alternative. With this extension of the previous design,
also the final issue of the big amount of time for making the job cards is solved.
7.2 Design the new process
The standard version was chosen for implementation. The reengineering team agreed that
implementing this version would make the change still comprehendible for Sarandi. This is very
important, since this is the first time BPR is implemented and a successful change will result in a
positive momentum. But because the extension of the second design will at some time in the future be
inevitable for an optimal process, a process flow diagram has been developed for the second design.
The only difference in the standard version diagram would be a separate planning system. The
diagram is presented in figure 7.2. Next, a more thorough description of the new process will be given.
Make Planning
Planning
Manufacturing Batch Quality Check
Repair
DataEntry
End
sampleok
error
Manufacturing
Planning/Job CardSystem
QualityControl
DataEntry
ok
error
Quality Control
End
Find Source
Quality Improvement
Figure 7.2 New sub process flow chart
7.2.1 Detailed description of the new process
The new sub process from figure 7.2 will have the functionality of automatically generating the job
cards from the production planning. In current sub process, PPIC enters the scheduled start and finish
date of an order in the system and production administration makes job cards from this manually. For
automatic job cards generation, a new information system has to be developed for production planning
and assigning operators to the jobs. This should be well possible, because the only variables needed
44

BPR at PT Sarandi – Process innovation at a manufacturing company in Indonesia
for such a system are the order amount, available capacity and the amount of time each activity takes.
Only the time each activity takes is not known for every activity, but this can quite easily be calculated.
The IT department can develop this new production planning and job card system in-house, together
with PPIC and production. Again, the solution that will be implemented does not have this functionality
because the standard version was chosen to continue the BPR cycle.
When an operator is ready to start his job, he moves to the computer in the workplace and clicks on
his name. This will be a newly installed computer, because at the moment there are no computers on
the work floor. Then the interface shows some relevant information about the next scheduled job. The
time is started and at the same time the relevant information about his next job rolls out of the printer.
While operating on his job, the operator has the responsibility to check his work for quality and repair
when necessary. When the operator is finished working on the job, he moves again to the computer,
clicks on his name and clicks on “finished”. Now the next job automatically appears on the screen, the
time starts again and the operator receives his next job from the printer. At this point in time, the IT
system has received all these data. The IT system should be adjusted so that the relevant information
can be extracted from the system. The same data input will be used for adjusting the production
planning and job cards.
Then the QC department will check the work again for quality and enters the information in the
improved QC part of the IT system. The improved QC system will have the functionality to generate
performance reports for every operator.
Gradually, the operators will get more responsibility for their own quality check, and the QC
department will only check problem areas like the painting procedure and after assembly. Gradually,
personnel will shift to a new department called quality improvement. This department is responsible for
sampling production, prevention of errors, working more efficient and finding causes of errors made by
operators.
7.2.2 Performance of the new process
The result of this new process is that production administration does not have to make job cards and
enter the data from the job cards manually anymore. Next to this, there will be more inherent process
quality because of the shift from quality control by the QC department to the operators themselves.
Thirdly, the new process will have the functionality to generate performance reports per operator
regarding the time they take to finish their jobs and the number of errors they make. A reward system
will be implemented for short times and little errors. In a previous research, Bieze and Jongejan
already introduced some performance indicators. These can be combined with the time and error
indicators.
It is difficult to predict by how much time the cycle time will reduce. This is because of overlap in
processes within the manufacturing process. However, it is possible to strive for a certain amount of
error reduction within the quality control procedure. Given that operators will be trained for quality
check, the implementation of a reward system for little errors and the introduction of the new quality
control procedure, a 50% reduction would be a challenging but realistic goal.
45

BPR at PT Sarandi – Process innovation at a manufacturing company in Indonesia
These mentioned improvements can be reflected against the stated problems of the three pathologies
described in section 6.4. As can be seen, all of the problems related to the pathologies will be tackled
with this new design.
7.3 Design the human resource architecture
The changes in the process have an effect on the tasks and responsibilities of the employees of
different departments. The departments that are most affected are production, production
administration and quality control.
7.3.1 Organisational Changes
In the current situation, production operators only perform quality checks on a very superficial level.
The new process design requires more from the operators. Their responsibility will be extended with
the responsibility of checking the quality of their own work. The management of Sarandi made clear
that this kind of job enrichment, extra responsibility, will only be possible if there is a clear, objective
and transparent feedback system for the operators. Therefore this organisational shift will be
accompanied by an IT system, that actually makes it possible to assess quality delivered by the
employees and reward them for good results. Giving operators more responsibility is currently a part
of Sarandi’s TQM efforts, therefore this organisational change fits with Sarandi’s strategy. The shift
towards a quality-oriented workforce will be difficult and will be discussed further in the Reconstruct
chapter.
In the current situation, the quality control department does not cooperate with the production
department, but only checks finished jobs when requested. In the new design production
administration and quality control will merge to form the new department quality improvement. The
production department will also be more involved in the new quality control procedure. Broadly, two
tasks can be identified for the new quality improvement department:
1. Prevention of errors in the manufacturing process and investigating ways for more efficient
ways of producing, using both BPR and TQM techniques. The opinion of operators will be
used in quality circles, preventive discussions between operators and the members of quality
improvement. Input for these discussions will be the data on process durations and quality
rates as provided by the IT system.
2. Sampling production for errors and retrieving underlying causes of mistakes. If an error is
found, a small task force will be initiated. The task force will exist of the relevant operator(s),
the head of the division and members of the quality improvement department. Their task is not
only to correct, but most important to prevent failures in the future.
Quality improvement will eventually sample twenty percent of the total amount of products produced in
manufacturing and one hundred percent quality check after painting and assembly. The reengineering
team stated the time for this shift to a new quality control procedure to be three months. A detailed
46

BPR at PT Sarandi – Process innovation at a manufacturing company in Indonesia
plan for this shift can be found in the reconstruct phase. A graphical overview of the gradual change is
given in Figure 7.3.
Quality Control
0%
20%
40%
60%
80%
100%
Time
QCQuality ImprovementOperators
Figure 7.3 Percentages quality control
7.3.2 Reward System
In the current situation every employee is evaluated every six months based on scores by an
evaluation team. Scoring is done on subjective criteria. The only objective criterion in the total score is
the absence penalty, which is derived from data from the automatic absence system. With the new
system, feedback and appraisal will be given on more objective criteria. The two most important
performance indicators for every operator are the total delay in raw process time and the repair/reject
rate for quality. The data can be derived directly from the new system. An extra indicator that can be
added to the primary two is the number of implemented ideas per employee as stated by the Bieze en
Jongejan27 research. This encourages ideas for quality improvement and cycle time reduction by the
operators.
7.4 Uncover pathologies
During the steps of designing the new process and designing the new human resource architecture,
extra pathologies can be identified. During this research, there were no clear new pathologies
identified that were more important than those already identified in the diagnose phase.
7.5 Prototyping
After designing the new process and the human resource architecture, the actual IT system that
supports those new processes has to be developed. Sarandi is not using a model language for
designing IT systems, actual IT development is done more on feeling. Therefore an easy to
understand model language has to be used to ensure that the design can be used by Sarandi’s IT
department. Unified Modelling Language (UML) is most suitable for Sarandi, because it is relatively
27 Bieze & Jongejan, “Supporting the company by improving their organizational performance"
47
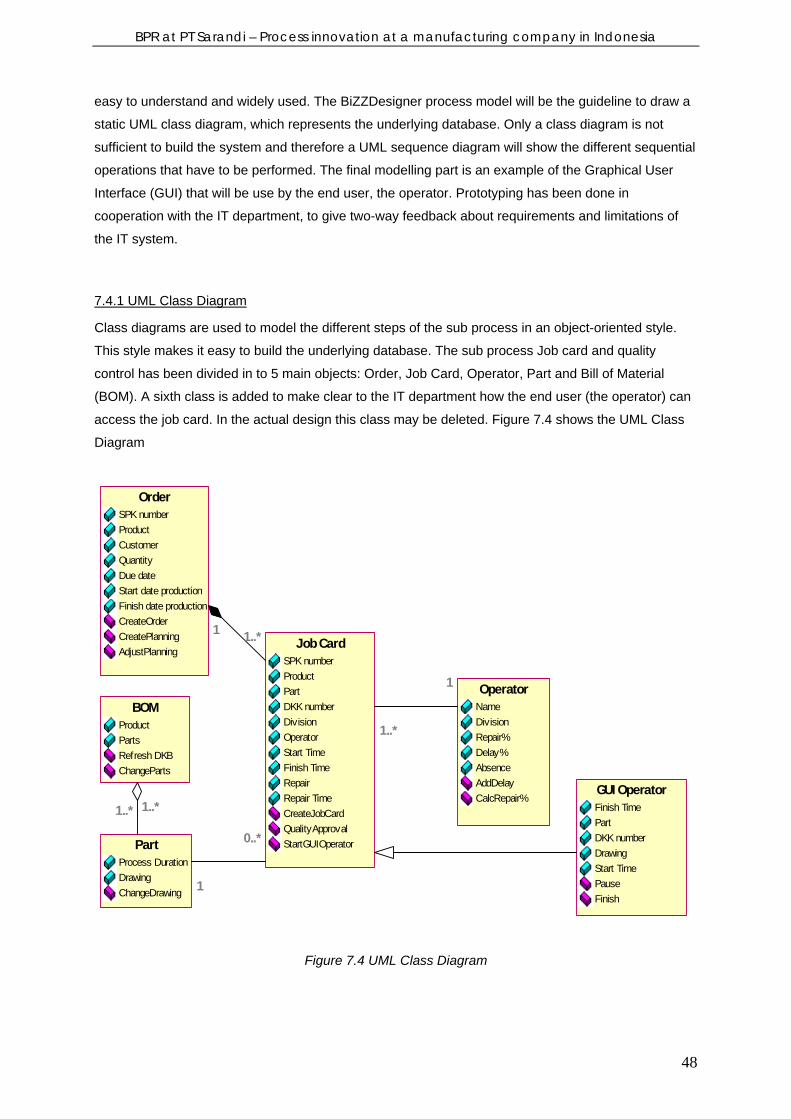
BPR at PT Sarandi – Process innovation at a manufacturing company in Indonesia
easy to understand and widely used. The BiZZDesigner process model will be the guideline to draw a
static UML class diagram, which represents the underlying database. Only a class diagram is not
sufficient to build the system and therefore a UML sequence diagram will show the different sequential
operations that have to be performed. The final modelling part is an example of the Graphical User
Interface (GUI) that will be use by the end user, the operator. Prototyping has been done in
cooperation with the IT department, to give two-way feedback about requirements and limitations of
the IT system.
7.4.1 UML Class Diagram
Class diagrams are used to model the different steps of the sub process in an object-oriented style.
This style makes it easy to build the underlying database. The sub process Job card and quality
control has been divided in to 5 main objects: Order, Job Card, Operator, Part and Bill of Material
(BOM). A sixth class is added to make clear to the IT department how the end user (the operator) can
access the job card. In the actual design this class may be deleted. Figure 7.4 shows the UML Class
Diagram
AdjustPlanningCreatePlanningCreateOrderFinish date productionStart date productionDue dateQuantityCustomerProductSPK number
Order
StartGUIOperatorQualityApprovalCreateJobCardRepair TimeRepairFinish TimeStart TimeOperatorDivisionDKK numberPartProductSPK number
Job Card
FinishPauseStart TimeDrawingDKK numberPartFinish TimeGUI Operator
ChangePartsRefresh DKBPartsProduct
BOM
CalcRepair%AddDelayAbsenceDelay%Repair%DivisionNameOperator
ChangeDrawingDrawingProcess Duration
Part
1..*1..*
1 1..*
1..*
1
1
0..*
Figure 7.4 UML Class Diagram
48

BPR at PT Sarandi – Process innovation at a manufacturing company in Indonesia
The process starts with an order. The order exists of several attributes and operations that can be
performed on the class. After initiating the order, the CreatePlanning operation adjusts the planning
and creates new job card instances for the different divisions. The Job Card is the central object, data
is edited by operators using the GUI Operator. Part data is retrieved from the class Part, a sub class
from the BOM. The BOM and Part classes can be edited by Engineering, in case of new drawings or
changes in for example dimensions. Data about delay and repair percentages are send to the class
Operator after finishing the job. At some point afterwards, Quality Improvement can sample and check
the quality of the part and edit the attribute Repair if repair has to be performed on the part.
An explanation about the multiplicities between the classes can be found in the theoretical
background.
7.4.2. UML Sequence Diagram
The class diagram shows associations and some relations between the different classes, but it does
not show the sequence of operations performed. A UML Sequence diagram has been used to model
the communication between different classes. Figure 7.5 shows the UML Sequence Diagram.
Order
CreateOrder
Job Card
CreateJobCard
GUI Operator
CreatePlanning
StartGUIOperator
Part
Finish
RetrieveDrawing
Repair
Operator
AddDelay
CalcRepair%
QualityApproval
AdjustPlanning
AdjustPlanning
49
BPR at PT Sarandi – Process innovation at a manufacturing company in Indonesia
Figure 7.5 UML Sequence Diagram
The diagram shows that the Job Card class is active during three periods:
1. Initiation of the job card instance after the order has been entered into the system.
2. When the operator starts with the actual manufacturing, the class becomes active again and
creates the user interface for the operator. Afterwards it communicates the results back to the
order class and the operator class.
3. When the part is selected in the sample for quality control, the Quality Improvement
department can give their approval or determine that the part has to be repaired. Data about
repairs are also send to the operator class.
7.4.3 Graphical User Interface (GUI) Operator
The system has to be used by the operators in manufacturing. There has to be a clear user interface
that allows them to work as efficient as possible. Besides that, operates should have limited access to
system variables to minimise errors in data gathering. There are a lot of problems with the input of
start and finish time by operators at the moment because of the manual, paper, job card system. The
new system is able to automatically calculate process durations using the internal clock of the
computer. This is far more reliable and accurate than manual entry. The only necessary entry by
operators is when they finish their current job. The time data will be calculated by the system and
entered in the database. Afterwards the next job for the operator will show up on the screen.
7.4.4 Microsoft Access Prototype
The previous steps in prototyping developed the framework for the system. An actual prototype has
been build using Microsoft Access. Access is used because it is a rapid way of prototyping. Besides
this, Sarandi’s system mainly consists of a large database and Access can model databases easily.
The prototype allows end users to enter the finish time and automatically updates the database. The
next job for the operator is displayed afterwards.
This prototype is used to discuss functionalities with the IT department and making improvements,
before the IT department can start with building the actual system. The actual system will be based on
MySQL database, the new database management system used at Sarandi.
Figure 7.6 shows the main table in the prototype. Production administration can add rows with jobs to
the table. The operators enter duration information automatically, using the GUI. An example is given
in figure 7.6, where operator Mulyadi has performed a drilling job. Reports can easily use the start and
finish dates to calculate durations and delays.
50
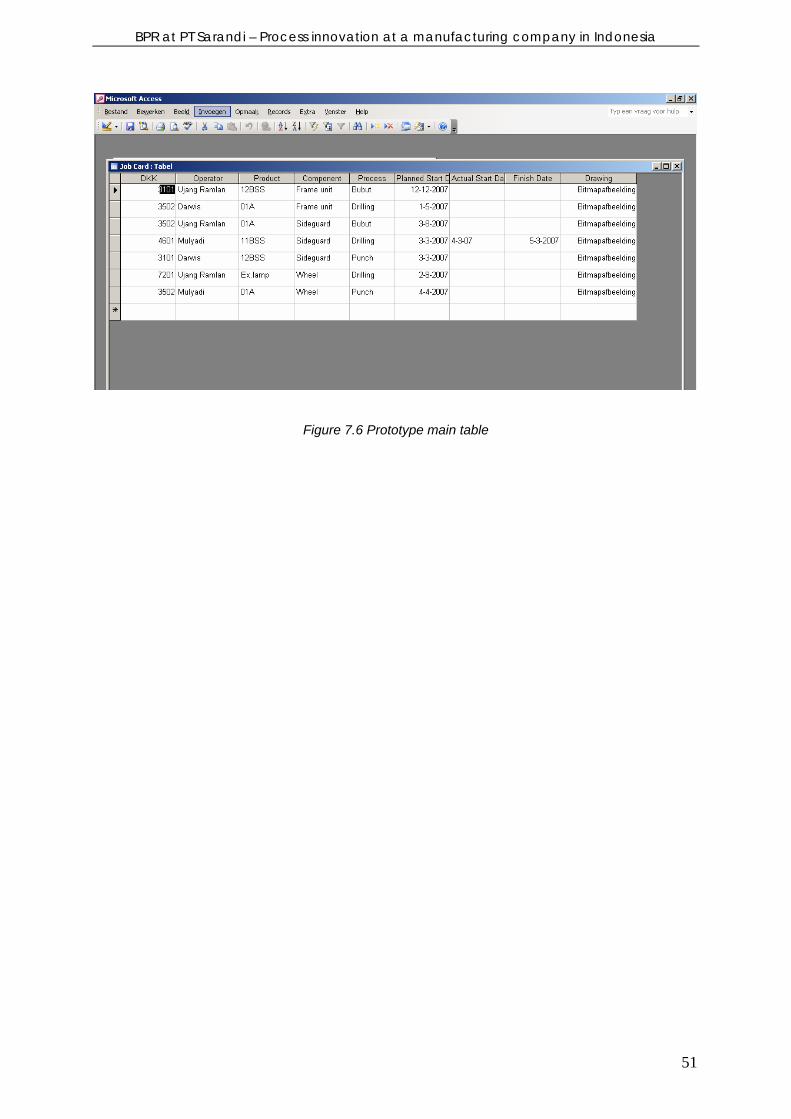
BPR at PT Sarandi – Process innovation at a manufacturing company in Indonesia
Figure 7.6 Prototype main table
51

BPR at PT Sarandi – Process innovation at a manufacturing company in Indonesia
8. Reconstruct
The reconstruct phase is the moment for the actual change of the
organisation: the new IT will be installed and the organisational changes will
be implemented. For Sarandi, this step will contain a detailed plan to
succesfully complete this phase.
Now that the new manufacturing process and human resource architecture are designed, it is time to
formulate requirements and necessary output for the IT system. Next to this, new job and task
descriptions have to be formulated. The shift to the new quality control procedure and managing
cultural aspects will also be subject of the reconstruct phase.
8.1 Install IT
Actual installation of both the software and hardware will be done by the internal IT department of
Sarandi. The objective is to provide Sarandi with a computer terminal in each production department,
where operators can enter their production data in the system as described in section 7.4.
Requirements new system:
• No physical job cards (only for backup)
o Job Cards are shown on screen and possibly printed by a label printer
o Job Cards are shown one by one
• Direct entry job durations by operators
o Operators press finish, the system automatically updates start and finish time
• Direct entry results quality sample
o Quality Improvement has access to the same database and job card instance to enter
the results of quality checks
o Repair times are stored in the system
• One database for drawings Engineering
o Engineering updates drawings in the same database (Part class) to ensure alignment
Necessary output system:
• Accurate data on lead times
o Lead times can be used as input for planning and marketing
• Accurate data on quality performance
o Uncover permanent problems
• Accurate data on delay time/operator
o Operators receive objective feedback based on scores on delay
• Accurate data on quality/operator
52
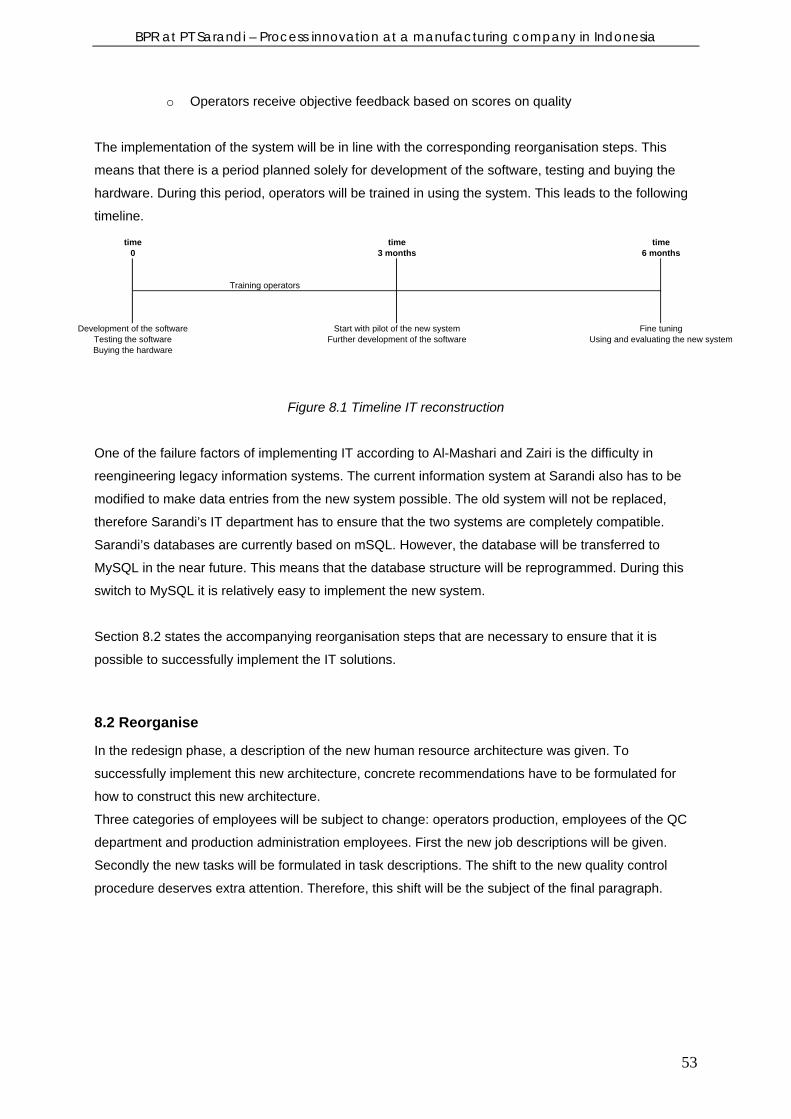
BPR at PT Sarandi – Process innovation at a manufacturing company in Indonesia
o Operators receive objective feedback based on scores on quality
The implementation of the system will be in line with the corresponding reorganisation steps. This
means that there is a period planned solely for development of the software, testing and buying the
hardware. During this period, operators will be trained in using the system. This leads to the following
timeline.
Further development of the software
3 months
Using and evaluating the new system
Training operators
time
Start with pilot of the new system
time6 months
Fine tuning
Buying the hardware
0time
Testing the softwareDevelopment of the software
Figure 8.1 Timeline IT reconstruction
One of the failure factors of implementing IT according to Al-Mashari and Zairi is the difficulty in
reengineering legacy information systems. The current information system at Sarandi also has to be
modified to make data entries from the new system possible. The old system will not be replaced,
therefore Sarandi’s IT department has to ensure that the two systems are completely compatible.
Sarandi’s databases are currently based on mSQL. However, the database will be transferred to
MySQL in the near future. This means that the database structure will be reprogrammed. During this
switch to MySQL it is relatively easy to implement the new system.
Section 8.2 states the accompanying reorganisation steps that are necessary to ensure that it is
possible to successfully implement the IT solutions.
8.2 Reorganise
In the redesign phase, a description of the new human resource architecture was given. To
successfully implement this new architecture, concrete recommendations have to be formulated for
how to construct this new architecture.
Three categories of employees will be subject to change: operators production, employees of the QC
department and production administration employees. First the new job descriptions will be given.
Secondly the new tasks will be formulated in task descriptions. The shift to the new quality control
procedure deserves extra attention. Therefore, this shift will be the subject of the final paragraph.
53
BPR at PT Sarandi – Process innovation at a manufacturing company in Indonesia
8.2.1 New job descriptions
Operator production
The operator is responsible for operating on products within his division. The jobs that need to be
processed will be made available for him. His responsibility is to finish his jobs within the scheduled
time and to deliver good quality. The operator reports to the head of division.
Employee production administration
The production administration employee is responsible for planning the jobs from the scheduled start
and finish dates of an order. Also, it is his responsibility to adjust the planning and job cards when
necessary.
Employee quality control
The employee quality control is responsible for a good quality of all of all the semi-finished products. In
a later stadium, the employee quality control will only be responsible for sampling critical areas in the
production process like painting and assembly.
Employee quality improvement
The employee quality improvement is responsible for prevention of errors in the production process. In
addition, the employee quality improvement samples production for errors and retrieves underlying
causes of mistakes.
8.2.2 New task descriptions
Operator production
The tasks of the operator can be split up into three tasks: retrieving the next job, operating on the
product and assuring good quality. These tasks will now be explained in detail.
Retrieving the next job: the operator can obtain his next scheduled job from a computer system. The
computer is installed in the workspace within his division. The operator sees an interface where he
can click on his name and his next job with all the relevant information will roll out of the printer.
Operating on the product: the main task is to operate on the product so that the product will be ready
to proceed to the next operation.
Assuring good quality: during the process of operating on the product, the operator is responsible for
assuring a good quality of the product. It is his task to make sure no errors will be found later in the
process due to his operations.
Employee production administration
The employee production administration has three tasks: making job cars, monitoring finish dates
operators and adjusting job cards. These tasks will now be explained in detail.
54

BPR at PT Sarandi – Process innovation at a manufacturing company in Indonesia
Making job cards: the PPIC department provides scheduled start and finish dates for the different
orders. It is the task of the employee production administration to make job cards from these data.
Monitoring finish dates operators: operators production are entering their finish data in the computer
system. The employee production administration checks if the entered finish times differ significantly
from the scheduled finish dates.
Adjusting job cards: when the real finish dates of the jobs differ in such a way from the scheduled
finish dates that the planning has to be adjusted, the employee production administration makes new
job cards based on the new schedule.
Employee quality control
The two task of the employee quality control are checking quality and entering data.
Checking quality: the head of division alerts the head of quality control when a job of an operator is
finished. The head of quality control alerts the employee quality control. The employee quality control
then checks the batch for quality.
Entering data: after the quality checks has been performed, the employee quality control enters the
results in the computer system at the quality control department.
Employee quality improvement
The tasks of the employee quality improvement can be split up into four tasks: prevention of errors,
finding ways for more efficient producing, sampling production and retrieving causes of errors.
Prevention of errors: the employee quality improvement will form a quality circle, together operators
from one division. It is his task to organise discussions and find out what improvements there are
possible so that less errors will be made in de production process.
Finding ways for more efficient producing: this task will also be a subject in the previous mentioned
discussions. The employee quality improvement has to make sure the members of the quality circle
come up with ideas about more efficient producing.
Sampling production: the employee quality improvement samples production for quality control. This
will be done on all manufacturing areas. Within critical areas like painting and assembly, all semi-
finished products will be checked.
Retrieving causes of errors: when an error is found by the employee quality improvement, a small task
force will be initiated. The task force will exist of the relevant operator(s), the head of the division and
members of the quality improvement department. Their task is to find out how the errors can be
prevented in the future.
8.2.3 Shift to the new quality control procedure
The quality control and quality improvement department were described as they exist completely next
to each other. In reality, employees from the quality control department will gradually shift to the
quality improvement department so that quality control will completely disappear. At the start of the
implementation, quality control will still check 100% of the batched produced. At the same time, one
person from production administration and one person from quality control will form the new quality
55
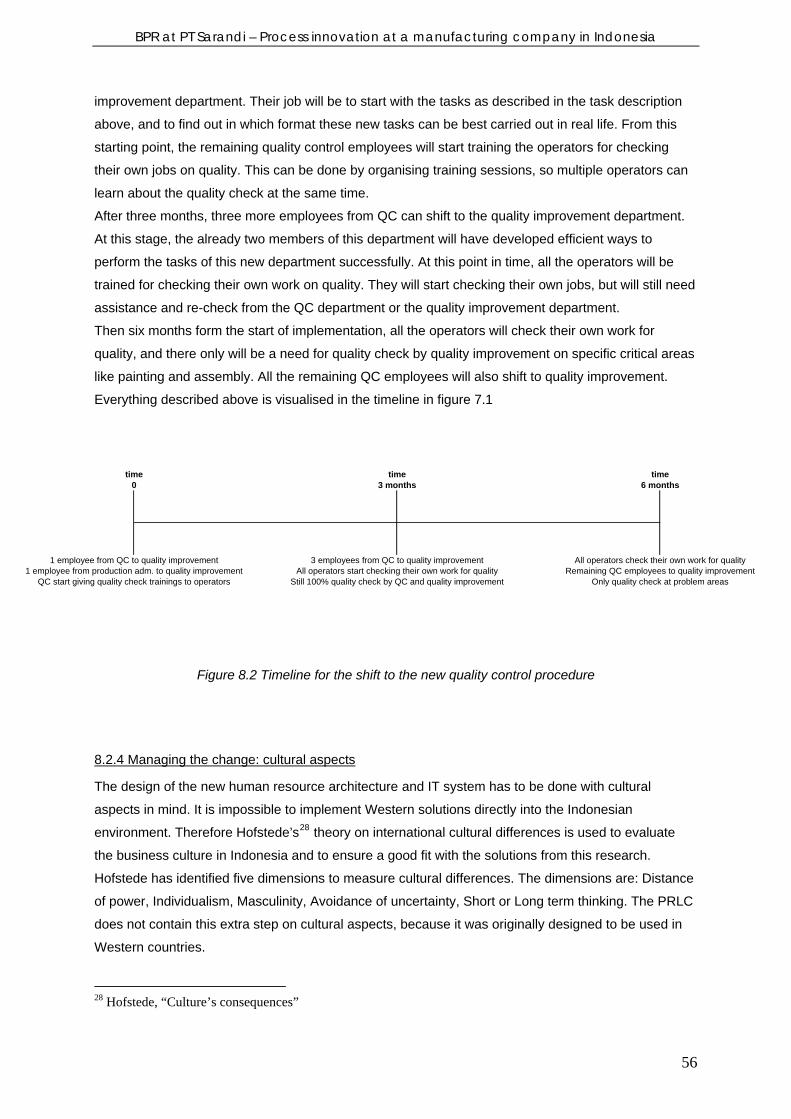
BPR at PT Sarandi – Process innovation at a manufacturing company in Indonesia
improvement department. Their job will be to start with the tasks as described in the task description
above, and to find out in which format these new tasks can be best carried out in real life. From this
starting point, the remaining quality control employees will start training the operators for checking
their own jobs on quality. This can be done by organising training sessions, so multiple operators can
learn about the quality check at the same time.
After three months, three more employees from QC can shift to the quality improvement department.
At this stage, the already two members of this department will have developed efficient ways to
perform the tasks of this new department successfully. At this point in time, all the operators will be
trained for checking their own work on quality. They will start checking their own jobs, but will still need
assistance and re-check from the QC department or the quality improvement department.
Then six months form the start of implementation, all the operators will check their own work for
quality, and there only will be a need for quality check by quality improvement on specific critical areas
like painting and assembly. All the remaining QC employees will also shift to quality improvement.
Everything described above is visualised in the timeline in figure 7.1
All operators start checking their own work for qualityStill 100% quality check by QC and quality improvement Only quality check at problem areas
3 months
Remaining QC employees to quality improvement
time
3 employees from QC to quality improvement
time6 months
All operators check their own work for quality
QC start giving quality check trainings to operators
0time
1 employee from production adm. to quality improvement1 employee from QC to quality improvement
Figure 8.2 Timeline for the shift to the new quality control procedure
8.2.4 Managing the change: cultural aspects
The design of the new human resource architecture and IT system has to be done with cultural
aspects in mind. It is impossible to implement Western solutions directly into the Indonesian
environment. Therefore Hofstede’s28 theory on international cultural differences is used to evaluate
the business culture in Indonesia and to ensure a good fit with the solutions from this research.
Hofstede has identified five dimensions to measure cultural differences. The dimensions are: Distance
of power, Individualism, Masculinity, Avoidance of uncertainty, Short or Long term thinking. The PRLC
does not contain this extra step on cultural aspects, because it was originally designed to be used in
Western countries.
28 Hofstede, “Culture’s consequences”
56

BPR at PT Sarandi – Process innovation at a manufacturing company in Indonesia
The big power distance in Indonesia implies that there is strong hierarchy within companies. This
might be of negative influence on the new quality control procedure, because employees are used to
just do what they are told. There will have to be a culture shift to the new attitude of more responsibility
and suggestions for improvement. When quality controllers are training the operators for the quality
check, they should also emphasize on the importance of this aspect.
The culture from Indonesia is a male dominant one. All of the employees subject to the change
process are male. Since this aspects only gives problems when there are men as well as women
involved, there are no threats that this aspects may cause problems.
Indonesian people are not individualistic. There is no mismatch with the proposed changes in this
report and the fact that the employees have a collective mindset.
The uncertainty avoidance aspect is the same for The Netherlands and Indonesia according to
Hofstede. The members of the reengineering team do not completely agree on this point, because in
Indonesia people are less used to procedures and rules. This could be a problem when implementing
a performance measurement and feedback system. It is important that the feedback system is actually
applied in the beginning, so that the operators understand the rules and consequences are serious. In
the new system, the employees are responsible for entering the data and retrieving their next job. Both
can be a problem because it are procedures that have to be followed. However, entering the data is
necessary for getting the next job and retrieving the job is automatically done when the data is
entered, so there is no room for neglectance.
The above comparison makes clear that the change can fail when the employees are not aware of
these threats. A new attitude, more responsible behaviour and accepting procedures can be reached
by good communication and open information. Of course should, next to this, a reward/punishment
system help to let the employees accept the proposed changes.
57
BPR at PT Sarandi – Process innovation at a manufacturing company in Indonesia
Part III:
Conclusions and Recommendations
The final part contains the conclusions, recommendations and the lists of figures, tables and references.
58
BPR at PT Sarandi – Process innovation at a manufacturing company in Indonesia
9. Conclusions
9.1. General conclusions
The central problem presented in the introduction was formulated as:
How can Sarandi's internal business processes be reengineered to realise a cycle time reduction?
For answering this question, a Business Process Reengineering approach was used. The
manufacturing process was selected as subject for the BPR cycle. Nine pathologies were identified in
the current manufacturing process, from which three were selected for redesign and reconstruct.
Those three pathologies were: the excessive number of job cards, insufficient inherent process quality
and inadequate performance measurement.
Changes in the manufacturing process have been made in two areas: IT and HRM. The underlying
process has been redesigned. The improvements have direct implications on the manufacturing
process and on the supporting process of quality control.
Improvements in the manufacturing process:
- There will be no more time lost by production administration for manually making and adjusting job
cards.
- The physical job card will disappear and no separate IT systems for planning, production and
quality control will exist anymore. Instead, one new IT system will be developed for job cards,
production planning and quality control.
- All relevant information for the operator will be visible on the computer screen in the workplace,
including drawings.
- Accurate registration of start and finish times of jobs of operators due to the new IT system in
newly installed computers in the workplace
- Ability to generate performance reports on total process times and amount of errors by operator.
Improvements in the supporting process of quality control:
- The quality control department will disappear.
- Operators will get the responsibility for checking their own jobs for quality.
- A new department called quality improvement will be formed, which is responsible for the
prevention and finding causes of inefficient production and errors.
The new process will be implemented within the timeframe of six months. The second part of the
central question refers to the problems with the long cycle time. The proposed changes will lead to
59

BPR at PT Sarandi – Process innovation at a manufacturing company in Indonesia
time savings in the manufacturing process. Actual measurement of the improvements can be done by
Sarandi in the Monitor phase, that has yet to be completed.
However, not all the time savings will lead to cycle time reduction, due to parallel processes within the
manufacturing process. ‘No more time lost for manually making and adjusting job cards’ and ‘making
less errors’ will lead to a reduction in cycle time. The other changes will lead to tasks that become
redundant. The result is that the departments of production administration and quality control will be
able to function with less FTE. This efficiency step will be used for the shift to the new department of
quality improvement.
9.2 Conclusions regarding success factors and cultural aspects
The relevant success factors of BPR for Sarandi have been identified. Most of the success factors did
not prove to be major threats to the project. Empowerment of employees during BPR cycle has proven
to be difficult, due to strong hierarchy and Indonesian business culture. Empowerment of the
employees will be increased as a part of the new HRM system. Therefore coming BPR cycles will
have less difficulties with the issue of empowerment. Creating an effective culture for organisational
change is also complex because of the business culture, however such a culture for change has been
achieved by extensive training of operators.
Because this BPR cycle was performed in a culture different from the Western, cultural differences
have gotten extra attention. Big power distance and uncertainty avoidance are the two aspects that
could give problems. An extensive training program is making employees familiar with a more
responsible behaviour and rules an procedures. This new attitude is necessary for the proposed
changes.
9.3 Conclusions regarding BPR in the manufacturing process
As was stated in this report, the manufacturing process is not a process that is commonly selected for
reengineering. In this research there was found that it is very well possible to apply BPR in the
manufacturing process. However, an important comment has to be made: the model which was used
starting the BPR cycle did not prove to be completely sufficient. When reengineering a manufacturing
process, a clean slate approach is not completely logical because there are physical product flows
within a manufacturing process. These physical product flows are not so easy to reengineer from
clean slate because of the direct relation with the size and lay out of the factory. This results in too
much constraints for applying a complete clean slate approach. Therefore a dirty slate approach was
chosen for this BPR cycle. It appeared that the model from Guha missed some aspects for when a
dirty slate approach for BPR is used. For that reason Guha’s model was adjusted so that it fits a dirty
slate approach. This new model is presented in the recommendations section.
60

BPR at PT Sarandi – Process innovation at a manufacturing company in Indonesia
9.4 Summarising conclusion regarding the objective
The improvements in the manufacturing process will lead to cycle time reduction. Cycle time reduction
leads to reduced costs, increased variety and flexibility and improved quality. Those three aspects
combined ensure that a competitive advantage for Sarandi has been obtained, which was the primary
objective of this project.
61

BPR at PT Sarandi – Process innovation at a manufacturing company in Indonesia
10. Recommendations
There are two categories of recommendations for Sarandi and a recommendation on methodology.
The first category contains recommendations on finishing the BPR cycle that has been started by this
research. The second category contains general recommendations for Sarandi.
10.1 Current BPR Cycle
The BPR cycle that was performed in this research is not complete, because of the limited time.
Sarandi should finish the BPR cycle and therefore complete the stages ‘Reconstruct’ and ‘Monitor’.
The stage Reconstruct consists of the steps ‘Reorganise’ and ‘Install IT’. The success factors for BPR
make clear that successful reorganising in Sarandi requires a focus on the success dimensions
‘Change management, systems and culture’ and ‘Organisational structure factors’. Successful
implementation of IT requires a focus on compatibility with the legacy system.
The stage “Monitor’ consists of the two steps ‘Measure performance’ and ‘Link to quality
improvement’. The new IT system makes it possible to precisely measure the performance of the
different manufacturing divisions. This allows Sarandi to pinpoint areas for improvement. As Guha’s
model suggests, Sarandi should go back to the ‘Diagnose’ phase and investigate the processes that
are candidates for improvement. Besides this, the IT department can compare the old lead times with
the new lead times and estimate the benefits of the new system. To improve quality, Sarandi should
keep implementing TQM methods in the processes where BPR was performed.
10.2 General Recommendations
Process Approach
This research has made Sarandi familiar with the possibilities of BPR and more general with a process
approach to improvement. It is therefore important that Sarandi’s management uses these methods in
the future when appropriate.
Automatic planning
Production planning within Sarandi is mainly done by hand. Golbach & Meutstege proposed a
comprehensive in-house developed Master Production Schedule (MPS) and Material Requirements
Planning (MRP) system to overcome the problems caused by manual planning. Unfortunately the
knowledge for developing and implementing such a system is currently not available within Sarandi.
Therefore it is possible to investigate the possibility of buying an IT package or hiring a consultant who
can develop such a system together with Sarandi. Such a system would support the interface and
data measurement system as developed in this BPR cycle.
62
BPR at PT Sarandi – Process innovation at a manufacturing company in Indonesia
Other pathologies
This research focused on three pathologies that were considered most important on the basis of
feasibility, impact on process time and dysfunction. Besides those, there were multiple other problems
extracted from the interviews with Sarandi’s management. Those problem areas still need
improvement. Examples are problems in communication and procedures between both production and
engineering and production and warehouse.
It is necessary to identify new problems on a regular basis. The company can use SMART analysis to
attach priority levels to the problem areas.
10.3 Recommendation on methodology
In the conclusions section was explained that some adjustments were made to Guha’s model for a
dirty slate approach. This adjustment can be generalised for all dirty slate approaches. For this
reason, a new model has been developed that includes the new steps for when performing BPR with a
dirty slate approach. The adjusted model can be found on the next page. The new steps are
“Document existing human resource architecture” and “Document existing IT”. Next to the new steps
concerning the dirty slate approach, there is also a change in the new model regarding “manage
transformation”. This aspect emphasises on keeping in mind succes factors of BPR. Succes factors
concerning managing the change do not get the attention they deserve in Guha’s model. In particular
these factors are “effective communication”, “empowerment”, “people involvement”, “training &
education” and “commited leadership”. Furthermore, when performing BPR in an other culture than
the Western culture, manage transformation also includes accounting for the differences between the
national culture of the specific country and the Western culture.
In this research general tools were used for the two new steps. Finding better tools would lead to a
more stuctured way of performing the steps. On the next page the adjusted model is shown.
63

BPR at PT Sarandi – Process innovation at a manufacturing company in Indonesia
Figure 10.1 Revised PRLC: adjusted for BPR with dirty slate approach
64

BPR at PT Sarandi – Process innovation at a manufacturing company in Indonesia
Figures and Tables
Figures
1.1 BCG Time Focus
2.1 Process Reengineering Life Cycle
3.1 Strategic Human Resource Management
3.2 Modelling Sequence diagrams
3.3 Scores on cultural dimensions for Indonesia
3.4 Scores on cultural dimensions for The Netherlands
5.1 Lead times of manufacturing process of the average order amount (20 beds) 5.2 Lead times of manufacturing process of the most common ordering amount (10 beds)
6.1 Model manufacturing process (part one) 6.2 Model manufacturing process (part two) 6.3 Sensitivity analysis
7.1 Current sub process flow chart
7.2 New sub process flow chart
7.3 Percentages quality control
7.4 UML Class Diagram
7.5 UML Sequence Diagram 7.6 Prototype main table
8.1 Timeline IT reconstruction
8.2 Timeline for the shift to the new quality control procedure 10.1 Revised PRLC
Tables
1.1 TQM versus BPR
2.1 Three Different BPR approaches
3.1 Class diagram associations
3.2 Class diagram multiplicities
3.3 Research steps, techniques and tools applied at Sarandi
5.1 Pareto Analysis
5.2 Reject rates of the quality control procedure
6.1 Information systems
6.2 Pathologies
6.3 SMART Table
65

BPR at PT Sarandi – Process innovation at a manufacturing company in Indonesia
Reference list
Al-Mashari, M., Zairi, M. (1999), “BPR Implementation process: an analysis of key success and failure
factors”
Bieze & Jongejan, “Supporting the company by improving their organizational performance”
Covert, Visible Systems Corporation, “Succesfully performing BPR”
Daft, “Management, ch. 1, 3, 7, 8, 9, 10, 11, 12, 13, 16”
Daft, “Organization theory and design, ch. 8, 10, 11”
Davenport, “Reengineering: business change of mythic proportions?”
Davenport & Short, “The new industrial engineering: information technology and business process
redesign”
Golbach & Meutstege, “Improving planning and control systems at PT Sarandi”
Goodwin & Wright, “Decision analysis for management judgment”, p. 7-26
Grover, “The implementation of Business Process Reengineering, page 17”
Guha, “Business process Change: A study of methodologies, techniques and tools”
Guha, Kettinger & Teng, “Business Process Reengineering: Building a
Comprehensive Methodology”
Hammer, “Reengineering: Don’t automate, obliterate”
Harker, “The art and science of decision making: the analytic hierarchy process”
Hofstede, “Culture’s consequences”
Hicks, “Problem solving and decision making”
Laudon & Laudon, “Bedrijfsinformatiesystemen, h. 2, 11”
Odeh, Beeson, Green & Sa, “Modelling processes using RAD and UML activity diagrams: an
exploratory study”
Katsma, “Business function support”
Krabbendam, “Een methode voor het analyseren van processen in organisaties”
Laudon & Laudon, “Bedrijfsinformatiesystemen” p.43
Miller, (Dec 1, 2003) “Practical UML: A Hands-On Introduction for Developers”, retrieved June 30,
2007, from http://dn.codegear.com/article/31863
PT Sarandi Karya Nugraha, Company Profile
Simon, “Towards a theoretical framework for Business Process Reengineering”
White, IBM corporation, “Introduction to BPMN”
66

BPR at PT Sarandi – Process innovation at a manufacturing company in Indonesia
Appendix A: Organisational chart
67

BPR at PT Sarandi – Process innovation at a manufacturing company in Indonesia
Appendix B: Success factors BPR
68

BPR at PT Sarandi – Process innovation at a manufacturing company in Indonesia
Appendix C: SMART The table states the different pathologies and their ratings on the criteria. The last column indicates
the general importance to tackle that pathology.
Please rate on 0-100 Feasibility Normalised
factor 0,25
Impact on
process
time
Normalised
factor 0,5
Dysfunction Normalised
factor 0.25
Total
Production
Inadequate performance
measurement 570 142,5 440 220 450 112,5 475
No employee feedback system 470 117,5 260 130 500 125 372,5
Excessive number of job cards 540 135 590 295 565 141,25 571,25
Production - Engineering
DKB Drawings change too
frequently 270 67,5 300 150 375 93,75 311,25
Not enough time for drawing new
products 260 65 390 195 305 76,25 336,25
Production - IT
IT system works until Welding 425 106,25 420 210 350 87,5 403,75
Production - PPIC
Production does not follow PPIC's
schedule 515 128,75 480 240 365 91,25 460
Production - Warehouse
Incorrect data from warehouse to
production 295 73,75 265 132,5 415 103,75 310
Production - QC
Procedures are not clear
(inconsistent quality control) 325 81,25 410 205 280 70 356,25
Insufficient inherent process quality 595 148,75 550 275 450 112,5 536,25
69

BPR at PT Sarandi – Process innovation at a manufacturing company in Indonesia
70