bp first quarter 2021
TRANSCRIPT

1Q 2021 financial results
bp first quarter 2021financial results presentation

1Q 2021 financial results
Craig Marshallsvp investor relations

1Q 2021 financial results
Cautionary statementIn order to utilize the ‘safe harbor’ provisions of the United States Private Securities Litigation Reform Act of 1995 (the ‘PSLRA’) and the general doctrine of cautionary statements, bp is providing the following cautionary statement: Thediscussion in this results announcement contains certain forecasts, projections and forward-looking statements - that is, statements related to future, not past events and circumstances - with respect to the financial condition, results ofoperations and businesses of bp and certain of the plans and objectives of bp with respect to these items. These statements may generally, but not always, be identified by the use of words such as ‘will’, ‘expects’, ‘is expected to’, ‘aims’,‘should’, ‘may’, ‘objective’, ‘is likely to’, ‘intends’, ‘believes’, ‘anticipates’, ‘plans’, ‘we see’, ‘focus on’ or similar expressions.
In particular, the following, among other statements, are all forward looking in nature: expectations regarding the COVID-19 pandemic, including the impacts of the pandemic on volume, margin and performance; expectations regarding the shapeof the COVID-19 recovery; expectations regarding oil and gas prices and demand and future refining margins; plans and expectations regarding the divestment programme, including the amount and timing of proceeds in 2021, and plans andexpectations in respect of reaching $25 billion of proceeds by 2025 and expectations that disposal proceeds will reach $5-6 billion during the latter stages of 2021; plans and expectations in respect of maintaining a strong investment grade creditrating; expectations regarding operating cash flow, convenience & mobility EBITDA growth, capital expenditure (including expected capital expenditure of around $13 billion in 2021 and capital expenditure of $14-16 billion thereafter), plans andexpectations with respect to dividends, distributions and share buybacks (including plans and expectations to return at least 60% of surplus cash flow to shareholders and to offset dilution from employee share schemes going forward), includingthe intention of maintaining a dividend of 5.25 cents per ordinary share per quarter; expectations with respect to the timing of cash outflows, including the timing of severance payments associated with the reinvent programme, annual GOM oilspill payment, and an improvement in realized refining margins relative to the quarter-to-date rise in RMM; plans and expectations that convenience and mobility will deliver returns in the range of 15-20%; plans and expectations to develop theUK’s largest blue hydrogen facility targeting one gigawatt of production by 2030; plans and expectations with respect to the roll-out of EV charging networks, including plans to have more than 70 thousand bp-operated EV charge points by 2030;expectations to grow margin share from convenience and electrification to around 50% by 2030; plans and expectations regarding bp’s hydrocarbons business, including achieving $1.5 billion of annual cost savings by 2023 as part of the $3-4billion reinvent bp target; expectations regarding refining margins, refinery capacity additions in 2021, refinery utilization rates, North American heavy crude differential, levels of turnaround activity in the refining portfolio, marketing volumes andproduct demand; plans and expectations regarding the ramp-up and production capacity of the Mad Dog 2, KG D6 Satellite Cluster and Raven projects; plans and expectations to reach 900kboed by the end of 2021; plans and expectationsregarding joint ventures and other agreements, including bp’s partnership with EnBW to develop offshore wind opportunities in the Irish Sea (including the expectation of achieving 8-10% returns), and bp’s partnerships with Amazon, Pure Planet,Utilita, Infosys, BMW, Daimler, Volkswagen Group and other industries and cities; expectations with respect to completion of transactions of agreed disposals; plans and expectations related to potential future transactions; plans andexpectations regarding the net output from the recent UK Round 4 offshore wind lease awards; and plans and expectations regarding bp’s convenience and mobility business, including plans to nearly double EBITDA from 2019 to 2030 withreturns of 15-20%.
By their nature, forward-looking statements involve risk and uncertainty because they relate to events and depend on circumstances that will or may occur in the future and are outside the control of bp.
Actual results may differ materially from those expressed in such statements, depending on a variety of factors, including: the extent and duration of the impact of current market conditions including the volatility of oil prices, the impact ofCOVID-19, overall global economic and business conditions impacting our business and demand for our products as well as the specific factors identified in the discussions accompanying such forward-looking statements; changes in consumerpreferences and societal expectations; the pace of development and adoption of alternative energy solutions; the receipt of relevant third party and/or regulatory approvals; the timing and level of maintenance and/or turnaround activity; the timingand volume of refinery additions and outages; the timing of bringing new fields onstream; the timing, quantum and nature of certain acquisitions and divestments; future levels of industry product supply, demand and pricing, including supplygrowth in North America; OPEC quota restrictions; PSA and TSC effects; operational and safety problems; potential lapses in product quality; economic and financial market conditions generally or in various countries and regions; political stabilityand economic growth in relevant areas of the world; changes in laws and governmental regulations; regulatory or legal actions including the types of enforcement action pursued and the nature of remedies sought or imposed; the actions ofprosecutors, regulatory authorities and courts; delays in the processes for resolving claims; amounts ultimately payable and timing of payments relating to the Gulf of Mexico oil spill; exchange rate fluctuations; development and use of newtechnology; recruitment and retention of a skilled workforce; the success or otherwise of partnering; the actions of competitors, trading partners, contractors, subcontractors, creditors, rating agencies and others; our access to future creditresources; business disruption and crisis management; the impact on our reputation of ethical misconduct and non-compliance with regulatory obligations; trading losses; major uninsured losses; decisions by Rosneft’s management and board ofdirectors; the actions of contractors; natural disasters and adverse weather conditions; changes in public expectations and other changes to business conditions; wars and acts of terrorism; cyber-attacks or sabotage; and other factors discussedelsewhere in this report, as well those factors discussed under “Risk factors” in bp Annual Report and Form 20-F 2020 as filed with the US Securities and Exchange Commission.
Reconciliations to GAAP - This presentation also contains financial information which is not presented in accordance with generally accepted accounting principles (GAAP). A quantitative reconciliation of this information to the most directlycomparable financial measure calculated and presented in accordance with GAAP can be found on our website at www.bp.com.
Tables and projections in this presentation are bp projections unless otherwise stated.
April 2021

1Q 2021 financial results
Bernard LooneyChief executive officer

1Q 2021 financial results
Strong set of results
$35bn net debt target achieved buybacks commencing
Disciplined strategic progress

1Q 2021 financial results
Murray AuchinclossChief financial officer

1Q 2021 financial results
Environment
(1) Spot price
Source: Platts - all data 1 January 2021 to 23 April 2021
Commodity prices $/bbl / $/mmBtu
RMM / Henry Hub
Brent RMM*
▪ Average Brent price $61/bbl38% higher
▪ bp’s average RMM* $8.70/bbl47% higher
▪ Average Henry Hub1 price $3.50/mmBtu40% higher
BrentHenry Hub
* For items marked with an asterisk throughout this document, definitions are provided in the glossary
1Q 2021 vs 4Q 2020

1Q 2021 financial results
1Q 2021 vs 4Q 2020
▪ Exceptional gas marketing and trading performance
▪ Significantly higher oil prices
▪ Higher refining margins
1Q21 underlying results summary
$bn 1Q20 4Q20 1Q21
Underlying RCPBIT* 2.4 1.0 4.7
Gas & low carbon energy 0.8 0.2 2.3
Oil production & operations 0.9 0.6 1.6
Customers & products 0.9 0.1 0.7
Rosneft* (0.0) 0.3 0.4
Other businesses and corporate (0.4) (0.1) (0.2)
Consolidation adjustment - UPII 0.2 (0.1) 0.0
Underlying replacement cost profit 0.8 0.1 2.6
Operating cash flow 1.0 2.3 6.1
Capital expenditure (3.9) (3.5) (3.8)
Divestment and other proceeds 0.7 4.2 4.8
Net issue (repurchase) of shares (0.8) 0.0 0.0
Net debt 51.4 38.9 33.3
Announced dividend per ordinary share (cents per share) 10.50 5.25 5.25

1Q 2021 financial results
$35bn net debt target achieved
Dividends4
1Q21 cash inflows/outflows $bn
▪ $11.0bn cash inflow*
▪ $6.1bn operating cash flow
▪ $4.8bn disposal proceeds*
▪ $5.6bn net debt reduction
▪ $35bn net debt target achieved – $33.3bn at end-1Q21
▪ $1.7bn surplus cash flow* at end-1Q21
▪ Expect surplus cash flow deficit in 2Q21
▪ Expect 2H21 surplus cash flow above
− ~$45/bbl Brent
− ~$13/bbl RMM*
− $3/mmBtu Henry Hub

1Q 2021 financial results
Progressing to the next phase of our financial frame
Resilient dividend Resilient dividend
Deleverage to $35bn net debt– target now retired
Strong investmentgrade credit rating
Low carbon* and convenience and mobility spend ~$4-6bn per year
Low carbon* and convenience and mobility spend ~$5-7bn per year
Resilient hydrocarbonsspend ~$9bn per year
Resilient hydrocarbons spend ~$9bn per year
Buybacks to offset employee share plan dilution & return at least
60% of surplus cash flow*
1
2
3
4
5
Phase 1 – delivered Phase 2 – clear hierarchy of priorities

1Q 2021 financial results
Committed distributions – buybacks commencing in 2Q21
2021-25 average annual per share distributions* c/share
2021 implementation
▪ Resilient dividend at 5.25 cents per share per quarter*
▪ Share buybacks comprising two elements:
▪ Offset expected full-year dilution from employee share schemes in the second quarter at a cost of ~$500m
▪ Distribute 60% of surplus cash flow* via buybacks*
with remaining 40% planned to be used to deleverage
▪ Update on 3Q21 buybacks with 2Q21 results
Brent $/bbl1
Total buybacks*Dividend
(1) 2020 real

1Q 2021 financial results
Bernard LooneyChief executive officer

1Q 2021 financial results
H2 Teesside
Targeting 1GW blue
hydrogen with UK’s largest project
Delivering disciplined strategic progress
Puma West discovery in deepwater Gulf
of Mexico
Growing high margin oil and gas business in
Gulf of Mexico
Mad Dog Phase 2 Argos platform arrives in Texas
Agreements with leading OEMs to
advance EV charging strategy in Europe
Lightsource bp grows pipeline by
1.4GW net to bp
Continued roll-out of strategic
convenience sites
>10% year-on-year
growth in convenience gross margin*
Advanced offshore wind strategy
Strong hopper growth
3.7GW net in pipeline
EV transition Castrol
e-fluids launched
Major project delivery
Raven
KG-D6 Satellite Cluster
Partnerships with countries, cities
and industries expanded
Strategic collaboration with Infosys to develop integrated Energy-as-a-
Service offer in India

1Q 2021 financial results
\
\\
Roll-out of EV-only ultra-fast charging hubs Potential future demand pool for renewable power
Working with VW Group to extend and integrate ultra-fast EV charging
EBITDA* nearly doubling from ~$5bn
in 20191 with15-20% ROACE*
Targeting >70,000 bp-operated
EV charging points
Driving integration with convenience to grow margin share
from convenience and electrification* to ~50%Investment in DCS to advance
simple, seamless and convenient EV charging
\ New range of e-fluids launched
Customers
Convenience and mobility
Strategic partnerships
Fast and convenient charging
Advantaged network
Digital solutions and loyalty
Most efficient price-setter
Accelerating roll-out of ultra-fast charging points at Aral retail sites
Electrification in EuropeRapidly scaling to provide the fastest, most convenient and reliable network of chargers
Success factors
(1) Growth vs. 2019 customers – convenience and mobility EBITDA

1Q 2021 financial results
Lease area 1
Lease area 2
▪ Two 60 year leases in the Irish Sea
Project expected to meet 8-10% returns threshold
Scale
Capability
Capital discipline
expected returns
Why bp?
UK offshore windDriving value through our distinctive capabilities and integration
Value chain
Project management
Trading
Operations
Supply chain
▪ Opportunities for shorter cycle times
Low carbon electricity and
energy strategy
UK offshore wind
▪ Favourable shallow water location
− 35m water depth− 30km from coast
▪ Advantaged resource
− above average wind conditions
▪ 3GW gross potential
▪ Synergies in execution and operations

1Q 2021 financial results
\
A single operating modelMaximising value through efficiencies and integration
Significantly contribute to $1.5bn cost savings included in our $3-4bn
Group target1
Drive improved reliability and
availability
Add further integration value by leveraging
capabilities into low carbon*
We expect the single operating model to
Trinidad Cassia Compression
bp solutions Sharing best practices across our global portfolio to add value
Operator Workbench Deploying digital tool to improve collaboration, safety and efficiency
USWhiting
Oman
(1) Expect $1.5bn of annual cost savings of hydrocarbon business by 2023, relative to 2019, net to bp. This forms part of $3-4bn Group pre-tax cost savings target from reinvent by 2023, relative to 2019
Principles
Digitally enabled
Agile structure and ways of working
Centralised and standardised
AzerbaijanAgile working pilotEgypt
RavenUS Gulf of MexicoAtlantis

1Q 2021 financial results
Strong set of results
$35bn net debt target achieved buybacks commencing
Disciplined strategic progress

1Q 2021 financial results
Q&A

1Q 2021 financial results
Appendix

1Q 2021 financial results
Investor proposition
(1) At least 60% of surplus cash as buyback after having reached $35bn net debt and subject to maintaining a strong investment grade credit rating(2) ROACE: return on average capital employed as defined in bp’s 2019 annual report, by 2025, $50-60/bbl (2020 real), at bp planning assumptions (3) By 2025
Profitablegrowth
Committeddistributions
Sustainablevalue
Resilient dividend of 5.25 cents per
share per quarter*
≥60% surpluscash as share
buybacks1
7-9% EBIDA*
per share CAGR*
>20% capital employed
in transition3
Growing ROACE to
12-14%2

1Q 2021 financial results
Guidance
Total capital expenditure
~$13bn
DD&A Similar level to 2020
Gulf of Mexico oil spill payments
~$1bn post-tax
OB&C* underlying annual charge
$1.2-1.4bnQuarterly charge may vary quarter to quarter
Underlying effectivetax rate* >40%1
(1) Underlying effective tax rate is sensitive to the impact that volatility in the current environment may have on the geographical mix of the group’s profits and losses
Full year 2021 2Q21 vs 1Q21
▪ Higher product demand across our customer businesses asrestrictions begin to ease and vaccination rollouts continue
▪ This should help provide some support to industry refiningmargins, although realized refining margins are expected to showa smaller improvement due to the slower recovery in diesel andjet demand and a narrower North American heavy crude oildifferential. In addition, we expect a higher level of turnaroundactivity in our refining portfolio
▪ Lower reported upstream production mainly due to divestmentsand seasonal maintenance activities, primarily in the Gulf ofMexico, the North Sea, and Trinidad, partly offset by the ramp upof the Raven and KG D6 R Cluster major projects. Within this, weexpect both gas & low carbon energy and oil production &operations to be lower
Reported upstream production (ex. Rosneft)
Lower than 2020 due to the impact of the ongoing divestment programme
Underlyingproduction*
(ex. Rosneft)
Slightly higher than 2020 due to the ramp-up ofmajor projects, primarily in gas regions, partlyoffset by the impacts of reduced capitalinvestment and decline in lower-margin gasassets

1Q 2021 financial results
Medium term financial frame
Reported upstream production (ex. Rosneft)
2.6mboed 2.4mboedlower than 2020
slightly higher underlying basis~2.0 mboed
Capital expenditure $19.4bn
$15.2bn ex. inorganic
$14.1bn$12bn ex. inorganic
~$13bn $14-16bn
Cash cost saving (vs 2019)
N/A 12% reduction $2.5bn before end-2021$3-4bn in 2023
from reinvent bp
Divestment andother proceeds
$2.8bn$6.6bn
inc. $4.8bn in 2H20$5-6bn $25bn 2H20-2025
Net debt $45.4bn $38.9bnmaintain a strong investment
grade credit rating
ROACE* 8.9% (3.8%) 12-14% by 20251
EBIDA* per share 156¢ 95¢7-9% CAGR by 20251
vs 2H19-1H20
Dividend 41¢/share 31.5 ¢/shareResilient dividend at5.25¢/sh per quarter*
Buybacks N/A N/A Offset dilution from employee share plans
Return at least 60% of surplus cash flow* via buybacks*
(1) $50-60/bbl (2020 real), at bp planning assumptions

1Q 2021 financial results
1Q 2021 summary
$bn 1Q20 4Q20 1Q21 % Y-o-Y % Q-o-Q
Gas & low carbon energy 0.8 0.2 2.3
Oil production & operations 0.9 0.6 1.6
Customers & products 0.9 0.1 0.7
Other businesses and corporate (0.4) (0.1) (0.2)
Underlying business RCPBIT* 2.2 0.7 4.3 94% 489%
Rosneft* (0.0) 0.3 0.4
Consolidation adjustment – unrealised profit in inventory 0.2 (0.1) 0.0
Underlying RCPBIT* 2.4 1.0 4.7 96% 385%
Finance costs* (0.7) (0.6) (0.6)
Tax (1.0) (0.2) (1.3)
Minority interest 0.0 (0.1) (0.2)
Underlying replacement cost profit 0.8 0.1 2.6 232% 2187%
Underlying effective tax rate* 55% 40% 30%
Operating cash flow 1.0 2.3 6.1 542% 169%
Underlying earnings per share (cents) 3.9 0.6 13.0 231% 2180%
Announced dividend per ordinary share (cents per share) 10.50 5.25 5.25 (50%) 0%

1Q 2021 financial results
Gas and low carbon energy
1Q 2021 vs 4Q 2020
▪ Exceptionally strong gas marketing and trading results
▪ Higher realisations and higher production from gas major projects andrecovery from planned maintenance
Underlying RCPBIT* $bnProduction volume 1Q20 4Q20 1Q21
Liquids (mbd) 96 98 112
Natural gas (mmcfd) 4,665 4,049 4,623
Total hydrocarbons (mboed) 900 796 909
Realisations* 1Q20 4Q20 1Q21
Liquids ($/bbl) 45.70 36.51 55.38
Natural gas ($/mcf) 3.51 3.37 3.94
Total hydrocarbons ($/boe) 23.30 21.27 26.84
Operational metrics (GW, bp net) 1Q20 4Q20 1Q21
Installed renewables capacity* 1.1 1.5 1.6
Developed renewables to FID* 2.7 3.3 3.3
Renewables pipeline* N/A 10.9 13.8
Selected financial metrics ($bn) 1Q20 4Q20 1Q21
EBITDA* 1.9 0.9 3.1
Capital expenditure - gas 1.2 0.9 0.8
Capital expenditure - low carbon 0.0 0.5 1.1

1Q 2021 financial results
Gas and low carbon energyBuilding scale and capability with capital discipline and a returns focus
Developed to FID* and pipeline*
GW bp netPipeline*
By technologybp net
Hopper*
bp net
GW active projectsan increase of 15GW from
4Q20
30 projects developed to FID*
with Lightsource bp weighted average expected IRR of 8-10%
Developed to FID* and pipeline* ~3GW higher than
4Q20

1Q 2021 financial results
Oil production and operations
Underlying RCPBIT* $bn
1Q 2021 vs 4Q 2020
▪ Higher liquids and gas realisations
Partially offset by
▪ Lower production
(1) Excluding Rosneft(2) On a year to date basis
Production volume1 1Q20 4Q20 1Q21
Liquids (mbd) 1,211 1,021 997
Natural gas (mmcfd) 2,723 1,962 1,810
Total hydrocarbons (mboed) 1,679 1,359 1,309
Realisations* 1Q20 4Q20 1Q21
Liquids ($/bbl) 47.64 38.58 52.92
Natural gas ($/mcf) 1.44 2.38 4.11
Total hydrocarbons ($/boe) 37.10 33.18 46.81
Combined upstream 1Q20 4Q20 1Q21
Oil and gas production1 (mboed) 2,579 2,155 2,218
Realisations* ($/boe) 31.80 28.48 37.75
Unit production costs*1,2 ($/boe) 7.07 6.39 7.36
bp-operated plant reliability*2
(%) 93.0 94.0 93.0
Selected financial metrics ($bn) 1Q20 4Q20 1Q21
Exploration write-offs 0.1 0.1 0.1
EBITDA* 3.1 2.5 3.2
Capital expenditure 2.0 1.1 1.3

1Q 2021 financial results
Customers and products
Underlying RCPBIT* $bn
(1) Castrol is included in customers – convenience & mobility(2) Reported to the nearest 100(3) Comparative information for 2020 has been restated for the changes to net presentation of revenues and purchases
relating to physically settled derivative contracts effective 1 January 2021. For more information see SEA - note 1 basis of preparation - voluntary change in accounting policy
Customers - convenience & mobility 1Q20 4Q20 1Q21
Customers - convenience & mobility EBITDA* 1.0 1.0 1.0
Castrol 1 EBITDA * 0.2 0.3 0.4
Capital expenditure 0.3 0.4 0.3
bp retail sites - total2 18,900 20,300 20,300
bp retail sites in growth markets2 1,300 2,700 2,700
Strategic convenience sites2 1,700 1,900 2,000
Refining environment 1Q20 4Q20 1Q21
RMM* ($/bbl) 8.8 5.9 8.7
Refining throughputs (mb/d) 1,806 1,628 1,601
Refining availability* (%) 96 96 95
Products - refining & trading 1Q20 4Q20 1Q21
EBITDA* 0.6 (0.2) 0.4
Capital expenditure 0.3 0.4 0.2
Marketing sales of refined products (mb/d)3 2,968 2,683 2,476
1Q 2021 vs 4Q 2020
Customers – Material and resilient performance despite renewed COVID restrictions
▪ Retail and aviation volumes impacted due to COVID-19 restrictions
▪ Resilient convenience performance
▪ Stronger performance in Castrol supported by stronger volumes andgrowth market earnings
Products – Improved refining environment and lower TAR activity. Higher contribution from trading
1Q 2021 financial results
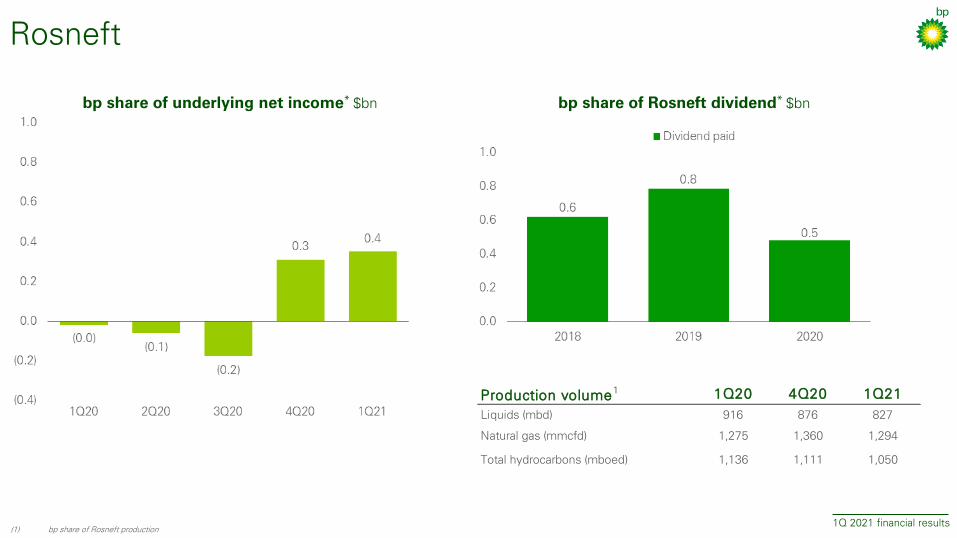
bp share of Rosneft dividend* $bnbp share of underlying net income* $bn
(1) bp share of Rosneft production
Rosneft
Production volume1 1Q20 4Q20 1Q21
Liquids (mbd) 916 876 827
Natural gas (mmcfd) 1,275 1,360 1,294
Total hydrocarbons (mboed) 1,136 1,111 1,050

1Q 2021 financial results
Glossary

1Q 2021 financial results
Glossary2021-25 average annual per share distributions
Dividend assumes 5.25 cents per ordinary share per quarter plus totalbuyback expenditure divided by projected share count
2021-25 average based on intended buybacks to offset dilution fromemployee share options and using 60% of surplus for buybacks, at referenceoil price and 2021-5 average bp planning assumptions ($11/bbl 2021 RMM,$3.mmbtu Henry Hub, 2020 real)
bp-operated plant reliability
Calculated taking 100% less the ratio of total unplanned plant deferralsdivided by installed production capacity. Unplanned plant deferrals areassociated with the topside plant and where applicable the subsea equipment(excluding wells and reservoir). Unplanned plant deferrals includebreakdowns, which does not include Gulf of Mexico weather relateddowntime.
bp share of Rosneft dividend
From 2018, represents bp’s share of 50% of Rosneft’s IFRS net profit
bp share of underlying net income
On a replacement cost basis and adjusted for adjusting items; 1Q21represents bp estimate
Buybacks from surplus cash flow
bp is committed to returning at least 60% of surplus cash flow over time, byway of share buybacks, subject to maintaining a strong investment gradecredit rating. In considering the quantum of share buybacks, the board willtake account of the cumulative level of, and outlook for, surplus cash flow,with the intention to provide guidance on a quarter-forward basis while macrouncertainties remain.
Cash inflow Operating cash flow plus divestment and other proceeds
Convenience gross margin
Store gross margin as well as other merchandise and service contribution, notconsidered as retail fuels or store gross margin, received from the retailservice stations operated under a bp brand, excluding equity-accountedentities.
Developed renewables to FID
Total generating capacity for assets developed to FID by all entities where bphas an equity share (proportionate to equity share). If asset is subsequentlysold bp will continue to record capacity as developed to FID. If bp equityshare increases developed capacity to FID will increase proportionately toshare increase for any assets where bp held equity at the point of FID.
Disposal proceeds
Divestments and other proceeds
EBIDA Underlying replacement cost profit before interest and tax, add backdepreciation, depletion and amortization and exploration expenditure written-off (net of adjusting items), less taxation on an underlying RC basis
EBIDA per share CAGR
2H19/1H20-2025, $50-60/bbl Brent (2020 real), at bp planning assumptions
EBITDA Underlying replacement cost profit before interest and tax, add backdepreciation, depletion and amortization and exploration expenditure written-off (net of adjusting items)
Finance costs Finance costs and net finance income or expense relating to pensions andother post-retirement benefits
Hopper Renewable hopper comprises of project opportunities from the point of initialevaluation until they are either stopped or become part of the renewablepipeline
Installed renewables capacity
bp's share of capacity for operating assets owned by entities where bp has an equity share
Lease payments Lease liability payments
Low carbon Low carbon electricity and energy
Margin share for convenience and electrification
Ratio of convenience and electrification gross margin of total consumerenergy (retail fuels and electrification) and convenience gross margin,excluding equity accounted entities

1Q 2021 financial results
GlossaryOB&C Other businesses and corporate
Pipeline Renewable pipeline includes projects that have achieved pre-set milestonecriteria
Realisations Based on sales of consolidated subsidiaries only, excluding equity-accountedentities
Refining availability
bp-operated refining availability
Refining marker margin (RMM)
Based on bp’s portfolio
Renewables pipeline
Renewable projects satisfying criteria to the point they can be considereddeveloped to final investment decision (FID): Site based projects haveobtained land exclusivity rights, or for PPA based projects an offer has beenmade to the counterparty, or for auction projects pre-qualification criteria hasbeen met, or for acquisition projects post a binding offer being accepted.
Replacement cost profit before interest and tax (RCPBIT)
Adjusted for adjusting items and fair value accounting effects
Resilient dividend at 5.25 cents per share per quarter
Dividend per ordinary share per quarter, intended to remain fixed at this level,subject to board discretion each quarter
ROACE Return on average capital employed as defined in bp’s 2020 annual report
Rosneft RCPBIT bp estimate of Rosneft earnings after interest, tax and minority interest
Surplus cash flow
Non-GAAP measure and refers to surplus of sources of cash, after reachingthe $35 billion net debt target, including operating cash flow and divestmentand other proceeds, over uses, including leases, hybrid servicing costs,dividend payments, cash capital expenditure and the cost of share buybacksto offset the dilution from vesting of awards under employee share schemes
Total buybacks Buybacks to offset dilution from employee share schemes plus buybacksfrom surplus cash flow
Underlying effectivetax rate
Underlying effective tax rate on replacement cost profit adjusted to removethe effects of adjusting items and fair value accounting effects
Underlying production
When compared with 2020, is production after adjusting for acquisitions anddivestments, curtailments, and entitlement impacts in our production-sharingagreements/contracts and technical service contract
Unit production costs
Calculated as production cost divided by units of production. Production costdoes not include ad valorem and severance taxes. Units of production arebarrels for liquids and thousands of cubic feet for gas. Amounts disclosed arefor bp subsidiaries only and do not include bp’s share of equity-accountedentities