bp cherry point cogeneration project · 2011-07-29 · bp cherry point cogeneration project. the...
TRANSCRIPT

BP Cherry Point Cogeneration Project
Volume 1 - Draft Environmental Impact StatementDOE/EIS-0349
Lead Agencies:
Energy Facility Site Evaluation Council
Bonneville Power Administration
Cooperating Agency:
U.S. Army Corps of Engineers
September 5, 2003

EFSEC Washington State Energy Facility Site Evaluation Council
September 5, 2003 Dear Reader: Enclosed for your review is the Draft Environmental Impact Statement (DEIS) for the proposed BP Cherry Point Cogeneration Project. The proponent, BP West Coast Products, LLC, has requested to build a 720-Megawatt Gas-Fired Combined Cycle Cogeneration Facility in Whatcom County, Washington, and interconnect this facility into the regional power transmission grid. To integrate the new power generation into the transmission grid, Bonneville Power Administration (Bonneville) may need to re-build 4.7 miles of an existing 230-kV transmission line. The Energy Facility Site Evaluation Council (EFSEC or Council) and Bonneville have completed this DEIS under contract with Shapiro and Associates. The analysis was undertaken to meet the direction of the State Environmental Policy Act (SEPA) for state and private lands, and the National Environmental Policy Act (NEPA) and other relevant federal laws and regulations for Federal permits and approvals. The scoping phase of this project analysis has identified several issues that are addressed in the DEIS. A No Action and Action Alternative, and alternative components, including mitigation measures, are discussed in detail in the DEIS. To ensure a complete analysis, we are asking you to help by reviewing this DEIS and providing comments. The comment period for this document closes on October 27, 2003. We have scheduled a public meeting to discuss the findings in the DEIS. The public meeting will be held as indicated below. There will be an open house before the meeting, from 6:30 to 7:00 p.m. Comments will be received from 7:00 to 9:00 p.m.
Wednesday, October 1, 2003 Open House: 6:30 to 7:00 p.m.
Public Comments: 7:00 to 9:00 p.m. Blaine Performing Arts Center
975 H Street Blaine, Washington, 98230

Letter to Reviewers Draft Environmental Impact Statement BP Cherry Point Cogeneration Project Page 2 of 2 For further information regarding this proposal, you may also contact Irina Makarow at (360) 956-2047 or Tom McKinney at (503) 230-4749. For copies of the DEIS, please contact Irina Makarow at (360) 956-2047, or you may access it on the Internet at www.efsec.wa.gov. Please send your comments to either: Allen Fiksdal, Manager Energy Facility Site Evaluation Council P.O. Box 43172 Olympia, WA 98504-3172
BP Cherry Point Project Comments BPA Communications Office KC-7 P.O. Box 14428 Portland, OR 97293-4428
Comments on this document must be postmarked by October 27, 2003. Bonneville and EFSEC will review and respond to all comments and intend to publish a Final EIS during Winter 2003. Please Note: Comments received in response to this solicitation, including names and addresses of those who comment, will be considered part of the public record on this proposed action and will be available for public inspection. Please remember, for a comment to be considered to have substance, it needs to:
1. Provide new information pertaining to the proposed action or an alternative;
2. Identify a new issue or expand upon an existing issue;
3. Identify a different way to meet the underlying need;
4. Provide an opinion regarding an alternative, including the basis or rationale for the opinion;
5. Point out a specific flaw in the analysis; or
6. Identify a different source of credible research which, if used in the analysis, could result in different effects.
Note to Reviewers: Reviewers should provide EFSEC and Bonneville with their comments during the review period of the Draft Environmental Impact Statement. This will enable the lead agencies to analyze and respond to the comments at one time and to use information acquired in the preparation of the Final Environmental Impact Statement, thus avoiding undue delay in the decision making process.
Allen J. Fiksdal Thomas C. McKinney Energy Facility Site Evaluation Council Bonneville Power Administration

TABLE OF CONTENTS
Page
FACT SHEET......................................................................................................................................................i
CHAPTER 1: SUMMARY1.1 Introduction ........................................................................................................................... 1-11.2 Purpose and Need for the Project ......................................................................................... 1-41.3 Decisions to be Made............................................................................................................ 1-61.4 Description of Alternatives................................................................................................... 1-71.5 Summary of Public Involvement, Consultation, and Coordination .................................. 1-121.6 Issues to be Resolved1.7 Summary of Potential Impacts and Mitigation Measures.................................................. 1-151.8 Cumulative Impacts ............................................................................................................ 1-15
CHAPTER 2: PROPOSED ACTION AND ALTERNATIVES2.1 Introduction ........................................................................................................................... 2-12.2 Description of the Proposed Action ..................................................................................... 2-12.3 No Action Alternative......................................................................................................... 2-362.4 Alternatives Considered but Rejected ................................................................................ 2-372.5 Benefits or Disadvantages of Reserving Project Approval for a Later Date .................... 2-462.6 Applicable Federal, State, and Local Permits .................................................................... 2-472.7 Coordination and Consultation with Agencies, Indian Tribes, the Public, and Non-
governmental Organizations............................................................................................... 2-47
CHAPTER 3: EXISTING CONDITIONS, IMPACTS, AND MITIGATION MEASURESIntroduction ..........................................................................................................................3-1
3.1 Earth.................................................................................................................................... 3.1-13.2 Air Quality.......................................................................................................................... 3.2-13.3 Water Resources................................................................................................................. 3.3-13.4 Water Quality ..................................................................................................................... 3.4-13.5 Wetlands............................................................................................................................. 3.5-13.6 Agricultural Land, Crops, and Livestock .......................................................................... 3.6-13.7 Upland Vegetation, Wildlife and Habitat, Fisheries, and Threatened and Endangered
Species................................................................................................................................ 3.7-13.8 Energy and Natural Resources .......................................................................................... 3.8-13.9 Noise................................................................................................................................... 3.9-13.10 Land Use........................................................................................................................... 3.10-13.11 Visual Resources, Light, and Glare................................................................................. 3.11-13.12 Population, Housing, and Economics.............................................................................. 3.12-13.13 Public Services and Utilities............................................................................................ 3.13-13.14 Cultural Resources ........................................................................................................... 3.14-13.15 Traffic and Transportation............................................................................................... 3.15-13.16 Health and Safety ............................................................................................................. 3.16-13.17 Relationship Between Short-Term Uses of the Environment and the
Maintenance and Enhancement of Long-Term Productivity ......................................... 3.17-13.18 Irreversible or Irretrievable Commitment of Resources ................................................. 3.18-1
CHAPTER 4: REFERENCES...................................................................................................................... 4-1

CHAPTER 5: ACRONYMS AND ABBREVIATIONS ............................................................................ 5-1
CHAPTER 6: LIST OF PREPARERS........................................................................................................ 6-1
CHAPTER 7: DISTRIBUTION LIST......................................................................................................... 7-1
INDEX
List of Tables
Table 1-1: Projected Pacific Northwest Electricity Demand, 2000-2025Table 1-2: Summary of Impacts and Mitigation MeasuresTable 2-1: BP Cherry Point Cogeneration Project ComponentsTable 2-2: Cogeneration Facility Tanks and SumpsTable 2-3: Expected Construction Work Force (Number of Personnel)Table 2-4: Cost Estimate for the Cogeneration ProjectTable 2-5: Summary of Ratings of Alternative Cogeneration Facility SitesTable 2-6: Pertinent Regulations, Statutes, and OrdinancesTable 2-7: Coordination and Consultation with Governmental Entities and Non-Governmental
Organizations or GroupsTable 3.1-1: Historical Western Washington Earthquakes with a Magnitude 5.0 or GreaterTable 3-2.1: Ambient Air Quality Standards and Significant Impact LevelsTable 3.2-2: Canadian National Ambient Air Quality Objectives and StandardsTable 3.2-3: Ambient Monitoring Stations in CanadaTable 3.2-4: Background Concentrations in CanadaTable 3.2-5: GVRD Air Quality Index Data for 2000Table 3.2-6: Hourly Criteria Pollutant Emission Rates – Auxiliary EquipmentTable 3.2-7: Annual Maximum Potential Criteria Pollutant EmissionsTable 3.2-8: Maximum ConcentrationsTable 3.2-9: Significant Impact Level Modeling Analysis Results – U.S. Class II AreasTable 3.2-10: Significant Impact Level and Modeling Analysis Results - Class I AreasTable 3.2-11: Comparison with Ambient Air Quality StandardsTable 3.2-12: Air Quality Modeling ResultsTable 3.2-13: Toxic Compounds that Require ModelingTable 3.2-14: Significant Impact Level Modeling Analysis Results - Toxic CompoundsTable 3.2-15: Maximum Concentration Modeling Analysis in CanadaTable 3.2-16: Highest Concentrations in CanadaTable 3.2-17: Ambient Air Monitors Closest to Project SiteTable 3.2-18: Lines of Sight Evaluated for Visibility Analysis in CanadaTable 3.2-19: Results of Visibility Analysis in CanadaTable 3.2-20: Overall Emission Reductions Estimated by the ApplicantTable 3.2-21: Refinery Emission ReductionsTable 3.2-22: Expected Annual Emissions (Criteria Pollutants)Table 3.2-23: Secondary Particulate Emission BalanceTable 3.2-24: Air Quality Related Values Modeling Analysis Results Including Refinery Emissions
ReductionsTable 3.2-25: Typical CO2 Emission Factors for Electrical Generating StationsTable 3.2-26: Baseline Source Group Plus the BP Cherry Point Project Peak Emissions with Primary
FuelTable 3.2-27: Comparison of Worldwide vs. Local Greenhouse Gas Emissions

Table 3.2-28: Cumulative Total Concentrations Compared to Canadian Air Quality ObjectiveTable 3.2-29: Cumulative Total Concentrations Compared to NAAQS or WAAQSTable 3.3-1: Water Rights, Permits, Certifications, and Claims in the Nooksack Basin (Upstream of
Ferndale)Table 3.3-2: Pending Groundwater Right Applications in the Terrell Creek/Cherry Point WatershedTable 3.4-1: Source Water QualityTable 3.4-2: Refinery Effluent Limitations (pounds per day, except where noted)Table 3.4-3: Chemicals to Be Used and Stored During ConstructionTable 3.4-4: Wastewater Flows and Chemical CompositionTable 3.4-5: Potential Impact of Proposed Cogeneration Facility on the Existing Refinery Wastewater
Discharge to Outfall 001 to the Strait of GeorgiaTable 3.4-6: Chemicals Used During Operations and MaintenanceTable 3.4-7: Stormwater Effluent LimitationsTable 3.5-1: Summary of Wetland Systems and Impact Areas Associated with the Cogeneration
Facility, Refinery Interface, and the Transmission System (acres)Table 3.5-2: Plant Species Observed in the Project VicinityTable 3.5-3: Summary of Wetland Systems Associated with the Custer/Intalco Transmission No. 2
Line CorridorTable 3.5-4: Summary of Wetland Systems and Upland Areas Associated with the Proposed Wetland
Mitigation Area (acres)Table 3.5-5: Summary of Wetland Community Impact Areas Associated with the Cogeneration
Facility, Refinery Interface Site, and the Transmission System (acres)Table 3.6-1: Whatcom County-Designated APO Soils, APO Protection Areas, and Open Space Areas
Mapped within Project Site ComponentsTable 3.6-2: Crop Cultivation, Number of Farms, Acres Harvested, and Yield for Selected CropsTable 3.6-3: Livestock Production in Whatcom CountyTable 3.7-1: Wildlife Species Observed in the Project Vicinity or Known to Occur in Similar Habitats
in Western WashingtonTable 3.7-2: Dominant Riparian Vegetation of Stream Channels within the Transmission Line
CorridorTable 3.7-3: Summary of Wetland and Upland Habitat Associated with the Transmission Line
CorridorTable 3.7-4: Characteristics of Stream Channels within the Transmission Line CorridorTable 3.7-5: Threatened, Endangered, Proposed, Candidate Species, and Species of Concern
Potentially Occurring in the Project VicinityTable 3.7-6: Summary of Vegetation Community Impacts Associated with the Cogeneration Facility,
Refinery Interface, and Other Project Components (acres)Table 3.8-1: Projected Pacific Northwest Electricity Demand, 2000-2025Table 3.8-2: Proposed Generation Projects in WashingtonTable 3.8-3: Washington/Oregon Generation Facilities Online in 2002Table 3.8-4: Washington Generation Facilities Currently Under ConstructionTable 3.8-5: Northwest Pipeline/Williams Expansion PlansTable 3.8-6: GTN Pipeline Expansion PlansTable 3.8-7: Construction Materials and Commodities ConsumedTable 3.8-8: Estimated Maximum Annual Electrical Energy OutputTable 3.8-9: Cogeneration Facility Power DemandTable 3.8-10: Estimated Maximum Annual Natural Gas Energy ConsumptionTable 3.9-1: Sound Pressure Levels of Representative NoisesTable 3.9-2: Noise Monitoring LocationsTable 3.9-3: Construction Equipment Noise RangesTable 3.9-4: Estimated Noise Levels without Background Ambient Sound Levels (Leq dBA)

Table 3.9-5: Estimated Noise Levels Combining Modeled and Background Sources (Leq dBA)Table 3.9-6: Summary of Low Frequency Receptor Levels due to the Cogeneration Base Load Plant
OperationTable 3.10-1: Population Estimates and Distance to Project SiteTable 3.10-2: Summary of Plans, Policies, and Regulations and their Relationship to the Proposed
ProjectTable 3.11-1: Visual Impact RatingTable 3.11-2: Summary of Visual Impacts from Representative ViewpointsTable 3.11-3: Heights of Project ComponentsTable 3.12-1: Population DataTable 3.12-2: HousingTable 3.12-3: Employment by Sector, 1999Table 3.12-4: Employment and Income, 1990-2000Table 3.12-5: Labor Requirements and EmploymentTable 3.12-6: Total Workforce Demand by TradeTable 3.12-7: Mean Hourly and Annual Wages by TradeTable 3.12-8: Expected Operation WorkforceTable 3.13-1: Major Public Recreational AreasTable 3.13-2: Public SchoolsTable 3.13-3: Summary of Anticipated Construction Waste StreamsTable 3.13-4: Summary of Anticipated Operation Waste StreamsTable 3.15-1: Average Daily Traffic Volumes on SR 548Table 3.15-2: PM Peak-Hour Level-of-Service SummaryTable 3.15-3: Five-Year Accident History on Two Segments of SR 548Table 3.15-4: Three-Year Accident History at Selected Major Intersections on SR 548Table 3.15-5: Railroad Crossings on SR 548Table 3.15-6: Estimated Vehicle Trip GenerationTable 3.15-7: PM Peak Hour Level-of-Service Summary – Proposed ActionTable 3.15-8: PM Peak Hour Level-of-Service Summary – No ActionTable 3.16-1: Applicable Health and Safety RegulationsTable 3.16-2: Anticipated Construction Waste StreamsTable 3.16-3: Chemicals to be Used and Stored during ConstructionTable 3.16-4: Anticipated Compressed Gases Use during ConstructionTable 3.16-5: Chemical and Hazardous Substances Anticipated to be Used during OperationTable 3.16-6: Estimated Waste Streams during OperationTable 3.16-7: Typical Electric and Magnetic Field Strengths at 1 foot from Common Appliances
List of Figures
Figure 1-1: Project Vicinity MapFigure 1-2: Typical Transmission Tower DesignsFigure 1-3: Cogeneration Facility Infrastructure and Refinery InterconnectionsFigure 2-1: Project ElementsFigure 2-2: Project Site and Surrounding AreaFigure 2-3: Existing Utility InfrastructureFigure 2-4: Alternative Cogeneration Site LocationsFigure 3.1-1: Project Site Topography North of Grandview RoadFigure 3.1-2: Project Site Topography South of Grandview RoadFigure 3.1-3: Geologic MapFigure 3.1-4: Soil Types

Figure 3.1-5: Seismotectonic Map of Northwest Washington and Southwest British ColumbiaFigure 3.1-6: Permitted, Active Surface Mines in Whatcom CountyFigure 3.2-1: Airsheds of Interest within 125 Miles of Project SiteFigure 3.3-1: Surface Water Drainage BasinFigure 3.3-2: Project Site DrainageFigure 3.3-3: Estimated Existing Surface and Subsurface Flow near CMA 2Figure 3.3-4: FloodplainsFigure 3.3-5: Cross Section A-AFigure 3.3-6: Cross Section B-BFigure 3.3-7: Generalized Water Table Surface Elevation and Groundwater FlowFigure 3.3-8: Design Basis for Operational Stormwater Control SystemFigure 3.3-9: Post-Mitigation Surface and Subsurface Flow near CMA 2Figure 3.5-1: Delineated and Affected WetlandsFigure 3.5-2: Site VegetationFigure 3.5-3: Proposed Wetland Mitigation AreasFigure 3.6-1: Agricultural Protection Overlay (APO) Soils and Protection AreasFigure 3.7-1: Cogeneration Site and Surrounding AreaFigure 3.9-1: Noise Monitoring LocationsFigure 3.10-1: ZoningFigure 3.11-1: Visual Resource Viewpoint LocationsFigure 3.11-2: Existing and Simulated Views Viewpoint 2Figure 3.11-3: Existing and Simulated Views Viewpoint 3Figure 3.11-4: Existing and Simulated Views Viewpoint 4Figure 3.11-5: Existing and Simulated Views Viewpoint 15Figure 3.15-1: Transportation Network in the Project VicinityFigure 3.15-2: Existing Roadway CharacteristicsFigure 3.15-3: Historical Daily Traffic CountsFigure 3.15-4: 2001 Average Daily Traffic VolumesFigure 3.15-5: 2001 Weekday PM Peak-Hour Traffic VolumesFigure 3.15-6: Project-Generated Trips for Peak Construction ConditionsFigure 3.15-7: Projected 2004 PM Peak-Hour and Average Weekday Traffic Volumes with
ProjectFigure 3.15-8: Projected 2004 PM Peak-Hour and Average Weekday Traffic Volumes without ProjectFigure 3.16-1: Typical Electromagnetic Levels for Transmission Lines
List of Appendices
Appendix A: 404(b) 1 Alternative AnalysisAppendix B: Environmental Resources ReportAppendix C: Visual Resources ReportAppendix D: Wetland SurveyAppendix E: Wetland Mitigation Plan

BP Cherry Point Cogeneration Project Fact SheetDraft EIS i September 2003
FACT SHEET
BP Cherry Point Cogeneration Project, Draft Environmental Impact Statement (EIS)(DOE/EIS-0349)
Responsible Agencies: U.S. Department of Energy (DOE), Bonneville Power Administration(Bonneville), and Washington State Energy Facility Site Evaluation Council (EFSEC)
Cooperating Agency: U.S. Army Corps of Engineers
States Involved: Washington
Abstract: BP West Coast Products, LLC proposes to construct and operate a 720-megawatt,natural-gas-fired, combined-cycle cogeneration facility on land adjacent to its BP Cherry PointRefinery. Approximately 195 acres of undeveloped land would be converted for the cogenerationfacility; gas, water, wastewater, and steam pipelines; construction laydown areas; access roads;and wetland mitigation areas.
The proposed project would be located in Whatcom County, Washington, approximately 15miles northwest of Bellingham and 7 miles south of Blaine. The purpose of the proposed powerproject is to provide stable and reliable electricity and steam to meet the needs of the refinery andprovide electricity to the Bonneville Federal Columbia River Transmission System.
Electrical energy from the proposed project would require construction of a new transmissionline from the switchyard in the cogeneration facility to an interconnection point on Bonneville’sCuster/Intalco Transmission Line No. 2. The length of the new line would be 0.8 mile.
From the interconnection point, a 230-kilovolt (kV) circuit may be constructed to the existingCuster substation. The most reliable method of adding the new line appears to be replacingapproximately 5 miles of the existing 230-kV single-circuit Custer/Intalco Transmission LineNo. 2 with a double-circuit line. Alternatively, preliminary studies of the transmission systemindicate that the circuit might not be needed if an agreement can be reached between theApplicant and the Intalco Aluminum Corporation to interrupt electrical service at the AlcoaIntalco Works under potential transmission system overload conditions. The formal agreementwould be known as a Remedial Action Scheme.
This Draft EIS assesses the existing natural and built environment, evaluates the potentialenvironmental impacts and economic benefits of the proposed action, and identifies mitigationmeasures to compensate for the unavoidable impacts. Alternative project sites, power-generatingand pollution-control technologies, and the No Action Alternative also are described.
Proposal’s Sponsor: BP West Coast Products, LLC (BP or Applicant)
Date of Implementation: Construction activities are expected to start during the first quarter of2004 and last approximately 25 months. The start of construction depends on the date thegovernor of Washington approves and signs the Site Certification Agreement for this project.

BP Cherry Point Cogeneration Project Fact SheetDraft EIS ii September 2003
List of Possible Permits, Approvals, and Licenses: Table 2-3 of the Draft EIS lists federal andstate requirements, permits, and approvals required for the proposed project, the agencies thatadminister the permits, and either the statute or regulation requiring the permit and approval. TheEFSEC Site Certification Agreement would provide construction and operation requirements andall other relevant Washington State permits and approvals for the project. No other state or localpermit is required for the proposed project.
As a federal agency, Bonneville must comply with federal permits and is precluded fromparticipating in procedural requirements associated with state and local land use approvals orpermits. The agency strives to meet or exceed the substantive standards and policies of theenvironmental regulations referenced above.
Authors and Principal Contributors to EIS: An independent consultant of EFSEC, Shapiroand Associates, Inc., is the principal author of the Draft EIS. The primary source of informationused to prepare the Draft EIS is the Application for Site Certification, which was prepared by BPand its primary consultants Anvil Corporation, Golder and Associates, URS Corporation, andDuke Energy/Fluor Daniel. A list of contributors is included in the Draft EIS.
Subsequent Environmental Review: Adjudicative HearingsLand Use HearingPrevention of Significant Deterioration/Notice of Construction Permit Review404 Individual Permit Review401 Water Quality Certification ReviewState Waste Discharge Permit ReviewFinal EISBonneville Record of Decision
Date of Final Lead Agency Action: After EFSEC deliberates on the facts, testimony, and EIScontents, it will send a recommendation to the governor of the state of Washington to approve ordeny the project (expected in spring 2004). The governor has 60 days to accept or reject therecommendation or to remand the recommendation to EFSEC for further investigation.

BP Cherry Point Cogeneration Project Fact SheetDraft EIS iii September 2003
Contact for Additional Information:
Irina MakarowSiting ManagerEnergy Facility Site Evaluation Council925 Plum Street SE, Building 4P.O. Box 43172Olympia, WA 98504-3172(360) [email protected]
Thomas McKinneyEnvironmental LeadBonneville Power AdministrationP.O. Box 3621Portland, OR 97208(503) [email protected]
Location of Background Information: You may access this Draft EIS and find moreinformation about the project and the responsible agencies on the Bonneville Web site atwww.efw.bpa.gov and the EFSEC Web site at www.efsec.wa.gov. Copies of the BPCogeneration Project Application for Site Certification, EFSEC No. 2002-01, and this Draft EISalso are available for public review at the following locations:
Washington State LibraryJoel M. Pritchard LibraryPoint Plaza East6880 Capitol BlvdTumwater, WA, 98504-2460360-704-5200
Energy Facility Site Evaluation Council925 Plum Street SE, Building 4Olympia, WA, 98504-3172360-956-2121
Whatcom County LibraryAttn: Kathy Richardson610 Third StreetBlaine, WA 98230
Whatcom County LibraryAttn: Dave MenardP.O. Box 1209
Ferndale, WA 98248Bellingham LibraryAttn: Gayle Helgoe210 Central AvenueBellingham, WA 98225-4421
Ocean Park LibraryCity of SurreyAttn: Isabelle Hay12854 17th AvenueSurrey, BC V4A 1T5Canada
White Rock Public LibraryAttn: Barb Hynek15342 Buena Vista AvenueWhite Rock, BC V4B 1Y6Canada
Cost of EIS Copy to the Public: There will be no cost for the Draft EIS.
For information on Department of Energy (DOE) NEPA activities, please contact Carol M.Borgstrom, Director, Office of NEPA Policy and Compliance, EH-25, U.S. Department ofEnergy, 1000 Independence Avenue SW, Washington, DC 20585; by telephone at 1-800-472-2756; or visit the DOE website at www.eh.de.gov/nepa.

BP Cherry Point Cogeneration Project Chapter 1: SummaryDraft EIS 1-1 September 2003
CHAPTER 1: SUMMARY
1.1 INTRODUCTION
BP West Coast Products, LLC (BP or the Applicant) proposes to construct and operate a nominal720-megawatt (MW), natural-gas-fired, combined-cycle cogeneration facility next to the existingBP Cherry Point Refinery in Whatcom County, Washington. The Applicant also owns andoperates the refinery, but the cogeneration facility and the refinery would be operated as separatebusiness units.
The cogeneration facility and its ancillary infrastructure would provide steam and 85 MW ofelectricity to meet the operating needs of the refinery and 635 MW of electrical power for localand regional consumption. The proposed cogeneration facility would be located betweenFerndale and Blaine in northwestern Whatcom County, Washington (see Figure 1-1). TheCanadian border is approximately 8 miles north of the proposed project site.
The Washington State Energy Facility Site Evaluation Council (EFSEC) has jurisdiction over theevaluation of major energy facilities including the proposed project. As such, EFSEC willrecommend approval or denial of the proposed cogeneration facility to the governor ofWashington after an environmental review.
On June 3, 2002, the Applicant filed an Application for Site Certification (ASC No. 2002-01)with EFSEC in accordance with Washington Administrative Code (WAC) 463-42. On April 22,2003, the Applicant submitted an amended ASC that included, among other things, a changefrom air to water cooling.
With the submission of the ASC and in accordance with the State Environmental Policy Act(SEPA) (WAC 463-47), EFSEC is evaluating the siting of the proposed project and conductingan environmental review with this Environmental Impact Statement (EIS). Because the proposedproject requires federal agency approvals and permits, this EIS is intended to meet therequirements under both SEPA and the National Environmental Policy Act (NEPA). TheBonneville Power Administration (Bonneville) and U.S. Army Corps of Engineers (Corps) alsowill use this EIS as part of their respective decision-making processes associated with theApplicant’s request to interconnect to Bonneville’s transmission system and proposed location ofthe project within wetland areas. Therefore, this Draft EIS serves as the environmental reviewdocument for SEPA and for NEPA as required by Bonneville for the interconnection and theCorps for its 404 individual permit. The EIS addresses direct, indirect, and cumulative impacts ofthe proposed project, and potential mitigation measures proposed by the Applicant, as well asmeasures recommended by EFSEC.
The information and resulting analysis presented in this Draft EIS are based primarily oninformation provided by the Applicant in the ASC No. 2002-01 (BP 2002). Where additionalinformation was used to evaluate the potential impacts associated with the proposed action, thatinformation has been referenced. EFSEC’s environmental consultant, Shapiro and Associates,Inc., did not perform additional studies during the preparation of this Draft EIS.

BP Cherry Point Cogeneration Project Chapter 1: SummaryDraft EIS 1-2 September 2003
Figure 1-1:

BP Cherry Point Cogeneration Project Chapter 1: SummaryDraft EIS 1-3 September 2003
Figure 1-2:

BP Cherry Point Cogeneration Project Chapter 1: SummaryDraft EIS 1-4 September 2003
1.2 PURPOSE AND NEED FOR THE PROJECT
The proposed project has two purposes. First, it would provide the BP Cherry Point Refinerywith reliable and affordable steam and electrical energy to maintain cost-effective operations.Second, it would provide electrical energy to the northwest power grid, which is needed to meetthe projected growing regional demands for electricity.
1.2.1 BP Cherry Point Refinery Need
Steam is generated throughout the refinery as a byproduct of a number of refinery processes, butprimarily by gas-fired utility boilers. These more than 30-year-old boilers are used to increase ordecrease steam supply volume and to maintain steam pressure as needed for various refineryoperations. The proposed project could produce steam for the refinery more efficiently andcheaper than the existing three utility boilers. With the proposed project, the refinery would beable to shut down the older boilers, thereby reducing air emissions from the refinery.
Two economic incentives exist for the Applicant to remove the three older refinery boilers. Thefirst is to operate the cogeneration project at peak efficiency in cogeneration mode, therebyproducing power at lower cost. The second is to use steam in the refinery that has been costeffectively produced by the cogeneration facility.
The cogeneration facility would be designed to operate at maximum efficiency at normalbaseload conditions, which include a nominal 510,000 pounds per hour of steam being exportedto the refinery. Although the steam turbine would have an operating range, it must be designedfor a specific operating point for peak efficiency based on the normal expected baseloadoperating conditions, which include steam export to the refinery. The second incentive for theApplicant is to operate the cogeneration facility in cogeneration mode to lower the cost ofproducing power. Cogeneration uses waste heat more efficiently and therefore produces powerusing less fuel and at a lower cost than the same facility in non-cogeneration mode.
The refinery currently produces steam for use in its petroleum product processing operationsthrough two processes: waste heat recovery and the use of utility steam boilers. Steam producedthrough waste heat recovery depends on the level of refinery operation, with greater amounts ofsteam being produced when the refinery process unit rate is high. However, the amount of steamneeded by the refinery is well in excess of the steam produced by waste heat recovery alone; theutility boilers are operated to make up the difference. The operation of the utility boilers isincreased or decreased according to the overall level of operation of the refinery. The olderutility boilers were installed during the refinery’s original construction in 1971 and currentlyoperate at about 85% efficiency. Economic incentive exists for the Applicant to accept as muchcogeneration project steam as the refinery can use because the cost of the steam would be lowerif produced at 100% efficiency by the cogeneration project. This incentive is reduced if therefinery accepts less than the cogeneration steam baseload (BP 2002).
Refinery operations require approximately 85 MW of electricity. Historically, the refinery hasrelied on electricity purchased from third parties. This reliance on third-party sources hasexposed the refinery to cost volatility in the electricity markets. For example, high prices for

BP Cherry Point Cogeneration Project Chapter 1: SummaryDraft EIS 1-5 September 2003
electricity in late 2000 and early 2001 placed the viability of the refinery at risk. While thevolatility has decreased significantly, the projected growth in regional power needs and thevolatility in hydropower will require new power generation to balance supply and demand.
1.2.2 National and Regional Power Need
Recent national and regional forecasts predict increasing consumption of electrical energy willcontinue into the foreseeable future, requiring development of new generation resources tosatisfy the increasing demand. The Energy Information Administration published a nationalforecast of electrical power through the year 2025. In it, the administration projected that totalelectricity demand would grow between 1.8 and 1.9% per year from 2001 through 2025. Rapidgrowth in electricity use for computers, office equipment, and a variety of electrical appliances inthe residential and commercial sectors is only partially offset by improved efficiency in theseelectrical applications. Power generation from natural gas, coal, nuclear, and renewable fuels isprojected to increase through 2025 to meet the growing demand for electricity and offset theprojected retirement of existing generation facilities (U.S. Energy Information Administration2003).
The Western Electricity Coordinating Council (WECC) forecasts electricity demand in thewestern United States. According to WECC’s most recent coordination plan, the 2001-2011summer peak demand requirement is predicted to increase at a compound rate of 2.5% per year(WECC 2002).
Based on data published by the Northwest Power and Conservation Council (NWPCC),electricity demand for the Council's four-state Pacific Northwest planning region (Washington,Oregon, Idaho, and Montana) was 20,080 average megawatts in 2000 (NWPCC 2003).
As shown in Table 1-1, the Council's recently revised 20-year demand forecast projects thatelectricity demand in the region will grow from 20,080 average megawatts in 2000 to 25,423average megawatts by 2025 (medium forecast), an average annual growth rate of just less than1% per year. While the Council's forecast indicates that the most likely range of demand growth(between the medium-low and medium-high forecasts) is between 0.4 and 1.50% per year, thelow to high forecast range used by the Council recognizes that growth as low as -0.5% per year,or as high as 2.4% per year, is possible although relatively unlikely (NWPCC 2003).
Table 1-1: Projected Pacific Northwest Electricity Demand, 2000-2025
Electricity Demand (Average Megawatts) Growth Rates (Percent Change)Forecast Scenario
2000 2015 2025 2000-2015 2000-2025
Low 20,080 17,489 17,822 -0.92 -0.48Medium Low 20,080 19,942 21,934 -0.05 0.35Medium 20,080 22,105 25,423 0.64 0.95Medium High 20,080 24,200 29,138 1.25 1.50High 20,080 27,687 35,897 2.16 2.35Source: NWPCC 2003

BP Cherry Point Cogeneration Project Chapter 1: SummaryDraft EIS 1-6 September 2003
Generated power typically requires interconnection with a high-voltage electrical transmissionsystem for delivery to purchasing retail utilities. Bonneville owns and operates the FederalColumbia River Transmission System (FCRTS), comprising more than three-fourths of the high-voltage transmission grid in the Pacific Northwest. Bonneville operates the FCRTS in part tointegrate and transmit “electric power from existing or additional Federal or non-Federalgenerating units” (16 USC 838b). Interconnection with the FCRTS is essential to deliver powerfrom many generating facilities to loads both within and outside the Pacific Northwest. TheApplicant has asked to integrate power from the proposed project into the FCRTS.
In summary, electrical consumers served by the Northwest Power Pool and in other westernstates need increased power production to serve the predicted long-term increasing demand andhigh-voltage transmission lines to deliver the power.
1.3 DECISIONS TO BE MADE
This document is a joint SEPA/NEPA Draft EIS intended to meet the environmental reviewneeds of EFSEC, Bonneville, and the Corps. EFSEC has jurisdiction over all of the evaluationand licensing steps for siting major energy facilities in the state of Washington. EFSEC's SiteCertification Agreement acts as an umbrella authorization that incorporates the requirements ofall state laws and regulations. EFSEC will jointly issue the Final EIS with Bonneville, andEFSEC will make a recommendation to the governor of Washington to approve or deny theproposed project.
Bonneville will use the Final EIS to meet NEPA requirements and will prepare a Record ofDecision for the proposed project. If the governor approves the project, Bonneville will need todecide whether and how to provide transmission interconnection and service to and from theproposed project.
Bonneville intends to base its comparison of project alternatives and its final decision on thefollowing criteria:
• Provide an adequate, economical, efficient, and reliable transmission system for the PacificNorthwest;
• Follow Bonneville’s Open Access Transmission Tariff for non-discriminatory access;• Comply with federal environmental and energy laws and policies;• Achieve cost and administrative efficiency; and• Minimize impacts on the natural and human environment through site selection and
transmission line design.
A list of permits and requirements for the proposed project is included in Chapter 2, Table 2-4.
Based on the wetland impact analysis, proposed mitigation measures, and information containedin Appendix A of this EIS (Siting and Wetland 401[b] 1 Alternative Analysis), the Corps willdecide whether or not to issue the 404 individual permit for the proposed project.

BP Cherry Point Cogeneration Project Chapter 1: SummaryDraft EIS 1-7 September 2003
1.4 DESCRIPTION OF ALTERNATIVES
1.4.1 Proposed Action
The proposed project includes a cogeneration facility and ancillary facilities that would belocated on an approximately 265-acre site. The cogeneration facility would be designed,constructed, and operated as a stand-alone facility that would have a number of systemsintegrated with the facilities and operations of the BP Cherry Point Refinery.
The cogeneration facility would occupy approximately 33 acres of Applicant-owned,unimproved property, which is zoned Heavy Impact Industrial. The 230-kilovolt (kV)transmission line would include approximately 15 acres of transmission right-of-way, andproposed construction laydown areas would include an additional 36 acres of land. Wetlandmitigation sites proposed for the project north of Grandview Road would occupy approximately110 acres.
Whatcom County Public Utility District No. 1 (PUD) would supply industrial water to thefacility under a new contract between the Applicant and the PUD. Electrical transmission towersand lines from the cogeneration facility to the Bonneville electrical transmission system wouldbe on Applicant-owned land. Natural gas would be supplied to the cogeneration facility fromeither the Arco Western Natural Gas Pipeline (Ferndale pipeline) or the Cascade Natural GasPipeline, both of which run through Applicant-owned land. The onsite stormwater detentionpond would be within the boundary of the cogeneration facility. A second stormwater detentionpond would be adjacent to the western boundary of Laydown Area 2. Sanitary wastewater wouldbe sent to the refinery and then to the Birch Bay Wastewater Treatment District Plant fortreatment and discharge to Birch Bay. Wastewater from the cogeneration facility would be sentto the refinery for treatment and discharge at the refinery’s Outfall 001 at the existing marine pierin the Strait of Georgia.
In this EIS, individual systems and/or components of the proposed project have been groupedinto five major project elements to facilitate the analysis and discussion of potentialenvironmental impacts associated with the proposal. The components of each major projectelement are briefly listed below.
Project facilities that would be constructed or installed within the boundary of the cogenerationplant are collectively referred to as the “cogeneration facility,” and include:
• A steam turbine generator;• Three combustion gas turbine generators;• Three heat recovery steam generators (HRSGs);• Three HRSG exhaust stacks;• Three 150 million volt amp (MVA) step-down transformers;• An emergency diesel generator;• An evaporative cooling tower;• Various holding, storage, and transfer tanks and sumps;• Stormwater collection, detention, and treatment facilities;

BP Cherry Point Cogeneration Project Chapter 1: SummaryDraft EIS 1-8 September 2003
• An administration and control and warehouse building complex;• Perimeter security fence and gates;• A primary access road (Access Road 1)
Project facilities that would be constructed or installed in the BP Cherry Point Refinery tosupport integration and operation of the cogeneration facility are referred to as “refineryinterface,” and include the following:
• Steam and condensate system connections and associated piping;• Natural gas supply connection and associated piping;• Natural gas compressor station;• Industrial water supply connection and associated piping;• Potable water supply connection and associated piping;• Industrial wastewater connection and associated piping;• Sanitary wastewater connection and associated piping;• Elevated piperack assembly for supporting pipes connecting the two facilities;• An intermediate voltage (69 kV or 115 kV) electrical distribution substation;• Electrical distribution transformers;• Stormwater collection, detention, and treatment facilities;• Construction Laydown Areas 1, 2, and 3; and• A connecting east-west access road (Access Road 2).
A new 230-kV double circuit electrical distribution line would be installed to connect thecogeneration facility with the existing Bonneville transmission system approximately 0.8 mile tothe east. Throughout the EIS, this line is referred to as the “transmission system.”
Bonneville has determined that modifications to the Custer/Intalco portion of the existingBonneville transmission system would be required to accommodate connection of thecogeneration facility. Two options have been identified to provide the required modifications.Option 1 is to install a Remedial Action Scheme (RAS). A RAS would install additionalelectrical equipment within the Custer and Intalco substations, and would require an operatingagreement between the Applicant, Alcoa Intalco Works, and Bonneville for load-reductionprotocols to be implemented under certain conditions. Option 2 is to reconstruct theCuster/Intalco Transmission Line No. 2 between the Custer substation and the point ofinterconnection with the transmission system, a distance of approximately 5 miles.Reconstruction of the transmission line would involve installation of a second transmission lineand replacement of existing towers between the interconnection point and the Custer substation.For purposes of this EIS, the element of the project dealing with modification of theCuster/Intalco portion of the Bonneville transmission system is referred to as “Custer/IntalcoTransmission Line No. 2.”
Other elements of the project that would be constructed or installed in other locations as part ofthe project are referred to as “other project components,” and include:
• Water supply connections, equipment, and piping to be installed at the Alcoa Intalco Worksfacility;

BP Cherry Point Cogeneration Project Chapter 1: SummaryDraft EIS 1-9 September 2003
• Construction Laydown Area 4 (located at the northeast of the cogeneration facility site);• Compensatory Mitigation Areas (CMAs) 1 and 2 (immediately north of Grandview Road);
and• A southern cogeneration facility access road (Access Road 3).
Figure 1-3 shows the relationship of project elements between the cogeneration facility, refinery,and supporting infrastructure. Chapter 2 contains a complete description of the systems and/orcomponents of the proposed project.
Alternatives Considered but Rejected
Alternative Sites
In addition to the proposed cogeneration facility site, four other potential sites on the Applicant’sproperty were evaluated for the facility location. They are as follows:
• East of Blaine Road and north of Brown Road adjacent to an existing cooling tower.• Within the Cherry Point Refinery boundary fence near refinery components.• Immediately north of Grandview Road. This area was evaluated because it contains a
moderately sized upland area adjacent to Grandview Road.• Within the refinery boundary just south of Grandview Road and west of Blaine Road. This
site currently has a contractor parking lot and open areas.
Locations outside refinery-owned property were not evaluated because the primary purpose ofthe proposed project is to supply reliable, stable, and cost-efficient electricity and steam to therefinery.
Alternative technologies and cooling systems also were considered; a list of those considered butrejected is shown below. The reasons for their rejection are described in more detail in Chapter 2.
Alternative Power Generation
• Stand-alone combined cycle• Conventional boiler and seam turbine• Fluidized bed combustion and steam turbine• Other technologies such as geothermal, hydroelectric, biomass fuels, solar and wind, and coal
and heavy fuel oil.• “Refinery Load Only” Alternative
“Refinery Load Only” Alternative
The Applicant examined a number of alternative facility configurations for the cogenerationproject, including a facility that would generate only enough electricity to meet the operatingneeds of the refinery (approximately 85 MW) and would therefore not require interconnectionwith Bonneville's power transmission facilities.

BP Cherry Point Cogeneration Project Chapter 1: SummaryDraft EIS 1-10 September 2003
Figure 1-3:

BP Cherry Point Cogeneration Project Chapter 1: SummaryDraft EIS 1-11 September 2003
Potential facility configurations were evaluated against a set of performance requirements thatthe Applicant established for the project. These considerations included:
• Steam supply reliability to the refinery;• Flexibility to accommodate larger future steam demands; and• Economy of scale to provide suitable capital risk.
The Applicant determined that an 85-MW facility would not provide suitable steam reliability,lacked the ability to accommodate increases in future steam demand, and had a higher capitalrisk profile than the proposed configuration. The "Refinery Load Only" Alternative was thereforeeliminated from further consideration.
Alternative Cooling Systems
• Dry cooling system: air cooled condenser• Wet/dry cooling system: evaporative wet/dry cooling tower• Wet/dry cooling: hybrid cooling system
Alternative Air Emission Controls
• SCONOX• XONON
Alternative Wastewater Disposal Methods
• Refinery industrial wastewater treatment system• New wastewater treatment facilities• Zero discharge facility
Alternative Electrical Interconnection
• Reconductoring Custer/Intalco Transmission Line No. 2
1.4.2 No Action Alternative
Under the No Action Alternative, the proposed cogeneration facility and ancillary infrastructurewould not be constructed and existing utility boilers at the refinery would remain in operation.The refinery would continue to purchase electricity or use onsite turbines to generate electricalpower needed for refinery operations. Under the No Action Alternative, the Applicant has noimmediate plans to use the area proposed for the project site, but because the site is zoned HeavyImpact Industrial, it could be used for other future industrial development.
Under this alternative, the impacts described for the proposed action would not occur.Approximately 110 acres of wetlands would not be enhanced, and if the Alcoa Intalco Worksremained closed, the current withdrawal of approximately 2,200 gallons per minute (gpm) of

BP Cherry Point Cogeneration Project Chapter 1: SummaryDraft EIS 1-12 September 2003
water from the Nooksack River would not occur. Finally, without an additional and redundantelectrical power supply, the refinery would continue to be subject to market energy prices.
The refinery’s demand for both steam and electrical power is expected to grow in the future asother projects are implemented within the refinery. Although the refinery boilers would continueto operate, additional heat generation capability would be required, and this likely would beproduced by new boilers and/or fired heaters.
A list of potential impacts and mitigation measures of the Proposed Action Alternative and theNo Action Alternative is shown in Table 1-2.
1.5 SUMMARY OF PUBLIC INVOLVEMENT, CONSULTATION, ANDCOORDINATION
The Applicant has been communicating and meeting with agencies, Indian tribes, the public, andnon-governmental organizations throughout development of the proposed project. EFSEC andBonneville have also conducted joint public comments and scoping meetings. The first publicmeeting was held on May 2, 2001 in the Blaine High School Center for the Performing Arts inBlaine, Washington. Prior to this meeting, public notices were mailed to local and regionalnewspapers, and press releases were issued to local and regional radio stations and newspapers.From May 2001 through 2003, meetings were held with local and state public agencies andcommittees, and agencies and regional committees of Canada. Formal meetings to informstakeholders and solicit comments with these entities are listed in Chapter 2, Table 2-5.
Project documents are available to the public on the EFSEC and Bonneville Web sites and inlocal libraries. Further opportunities for public involvement will occur throughout the remainderof the siting evaluation process. A public comment hearing for the Draft EIS will be scheduledduring the 45-day comment period, and additional public comment will be received by EFSECthrough adjudicative and land use hearings to be held before the Final EIS is issued. Concurrentwith these activities will be review of permit applications, specifically the Corps of Engineers’404 Individual Permit, a 401 Water Quality Certification, a Prevention of SignificantDeterioration/Notice of Construction Permit, and a State Waste Discharge Permit.
1.6 ISSUES TO BE RESOLVED
The following unresolved issue requires further evaluation and decision by the Applicant,EFSEC, and Bonneville.
1.6.1 Interconnection of the Cogeneration Project
The Applicant has asked Bonneville to provide an electrical connection with the FederalColumbia River Transmission System. The proposed point of interconnection is along one ofBonneville’s existing 230-kV transmission lines between the Custer substation and Intalcosubstation (Custer/Intalco Transmission Line No. 2) near Brown Road. Preliminary transmissionsystem studies indicate that to ensure reliable operation of the transmission system, integration ofthe project would require construction of an additional 230-kV circuit from the point of

BP Cherry Point Cogeneration Project Chapter 1: SummaryDraft EIS 1-13 September 2003
interconnection to Custer substation. The most feasible method of adding the new line appears tobe replacing the existing 230-kV single-circuit Custer/Intalco Transmission Line No. 2 with adouble-circuit line.
Alternatively, the preliminary transmission system studies indicate that the new circuit might notbe needed if agreement (a RAS) can be reached with the Alcoa Intalco Aluminum Corporation tointerrupt electrical service at the Alcoa Intalco Works under certain potential transmissionsystem overloads.
However, as of early summer 2003, there is uncertainty about continuing operation of the AlcoaIntalco Works. Extended loss of load at the aluminum smelter could present other problems foroperation of the transmission system. Also, there is uncertainty about whether and when otherelectrical generation projects planned in northwest Washington would be constructed and howthat would affect transmission system operations. Bonneville must further study how tointerconnect the proposed project under this complex set of scenarios.
1.6.2 Firm Transmission Service from the Cherry Point Cogeneration Project
The Applicant has asked Bonneville to provide firm, guaranteed transmission service from thepoint of interconnection to the Northwest Hub (Central Washington) and John Day substations.Bonneville needs to resolve uncertainty about existing available transmission capacity to servethe Applicant’s request before the appropriate system study can be completed.
1.6.3 Natural Gas Supply
The Applicant has not entered into a purchase agreement for natural gas supply to the proposedproject. It is likely that the Ferndale pipeline would not have sufficient available capacity to meetthe natural gas requirements of both the cogeneration facility and the refinery during periods ofpeak demand. The Applicant has indicated that if needed, additional natural gas would beobtained from a local supplier with available capacity. However, the additional supplier andassociated new natural gas transmission/distribution facilities that would be required have notbeen identified at this time.
1.6.4 BP Refinery NPDES Permit Changes
The BP Cherry Point Refinery’s existing National Pollutant Discharge Elimination System(NPDES) permit will require revision to allow the refinery to accept industrial wastewaterdischarge from the cogeneration facility. Ecology, the agency with jurisdiction over this permit,would address water quality issues that have been raised for the cogeneration project such asimpacts of increased salinity and temperature on the herring population, the age and condition ofthe existing diffuser, and potential cumulative impacts on water quality through this refineryNPDES permit revision process.

BP Cherry Point Cogeneration Project Chapter 1: SummaryDraft EIS 1-14 September 2003
1.6.5 Water Use
Letters of intent have been signed by the Applicant, Alcoa and Whatcom PUD to effectuate thecontract water right purchases between the three entities that would allow the cogenerationfacility to purchase water from the PUD regardless of whether the Alcoa Intalco Worksaluminum smelter is operating or not. It is anticipated that agreements to purchase the contractwater rights by the cogeneration facility would become final should all state and federalapprovals be received.
1.6.6 Prevention of Significant Deterioration Permit and Best Available ControlTechnology
The Applicant’s projected air emissions and selection of the Best Available Control Technology(BACT) are currently under review by EFSEC and EPA. It is anticipated that final permitrequirements would be based on emission controls and BACT no less stringent than thosepresented in this Draft EIS.
1.6.7 Change of Ownership of Cogeneration Project
BP has informed the Council that TransCanada is negotiating purchase of the cogenerationproject. This change of ownership could directly affect the greenhouse mitigation options offeredby the Applicant.
1.6.8 Project Design Features
For some project components, additional project design and related information will be requiredto complete the environmental review process for the proposed project. Specific areas whereadditional information is required are listed below.
Additional information is required regarding who will construct and operate key projectcomponents. This includes:
• 230-kV switchyard. Ownership and operation of the cogeneration facility’s 230-kV electricalswitchyard would be subject to the terms of an interconnection agreement betweenBonneville and the Applicant. That agreement has not been finalized.
• Industrial water supply. At this time, it has not been determined whether the Applicant orWhatcom County PUD would construct and operate the proposed industrial water supplyconnection and piping required within the refinery.
• Natural gas supply and compression station. At this time, it has not been determined whetherthe Applicant, the refinery, or the Ferndale pipeline would be responsible for constructionand operation of the cogeneration facility’s natural gas supply connection, associated piping,and natural gas compression station to be located within the refinery.
• Intermediate voltage substation. At this time, it has not been determined whether theApplicant or the refinery would construct and operate the intermediate voltage (69 kV or 115kV) substation to be located within the refinery.

BP Cherry Point Cogeneration Project Chapter 1: SummaryDraft EIS 1-15 September 2003
Additional facility design and related descriptive information are required for some projectsystems and components. These include:
• Refinery interface piping systems. Design characteristics for a number of piping systems thatinterconnect the cogeneration facility with the refinery have not yet been determined.Information regarding the size, type, route, and refinery tie-in point for the following pipingsystems is required to fully evaluate the potential for environmental impacts:- steam and condensate systems,- potable water supply,- natural gas supply,- industrial water supply,- industrial wastewater, and- sanitary wastewater.
• Custer/Intalco Transmission Line No. 2. At this time, many aspects of reconstruction of theCuster/Intalco Transmission Line No. 2 remain to be resolved by the Applicant andBonneville. These include:- number, type, and location of transmission towers that would be installed,- type, length, and location of any transmission line access roads that would be constructed
or improved,- type, size, and location of any culverts to be constructed, and- size and location of any temporary laydown, staging, and assembly areas that may be
required.
1.6.9 Additional Studies/Evaluations Required to Complete the EnvironmentalReview of the Proposed Project
• 404(b) 1 Alternative Analysis. The Corps of Engineers has asked the Applicant to revise andprovide more details regarding the evaluation of project alternatives.
1.7 SUMMARY OF POTENTIAL IMPACTS AND MITIGATION MEASURES
Table 1-2 summarizes potential impacts resulting from construction and operation of theProposed Action Alternative and the No Action Alternative. Also included in the table areproposed mitigation measures. The Applicant, during the preliminary design of the proposedproject, has mitigated potentially significant adverse impacts such that, with the exception of thepermanent loss of approximately 31 acres of wetlands, no significant adverse impact on naturalresources and the built environment has been identified in the environmental review. Specificimpacts and mitigation measures are discussed in each section of Chapter 3.
1.8 CUMULATIVE IMPACTS
The Pacific Northwest has short-term and long-term supply needs for electrical power. TheWECC forecasts electricity demand in the western United States. According to WECC’s mostrecent coordination plan, the 2001-2011 summer peak demand requirement is forecasted toincrease at a compound rate of 2.5% per year (WECC 2002).

BP Cherry Point Cogeneration Project Chapter 1: SummaryDraft EIS 1-16 September 2003
The NWPCC regularly prepares a 20-year forecast of electricity demand in the PacificNorthwest. NWPCC’s latest long-term forecast found that the total consumption of electricity isforecasted to grow from 20,080 average megawatts in 2000 to 25,423 average megawatts by2025, an average yearly rate of growth of just under 1% (NWPCC 2003).
In addition to evaluating the environmental impacts of proposed power projects on an individualbasis, EFSEC and Bonneville have also considered potential cumulative impacts of theseprojects, as well as other projects and actions that could contribute to cumulative impacts. Thisconcern of the state and federal agencies is magnified when several projects are proposed at thetime in the same vicinity with schedules that overlap.
The following is a summary of the cumulative impact evaluation included in this EIS.
1.8.1 Global Warming
Most greenhouse gas emissions are in the form of CO2, with smaller fraction of methane ornitrous oxide. Although the additional contribution of greenhouse gases on a state, regional, andnational level from this proposal can be quantified, it is not possible to determine their actualimpact on global warming.
1.8.2 Regional Air Quality
The results of modeling under the worst-case scenario for criteria pollutants from the proposedproject indicate there would be no air quality impacts in the US or Canada when compared to themost stringent values of the National Ambient Air Quality Standards, Washington Ambient AirQuality Standards, or Canadian Objectives or Standards. Purchase of cogeneration steam by therefinery would likely lead to the refinery shutting down three older utility boilers, resulting inoverall reductions of PM10 and NOx emissions in the air shed. Construction of the Georgia StraitPipeline along Grandview Road at approximately the same time as construction of the proposedproject would only temporary affect air quality through the emission of fugitive dust.
1.8.3 Water
With the construction of the proposed project and the Georgia Strait Pipeline project scheduled ataround the same time, there is a possibility of cumulative impacts. These impacts couldpotentially result from the use of water to control dust, pipeline testing and cleaning, andhydrotesting major pipelines.
With the shutdown of the Alcoa Intalco Works, water used at that facility would now be used bythe proposed project, so there would be no net increase of water consumption when the proposedproject becomes operational. If Alcoa Intalco Works operates at the same time as thecogeneration facility, there still would be no cumulative impacts because the once-throughcooling water from Alcoa Intalco Works would be used by the cogeneration facility, therebyprecluding the need for additional withdrawal of water from the Nooksack River.

BP Cherry Point Cogeneration Project Chapter 1: SummaryDraft EIS 1-17 September 2003
Several industrial dischargers are located in the general vicinity of the proposed cogenerationproject. These include the BP Cherry Point Refinery, the Conoco-Phillips Refinery, TenaskaWashington Cogeneration Power Plant, and Alcoa Intalco Works. All of these facilities currentlydischarge to the Strait of Georgia. Also, the Birch Bay Sewer District Treatment Plant dischargesto Birch Bay, an embayment of the Strait of Georgia. Although discharge from the proposedproject would represent a relatively small increase to the regional discharge to the Strait ofGeorgia, it adds to the overall burden on water quality.
1.8.4 Natural Gas Supply
The projected annual consumption of natural gas by the proposed project is approximately42,457,000 million British thermal units (MMBtu). The proposed project would result in anincremental contribution to the regional demand for natural gas. However, there is sufficientcapacity in the gas supply and distribution system serving the Pacific Northwest to supply theproposed cogeneration project and existing and planned natural-gas-related projects such that theoverall effect on available supplies would be negligible.
1.8.5 Transmission Lines
Construction of the cogeneration facility’s transmission line and the possible reconstruction ofthe Custer/Intalco Transmission Line No. 2 would not have a cumulative impact on the naturalresources within western Whatcom County. The short 0.8-mile cogeneration transmission linewould connect the project to Bonneville's existing transmission system. The Bonneville linewould not need to be extended and, except for the 230-kV switchyard at the cogenerationfacility, no new substations would need to be constructed as a result of the proposed project.Bonneville is continually conducting studies to determine the need to extend their transmissionsystem. It is not known at this time what other transmission lines would be needed in the future.
1.8.6 Transportation
Construction of the proposed project and the construction of the Georgia Strait Pipeline projectwould occur at about the same time. It is expected that some increased traffic congestion anddelays at intersections along Grandview Road would occur over the two-year period. Based ontraffic modeling completed for the proposed project, the results indicate that the level-of-serviceat all major regional intersections would operate at acceptable levels as defined by WashingtonState Department of Transportation design standards.
1.8.7 Population, Housing, and Economics
A workforce analysis conducted by the Applicant suggests that there is an adequate labor poolavailable for construction of the proposed project. If additional projects, such as the GeorgiaStrait Pipeline project, were to be constructed within the region, some workers likely wouldrelocate to the area, temporarily affecting the local housing market, population, and localservices. This potential future condition is not expected to be a significant cumulative impact oncommunities in the project vicinity.

Table 1-2: Summary of Impacts and Mitigation Measures
Element of theEnvironment
Impacts of the Proposal Impacts of No Action Measures to Mitigate Impacts
BP Cherry Point Cogeneration Project Chapter 1: SummaryDraft EIS 1-18 September 2003
EarthConstruction • Extensive grading of the site is not anticipated to be
required, however some unsuitable materials mayrequire removal from the site for disposal atapproved locations.
• The total quantity of imported fill material isestimated to be approximately 126,000 cubic yards(75,600 tons).
• Site grading and stockpiling activities would exposesoils and would increase the potential for erosion.
• The potential exists for contacting contaminatedsoils during excavation activities at the BP CherryPoint Refinery and at the Alcoa Intalco Worksfacilities because of industrial practices that haveoccurred at these sites since the 1970s.
• Under the No ActionAlternative, the project wouldnot be constructed, thereforethere would not be anyconstruction impacts for thiselement of the environment.
Mitigation Proposed by the Applicant
• Best Management Practices (BMPs) would beimplemented for erosion control and prevention.The BMPs would be described in a StormwaterPollution Prevention Plan (SWPPP) and TemporaryErosion and Sedimentation Control Plan (TESC) tobe submitted to EFSEC prior to construction.
• Soils would be sampled and inspected for thepresence of contaminants before and during siteclearing, grading, and trenching.
• Excavated materials of acceptable quality would bereused as much as possible.
• Excess materials would be disposed of at permittedfill sites or would be placed where they would noteasily erode.
• Disturbed areas would be revegetated by seeding orhydroseeding.
• Seed mixes would be selected that are known toeffectively stabilize erodible soils in thenorthwestern portion of the State of Washington.
• Soil stockpiles would be seeded or covered with anemulsion and surrounded by silt fences and strawbales or sand bags, where necessary, to preventexcessive erosion by wind or rain.
• Sprinkler systems may be employed to sustainvegetation on bermed areas with high exposure tothe erosive forces of wind.
• Erosion control measures for construction, such assilt fencing, straw bales, and tarps, would beinspected and maintained.
• A Spill Prevention Control and Countermeasure(SPCC) Plan would be prepared. The plan wouldinclude procedures to implement structural,operational, and treatment BMPs.

Table 1-2: Continued
Element of theEnvironment
Impacts of the Proposal Impacts of No Action Measures to Mitigate Impacts
BP Cherry Point Cogeneration Project Chapter 1: SummaryDraft EIS 1-19 September 2003
• Stormwater runoff from the construction site wouldbe collected and routed to a sediment controlsystem.
• Sediment control measures, such as an oil-waterseparation system and detention ponds, would besized for storm events ranging from 6-month, 24-hour up to the 100-year, 24-hour event.
Operation • During operation, there would be the potential fora large seismic event to impact cogenerationfacility operations (i.e., the production ofelectricity).
• During operation, the greatest risk to the projectfrom volcanic activity would be from tephra (ash)fall.
• Under the No ActionAlternative, the project wouldnot be constructed, thereforethere would not be anyoperation impacts for thiselement of the environment.
Mitigation Proposed by Applicant
• The characteristics of the soils would be determinedduring the geotechnical analysis completed duringdetailed project design. If the soils prove to besusceptible to induced amplification, the projectdesign would incorporate protection measuresagainst such seismic events.
Additional Recommended Mitigation Measures
• In the event of tephra fall at the cogenerationfacility, all activities would be suspended until thetephra fall has ceased. Mechanical and electricalcomponents and water supply containmentstructures would be cleared of ash before resumingoperations.
Air QualityConstruction • Emissions during the construction process would
consist of fugitive dust and combustion exhaustemissions from construction equipment andvehicles. It is not anticipated that these emissionswould exceed the NAAQS.
• Under the No ActionAlternative, the project wouldnot be constructed, thereforethere would not be anyconstruction impacts for thiselement of the environment.
Mitigation Proposed by the Applicant
• Roads would be covered with gravel to minimizethe potential for fugitive dust emissions fromvehicle traffic.
• Late in construction, gravel roads would be pavedto further reduce emission of fugitive dust.
• Spraying exposed soil with water would reducePM10 emissions and particulate matter deposition.
• Planting vegetative cover as soon as possible aftergrading would reduce windblown particulate matterin the area.

Table 1-2: Continued
Element of theEnvironment
Impacts of the Proposal Impacts of No Action Measures to Mitigate Impacts
BP Cherry Point Cogeneration Project Chapter 1: SummaryDraft EIS 1-20 September 2003
Additional Recommended Mitigation
• Covering all trucks transporting materials, wettingmaterials in trucks, or providing adequatefreeboard (space from the top of the material to thetop of the truck) would reduce PM10 anddeposition of particulate matter duringtransportation.
• Providing wheel washers to remove particulatematter that would otherwise be carried offsite byvehicles would decrease deposition of particulatematter on area roads and subsequent entrainmentfrom those roads.
• Routing and scheduling construction trucks so asto reduce delays to traffic during peak travel timeswould reduce secondary air quality impacts causedby a reduction in traffic speeds while waiting forconstruction trucks.
• Requiring appropriate emission-control devices onall construction equipment powered by gasoline ordiesel fuel would reduce CO and NOxx emissionsin vehicular exhaust. Using relatively new, well-maintained equipment would reduce CO and NOx
emissions.Operation • During operation, emissions from the cogeneration
facility would include SO2, PM10, PM2.5, VOCs, CO,and NO2, however all pollutant concentration levelswould be well below National Ambient Air QualityStandards.
• Emissions of toxic air pollutants would result fromthe combustion of natural gas in the cogenerationfacility, however, modeled maximum concentrationsare less than the state's Acceptable Source ImpactLevels.
• The cogeneration facility would provide steam to therefinery and allow existing refinery boilers to be shutdown, thereby providing an offsetting air qualitybenefit.
• Under the No ActionAlternative, the project wouldnot be constructed, thereforethere would not be anyoperation impacts for thiselement of the environment.
Mitigation Proposed by the Applicant
• Only natural gas would be burned in thecombustion turbines and duct burners, and onlylow-sulfur diesel fuel in the emergency generatorand firewater pump.
• BACT would be used at the cogeneration facility.BACT to control criteria pollutant emissionsinclude:- Dry low NOx combustion technology;- Selective catalytic reduction technology;- Oxidation catalyst controls incorporated into the
HRSGs to reduce CO emissions and VOCs.

Table 1-2: Continued
Element of theEnvironment
Impacts of the Proposal Impacts of No Action Measures to Mitigate Impacts
BP Cherry Point Cogeneration Project Chapter 1: SummaryDraft EIS 1-21 September 2003
• Cogeneration emissions are projected to contributeto a decrease in visibility at the Olympic NationalPark.
• Fogging from the cooling tower vapor plume mayoccur for up to 650 to 1,650 feet for a total of 2.5hours a year in the northeast or northwest directionsfrom the tower.
• BACT to control toxic emissions include:- Use of clean natural gas as the only fuel for the
combustion gas turbines and HRSG duct burners;and
- Use of oxidation catalyst unit on each HRSG ductburner.
• As long as the Applicant owns the cogenerationfacility, mitigation of greenhouse gases (GHG)would be offset by GHG reduction within BP WestCoast Products, LLC worldwide operations.
• If the cogeneration facility is owned by anotherowner, then mitigation of GHG emissions wouldbe provided by:- the proposed CO2 emission standard would be
0.675 lbs. CO2/kWh,- emissions in excess of the emission standard
would be mitigated either by (a) an annualpayment of $0.85/ton CO2, or (b) GHGreductions obtained by the new owner, or (c) acombination of both.
- mitigation would be satisfied annually for 30years.
Water ResourcesConstruction • Water from various sources would be used to
support construction, including:- Approximately 7 million gallons of trucked water
from the refinery would be used for dust control;and
- Approximately 21.5 million gallons of fresh waterfrom the public utility district would be used forsteam blow testing and hydrostatic testing.
• Stormwater flow would be altered to controlerosion and sedimentation during construction
• Groundwater recharge would be reduced under theproject site during construction, but wouldincrease in the wetlands north of Grandview Road.
• Under the No ActionAlternative, the projectincluding proposed wetlandmitigation areas would not beconstructed. Therefore, therewould not be any constructionimpacts for this element of theenvironment.
Mitigation Proposed by the Applicant
• Stormwater would be collected, treated, anddischarged off-site within the same drainage basinallowing groundwater recharge in the samehydrological system.
• A stormwater pollution prevention (SWPP) planwould be developed prior to construction, theSWPP plan would include Temporary Erosion andSedimentation Control (TESC) plans.
• The SWPP and TESC would specify BestManagement Practices for erosion control duringconstruction. All erosion control BMPs would bein place and functioning prior to construction.
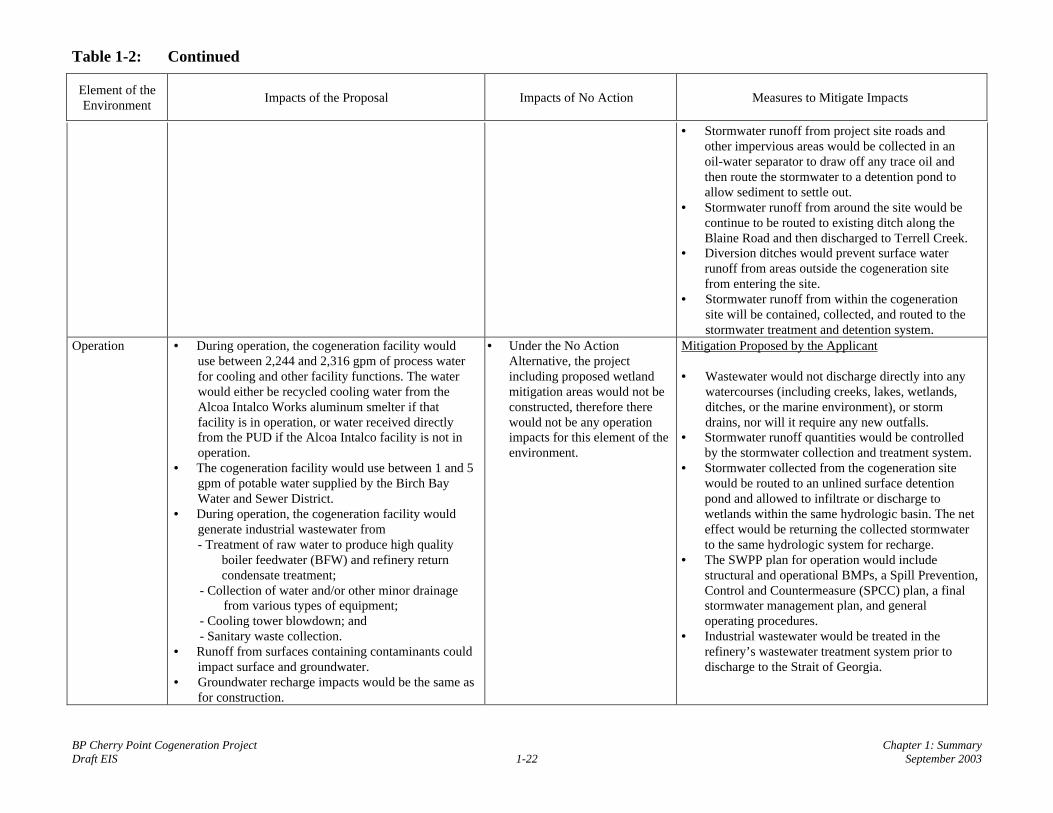
Table 1-2: Continued
Element of theEnvironment
Impacts of the Proposal Impacts of No Action Measures to Mitigate Impacts
BP Cherry Point Cogeneration Project Chapter 1: SummaryDraft EIS 1-22 September 2003
• Stormwater runoff from project site roads andother impervious areas would be collected in anoil-water separator to draw off any trace oil andthen route the stormwater to a detention pond toallow sediment to settle out.
• Stormwater runoff from around the site would becontinue to be routed to existing ditch along theBlaine Road and then discharged to Terrell Creek.
• Diversion ditches would prevent surface waterrunoff from areas outside the cogeneration sitefrom entering the site.
• Stormwater runoff from within the cogenerationsite will be contained, collected, and routed to thestormwater treatment and detention system.
Operation • During operation, the cogeneration facility woulduse between 2,244 and 2,316 gpm of process waterfor cooling and other facility functions. The waterwould either be recycled cooling water from theAlcoa Intalco Works aluminum smelter if thatfacility is in operation, or water received directlyfrom the PUD if the Alcoa Intalco facility is not inoperation.
• The cogeneration facility would use between 1 and 5gpm of potable water supplied by the Birch BayWater and Sewer District.
• During operation, the cogeneration facility wouldgenerate industrial wastewater from- Treatment of raw water to produce high quality
boiler feedwater (BFW) and refinery returncondensate treatment;
- Collection of water and/or other minor drainagefrom various types of equipment;
- Cooling tower blowdown; and- Sanitary waste collection.
• Runoff from surfaces containing contaminants couldimpact surface and groundwater.
• Groundwater recharge impacts would be the same asfor construction.
• Under the No ActionAlternative, the projectincluding proposed wetlandmitigation areas would not beconstructed, therefore therewould not be any operationimpacts for this element of theenvironment.
Mitigation Proposed by the Applicant
• Wastewater would not discharge directly into anywatercourses (including creeks, lakes, wetlands,ditches, or the marine environment), or stormdrains, nor will it require any new outfalls.
• Stormwater runoff quantities would be controlledby the stormwater collection and treatment system.
• Stormwater collected from the cogeneration sitewould be routed to an unlined surface detentionpond and allowed to infiltrate or discharge towetlands within the same hydrologic basin. The neteffect would be returning the collected stormwaterto the same hydrologic system for recharge.
• The SWPP plan for operation would includestructural and operational BMPs, a Spill Prevention,Control and Countermeasure (SPCC) plan, a finalstormwater management plan, and generaloperating procedures.
• Industrial wastewater would be treated in therefinery’s wastewater treatment system prior todischarge to the Strait of Georgia.

Table 1-2: Continued
Element of theEnvironment
Impacts of the Proposal Impacts of No Action Measures to Mitigate Impacts
BP Cherry Point Cogeneration Project Chapter 1: SummaryDraft EIS 1-23 September 2003
• During operation of the project, surface water fromthe cogeneration facility would be discharged to theCMA 2 site, increasing flows to the site. Increasedflows the site, combined with topologicalmodifications proposed for the site, is expected toincrease hydraulic residence time on the site, thusenhancing existing wetlands and restoring wetlandsthat have been effectively drained.
• Sanitary wastewater would be routed to the BirchBay Sewer District's wastewater treatment plant fortreatment and discharge to the Strait of Georgia.
Water QualityConstruction • Wastewater containing contaminants would be
generated during plant construction and pre-operation testing.
• During construction of the project, potential waterquality impacts could be caused by:-Sediment-laden stormwater discharged from the
project site during construction; and-Spills and leaks of chemicals, especially a large
volume spill, during construction could impactstormwater, surface water (wetlands), andgroundwater.
• Water used for HRSG steam-blow tests would bedischarged as steam to the atmosphere. Ifcontaminants are present in the water, thecontaminants may be discharged to the atmospherewith the steam.
• Runoff from surfaces containing contaminants couldimpact surface and groundwater.
• Sanitary waste generation is anticipated to be 500gallons per day during construction of the project.
• Under the No ActionAlternative, the project wouldnot be constructed; thereforethere would not be anyconstruction impacts for thiselement of the environment.
Mitigation Proposed by the Applicant
• Hydrostatic test water would be discharged to therefinery’s wastewater treatment system and thendischarged to the Strait of Georgia.
• SWPP plan for construction activities would beprepared for the various elements of the project,and would include stormwater managementprocedures, temporary erosion and sedimentationcontrol (TESC) plan for each phase of project, thespecification of all necessary BMPs forconstruction activities as specified in theStormwater Management Manual for WesternWashington (Ecology 2001), and include generaloperation and maintenance descriptions of theBMPs used on site.
• All erosion control BMPs would be in place andfunctioning prior to the start of construction.
• To minimize the potential release or spills ofchemicals during construction, best managementpractices, as specified in the SWPP plans, would beemployed. These would include good housekeepingmeasures, inspections, containment facilities,minimum onsite inventory, and spill preventionpractices.

Table 1-2: Continued
Element of theEnvironment
Impacts of the Proposal Impacts of No Action Measures to Mitigate Impacts
BP Cherry Point Cogeneration Project Chapter 1: SummaryDraft EIS 1-24 September 2003
Additional Recommended Mitigation Measures
• EFSEC is currently developing State WasteDischarge Permit conditions for construction of thecogeneration facility. The permit would specifyconstruction stormwater effluent limits andmonitoring requirements intended to reduce oreliminate water quality impacts. Monitoring ofstormwater would commence at the beginning ofconstruction.
Operation • Spills and leaks of chemicals, especially a largevolume spill, during operation could affectstormwater, surface water (wetlands), andgroundwater.
• The cogeneration facility would produce 190 gpm onaverage (assuming 15 cycles of concentration in thecooling tower) of non-recyclable process wastewaterwhich would be sent to the BP refinery’s wastewatertreatment system.
• Between 1 and 5 gpm of sanitary waste would begenerated by the cogeneration facility.
• Periodic washing of the gas turbines would generateup to approximately 2,300 gallons of wash water perturbine per quarter. The wash water would likelycontain dirt deposits removed from the blades, alongwith detergents used for the cleaning operation.
• Operation and maintenance of the industrial watersupply pipeline and associated components at theAlcoa Intalco Works could result in potentialerosion/sedimentation and chemical spills that couldimpact surface water and groundwater quality.
• Under the No ActionAlternative, the project wouldnot be constructed; thereforethere would not be anyoperation impacts for thiselement of the environment.
Mitigation Proposed by the Applicant
• SWPP plan for operational activities would beprepared for the cogeneration facility, and wouldinclude stormwater management procedures. TheSWPP plan for operation would include structuraland operational BMPs; a SPCC plan; and a finalstormwater management plan.
• Prior to operation of the cogeneration facility, aSPCC plan would be prepared the plan wouldcontain procedures for spill response, containment,and prevention procedures; and structural,operational, and treatment BMPs.
• Safeguards incorporated to mitigate the risks of arelease to the environment from stored operationalchemicals include secondary containment, tankoverfill protection, routine maintenance, safehandling practices, supervision of allloading/unloading by plant personnel and truckdrivers, and appropriate training of operation andmaintenance staff.
• Industrial wastewater from the cogeneration facilitywould be treated in the refinery’s wastewatertreatment system prior to discharge to the Strait ofGeorgia.
• Sanitary wastewater would be routed to the BirchBay wastewater treatment plant for treatment anddischarge to the Strait of Georgia.

Table 1-2: Continued
Element of theEnvironment
Impacts of the Proposal Impacts of No Action Measures to Mitigate Impacts
BP Cherry Point Cogeneration Project Chapter 1: SummaryDraft EIS 1-25 September 2003
Additional Recommended Mitigation Measures
• EFSEC has developed Draft State Waste DischargePermit conditions for operation of the CogenerationFacility. Permit conditions include dischargelimitations, monitoring requirements, reporting andrecord keeping requirements, operation andmaintenance plan for water quality treatmentfacilities, development of SPCC and hazardouswaste management plans, and SWPP plan.
WetlandsConstruction • Construction of the project would disturb 35.52 acres
of existing wetland areas, including 30.66 acres thatwould be permanently disturbed and 4.86 acres thatwould be temporarily disturbed. Affected wetlandswould be located at the cogeneration facility site(Wetlands A, B1, B2, B3, C, and D), the refineryinterface (Wetlands F, G, J, and H), and thetransmission system.
• Reduced wetland functions would includefloodwater detention and retention, flood flowdesynchronization, groundwater recharge anddischarge, and water quality improvement.
• Under the No ActionAlternative, the projectincluding proposed wetlandmitigation, would not beconstructed. Therefore noconstruction impacts orwetland enhancement wouldoccur.
Mitigation Proposed by the Applicant
• Mitigation measures consistent with those generallyrequired by the Corps and Ecology for Category IIIwetlands within Western Washington would beimplemented during construction to protectwetlands that would not be filled. Wetlands notdisturbed would be protected using silt fencing andhaybales. Wetlands temporarily disturbed andwould be restored after the project construction iscompleted.
• To compensate permanently disturbed wetlands theApplicant has designed a compensatory mitigationplan in consultation with state, and federalagencies. The proposed plan outlines theenhancement of 110 acres north of GrandviewRoad.
• To minimize and control the spread of noxiousweed species, all equipment would be cleanedbefore leaving the site.

Table 1-2: Continued
Element of theEnvironment
Impacts of the Proposal Impacts of No Action Measures to Mitigate Impacts
BP Cherry Point Cogeneration Project Chapter 1: SummaryDraft EIS 1-26 September 2003
Operation • Other than those communities affected byconstruction, operation of the project would notaffect existing wetland systems.
• Under the No ActionAlternative, the project wouldnot be constructed, thereforethere would not be anyimpacts for this element of theenvironment. The proposedwetland enhancement and thecreation of new wetlandswould not occur.
Mitigation Proposed by the Applicant
• A 10-year monitoring plan would be implementedto measure mitigation success.
Agricultural Land, Crops, and LivestockConstruction • The proposed project elements would result in the
development or modification of land that WhatcomCounty has identified as Category I and II primefarmland soils and mapped as APO soils andAgricultural Open Space.
• Reconstruction of Custer/ Intalco Transmission LineNo. 2 would likely result in the conversion of someprime farmland to utility uses within the existingBonneville Transmission Corridor.
• Construction of the cogeneration facility, AccessRoad 1, and Laydown Areas 2 and 4 would result ina direct and permanent loss of approximately 2.6acres of existing hybrid black cottonwood.
• The proposed compensatory wetland mitigation planwould preclude the continued use of mitigation areaCMA 1 for cattle grazing.
• Under the No ActionAlternative, the project wouldnot be constructed, thereforethere would not be anyimpacts for this element of theconstruction environment.
Mitigation Proposed by the Applicant
• No mitigation measures for agricultural land, crops,and livestock are proposed.
Operation • Emissions from the cogeneration facility areexpected to have a negligible effect on agriculturalcrops and livestock.
• Under the No ActionAlternative, the project wouldnot be constructed, thereforethere would not be anyimpacts for this element of theoperation environment.
• No operational mitigation measures for agriculturalland, crops, and livestock are proposed.

Table 1-2: Continued
Element of theEnvironment
Impacts of the Proposal Impacts of No Action Measures to Mitigate Impacts
BP Cherry Point Cogeneration Project Chapter 1: SummaryDraft EIS 1-27 September 2003
Upland Vegetation, Wildlife and Habitat, Fisheries, and Threatened and Endangered SpeciesConstruction • Construction of the project would disturb up to 33.53
acres of existing upland vegetation, including:including grassland, shrubland, mixedconiferous/deciduous forest, coniferous forest, anddeciduous forest. Potential additional clearingassociated with the transmission lines have not beenquantified at this time but will be incorporated intothe Final EIS.
• The primary effect from project construction wouldbe removal and loss of habitat. Grassland and wetlandcommunities are the primary habitats that would becleared under the proposed alternative. Other habitatsthat would be cleared include shrubland, mixedconiferous/deciduous forest, coniferous forest, anddeciduous forest.
• Disturbances caused by construction on the site mayaffect wildlife in adjacent habitats by disruptingfeeding and nesting activities. Increased noise levelscreated by heavy machinery could cause birds toabandon their nests and may temporarily displacewildlife during construction.
• Proposed wetland enhancement and the creation ofnew wetlands associated with proposed wetlandmitigation sites CMA 1 and CMA 2 would result inan increase in habitat quality, would benefit wildlifespecies that currently use the area, and would likelyattract a more diverse assortment of wildlife species.
• Under the No ActionAlternative, new facilitieswould not be constructed atthe site, and impacts onupland vegetation, wildlifeand habitat, fisheries, andthreatened and endangeredspecies associated with theproposed project would notoccur. No impacts orconstruction would occur thatwould entail removal oralteration of existing habitatwithin the proposed projectsite.
• The proposed wetlandenhancement and the creationof new wetlands associatedwith proposed wetlandmitigation sites CMA 1 andCMA 2 would not occur.
Mitigation Proposed by the Applicant
• BMPs would be implemented to protect uplandvegetation communities within the proposed projectsite that are not disturbed during construction.
• Native vegetation, including seed mixes with nativegrasses, would be used to replace vegetation,particularly areas infested by weedy species.
• A landscaping plan would be prepared andimplemented that includes long-term weed controlmeasures.
• Plant native trees and shrubs parallel to the southside of Grandview Road, north of the cogenerationfacility site and north of the laydown areas, to thewest of Blaine Road.
• Development of the stormwater control systemwould maintain water quality and fishery resourcesin Terrell Creek
• Development and implementation of the SWPPPswould also protect water quality and fisheryresources.
• Mitigation requirements as conditions of permits orgovernment approvals would be implemented.
• Construction Laydown Area 4 would be restoredfollowing construction l.
• The Applicant would restore, rehabilitate andenhance wetlands north of Grandview Road,identified as mitigation sites CMA 1 and CMA 2.
Operation • Some areas currently dominated by noxious weedspecies may be converted to landscaped areas thatwould require maintenance. The establishment ofnoxious weed species may occur within the proposedplant site.
• Operation and maintenance associated with thetransmission corridors would include removing ortopping trees to maintain a safe distance betweentrees and electrical lines.
• Under the No ActionAlternative, the project wouldnot be constructed, thereforethere would not be anyimpacts for this element of theenvironment.
Additional Recommended Mitigation Measures
• Implement weed control program approval by theWhatcom County Noxious Weed Control Board.
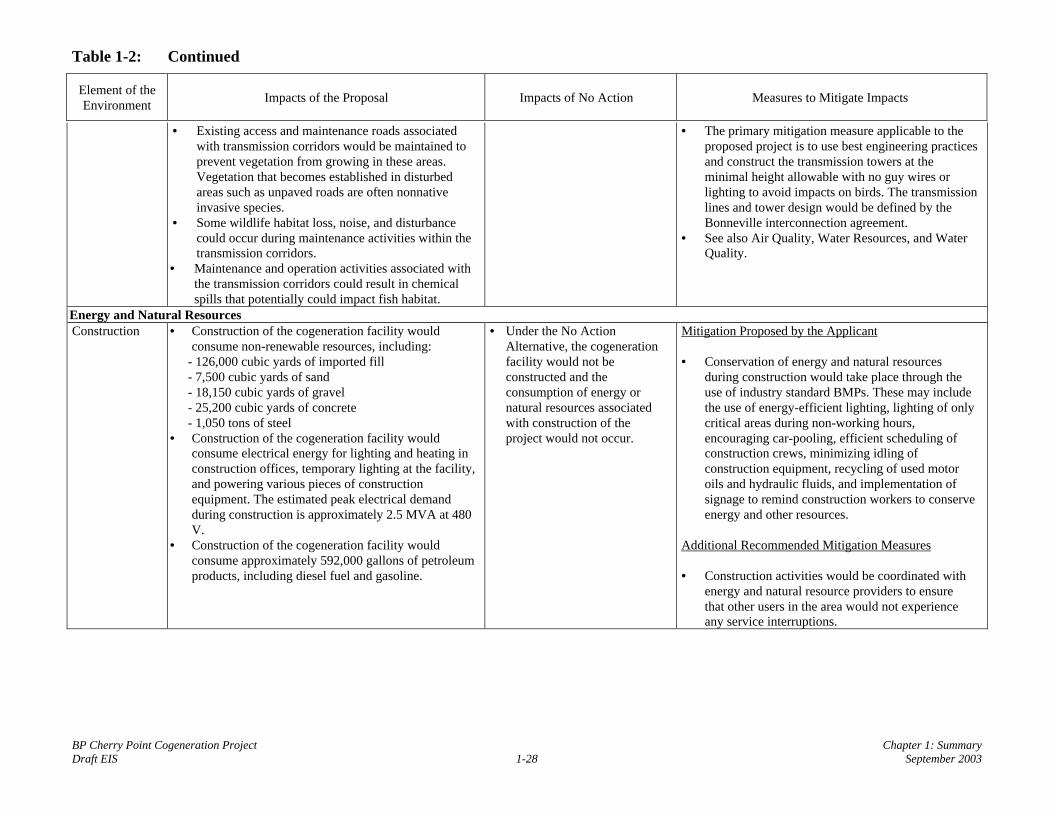
Table 1-2: Continued
Element of theEnvironment
Impacts of the Proposal Impacts of No Action Measures to Mitigate Impacts
BP Cherry Point Cogeneration Project Chapter 1: SummaryDraft EIS 1-28 September 2003
• Existing access and maintenance roads associatedwith transmission corridors would be maintained toprevent vegetation from growing in these areas.Vegetation that becomes established in disturbedareas such as unpaved roads are often nonnativeinvasive species.
• Some wildlife habitat loss, noise, and disturbancecould occur during maintenance activities within thetransmission corridors.
• Maintenance and operation activities associated withthe transmission corridors could result in chemicalspills that potentially could impact fish habitat.
• The primary mitigation measure applicable to theproposed project is to use best engineering practicesand construct the transmission towers at theminimal height allowable with no guy wires orlighting to avoid impacts on birds. The transmissionlines and tower design would be defined by theBonneville interconnection agreement.
• See also Air Quality, Water Resources, and WaterQuality.
Energy and Natural ResourcesConstruction • Construction of the cogeneration facility would
consume non-renewable resources, including:- 126,000 cubic yards of imported fill- 7,500 cubic yards of sand- 18,150 cubic yards of gravel- 25,200 cubic yards of concrete- 1,050 tons of steel
• Construction of the cogeneration facility wouldconsume electrical energy for lighting and heating inconstruction offices, temporary lighting at the facility,and powering various pieces of constructionequipment. The estimated peak electrical demandduring construction is approximately 2.5 MVA at 480V.
• Construction of the cogeneration facility wouldconsume approximately 592,000 gallons of petroleumproducts, including diesel fuel and gasoline.
• Under the No ActionAlternative, the cogenerationfacility would not beconstructed and theconsumption of energy ornatural resources associatedwith construction of theproject would not occur.
Mitigation Proposed by the Applicant
• Conservation of energy and natural resourcesduring construction would take place through theuse of industry standard BMPs. These may includethe use of energy-efficient lighting, lighting of onlycritical areas during non-working hours,encouraging car-pooling, efficient scheduling ofconstruction crews, minimizing idling ofconstruction equipment, recycling of used motoroils and hydraulic fluids, and implementation ofsignage to remind construction workers to conserveenergy and other resources.
Additional Recommended Mitigation Measures
• Construction activities would be coordinated withenergy and natural resource providers to ensurethat other users in the area would not experienceany service interruptions.

Table 1-2: Continued
Element of theEnvironment
Impacts of the Proposal Impacts of No Action Measures to Mitigate Impacts
BP Cherry Point Cogeneration Project Chapter 1: SummaryDraft EIS 1-29 September 2003
Operation During operation, the cogeneration facility would:• Consume approximately 42.5 million MMBtu of
natural gas per year.• The proposed project may exceed the transmission
capacity of the Ferndale Pipeline during periods ofpeak demand. The Applicant estimates that up toapproximately 40,000 decatherms per day ofadditional capacity of may be needed.
• Operation of the cogeneration facility wouldconsume petroleum products, primarily lubricantsassociated with the operation of equipment and gasand diesel fuel for vehicles around the facility
• The cogeneration facility would use variouschemicals during operation to facilitate desiredchemical reactions, control water quality, and forother facility operational purposes.
• Transmission line maintenance would requirerelatively small quantities of fuel for vehicles andhelicopters engaged in transmission line surveillanceand monitoring, and electricity to maintain andoperate equipment at Custer Substation.Transmission corridor road maintenance wouldrequire the use of crushed rock, gravel, and sandduring the life of the project on an as-needed basis.Periodic replacement of conductor wires, groundwires, fiber optic cables, insulators, and structuralelements may be required over time.
• Generate a nominal 720 MW of electricity, of which,approximately 85 MW would be used by the BPCherry Point Refinery, 21 MW would be used by thenatural gas compression station and othercogeneration facility auxiliary systems, and 635 MWwould be exported to the Northwest power grid foruse by other customers.
• Supply approximately 4,200 million pounds (MMlb)of steam per year to the refinery.
• Under the No ActionAlternative, the project wouldnot be constructed; thereforethere would not be anyconstruction impacts for thiselement of the environment.
• Under the No ActionAlternative, the Applicantwould likely continue to meetthe electrical power needs ofthe refinery with acombination of onsiteelectrical power generationand purchasing electricalpower from other sources. Theexisting refinery boiler systemwould continue to be used tomeet the refinery's steamdemand. Under thisalternative, the cogenerationfacility would not generate andtransmit electrical power foruse on the Northwest powergrid.
Mitigation Proposed by the Applicant
• Boiler blowdown water would be routed to thecooling tower as make up water to reduce freshwater consumption.
• Existing utility boilers would be taken out ofservice and replaced with more efficientcogeneration steam generation cycle, reducing theuse of natural gas resources.

Table 1-2: Continued
Element of theEnvironment
Impacts of the Proposal Impacts of No Action Measures to Mitigate Impacts
BP Cherry Point Cogeneration Project Chapter 1: SummaryDraft EIS 1-30 September 2003
NoiseConstruction • Noise produced during construction would vary
depending on the construction phase underway.Maximum noise levels from most constructionequipment could range from 69 to 106 decibels ordB(A) at 50 feet.
• In addition to noise produced from onsiteconstruction equipment, traffic volumes wouldincrease as construction employees commute to andfrom work at the site. Additional transient noisewould occur as a result of increased volumes ofdelivery and service vehicles (including trucks ofvarious sizes) doing business at the site.
• Under the No ActionAlternative, the project wouldnot be constructed, thereforethere would not be anyconstruction impacts for thiselement of the environment.
Mitigation Proposed by Applicant
• To reduce construction noise, the constructionindustry’s management practices would beincorporated into construction plans and contractorspecifications.
• Limiting noisier construction activities to thehours of 7 a.m. and 10 p.m. would reduceconstruction noise during sensitive nighttimehours.
• Construction equipment would be equipped withadequate mufflers, intake silencers, or engineenclosures.
Additional Recommend Mitigation Measures
• Turn off construction equipment during prolongedperiods of nonuse.
• Require contractors to maintain all equipment.• Locate stationary equipment away from receiving
properties.Operation • Modeling results indicate that none of the receivers
would experience a perceptible increase (above 3dBA) in noise during the daytime or evening.
• Under the No ActionAlternative, the project wouldnot be constructed, thereforethere would not be anyimpacts for this element of theenvironment.
Mitigation Measures Proposed by the Applicant
• The cogeneration placement and design of thefacility has integrated noise mitigation measuresfor sound reduction.
• Stack silencers would be incorporated into thedesign of the HRSG.
• The three gas turbine generators and the steamturbine generator will be housed within enclosures.
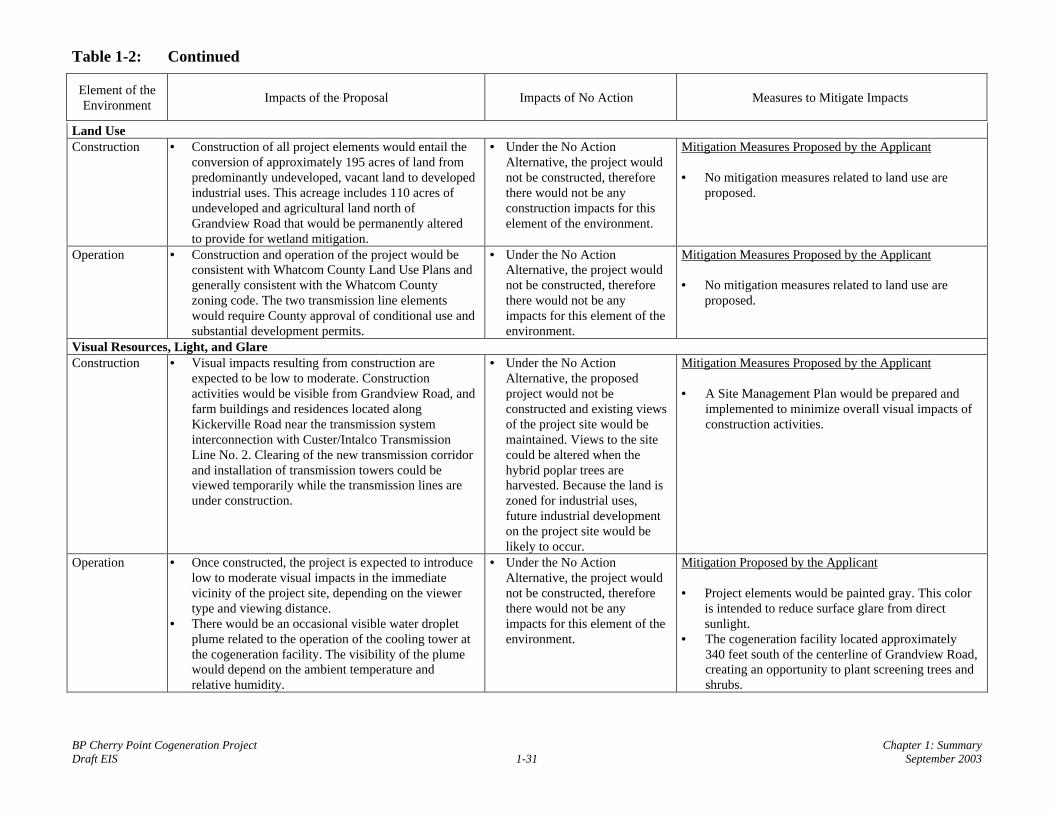
Table 1-2: Continued
Element of theEnvironment
Impacts of the Proposal Impacts of No Action Measures to Mitigate Impacts
BP Cherry Point Cogeneration Project Chapter 1: SummaryDraft EIS 1-31 September 2003
Land UseConstruction • Construction of all project elements would entail the
conversion of approximately 195 acres of land frompredominantly undeveloped, vacant land to developedindustrial uses. This acreage includes 110 acres ofundeveloped and agricultural land north ofGrandview Road that would be permanently alteredto provide for wetland mitigation.
• Under the No ActionAlternative, the project wouldnot be constructed, thereforethere would not be anyconstruction impacts for thiselement of the environment.
Mitigation Measures Proposed by the Applicant
• No mitigation measures related to land use areproposed.
Operation • Construction and operation of the project would beconsistent with Whatcom County Land Use Plans andgenerally consistent with the Whatcom Countyzoning code. The two transmission line elementswould require County approval of conditional use andsubstantial development permits.
• Under the No ActionAlternative, the project wouldnot be constructed, thereforethere would not be anyimpacts for this element of theenvironment.
Mitigation Measures Proposed by the Applicant
• No mitigation measures related to land use areproposed.
Visual Resources, Light, and GlareConstruction • Visual impacts resulting from construction are
expected to be low to moderate. Constructionactivities would be visible from Grandview Road, andfarm buildings and residences located alongKickerville Road near the transmission systeminterconnection with Custer/Intalco TransmissionLine No. 2. Clearing of the new transmission corridorand installation of transmission towers could beviewed temporarily while the transmission lines areunder construction.
• Under the No ActionAlternative, the proposedproject would not beconstructed and existing viewsof the project site would bemaintained. Views to the sitecould be altered when thehybrid poplar trees areharvested. Because the land iszoned for industrial uses,future industrial developmenton the project site would belikely to occur.
Mitigation Measures Proposed by the Applicant
• A Site Management Plan would be prepared andimplemented to minimize overall visual impacts ofconstruction activities.
Operation • Once constructed, the project is expected to introducelow to moderate visual impacts in the immediatevicinity of the project site, depending on the viewertype and viewing distance.
• There would be an occasional visible water dropletplume related to the operation of the cooling tower atthe cogeneration facility. The visibility of the plumewould depend on the ambient temperature andrelative humidity.
• Under the No ActionAlternative, the project wouldnot be constructed, thereforethere would not be anyimpacts for this element of theenvironment.
Mitigation Proposed by the Applicant
• Project elements would be painted gray. This coloris intended to reduce surface glare from directsunlight.
• The cogeneration facility located approximately340 feet south of the centerline of Grandview Road,creating an opportunity to plant screening trees andshrubs.

Table 1-2: Continued
Element of theEnvironment
Impacts of the Proposal Impacts of No Action Measures to Mitigate Impacts
BP Cherry Point Cogeneration Project Chapter 1: SummaryDraft EIS 1-32 September 2003
• From the intersection of Blaine and Grandview roads,the proposed cogeneration facility would bemoderately visible due to its close proximity to theroad.
• Under Option 1, there would be no visual impactsassociated with the Custer Intalco Transmission LineNo. 2. Under Option 2a, the use of larger steel latticetowers may result in a slight increase in effects overthe existing towers near residences because of theirgreater height. Under Option 2b, the closer spacing ofthe steel monopole towers may reduce the visualeffects of individual towers, but the decreasedspacing would result in a greater number of towersand may offer a slightly greater interruption of views.
• Project site lighting would be designed to minimizelight spillover and glare.
Population, Housing, and EconomicsConstruction • During construction monthly employment on site
would average 372 people, with peak employment of706 individuals.
• The indirect workforce associated with theconstruction stage of the project would beapproximately 210 people
• Including relocated employees from indirect labor,relocation could be as high as 180 workers
• Tax revenue from construction of the project wouldaccrue to Whatcom County and Washington State,from the following sources:- sales/use tax on equipment: $22.8 million.- sales/use tax on construction services and materials:
$4.9 million.
• Under the No ActionAlternative, the cogenerationfacility would not beconstructed. No additionalemployment or tax revenueswould be created, and noworkers would relocate to theproject area.
Mitigation Measures Proposed by the Applicant
• No mitigation measures are proposed.
Operation • Operation of the cogeneration facility would createapproximately 30 full time jobs, and approximately$200,000 per year worth of temporary positions.
• Operation of the cogeneration facility would generateWashington State brokerage tax revenues of between$4.5 and $5.3 million annually.
• Operation of the facility would generateapproximately $6 million in property tax revenuesannually
• Under the No ActionAlternative, the project wouldnot be constructed; thereforethere would not be anyimpacts for this element of theenvironment.
Mitigation Measures Proposed by the Applicant
• No operational mitigation measures are proposed.

Table 1-2: Continued
Element of theEnvironment
Impacts of the Proposal Impacts of No Action Measures to Mitigate Impacts
BP Cherry Point Cogeneration Project Chapter 1: SummaryDraft EIS 1-33 September 2003
• During operation, the cogeneration facility would alsopay business and occupation (B&O) and public utilitytax to the state of Washington. The total tax paidwould likely be on the order of several million dollarsper year.
Public Services and UtilitiesConstruction • Construction traffic associated with the project could
affect the use of recreational facilities near the projectsite. Such effects however would be relatively shortterm, and would not be likely to significantly affectthe public's ability to use these facilities.
• It is possible that families choosing to reside withinthe boundaries of the Blaine School District couldadd a relatively small number of students to thatdistrict's enrollment, which is currently at capacity,however individual family decisions regarding whereto reside would determine which schools students inthose families would be eligible to attend.
• Under the No ActionAlternative, the project wouldnot be constructed, thereforethere would not be anyconstruction impacts for thiselement of the environment.
Mitigation Measures Proposed by the Applicant
• The Applicant would develop response protocolswith the Jurisdiction Having Authority, FireDistrict #7, to ensure that additional support andresources are available from the district and otherfire jurisdictions through the District Mutual AidAgreements.
Operation • Operation of the cogeneration facility is projected tocreate 30 new jobs. It is possible that some familieswho choose to relocate and reside within theboundaries of the Blaine School District could add arelatively small number of students to that district'senrollment, which is currently at capacity.
• The Applicant proposes to provide its own security,emergency medical, and fire response infrastructure.It is anticipated that only in an emergency, wouldlocal community fire, police, medical services, andother government resources be called upon to helprespond to an event at the facility.
• Under the No ActionAlternative, the project wouldnot be constructed, thereforethere would not be anyconstruction impacts for thiselement of the environment.
• Tax revenue associated withconstruction and operation ofthe project would not berealized by the state ofWashington and WhatcomCounty.
Mitigation Measures Proposed by the Applicant
• No mitigation is proposed.
Cultural ResourcesConstruction • The Lummi Indian Nation’s second native plant
survey has not been completed and the results of thisstudy and its associated archaeological survey mayidentify important resources or sites in the variousproject facility areas.
• Under the No ActionAlternative, the project wouldnot be constructed; thereforethere would not be anyconstruction impacts for thiselement of the environment.
Mitigation Measures Proposed by the Applicant
• Monitor construction activities would occur within100 feet of the boundaries of the recordedarchaeological site discovered in Laydown Area 3.

Table 1-2: Continued
Element of theEnvironment
Impacts of the Proposal Impacts of No Action Measures to Mitigate Impacts
BP Cherry Point Cogeneration Project Chapter 1: SummaryDraft EIS 1-34 September 2003
• One recorded archaeological site in laydown area 3 inthe refinery interface area appears to be insignificantand therefore would not be adversely affected byproject construction.
• Archaeological surveys have not been conducted forthe following project facilities, therefore impacts tocultural resources in these areas are not known:various components in the refinery interface area;0.8-mile long Bonneville transmission line; Alcoawater pipeline; Access Road 1 area; and the wetlandmitigation area.
• A pedestrian survey is planned for the wetlandmitigation areas where the ground would be diskedto control reed canary grass.
Additional Recommended Mitigation
• If intact archaeological resources or human burialswere encountered during construction, activitiesthat could further disturb the deposits would bedirected away from the find. The Washington StateArchaeologist and Lummi Indian Nation culturalresource staff would be contacted.
• An archaeological survey should be conducted inareas not previously surveyed. If no significantarchaeological resources are discovered,construction activities would not affect culturalresources. If significant resource were found thatcould be impacted by the project, it isrecommended that appropriate mitigation measuresbe devised before construction begins.
Operation • Operation of the project would not result in adverseimpacts on cultural resources at any of the projectcomponents.
• Under the No ActionAlternative, the project wouldnot be constructed; thereforethere would not be anyoperation impacts for thiselement of the environment.
Mitigation Measures Proposed by the Applicant
• No operational mitigation measures are proposed.

Table 1-2: Continued
Element of theEnvironment
Impacts of the Proposal Impacts of No Action Measures to Mitigate Impacts
BP Cherry Point Cogeneration Project Chapter 1: SummaryDraft EIS 1-35 September 2003
TransportationConstruction • Construction of the proposed project would generate
650-1200 average weekday trips during the 25-monthconstruction period.
• During construction, some onsite soil would beremoved and disposed of at approved sites. Variousquantities of fill, including sand and gravel, wouldalso be imported to the site. In addition, constructionmaterials would be brought to the site that wouldinclude concrete, sheet and metal piping. Assumingtrucks with a 20-cubic-yard capacity, this wouldresult in 7,583 one-way truck trips.
• The SR 548/Portal Way intersection would operateat Level of Service (LOS) F during the PM peak hourduring peak construction conditions without anymitigation.
• Under the No ActionAlternative, traffic volumes inthe area would be expected toincrease at approximately a5% per year. Intersections onSR 548 would continue tooperate at LOS B or C. Theonly exception is the SR548/Portal Way intersection,which would operate at LOSD, which is consideredacceptable by WSDOT.
Mitigation Measures Proposed by the Applicant
• A Traffic Control Plan would be developed andimplemented to ensure safe travel conditions withinthe Grandview Road and SR 548 rights-of-way.
• A responsible person would be designated as theTransportation Coordinator.
• The Transportation Coordinator would serve as thepoint of contact for county and state agencies.
• Preferential parking for carpools and vanpoolswould be established at the site during construction,where practical.
• Shift hours would be staggered or adjusted asappropriate to minimize traffic impacts.
Additional Recommended Mitigation Measures
• All mitigation measures should be carried out bythe Applicant to maintain a positive and safe trafficflow. These could be formulated into aTransportation Management Program that wouldbe applicable during both construction andoperation of the proposed project.
• The Applicant would keep and maintain countyroads and SR 548 free of any debris or hazardousmaterial related to the project. Any spilled materialwould be cleaned up.
• A traffic signal would be installed at theintersection of Grandview Road (SR 548)/PortalWay.

Table 1-2: Continued
Element of theEnvironment
Impacts of the Proposal Impacts of No Action Measures to Mitigate Impacts
BP Cherry Point Cogeneration Project Chapter 1: SummaryDraft EIS 1-36 September 2003
Operation • Operation of the cogeneration facility would generateapproximately 140 weekday trips
• The level of service at the SR 548/Portal Wayintersection would decrease to LOS D, but delayswould be low, and no substantial traffic queuing orcongestion is expected.
• Under the No ActionAlternative, the project wouldnot be constructed; thereforethere would not be anyimpacts for this element of theenvironment.
Mitigation Measures Proposed by the Applicant
• An eastbound and a westbound left-turn lane wouldbe installed on SR 548 at the Blaine Roadintersection.
• An access road would be located approximately1,000 feet east of Blaine Road. The access roadwould be constructed and paved to meet applicablegeometric and safety standards.
Additional Recommended Mitigation Measures
• Intersection improvements to accompany trafficsignalization should be investigated at the PortalWay/Grandview Road (SR 548) and BlaineRoad/Grandview Road (SR 548) intersections.Traffic signalization may warrant changes tointersection operation such as left- or right-turnlanes.
Health and SafetyConstruction • Potential health and safety risks present during
construction are generally typical of the risks presenton major industrial/commercial construction site.Health and safety concerns include the risk of fire andexplosion, chemical storage and handling, spillresponse, collection, storage and disposal ofhazardous wastes, the installation of transmissionlines, sanitary waste handling, the presence of naturalgas, and worker exposure to radiation.
• The Ferndale natural gaspipeline and the BP CherryPoint Refinery have beenadjacent to the project site fordecades. If the proposedproject were not constructed,the worker and public healthand safety risks related to theuse, storage, collection andtreatment of non-hazardousand hazardous chemicals at therefinery would still exist.Under the no actionalternative, there would be noadditional health and safetyrisks related to theconstruction and operation ofthe proposed project.
Measures Proposed by Applicant
• Prior to construction the Applicant would requirethe engineering, procurement, and constructioncontractor to prepare an Environmental Health andSafety Program designed to reduce the potentialimpacts related to risks of fire and explosion, spills,hazardous or toxic materials management andhandling. Individual plans to be prepared include:- Fire Prevention and Response Plan,- Medical Emergency Plan,- Spill Prevention Plan ,- Hazardous Construction Material Management
Plan, and- Explosion Risk Management Plan.
• As appropriate, the Applicant’s existing health andsafety resources may augment the EPC contractor’sfirst aid, fire response, and security personnel.

Table 1-2: Continued
Element of theEnvironment
Impacts of the Proposal Impacts of No Action Measures to Mitigate Impacts
BP Cherry Point Cogeneration Project Chapter 1: SummaryDraft EIS 1-37 September 2003
• The EPC contractor would coordinate with theRefinery Fire Marshal and the Whatcom CountyFire Department during construction of theproposed project.
Operation • The potential risks present during operation,maintenance and standby of the proposed project aresimilar to those present during construction. Types ofaccidents that could occur that would pose a healthand safety risk to individuals at the cogenerationfacility, the BP refinery, or in the project vicinityinclude: the release of anhydrous ammonia, a naturalgas explosion or fire, and the release/spill of ahazardous chemical(s).
• The Ferndale pipeline and theBP Cherry Point Refinery havebeen adjacent to the projectsite for decades. If theproposed project were notconstructed, the worker andpublic health and safety risksrelated to the use, storage,collection and treatment ofnon-hazardous and hazardouschemicals at the refinerywould still exist. Under the noaction alternative, there wouldbe no additional health andsafety risks related to theconstruction and operation ofthe proposed project.
Mitigation Measures Proposed by Applicant
• Plans, procedures, and protocols for managingworker and public health and safety would bedeveloped. These may include:- Safety and Health Manual- Emergency Preparedness Response Plan, and- Fire Emergency Response Operations (FERO)
Plan• In addition to the plans, procedures, and protocols
listed above, the following plan would be preparedto protect worker and public health and safetyduring the operation of the proposed project:- Fire Prevention and Response Plan,- Spill Prevention Plan,- Hazardous Waste Management Plan,- Prevention of Natural Gas Plan, and- Explosion Risk Management Plan

BP Cherry Point Cogeneration Project Chapter 2: Proposed Action and AlternativesDraft EIS 2-1 September 2003
CHAPTER 2: PROPOSED ACTION AND ALTERNATIVES
2.1 INTRODUCTION
The Applicant proposes to construct and operate a nominal 720-MW, natural-gas-fired,combined-cycle cogeneration facility adjacent to the existing BP Cherry Point Refinery inWhatcom County, Washington. The cogeneration facility would provide steam and electricity tomeet the operating needs of the refinery and produce electrical power for local and regionalconsumption.
The Washington State Energy Facility Site Evaluation Council (EFSEC) has jurisdiction over theevaluation of major energy facilities including the proposed project and as such will recommendapproval or denial of the proposed cogeneration facility to the governor of Washington after anenvironmental review.
All project components within the proposed cogeneration facility boundary, including thefacility’s primary access road (Access Road 1), are considered the “principal facility” and wouldbe under EFSEC jurisdiction during project construction and operation. In addition, the proposedwetland mitigation sites and restoration areas would be under EFSEC jurisdiction for the life ofthe project.
Other facilities and equipment would be required to interconnect the cogeneration facility to therefinery for exchange of steam and steam condensate (e.g., piping and piperacks) or to connectthe cogeneration facility with existing utility infrastructure (i.e., natural gas, industrial watersupply, and electrical transmission lines). These connections would be made by modifyingexisting facilities or constructing new facilities on property that would not be under EFSECjurisdiction. Such facilities, equipment, and property are referred to as “ancillary facilities.”
For the purposes of this EIS, all principal and ancillary facility locations, temporary constructionlaydown areas, and wetland mitigation and restoration areas are collectively referred to as theproject site.
2.2 DESCRIPTION OF PROPOSED ACTION
2.2.1 Project Location
The proposed cogeneration facility would be located near Ferndale and Blaine in northwesternWhatcom County, Washington (see Figure 1-1). The cogeneration facility would be sited at theeastern edge of the BP Cherry Point Refinery between Grandview and Brown roads. The projectsite is approximately 6 miles northwest of Ferndale, 7 miles southeast of Blaine, and 15 milesnorthwest of Bellingham. The nearest community is Birch Bay, approximately 2 miles northwestof the site. The Canadian border is approximately 8 miles north of the proposed site.
The cogeneration facility and associated systems and components that interface with the refinery,including new natural gas and water supply connections, stormwater detention and treatmentfacilities, construction laydown areas, and wetland mitigation sites, would be located on

BP Cherry Point Cogeneration Project Chapter 2: Proposed Action and AlternativesDraft EIS 2-2 September 2003
Applicant-owned property. The project site is within the Cherry Point Major Industrial UrbanGrowth Area/Port Industrial Zone as defined in the Whatcom County Comprehensive Plan. Thecogeneration facility would occupy approximately 33 acres of unimproved land, which is zonedHeavy Impact Industrial. Proposed construction laydown areas would include an additional 36acres of land. Wetland mitigation sites proposed for the project north of Grandview Road wouldoccupy approximately 110 acres.
The land surrounding the cogeneration facility site is relatively flat and owned by the Applicantfor at least 0.5 mile in all directions. The closest residence is about 0.75 mile east of the site.Prior to construction of the refinery in 1969, the surrounding land was used for agriculture.Vegetation in the area mainly consists of grasses with areas of hybrid poplar trees that theApplicant planted between 1989 and 1991. The only relatively mature forests near the projectsite are small patches in the vicinity of the cogeneration facility site that developed fromabandoned homesteads and riparian areas along Terrell Creek. The Applicant owns the landnorth of the refinery site and the cogeneration facility and uses it for habitat enhancement and asa visual buffer for industrial operations. Some portions of Applicant-owned land in the area areleased to local farmers for livestock grazing and hay production. Terrell Creek is about 0.5 milenorth of the proposed cogeneration facility site within the Applicant’s habitat enhancement area.Other industrial sites near the proposed project site include the Chemco wood treatment facility(located about 0.75 mile east), the Praxair industrial gas plant (located 0.5 mile south), and thePuget Sound Energy peaking power plant (located 1 mile west) (see Figure 2-2).
The new 230-kV electrical transmission line that would connect the cogeneration facility withthe Bonneville transmission system also would be constructed on Applicant-owned land betweenthe cogeneration facility site and Bonneville’s Custer/Intalco Transmission Line No. 2approximately 0.8 mile to the east. The new transmission line would require a 150-foot utilityright-of-way (ROW) encompassing approximately 15 acres.
Bonneville has determined that modifications to the existing Custer/Intalco Transmission LineNo. 2 would be required to allow the proposed project to connect to the existing powertransmission system. The project portion of the transmission line is located within an existing125-foot Bonneville transmission ROW, which extends for approximately 5 miles throughpredominantly agricultural lands, and covers approximately 70 acres (see Appendix B for a mapand description of the existing corridor).
Figure 2-3 shows the infrastructure necessary to support the cogeneration facility. The WhatcomCounty Public Utility District No. 1 (PUD) would supply industrial water to the facility. Theelectrical transmission towers and corridor from the cogeneration facility to the Bonnevilleelectrical transmission system would be on Applicant-owned land.
Natural gas would be supplied to the cogeneration facility from either the Arco Western NaturalGas Pipeline (Ferndale pipeline) or the Cascade Natural Gas Pipeline, both of which run throughApplicant-owned land. The onsite stormwater detention pond would be within the boundary ofthe cogeneration facility. Sanitary wastewater would be sent to the Birch Bay WastewaterTreatment Plant for treatment and discharge to the Strait of Georgia.

BP Cherry Point Cogeneration Project Chapter 2: Proposed Action and AlternativesDraft EIS 2-3 September 2003
Figure 2-1:

BP Cherry Point Cogeneration Project Chapter 2: Proposed Action and AlternativesDraft EIS 2-4 September 2003
Figure 2-2: Project Site and Surrounding Area

BP Cherry Point Cogeneration Project Chapter 2: Proposed Action and AlternativesDraft EIS 2-5 September 2003
Figure 2-3: Existing Utility Infrastructure

BP Cherry Point Cogeneration Project Chapter 2: Proposed Action and AlternativesDraft EIS 2-6 September 2003
The Cherry Point Major Industrial Urban Growth Area/Port Industrial Zone is approximately6,500 acres, of which approximately 2,500 acres is currently occupied by heavy impactindustries. Land use and zoning maps of western Whatcom County and of the Cherry Pointsubarea from the Whatcom County Comprehensive Plan are presented in Section 3.10 Land Use.The northern boundary of the proposed cogeneration facility would be 337 feet south of thecenterline of Grandview Road. This setback provides space for landscaping and a buffer from theexisting gas pipeline easements that are 100 feet south of the centerline of Grandview Road.
2.2.2 Project Facilities
The proposed project includes a cogeneration facility and related components that would belocated on an approximately 265-acre site. The cogeneration facility would be designed,constructed, and operated as a stand-alone plant that would have a number of systems integratedwith the facilities and operations of the BP Cherry Point Refinery, including electrical power,steam and condensate systems, potable water, and industrial and sanitary wastewater (see Figure1-3).
In this EIS, individual systems and/or components of the proposed project have been groupedinto five major project elements to facilitate the analysis and discussion of potentialenvironmental impacts associated with the proposal. The five major elements are defined below.The components of each element are briefly described in Table 2-1. A more detailed descriptionof these facilities is provided in the text that follows.
Project facilities that would be constructed or installed within the boundary of the cogenerationplant are collectively referred to as “cogeneration facility,” and include:
• A steam turbine generator (STG);• Three combustion gas turbine generators (CGTs);• Three heat recovery steam generators (HRSGs);• Three HRSG exhaust stacks;• Three 150 million volt amp (MVA) step-down transformers;• An emergency diesel generator;• An evaporative cooling tower;• A variety of holding, storage, and transfer tanks and sumps (see Table 2-2);• Stormwater collection, detention, and treatment facilities;• An administration, control, and warehouse building complex;• Perimeter security fence and gates; and• A primary access road (Access Road 1).
Project facilities that would be constructed or installed in the BP Cherry Point Refinery tosupport integration and operation of the cogeneration facility are referred to as the “refineryinterface,” and include the following:
• Steam and condensate system connections and associated piping;• Natural gas supply connection and associated piping;• Natural gas compressor station;

BP Cherry Point Cogeneration Project Chapter 2: Proposed Action and AlternativesDraft EIS 2-7 September 2003
• Industrial water supply connection and associated piping;• Potable water supply connection and associated piping;• Industrial wastewater connection and associated piping;• Sanitary wastewater connection and associated piping;• Elevated piperack to support pipes that connect the two facilities;• An intermediate voltage (69 kV or 115 kV) electrical distribution substation;• Six electrical distribution transformers;• Stormwater collection, detention, and treatment facilities;• Construction Laydown Areas 1, 2, and 3; and• A connecting east-west access road (Access Road 2).
A new 230-kV double-circuit electrical distribution line would be installed to connect thecogeneration facility with the existing Bonneville transmission system approximately 0.8 mile tothe east. Throughout the EIS, this line is referred to as the “transmission system.”
Bonneville has determined that modifications to the Custer/Intalco portion of the existingBonneville transmission system would be required to accommodate connection of thecogeneration facility. Two options have been identified to provide the required modifications.Option 1 is a Remedial Action Scheme (RAS). A RAS would install additional electricalequipment within the Custer and Intalco substations, and would require an operating agreementamong the Applicant, Alcoa Intalco Works, and Bonneville for load-reduction protocols undercertain conditions. Option 2 is to reconstruct the Custer/Intalco Transmission Line No. 2 betweenthe Custer substation and the point of interconnection with the transmission system, a distance ofapproximately 5 miles. Reconstruction of the transmission line would involve installation of asecond transmission line and replacement of existing towers for this portion of the corridor.Existing single-circuit towers would be replaced with either double-circuit steel lattice towers(Option 2a) or double-circuit steel monopole towers (Option 2b). For purposes of this EIS, theelement of the project dealing with this modification is referred to as “Custer/IntalcoTransmission Line No. 2.”
Other elements of the project that would be constructed or installed in other locations as part ofthe project are referred to as “other project components,” and include:
• Water supply connections, equipment, and piping at Alcoa Intalco Works;• Laydown Area 4 (located at the northeast corner of the cogeneration facility site);• Compensatory Mitigation Area (CMA) 1 and 2 (immediately north of Grandview Road); and• A southern access road (Access Road 3) at the cogeneration facility.
Cogeneration Facility
The cogeneration facility would occupy approximately 33 acres immediately east of the BPCherry Point Refinery. The combined-cycle cogeneration (steam and electricity) facility wouldproduce a nominal 720 MW of power and export steam and electricity to the refinery.

BP
Che
rry
Poi
nt C
ogen
erat
ion
Pro
ject
Cha
pter
2:
Pro
pose
d A
ctio
n an
d A
lter
nati
ves
Dra
ft E
IS2-
8Se
ptem
ber
2003
Tab
le 2
-1:
BP
Che
rry
Poi
nt C
ogen
erat
ion
Pro
ject
Com
pone
nts
Com
pone
ntC
ompo
nent
Des
crip
tion
Con
stru
ctio
nR
espo
nsib
ility
1O
wne
r/O
pera
tor
Perm
its a
nd A
ppro
vals
Cog
ener
atio
n Fa
cilit
yPo
wer
Gen
erat
ion
Blo
ckIn
clud
es o
ne S
TG
, thr
ee C
GT
s, th
ree
HR
SGs,
and
asso
ciat
ed e
mis
sion
sta
cks,
eva
pora
tive
cool
ing
tow
er,
and
adm
inis
trat
ion
build
ing
com
plex
.
App
lican
tA
pplic
ant
EFS
EC
Cor
ps
230-
kV E
lect
rica
lSw
itchy
ard
Loc
ated
at t
he e
ast e
nd o
f th
e co
gene
ratio
n fa
cilit
y, it
serv
es a
s th
e ge
nera
tion/
tran
smis
sion
inte
rfac
e po
int.
App
lican
tO
wne
rshi
p su
bjec
t to
term
s of
a B
onne
ville
inte
rcon
nect
ion
agre
emen
t. A
pplic
ant w
ould
own
unde
rlyi
ng la
nd.
EFS
EC
Cor
psB
onne
ville
Stor
mw
ater
Fac
ilitie
sIn
clud
es s
torm
wat
er d
eten
tion
pond
1 a
nd a
ssoc
iate
doi
l-w
ater
sep
arat
ion
syst
em a
nd d
rain
age
ditc
h sy
stem
.A
pplic
ant
App
lican
tE
FSE
CC
orps
Em
erge
ncy
Gen
erat
orA
ppro
xim
atel
y 1,
500-
kW d
iese
l gen
erat
or.
App
lican
tA
pplic
ant
EFS
EC
Cor
psE
lect
rica
l Dis
trib
utio
nan
d C
ontr
ol S
yste
ms
Incl
udes
pow
er d
istr
ibut
ion
cent
ers,
sw
itchg
ear,
and
asso
ciat
ed m
eter
ing
and
cont
rol s
yste
ms
for
480V
and
4160
V s
yste
ms,
and
uni
vers
al p
ower
sup
ply
and
125V
back
up s
yste
ms.
App
lican
tA
pplic
ant
EFS
EC
Cor
ps
Fire
Pro
tect
ion
Syst
ems
Incl
udes
a p
erim
eter
fir
e su
ppre
ssio
n w
ater
loop
,de
tect
ion,
and
ala
rm s
yste
m, a
nd a
n ap
prox
imat
ely
265-
hp d
iese
l-po
wer
ed e
mer
genc
y w
ater
pum
p fo
r fi
resu
ppre
ssio
n.
App
lican
tA
pplic
ant
EFS
EC
Cor
ps
Cog
ener
atio
n Fa
cilit
yR
oads
and
Par
king
Are
as
Incl
udes
a p
erm
anen
t per
imet
er r
oad,
bra
nch
road
s to
acce
ss f
acili
ty c
ompo
nent
s, a
nd p
arki
ng a
rea
atad
min
istr
atio
n bu
ildin
g co
mpl
ex.
App
lican
tA
pplic
ant
EFS
EC
Cor
ps
Phys
ical
Site
Sec
urity
Incl
udes
an
8-fo
ot-h
igh
peri
met
er f
ence
, aut
omat
ic a
ndm
anua
l gat
es, a
nd p
erso
nnel
acc
ess
cont
rols
.A
pplic
ant
App
lican
tE
FSE
CC
orps
Oth
er S
yste
ms
and
Equ
ipm
ent
Incl
udes
con
tinuo
us e
mis
sion
s m
onito
ring
sys
tem
,au
xilia
ry c
lose
d co
olin
g w
ater
sys
tem
, and
adi
stri
bute
d co
ntro
l sys
tem
.
App
lican
tA
pplic
ant
EFS
EC
Cor
ps
Prim
ary
Acc
ess
Roa
d 1
Acc
ess
Roa
d 1,
the
nort
hern
acc
ess
road
and
pri
mar
yen
tran
ce, w
ould
be
appr
oxim
atel
y 40
0 fe
et lo
ng a
ndco
nstr
ucte
d fr
om G
rand
view
Roa
d.
App
lican
tA
pplic
ant
EFS
EC
1“a
t fen
ce li
ne”
indi
cate
s th
e re
fine
ry is
res
pons
ible
for
the
elem
ents
with
in it
s fe
nce
line,
and
the
coge
nera
tion
faci
lity
is r
espo
nsib
le f
or e
lem
ents
with
in it
s fe
nce
line.

BP
Che
rry
Poi
nt C
ogen
erat
ion
Pro
ject
Cha
pter
2:
Pro
pose
d A
ctio
n an
d A
lter
nati
ves
Dra
ft E
IS2-
9Se
ptem
ber
2003
Tab
le 2
-1:
Con
tinu
ed
Com
pone
ntC
ompo
nent
Des
crip
tion
Con
stru
ctio
nR
espo
nsib
ility
1O
wne
r/O
pera
tor
Perm
its a
nd A
ppro
vals
Ref
iner
y In
terf
ace
Wat
er S
uppl
yC
onne
ctio
n an
d Pi
ping
The
PU
D d
eliv
ers
wat
er to
the
refi
nery
via
an
exis
ting
24-i
nch
unde
rgro
und
pipe
line
alon
g A
lder
grov
e R
oad.
New
16-
inch
pip
ing
(loc
atio
n to
be
dete
rmin
ed)
wou
ldbe
inst
alle
d at
one
of
the
exis
ting
but u
nuse
d fl
ange
s on
the
24–i
nch
pipe
line.
App
lican
t or
Wha
tcom
PUD
– to
be
dete
rmin
ed
App
lican
t or
Wha
tcom
PU
D –
to b
e de
term
ined
EFS
EC
if A
pplic
ant
cons
truc
ts a
nd o
pera
tes
Nat
ural
Gas
Con
nect
ion
and
Pipe
sA
new
con
nect
ion
and
natu
ral g
as p
ipes
wou
ld b
ein
stal
led
at th
e ex
istin
g m
eter
ing
stat
ion
for
the
Fern
dale
pip
elin
e to
sup
port
bot
h co
gene
ratio
n an
dre
fine
ry o
pera
tions
. The
new
pip
es w
ould
be
rout
edun
derg
roun
d fr
om th
e m
eter
ing
stat
ion
to th
e ne
wco
mpr
esso
r st
atio
n ap
prox
imat
ely
300
feet
wes
t. A
conn
ectio
n fr
om th
e co
mpr
esso
r st
atio
n to
the
refi
nery
wou
ld b
e m
ade
with
app
roxi
mat
ely
300
feet
of
new
pipi
ng r
oute
d ba
ck u
nder
Bla
ine
Roa
d to
con
nect
with
exis
ting
pipi
ng a
t the
met
erin
g st
atio
n. T
he c
onne
ctio
nfr
om th
e co
mpr
esso
r st
atio
n to
the
coge
nera
tion
faci
lity
wou
ld b
e vi
a ne
w p
ipin
g ro
uted
alo
ng th
e el
evat
edpi
pera
ck.
App
lican
t, R
efin
ery,
or
Fern
dale
pip
elin
e –
tobe
det
erm
ined
, at f
ence
line
App
lican
t, R
efin
ery,
or
Fern
dale
pip
elin
e –
to b
ede
term
ined
, at f
ence
line
EFS
EC
if A
pplic
ant
cons
truc
ts a
nd o
pera
tes
aspa
rt o
f th
e co
gene
ratio
nfa
cilit
y -
Cou
nty,
Eco
logy
,an
d/or
Nor
thw
est A
irPo
llutio
n A
utho
rity
othe
rwis
e.
Any
com
pone
nts
on th
eco
gene
ratio
n fa
cilit
y si
tew
ould
be
regu
late
d by
EFS
EC
.
Nat
ural
Gas
Com
pres
sor
Stat
ion
A n
ew c
ompr
esso
r st
atio
n w
ould
be
inst
alle
d w
ithin
the
refi
nery
app
roxi
mat
ely
450
feet
wes
t of
the
coge
nera
tion
faci
lity,
and
wou
ld in
clud
e th
ree
elec
tric
ally
dri
ven
natu
ral g
as c
ompr
esso
rs e
nclo
sed
ina
sing
le b
uild
ing.
App
lican
t, R
efin
ery,
or
Fern
dale
pip
elin
e –
tobe
det
erm
ined
App
lican
t, R
efin
ery,
or
Fern
dale
pip
elin
e –
to b
ede
term
ined
EFS
EC
if A
pplic
ant
cons
truc
ts a
nd o
pera
tes
aspa
rt o
f th
e co
gene
ratio
nfa
cilit
y -
Cou
nty,
Eco
logy
,an
d/or
Nor
thw
est A
irPo
llutio
n A
utho
rity
othe
rwis
e.Fe
rnda
le P
ipel
ine
Met
erin
g St
atio
nM
odif
icat
ions
The
exi
stin
g Fe
rnda
le p
ipel
ine
met
erin
g st
atio
n lo
cate
dbe
twee
n th
e re
fine
ry a
nd th
e co
gene
ratio
n fa
cilit
yw
ould
req
uire
som
e m
odif
icat
ions
to a
ccom
mod
ate
met
erin
g fo
r th
e co
gene
ratio
n pr
ojec
t and
to r
econ
nect
the
natu
ral g
as p
ipel
ine
to A
lcoa
Int
alco
Wor
ks.
Fern
dale
pip
elin
eFe
rnda
le p
ipel
ine
Wha
tcom
Cou
nty
1“a
t fen
ce li
ne”
indi
cate
s th
e re
fine
ry is
res
pons
ible
for
the
elem
ents
with
in it
s fe
nce
line,
and
the
coge
nera
tion
faci
lity
is r
espo
nsib
le f
or e
lem
ents
with
in it
s fe
nce
line.

BP
Che
rry
Poi
nt C
ogen
erat
ion
Pro
ject
Cha
pter
2:
Pro
pose
d A
ctio
n an
d A
lter
nati
ves
Dra
ft E
IS2-
10Se
ptem
ber
2003
Tab
le 2
-1:
Con
tinu
ed
Com
pone
ntC
ompo
nent
Des
crip
tion
Con
stru
ctio
nR
espo
nsib
ility
1O
wne
r/O
pera
tor
Perm
its a
nd A
ppro
vals
Inte
rmed
iate
Vol
tage
(69
kV)
Subs
tatio
n an
dA
ssoc
iate
d Po
wer
Lin
es
A n
ew in
term
edia
te v
olta
ge (
69 k
V o
r 11
5 kV
)su
bsta
tion
wou
ld b
e in
stal
led
with
in th
e re
fine
ryap
prox
imat
ely
500
feet
wes
t of
the
coge
nera
tion
faci
lity
to f
acili
tate
pow
er d
istr
ibut
ion.
The
sub
stat
ion
wou
ld b
e co
nnec
ted
to th
e 23
0-kV
sw
itchy
ard
in th
eco
gene
ratio
n fa
cilit
y an
d th
ree
exis
ting
subs
tatio
nsel
sew
here
in th
e re
fine
ry v
ia n
ew o
verh
ead
orun
derg
roun
d po
wer
line
s.
App
lican
t or
Ref
iner
yR
efin
ery
EFS
EC
if A
pplic
ant
cons
truc
ts a
nd s
ubst
atio
nre
mai
ns p
art o
f th
eco
gene
ratio
n fa
cilit
y
Mod
ific
atio
ns to
Ref
iner
y Su
bsta
tions
MS
1, M
S 2,
and
MS
3
New
dis
trib
utio
n tr
ansf
orm
ers
wou
ld b
e in
stal
led
atex
istin
g re
fine
ry S
ubst
atio
ns M
S 1,
MS
2, a
nd M
S 3.
Ref
iner
yR
efin
ery
Stea
m a
nd C
onde
nsat
eSy
stem
sN
ew s
team
and
con
dens
ate
syst
em p
ipin
g w
ould
be
inst
alle
d be
twee
n th
e co
gene
ratio
n fa
cilit
y an
d th
ere
fine
ry. S
team
and
con
dens
ate
pipe
s w
ould
be
rout
edab
ove
grou
nd b
etw
een
the
two
faci
litie
s al
ong
the
elev
ated
pip
erac
k. T
he lo
catio
n an
d ro
ute
of p
ipin
gw
ithin
the
refi
nery
are
to b
e de
term
ined
.
App
lican
t, R
efin
ery,
at
fenc
e lin
eA
pplic
ant,
Ref
iner
y, a
t fen
celin
eE
FSE
C f
or c
ogen
erat
ion
faci
lity
to f
ence
line
Ele
vate
d Pi
pera
ckA
new
ele
vate
d pi
pera
ck w
ould
be
cons
truc
ted
betw
een
the
coge
nera
tion
faci
lity
and
the
refi
nery
tosu
ppor
t ste
am, c
onde
nsat
e, a
nd n
atur
al g
as p
ipes
betw
een
the
two
faci
litie
s. T
he p
iper
ack
wou
ld b
eap
prox
imat
ely
3,00
0-3,
500
feet
long
.
App
lican
t, R
efin
ery,
at
fenc
e lin
eA
pplic
ant,
Ref
iner
y, a
t fen
celin
eE
FSE
C f
or c
ogen
erat
ion
faci
lity
to f
ence
line
Lay
dow
n A
reas
1, 2
,an
d 3
The
se la
ydow
n ar
eas
wou
ld b
e lo
cate
d w
ithin
the
refi
nery
. Are
as 1
and
3 a
nd th
e so
uthe
rn p
ortio
n of
Are
a 2
wou
ld b
e pe
rman
ently
con
vert
ed to
indu
stri
alus
es. T
he n
orth
ern
273
feet
of
Are
a 2
wou
ld b
ere
stor
ed u
pon
com
plet
ion
of p
roje
ct c
onst
ruct
ion.
App
lican
tR
efin
ery
The
por
tion
of L
aydo
wn
Are
a 2
to b
e re
stor
ed a
fter
cons
truc
tion
wou
ld r
emai
nun
der
EFS
EC
juri
sdic
tion.
Pota
ble
Wat
er P
ipel
ine
The
PU
D s
uppl
ies
pota
ble
wat
er to
the
refi
nery
. New
pota
ble
wat
er p
ipin
g (l
ocat
ion
to b
e de
term
ined
)be
twee
n th
e re
fine
ry a
nd th
e co
gene
ratio
n fa
cilit
yw
ould
del
iver
pot
able
wat
er to
the
cong
ener
atio
nfa
cilit
y. T
he A
pplic
ant a
ntic
ipat
es th
at th
e pi
pe w
ould
be r
oute
d al
ong
Acc
ess
Roa
d 2.
App
lican
t, R
efin
ery,
at
fenc
e lin
eA
pplic
ant,
Ref
iner
y, a
t fen
celin
eE
FSE
C f
or c
ogen
erat
ion
faci
lity
to f
ence
line
1“a
t fen
ce li
ne”
indi
cate
s th
e re
fine
ry is
res
pons
ible
for
the
elem
ents
with
in it
s fe
nce
line,
and
the
coge
nera
tion
faci
lity
is r
espo
nsib
le f
or e
lem
ents
with
in it
s fe
nce
line.

BP
Che
rry
Poi
nt C
ogen
erat
ion
Pro
ject
Cha
pter
2:
Pro
pose
d A
ctio
n an
d A
lter
nati
ves
Dra
ft E
IS2-
11Se
ptem
ber
2003
Tab
le 2
-1:
Con
tinu
ed
Com
pone
ntC
ompo
nent
Des
crip
tion
Con
stru
ctio
nR
espo
nsib
ility
1O
wne
r/O
pera
tor
Perm
its a
nd A
ppro
vals
Indu
stri
al W
aste
wat
erPi
pelin
eC
ogen
erat
ion
faci
lity
indu
stri
al w
aste
wat
er w
ould
be
conv
eyed
to th
e re
fine
ry f
or tr
eatm
ent v
ia n
ew p
ipin
g(l
ocat
ion
to b
e de
term
ined
) to
be
cons
truc
ted
betw
een
the
refi
nery
and
the
coge
nera
tion
faci
lity.
The
App
lican
t ant
icip
ates
that
the
pipe
wou
ld b
e ro
uted
alon
g A
cces
s R
oad
2.
App
lican
t, R
efin
ery,
at
fenc
e lin
eA
pplic
ant,
Ref
iner
y, a
t fen
celin
eE
FSE
C f
or c
ogen
erat
ion
faci
lity
to f
ence
line
Sani
tary
Was
tew
ater
Pipe
line
Cog
ener
atio
n fa
cilit
y sa
nita
ry w
aste
wat
er w
ould
be
conv
eyed
to th
e re
fine
ry's
san
itary
was
tew
ater
sys
tem
via
new
pip
ing
(loc
atio
n to
be
dete
rmin
ed)
to b
eco
nstr
ucte
d be
twee
n th
e re
fine
ry a
nd th
e co
gene
ratio
nfa
cilit
y. T
he A
pplic
ant a
ntic
ipat
es th
at th
e pi
pe w
ould
be r
oute
d al
ong
Acc
ess
Roa
d 2.
App
lican
t, R
efin
ery,
at
fenc
e lin
eA
pplic
ant,
Ref
iner
y, a
t fen
celin
eE
FSE
C f
or c
ogen
erat
ion
faci
lity
to f
ence
line
Stor
mw
ater
Det
entio
nan
d T
reat
men
t Fac
ilitie
sIn
clud
es s
torm
wat
er d
eten
tion
pond
2 (
170
feet
by
150
feet
by
6 fe
et),
ass
ocia
ted
oil/w
ater
sep
arat
ion
faci
litie
s, p
erim
eter
acc
ess
road
, and
Ditc
h C
-4(a
ppro
xim
atel
y 1,
500
feet
long
).
App
lican
tR
efin
ery
Con
stru
ctio
n: E
FSE
CO
pera
tion:
Cou
nty/
Eco
logy
Acc
ess
Roa
d 2
Acc
ess
Roa
d 2,
an
east
-wes
t acc
ess
road
, wou
ld b
eco
nstr
ucte
d be
twee
n B
lain
e R
oad
and
the
wes
tern
edg
eof
the
coge
nera
tion
faci
lity;
it w
ould
be
24 f
eet w
ide
and
appr
oxim
atel
y 30
0 fe
et lo
ng.
App
lican
tR
efin
ery
Con
stru
ctio
n: E
FSE
CO
pera
tion:
Cou
nty/
stat
eag
enci
es
Tra
nsm
issi
on S
yste
m23
0-kV
Dou
ble-
Cir
cuit
Tra
nsm
issi
on L
ine
A n
ew 2
30-k
V d
oubl
e-ci
rcui
t tra
nsm
issi
on li
ne w
ould
be in
stal
led
betw
een
the
coge
nera
tion
faci
lity
switc
hyar
d an
d ex
istin
g C
uste
r/In
talc
o T
rans
mis
sion
Lin
e N
o. 2
. The
new
tran
smis
sion
line
, whi
ch w
ould
be
appr
oxim
atel
y 0.
8-m
ile lo
ng, w
ould
req
uire
fou
rla
ttice
-sty
le to
wer
s an
d on
e m
onop
ole-
styl
e to
wer
.
App
lican
tO
wne
rshi
p su
bjec
t to
term
s of
a B
onne
ville
inte
rcon
nect
ion
agre
emen
t. R
efin
ery
wou
ldow
n un
derl
ying
land
.
Bon
nevi
lle
Cus
ter/
Inta
lco
Tra
nsm
issi
on L
ine
No.
2O
ptio
n 1:
Rem
edia
l Act
ion
Sche
me
A R
AS
wou
ld in
volv
e th
e in
stal
latio
n of
new
bre
aker
san
d ot
her
elec
tric
al e
quip
men
t and
wir
ing
at th
e C
uste
ran
d In
talc
o su
bsta
tions
. Agr
eem
ent a
mon
g A
lcoa
Inta
lco
Wor
ks, t
he A
pplic
ant,
and
Bon
nevi
lle w
ould
be
requ
ired
.
Bon
nevi
lleB
onne
ville
Bon
nevi
lle
1“a
t fen
ce li
ne”
indi
cate
s th
e re
fine
ry is
res
pons
ible
for
the
elem
ents
with
in it
s fe
nce
line,
and
the
coge
nera
tion
faci
lity
is r
espo
nsib
le f
or e
lem
ents
with
in it
s fe
nce
line.

BP
Che
rry
Poi
nt C
ogen
erat
ion
Pro
ject
Cha
pter
2:
Pro
pose
d A
ctio
n an
d A
lter
nati
ves
Dra
ft E
IS2-
12Se
ptem
ber
2003
Tab
le 2
-1:
Con
tinu
ed
Com
pone
ntC
ompo
nent
Des
crip
tion
Con
stru
ctio
nR
espo
nsib
ility
1O
wne
r/O
pera
tor
Perm
its a
nd A
ppro
vals
Opt
ion
2:R
econ
stru
ctT
rans
mis
sion
Lin
e
Opt
ion
2 w
ould
rec
onst
ruct
an
exis
ting
Bon
nevi
lletr
ansm
issi
on li
ne b
etw
een
the
Cus
ter
subs
tatio
n an
d th
eco
gene
ratio
n fa
cilit
y in
terc
onne
ctio
n po
int
(app
roxi
mat
ely
5 m
iles
in le
ngth
). T
he e
xist
ing
sing
le-
circ
uit l
ine
with
latti
ce s
teel
tow
ers
wou
ld b
e re
plac
edw
ith a
dou
ble-
circ
uit l
ine
usin
g ei
ther
latti
ce s
teel
or
mon
opol
e to
wer
s.
Bon
nevi
lleB
onne
ville
Bon
nevi
lle
Oth
er P
roje
ct C
ompo
nent
sIn
dust
rial
Wat
er S
uppl
yPi
pelin
e an
dM
odif
icat
ions
at A
lcoa
Inta
lco
Wor
ks
New
pip
ing
wou
ld c
onne
ct th
e A
lcoa
Int
alco
Wor
ks a
irco
mpr
esso
r bu
ildin
g w
ith a
new
sum
p or
wet
wel
l (10
feet
by
40 f
eet b
y 10
fee
t dee
p) o
n th
e so
uth
side
of
the
Alc
oa f
acili
ty. A
n en
clos
ure
(12
feet
by
20 f
eet)
cont
aini
ng th
ree
150-
hp e
lect
ric
pum
ps w
ould
be
cons
truc
ted
and
conn
ecte
d to
the
PUD
con
trol
sys
tem
.A
new
16-
inch
pip
e ap
prox
imat
ely
1,60
0 fe
et lo
ng(l
ocat
ion
to b
e de
term
ined
, pre
sum
ably
with
in th
eA
lcoa
fac
ility
) w
ould
con
nect
the
wet
wel
l to
anex
istin
g PU
D w
ater
line
.
Wha
tcom
PU
DW
hatc
om P
UD
Wha
tcom
Cou
nty
Acc
ess
Roa
d 3
Acc
ess
Roa
d 3,
a p
erm
anen
t roa
d, w
ould
pro
vide
acce
ss to
the
coge
nera
tion
faci
lity
from
the
sout
h, a
ndw
ould
be
cons
truc
ted
betw
een
the
faci
lity
and
Bro
wn
Roa
d by
wid
enin
g an
d ex
tend
ing
the
exis
ting
tran
smis
sion
cor
rido
r’s
mai
nten
ance
roa
d so
uth
of th
esi
te. T
he r
oad
wou
ld b
e 30
fee
t wid
e an
dap
prox
imat
ely
1,50
0 fe
et lo
ng.
App
lican
tR
efin
ery
Con
stru
ctio
n: E
FSE
C
Ope
ratio
n: C
ount
y/ot
her
stat
e ag
enci
es
Com
pens
ator
y W
etla
ndM
itiga
tion
Are
asC
MA
1 a
nd C
MA
2 (
appr
oxim
atel
y 11
0 ac
res
tota
l)w
ould
be
loca
ted
nort
h of
the
coge
nera
tion
faci
lity
onea
ch s
ide
of B
lain
e R
oad
imm
edia
tely
nor
th o
fG
rand
view
Roa
d.
App
lican
tA
pplic
ant
EFS
EC
Lay
dow
n A
rea
4 an
dW
etla
nds
Miti
gatio
nT
his
tem
pora
ry la
ydow
n ar
ea w
ould
be
loca
ted
at th
eno
rthe
ast c
orne
r of
the
coge
nera
tion
faci
lity.
Thi
s ar
eaw
ould
be
rest
ored
upo
n co
mpl
etio
n of
con
stru
ctio
n.
App
lican
tA
pplic
ant
EFS
EC
1“a
t fen
ce li
ne”
indi
cate
s th
e re
fine
ry is
res
pons
ible
for
the
elem
ents
with
in it
s fe
nce
line,
and
the
coge
nera
tion
faci
lity
is r
espo
nsib
le f
or e
lem
ents
with
in it
s fe
nce
line.

BP
Che
rry
Poi
nt C
ogen
erat
ion
Pro
ject
Cha
pter
2:
Pro
pose
d A
ctio
n an
d A
lter
nati
ves
Dra
ft E
IS2-
13Se
ptem
ber
2003
Tab
le 2
-2:
Cog
ener
atio
n F
acili
ty T
anks
and
Sum
ps
Serv
ice/
Purp
ose
Tan
k T
ype
Wor
king
Cap
acity
(gal
lons
)D
iam
eter
(fee
t)H
eigh
t(f
eet)
Seco
ndar
yC
onta
inm
ent
Anh
ydro
us A
mm
onia
Sto
rage
Tan
k -
Stor
e liq
uefi
ed a
mm
onia
for
use
in s
elec
tive
cata
lytic
red
uctio
n ai
r po
llutio
n co
ntro
l sys
tem
Hor
izon
tal,
cylin
dric
al p
ress
ure
vess
el12
,000
745
Con
cret
e W
all
Boi
ler
Feed
wat
er a
nd C
onde
nsat
e St
orag
e T
ank
- St
orag
e fo
rbo
iler
feed
wat
er (
BFW
) an
d co
nden
sate
ret
urne
d fr
om th
e re
fine
rybe
fore
pol
ishi
ng tr
eatm
ent i
n de
min
eral
izer
sys
tem
Ver
tical
, cyl
indr
ical
, atm
osph
eric
abov
egro
und
tank
500,
000
5232
--
Dem
iner
aliz
ed W
ater
Sto
rage
Tan
k -
Prov
ide
mak
eup
BFW
in c
ase
wat
er d
eliv
ery
or tr
eatm
ent i
s te
mpo
rari
ly in
terr
upte
dV
ertic
al, c
ylin
dric
al, a
tmos
pher
icab
ove
grou
nd ta
nk (
open
ven
ted)
100,
000
----
--
Neu
tral
izat
ion
Tan
ks -
Col
lect
dem
iner
aliz
er r
egen
erat
ion
was
tes
to a
djus
t pH
as
nece
ssar
y fo
r di
scha
rge
to r
efin
ery’
s bi
olog
ical
was
tew
ater
trea
tmen
t sys
tem
Ver
tical
, cyl
indr
ical
, atm
osph
eric
abov
egro
und
tank
(op
en v
ente
d)50
,000
ea;
100,
000
tota
l16
34--
Fire
Sup
pres
sion
Wat
er P
ump
- D
iese
l Fue
l Sto
rage
Tan
kH
oriz
onta
l tan
kA
ppro
x. 4
604
5C
urbe
d A
rea
Die
sel G
ener
ator
- D
iese
l Fue
l Sto
rage
Tan
kV
ertic
al ta
nkA
ppro
x. 1
,500
68
Cur
bed
Are
aSt
eam
Tur
bine
- L
ube
Oil
Stor
age
Tan
kR
ecta
ngul
ar ta
nkA
ppro
x. 7
,200
24L
by
12W
7C
urbe
d A
rea
Thr
ee C
ombu
stio
n T
urbi
nes
- L
ube
Oil
Stor
age
Tan
ksR
ecta
ngul
ar ta
nkA
ppro
x. 6
,200
28L
by
10W
4.0
Cur
bed
Are
aO
xyge
n Sc
aven
ger
Tan
k -
Stor
age
for
BFW
trea
ting
chem
ical
Ver
tical
, cyl
indr
ical
, atm
osph
eric
1,00
05'
-2"
7'-4
"C
urbe
d A
rea
Neu
tral
izin
g A
min
e T
ank
- St
orag
e fo
r B
FW tr
eatin
g ch
emic
alV
ertic
al, c
ylin
dric
al, a
tmos
pher
ic1,
000
5'-2
"7'
-4"
Cur
bed
Are
aPh
osph
ate
Tan
k -
Stor
age
for
BFW
trea
ting
chem
ical
Ver
tical
, cyl
indr
ical
, atm
osph
eric
500
46'
-3"
Cur
bed
Are
aA
cid
Stor
age
Tan
ks -
Sto
rage
for
dem
iner
aliz
er c
atio
n;re
gene
ratio
n an
d co
olin
g to
wer
cir
cula
ting
wat
er tr
eatm
ent
Hor
izon
tal,
cylin
dric
al,
atm
osph
eric
8,00
0 ea
16,0
00 to
tal
912
'-6"
S/S
Con
cret
e W
all
Cau
stic
Sto
rage
Tan
k -
Stor
age
for
dem
iner
aliz
er a
nion
;re
gene
ratio
nH
oriz
onta
l, cy
lindr
ical
,at
mos
pher
ic8,
000
912
'-6"
S/S
Con
cret
e W
all
Blo
wdo
wn
Sum
p -
Gra
vity
dra
in c
olle
ctio
n po
int f
or H
RSG
boi
ler
blow
dow
n dr
ain,
pum
ped
from
sum
p to
neu
tral
izat
ion
tank
Bel
ow g
roun
d, c
oncr
ete
sum
p5,
865
14L
by
8W7
--
Oily
Wat
er S
ump
(GT
G a
nd S
TG
Are
a) -
Col
lect
ion
poin
t for
pote
ntia
l oily
run
off
from
was
h w
ater
and
pre
cipi
tatio
n, p
umpe
d to
refi
nery
trea
tmen
t sys
tem
Bel
ow g
roun
d, c
oncr
ete
sum
p58
6514
L b
y 8W
7--
Was
tew
ater
Equ
iliza
tion
Tan
kV
ertic
al, c
ylin
dric
al, a
tmos
pher
icab
oveg
roun
d ta
nk (
open
ven
ted)
400,
000
5226
--
Sodi
um H
ypoc
hlor
ite -
15%
sol
utio
n fo
r co
olin
g to
wer
cir
cula
ting
wat
er tr
eatm
ent
Ver
tical
, cyl
indr
ical
, atm
osph
eric
abov
egro
und
tank
8,00
09
12’-
6”C
urbe
d A
rea
Filte
red
Wat
er a
nd F
irew
ater
Sto
rage
Tan
kV
ertic
al, c
ylin
dric
al, a
tmos
pher
icab
oveg
roun
d ta
nk42
5,00
043
40--
CG
T W
ash
Wat
er S
ump
- T
empo
rary
sto
rage
of
used
was
h w
ater
from
per
iodi
c of
flin
e C
GT
cle
anin
gB
elow
gro
und,
con
cret
e su
mp
5,86
514
L b
y 8W
7--
Sour
ce:
BP
2002
, App
endi
x D

BP Cherry Point Cogeneration Project Chapter 2: Proposed Action and AlternativesDraft EIS 2-14 September 2003
Major Structures
Major structures at the cogeneration facility would include the STG enclosure; theadministration, control, and warehouse/maintenance building; the water treatment building; andthe switchgear building. The STG enclosure would house the STG, the condenser pumps, andother equipment associated with the STG; it would be approximately 190 feet by 90 feet by 50feet tall.
The major buildings would be single-story metal buildings built on concrete slabs at grade. Theadministration, control, and warehouse/maintenance building would be approximately 220 feetby 65 feet. The water treatment building would be approximately 35 feet by 80 feet, and theswitchgear building would be approximately 70 feet by 50 feet (BP 2002; Torpey, pers. comm.,2003).
Major outdoor equipment includes the cooling tower, the HRSGs, the CGTs, and the 230-kVelectrical switchyard. The cooling tower would be approximately 110 feet by 330 feet by 60 feettall and would be used to remove heat by circulating water to the condenser downstream of thesteam turbine. Each of the three HRSGs would be approximately 110 feet by 30 feet by 95 feettall with a 150-foot-tall exhaust stack.
Power Plant Processes
Electrical Power Generation
The power generation portion of the facility (power plant) would be configured with three 205-MVA natural-gas-fired CGTs, three HRSGs, and a single 243-MW STG. Thermal energyproduced through the combustion of natural gas would be converted into mechanical energy ineach CGT to drive an electric generator. Hot combustion gases from the CGTs would enter theHRSGs, which would transfer heat from the CGT exhaust gases to condensate and boilerfeedwater to produce steam. Steam from the HRSGs would enter the STG, where it wouldexpand and drive the steam turbine and its electric generator.
Electricity generated by the CGTs and STG would be transmitted to the 230-kV switchyardlocated on the east side of the cogeneration facility for further transmission to the refinery andthe Bonneville transmission system. Major equipment within the 230-kV switchyard wouldconsist of 230-kV breakers and associated controls, two outgoing circuits to the Bonnevilletransmission system, and three step-down transformers with overhead lines or cables to a newintermediate voltage substation to be constructed in the refinery.
Steam, Condensate, and Boiler Feedwater Systems
Systems within the Cogeneration Facility. The HRSGs would transfer heat from the CGTexhaust gases to condensate and boiler feedwater to produce high-pressure, intermediate-pressure, and low-pressure steam. The steam produced by the HRSGs would flow to the STG,where process steam would be extracted from the steam turbine and conditioned before it isexported to the refinery. Each HRSG would be equipped with duct burners for supplementary

BP Cherry Point Cogeneration Project Chapter 2: Proposed Action and AlternativesDraft EIS 2-15 September 2003
firing with natural gas. The duct burners would reheat the CGT exhaust gases to generateadditional steam at times when additional electricity and/or process steam would be needed.
A selective catalytic reduction (SCR) emission control system would be integrated within eachHRSG. The mechanical components of the system would include a catalyst bed and an ammoniastorage and distribution system. Other than the replacement of spent catalyst every three to fiveyears, the emission control system would produce no solid or liquid waste products. See Section3.2 Air Quality for additional discussion of the cogeneration facility’s emission controls. EachHRSG would have a 150-foot-tall exhaust stack.
Integration with the Refinery. The cogeneration facility would supply the refinery with steamrequired for refinery operations. During typical operation, steam would be provided at a flow rateof 510 thousand pounds per hour (kpph) and a pressure of 650 pounds per square inch absolute(psia). In return, the cogeneration facility would receive approximately 459 kpph of water thathas been condensed from the steam after use (condensate) from the refinery (approximately 90%of the steam supplied). This stream is actually a mix of demineralized water and condensate thatcomes from the refinery. Steam from the cogeneration facility to the refinery and condensatefrom the refinery to the cogeneration facility would be transmitted through a piping systemmounted on an aboveground rack that would be constructed south of the new east-west accessroad between the cogeneration facility and the refinery.
Cooling System
Exhaust from the steam turbine (steam not used by the refinery) would be discharged into anexhaust duct that leads to a surface condenser for cooling. The water-cooled condenser woulduse circulating water to condense the exhaust steam to condensate (water) for return to theHRSGs. Water from the circulating water-cooling system would be pumped to the evaporativecooling tower, where heat would be emitted to the atmosphere through the evaporation of aportion of the cooling water stream. The remaining cooling water would then be returned to thecondenser to repeat the cooling process.
Approximately 145,000 gpm of circulating water would be required to pass through the surfacecondenser to condense the exhaust steam at maximum plant load. An additional closed loopcooling water system would use a mixture of 45% propylene and 55% demineralized water toprovide auxiliary cooling in the facility.
Wastewater Treatment and Disposal
During normal operation, the cogeneration facility would generate wastewater from thefollowing activities:
• Treatment of industrial water and refinery condensate to produce high-quality boilerfeedwater;
• Collection of water and/or other minor drainage from various types of equipment andsecondary containment areas;
• Sanitary wastes from employee water use; and

BP Cherry Point Cogeneration Project Chapter 2: Proposed Action and AlternativesDraft EIS 2-16 September 2003
• Blowdown of water from the cooling tower.
A wastewater stream also would be generated periodically when a gas turbine is shut down towash the compressor blades to restore peak operating efficiency. This would be done severaltimes per year per gas turbine depending on need. The washing operation would generateapproximately 2,300 gallons of water that contains airborne dirt removed from the blades, oilresidue, and cleaning detergents. Wash water would be collected and temporarily stored in theCGT wash water sump. At this time, the Applicant assumes that the wash water would need tobe moved offsite for treatment and disposal unless and until the spent wash water can becharacterized and determined to be acceptable for treatment in the refinery wastewater system.The contractor in charge of washing the compressor blades would be responsible for transportingthe wash water offsite for treatment and proper disposal.
Periodically, the HRSGs must be purged of their contents (“blowdown”) to remove tracedissolved inorganic constituents that build up in the steam generation process. This blowdown iscooled and routed to the refinery’s cooling system to be recycled. Recycling the HRSGblowdown reduces the overall amount of freshwater necessary to operate the refinery.
Demineralization Plant Wastewater and Refinery Condensate Treatment System Waste
Pressure filters would be used to remove suspended solids in the water coming into thecogeneration facility. Filtration would be required as a first step in the production of high-qualityboiler feedwater. After 24 hours of use, each of the filters would be backwashed to remove thesolids from the filter media. The backwash water would be collected in the wastewaterequalization tank, which would be periodically pumped to the refinery for treatment.
Ion exchange units, which require periodic chemical regeneration with dilute sulfuric acid andsodium hydroxide, also would be used for water quality treatment. These chemicals, along withthe removed ions and rinse waters, would be collected and neutralized to a pH of between 6.5and 8.5 and pumped to the refinery’s wastewater treatment system.
Water produced from condensed steam returned from the refinery would be treated with a systemthat uses powdered cellulose and activated carbon to remove any trace oil before the water isused as boiler feedwater at the cogeneration facility. The cellulose used in this process wouldrequire periodic regeneration. The regeneration waste, including oily water and spent cellulosematerial, would be collected in a sump and drained for disposal. The Applicant estimates that thecogeneration facility would generate about 1,200 pounds per day of spent precoat filter materialwith roughly equal distributions of water, oil, and cellulose. The sump would be designed to holdapproximately 10 days’ capacity, or approximately 1,500 gallons. Oily water recovered from thesump would be pumped to the refinery’s wastewater treatment plant. The remaining cellulosematerial would be disposed of at the non-hazardous land treatment farm in the refinery (Torpey,pers. comm., 2003).

BP Cherry Point Cogeneration Project Chapter 2: Proposed Action and AlternativesDraft EIS 2-17 September 2003
Equipment Drains and Secondary Containment Areas
Pumps, compressors, turbines, and other equipment generate wastewater in the form of washwater, rainwater runoff, leakage, or periodic flushing operations. Since this wastewater has thepotential to carry traces of free oil, it would be collected separately and pumped to the refinery’soily water sewer for treatment before discharge unless testing confirms it can be discharged intothe stormwater treatment system.
All chemical feed and chemical storage areas would have secondary containment curbs tocapture spills and tank overflows. Containment designs would be established assuming manualcleanup. Spill containment at the chemical truck unloading areas would be provided to containsmall spills only at hose connection points with curbs for manual cleanup. Water from theseareas would be transferred to the refinery’s wastewater treatment system for treatment anddisposal unless testing confirms it can be discharged into the stormwater treatment system.
Sanitary Waste
The cogeneration facility would have lavatories and showers, which would generate sanitarywaste requiring treatment. This waste would average between 1 and 5 gpm and would becollected and pumped to the refinery’s sanitary system for disposal. The refinery’s sanitary wasteis sent to the Birch Bay Water and Sewer District for treatment and disposal.
Cooling Tower Blowdown
Approximately 7-10% of the water used by the cogeneration cooling tower (292,320 gpd baseoperating case) would be drained to control the cooling tower’s water quality. The drained waterwould be pumped to the refinery’s wastewater treatment system for treatment and disposal.
Wastewater Discharge
Refinery wastewater is treated and discharged to the Strait of Georgia under the NationalPollutant Discharge Elimination System (NPDES) permit number WA-002290-0, effectiveNovember 1, 1999 until November 1, 2004 (BP 2002, Appendix D). Wastewater from thecogeneration facility would be sent to the refinery’s wastewater treatment system for treatmentand discharge to the Strait of Georgia along with wastewater from the refinery. The proposedproject would discharge 190 to 260 gallons per minute (approximately 8% of existing refineryflow discharge) assuming 15 cycles of cooling water concentration in the cooling tower (BP2002, Appendix D).
Refinery-treated wastewater is discharged at the mooring area of the refinery’s marine pier,approximately 2,000 feet from the shoreline at an approximate depth of 60 feet below meanlower low water level. The existing discharge diffuser, constructed in 1971 along with therefinery, is supported by pilings that also support the pier. The diffuser is a 20-inch-diameterpipe with 13 4-inch-diameter ports spaced 8 feet apart. The diffuser ranges from 3 to 6 feet abovethe seafloor.

BP Cherry Point Cogeneration Project Chapter 2: Proposed Action and AlternativesDraft EIS 2-18 September 2003
Stormwater Collection, Treatment, and Discharge
Most of the cogeneration facility site would be paved with asphalt or covered with crushed rock,grass, buildings, or enclosures. The finished surfaces would be sloped from a high point near thecenter of the facility toward low points along the edge of the facility’s internal roads. Runoffwould sheet flow across the site toward a collection system consisting of swales and catchbasins. All surface runoff would be captured by the surface drainage system and directed throughan underground piping system to the onsite stormwater treatment and detention system. Thestormwater treatment and detention system consists of an oil-water separation system equippedwith a shutoff valve for containment in case of an accidental release. Stormwater would bedischarged from the oil-water separation system into a final treatment and detention pondproperly sized in accordance with Whatcom County and Washington Department of Ecology(Ecology) requirements. Stormwater would be discharged from the detention pond to theproposed wetland mitigation sites. The detention pond would either be constructed as a linedpond, or a monitoring program would be established to ensure that stormwater composition doesnot adversely affect groundwater quality. See Section 3.3 Water Resources for additionalinformation about the discharge of stormwater to the wetland mitigation sites.
Stormwater from the secondary containment structures for outside tanks and chemical storageareas would be kept separate from other stormwater because of releases that could potentiallyoccur from the tanks. This stormwater would be collected and routed to the cogenerationfacility’s wastewater system and then on to the refinery’s wastewater treatment system fortreatment and disposal along with other cogeneration facility wastewater.
Ammonia Storage System
The cogeneration facility would use ammonia to facilitate required chemical reactions in theSCR emission control system. An ammonia storage and distribution system would be locatedonsite to supply 100% anhydrous ammonia to the SCR catalyst beds. The system would includea 12,000-gallon aboveground storage tank, a delivery truck unloading and containment area, andinterconnecting valves and piping to feed the ammonia flow control unit. The working capacityof the storage tank would be sufficient for storing ammonia for approximately four weeks ofoperation. Safety devices such as pressure/vacuum relief valves, liquid overflow protectiondevices, isolation block valves, alarms, water spray (above storage tank), and associatedinstruments would be incorporated into the detailed design of this storage system. Thecogeneration facility would receive anhydrous ammonia by tanker truck and would use up to870,300 pounds (approximately 168,500 gallons) of ammonia per year. The number of roundtrips for ammonia delivery is estimated to be 23 per year.
Ancillary Systems
The cogeneration facility would include a number of emergency ancillary and support systems,including auxiliary cooling, control and communications, emissions monitoring, electricaldistribution and control, security, and fire protection.

BP Cherry Point Cogeneration Project Chapter 2: Proposed Action and AlternativesDraft EIS 2-19 September 2003
A new approximately 1,500-kilowatt (kW) emergency diesel generator would provide power tomaintain the critical lubrication system if the total power grid ever fails. An approximately 265-horsepower (hp) diesel-driven pump would be provided to ensure adequate water pressure forfire suppression at the cogeneration facility in case of a power failure or low water pressuresituation. The generator and pump would only operate in emergency situations or during periodicequipment tests.
Water Supply System
Water Sources
The Whatcom County PUD and the Birch Bay Water and Sewer District would supply water tothe cogeneration facility. Two streams of freshwater would be required: (1) potable water, and(2) non-potable cooling tower and boiler makeup water.
The Birch Bay Water and Sewer District provides potable water to the refinery. A new waterpipe routed between the refinery and cogeneration facility would supply potable water to thecogeneration facility. Potable water required for drinking, personal washing, and sanitation at thecogeneration facility would average between 1 and 5 gpm. The Applicant anticipates that theroute of the piping between the two facilities and point of entry to the cogeneration facilitywould be adjacent to Access Road 2, however the exact route and refinery tie-in point have notbeen determined.
The Whatcom County PUD provides non-potable industrial water to the refinery. The refineryhas a contract with Whatcom County PUD to purchase industrial water through December 31,2030. Alcoa Intalco Works has a similar contract to purchase industrial water from WhatcomCounty PUD. Whatcom County PUD obtains water from the Nooksack River for both of thesecontracts under a certified water right.
Letters of intent have been entered into by the Applicant, Whatcom County PUD, and AlcoaIntalco Works to allow the cogeneration facility to purchase industrial water that is currentlyallocated to the aluminum smelter. If Alcoa Intalco Works is operational, Whatcom County PUDwould supply industrial water to the cogeneration facility from recycled water used for once-through cooling at the nearby aluminum smelter. If Alcoa Intalco Works is not operational, thecogeneration facility would purchase the industrial water directly from the PUD, which wouldhave otherwise provided it to the aluminum smelter. A maximum amount of approximately2,780 gpm of water from the PUD would be used. The cogeneration facility would require anaverage of 2,244 to 2,316 gpm of industrial water, and when the aluminum smelter isoperational, the remaining 484 to 556 gpm of recycled water would be used by the refinery toprovide for a similar reduction in the amount of freshwater that needs to be withdrawn from theNooksack River.
The Whatcom County PUD currently supplies freshwater to the refinery by an existing 24-inchpipeline, which enters the refinery at the southeast corner of the property. Freshwater or recycledindustrial water would be conveyed to the cogeneration facility through a new 16-inchunderground pipe to be constructed within the refinery. The Applicant anticipates that the route

BP Cherry Point Cogeneration Project Chapter 2: Proposed Action and AlternativesDraft EIS 2-20 September 2003
of the new industrial water supply pipe between the two facilities and point of entry to thecogeneration facility would be adjacent to Access Road 2, however the exact route and refinerytie-in point have not been determined at this time.
Water Treatment
Water for the HRSGs must meet stringent specifications for suspended and dissolved solids. Therecycled industrial water from the Alcoa Intalco Works aluminum smelter or freshwater from theWhatcom County PUD does not meet the specifications required for steam generation. In orderto meet these specifications, the water would be run through two pressure filters at thecogeneration facility. Demineralized water from the polisher would flow to the demineralizedwater tank, which would provide an uninterrupted supply of demineralized makeup water to thesteam cycle and would have eight hours of boiler feedwater storage capacity.
A steam sampling and analysis system would monitor the water quality at various points in thefacility’s steam cycle. The water quality data would be used to guide adjustments in watertreatment processes and to determine the need for other corrective operational or maintenancemeasures.
Access Road 1
The cogeneration facility’s primary access road (Access Road 1) would connect the site toGrandview Road to the north. Access Road 1 would be approximately 300 feet long, 30 feetwide, and surfaced with asphalt (Torpey, pers. comm., 2003d). Access roads would also beconstructed to Brown Road on the south and Blaine Road on the west. Three access roads areproposed to provide flexibility for access in case of an emergency. Access Road 2 is discussed aspart of the refinery interface, and Access Road 3 is discussed as part of other projectcomponents. In addition, a permanent road would be constructed around the site perimeter withbranch roads providing access to specific plant areas such as the CGTs, STG, HRSGs, watertreatment facility, administration building, and cooling tower.
All roadwork within the plant would be constructed to facilitate plant access and maintenance inaccordance with standards of the American Association of State Highway TransportationOfficials (AASHTO). Roadwork outside the plant boundary would be constructed in accordancewith the Washington State Department of Transportation (WSDOT) and emergency vehiclerequirements. Figure 2-1 shows the proposed access roads for the cogeneration facility.
Refinery Interface
Steam and Condensate System
Steam from the cogeneration facility to the refinery and condensate from the refinery to thecogeneration facility would be transmitted through new pipes mounted on an elevated piperackthat would be constructed between the facilities south of the new east-west access road (seeFigure 2-1). The Applicant has not yet determined the exact route and tie-in point for the pipingwithin the refinery.

BP Cherry Point Cogeneration Project Chapter 2: Proposed Action and AlternativesDraft EIS 2-21 September 2003
Natural Gas Fuel System
Natural gas would be used as the fuel source for the CGTs and HRSG duct burners. Although theApplicant has not made a commitment to purchase natural gas from a particular provider, it isanticipated that natural gas would be supplied by the existing Ferndale or Cascade pipelines,which are routed through the refinery in the utility corridor immediately east of Blaine Road.
A new connection and natural gas pipes would be installed within the refinery at the existingmetering station for the Ferndale pipeline to support both cogeneration and refinery operations.From the connection at the metering station, a new underground pipe would be routedapproximately 300 feet west under Blaine Road to the new compressor station to be constructedwithin the refinery. A second pipe providing the compressed natural gas from the compressorstation to the refinery would be routed back under Blaine Road to the refinery tie-in at themetering station. A third pipe providing compressed natural gas from the compressor station tothe cogeneration facility would be routed above ground for approximately 450 feet along the newpiperack. The Applicant has not yet determined the exact size, type, and route of the natural gaspipes (Torpey, pers. comm., 2002).
Natural gas would be delivered to the project at a pressure of approximately 250-300 pounds persquare inch gauge (psig). The CGTs and some refinery operations require a higher fuel pressure,so natural gas compressors would raise the pressure of this gas to approximately 500 psig. Thecompressor station would include a building to enclose three electrically driven compressors,acoustic protection, and gas and fire detection and extinguishing systems. At this time, it has notbeen determined who would construct and operate the compressor station.
Industrial Water Supply
The Whatcom County PUD currently supplies freshwater to the refinery via an existing 24-inchpipeline, which enters the refinery at the southeast corner of the property. Freshwater or recycledindustrial water from Alcoa Intalco Works would be conveyed to the cogeneration facilitythrough a new 16-inch underground pipe to be constructed within the refinery. The Applicantanticipates that the route of the new industrial water supply pipe between the two facilities wouldbe adjacent to Access Road 2, however the exact route and tie-in point within the refinery havenot been determined.
Potable Water Supply
The Birch Bay Water and Sewer District provides potable water to the refinery via an existing 6-inch potable water pipeline that enters the refinery near the contractor’s gate from a utility ROWalong Grandview Road. Potable water to the cogeneration facility would be provided by a newwater pipe routed between the refinery and cogeneration facility. The Applicant anticipates thatthe route of the piping between the two facilities would be adjacent to Access Road 2, howeverthe exact size, route, and tie-in point for piping within the refinery have not been determined atthis time.

BP Cherry Point Cogeneration Project Chapter 2: Proposed Action and AlternativesDraft EIS 2-22 September 2003
Industrial Wastewater Connection and Associated Piping
Cogeneration facility industrial wastewater would be conveyed to the refinery for treatment via anew wastewater pipe. The Applicant anticipates that the route of the piping between the twofacilities would be adjacent to Access Road 2, however the size, route, and tie-in point for pipingwithin the refinery have not been determined at this time.
Sanitary Wastewater Connection and Associated Piping
Cogeneration facility sanitary wastewater would be conveyed to the refinery’s sanitarywastewater system for transmission to the Birch Bay wastewater treatment plant via a newsanitary wastewater pipe. The Applicant anticipates that the route of the piping between the twofacilities would be adjacent to Access Road 2, however the exact size, route, and tie-in pointwithin the refinery have not been determined at this time.
Elevated Piperack
An elevated piperack would be constructed between the cogeneration facility and the refinery tosupport steam, condensate, and natural gas pipes between the two facilities. The piperack wouldmost likely be made of steel with vertical supports spaced at approximately 20-foot intervals andI-beams anchored to pile-supported concrete footings measuring approximately 3 feet by 3 feet.The piperack would be between 3,000 and 3,500 feet long, with height to be determined basedon utility corridor maintenance requirements, locations of existing overhead power lines, andvehicle access requirements. Pile type, length, and configuration would be based on geotechnicalinvestigations not yet conducted by the Applicant.
Intermediate Voltage Substation
An intermediate voltage (either 69 kV or 115 kV) substation for distribution of electrical powerproduced by the cogeneration facility would be constructed within the refinery at a siteapproximately 500 feet west of the cogeneration facility. The substation would be connected tothe 230-kV switchyard in the cogeneration facility and to three existing transformers (MS 1, MS2, and MS 3) elsewhere in the refinery via new overhead or underground lines.
New distribution transformers at Substations MS 1, MS 2, and MS 3 would facilitate thedistribution of power within the refinery. The distribution transformers would be installed andoperated by the refinery.
Stormwater Facilities
The Applicant would construct stormwater facilities in the refinery for the collection, detention,and treatment of stormwater runoff from laydown areas during project construction. Stormwaterfacilities to be constructed in the refinery would include a 0.6-acre stormwater detention pond(detention pond 2) and associated oil-water separation facility, a stormwater system perimeteraccess road, and approximately 1,500 feet of conveyance ditch (Ditch C-4). Upon completion of

BP Cherry Point Cogeneration Project Chapter 2: Proposed Action and AlternativesDraft EIS 2-23 September 2003
construction, the refinery would be responsible for maintenance and operation of thesestormwater components.
Laydown Areas
Figure 2-1 presents the construction laydown areas that would be created within the refinery,which total approximately 28 acres. Laydown Areas 1, 2, and 3 would be located in the northeastcorner of the refinery, immediately west of Blaine Road and immediately south of GrandviewRoad. In addition, the refinery’s existing 3.2-acre contractors’ parking lot in the same area wouldalso be used as a construction laydown area. Laydown areas would be unpaved or surfaced withaggregate.
Once construction is completed, Laydown Areas 1 and 3 would be retained as material and/orequipment storage areas for the refinery. The northern 273 feet of Laydown Area 2 would berestored to native wetland and upland communities.
Access Road 2
Figure 2-1 depicts Access Road 2 to be constructed within the refinery. Access Road 2 would beconstructed between Blaine Road and the western edge of the cogeneration facility. The roadwould be 24 feet wide and approximately 300 feet long, and would provide direct vehicularaccess between the refinery and the cogeneration facility. Access Road 2 would be constructedwith aggregate placed over a compacted, engineered subbase, and would meet WSDOT andemergency vehicle requirements. The access road also would carry a variety of pipe and utilityconnections between the cogeneration facility and the refinery.
Transmission System
The cogeneration facility would be connected to Bonneville’s Custer substation for transmissionof power not used by the refinery. A double-circuit 0.8-mile-long transmission line from thecogeneration facility’s 230-kV switchyard to the Custer/Intalco Transmission Line No. 2 wouldexport power from the cogeneration facility to the Bonneville system. Figures 2-1 and 2-2 showthe existing Bonneville transmission lines and the new electrical transmission system corridor.
Two 230-kV transmission lines would connect the cogeneration facility to the Bonnevilletransmission lines for redundancy. Each line would be capable of safely carrying the exportedpower to the Bonneville system. The cogeneration facility would use two types of towers for theelectrical transmission lines between the facility and the Bonneville connection point. Amonopole steel tower would be used at the 230-kV switchyard within the cogeneration facility.Within the electrical transmission corridor, lattice steel towers would be used. See Figure 1-2 fortypical views of both tower designs.
Ownership of the 230-kV switchyard and new electrical transmission towers and linesconnecting this switchyard to the existing Bonneville transmission lines would be subject to theterms of an interconnection agreement between the Applicant and Bonneville. The Applicantwould retain ownership of the land underlying the switchyard and the transmission system.

BP Cherry Point Cogeneration Project Chapter 2: Proposed Action and AlternativesDraft EIS 2-24 September 2003
Custer/Intalco Transmission Line No. 2
Two existing 230-kV transmission lines connect Bonneville’s Custer substation to Bonneville’sIntalco substation at the Alcoa Intalco Works aluminum smelter. These transmission lines arerouted in separate corridors with lattice steel towers supporting one transmission circuit each.Near the refinery, these corridors both run in a north-south direction (see Figure 2-2).
In February 2001, the Applicant submitted an interconnection request to Bonneville to allow thecogeneration facility to connect to the Bonneville system. In response to that request, Bonnevillecompleted a contingency analysis for the cogeneration project and refinery load along with thepotential Alcoa Intalco Works load on the two existing Bonneville 230-kV transmission lines.The analysis showed that under certain conditions, one or more portions of the Bonnevillesystem could exceed acceptable thermal operating limits with the proposed project. Twomodification options for the Bonneville transmission system have been identified to address thepotential condition.
Option 1 – Remedial Action Scheme
Option 1 would involve a RAS. The RAS would install additional electrical equipment withinthe Custer and Alcoa substations, which would automatically reduce the load at the Alcoafacility if thermal operating limits are exceeded on the Bonneville transmission lines. This optionwould not require any changes to the 230-kV lines or towers, but would require agreementamong the Applicant, Alcoa Intalco Works, and Bonneville. This is the Applicant’s preferredoption.
Option 2a – New Transmission Line with Lattice Towers
Under both Option 2a and Option 2b, a second 230-kV transmission line would be installedinside the existing 125-foot ROW of Custer/Intalco Transmission Line No. 2 from thecogeneration interconnection point to the Custer substation to increase the transmission capacityalong this segment. The existing single-circuit steel lattice towers in this approximately 5-mile-long segment are not strong enough to carry a second circuit so the 24 towers would be replacedwith new double-circuit towers (see Figure 1-2 for typical single-circuit and double-circuit towerdesigns). Appendix C provides annotated aerial photographs that depict the existing towerlocations and selected environmental features within the transmission corridor.
Under Option 2a, the new double-circuit towers would have a lattice steel design. The towerslikely would be replaced one at a time by temporarily supporting the existing wires while eachtower is installed. Some foundation work likely would be required to accommodate the newtowers, which would be approximately 120 feet tall and spaced an average of 1,150 feet apart(Torpey, pers. comm., 2003). Figure 1-2 provides a typical view of a lattice steel tower.
Two basic types of 230-kV steel lattice towers would be used: tangent or light-angle structuresand dead-end structures. Tangent structures are used to elevate wires a safe distance above theground on relatively straight stretches of a line without sharp angles. Dead-end structures elevatethe conductors above the ground and equalize tension of the conductors between two segments

BP Cherry Point Cogeneration Project Chapter 2: Proposed Action and AlternativesDraft EIS 2-25 September 2003
of transmission line when the line makes a turn. Dead-end structures are much stronger, heavier,and more expensive than tangent structures.
Option 2b – New Transmission Line with Monopole Towers
Option 2b is similar to Option 2a except that steel monopole double-circuit transmission towerswould be installed instead of lattice steel towers. The monopole towers would be approximately120 feet tall and spaced an average of 900 feet apart (Torpey, pers. comm., 2003). More towerswould need to constructed under this option because of the closer spacing requirement for themonopole tower design. Figure 1-2 provides a typical view of a monopole tower.
Transmission Line Components
The following section briefly describes typical transmission line components.
Conductors are the wires that carry electrical current in a transmission line.
Insulators are used to suspend the conductors from towers. Insulators are made of non-conductive materials (porcelain or fiberglass) that prevent electric current from passing throughthe towers to the ground. Porcelain insulator strings would be non-reflective to reduce theirvisibility.
Transmission towers elevate conductors to provide safety within the ROW for people andbuildings. The National Electrical Safety Code establishes minimum conductor heights.Minimum conductor-to-ground clearance for a 230-kV line is 22.4 feet depending on the type ofland use under the line. Greater clearance would be provided over highway, railroad, and rivercrossings and some agricultural areas. Lines are generally strung above the minimum height toallow for future sag. As power lines (conductors) carry increasing amounts of power, electricalresistance causes the conductors to get warmer, expand, increase in length, and hang lower to theground.
A fiber-optic cable may be attached to provide a communication link. The 0.5-inch-diameterfiber-optic cable would be hung below the conductors.
Overhead ground wires are two smaller wires attached to and strung between the tops of thetowers to protect the transmission line against lightning damage. The width of each wire istypically 0.5 inch.
Counterpoise is a set of wires buried in the ground surrounding each tower to provide lightningprotection by providing a low resistance path to the earth.
At this time, several aspects of the reconstruction of the Custer/Intalco Transmission Line No. 2remain to be resolved by Bonneville and the Applicant. These include:
• Number, type, and location of transmission towers that would be installed;

BP Cherry Point Cogeneration Project Chapter 2: Proposed Action and AlternativesDraft EIS 2-26 September 2003
• Type, length, and location of transmission line access roads to be constructed or improved;and
• Size and location of any temporary laydown, staging, and assembly areas that may berequired.
Other Project Components
Alcoa Intalco Works Industrial Water Supply Piping and Equipment
To facilitate the cogeneration facility’s use of recycled industrial water when the Alcoa IntalcoWorks aluminum smelter is operating, the Applicant would fund the construction of a recycledwater pipeline and associated equipment within the Alcoa Intalco Works facility, approximately2.5 miles south of the cogeneration facility site. The new facilities would be constructed andoperated by Whatcom County PUD, and would consist of new piping that would connect theAlcoa Intalco Works air compressor building with a new 10-foot by 40-foot sump or wet well,which would be installed on the south side of the Alcoa Intalco Works facility. A 12-foot by 20-foot enclosure containing three 150-hp electric pumps would be constructed and connected to thePUD control system. A new 16-inch pipe approximately 1,600 feet long would connect the wetwell to an existing PUD water transmission line located at Alcoa Intalco Works, which in turnconnects to the BP Cherry Point Refinery.
Compensatory Wetland Mitigation Areas
The Applicant proposes to rehabilitate approximately 110 acres of wetland and wetland buffer tocompensate for losses in wetland function expected from construction of the proposed project.Figure 2-1 depicts the location of the CMAs proposed for the project.
The Applicant would create two wetland mitigation areas on Applicant-owned land immediatelynorth of Grandview Road near the cogeneration facility. CMA 1 would cover approximately 50acres and would be located in the northeast quadrant of the intersection of Grandview Road andBlaine Road, extending to the vicinity of Terrell Creek to the north. CMA 2 would coverapproximately 60 acres and would be located in the northwest quadrant of the same intersection,also extending to the vicinity of Terrell Creek to the north.
The wetland mitigation areas would be rehabilitated by restoring historical drainage patterns byrerouting treated stormwater runoff and plugging existing ditches, removing and suppressingnon-native, invasive plants such as reed canarygrass, and establishing native plant communities.Rerouting stormwater runoff would include installing pipes, culverts, and an inlet channel withdiffuse-flow outlets to direct runoff from the proposed detention pond at the cogeneration facilityto CMA 1 rather than letting all of it go through a roadside ditch directly to Terrell Creek. Allrunoff from the other detention pond would be directed through an existing culvert to a series ofponds, known as the BP duck ponds, connected by natural channels and swales. The reroutedstormwater runoff would be directed to large natural areas that would provide additionalhydrologic storage and water quality treatment.

BP Cherry Point Cogeneration Project Chapter 2: Proposed Action and AlternativesDraft EIS 2-27 September 2003
Laydown Area 4
Figure 2-1 depicts Laydown Area 4, a 4.74-acre temporary construction laydown area in thenortheast corner of the cogeneration facility immediately south of Grandview Road. Thelaydown area would be unpaved or surfaced with aggregate, and would be used to supportproject construction.
Once construction is completed, the western 2.94 acres of the laydown area would be part of thecogeneration facility and would be restored with natural wetland and upland vegetation. Theeastern 1.81 acres of Laydown Area 4 would be outside of the cogeneration facility and would beplanted as upland forest to be maintained by the refinery.
Access Road 3
Figure 2-1 depicts Access Road 3 to be constructed between Brown Road and the southern edgeof the cogeneration facility. Access Road 3 would be constructed by widening and extending theexisting maintenance road previously built to provide access to a future refinery powertransmission corridor. The existing unsurfaced, two-track access road would be widened to 30feet and extended to a length of approximately 1,500 feet to provide access to the facility fromBrown Road. The road would be constructed with aggregate placed over a compacted,engineered subbase, and would meet WSDOT and emergency vehicle requirements.
2.2.3 Construction
The construction of the BP Cherry Point Cogeneration Project would involve:
• The cogeneration facility;• The systems and components that interface with the BP Cherry Point Refinery;• The 230-kV power transmission system;• Modifications to Bonneville’s Custer/Intalco Transmission Line No. 2; and• Other offsite project components.
Cogeneration Facility and Refinery Interface
The existing terrain at the cogeneration facility site is relatively flat. Site grading would useonsite fill to the extent possible to reduce the need for imported fill. Site preparation would becompleted using conventional methods of construction and conventional construction equipment,including bulldozers, front-end loaders, trucks, tractor scrapers, and graders. During sitepreparation, an erosion control and temporary stormwater drainage system would be installed.This system would convey surface water runoff into the storm drainage control system. To theextent possible, excavated material of acceptable quality would be retained on the site indesignated locations using proper erosion protection methods for reuse as backfill. Excessmaterial to be removed from the site would be disposed of at an acceptable location. TheApplicant estimates the amount of imported fill required for site preparation would be 126,000cubic yards. The fill material would be obtained from permitted, local sources (see Section 3.1for additional discussion of the potential sources for required fill material).

BP Cherry Point Cogeneration Project Chapter 2: Proposed Action and AlternativesDraft EIS 2-28 September 2003
Temporary roads, perimeter roads, laydown and parking areas, and other work areas would besurfaced with gravel as required. The Applicant estimates that the total amount of gravelaggregate and sand base material required for site preparation would be 28,200 cubic yards. Theconstruction contractor would determine the source of these materials, but it is expected to befrom local, permitted sources (see Section 3.1 for additional discussion of the potential sourcesfor required aggregate material).
Undeveloped areas to the north and the west of the cogeneration facility have been identified foruse as construction staging areas, known as laydown areas. These areas (Laydown Areas 1through 4) would be graded and left unpaved or surfaced with aggregate during construction asrequired. Approximately 36 acres of land would be used for construction laydown (see Figure 2-1). Construction laydown and parking areas would be adjacent to the site. A security fence wouldbe installed around the perimeter of the site and the perimeter of the laydown areas. Constructionworkers would enter through a security gate on Blaine Road on the Applicant’s property.
Originally, the Applicant identified a Laydown Area 5 that could be used if additional laydownspace was needed (BP 2002, Appendix D). The Laydown Area 5 site, which is approximately 10acres of uplands owned by the Applicant, is 1.5 miles southwest of the cogeneration facility site.The Applicant has subsequently determined that Laydown Area 5 would not be required(Torpey, pers. comm., 2003).
After site preparation and rough grading is completed, the construction contractor would installthe piling and concrete foundations required to support the combustion and steam turbinegenerators, HRSGs, stacks, pipe supports, electrical equipment, and other miscellaneousequipment items, tanks, and support facilities. Although the Application for Site Certificationindicates that pile-supported concrete foundations would be used for all major equipment items,major building columns, and piperack supports, the Applicant now believes that only the STGbuilding would require a pile-supported concrete foundation. Piles may be as long as 100 feet(Torpey, pers. comm., 2003). Pile type, length, and configuration would be based ongeotechnical investigations not yet completed. Construction of these foundations would requirethe use of heavy equipment, including pile-driving equipment, excavation and backfillequipment, concrete-pumping equipment, and concrete-finishing equipment. In addition, lightand medium trucks, air compressors, generators, and other equipment with internal combustionengines would be used. Onsite roads and parking areas would be constructed with asphalt over acompacted and engineered subbase. The perimeter and equipment access roads would beconstructed with aggregate placed over a compacted and engineered subbase. Blasting is notexpected to be required for construction of foundations.
The facility installation work would include underground systems, such as pipes, sewers, ductbanks, and grounding grids. Construction materials such as concrete, structural steel, pipe, wire,cable, fuels, reinforcing steel, small tools, and consumables likely would be delivered to theproject site by trucks using existing roadways. Some of these materials could be delivered byrail. These materials would be segregated and stockpiled in designated laydown areas. Fueling ofconstruction equipment would occur at a designated location with appropriate spill containmentprovisions.

BP Cherry Point Cogeneration Project Chapter 2: Proposed Action and AlternativesDraft EIS 2-29 September 2003
Combustion turbines and other large equipment would be transported to the site by rail(preferably) or barge. This large, heavy equipment would then be transferred by cranes to anoversize truck for delivery to the project site. Rail deliveries would be off-loaded and transportedto the site by a heavy-haul contractor using specialized transports. The existing refinery’s railspurs could be used to unload heavy equipment transported by rail.
After the underground systems and foundations are installed, the excavated areas would bebackfilled, compacted, leveled, and finished with gravel as required for the aboveground portionof the facility. The aboveground portion would include the piperack, CGTs, HRSGs, the STG,cooling tower, 230-kV switchyard, and monopole transmission tower and lines. For each HRSG,the exhaust stack would be assembled in the field and erected last. The underground pipingsystem may have cathodic protection, as determined by the soil resistivity tests and pipingmaterial. Detailed pipe routes, surveys, and plans have not been prepared at this time for thepiping systems that would interface with the refinery. Applicable regulations include U.S.Department of Transportation (DOT) 49 Code of Federal Regulations (CFR) 192, whichspecifies the required depth, fill, and cover for pipelines. In general, pipeline trenches would be 6to 10 feet deep depending on soil conditions and the water table, and considering the engineeringanalysis of expected load conditions. Minimum fill would be 3 to 4 feet over the pipe, but alsowould depend on the evaluation of loads from vehicle traffic that may pass over the pipeline atdesignated points.
Construction of the natural gas supply piping would begin with the survey and staking of thenatural gas pipeline route. Following the survey, work crews would begin excavation of theroute. The natural gas piping would be connected to the existing Ferndale natural gastransmission line located within the refinery after the new piping and associated equipment havebeen constructed and pressure tested. Normal gas pipeline construction includes the followingsteps:
• clearing and grubbing;• topsoil movement/stockpiling;• trenching;• lining the trench with a gravel bed and a water barrier on steep hills;• pipe assembly and welding;• X-ray of welds;• hydrostatic testing;• installing pipe in the trench;• repeat testing (optional);• backfilling;• replacing topsoil; and• seeding and restoring the site.
Once construction is completed, the final grading would be performed. The roads, parking lot,and other designated areas in the power block, maintenance, and warehouse areas would bepaved while the balance of the site would be finished with gravel as required. The switchyard

BP Cherry Point Cogeneration Project Chapter 2: Proposed Action and AlternativesDraft EIS 2-30 September 2003
would be surfaced with gravel. All side slopes and embankments would be protected againsterosion with landscaping or seeded with grasses common to the local area.
Transmission System
The 0.8-mile 230-kV double-circuit transmission line would be installed within a new 150-foottransmission ROW on Applicant-owned land. The corridor is relatively flat and would beaccessible from Brown Road via previously constructed transmission line maintenance roads.Site preparation and the construction of gravel foundation pads would need to be accomplishedfor Tower 1. This work was previously performed under a separate project for Towers 2, 3, and4.
Site Preparation and Clearing
Clearing around the towers would include removal of all brush and debris and possibly gradingto level the working area. An area of approximately 0.25 acre would be cleared or disturbed fortower placement. Cleared or disturbed areas that are not directly covered by transmission towers,facilities, or accessories would be reseeded with naturally occurring shrubs and grasses at the endof the construction period. Vegetation within the transmission line ROW would be low growingto allow safe and uninterrupted operation of the transmission line.
Tower Footings
Transmission towers are attached to the ground by burying a metal footing assembly at each offour structure corners. A trackhoe is used to excavate the soil to allow footing placement. Theexcavation is usually 1 to 2 feet larger than the footing to be installed. Additional footingexcavation could be required in certain soil types. The soil and rock materials removed are laterused to backfill the excavation once the footings are installed. Excess material would bestockpiled and spread along the ROW.
Transmission Towers
Transmission towers would normally be assembled in sections at the structure site and lifted intoplace by a large crane (30- to 100-ton capacity). Occasionally, transmission towers may beassembled at a remote staging area, then lifted, transported, and placed on foundation footings atthe structure site by large sky-crane helicopters. Using helicopters enables towers to beconstructed more quickly and reduces ground disturbance. Helicopter construction could be morecostly than conventional crane construction, but time saved by faster structure assemblysometimes reduces the cost differential. The construction contractor would decide whenhelicopter-assisted assembly is appropriate. The construction contractor would not be selecteduntil the Record of Decision (ROD) is completed for the proposed project.
Conductors, Overhead Ground Wire, Fiber-Optic Cable, and Insulators
Workers would first attach a small steel cable called the “sock line” to the towers. The other endof the sock line would be attached to the conductor. As the sock line is pulled through pulleys on

BP Cherry Point Cogeneration Project Chapter 2: Proposed Action and AlternativesDraft EIS 2-31 September 2003
the towers, it would pull the conductor from large reels mounted on trucks equipped with a brakesystem. This allows the conductor to be unwound and pulled through the towers under tension,usually by a helicopter. The conductors would be attached to the tower using glass, porcelain, orfiberglass insulators. The conductor would be pulled through pulleys that are attached to thebottom of these insulators on each tower.
The overhead ground wires would be attached to the top of the transmission towers. Bonnevillemay also attach a 0.5-inch-diameter fiber-optic cable to the transmission towers to provide acommunication link. The counterpoise would be buried in the ground at each tower.
Staging, Assembly, and Refueling Areas
Construction contractors usually establish staging areas near the transmission line to stockpilematerials for towers, spools of conductor, and other construction materials until they are needed.Steel for towers would be delivered in pieces and would need to be assembled onsite. Optionally,general assembly yards could be used to erect the tower, which could then be moved into placeby truck or helicopter. Because trucks would need to refuel often, these areas would also likelybe used for refueling.
Custer/Intalco Transmission Line No. 2
Option 1 - Remedial Action Scheme
Under Option 1, additional electrical equipment and cabling would be installed within the Custerand Intalco substations, which would automatically reduce the load at Alcoa Intalco Works ifthermal operating limits are exceeded on the Bonneville transmission lines. This option wouldnot require any changes to the existing 230-kV lines or towers for Transmission Line No. 2.
Option 2a - New Transmission Line with Lattice Towers
Under both Option 2a and Option 2b, Bonneville would construct and operate a second 230-kVtransmission line within the existing 125-foot ROW of Custer/Intalco Transmission Line No. 2from the cogeneration interconnection point to the Custer substation (a distance of approximately5 miles). This would require the replacement of 24 existing towers.
Under Option 2a, the new towers would be of the lattice steel design, and the method ofconstruction would be similar to that described previously for the 230-kV transmission system.However, the towers would require relatively little additional ground disturbance for foundationwork and structure placement because the existing tower foundations would most likely be ableto be reused with only minor modifications. Existing towers would be removed from theirfoundations by crane or helicopter, and disassembled either onsite or at a nearby laydown area.The old wire, steel lattice towers, and other structures to be removed may be salvaged or madeavailable for reuse, as appropriate. Other transmission line materials (such as hardware, crossarms, and insulators) would be removed from the ROW and properly disposed of. Duringreplacement of each tower, the existing transmission lines would need to remain in service. The

BP Cherry Point Cogeneration Project Chapter 2: Proposed Action and AlternativesDraft EIS 2-32 September 2003
existing towers and lines would most likely be temporarily supported until the new tower isinstalled and the lines can be attached to the new tower (McKinney, pers. comm., 2003).
To the extent practicable, existing maintenance roads would be used for access during theconstruction effort. It is anticipated that the county roads would be of sufficient quality to allowequipment and personnel movement to the construction site without significant roadimprovement. Any damage to county roads from equipment movement or operation would berepaired to county standards prior to equipment demobilization.
Some improvement to agricultural roads may be required. If necessary, improvements to existingroads would generally be limited to a zone 20 feet wide (for a 16-foot roadbed and adjacentditches). No permanent access road construction would be allowed in cultivated or fallow fields.Any roads in cropland would be removed and the ground may be restored to its original contourwhen the transmission line is completed depending on the landowner’s needs. Dips and culvertswould be installed within the access roadbeds to provide drainage. If the road were temporary,any disturbed ground would be repaired and reseeded with grass or other seed mixtures asappropriate. At the conclusion of construction, access roads would likely be used fortransmission line maintenance. If the ground were disturbed by maintenance activities, theroadbed would be repaired and reseeded if necessary. Fences, gates, cattle guards, and additionalrock would be added to these roads when necessary to maintain access.
Option 2b - New Transmission Line with Monopole Towers
Option 2b would involve the replacement of existing lattice towers with steel monopole towers.The construction process for this option would be similar to Option 2a. Although it is possiblethat some existing tower foundations could be reused with modifications, the closer spacingrequirement for the monopole tower design would require the construction of a greater numberof towers than currently exist, therefore some new foundations would be required.
Tower installation would require vegetation to be cleared in an area sufficient for poleinstallation. Holes would be dug with a backhoe or power auger and a concrete foundation pierwould be poured in place. In some cases, rock drills may be required to excavate a foundationhole to sufficient depth. Where drilling is required, unsuitable construction debris would beremoved and backfilled with suitable material. The poles would be bolted to the foundation piers,steel cross-arm and insulators installed, and the towers prepared for conductor stringing.
Other Project Components
Compensatory Wetland Mitigation Areas
Wetland mitigation construction activities would consist of several key components, as follows:
• Creating a pipe or ditch to carry stormwater discharge from detention pond 1 on thecogeneration facility site to a new culvert under Grandview Road, several hundred feet westof Blaine Road;

BP Cherry Point Cogeneration Project Chapter 2: Proposed Action and AlternativesDraft EIS 2-33 September 2003
• Constructing a level inlet trench extending approximately 1,000 feet in a northerly directionacross the eastern side of CMA 2;
• Filling existing ditches on both CMA 1 and 2;• Eradicating noxious weeds, primarily reed canarygrass and blackberry, using mowing,
discing, and herbicide treatment if necessary; and• Replanting with native vegetation.
A temporary irrigation system may also be installed to support initial establishment of plantedvegetation.
Methods for the construction of industrial water supply modifications at Alcoa Intalco Works,and construction of Laydown Area 4 and Access Road 3 would be similar to the constructionmethods for piping systems, laydown areas, and roads discussed above under refinery interface.
2.2.4 Schedule and Workforce
Construction
Cogeneration Facility, Refinery Interface, and Other Project Components
Construction and commissioning of the cogeneration facility and system that interfaces with therefinery are scheduled to start in February 2004 and would take approximately 25 months.Operation of the facility is scheduled to begin in 2006. The construction schedule assumes anaverage work week of 40 to 48 hours for construction workers. Table 2-3 provides an estimate ofthe workforce anticipated during construction of the facility.
Construction activities would be primarily conducted on single shifts with overtime as necessaryto meet specific schedule milestones. A second shift could be instituted as necessary toaccommodate a particular construction activity or meet a critical milestone. At present, theApplicant plans for the commissioning effort to be supported with a second shift.
Dayshift hours would begin between 6:30 a.m. and 7:30 a.m. and conclude between 5 p.m. and 6p.m. The cogeneration facility would coordinate with the refinery to stagger the workforcestart/stop times to minimize traffic congestion and maximize the efficiency of support resources.Lunch hours would also be staggered to minimize congestion on the roads and supporting areas.If a second shift were needed, the number of workers assigned would be much lower than thenumber of workers in the first shift. The second shift would typically start at 6 p.m. and wouldconclude at 4 a.m. The management of the construction workforce would be coordinated withother concurrent projects within the refinery to minimize congestion and offsite impacts.
Transmission System and Custer/Intalco Transmission Line No. 2
Construction of the transmission system would be performed concurrently with construction ofthe cogeneration facility. The number of construction personnel needed for work on theCuster/Intalco Transmission Line No. 2 would depend on the modification option (RAS ortransmission line reconstruction) selected by Bonneville and the Applicant.

BP
Che
rry
Poi
nt C
ogen
erat
ion
Pro
ject
Cha
pter
2:
Pro
pose
d A
ctio
n an
d A
lter
nati
ves
Dra
ft E
IS2-
34Se
ptem
ber
2003
Tab
le 2
-3:
Exp
ecte
d C
onst
ruct
ion
Wor
k F
orce
(N
umbe
r of
Per
sonn
el) Mon
ths
Cra
ft/T
rade
23
45
67
89
1011
1213
1415
1617
1819
2021
2223
24
Boi
lerm
aker
s9
1928
3851
6976
7979
7660
2213
13C
arpe
nter
s1
112
2234
4763
7585
9183
6252
4129
2827
2724
1911
73
Ele
ctri
cian
s11
2237
5675
9310
812
613
013
213
212
911
697
6421
21
Iron
wor
kers
25
811
3245
5454
4622
179
65
44
31
10
0L
abor
ers
1013
2329
2628
2328
3336
3529
2623
2223
2323
2219
117
3Pi
pefi
tters
117
3150
7510
212
614
216
417
317
717
817
316
714
390
363
21
Pain
ters
/Ins
ulat
ion
Wor
kers
2235
4037
25B
rick
laye
rs/M
ason
s2
35
711
1316
1615
107
31
11
11
11
Mill
wri
ghts
1020
3040
5474
8184
8481
6423
1313
Ope
ratin
g E
ngin
eers
1722
3439
3229
1622
2733
3434
3333
3025
2220
159
43
1T
eam
ster
s6
813
1512
126
810
1213
1414
1414
1413
1210
74
21
Tot
al C
raft
3444
8611
415
521
828
639
149
358
462
662
061
559
155
348
341
037
527
815
472
479
Fiel
d St
aff
1118
2532
3941
4545
4747
4756
5656
5555
5451
4839
3017
14T
otal
Site
Sta
ff45
6211
114
619
425
933
143
654
063
167
367
667
164
760
853
846
442
632
619
310
264
23So
urce
:B
P 20
02N
ote:
Thi
s st
affi
ng r
epre
sent
s th
e co
gene
ratio
n pr
ojec
t onl
y an
d do
es n
ot in
clud
e th
e na
tura
l gas
com
pres
sion
sta
tion.

BP Cherry Point Cogeneration Project Chapter 2: Proposed Action and AlternativesDraft EIS 2-35 September 2003
Operation and Maintenance
Cogeneration Facility, Refinery Interface, and Other Project Components
The Applicant has projected that the cogeneration facility and associated infrastructure couldstart commercial operation in 2006. Operation of the cogeneration facility would requireapproximately 30 full-time employees in shifts 24 hours per day for seven days per week. Thedayshift during weekdays would have the largest number of personnel at the plant withapproximately 15 employees. Other shifts and weekend crew would total an additional fouremployees.
For scheduled maintenance, the number of personnel would increase. This number depends onthe specific scheduled tasks of each maintenance period and would vary between 5 and 10maintenance personnel per shift. The maintenance periods are expected to vary in duration fromtwo weeks per year to 18 weeks per year (once every six years).
The cogeneration facility is designed to allow maintenance to be occur without a completeshutdown of the facility. The anticipated maximum maintenance effort would occur every sixthyear of operation when approximately 3,200 staff hours (about 80 staff weeks) would benecessary for major inspection and overhaul of equipment. During this period, maintenance oneach gas turbine generator would take about six weeks with only one CGT undergoingmaintenance at a time (18 weeks total for all three CGTs). The facility may not be completelyshut down for any of the planned maintenance periods.
Transmission System and Custer/Intalco Transmission Line No. 2
No new workers would be needed to operate and maintain the transmission system orCuster/Intalco Transmission Line No. 2. Bonneville would use its existing inspection andmaintenance staff to check towers, transmission lines, and activities within the ROW.
2.2.5 Costs
Cogeneration Facility, Refinery Interface, and Other Project Components
Total capital costs for the cogeneration facility and associated components are estimated to be$574 million. A summary of the costs by major component is provided in Table 2-4. TheApplicant estimates that the annual operation and maintenance costs for the cogeneration facility,excluding the cost of natural gas, would be $18.2 million.
Transmission System and Custer/Intalco Transmission Line No. 2
The Applicant estimates that capital costs for the transmission system would be $6 million.
The capital costs for work associated with Custer/Intalco Transmission Line No. 2 would dependon the modification option selected. Preliminary cost estimates prepared by Bonneville indicatethat Option 2 (reconstruction of the transmission line) would be $10.4 million (Bonneville 2002).
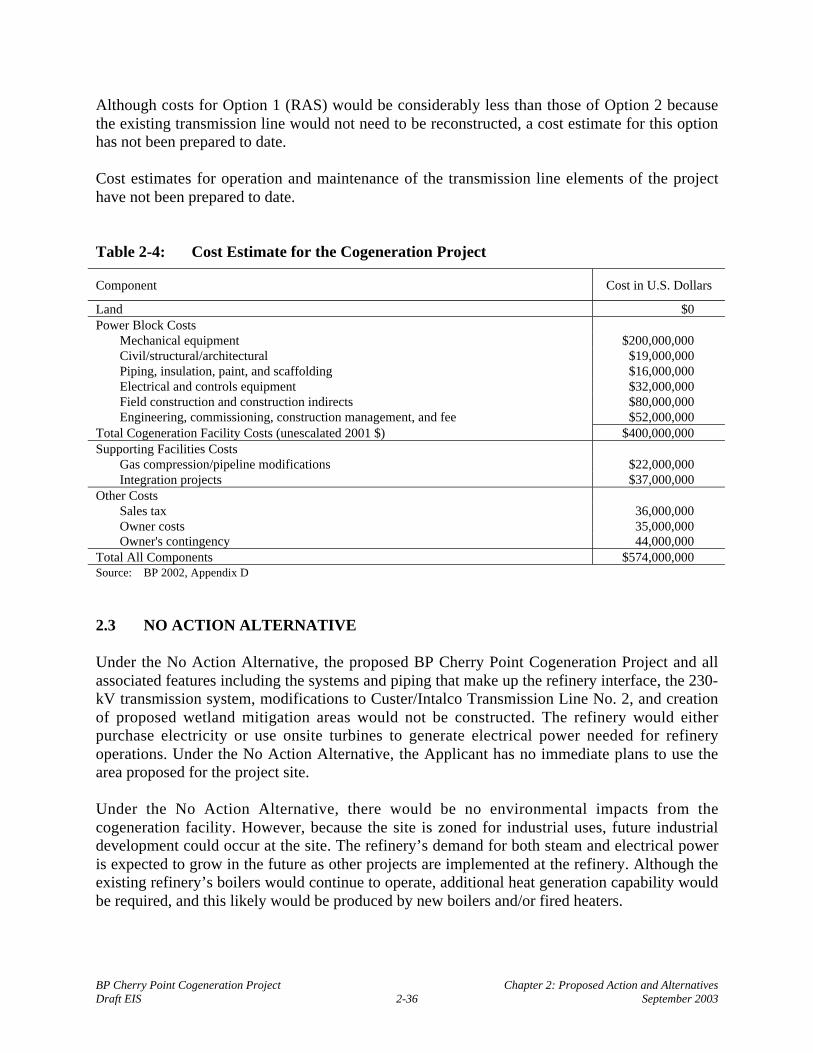
BP Cherry Point Cogeneration Project Chapter 2: Proposed Action and AlternativesDraft EIS 2-36 September 2003
Although costs for Option 1 (RAS) would be considerably less than those of Option 2 becausethe existing transmission line would not need to be reconstructed, a cost estimate for this optionhas not been prepared to date.
Cost estimates for operation and maintenance of the transmission line elements of the projecthave not been prepared to date.
Table 2-4: Cost Estimate for the Cogeneration Project
Component Cost in U.S. Dollars
Land $0Power Block Costs
Mechanical equipment $200,000,000Civil/structural/architectural $19,000,000Piping, insulation, paint, and scaffolding $16,000,000Electrical and controls equipment $32,000,000Field construction and construction indirects $80,000,000Engineering, commissioning, construction management, and fee $52,000,000
Total Cogeneration Facility Costs (unescalated 2001 $) $400,000,000Supporting Facilities Costs
Gas compression/pipeline modifications $22,000,000Integration projects $37,000,000
Other CostsSales tax 36,000,000Owner costs 35,000,000Owner's contingency 44,000,000
Total All Components $574,000,000Source: BP 2002, Appendix D
2.3 NO ACTION ALTERNATIVE
Under the No Action Alternative, the proposed BP Cherry Point Cogeneration Project and allassociated features including the systems and piping that make up the refinery interface, the 230-kV transmission system, modifications to Custer/Intalco Transmission Line No. 2, and creationof proposed wetland mitigation areas would not be constructed. The refinery would eitherpurchase electricity or use onsite turbines to generate electrical power needed for refineryoperations. Under the No Action Alternative, the Applicant has no immediate plans to use thearea proposed for the project site.
Under the No Action Alternative, there would be no environmental impacts from thecogeneration facility. However, because the site is zoned for industrial uses, future industrialdevelopment could occur at the site. The refinery’s demand for both steam and electrical poweris expected to grow in the future as other projects are implemented at the refinery. Although theexisting refinery’s boilers would continue to operate, additional heat generation capability wouldbe required, and this likely would be produced by new boilers and/or fired heaters.

BP Cherry Point Cogeneration Project Chapter 2: Proposed Action and AlternativesDraft EIS 2-37 September 2003
The No Action Alternative does not remove the long-term need for power production; itpotentially transfers the impacts to another site and potentially another technology. There wouldbe no increase in the power supply reliability for the BP Cherry Point Refinery and nocontribution to new electrical generation required to meet projected long-term increasing powerdemand in the Pacific Northwest and adjoining regions.
2.4 ALTERNATIVES CONSIDERED BUT REJECTED
2.4.1 Alternative Cogeneration Facility Locations
Onsite Locations
In addition to the proposed cogeneration facility site (Site 3), four other potential sites on theApplicant’s property were evaluated for the facility location. They are as follows (see Figure 2-4):
Site 1 East of Blaine Road and north of Brown Road adjacent to an existing cooling tower.Site 2 Within the Cherry Point Refinery boundary fence near refinery components.Site 4 Immediately north of Grandview Road and northwest of Site 3. This area was evaluated
because it contains a moderately sized upland area adjacent to Grandview Road.Site 5 Within the refinery boundary fence just south of Grandview Road and west of Blaine
Road. This site currently has a contractors’ parking lot and open areas.
Each of the sites was rated on the basis of six criteria as documented in the Applicant’sApplication for Site Certification (BP 2002). The criteria included:
• Sufficient area,• Proximity to the refinery,• Avoidance of wetlands,• Proximity to infrastructure,• Avoidance of other environmental impacts, and• Security.
These criteria are discussed in more detail below.
Rating Criteria
Sufficient Area
A site of approximately 33 acres is needed to provide for all plant components including aswitchyard and other ancillary features. This area allows for some buffer around the perimeter ofthe plant. The actual footprint of the project could vary somewhat depending on final design ofthe project. In addition to the plant area, additional space of 36 acres is also needed forconstruction laydown, fabrication yards, and access roads. These areas temporarily would beused by the project for approximately two years during the construction period and would be leftin place for use by the refinery thereafter.

BP Cherry Point Cogeneration Project Chapter 2: Proposed Action and AlternativesDraft EIS 2-38 September 2003
Figure 2-4: Alternative Cogeneration Site Locations

BP Cherry Point Cogeneration Project Chapter 2: Proposed Action and AlternativesDraft EIS 2-39 September 2003
Proximity to the Refinery
The proposed cogeneration facility has to be located within a reasonable distance from therefinery to provide steam through relatively short pipelines that are properly insulated for steamtransport. Increasing the distance of the power plant from the refinery would decrease theefficiency of the project or make it impractical. Additionally, increased pipeline length wouldresult in increased disturbance to land and wetland areas. The project site has to take into accountthe delivery point of the steam at the refinery since refinery operations or other obstacles mayprevent a reasonable connection.
Avoidance of Wetlands
Siting of the cogeneration facility took into account the presence of wetlands; the potential areaof wetlands that would be affected; and in some cases the function and value of the wetlands.Alternative project configurations were also evaluated to reduce overall impacts. In addition,proposed future refinery construction requirements were assessed to determine if there werepotential actions that would result in additional wetland impacts.
Proximity to Infrastructure
The operation of a gas-fired cogeneration plant depends on several elements of supportinginfrastructure, including a natural gas pipeline, a source of water, road access, and a transmissionline. Reducing the construction of new infrastructure lowers cost and reduces the impact on theenvironment. The refinery has the above-mentioned infrastructure already in place, and theproposed site allows use of this existing infrastructure with minimum modifications. Alternativesites would require an extension of this infrastructure to service the cogeneration facility.
A transmission line corridor has received Section 404(b) permit approvals in a previous action,including mitigation for wetland impacts. To minimize additional wetland and otherenvironmental impacts, all of the sites were evaluated in relationship to this permittedtransmission line corridor.
Avoidance of Other Environmental Impacts
Impacts on other environmental values were also considered in the analysis of alternative sites,including loss of wooded areas, upland habitat impacts, proximity to water bodies, and visualimpacts.
Security
The refinery is located in a rural area and is surrounded by wooded areas and open fields that arebisected by paved roads. The Applicant owns much of the land immediately surrounding therefinery, except on the west where the property boundary is along Jackson Road. A chain-linkfence topped by barbed wire surrounds the refinery, which is bounded by Grandview Road onthe north, Jackson Road on the west, Blaine Road on the east, and Aldergrove Road on the south.An internal security road runs inside the fence line. A secondary chain-link fenced area encloses

BP Cherry Point Cogeneration Project Chapter 2: Proposed Action and AlternativesDraft EIS 2-40 September 2003
other ancillary facilities east of Blaine Road and bounded by Grandview Road and KickervilleRoad. Security guards patrol all roads and fence lines and all other Applicant properties.
Alternative Ratings
For each criterion, a rating of high, medium, or low was assigned, where high indicated thealternative best met the criterion, and low indicated that the alternative marginally met or did notmeet the criterion.
Table 2-5 summarizes the ratings for the five alternative sites that were evaluated. Appendix Acontains the siting and wetland 404(b) alternatives analysis.
Table 2-5: Summary of Ratings of Alternative Cogeneration Facility Sites
Alternative LocationCriterion Site 1 Site 2 Site 3 (Proposed) Site 4 Site 5
Sufficient area High Low High High MediumProximity to refinery Medium High Medium Low HighAvoidance of wetlands Low High Medium Medium MediumProximity to infrastructure High High High Low HighAvoidance of other environmental impacts High High High Low MediumSecurity High High High Low HighSource: BP 2002, Section 2
Site 1
Site 1 was the first site investigated for the cogeneration project. The site was delineated forwetlands and it was determined that the site is approximately 80% wetlands (30 acres). Althoughthis site rated high in most criteria, the Applicant did not select this site because of greaterimpacts on wetlands compared to the proposed site.
Site 2
Site 2 would provide only 16 acres of space for facility construction; therefore, the Applicant didnot select the site because it did not meet the criterion for size.
Site 4
Site 4 was evaluated because it contains moderately sized upland area adjacent to GrandviewRoad. The site is located approximately 0.5-mile east of the refinery on the north side ofGrandview Road. This site would require significantly longer segments of piping to deliversteam to the refinery and would also require a 0.5-mile new transmission line to the refinery. Thesteam pipeline to the refinery would be difficult to construct because existing gas and waterpipelines and electrical transmission lines are south of Grandview Road. The Applicant did not

BP Cherry Point Cogeneration Project Chapter 2: Proposed Action and AlternativesDraft EIS 2-41 September 2003
select Site 4 because of the distance from the refinery that would result in new utility corridors tothe refinery. In addition, the new utility corridors would be less secure than other proposed sites.
Site 5
Site 5 is located within the refinery's boundary fence just south of Grandview Road and west ofBlaine Road. This area is used for construction laydown and contractor parking duringmaintenance programs at the refinery. Portions of Site 5 were delineated for wetlands, and areconnaissance of the remaining area indicates that the overall site is approximately 80%wetlands (23.5 acres). If Site 5 were chosen for the cogeneration facility site, Site 3 would berequired for equipment laydown areas and the wetland areas east of Blaine Road would beaffected. Site 5 would also affect Wetland I, which would not be affected by using Site 3 for theproject. In addition, the Clean Fuels Project will be constructed by the refinery in the space thatis currently used as a maintenance laydown area, which means that the refinery will needadditional maintenance laydown space in the future. The Applicant did not select Site 5 as thepreferred site because it would have greater wetland impacts than the proposed site and it wouldmake future refinery activities more difficult.
In addition to the sites described above, reconnaissance surveys were conducted to evaluate twoother general areas located on Applicant-owned property. These additional areas are describedbelow (see Figure 2-4).
1. An area approximately 200 acres south of Brown Road was evaluated for the presence ofwetlands. The site is approximately 90% wetlands, including herbaceous wetlands and high-quality forested wetlands, which comprise approximately 70% of the area. Additionally,several small ponded areas appear to be ephemeral, but hold water for extended periods oftime. Old-growth trees were found on this site and large mammal and raptor species(including red-tailed hawk) and wading species (including great blue heron) were observed.This area rated low in all categories and was eliminated from further consideration.
2. An area east of the proposed cogeneration facility site also was evaluated. It was found tocontain forested wetlands that are of high quality in terms of their functions such as sedimentdetention and general habitat suitability. This area was eliminated from consideration basedon the high quality of the habitat and the associated cost of mitigating impacts to such anarea.
Offsite Locations
Locations outside Applicant-owned property were not evaluated because the primary purpose ofthe cogeneration project is to supply electricity and steam to the refinery. The Applicant owns anextensive amount of property that surrounds the refinery site. These surrounding areas are theonly feasible locations to ensure a reliable and efficient source of power and steam for therefinery. Offsite locations would require more pipeline interconnections, potentially affectingmore priority habitat, and would significantly reduce the efficiency of steam transmission to therefinery. Securing an offsite location also would likely be more costly as an existing emergencyresponse and security system is already in place at the refinery.

BP Cherry Point Cogeneration Project Chapter 2: Proposed Action and AlternativesDraft EIS 2-42 September 2003
2.4.2 Alternative Power Generation Technologies
The Applicant’s evaluation of alternative power generation technologies was limited totechnologies that could produce both steam and electricity.
Stand-Alone Combined Cycle
This technology integrates natural-gas-burning combustion turbines and steam turbines toachieve higher efficiencies. The combustion turbine’s hot exhaust is passed through an HRSG tocreate steam used to drive a steam turbine generator. This technology is able to achieve thermalefficiencies up to approximately 53%, considerably higher than most other alternatives. The useof clean natural gas and the high equipment efficiency also result in relatively low air emissionsper kilowatt-hour generated. The capital investment for the combined-cycle plant is significantlyless than either a boiler-turbine or fluidized bed combustion plant.
Because of its high efficiency and superior environmental performance, combined-cycletechnology is an integral part of the proposed cogeneration project. However, the stand-alonecombined-cycle facility is less efficient than a cogeneration facility and would not produce steamfor use at the refinery. Because this alternative technology does not meet the project’s purposeand need, the Applicant eliminated it from consideration for the proposed project.
Conventional Boiler and Steam Turbine
This technology burns fossil fuel (gas, oil, coal, etc.) in a conventional boiler to generate steamto drive a STG. Steam can be extracted directly from the STG or provided from the main steampipe. The remaining STG exhaust steam is then condensed and returned to the boiler. Makeupwater is added to the steam cycle to replace process steam not returned as condensate. This is anestablished technology that is able to achieve approximately 30-40% thermal efficiency whenusing natural gas. Because of the relatively low thermal efficiency, high emissions, and highcapital and operating costs, the Applicant eliminated the conventional boiler and steam turbinetechnology from consideration for the proposed project.
Fluidized Bed Combustion and Steam Turbine
Fluidized bed combustion is an alternative to the conventional boiler for generating steam,especially while burning high-sulfur-bearing, difficult-to-burn fuels such as petroleum coke, abyproduct of the petroleum refining industry.
A fluidant such as limestone is added to the fluidized bed to capture in-situ sulfur oxidesproduced during the combustion process. The amount of limestone used is significant, about one-third of a ton of limestone for every ton of coke burned. The systems required to import,transport, crush, and size this quantity of limestone can have significant environmental impacts.
The hot combustion flue gas is cooled by rising steam, which drives a steam turbine. Thermalefficiencies are comparable to the conventional boiler technology (approximately 36% in full

BP Cherry Point Cogeneration Project Chapter 2: Proposed Action and AlternativesDraft EIS 2-43 September 2003
condensing mode). A large quantity of calcium sulfate is generated as a byproduct. This materialcan be used to manufacture gypsum board or used as road fill material. If local markets do notexist for these products, potential environmental impacts from waste disposal and additionalcosts are high. Because of the environmental concerns with solid waste disposal, higheremissions, and the low thermal efficiency, the Applicant eliminated the fluidized bed combustiontechnology from consideration.
Other Alternative Technologies and Fuels
The Applicant eliminated technologies based on fuels other than natural gas because they wouldnot allow the project to achieve the environmental and operational advantages of natural gas.Additional factors that render alternative fuel technologies unsuitable for the proposed projectare as follows:
• No geothermal or hydroelectric resources exist in the area.• Biomass fuels such as wood waste are not locally available in sufficient quantities to make
them a practical alternative fuel.• Solar and wind technologies are generally not continuous and not capable of producing the
large quantities of steam needed to supply the refinery.• Coal and heavy fuel oil technologies emit more air pollutants than technologies that use
natural gas.
The Applicant selected natural gas technology based on the availability of natural gas and theenvironmental and operational advantages for the proposed cogeneration project.
2.4.3 Alternative Cooling Systems
The Applicant evaluated three alternative cooling technologies for rejecting heat from the steamturbine’s surface condenser. These include:
• Dry cooling system: air cooled condenser;• Wet/dry cooling: wet/dry evaporative tower; and• Wet/dry cooling: hybrid system.
Dry Cooling System: Air Cooled Condenser
Air-cooled condensing (ACC) systems are significantly more expensive and less thermallyefficient than comparable water evaporative cooling systems. They also require more land areathan evaporative cooling systems and have a larger visual impact. The main benefit of the ACCsystem is to provide cooling with less freshwater consumption. Since ACC cooling is donewithout evaporation, is does not have water vapor plumes.
The Applicant initially selected a dry cooling system using an ACC for the proposed project tominimize water use, but was subsequently able to reach an agreement with the Whatcom CountyPUD and Alcoa Intalco Works allowing purchase of cooling water from the Alcoa IntalcoWorks. When the aluminum smelter is in operation, more water would be recycled on an annual

BP Cherry Point Cogeneration Project Chapter 2: Proposed Action and AlternativesDraft EIS 2-44 September 2003
average basis than the cogeneration project would consume, resulting in a net decrease in theamount of water needed to be withdrawn from the Nooksack River. When the aluminum smelteris not in operation, the Whatcom County PUD would provide the freshwater to the cogenerationproject that would have been allocated to Alcoa.
Wet/Dry Cooling System: Evaporative Wet/Dry Cooling Tower
The wet/dry cooling tower uses a conventional design but adds a tube bundle inside the towerabove the fill that breaks the water column into a spray. Warm water from the cogenerationfacility flows through this bundle and is cooled by air drawn through the tower by the coolingtower fan. The cooled water is then sprayed on the tower fill to achieve additional coolingthrough evaporation. Since the tube bundle does part of the cooling in the wet/dry design, lesswater is lost through evaporation than with a conventional wet cooling tower.
The ratio of dry cooling surface to wet fill can be designed for conditions ranging from a smallamount of water conservation to a tower that requires the wet section only for the hottest days ofsummer, using 100% dry cooling most of the year. The wet/dry evaporative cooling tower can bedesigned to allow independent operation of the wet and dry section fans or designed to usecommon fans. The wet/dry cooling tower option uses less water than a conventional wet coolingtower, but is more expensive to construct and operate. The Applicant rejected this systembecause of the high capital costs.
Wet/Dry Cooling: Hybrid Cooling System
Another option is to use both an ACC and a cooling tower to cool water from the cogenerationunit condenser. The cooling tower is controlled to reduce water consumption and only drycooling is used during cold months. The benefit of a hybrid cooling system is that the ACC andthe evaporative cooling tower can be closer to standard manufacturer’s designs, which are lesscostly than a custom wet/dry evaporative cooling tower design. The negative side of a hybridcooling system is that the engineering design effort is increased since the number and interactionof components that must be designed for the two autonomous systems are greater. The land areafor the evaporative cooling tower and ACC is greater than that of an ACC alone, since they bothmust have substantial open area around their perimeter to prevent interference with the air inletpath. The hybrid option also uses less water than a conventional wet cooling tower. For thesereasons, the Applicant eliminated the evaporative cooling tower and ACC hybrid cooling systemfrom further consideration.
2.4.4 Alternative Air Emission Controls
SCONOX
SCONOX, a brand name for a specific air emission control technology, uses a catalyst bed akinto that used in a selective catalytic reduction. SCONOX catalyst does not require ammonia tohelp convert nitrogen oxides to nitrogen dioxide. However, the SCONOX catalyst does getsaturated during operation and requires periodic regeneration with a diluted hydrogen gas stream.A system of slide valves takes alternate beds of SCONOX catalyst in and out of service as

BP Cherry Point Cogeneration Project Chapter 2: Proposed Action and AlternativesDraft EIS 2-45 September 2003
required for regeneration while the gas turbines are operating. The Applicant reviewedSCONOX technology with the vendor and requested a quote for the system. The SCONOXsystem’s cost was much higher than the cost of the selective catalytic reduction system; it wasrejected by the Applicant because of the high capital cost and operating and mechanicalcomplexity of the system and because it has not been proven feasible on a facility of this size.
XONON
XONON, a brand name for a specific air emission control technology, uses a catalyst in the gasturbine combustion chambers to burn natural gas rather than using a flame. The catalyticcombustion takes place at a lower temperature and thus produces lower amounts of nitrogenoxides and carbon monoxide. Enron invested in Catalytica, the creators of XONON catalyst, andagreed to test the catalyst at its Pastoria Energy Facility in southern California. This facility wassubsequently sold to Calpine and the current status of XONOX technology testing is uncertain.Until proven commercially, XONON is considered to be experimental, and has been rejected bythe Applicant.
2.4.5 Alternative Wastewater Disposal Methods
The cogeneration facility’s wastewater stream includes process wastewater, sanitary wastewater,equipment drainage, and runoff from curbed areas that could have come into contact with oilfrom equipment. The preferred method for disposal of process and potential oil-bearingwastewater is to send it to the refinery’s wastewater treatment system. Secondary containmentwater is isolated until verified acceptable for discharge to the stormwater system through testing.The existing refinery system has the capacity to handle the small wastewater stream from theproposed project. Construction of new wastewater treatment facilities for the cogenerationfacility would be expensive and would not provide any additional environmental benefit;therefore, the Applicant rejected this alternative disposal method.
A zero liquid discharge facility was evaluated by the Applicant as part of an evaporative coolingsystem. Such a facility would combine the refinery’s and cogeneration facility’s wastewater andwould use evaporation to separate solids from the water. The water vapor would be condensedand recycled back to the industrial water system for reuse. This system would have the advantageof conserving freshwater since the water is recycled for use within the facility. However, theseparation process would generate a large volume of cogeneration facility solids per day. Thesolid waste, while not hazardous, would be soluble and would have to be disposed in a suitablelandfill. This would be a large volume of material requiring offsite disposal on a daily basis,thereby significantly increasing truck traffic. (Trucks would have to be used to haul solids to alandfill since most landfills are not accessible by rail.) Equipment for a zero liquid dischargeplant also is costly. The Applicant eliminated the zero liquid discharge option from considerationbecause of solid waste disposal requirements, operating complexity, and higher cost.
2.4.6 Alternative Modification of Custer/Intalco Transmission Line No. 2
Replacing Bonneville’s 230-kV transmission lines with higher capacity lines was evaluated todetermine whether this option would provide a technically feasible means of upgrading the

BP Cherry Point Cogeneration Project Chapter 2: Proposed Action and AlternativesDraft EIS 2-46 September 2003
Bonneville lines without requiring replacement or extensive modification of the existingBonneville transmission towers. This option would involve replacing the existing Bonnevilletransmission lines between the Custer substation and the cogeneration/Bonnevilleinterconnection point with a wire type that provides the required capacity to address theconditions identified in Bonneville’s contingency analysis, but that has the same weight as theexisting wire. Although, several wires were evaluated for possible use, a suitable wire type hasnot been identified.
2.4.7 “Refinery Load Only” Alternative
The Applicant examined a number of alternative facility configurations for the cogenerationproject, including a facility that would generate only enough electricity to meet the operatingneeds of the refinery (approximately 85 MW) and would therefore not require interconnectionwith Bonneville's power transmission facilities.
Potential facility configurations were evaluated against a set of performance requirements thatthe Applicant established for the project. These considerations included:
• Steam supply reliability to the refinery;• Flexibility to accommodate larger future steam demands; and• Economy of scale to provide suitable capital risk.
The Applicant determined that an 85-MW facility would not provide suitable steam reliability,lacked the ability to accommodate increases in future steam demand, and had a higher capitalrisk profile than the proposed configuration. The “Refinery Load Only” Alternative wastherefore eliminated from further consideration.
2.5 BENEFITS OR DISADVANTAGES OF RESERVING PROJECT APPROVALFOR A LATER DATE
Reserving or delaying approval of the proposed project would not provide the BP Cherry PointRefinery with the needed reliable, efficient, and cost-effective heat and power. Specifically, theBP Cherry Point Refinery would not benefit from reliable and affordable electric power andprocess steam, and would continue to use three more than 30-year-old boilers that contribute toair pollutants emitted from the refinery. With the new cogeneration facility, these three boilerscould be taken out of operation, thereby reducing the total air emissions from the refinery. Inaddition, reserving or delaying approval of the proposed project would not provide the associatedtax revenue and employment benefits to the local community. Also, the refinery would have tocontinue to purchase power at fluctuating market prices.
If the proposed project were delayed, the projected 635 MW of excess power would not beavailable in the short term for distribution by the Applicant over Bonneville transmission lines.However, such a delay would also avoid or delay potential thermal operating limit problems onthe Bonneville transmission system in the project vicinity, as well as the need to modify theexisting Custer/Intalco Transmission Line No. 2. Project delays would not increase power in thePacific Northwest served by the Bonneville regional electrical transmission network in the short

BP Cherry Point Cogeneration Project Chapter 2: Proposed Action and AlternativesDraft EIS 2-47 September 2003
term. However, because of several recent developments such as reduced electricity use by thealuminum industry and other electricity-intensive industries in the region, it is uncertain if thereis a need for additional power in the region in the short term.
If project approval were reserved, direct, secondary, and cumulative impacts would be delayedand the refinery would continue to operate as it does today. The resources needed to constructand operate the proposed project are available at this time. Delaying approval decisions wouldcreate uncertainty for the funding of project and could delay operation beyond the requestedtransmission contract start date with Bonneville.
If this project were deferred for a lengthy period of time, it is uncertain whether this projectwould be available in time to meet regional long-term energy needs. If not, another generatingfacility would be required to meet these needs. That alternative project would likely not have thepotential to offset emission reductions by removing older utility boilers at the refinery.
2.6 APPLICABLE FEDERAL, STATE, AND LOCAL PERMITS
If the proposed project is approved, EFSEC would specify the conditions of construction andoperation, issue a Site Certification Agreement in lieu of any individual state or local permittingauthority, and manage the environmental and safety oversight program of project operations.EFSEC is the sole non-federal agency authorized to permit the proposed project. The Applicantwould enter contractual agreements with Bonneville to connect to Bonneville’s electricaltransmission system and the U.S. Army Corps of Engineers for an individual Clean Water ActSection 404 Permit. For informational purposes, Table 2-6 lists the major state and localpermitting requirements preempted by EFSEC, as well as federal requirements.
2.7 COORDINATION AND CONSULTATION WITH AGENCIES, INDIAN TRIBES,THE PUBLIC, AND NON-GOVERNMENTAL ORGANIZATIONS
The Applicant has been communicating and meeting with agencies, Indian tribes, the public, andnon-governmental organizations throughout the development process of the proposed project.Formal meetings and presentations held by the Applicant with these entities are listed in Table 2-7. The meetings and presentations were to inform stakeholders of the proposed project and tosolicit comments.
Consultations with the public, agencies, Indian tribes, and interested parties will continuethrough the EIS process.

BP Cherry Point Cogeneration Project Chapter 3: Existing Conditions, Impacts, and MitigationDraft EIS 3-1 September 2003
CHAPTER 3: EXISTING CONDITIONS, IMPACTS, AND MITIGATION MEASURES
This chapter presents a discussion of all elements of the proposed project (as described in theprevious chapter) as they affect, or are affected by, each element of the environment. For mostelements of the environment (e.g., earth, wetlands, surface water, etc.) site-specific descriptionsof the affected environment corresponding to the five major project elements are presented. Forsome elements (e.g., air quality, groundwater), the geographic separation of major projectelements is of little value to the analysis because of the landscape scale of existing conditionsand potential impacts. For traffic and transportation, virtually all vehicles would arrive anddepart from a single point during construction, and similarly during operation (although at aslightly different point). For cultural resources, the mitigation measure for discovering resourcesduring construction is the same regardless of where in the overall project site they might befound.
To ease the readers’ review, efforts have been made to reduce redundancy in presentation of theanalysis. Affected Environment, Impacts, and Mitigation Measures have been specificallydistinguished into major project elements only where it assists in understanding the effects of theproject. Where the effects are the same for two or more major project elements, an effort hasbeen made to consolidate the analysis. If a specific project element is not mentioned, it isbecause it has been determined that no effect, adverse or beneficial, would occur.

BP Cherry Point Cogeneration Project 3.1 EarthDraft EIS 3.1-1 September 2003
3.1 EARTH
3.1.1 Existing Conditions
Location and Physiography
The project site, which includes the footprint of the cogeneration facility, the refinery interface,the transmission system, Custer/Intalco Transmission Line No. 2, and other project components,is located in western Whatcom County, Washington. The Strait of Georgia is located west of thesite and borders the western edge of Whatcom County. The site is located at the extremenorthern end of the Puget Lowland physiographic province near where the lowland meets thesouthern end of the Georgia Lowland in British Columbia. Both lowlands occupy a north-southtrending structural trough bordered by the Cascade and Coast Range mountains on the east andby the Olympic Mountains and Vancouver Island on the west. The Strait of Juan de Fucaseparates the Olympic Mountains and Vancouver Island and connects the Strait of Georgia withthe Pacific Ocean.
The project site is located on a glaciated upland. The Mountain View upland is bordered by theStrait of Georgia to the west; the Lummi Peninsula, Chuckanut Mountain, and LookoutMountain to the south; and the Cascade Mountain foothills to the east. The upland extendsnorthward into Canada where it terminates at the Coast Range Mountains at Vancouver. Theupland is relatively flat with gently rolling hills bisected by small stream valleys tributary tomajor rivers or to the Strait of Georgia. Major rivers include the Nooksack, which dischargesinto the Strait of Georgia about 15 miles south of the site, and the Fraser, which empties into theStrait of Georgia at Vancouver about 25 miles to the north. Geologic, soils, topographic, andseismic conditions are fairly uniform over the project site.
Generalized Geologic History
It is widely held that approximately 200 million years ago, the breakup of the supercontinent,Pangaea, opened the Atlantic Ocean along a mid-ocean ridge and resulted in the westwardmovement of the North American continent and the subsidence of the oceanic crust beneath thewestern margin of the North American plate. Much of the north Cascade Range and VancouverIsland are composed of exotic terranes created during this time when subcontinents wereaccreted to the western margin of North America.
Approximately 57 million years ago at the beginning of the Eocene, vast alluvial floodplainscovered the region with a lowland semitropical rain forest. This resulted in the deposition of theChuckanut formation within a faulted, down-dropped basin. Subsequent displacement along theStraight Creek fault (approximately 60 miles to the west), uplift of the lowland basins, andchanges in regional tectonics led to folding and thrusting of the Chuckanut formation. Thesandstones, conglomerates, shales, and coal deposits of the Chuckanut formation are exposed inthe Chuckanut Mountains along the southern margin of the Whatcom Basin immediately southof Bellingham (Easterbrook 1976).

BP Cherry Point Cogeneration Project 3.1 EarthDraft EIS 3.1-2 September 2003
The Puget Lowland has been glaciated numerous times during the Pleistocene epoch, with thelast glacial advance occurring about 11,000 years ago; the Olympia interglaciation and the Fraserglaciation represent the two most important geologic units that occurred. The Fraser glaciationrepresents the most important in terms of the surficial deposits in the area of the proposedcogeneration project site. Successive advance and retreat of glaciers led to glaciomarine, marine,and related deposits in the coastal lowlands of southwestern British Columbia and northwesternWashington (Armstrong et al. 1965), followed by marine waters entering the area.
Topography
Topography of the proposed project is depicted in Figures 3.1-1 and 3.1-2. The proposedcogeneration facility is situated at an elevation of approximately 120 feet above mean sea level(MSL). The adjoining refinery is at an elevation of approximately 100 feet above MSL. Asshown in the figures, there is a gentle downward slope (0.5% to 1%) toward the northwest.Terrell Creek is adjacent to the Applicant’s habitat enhancement area north of the cogenerationfacility. The creek runs through a shallow, narrow depression, which is 10 to 15 feet lower inelevation than the surrounding area.
The transmission system’s interconnection elevation ranges from approximately 160 to 120 feetabove MSL. The Custer/Intalco Transmission Line No. 2 ranges in elevation over its nearly 5-mile length from approximately 60 feet above MSL at the Custer substation to a high point ofapproximately 270 feet near the middle of the line and returns to approximately 200 feet aboveMSL at Intalco. The Alcoa Intalco Works is at an elevation of approximately 200 feet aboveMSL.
Regional Geology
The upland is underlain by unconsolidated glacial drift, including layers of till, glaciomarinedrift, outwash sand and gravel, and fine-grained glaciolacustrine sediments. Drift thickness mayreach several hundred feet. Recent sand and silt deposited as alluvium are associated with theNooksack River. The drift is underlain by Eocene Chuckanut sandstone consisting primarily ofthin-to-medium bedded sandstone with occasional layers of conglomerate, siltstone, shale, andcoal. The coal beds extend beneath Bellingham Bay where they were extensively mined from themid-1800s through the 1930s. The sandstone has been substantially folded and faulted andusually dips steeply where exposed. The sandstone is underlain by the Late Jurassic Darringtonphyllite, a dark black, highly fractured micaceous metamorphic rock.
While the Chuckanut sandstone and Darrington phyllite have been deformed by folding andfaulting, the overlying Pleistocene drift is relatively undeformed. The drift is too young to haveexperienced deformational forces over significant lengths of geologic time.
Project Area Geology
Figure 3.1-3 is a generalized geologic map of the project site and surrounding area. The site isunderlain by glacial drift. The drift is comprised of the following deposits described in orderfrom youngest to oldest:

BP Cherry Point Cogeneration Project 3.1 EarthDraft EIS 3.1-3 September 2003
Figure 3.1-1: Project Site Topography North of Grandview Road

BP Cherry Point Cogeneration Project 3.1 EarthDraft EIS 3.1-4 September 2003
Figure 3.1-2: Project Site Topography South of Grandview Road

BP Cherry Point Cogeneration Project 3.1 EarthDraft EIS 3.1-5 September 2003
Figure 3.1-3: Geologic Map

BP Cherry Point Cogeneration Project 3.1 EarthDraft EIS 3.1-6 September 2003
Quaternary
Glacial Outwash - Very limited thin deposits of sand and gravel occur at the land surface andoverlie Bellingham drift. The sand and gravel are loosely consolidated and are well sorted tosilty. This deposit is interpreted to be glaciofluvially reworked sediment from the Bellinghamglaciomarine drift (Easterbrook 1976). The presence of this sand and gravel at the project site isunknown, but if present, it is not expected to be extensive. The sand and gravel are quitepermeable and transmit water readily.
Bellingham Glaciomarine Drift – This deposit consists of a gray, nonsorted, and nonstratifiedpebbly sandy silt and pebbly clay. Published data suggest that the Bellingham drift is about 80feet thick below the project site. The drift is generally firm to dense and may contain marineinvertebrate fossils. Permeability is low and where exposed at land surface, the drift will pondwater in closed topographic depressions. It was formed as sediment trapped in melting glacial icefloating in seawater accumulated on the sea bed. Bellingham drift covers the entire project siteup to a thickness of 80 feet.
Deming sand – The sand is brown, stratified, well-sorted, and medium-to-coarse grained withsome layers of silt, clay, and gravel. The sand is 30 to 40 feet thick below the project site and isgenerally dense. It is permeable and acts as an aquifer, though it appears to be discontinuous or ispinched out to the east and northeast of the project site.
Undifferentiated sedimentary deposits - This is a group of unconsolidated deposits that are notindividually identified or distinguishable on project area well logs. The deposits may include theKulshan glaciomarine drift, Vashon till, Esperance sand, and other glacial and nonglacialsediments underlying Bellingham drift. The thickness and consistency of these deposits varysubstantially; however, in general, consistencies tend to be denser than those of the overlyingdeposits. Granular sediments have higher permeabilities than finer-grained sediments.
Pre-Quaternary
Undifferentiated sedimentary rock - The unconsolidated deposits are likely underlain by bedrockof the Chuckanut sandstone. These rocks were encountered at 210 and 256 feet below ground tothe north and northeast of the project site.
Surficial Soils
Soil types in the project vicinity are shown in Figure 3.1-4 (Goldin 1992). These soil types aredescribed below.
12 - Birch Bay silt loam (0 to 3% slopes) encompasses the northwestern portion of the projectsite. This deep, moderately well-drained soil is reworked glaciomarine drift material.Permeability is moderate in the upper part, very rapid in the sandy upper part of the substratum,and slow in the loamy lower part. Runoff is very slow and there is little or no hazard of erosion(Goldin 1992).

BP Cherry Point Cogeneration Project 3.1 EarthDraft EIS 3.1-7 September 2003
Figure 3.1-4: Soil Types

BP Cherry Point Cogeneration Project 3.1 EarthDraft EIS 3.1-8 September 2003
80 – Kickerville silt loam (0 to 3% slopes) is found on a low hill in the northeast section of theproject site north of Grandview Road. This deep, well-drained soil is found on outwash terraces.Permeability is moderate in the upper part and little or very rapid in the substratum. Runoff isvery slow and there is no hazard of erosion (Goldin 1992).
93 – Labounty silt loam (0 to 2% slopes) encompasses the eastern portion of the transmissionsystem intertie. This deep, poorly drained soil is found on reworked glaciomarine drift material.Permeability is slow. Runoff is very slow, and surface ponding may occur during the winter andspring. There is little or no hazard of erosion (Goldin 1992).
94 – Labounty silt loam, drained, (0 to 2% slopes) is found north of the project site, north ofGrandview Road. Its description is the same as 93 above, except it is artificially drained topermit fieldwork earlier in the spring and increase yields of perennial crops (Goldin 1992).
171 – Urban land is found west and southwest of the project site. It consists of areas covered bystreets, buildings, parking lots, and other structures that obscure the ground so that identificationof the soil type is not feasible (Goldin 1992).
184 – Whitehorn silt loam (0 to 2% slopes) encompasses most of the project site. This deep,poorly drained soil occurs in depressions on glaciomarine drift plains. Permeability is moderatelyslow. Runoff is very slow, and there is little or no hazard of erosion (Goldin 1992).
The erosion factor K (potential for erosion) for soils at the project site (Birch Bay – Whitehorn)ranges from 0.10 to 0.49 (low to high). The risk of erosion of undisturbed soils in the vicinity ofthe site is low because of the relatively flat slopes and vegetative cover.
Geologic and Natural Hazards
Geologic and natural hazards that could affect the cogeneration facility and associatedinfrastructure include:
• seismic hazards,• erosion hazards as a result of flooding,• volcanic hazards, and• tsunami hazards.
Seismic Hazards
The site is located in seismically active western Washington. Two of the earth’s crustal platescollide offshore from Washington’s coast. The Juan de Fuca oceanic plate moves eastward andcollides with the North American continental plate, which is moving relatively westward.Because the continental plate is less dense than the oceanic plate, the oceanic plate dives and issubducted beneath the continental plate. The stresses developed as the two plates collide releaseenergy in the form of earthquakes. Earthquakes associated with plate collisions are generallydeep (greater than 15 miles below ground surface), often at around 40 miles beneath the land

BP Cherry Point Cogeneration Project 3.1 EarthDraft EIS 3.1-9 September 2003
surface. Some of the energy released by these earthquakes is absorbed as it passes through theearth’s crust, reducing impacts at the surface.
The plate collision induces stresses in the bedrock of the continental crust. If induced stress issufficient, the crustal rocks will fracture, creating faults. Movement along these faults releasesenergy causing shallow earthquakes at less than 15 miles beneath the land surface. Two faults arerecognized in northwestern Washington. The Devils Mountain Fault is located in the CascadeMountain foothills and extends northwesterly and westerly to northern Whidbey Island. TheVedder Mountain Fault runs northeast-southwest just south of Sumas and Everson, Washington.The fault is projected to extend to the Lummi Peninsula. A third fault, the Sumas, ishypothesized to extend parallel to the Vedder Mountain fault just north of Sumas. Directassociation of earthquakes with these faults is uncertain. Historical earthquakes are listed inTable 3.1-1.
Table 3.1-1: Historical Western Washington Earthquakes with a Magnitude 5.0 orGreater
Year Location Magnitude Depth
1909 Friday Harbor 6.0 deep1932 Granite Falls 5.7 shallow1949 Olympia 7.1 deep1965 Tacoma 6.5 deep1976 West of Friday Harbor 5.1 deep1990 Deming 5.0 shallow1995 Tacoma 5.0 deep1996 Duvall 5.6 shallow2001 Olympia 6.8 deep
Western Washington is listed as being in a Seismic Zone 3 in the Uniform Building Code.Seismic Zone 3 areas require a certain level of design to avoid damage from earthquakes that isnot required in Seismic Zones 1 and 2. Earthquakes can damage structures and utilities in severalways:
• Ground Acceleration – The initial energy wave felt during an earthquake compresses theground as it moves. The compression can move the ground surface laterally such that theground surface accelerates quickly beneath structures on the land surface. This accelerationcan severely damage structures. Seismic Zone 3 areas can experience ground accelerationbetween 0.2 to 0.3 times the acceleration of gravity
• Ground Shaking – Complex energy waves follow the compression wave from an earthquake.The complex waves can impart a great deal of energy into the ground and cause severeshaking in structures. The closer a site is to the source of the earthquake, the greater theground shaking. The degree of ground shaking is also related to the earthquake’s magnitudeand the soils underlying the site. Unconsolidated soils tend to slow earthquake energy waves,thereby increasing their amplitude, which in turn increases ground shaking. Earthquakewaves traveling through bedrock move at a much greater velocity and have smalleramplitudes resulting in less ground motion.
BP Cherry Point Cogeneration Project 3.1 EarthDraft EIS 3.1-10 September 2003
• Ground Surface Rupture – If ground shaking is excessive, the ground surface may rupture,potentially damaging structures. Ground surface ruptures are neither areally extensive norcommon during western Washington earthquakes.
• Differential Settlement – Strong ground motion may compress unconsolidated soils. Loadsinduced by structures can enhance this process. More loosely consolidated soils may settlegreater amounts, thereby removing foundation support and damaging overlying structures.Underground utilities can also be damaged in this manner.
• Landslides – Steep slopes where unstable geologic conditions exist are prone to landslides.Triggering mechanisms, such as earthquakes, can initiate both large and small landslides insuch areas. Some of the largest and most spectacular landslides in western Washington werethe result of earthquakes.
• Soil Liquefaction – Certain soil types with a distinct combination of physical properties andmoisture content are susceptible to liquefaction. In this process, the friction between the soilgrains that binds the soil cohesively is overcome by the pore pressure of the water in the soilpore spaces. This results in the soil behaving like a viscous liquid. Structures located on suchsoils can settle substantially and suffer severe damage.
Potential impacts to the site from these hazards are addressed in the following sections.
Ground Acceleration
Compliance with design criteria outlined for Seismic Zone 3 in the Uniform Building Codewould protect against damage from ground acceleration.
Ground Shaking
A useful way to describe earthquake shaking for engineering purposes is in terms of peak groundacceleration (PGA). This measure provides useful information about the forces that might beapplied to engineered structures during earthquake shaking.
The U.S. Geological Survey (USGS) National Seismic Hazard Mapping Project has completed aprobability seismic hazard assessment for the contiguous U.S. USGS estimates probable seismichazards by considering the probability of occurrence of all earthquakes and ground motionassociated with these earthquakes and calculating the probability that a certain level of shakingwould be exceeded in a chosen time period. The 10% probability of exceeding a mean PGAvalue in a 50-year period is a common measure used in engineering studies. (This probabilityalso can be expressed as a 90% probability that ground motion will not occur in 50 years.) Thisis equivalent to the mean ground motion with a return period of 475 years.
The proposed project site is located in an area of moderate earthquake hazard. A PGA of 0.23(expressed in units of gravity) has a 10% chance of being exceeded in the next 50 years. Strongshaking of 0.54 gravity has a 1% chance of being exceeded in 50 years. These levels ofearthquake shaking are estimated for weak rock sites. The character (frequency and duration) ofearthquake shaking at the proposed project site would be different than that calculated by theUSGS models because the proposed project site is underlain by more than 200 feet of sediment.Sediment layers would modify the character of earthquake ground motion.

BP Cherry Point Cogeneration Project 3.1 EarthDraft EIS 3.1-11 September 2003
The cogeneration facility is underlain by more than 200 feet of Quaternary-age glaciofluvial andglaciomarine deposits. The upper 100 feet of these deposits is typically soft to medium stiffglaciomarine drift to about 50 feet below ground. Below about 50 feet the drift is very stiff tohard.
The upper 50 feet of sediment is expected to have a low average “shear wave velocity.” Averageshear wave velocity in the upper 100 feet of soil determines earthquake response, and shear wavevelocity is used to characterize the soil profile type in the 1997 UBC. Low average shear wavevelocity deposits can filter out short-term ground motion and amplify the longer duration groundmotion. Amplification during longer duration motion is potentially more damaging to tallstructures and requires consideration during design. The magnitude of site amplification woulddepend primarily on the frequency, content, and intensity of the ground motion and local soilconditions. Topographic amplification of earthquake shaking is not expected at the project sitebecause of the low topographic relief. In addition, the impact of ground shaking on undergroundutilities is expected to be minimal.
Landsliding
Earthquake-triggered landslides are not a potential hazard at the proposed project site becausethere are no steep slopes in the area.
Soil Liquefaction
Preliminary analysis of subsurface soils close to the project site indicates that soils lack thephysical properties that lead to liquefaction. Without these properties being present, the potentialfor liquefaction at the project site is low.
Ground Surface Rupture
No active faults are known to exist beneath the project site; however, the Vedder Mountain andSumas faults extend across Whatcom County in a southwesterly direction (see Figure 3.1-5).Analysis indicates that the potential hazard from surface faulting at the project site is low.
Differential Settlement
Site surficial soils have the potential for settlement based on their consistency and moisturecontent. The foundations for various structures and equipment, particularly vibrating equipment,should be designed to compensate for potential differential settlement.
Erosion Hazards as a Result of Flooding
The proposed cogeneration facility and associated structural components are located outside any5-, 100-, or 500-year floodplains, as designated by the Federal Emergency Management Agency(FEMA). Site soils are fairly impervious (clay/silt), and topography is relatively flat. Also,vegetation is well established. Based on these factors, there is a low risk for erosion fromflooding.

BP Cherry Point Cogeneration Project 3.1 EarthDraft EIS 3.1-12 September 2003
Figure 3.1-5: Seismotectonic Map of Northwest Washington and Southwest British Columbia

BP Cherry Point Cogeneration Project 3.1 EarthDraft EIS 3.1-13 September 2003
Volcanic Hazards
Five major composite volcanoes (or stratovolcanoes) are located in the state of Washington, allof which are part of the Cascade Range, a volcanic arc that stretches from southwestern BritishColumbia to northern California. These five volcanoes are Mount Baker, Glacier Peak, MountRainier, Mount St. Helens, and Mount Adams. All Washington volcanoes except Mount Adamshave erupted within the last 250 years (Pringle 1994).
Of the five Washington volcanoes, only Mount Baker, and to a far lesser degree Glacier Peak,has any potential to affect the proposed project. Mount Baker is approximately 45 miles to theeast and Glacier Peak is approximately 100 miles southeast of the project site.
In the case of a volcanic eruption, tephra (ash) deposition would be the biggest concern at theproposed project site; lava and debris flow would not be a concern because of the distance ofMount Baker and other Cascade volcanoes from the project site. The annual probability for thedeposition of 0.39 inch or more of tephra at the project site from any Cascade volcano is 0.02%.The annual probability for the deposition of 3.9 inches or more of tephra at the project site fromany Cascade volcano is less than 0.01%. Mount Baker has not historically produced largeamounts of tephra and probably will not do so in the future (Gardner et al. 1995).
Tsunami
The vulnerability of the proposed project site to tsunamis that have been historically recorded orinterpreted from the geologic record is very low. The site is at an elevation of 120 feet aboveMSL and is 2 miles from the Strait of Georgia. Sea cliffs ranging from 60 to 100 feet highprotect most of the shoreline along the Strait of Georgia closest to the project site.
The shoreline near the project site is generally protected from tsunamis generated from distanttrans-Pacific sources or Cascadia subduction zone seismic events by the relatively narrowconfines of the Strait of Juan de Fuca and Strait of Georgia, and the buffer of the San Juan andGulf islands. Similar protection is afforded from tsunamis generated from a large seismic eventalong the Seattle fault to the south. More commonly, a tsunami could be generated from a localearthquake disturbing the sea floor or by slumping along the front of the Nooksack delta(Easterbrook 1973). Such a tsunami could have severe local shoreline impacts, but is notexpected to affect the proposed project.
3.1.2 Impacts of the Proposed Action
Construction
Cogeneration Facility
Excavation and Fill Materials
The existing terrain at the cogeneration facility and refinery interface area is relatively flat.Therefore, extensive grading of the site will not be required. It is anticipated that some unsuitable

BP Cherry Point Cogeneration Project 3.1 EarthDraft EIS 3.1-14 September 2003
materials may require removal and that some imported fill of suitable quality will be needed forreplacement, site preparation, and backfill. The imported fill, sand, and aggregate gravel wouldbe obtained from local sources within Whatcom County. Site grading would use onsite fill to theextent possible to reduce the need for imported fill. Acquisition of fill material and sand andgravel would be the responsibility of the construction contractor.
Construction bulk materials including soil, sand, and gravel would be supplied locally fromexisting permitted sources and quarries. The total quantity of imported fill material is estimatedto be approximately 126,000 cubic yards (75,600 tons). This quantity includes pavement basecourse material for the plant roadway and parking area and gravel surfacing material for theswitchyard and power block areas. Impacts on the local sources and quarries of bulk constructionmaterials will be consistent with those types of extractive land uses within the limitations of thepermit requirements for these facilities. Specific sources had not been identified at the time ofDraft EIS preparation. However, total gravel resources in Whatcom County that have beenpermitted for extraction represent 55.2 million tons. The permitted, active mines in WhatcomCounty are depicted in Figure 3.1-6. Based on estimates for the cogeneration project,approximately 27,000 tons of gravel would be required. Therefore, existing permitted sources ofgravel (and fill material) would likely not be significantly impacted by construction of theproject.
Undesirable site soils (with respect to engineering properties) would be removed and disposed ofat an approved offsite location. Specific disposal locations would be determined during finalproject design and would be approved according to the requirements of a Whatcom CountyClearing and Grading Permit for the project.
Soil Contamination
A very low potential exists for encountering contaminated soil within the proposed project site.Based on a review of historic aerial photographs and interviews with long-time BP employees,project areas were used for agriculture before the refinery was built and therefore are notexpected to be sources of hazardous materials.
There is a potential for impacts on site soils through accidental spills of construction chemicalsor through fuel and lubricant leaks from construction equipment. This issue is discussed ingreater detail in Section 3.4 Water Quality and Section 3.16 Health and Safety. Effectiveimplementation of the Stormwater Pollution Prevention (SWPP) plan and Spill PreventionControl and Countermeasures (SPCC) plan would limit the extent of soil contamination.
Topographic Modifications
No significant topographic modifications would be required to prepare any of the project sitesbecause slopes range from only 0.5% to 1% (see Figures 3.1-1 and 3.1-2). Site grading wouldinclude cutting and filling with slopes directing stormwater drainage toward collection structures.Some unsuitable onsite materials would require removal, and some imported fill of suitablequality would be needed for replacement, site preparation, and backfill. This fill material wouldhave minimal impacts on existing topography.

BP Cherry Point Cogeneration Project 3.1 EarthDraft EIS 3.1-15 September 2003
Figure 3.1-6: Permitted, Active Surface Mines in Whatcom County

BP Cherry Point Cogeneration Project 3.1 EarthDraft EIS 3.1-16 September 2003
Any clearing and grading activities would be accomplished using construction machinery such asexcavators and bulldozers. Blasting to modify topography is not anticipated.
Erosion
Existing slopes range from 0.5% to 1%, with minimal potential for significant erosion. Thepotential for erosion would be further reduced by using the Best Management Practices (BMPs)described below in Section 3.1.5. Site grading and stockpiling would expose soils and wouldincrease the potential for erosion. However, exposed and stockpiled soil would be controlled bythe procedures and mitigation measures described below in Section 3.1.5.
Refinery Interface
Potential impacts from excavation, filling, and soil contamination described for the refineryinterface components are similar to those described for the cogeneration facility construction. Agreater potential exists for contacting contaminated soils during excavation activities on therefinery site because of industrial practices that have occurred there since the early 1970s.Topographic modifications and erosion hazards would be similar to those described forconstruction at the cogeneration facility site.
Transmission System
The access/maintenance roads leading to the transmission line corridor, as well as theconstruction access and maintenance road along the corridor and three of the four transmissiontower pads, were previously graded under an existing Section 404 Permit. One additional 50-footby 50-foot pad would be graded adjacent to the existing Custer/Intalco Transmission Line No. 2.Therefore, only very limited clearing and grading would be required to complete this projectelement.
Custer/Intalco Transmission Line No. 2
This specifics for this project element are still under development. One option being consideredis replacing the existing single-circuit line with a double-circuit line. This would requireplacement of new towers. The location and number of these towers has not yet been determined.Also unknown is whether any new construction access roads would need to be established. Theseactivities, if this option was chosen, may require clearing, grading, and topographic modification.There also could be exposed soil susceptible to erosion.
Other Project Components
Construction activities at Intalco would include excavation (presumably in a previously disturbedindustrial area) to establish a 10-foot by 40-foot by 10-foot deep sump. Given that this wouldoccur on land used for industrial purposes, there is a possibility of encountering contaminatedsoils. Topographic modifications would be minor and localized. There is an increased erosionrisk while soils are exposed.

BP Cherry Point Cogeneration Project 3.1 EarthDraft EIS 3.1-17 September 2003
Construction of cogeneration facility access roads would require minor clearing and grading.Topographic modifications would be minimal because the existing topography is flat. Therewould be an increased erosion risk when soils are initially exposed until compaction andsurfacing activities are completed.
Topographic modifications associated with the mitigation wetlands would involve filling someditches on both compensatory wetland mitigation sites (CMA 1 and CMA 2) and construction ofa level trench at about elevation 98 on CMA 2. Ditches in CMA 1 and CMA 2 would be filledprimarily with material originally excavated to create them. For Laydown Area 4 and thenorthern approximately 273 feet of Laydown Area 2, fill would be removed at the end of projectconstruction and wetland hydrologic conditions would be restored to the extent possible.Potential impacts to earth resources would be similar to those described for cogeneration facilityconstruction.
Operation
Cogeneration Facility
Facility Operation and Maintenance
No significant impacts on soils or local topography are anticipated during the operation andmaintenance of the cogeneration project. Additional fill or aggregate materials may be neededfor repairs to roads and underground utilities, but the amounts would be minimal. The surfacetopography of the site is not expected to be altered after construction of the cogeneration facility.
Seismic Hazard
As discussed in Section 3.1.1, risk of a seismic event causing significant damage to thecogeneration facility and ancillary components is low because design criteria outlined forSeismic Zone 3 in the Uniform Building Code would be incorporated into the design. A largeearthquake could affect operation of the cogeneration facility. However, it is unlikely that theimpacts would be significant.
Volcanic Hazard
As discussed in Section 3.1.1, the greatest risk to the project from volcanic activity is fromtephra (ash) fall. The probability of this impacting the cogeneration facility is low. Cogenerationfacility operations would be suspended until tephra fall ceased and this material was cleaned up.
Refinery Interface
Impacts to earth resources and from natural hazards to components of the refinery interface areexpected to be similar to those described for the cogeneration facility. It is possible that a largeseismic event could damage pipelines. Damaged water pipelines could leak their contents untilvalves were closed. Ruptured gas lines could lead to fire and explosion. The probability of alarge seismic event affecting pipe integrity is low due to design considerations.

BP Cherry Point Cogeneration Project 3.1 EarthDraft EIS 3.1-18 September 2003
Transmission System and Custer/Intalco Transmission Line No. 2
No impacts to earth resources are expected from operation of the transmission system or theCuster/Intalco Transmission Line No. 2. A large seismic event could damage transmission linetowers and interrupt the flow of electricity.
Other Project Components
No impacts to earth resources are expected from operation of the water supply facilities at theAlcoa Intalco Works. A large seismic event could disrupt this facility.
3.1.3 Impacts of No Action
Under the No Action Alternative, most of the new facilities would not be constructed and noimpacts on soils would occur. No construction impacts from the removal and handling of soilwithin the project site would occur. There would also be no change to the existing supply of fillmaterials from quarries in Whatcom County.
3.1.4 Secondary and Cumulative Impacts
No long-term secondary or cumulative impacts to earth resources from the proposed project orother reasonably foreseeable projects are expected. Some fill material would be supplied to theproject from offsite sources and some material excavated from the site would need to bedisposed of offsite. This would occur at approved or permitted locations.
Other construction projects in the area not associated with the cogeneration facility, such as theproposed Georgia Strait Crossing Project (GSX), also would likely have short-term impactsrelating to clearing, excavation, and filling, and topographic modification. Under the proposedGeorgia Strait Crossing project, installation of a pipeline along Grandview and Jackson roadswould temporarily affect earth resources. Pipeline installation is scheduled to occur about thesame time as construction of the proposed cogeneration project. Pipeline construction is expectedto disturb surface soils within the 100-foot right-of-way (ROW) immediately north of GrandviewRoad and west of Jackson Road. The ROW would be cleared and the soil would be stockpiledwithin the ROW; a trench 6 to 10 feet deep and approximately 6 feet wide would be dug. Theseactivities would affect the native soils within and adjacent to the pipeline ROW. It is anticipatedthat the topsoil would be restored and the area revegetated following pipeline installation. Thus,no long-term impacts on soils within the pipeline ROW or within the proposed cogenerationproject boundaries are anticipated. BMPs used during installation of the pipeline wouldprevent/reduce impacts on other natural resources.

BP Cherry Point Cogeneration Project 3.1 EarthDraft EIS 3.1-19 September 2003
3.1.5 Mitigation Measures
Mitigation Proposed by the Applicant
Construction
Soil Contamination
In order to confirm the absence of contaminants, soils will be sampled and inspected before andduring site clearing, grading, trenching, and other excavation activities. Despite theseprecautions, if suspect contaminated soil is encountered during trenching and other excavationactivities, these activities will be stopped. Qualified personnel will respond to assess hazards andperform characterization. Treatment and/or disposal at an approved facility would depend on thetype of contamination found.
A SWPP plan and SPCC plan would be developed and implemented for both construction andoperation activities; these plans would outline strategies to prevent or minimize impacts on sitesoils from chemical spills and leaks of fuel and lubricants. The contents of the SWPP plan andSPCC plan are discussed in greater detail in Section 3.4 Water Quality.
Erosion Control Procedures
BMPs would be implemented during construction and operation for erosion control andprevention. BMPs would be described in a SWPP plan and Temporary Erosion andSedimentation Control (TESC) plan developed prior to construction and operation. BMPs mayinclude the installation of control structures such as silt fences/straw bales, sediment traps, anddiversion ditches. Construction activities would be controlled to limit erosion. Graded areaswould be smooth, compacted, free from irregular surface changes, and sloped to drain. Becausethe existing slopes range from 0.5% to 1%, extensive grading of the site would not be required.Disturbed areas would be surrounded with stabilized soil berms or sand bags to prevent erosionfrom affecting adjacent areas. Piles of excavated materials would be stabilized and protectedusing BMPs in accordance with a SWPP plan and TESC plan. Dust control and wind erosionwould be controlled by spraying exposed soil with water.
Excavated materials of acceptable quality would be reused as much as possible. Excess materialswould be disposed of at permitted fill sites or would be placed where they would not easily erode(i.e., not on slopes steeper than 3:1 unless compacted to the requirements of structural fill). Uponcompletion of construction, disturbed areas would be revegetated by seeding or hydroseeding.Seed mixes that are known to effectively stabilize erodible soils in northwestern Washingtonwould be selected. Sprinkler systems may be used to sustain vegetation on bermed areas withhigh exposure to the erosive forces of wind.
Soil stockpiles would be seeded or covered with an emulsion and surrounded by silt fences andstraw bales or sand bags, where necessary, to prevent excessive erosion by wind or rain.

BP Cherry Point Cogeneration Project 3.1 EarthDraft EIS 3.1-20 September 2003
Erosion control measures for construction, such as silt fencing, straw bales, and tarps, would beinspected and maintained periodically and after major storms as needed to ensure their continuedeffectiveness.
Stormwater runoff from the construction site would be collected and routed to a sediment controlsystem. Sediment control measures, such as an oil-water separation system and detention ponds,would be sized for storm events ranging from 6-month, 24-hour up to the 100-year, 24-hourevent. Details on the proposed stormwater and sediment control systems are provided in Section3.4, Water Quality.
Operation
Seismic Hazards
The proposed cogeneration facility and associated infrastructure would be designed and built inaccordance with applicable federal, state, and local building standards and codes specifically forpower-generating facilities. The characteristics of soils at the proposed project site would bedetermined during the geotechnical analysis completed during detailed project design. If soilsprove to be susceptible to induced amplification, the project design would incorporate protectionmeasures against such seismic events.
Additional Recommended Mitigation Measures
Volcanic Hazards
In the event of tephra fall at the cogeneration facility, it is recommended that all activities at thefacility be suspended until the tephra fall has ceased. All mechanical and electrical componentsand water supply containment structures should then be cleared of the volcanic ash beforeresuming operations.
3.1.6 Significant Unavoidable Adverse Impacts
No significant unavoidable adverse impacts on earth resources are identified. Project design aswell as operation and maintenance planning would minimize potential risks from natural hazardssuch as seismic and volcanic events.

BP Cherry Point Cogeneration Project 3.2 Air QualityDraft EIS 3.2-1 September 2003
3.2 AIR QUALITY
This section discusses the impact on air resources from the BP Cherry Point CogenerationProject. It addresses potential impacts associated with the proposed project and identifiesmitigation measures designed to limit those impacts. The analysis in this section is based oninformation from the Application for Site Certification prepared for this project (BP 2002,Appendix E).
In addition to evaluating the emissions resulting from the cogeneration facility alone, this sectiondescribes the Applicant’s estimates of emission reductions that would occur with thecogeneration aspect of the proposal. As indicated in Section 1.2.1, BP Cherry Point RefineryNeed, one of the purposes of the cogeneration project is to supply both steam and electricity tothe existing refinery. The refinery’s purchase of cogeneration facility steam would allow theremoval of existing less efficient refinery utility boilers, leading to a reduction in regionalemissions of particulate matter less than 10 microns is size (PM10) and nitrogen oxides (NOx).The short and long-range air quality impacts of both the cogeneration facility emissions and therefinery reductions are discussed in more detail below.
3.2.1 Regulatory Framework
Under Chapter 80.50 Revised Code of Washington (RCW), the authority for permit review andissuance of air permits is granted to the EFSEC for thermal generating power plants capable ofgenerating 350 MW or more of electricity. The U.S. Environmental Protection Agency (EPA)has delegated to EFSEC the issuance of federal Prevention of Significant Deterioration (PSD)permits for facilities regulated under Chapter 80.50 RCW. EFSEC reviews applications for airemissions resulting from the operation of such facilities pursuant to the requirements ofChapter463-39 WAC. EFSEC has adopted the substantive requirements of the WashingtonDepartment of Ecology regulations for air pollution sources as codified in Chapters 173-400WAC (General Regulations for Air Pollution Sources), Chapter 173-401 WAC (Air OperatingPermit Program), Chapter 173-406 WAC (Acid Rain Regualtion), and Chapter 173-460(Controls for New Sources of Toxic Air Pollutants).
Air Quality Standards
United States
The proposed cogeneration facility would be regulated according to applicable U.S. federal andWashington State laws and regulations. Pursuant to the Clean Air Act of 1970, the EPAestablished air quality standards for the following air pollutants: ozone (O3), carbon monoxide(CO), lead (Pb), nitrogen dioxide (NO2), particulate matter (PM10, PM2.5), and sulfur dioxide(SO2). These include primary standards that have been established to protect human health andsecondary standards to protect the public welfare. Ecology has also adopted WashingtonAmbient Air Quality Standards (WAAQS) similar to the National Ambient Air QualityStandards (NAAQS), and has included standards for total suspended particulate (TSP).

BP Cherry Point Cogeneration Project 3.2 Air QualityDraft EIS 3.2-2 September 2003
Particulate matter includes both naturally occurring and man-made particles with a diameter ofless than 10 microns or 2.5 microns, respectively. Local and regional contributions of particulatematter include sea salt, pollen, smoke from forest fires and wood stoves, road dust, industrialemissions, and agricultural dust. Particles of this size are small enough to be drawn deep into therespiratory system where they can contribute to infection and reduced resistance to disease(Canadian Federal Government 2002).
Table 3.2-1 summarizes the federal and state primary and secondary standards for the criteriapollutants, and the averaging time for determining compliance with the standards. It also presentsthe increments under the EPA’s PSD program and the EPA PSD Class II significance levels forair quality that are applicable to the proposed project.
Canada
For purposes of review of the impacts to air quality on a regional basis, Canadian regulatorystandards and objectives were considered. The Canadian Environmental Protection Act providesfor three levels of air quality objectives: desirable, acceptable, and tolerable, which correspond todegrees of environmental damage or potential health effects. The Province of British Columbiaalso has established air quality objectives that are similar to the Canadian national objectives,and, where no comparable federal objectives exist, the Greater Vancouver Regional District(GVRD) has proposed objectives for pollutants of concern within its jurisdiction. Level A is adescriptor used by GVRD that is equivalent to the desirable objective, and Level B is adescriptor that is equivalent to the acceptable objective in the Canadian EnvironmentalProtection Act. The Canadian Ministers of Environment have established nationwide standardsfor PM2.5 and O3. These standards establish goals for the year 2010 rather than regulatory limits.Table 3.2-2 summarizes the Canadian National Ambient Air Quality Objectives and Standards.
Regulatory Requirements
The EPA and Ecology have developed air quality regulations and guidelines that require all newor modified “major sources” of air emissions to undergo a rigorous permitting process beforecommencing construction. The federal program is called New Source Review (NSR). The PSDprogram is within the overall federal NSR program. The provisions of the federal PSD programare contained in 40 CFR 52.21.
New Source Review
The NSR program applies to new or modified sources that could cause a significant increase inemissions of air pollutants. The objectives of the NSR process are to demonstrate that airemissions from the new source will not significantly impact ambient air quality near the facilityand that state-of-the-art emission controls will be applied. NSR incorporates both state andfederal requirements.
To satisfy the general NSR requirements, the following information must be submitted:

BP Cherry Point Cogeneration Project 3.2 Air QualityDraft EIS 3.2-3 September 2003
• Notice of Construction Application form and associated information. This application form isincluded at the front of the PSD application.
• PSD Applicability Analysis• "Top-down" BACT Analysis• Toxic Air Pollutant Review (WAC 173-460)• Air Quality Modeling Analysis
The requirements for these separate review elements are described in further detail below.
Prevention of Significant Deterioration
PSD review regulations apply to new or modified sources located in an attainment area that havethe potential to emit criteria pollutants in excess of predetermined “de minimus” values (40 CFRPart 51). For new generation facilities, these values are 100 tons per year (tpy) of criteriapollutants for 28 specific source categories, including power generating facilities, and 250 tpy forall others. The proposed project would be a PSD source because it would emit more than 100 tpyof NOx, CO, PM10, and PM2.5. Also, the projected potential to emit annual emissions of volatileorganic compounds (VOC), SO2, and sulfuric acid mist (H2SO4) exceeds the individualsignificant emission rate thresholds listed in WAC 173-400-030. VOC is defined as any organiccompound that participates in atmospheric photochemical reactions. Therefore, the proposedproject is also subject to PSD review for those pollutants.
The PSD review process evaluates existing ambient air quality, the potential impacts of theproposed source on ambient air quality, whether the source would contribute to a violation of theNAAQS, and a review of the Best Available Control Technology (BACT). It should be notedthat although NAAQS have been established for PM 2.5, the designation of attainment, non-attainment, and unclassified areas has not yet been performed for this pollutant. PM 2.5 istherefore not a regulated pollutant under the PSD program at this time.
PSD restricts the degree of ambient air quality deterioration that would be allowed by assigningincrements for criteria pollutants based on the classification (attainment, non-attainment, orunclassified) of the area. PSD increments have been established for certain criteria pollutants andare interpreted as the maximum allowable ground-level increase of a pollutant concentration.Class I areas are assigned to federally protected wilderness areas, such as national parks, andallow the lowest increment of permissible deterioration. This essentially precludes developmentnear these areas. Class II areas are designed to allow for moderate, controlled growth, and ClassIII areas allow for heavy industrial use, but in all cases the pollution concentrations cannotviolate any of the NAAQSs.
The Class I areas closest to the proposed project include North Cascades National Park, OlympicNational Park, Glacier Peak Wilderness Area, Alpine Lakes Wilderness Area, and PasaytenWilderness Area (Figure 3.2-1). The area around the proposed project is designated Class IIwhere less stringent PSD increments apply. Class I and II increments are shown with the ambientair quality standards in Table 3.2-1.
BP Cherry Point Cogeneration Project 3.2 Air QualityDraft EIS 3.2-4 September 2003
Significant Impact Levels (SILs) are used in the air quality impact analysis. The SILs are ascreening tool to determine the extent of the air quality analysis required to demonstratecompliance with the NAAQSs and PSD increments. The SILs are typically 1 to 5% of theambient air quality standards and are well below any levels that could lead to adverse health orwelfare impacts. These SILs are more restrictive than the NAAQSs and the Canadian NationalAmbient Air Quality Objectives and Standards.
According to analysis methodologies established by Ecology and the EPA, the impact from asource is not required to be below the SILs. However, these levels set a worst-case scenario, so ifthe impacts of a source are below the SILs, state and federal agencies consider the impacts to beinconsequential and no further evaluation is required.
Finally, the PSD program also requires an analysis of the impairment to soils and vegetation, andan analysis of visibility, regional haze, and deposition impacts on Class I areas.
State/Local Emission Limits and Best Available Control Technology
As part of the PSD process, EFSEC is reviewing the Applicant’s evaluation of alternativeemission control technologies. The determination of which control technology best protectsambient air quality is made by the regulatory agency on a case-by-case basis taking into accountthe associated economic, energy, and environmental impacts. The analysis for BACT identifiespollutant-specific alternatives for emission control, and the costs and benefits of each alternativetechnology. BACT would reduce emissions of toxic air pollutants, along with those of criteriapollutants. For example, low-sulfur fuel, such as natural gas, is a BACT because of its loweremissions of criteria and toxic air pollutants over other fuels, such as fuel oil or coal. Combustioncontrols also reduce criteria pollutants by optimizing combustion and reducing pollutants emittedin the exhaust stream.
The determination of BACT at the time of the final air emissions permit review would define theemission limits for the proposed project. BACT for NOx typically consists of dry, low NOx
technology, or SCR, which is a post-combustion control that uses ammonia and a catalyst toreduce NOx emissions. Any unreacted ammonia is emitted as a toxic air pollutant, however, andis regulated by Washington State.
Other Air Permit Requirements
New Source Performance Standards
The EPA has adopted federal emission standards applicable to various combustion sources.These emission standards are referred to as the New Source Performance Standards (NSPS).EPA set forth the NSPS for stationary combustion turbines in 40 CFR 60, Subpart GG, datedSeptember 1979. These require that NOx emissions do not exceed 103 parts per million dryvolume (ppmdv) at full load operation and that SO2 emissions not exceed 150 ppmdv. They alsoprohibit the use of fuel containing more than 0.8% sulfur by weight.

BP Cherry Point Cogeneration Project 3.2 Air QualityDraft EIS 3.2-5 September 2003
Figure 3.2-1

BP Cherry Point Cogeneration Project 3.2 Air QualityDraft EIS 3.2-6 September 2003
The duct burners are subject to the NSPS for steam generating units in 40 CFR 60, Subpart Db,which limit the NOX emission for the duct burners to 0.20 lb/mmBt No other NSPS emissionsstandards are applicable to this proposed power generating facility.
Acid Rain
Title IV of the Clean Air Act (also known as the “acid rain” rules) applies to utility projects thatstarted commercial operation on or after November 15, 1990, produce electricity for sale and donot fall into one of the regulatory exemptions. These rules are contained in 40 CFR Parts 72, 75,and 76 and have been adopted into WAC 173-406. The “acid rain” rules will apply to theproposed project’s combustion turbines and duct burners because these units will be utility unitsserving one or more generators with a nameplate capacity of greater than 25 MW.
The Title IV program consists of three primary requirements. To meet these requirements theApplicant would have to:
1. Submit an “acid rain” permit application at least 24 months before the anticipated date forstart of operations,
2. Be subject to requirements for continuous emissions monitoring for NOX and dilutents gas(O2 or CO2) and,
3. Be subject to the “acid rain” recordkeeping and reporting requirements, including therequirement to obtain and document SO2 allowances.
Hazardous Air Pollutant Regulations
According to EPA Interpretive Rule (Federal Register 65 FR 21363), the proposed cogenerationfacility is not categorically exempt from “case-by-case” Maximum Available ControlTechnology (MACT) determinations (Clean Air Act [CAA] Section 112). However, because noindividual hazardous air pollutants (HAP) will have an emission rate greater than 10 tpy and nocombination of HAPs will have a total cumulative annual emission rate of greater than 25 tpy,the facility is not subject to the MACT requirements.
No current National Emission Standards for Hazardous Air Pollutants (NESHAPS), as regulatedunder 40 CFR 61, are applicable to the cogeneration facility, and no current or proposedNESHAPS for sources regulated under 40 CFR 63 apply to the facility. In the future, stationarycombustion turbines will be subject to NESHAPS, but since it has not yet been adopted, anapplicability determination can not be made at this time.
Title V – Air Operating Permit
The cogeneration facility would be subject to the federal Clean Air Act Part 70 – Title V airoperating permit program. The Applicant would have to file a permit application 12 months afterfacility operations commence.

BP
Che
rry
Poi
nt C
ogen
erat
ion
Pro
ject
3.2
Air
Qua
lity
Dra
ft E
IS3.
2-7
Sept
embe
r 20
03
Tab
le 3
-2.1
:A
mbi
ent
Air
Qua
lity
Stan
dard
s an
d Si
gnif
ican
t Im
pact
Lev
els
Nat
iona
lPS
DE
PA S
igni
fica
nt I
mpa
ct L
evel
Prim
ary
Stan
dard
s 1
Seco
ndar
y St
anda
rds
1St
ate
of W
ashi
ngto
n 1
Cla
ss 1
Cla
ss I
IC
lass
IC
lass
II
Cri
teri
a Po
lluta
nts
Ave
ragi
ngPe
riod
ppm
µg/
m3
ppm
µg/
m3
ppm
µg/
m3
µg/
m3
µg/
m3
µg/
m3
µg/
m3
Tot
al
Sus
pend
edPa
rtic
ulat
ean
nual
----
----
--60
----
----
24-h
our
----
----
--15
0--
----
--Su
lfur
Dio
xide
annu
al0.
0380
----
0.02
522
220
0.1
124
-hou
r0.
1436
5--
--0.
1026
225
910.
25
thre
e-ho
ur0.
14--
0.5
1300
----
2551
21.
025
one-
hour
----
----
0.40
310
502
----
----
PM 1
0an
nual
--50
--50
--50
417
0.2
124
-hou
r--
150
--15
0--
150
830
0.3
5PM
2.5
annu
al--
15--
15--
----
----
--24
-hou
r--
65--
65--
----
----
--C
arbo
n M
onox
ide
eigh
t-ho
ur9
10,0
00--
--9
10,0
002
----
--50
0on
e-ho
ur35
40,0
00--
--35
40,0
002
----
--2,
000
Ozo
neon
e-ho
ur0.
1223
50.
1223
50.
1223
52--
----
--ei
ght-
hour
0.08
176
0.08
176
----
----
----
Nitr
ogen
Dio
xide
annu
al0.
053
100
0.05
310
00.
0510
02.
525
0.1
1L
ead
quar
terl
y--
1.5
--1.
5--
----
----
--So
urce
:W
AC
173
-400
and
40
CFR
52.
21N
otes
:µ
g/m
3=
mic
rogr
ams
per
cubi
c m
eter
ppm
= pa
rts
per
mill
ion
by v
olum
e, d
ry b
asis
1A
nnua
l sta
ndar
ds n
ever
to b
e ex
ceed
ed; s
hort
-ter
m s
tand
ards
not
to b
e ex
ceed
ed m
ore
than
onc
e pe
r ye
ar u
nles
s ot
herw
ise
note
d.2
Val
ues
are
calc
ulat
ed e
quiv
alen
t to
regu
late
d va
lue.
3T
he 0
.40
ppm
sta
ndar
d is
not
to b
e ex
ceed
ed m
ore
than
onc
e pe
r ye
ar

BP Cherry Point Cogeneration Project 3.2 Air QualityDraft EIS 3.2-8 September 2003
Table 3.2-2: Canadian National Ambient Air Quality Objectives and Standards 1
Canada Objectives 2
(µg/m3)BC and GVRD
Objectives 3 (µg/m3)PollutantAveraging
PeriodDesirable Acceptable Level A Level B
Canada-WideStandard(µg/m3)
Sulfur dioxide annual 30 60 25 50 ---24-hour 150 300 160 260 ---
three-hour --- --- 375 665 ---one-hour 450 900 450 900 ---
Total suspended particulate annual 60 70 60 70 ---24-hour --- 120 150 200 ---
Inhalable particulate (PM10) 4 annual --- --- --- 30 ---
24-hour --- --- --- 50 ---Fine particulate (PM2.5)
5,6 24-hour --- --- --- --- 30Carbon monoxide eight-hour 6,000 15,000 5,500 11,000 ---
one-hour 15,000 35,000 14,300 28,000 ---Ozone 24-hour 30 50 --- --- ---
eight-hour 5 --- --- --- --- 127one-hour 100 160 --- --- ---
Nitrogen dioxide annual 60 100 --- --- ---24-hour --- 200 --- --- ---one-hour --- 400 --- --- ---
Total reduced sulfur 24-hour --- --- 3 6 ---one-hour --- --- 7 28 ---
Lead annual --- --- 2 2 ---24-hour --- --- 4 4 ---
Zinc annual --- --- 3 3 ---24-hour --- --- 5 5 ---
Source: GVRD 20021 The tolerable objective is the least strict of the Canadian objectives, so no column is presented in the table showing these
values.2 Federal objective unless otherwise noted.3 British Columbia Provincial objective unless otherwise noted.4 GVRD objective.5 Canada-wide standard to be achieved by year 2010.6 Based on the 98th percentile, average over a three-year period, and established by the Canadian regulatory agencies.
Title III – Prevention of Accidental Releases
Because the cogeneration facility proposes the use of anhydrous ammonia in the SCR emissionscontrol system, the facility could become subject to the Prevention of Accidental Releaseprovisions of the 1990 Clean Air Act Amendment, Section 112. If the proposed cogenerationfacility is subject to these provisions, a Risk Management Plan would be required coveringstorage, handling, and use of ammonia.
3.2.2 Existing Conditions
Climate
The proposed project is in the Puget Sound lowlands, a north-south topographical depressionbordered on the east by the Cascade Mountains and the west by the Olympic Mountains and

BP Cherry Point Cogeneration Project 3.2 Air QualityDraft EIS 3.2-9 September 2003
Vancouver Island. The project site is located in an area known as the Mountain View upland.The climate at the site is influenced by marine air that flows east from the Pacific Ocean andthrough the Straits of Georgia and Juan de Fuca. Occasionally, cold, dry continental air flowsfrom the east-northeast through the Fraser River canyon.
According to data from the BP Cherry Point Refinery’s meteorological seven-year monitoringprogram (1995-2001), the maximum high temperature recorded was 86°F (1998) and the recordlow temperature was 10°F (1996). Over the seven years of monitoring, January and Decemberhad the lowest temperature average of 40°F while July and August had the highest average of60°F. Relative humidity is not measured as part of the BP meteorological measurementsprogram. However, other published data demonstrate the influence of the marine climate at theproject site. Afternoon humidity readings are typically in the 60% range during summer monthsand in the mid- to upper 80% range during winter months (Pacific Northwest River BasinCommission 1968). Higher relative humidity can be expected with the passage of migratorystorm systems from the west. Lower humidity can be expected with high pressure over easternBritish Columbia and eastern Washington.
Predominant winds at the project site are from the south to south-southwest and from the east-northeast. On an annual basis, winds from the south and south-southwest occur with a frequencyof about 24%. Winds from the east or east-northeast occur about 21% of the time, and windsfrom the west to northwest occur about 20% of the time
Dust
The air in the vicinity of the project site is generally free of dust. The area around the site ispredominantly rural, agricultural land with some populated areas within a few miles of the site.The agricultural land is predominantly covered with grass and is used for cattle grazing. Typicalfarming activities, such as soil tilling that create dust clouds, occur infrequently.
Dust-control measures regulated by the Northwest Air Pollution Authority (NWAPA) are aimedat preventing particulate matter from becoming airborne from untreated open areas (NWAPA2003).
Odor
Over the past three years the NWAPA has received several odor-related complaints due to theexisting refinery. A sulfur smell has been the most prevalent complaint, however, local officialswho responded to the complaints have not detected or found any of these odors. Compared toother facilities of this type, the existing refinery has received minimal complaints (Billington,pers. comm., 2003).
BP Cherry Point Cogeneration Project 3.2 Air QualityDraft EIS 3.2-10 September 2003
Existing Air Quality
United States
Based on air quality monitoring information, Ecology and the EPA designate geographic regionsas being in “attainment” or “nonattainment” if the region is in compliance or noncompliancewith air pollutants listed under the NAAQSs (Table 3.2-1). Whatcom County and thesurrounding area are in attainment for all air pollutants regulated by the NAAQS and theWAAQS.
The NWAPA operates monitoring sites for a variety of air pollutants within Whatcom County.Pollutants monitored by or reported to the NWAPA include SO2, PM10, PM2.5 and O3. Data arereported as an air quality index (AQI) where levels are characterized as good, moderate, orunhealthful.
Data from the Lynden-Custer site indicate that no moderate or unhealthful days occurred incalendar year 2001 (all 365 days were in the “good” range). At the more urban Bellingham site,there were no moderate or unhealthful days for PM10 (all 365 days were in the “good” range) andthere were 6 days where the PM2.5 air quality index was in the moderate range. The Lynden-Custer site is representative of a rural “background” area while the Bellingham site isrepresentative of a more mixed urban and rural area, where higher pollution levels are typicallyexpected.
In Bellingham (Yew Street), PM10 is collected continuously by a Rupprecht and PatashnickTEOM 1400 sampler. These data are summarized and reported by the NWAPA. For the yearssummarized, the maximum 24-hour PM10 concentration was 53 micrograms per cubicmeter (µg/m3). According to the three-year data presented, the maximum annual average PM10
concentration in Bellingham was 13.7 µg/m3. In March 1999, this PM10 sampler was moved toits current Yew Street location from its previous location on Iowa Street.
NWAPA has operated a PM2.5 sampler in Bellingham since February 1999 (Yew Street). Thissite is currently co-located with the Bellingham PM10 measurements. The NWAPA also reportsozone data for a Lynden-Custer site. For calendar year 2001, no moderate or unhealthful dayswere experienced (all 365 days were in the “good” range). BP also operates an SO2 monitor atthe refinery. According to the NWAPA data summary for SO2 at Blaine, all 365 days in calendaryear 2001 were in the “good” range.
Air quality monitoring indicates that since 1999 (for PM10, PM2.5) and 2001 (for SO2 and O3), nomoderate or unhealthful days have been recorded in Whatcom County.
Canada
Ambient air quality data have also been summarized by pollutant for the closest ambientmonitoring stations in Canada. The Surrey and Langley sites are the closest sites in Canada to theproject that monitor PM10, CO, NOX, and O3. They are located approximately 16.2-mile to thenorth and northeast, respectively, from the cogeneration project site. The Richmond and

BP Cherry Point Cogeneration Project 3.2 Air QualityDraft EIS 3.2-11 September 2003
Abbotsford sites are the closest sites in Canada that monitor SO2, and they are located 23 miles tothe northwest and 22 miles to the northeast, respectively, from the cogeneration project site. PittMeadows and Vancouver Airport are the closest sites in Canada to the cogeneration project sitethat measure PM2.5, and they are located 24 miles to the north and 27 miles to the northwest,respectively, from the project site. A summary of the ambient monitoring sites is shown inTable 3.2-3.
Table 3.2-3: Ambient Monitoring Stations in Canada
Station Station IDDistance from
Project Site (miles)Direction from
Project SitePollutants Measured
Surrey T15 16.5 N PM10, CO, NO2, O3
Richmond T17 23.1 NW SO2
Pitt Meadows T20 24.5 N PM2.5
Langley T27 16.3 NE PM10, CO, NO2, O3
Vancouver Airport T31 27.0 NW PM2.5
Abbotsford T33 22.3 NE SO2
For the Canadian air quality data, the maximum and 98th percentile concentrations for eachpollutant and averaging time are summarized in Table 3.2-4. Concentrations are listed for 1999through 2001 for the closest two ambient monitoring stations for each pollutant. The maximumvalues of the three years and the two stations are also listed.
Table 3.2-4: Background Concentrations in Canada 1
Ambient Monitoring Station 1 Ambient Monitoring Station 2Pollutant
1999 2000 2001 1999 2000 2001Maximum
Maximum Concentration (µg/m3)SO2 Annual 3 3 3 3 1 3 3
24-hour 11 13 8 5 5 8 133-hour 19 27 16 19 21 13 271-hour 29 35 29 27 27 29 35
PM10 Annual 12 13 12 12 13 12 1324-hour 34 31 35 32 34 33 35
PM2.5 Annual 8 9 5 9 9 5 924-hour 24 22 19 23 29 17 29
CO 8-hour 2,436 1,740 1,624 2,668 1,740 1,508 2,6681-hour 2,900 2,900 2,900 2,900 2,784 4,060 2,900
NOX Annual 23 27 21 17 17 17 2724-hour 69 67 55 52 48 42 691-hour 107 99 90 84 88 73 107
Ozone 24-hour 88 84 76 94 86 82 941-hour 140 138 166 142 134 160 168
1 Ambient Monitoring Station 1 is Surrey for PM10, CO, O3, and NO2, Richmond for SO2, and Pitt Meadows for PM2.5.Ambient Monitoring Station 2 is Langley for PM10, CO, O3, and NO2, Abbotsford for SO2, and Vancouver Airport for PM2.5

BP Cherry Point Cogeneration Project 3.2 Air QualityDraft EIS 3.2-12 September 2003
Table 3.2-4: Continued
Ambient Monitoring Station 1 Ambient Monitoring Station 2Pollutant
1999 2000 2001 1999 2000 2001Maximum
98th Percentile Concentrations for short-term averaging times (µg/m3)SO2 24-hour 5 8 5 5 5 5 8
3-hour 8 11 8 5 8 5 111-hour 21 24 16 19 19 11 24
PM10 24-hour 24 25 25 26 27 24 27PM2.5 24-hour 17 19 15 17 21 15 21CO 8-hour 1,276 1,044 1,044 1,160 1,044 928 1,276
1-hour 1,276 1,160 1,740 1,276 1,160 1,624 1,740NOX 24-hour 50 52 46 34 32 36 52
1-hour 61 69 78 48 46 63 78Ozone 24-hour 72 68 70 76 72 68 76
1-hour 90 88 112 94 88 114 1121 Ambient Monitoring Station 1 is Surrey for PM10, CO, O3, and NO2, Richmond for SO2, and Pitt Meadows for PM2.5.
Ambient Monitoring Station 2 is Langley for PM10, CO, O3, and NO2, Abbotsford for SO2, and Vancouver Airport for PM2.5
Monitoring Stations
The GVRD operates air quality monitoring stations in the Lower Fraser Valley of BritishColumbia. Similar to the United States, Canada’s AQI is a measure derived by the GVRD andLower Fraser Valley Ambient Air Quality Reports. Based on the index criteria, an AQI of lessthan 25 indicates good air quality. An AQI of 26 to 50 represents fair air quality levels. From 51to 100, the AQI level is considered to be poor, and above 101 the air quality is considered to bevery poor.
Air quality classified as good would show that air contaminants are near the background(ambient) levels, in which air quality poses little health risk within the region. Presently, 98% ofthe time air quality is at or below this level. Fair air quality within the region reflects that aircontaminants are relatively low, however, sensitive individuals and ecosystems may haveadverse effects. Currently, air quality is at this level less than 2% of the time. Poor air qualitymay adversely affect humans, animals, water, and vegetation. On average, air quality is at thislevel only for a few hours each year. Finally, very poor air quality can pose significant health andenvironmental risks within the region, leading to immediate government action (GVRD 2003).
Air quality in areas of British Columbia immediately north of the proposed project site ischaracterized in the good range with some hours characterized as fair. To characterize theexisting air quality for areas closest to the U.S./Canada border, the most recent data availablefrom a selection of monitoring stations were evaluated (Surrey, Richmond, Langley, andAbbotsford) and are summarized in Table 3.2-5. Poor and very poor air quality conditions werenot recorded at any of these locations in 2000.

BP Cherry Point Cogeneration Project 3.2 Air QualityDraft EIS 3.2-13 September 2003
Table 3.2-5: GVRD Air Quality Index Data for 2000 1
StationPM10
(24-hour)SO2
(one-hour)CO
(one-hour)O3
(one-hour)NO2
(one-hour)
Total hours per year with an AQI level of goodSurrey 8657 NM 8760 8728 8760Richmond 8476 8760 8760 8748 8760Langley 8557 NM 8760 8720 8760Abbotsford 8525 8760 8760 8741 8760Total hours per year with an AQI level of fairSurrey 103 NM 0 32 0Richmond 284 0 0 12 0Langley 203 NM 0 40 0Abbotsford 235 0 0 19 0Total hours with an AQI level of poor or very poorSurrey 0 NM 0 0 0Richmond 0 0 0 0 0Langley 0 NM 0 0 0Abbotsford 0 0 0 0 0Source: GVRD 2002NM-The criteria pollutant was not monitored at this location.Note: SO2 is not measured at the Surrey and Langley monitoring stations.1 Data for calendar year 2000 are the latest available from GVRD.
Sources of Air Pollution in the Project Area
Existing emission sources in the project vicinity include the adjacent refinery, the Alcoa IntalcoWorks aluminum smelter (approximately 3 miles south-southeast of the project site), theConoco-Phillips Refinery (approximately 5 miles south-southeast), and the Tenaska WashingtonCogeneration power plant (approximately 5 miles to the south-southeast). The NWAPA andEcology regulate all of these sources.
The Applicant issues annual reports to NWAPA and Ecology for review. These documentscontain yearly emission data from the existing facility and are available to the public.
3.2.3 Impacts of the Proposed Action
Construction
Cogeneration Facility
Dust
The use of heavy equipment on the project site during the construction phase would generatedust. Late in the construction process onsite roads and parking areas would be constructed withasphalt over a compacted subbase.

BP Cherry Point Cogeneration Project 3.2 Air QualityDraft EIS 3.2-14 September 2003
Odors
This would be a localized air emission and is not anticipated to produce an impact.
Natural gas will be supplied to the site primarily through the existing refinery connections to theproprietary Ferndale pipeline, which connects to the West Coast Energy Pipeline at theU.S./Canada border near Sumas. If a leak occurs before preventative instrumentation/measuresare conducted, a short-term odor may occur.
Combustion emissions would result from diesel construction equipment, various diesel-fueledtrucks, and the private vehicles of workers commuting to the construction site. All sitepreparation would be completed using conventional methods of construction. Generalconstruction equipment would include, but is not limited to: heavy, medium, and light equipmentsuch as excavators, roller compactors, front end loaders, bulldozers, graders, backhoes, dumptrucks, water trucks, concrete trucks, pump trucks, utility trucks, cranes, and pile drivers.
Refinery Interface, Transmission System, Custer/Intalco Transmission Line No. 2, and OtherProject Components
Construction of the pipelines, transmission lines, and other project components would generateshort-term emissions, including fugitive dust and construction equipment exhaust emissions.Fugitive dust would be controlled by conventional construction practices (e.g., road watering,covering of dirt piles) to comply with state regulations.
Operation and Maintenance
The following section relates to information dealing with the operation and maintenance of theproposed cogeneration facility. All other aspects of the proposed project such as the refineryinterface, transmission system, Custer/Intalco Transmission Line No. 2, and other projectcomponents are not addressed because of the lack of air emissions.
Emission Sources and Emission Controls
The principal sources of emissions from the proposed project during startup and operation wouldoccur from up to three combustion turbines fired by natural gas, and three HRSGs.
Each HRSG would be equipped with low- NOx duct burners and with selective catalyticreduction and oxidation catalyst systems for the removal of NOx and CO, respectively. Steamwill be produced at high pressure in the HRSG and sent to a single STG. For additionalinformation, see Chapter 2.
The three combustion turbines would be equipped with dry low NOx combustors that minimizethe formation of NOx and CO. GE would guarantee exhaust concentrations from the combustiongas turbine of 9 parts per million (ppm) for both NOx and CO. A SCR catalyst bed and ammoniainjection grids for the control of NOx emissions will be installed in the HRSG, as well as acatalytic oxidation bed for the control of CO emissions. Because natural gas is a clean-burning

BP Cherry Point Cogeneration Project 3.2 Air QualityDraft EIS 3.2-15 September 2003
fuel, there would be inherently low amounts of sulfur formed as a result of the combustionprocess. Annual emissions rates for NOx (2.5 ppm) and CO (2.0 ppm) were proposed. Anhydrousammonia would be used in the SCR control system and some unreacted ammonia would exit thefacility stack as ammonia “slip.” However, this ammonia slip would be limited to 5 ppm.
A cooling water system would condense the steam coming from the steam turbine. Coolingwater would itself be cooled within the multi-cell cooling tower. The cooling towers would bedesigned with a very efficient drift elimination system to minimize the formation of PM10. In amechanical-drift cooling tower there is always a certain amount of water in the form of mist(drift) containing dissolved solids that would exit through the cooling tower stacks. As the driftevaporates, the dissolved solids would form particulate, thereby adding to the PM10 emissions.Typically, cooling towers are designed to maintain a drift at 0.008 % of the amount of circulatingwater flow. The proposed project would incorporate ultra-low drift elimination devices in thecooling towers, which would maintain drift at a level of 0.001% of the amount of circulatingwater flow. Only a portion of the drift is particulate matter; the remainder is water, whichevaporates.
The features listed below, which are incorporated into the proposed cogeneration facility,represent BACT:
• Dry low NOx combustion technology on the combustion gas turbines which limits NOx andCO emissions from the combustion gas turbines to 9.0 ppm,
• SCR technology incorporated in the HRSGs that further reduces total NOx emissions to a 2.5ppmvd basis, and
• Oxidation catalyst controls incorporated into the HRSGs that reduce CO emissions to 2.0ppmvd and VOCs reduced by approximately 30% with the application of the CO oxidationcatalyst.
Emissions of Criteria Pollutants
The combustion turbine is an internal combustion turbine with emissions varying with ambienttemperature and load condition. Since turbine operating parameters are directly affected by theambient temperature, the ambient temperatures of 5°F, 50°F, and 85°F are considered in theemission calculations. These temperatures are chosen to represent one winter condition (5°F), anannual average condition (50°F), and one hot summer condition (85°F). Turbine emissions arehigher at lower ambient temperatures. For each of these temperatures, three load conditions areconsidered: 100 (base load), 75, and 50% load. For purposes of establishing the PSD permitemission limits, it is conservatively assumed that the gas turbines will operate 24 hours per day,7 days per week.
The proposed emission units for the cogeneration facility are as follows:
• Three General Electric Frame 7FA combustion turbines (approximately 1,614 mmBtu/hourlower heating value for each turbine at 50°F and base load conditions),
• One diesel-driven emergency generator, about 1,500 kW in size,
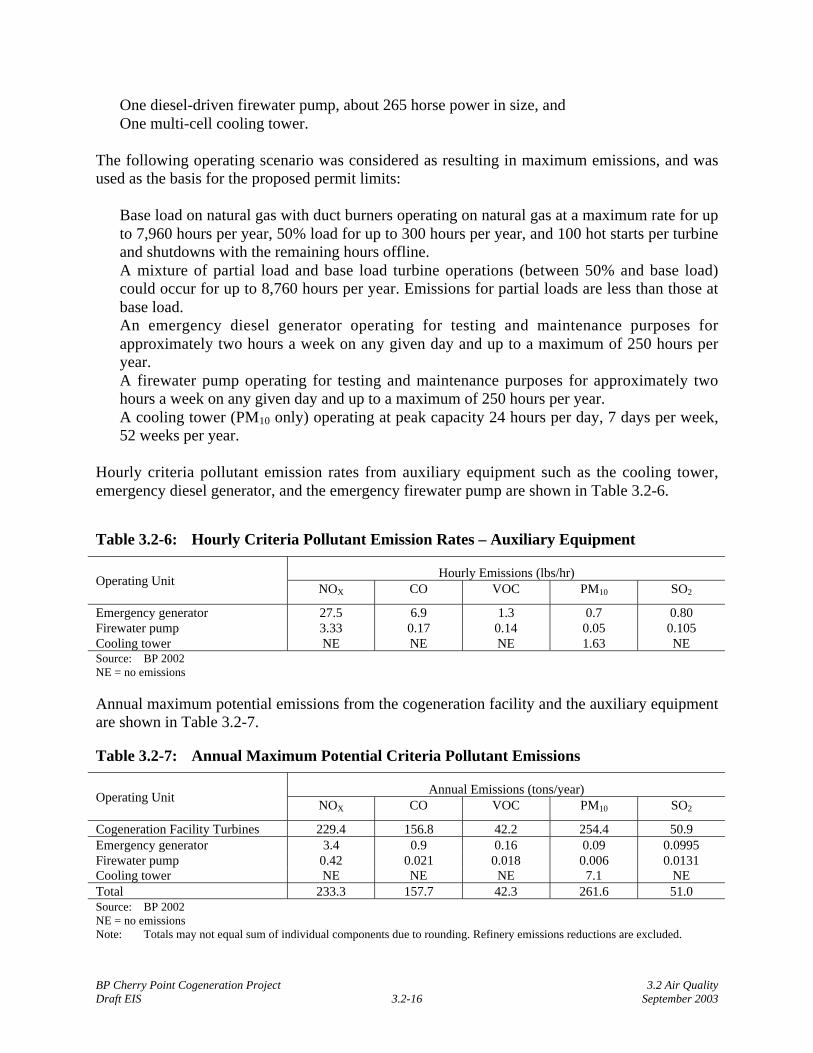
BP Cherry Point Cogeneration Project 3.2 Air QualityDraft EIS 3.2-16 September 2003
• One diesel-driven firewater pump, about 265 horse power in size, and• One multi-cell cooling tower.
The following operating scenario was considered as resulting in maximum emissions, and wasused as the basis for the proposed permit limits:
• Base load on natural gas with duct burners operating on natural gas at a maximum rate for upto 7,960 hours per year, 50% load for up to 300 hours per year, and 100 hot starts per turbineand shutdowns with the remaining hours offline.
• A mixture of partial load and base load turbine operations (between 50% and base load)could occur for up to 8,760 hours per year. Emissions for partial loads are less than those atbase load.
• An emergency diesel generator operating for testing and maintenance purposes forapproximately two hours a week on any given day and up to a maximum of 250 hours peryear.
• A firewater pump operating for testing and maintenance purposes for approximately twohours a week on any given day and up to a maximum of 250 hours per year.
• A cooling tower (PM10 only) operating at peak capacity 24 hours per day, 7 days per week,52 weeks per year.
Hourly criteria pollutant emission rates from auxiliary equipment such as the cooling tower,emergency diesel generator, and the emergency firewater pump are shown in Table 3.2-6.
Table 3.2-6: Hourly Criteria Pollutant Emission Rates – Auxiliary Equipment
Hourly Emissions (lbs/hr)Operating Unit
NOX CO VOC PM10 SO2
Emergency generator 27.5 6.9 1.3 0.7 0.80Firewater pump 3.33 0.17 0.14 0.05 0.105Cooling tower NE NE NE 1.63 NESource: BP 2002NE = no emissions
Annual maximum potential emissions from the cogeneration facility and the auxiliary equipmentare shown in Table 3.2-7.
Table 3.2-7: Annual Maximum Potential Criteria Pollutant Emissions
Annual Emissions (tons/year)Operating Unit
NOX CO VOC PM10 SO2
Cogeneration Facility Turbines 229.4 156.8 42.2 254.4 50.9Emergency generator 3.4 0.9 0.16 0.09 0.0995Firewater pump 0.42 0.021 0.018 0.006 0.0131Cooling tower NE NE NE 7.1 NETotal 233.3 157.7 42.3 261.6 51.0Source: BP 2002NE = no emissionsNote: Totals may not equal sum of individual components due to rounding. Refinery emissions reductions are excluded.

BP Cherry Point Cogeneration Project 3.2 Air QualityDraft EIS 3.2-17 September 2003
PSD Air Quality Impact Assessment
For purposes of the PSD assessments described below, emissions for the cogeneration facilitywere considered without taking into account any emission reductions that would occur at therefinery following removal of existing steam boilers.
PSD regulations require an assessment of the project’s impact on air quality related values(AQRV) in Class I areas. AQRVs include regional visibility or haze; the effects of primary andsecondary pollutants on sensitive plants; the effects of pollutant deposition on soils and waterbodies; and effects associated with secondary aerosol formation. These requirements providespecial protection for Class I areas.
Class I areas within a 124-mile radius of the project site include: North Cascades National Park,Olympic National Park, Glacier Peak Wilderness Area, Alpine Lakes Wilderness Area, andPasayten Wilderness Area. The Mt. Baker Wilderness area was also included for informationalpurposes, even though it is not afforded special protection under the Clean Air Act.
PSD Class II Increment Consumption Analysis
Table 3.2-8 summarizes the maximum concentrations resulting from the cogeneration facility,and locations where these maxima were reached. Except for the Annual SO2 concentration, alllocations are in Whatcom County within 1-mile (or closer) of the site.
Table 3.2-8: Maximum Concentrations 1
Pollutant Averaging Time Conc. (ug/m3) Location
SO2 ANNUAL 0.03 7.5-miles north of project on the US/Canada borderSO2 24-HR 1.0 328-feet north of the project siteSO2 3-HR 5.0 Eastern boundary of the project siteSO2 1-HR 8.7 Eastern boundary of the project site
PM10 ANNUAL 0.25 1 mile north of the project sitePM10 24-HR 4.3 328 feet north of the project sitePM2.5 ANNUAL 0.25 1 mile north of the project sitePM2.5 24-HR 4.3 328 feet north of the project site
CO 8-HR 12.6 Eastern boundary of the project siteCO 1-HR 67.3 Eastern boundary of the project site
NOX ANNUAL 0.60 Northern boundary of the project site1 Not including background concentrations
The maximum modeled concentrations of SO2, NO2, CO, and PM10 including background arebelow the respective SILs (Table 3.2-9). Proposed project generation of these pollutants has aninsignificant impact on Class II increments, so further analysis is not required. In fact, Table 3.2-11 demonstrates that emissions combined with background concentrations are anticipated to bebelow the most stringent regulation for each criteria pollutant analyzed. The project wouldcomply with the PSD Class II increment limits.

BP Cherry Point Cogeneration Project 3.2 Air QualityDraft EIS 3.2-18 September 2003
Local Air Quality Impact Assessment
The assessment of impacts on local and regional ambient air quality from the proposed facilitywas conducted using EPA-approved air quality dispersion models. These models are based onfundamental mathematical descriptions of atmospheric processes in which a pollutant source canbe related to a receptor area. These models evaluated compliance with state and federal ambientair quality standards; SILs; and Class II area increments for NO2 and SO2. The regional impactassessment evaluated potential impacts on Class I areas within about 124 miles of the projectsite, including impacts on visibility, Class I increments for NO2, SO2, and PM10, and impacts onsoil and vegetation from deposition of nitrogen and sulfur compounds.
The Industrial Source Complex (ISC) dispersion model (EPA SCRAM) was used. The modelinganalysis revealed that the project would not significantly affect the ambient air quality of thearea, nor have a significant effect on Class II areas. Table 3.2-9 compares maximumconcentrations to the PSD SIL.
Table 3.2-9: Significant Impact Level Modeling Analysis Results – U.S. Class II Areas1
Pollutant Averaging Period Maximum Concentration2,3 (µg/m3) SIL4 (µg/m3)
Sulfur dioxide annual5,7 0.03 124-hour6,8 4.3 5
three-hour6,8 8.4 25Inhalable particulate (PM10)
3 annual7 0.25 124-hour 4.3 5
Carbon monoxide eight-hour8 50.4 500one-hour8 81.4 2,000
Nitrogen dioxide annual7 0.60 11 All other areas that are not designated as Class I within the State of Washington.2 Highest of all cases for 1995, 1996, 1998, 1999, 2000.3 Excludes the effect of refinery emission reductions.4 Significant impact level for criteria pollutants.5 Value represents a maximum sulfur content in natural gas of 0.8 gr/100 standard cubic feet annual average.6 Value represents a maximum sulfur content in natural gas of 1.6 gr/100 standard cubic feet.7 Based on annual average ambient temperature of 50°F.8 From emergency use of the diesel generator.
Table 3.2-10 shows the results of the long-term criteria pollutant modeling. The maximum long-term (annual average) ground-level concentrations for criteria pollutants (NO2, SO2, and PM10)were modeled using the ISC model.
Background concentrations are the maximum value for each pollutant and averaging time of thetwo nearest representative ambient measuring stations. The predicted concentrations are added tothe maximum background concentrations and compared to the most stringent NAAQS or theWAAQS shown in Table 3.2-1. Table 3.2-11 shows that the total concentration (modeledconcentration plus background concentration) is significantly less than the most stringentstandard for all pollutants analyzed.

BP Cherry Point Cogeneration Project 3.2 Air QualityDraft EIS 3.2-19 September 2003
Table 3.2-10: Significant Impact Level and Modeling Analysis Results - Class I Areas1
Pollutant Averaging Period Maximum Concentration2,3 (µg/m3) SIL 4 (µg/m3)
Sulfur Dioxide annual 0.001 0.124-hour 0.021 0.2
three-hour 0.048 1PM10 annual 0.0054 0.2
24-hour 0.087 0.3Nitrogen dioxide annual 0.0053 0.1
1 Class I areas include North Cascades National Park, Olympic National Park, Glacier Peak Wilderness, Alpine LakesWilderness, and Pasayten Wilderness Area.
2 Highest of 1995, 1996, 1998, 1999, 2000.3 Excludes the effect of refinery emissions reductions.4 Significant impact level for criteria pollutants.
Table 3.2-11: Comparison with Ambient Air Quality Standards
Maximum Concentration (µg/m3)Pollutant
AveragingTime Modeled Background Total
Most Stringent of the State ofWashington Standards or
NAAQS (µg/m3)
annual 0.03 3 3 8024-hour 1.0 13 14 365
three-hour 5.1 27 32 1,300
SO2
one-hour 8.7 35 44 1,065annual 0.25 13 13 50PM10
24-hour 4.3 35 39 150annual 0.25 9 9 15PM2.5
24-hour 4.3 29 33 65eight-hour 12.6 2,668 2,681 10,000COone-hour 67.3 2,900 2,967 40,000
NO2 annual 0.60 27 28 100Source: BP 2002Excludes the effect of refinery emissions reductions.All PM10 was conservatively assumed to be PM2.5.
Pollutant Concentration Effects on Soils and Vegetation
Federal land managers (National Park Service, U.S. Fish and Wildlife, and U.S. Forest Service)have the responsibility of ensuring AQRVs in Class I areas are not adversely affected, regardlessof whether the Class I increments are maintained. In order to protect plant species, the U.S.Forest Service recommends that maximum SO2 concentrations not exceed 40 to 50 parts perbillion (ppb) (105 to 130 µg/m3), and annual SO2 concentrations should not exceed 8 to 12 ppb(21 to 31 µg/m3). For emissions of NO2 (assuming a full conversion from NOx), potential plantdamage would not begin to occur with 24-hour concentrations less than 15 ppb (28 µg/m3).Based on the results of the dispersion modeling analyses, facility emissions are expected to havea negligible effect on soils and vegetation. The proposed project would only combust low-sulfurnatural gas fuel, thus minimizing the emission of sulfur compounds. Also, modeling results showthat the annual maximum annual concentration of NO2 is below 1.0 µg/m3 (about 1.1 ppb).

BP Cherry Point Cogeneration Project 3.2 Air QualityDraft EIS 3.2-20 September 2003
Nitrogen and Sulfur Deposition at Class I Areas
The CALPUFF modeling system was used to estimate the cogeneration facility’s potentialcontribution to total nitrogen and sulfur deposition in Class I areas. Soil, vegetation, and aquaticresources in Class I areas are potentially influenced by nitrogen and sulfur deposition.
A change in visibility of greater than 5% is the threshold (level of concern) used by federal landmanagers to signify that additional analysis may be needed to more fully understand the overallimpacts on visibility. The results of the dispersion modeling for visibility impacts aresummarized in Table 3.2-12. Without the reduced emissions associated with decommissioningthe boilers, the CALPUFF modeling results show that the maximum change in visibility in aClass I area is 6.0%. The maximum visibility change modeled is in Olympic National Park. Onlyone day per year was above 5% in all of the modeled Class I areas.
Regional Haze Assessment
Regional haze is usually quantified using two related indicators. First, the “visual range” is thedistance at which a dark mountain is just perceptible against the sky. The visual range decreasesif the air is polluted. Secondly, the “light extinction coefficient” is used to quantify howpollutants in the atmosphere reduce visual range. Increased light extinction reduces the visualrange. According to federal land managers responsible for protecting air quality in Class I areas,a 5% change in extinction can be used to indicate a “just perceptible” change to landscape and a10% change in extinction coefficient from the “natural” background is considered a significantincremental impact. Section 3.2.6, Cumulative Impacts, contains a more in-depth discussion.
Toxic Air Pollutant Emission Rates
For purposes of the regulatory Toxic Air Pollutant assessments described below, emissions forthe cogeneration facility were considered excluding any emission reductions that would occur atthe refinery following removal of existing steam generation boilers.
This section presents the emission factors and emission rates used in the analysis of toxic airpollutants. The proposed project has the potential to emit small quantities of toxic air pollutantsregulated by Ecology. Formaldehyde, benzene, and other organic compounds associated with thecombustion of fossil fuels would be released. In addition, post-combustion control with SCRresults in ammonia emissions or “slip” that passes through the process unreacted. Ammonia isnot a federal hazardous air pollutant, but it is identified as a Washington State Toxic AirPollutant and along with sulfuric acid would be the highest noncriteria pollutant concentrationemitted from the project.
Emissions of toxic air pollutants would result from the combustion of natural gas in the gasturbines, HRSG duct burners, and auxiliary boiler, as well as from the use of the emergencydiesel generator and diesel fire pump. Emissions were computed for short-term emission rates,and the hourly fuel use of heat input was used to estimate emissions on a pounds per hour basis.For the annual average emission rates (tons per year), total annual fuel use or heat inputs werecomputed and used with the emission factors in estimating the emissions.

BP
Che
rry
Poi
nt C
ogen
erat
ion
Pro
ject
3.2
Air
Qua
lity
Dra
ft E
IS3.
2-21
Sept
embe
r 20
03
Tab
le 3
.2-1
2:A
ir Q
ualit
y M
odel
ing
Res
ults
Ope
ratin
g Sc
enar
ioC
lass
I a
rea
Max
imum
Nitr
ogen
Dep
ositi
on(g
/ha/
yr)
Max
imum
Sulf
urD
epos
ition
(g/h
a/yr
)
Max
imum
Vis
ibili
tyC
hang
e (%
)
Num
ber
ofD
ays
over
5%
Vis
ibili
ty C
hang
ew
hen
Subt
ract
ing
Boi
ler
Em
issi
onR
educ
tions
Oly
mpi
c N
atio
nal P
ark
0.09
0.11
5.5
11.
6N
orth
Cas
cade
s N
atio
nal P
ark
0.44
0.31
2.5
01.
4A
lpin
e L
akes
Wild
erne
ss A
rea
0.56
0.68
3.8
01.
9G
laci
er P
eak
Wild
erne
ss A
rea
0.42
0.32
4.1
01.
8Pa
sayt
en W
ilder
ness
Are
a0.
230.
131.
70
1.0
Nor
mal
ope
ratio
n w
ithou
tdu
ct b
urne
rs o
pera
ting
Mt.
Bak
er W
ilder
ness
Are
a0.
630.
564.
00
2.2
Oly
mpi
c N
atio
nal P
ark
0.09
0.11
5.6
11.
7N
orth
Cas
cade
s N
atio
nal P
ark
0.45
0.31
2.5
01.
4A
lpin
e L
akes
Wild
erne
ss A
rea
0.57
0.70
3.9
02.
0G
laci
er P
eak
Wild
erne
ss A
rea
0.42
0.32
4.2
01.
9Pa
sayt
en W
ilder
ness
Are
a0.
230.
131.
70
1.1
Nor
mal
ope
ratio
n w
ithdu
ct b
urne
rs
Mt.
Bak
er W
ilder
ness
Are
a0.
640.
574.
00
2.3
Oly
mpi
c N
atio
nal P
ark
0.09
0.12
6.0
11.
9N
orth
Cas
cade
s N
atio
nal P
ark
0.47
0.32
2.6
01.
5A
lpin
e L
akes
Wild
erne
ss A
rea
0.60
0.73
4.1
02.
3G
laci
er P
eak
Wild
erne
ss A
rea
0.44
0.34
4.4
02.
1Pa
sayt
en W
ilder
ness
Are
a0.
240.
141.
80
1.2
Ope
ratio
n w
ith d
uct
burn
ers
firi
ng a
t am
axim
um r
ate
Mt.
Bak
er W
ilder
ness
Are
a0.
670.
604.
10
2.3
Max
imum
0.67
0.73
6.0
12.
3N
otes
: Si
gnif
ican
ce le
vel f
or v
isib
ility
cha
nge
is 5
%.
Sign
ific
ance
leve
l for
dep
ositi
on is
5 g
/ha/
yr.

BP Cherry Point Cogeneration Project 3.2 Air QualityDraft EIS 3.2-22 September 2003
Ammonia emissions are based on a 5 ppmvd slip associated with the use of SCR for NOx
control. Sulfuric acid mist emissions depend on the amount of sulfur in the fuel and amount ofsulfur dioxide converted to sulfur trioxide.
The toxic air pollutants and their pollutant class, emission factors, and emission rates for the gasturbines, the emergency diesel generator, and the diesel fire pump are listed in Table 3.2-13. Thetoxic air pollutant classes refer to Class A, for annual-averaged risk-based carcinogens, and ClassB for non-carcinogens.
The proposed project would adopt BACT for toxics for controlling toxic emissions pursuant toChapter 173-460-040 WAC, including the following:
• Use of clean natural gas as the only fuel for the combustion gas turbines and HRSG ductburners which help minimize formation of toxics, and
• Use of an oxidation catalyst unit on each HRSG duct burner that would reduce the emissionsof certain volatile organic toxic compounds.
Modeling Criteria
Air quality dispersion modeling was used to assess compliance with the State of Washington’stoxic air pollutant regulations (Chapter 173-460 WAC). Those toxic air pollutants that areemitted in quantities above the Small Quantity Emissions Rate (SQER) require calculation ofpotential impacts that are then compared with the Acceptable Source Impact Levels (ASILs) toassess compliance. Seventeen compounds were identified as being emitted in amounts greaterthan the small quantity emission rate and required modeling. Depending on the compound, eitherthe 24-hour or annual average concentrations were used for comparison with the ASILs.
Toxic Air Pollutant Analysis
The maximum modeled 24-hour and annual average toxic air pollutant concentrations resultingfrom the proposed facility emissions are compared to the appropriate ASILs in Table 3.2-14. Forall toxic air pollutants evaluated, the maximum modeled concentrations are less than the ASILs.Maximum short-term ammonia and sulfuric acid mist concentrations are also below the 24-hourASIL. Based on these modeling results, the proposed cogeneration facility is not expected tocreate any significant impacts due to its toxic air pollutant emissions.

BP
Che
rry
Poi
nt C
ogen
erat
ion
Pro
ject
3.2
Air
Qua
lity
Dra
ft E
IS3.
2-23
Sept
embe
r 20
03
Tab
le 3
.2-1
3:T
oxic
Com
poun
ds t
hat
Req
uire
Mod
elin
g
Tox
icC
ompo
und
Em
issi
onR
ate
for
thre
eC
ombu
stio
nT
urbi
nes
(lbs
/hr)
Em
issi
onR
ate
for
Em
erge
ncy
Gen
erat
or(l
bs/h
r)
Em
issi
onR
ate
for
Fire
wat
erPu
mp
(lbs
/hr)
Tot
alA
nnua
lE
mis
sion
s(l
bs/y
r)
Tot
alH
ourl
yE
mis
sion
s(l
bs/h
r)
SQE
R(l
bs/y
r)SQ
ER
(lbs
/hr)
ASI
L(µ
g/m
3 )C
lass
A o
r B
Tox
icC
ompo
und
Ace
tald
ehyd
e0.
0210
0.00
039
0.00
1553
184.
80.
023
50N
A0.
45A
Ann
ual
Acr
olei
n0.
0373
0.00
0121
0.00
0187
232
7.1
0.03
817
50.
020.
02B
24-h
rA
mm
onia
139
.50
034
6,24
739
.517
,500
2.0
100
B24
-hr
Ben
zene
0.07
050.
0119
20.
0018
8962
1.4
0.08
420
NA
0.12
AA
nnua
l1,
3-B
utad
iene
0.00
250
0.00
0079
122
.00.
0026
0.5
NA
0.00
36A
Ann
ual
Form
alde
hyde
0.58
760.
0012
10.
0023
95,
148
0.59
20N
A0.
077
AA
nnua
lPA
H0.
0129
0.00
326
0.00
0034
113.
50.
016
NA
NA
0.00
048
AA
nnua
lA
rsen
ic0.
0000
520.
0037
10.
0002
651.
50.
0040
3N
AN
A0.
0002
3A
Ann
ual
Ber
ylliu
m0.
0000
030
00.
030.
0000
03N
AN
A0.
0004
2A
Ann
ual
Cad
miu
m0.
0002
870.
0003
50.
0000
252.
60.
0006
6N
AN
A0.
0005
6A
Ann
ual
Chr
omiu
m0.
0259
0.00
371
0.00
0265
227.
60.
030
175
0.02
1.7
B24
-hr
Cob
alt
0.02
550
022
3.6
0.02
617
50.
020.
33B
24-h
rC
oppe
r10.
0257
00
225.
30.
026
175
0.02
0.3
B24
-hr
Man
gane
se0.
0256
00
224.
20.
026
175
0.02
0.4
B24
-hr
Nic
kel
0.02
600.
0003
50.
0000
2522
8.3
0.02
60.
5N
A0.
0021
AA
nnua
lZ
inc1
0.03
310.
0038
50.
0002
7529
0.7
0.03
717
50.
027
B24
-hr
Sulf
uric
Aci
d18.
10.
2437
0.03
2171
,040
8.38
175
0.02
3.3
B24
-hr
Not
es:
SQE
R =
Sm
all Q
uant
ity E
mis
sion
Rat
eA
SIL
= A
ccep
tabl
e So
urce
Im
pact
Lev
elN
A =
Not
App
licab
leT
he r
esul
ts r
epre
sent
max
imum
em
issi
ons
1N
ot a
n E
PA c
lass
ifie
d ha
zard
ous
air
pollu
tant
.

BP Cherry Point Cogeneration Project 3.2 Air QualityDraft EIS 3.2-24 September 2003
Table 3.2-14: Significant Impact Level Modeling Analysis Results - Toxic Compounds
Maximum Predicted Concentration (µg/m3)4
PollutantAnnual1 24-hr2 ASIL (µg/m3)3 ASIL Exceeded
Acetaldehyde 0.00014 NA 0.45 NoAcrolein NA 0.0027 0.02 NoAmmonia NA 2.8 100 NoBenzene 0.00032 NA 0.12 No1,3-Butadiene 0.00001 NA 0.0036 NoFormaldehyde 0.00237 NA 0.077 NoPAH 0.00007 NA 0.00048 NoArsenic 0.00007 NA 0.00023 NoBeryllium <0.000015 NA 0.00042 NoCadmium 0.00001 NA 0.00056 NoChromium NA 0.0024 1.7 NoCobalt NA 0.0018 0.33 NoCopper NA 0.0018 0.3 NoManganese NA 0.0018 0.4 NoNickel 0.00011 NA 0.0021 NoZinc NA 0.0025 7 NoSulfuric Acid NA 0.57 3.3 No
1 Highest of cases (modeled operating scenarios) 1AB, 1BB, 1CB, 2B, 6B (50°F).2 Highest of all cases (modeled operating scenarios) for 1995, 1996, 1998, 1999, and 2000.3 Acceptable source impact levels.4 Excludes the effect of refinery emissions reductions.5 Impacts are less than the sensitivity of the ISC model of 0.00001 ug/m3
Regional Air Quality Impact Assessment
Short Range Air Quality Impacts in Canada
Concentration analyses for areas in Canada were conducted using methods similar to those usedfor Class II areas in the U.S., as previously described. These analyses excluded any emissionreductions from the refinery resulting from the removal of refinery boilers.
The analyses covered an area into Canada extending 31-miles from the project site (the limit ofthe approved use of the ISC dispersion model), as shown in Figure 3.2-1. The predictedconcentrations are added to the maximum background concentrations provided by Canadianregulatory agencies and compared to the Canadian objectives and standards presented in Table3.2-15. The PM2.5 emissions are not specifically modeled and are conservatively assumed to beequal to the PM10 emissions. In reality, the PM2.5 emissions are a subset of the PM10 emissionsand should, therefore, be lower than reported. The modeled maximum concentration issignificantly less than the background concentration for all pollutants. The total concentration(modeled concentration plus background concentration) is significantly less than the objectivesand standards (Table 3.2-2) for all pollutants.
Table 3.2-16 summarizes the concentrations resulting from the project alone (not includingbackground) reached in Canada. The highest concentrations in Canada were reached 7.5 to 7.8miles north of the project site at the US/Canada border. As discussed above, the maximum

BP Cherry Point Cogeneration Project 3.2 Air QualityDraft EIS 3.2-25 September 2003
modeled concentration (including background) occurs in the US, and is less than both the USstandards and Canadian Objectives. Table 3.2-17 summarizes the concentrations estimated(including background) at the closest monitoring stations in Canada.
Table 3.2-15: Maximum Concentration Modeling Analysis in Canada
Maximum Concentration in Canada (µg/m3)Pollutant
AveragingTime Modeled Background Total
Most Stringent CanadianObjective or Standard
(µg/m3)
annual 0.03 3 3 2524-hour 0.7 16 17 150
three-hour 3.3 27 30 374
SO2
one-hour 5.3 59 64 450annual 0.2 13 13 30PM10
24-hour 2.5 35 38 50PM2.5
1, 2 24-hour 0.9 18 19 30eight-hour 4.8 2,668 2,673 5,500COone-hour 13.6 2,900 2,914 14,300annual 0.2 27 27 60
24-hour 1.6 69 71 200NO2
3
one-hour 16.7 107 124 400Notes: Excludes the effect of refinery emissions reductions.
1 PM2.5 emissions are conservatively assumed to be equal to PM10 emissions.2 The PM2.5 Canada-wide standard is based on the 98th percentile averaged over three years; therefore, the
modeled and background values indicated above are also based on these assumptions.3 NOX is considered to be fully converted to NO2.
Table 3.2-16: Highest Concentrations in Canada
Pollutant Averaging TimeConcentration
(µg/m3)Location
SO2 ANNUAL 0.03 7.5-miles north of project on the US/Canada borderSO2 24-HR 0.7 7.5-miles north of project on the US/Canada borderSO2 3-HR 3.3 7.5-miles north of project on the US/Canada borderSO2 1-HR 5.3 7.5-miles north of project on the US/Canada border
PM10 ANNUAL 0.2 7.5-miles north of project on the US/Canada borderPM10 24-HR 2.5 7.5-miles north of project on the US/Canada borderPM2.5 24-HR 0.9 7.5-miles north of project on the US/Canada border
CO 8-HR 4.8 7.8-miles north of project on the US/Canada borderCO 1-HR 13.6 7.5-miles north of project on the US/Canada border
NOX ANNUAL 0.2 7.5-miles north of project on the US/Canada borderNOX 24-HR 1.6 7.5-miles north of project on the US/Canada borderNOX 1-HR 16.7 7.5-miles north of project on the US/Canada border

BP Cherry Point Cogeneration Project 3.2 Air QualityDraft EIS 3.2-26 September 2003
Table 3.2-17: Ambient Air Monitors Closest to Project Site
PollutantAveraging
TimeConcentration
(µg/m3)Background Concentration
(µg/m3)Total Concentration
(µg/m3)Objective1
(µg/m3)
Concentrations at SurreyPM10 ANNUAL 0.05 13 13.0 30PM10 24-HR 0.50 39 39.5 50NOX ANNUAL 0.04 27 27.0 60NOX 24-HR 0.42 69 69.4 200NOX 1-HR 8.2 107 115 400CO 8-HR 1.1 2436 2437 5500CO 1-HR 3.6 2900 2904 14300
Concentrations at Langley2
PM10 ANNUAL 0.04 13 13.0 30PM10 24-HR 0.36 37 37.4 50
PM2.52 24-HR 0.36 16 16.4 30NOX ANNUAL 0.03 20 20.0 60NOX 24-HR 0.33 52 52.3 200NOX 1-HR 7.8 92 100 400CO 8-HR 0.7 2668 2669 5500CO 1-HR 3.6 4060 4064 14300
Closest SO2 monitors in Canada – Concentrations at RichmondSO2 ANNUAL 0.003 3 3.0 25SO2 24-HR 0.08 13 13.1 150SO2 3-HR 0.34 27 27.3 374SO2 1-HR 0.90 35 35.9 450
Concentrations at AbbotsfordSO2 ANNUAL 0.0014 3 3.0 25SO2 24-HR 0.058 8 8.1 150SO2 3-HR 0.35 21 21.3 374SO2 1-HR 1.04 29 30.0 450
PM2.5 Ambient Air Monitors Closest to Project Site – Concentrations at Pitt Meadows3
PM2.5 ANNUAL 0.029 9 9.0 NAPM2.5 24-HR 0.30 19 19.3 30
Concentrations at Vancouver AirportPM2.5 ANNUAL 0.016 9 9.0 NAPM2.5 24-HR 0.17 18 18.2 30
Notes: 1 Most Stringent Canadian Objective or Standard2 A PM2.5 monitor was added at Langley in 2002.3 PM2.5 background and total concentration are based on the 98th percentile
Air Quality Visibility Analysis in Canada
The visibility analyses for Canadian areas were conducted using methods similar to those usedfor Class I areas in the U.S., and excluded any effects of refinery emission reductions. Theanalyses were conducted along seven lines of sight recommended by the GVRD (listed inTable 3.2-18). The visibility extinction was averaged along each line of sight to achieve a day-by-day account of whether visibility is impaired with and without the impacts from the proposedproject. The maximum visibility change because of emissions from the proposed project was alsocalculated.

BP Cherry Point Cogeneration Project 3.2 Air QualityDraft EIS 3.2-27 September 2003
The results of the Canada visibility analyses are summarized in Table 3.2-19. A visual range ofless than 37 miles was used to determine impaired visibility. As shown in this table, impactsfrom the proposed project would not increase the number of days with impaired visibility at anyof the seven specified lines of sight. A visibility analysis threshold has not been established byCanadian agencies. For purposes of this analysis, the threshold established by the U.S. federalland managers was used. According to the federal land managers, a greater than 5% change invisibility will evoke a noticeable change in most landscapes. The results of the visibility analysisin Canada show that the maximum visibility change is only 2.7%, which is significantly belowthe 5% threshold.
Table 3.2-18: Lines of Sight Evaluated for Visibility Analysis in Canada
Line of Sight Observer Location Direction and Target
1 Victoria East-northeast to Mount Baker2 White Rock East-southeast to Mount Baker3 Tsawassen East-southeast to Mount Baker4 Vancouver North to North Shore Mountains (The Lions)5 Langley North to North Shore Mountains (Golden Ears)6 Chilliwack East to Mount Cheam7 Abbotsford Southeast to Mount Baker
Table 3.2-19: Results of Visibility Analysis in Canada
Line ofSight
Number of Days with ImpairedVisibility, Background Conditions1
Additional Days with ImpairedVisibility from Cogeneration Facility
Maximum VisibilityChange
1 171 0 1.2%2 166 0 2.4%3 166 0 2.1%4 166 0 2.2%5 166 0 2.7%6 166 0 1.5%7 166 0 1.4%
1 Impaired visibility is defined as those days with a visibility range of less than 37-miles. Excludes the effect of refineryemissions reductions.
Regional Impacts of Concurrent Emissions Reductions at the Refinery
State regulatory air permitting requirements require that the maximum potential emissionsexpected from the cogeneration facility be used for permitting purposes. The analyses presentedabove are based on the maximum potential emissions. However, in order to characterize ascenario of more probable long range impacts to the region, the Applicant has estimated what theactual emissions from the cogeneration facility are likely to be. This estimate is based on thefollowing assumptions, described in more detail below:
• Refinery emissions would decrease because of the removal of existing utility boilers thatwould no longer be needed once steam was purchased from the cogeneration facility;

BP Cherry Point Cogeneration Project 3.2 Air QualityDraft EIS 3.2-28 September 2003
• A more realistic actual operating scenario would lead to actual emissions lower than themaximum potential emissions required by regulatory analyses;
• Actual particulate emissions would be lower than those measured at the stacks by therequired EPA reference methods; and
• Recent information indicates that long range secondary particulate formation would bereduced due to NOx emission reductions at the refinery.
The overall emissions reductions estimated by the Applicant are summarized in Table 3.2-20.
Table 3.2-20: Overall Emission Reductions Estimated by the Applicant
Expected Annual Reductions (tpy) NOx CO VOC PM10 SO2
Estimated Actual Emissions from the Cogeneration Facility 181 81 28 94 50Refinery Emission Reductions Through Utility Boiler Removal -499 -54 -3 -10 -7Net Regional Change in Emissions -318 27 25 -84 43Changes in Secondary Emissions from Cogeneration Facility and
Refinery Boiler Removal105 0 0 -96 -9
Net Regional Emission Changes -213 27 25 -12 34Source: BP 2002
Refinery Emission Reductions due to removal of Refinery Steam Boilers
Emissions of criteria pollutants from the proposed cogeneration facility would be offset byreductions in emissions from the refinery. These reductions would occur because thecogeneration facility would provide steam to the refinery, which would allow the refinery todiscontinue the utility boilers currently in use. This would also allow the refinery to reduce itsuse of gas-fired heaters. Table 3.2-21 summarizes the possible refinery emission reductions ifsteam produced by the cogeneration project replaces steam currently produced by refineryboilers. A consequence of cogeneration is the reduction in steam production inside the refineryand an associated reduction in the criteria pollutant emissions. All emission reductions are basedon the reduction in steam production in the refinery. After the cogeneration project beginssupplying steam to the refinery, the refinery utility boilers would be shut down and would nolonger produce emissions.
It should be noted that new boilers are being planned for the Clean Fuels project but they will beshut down when the cogeneration facility is operating. Some backup boiler capability would stillbe required at the refinery when the cogeneration facility is not operating.
Table 3.2-21: Refinery Emission Reductions
Expected Annual Reductions (tpy) NOx CO VOC PM10 SO2
Refinery emission reductions -499 -54 -3 -10 -7Source: BP 2002
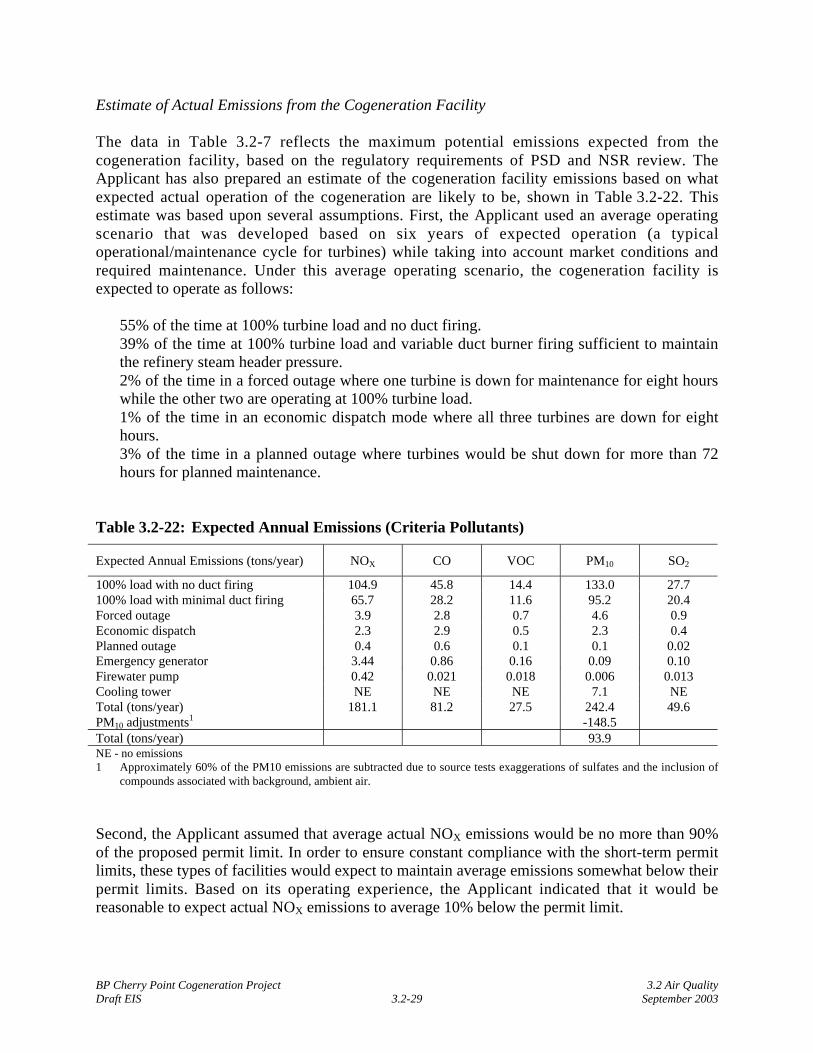
BP Cherry Point Cogeneration Project 3.2 Air QualityDraft EIS 3.2-29 September 2003
Estimate of Actual Emissions from the Cogeneration Facility
The data in Table 3.2-7 reflects the maximum potential emissions expected from thecogeneration facility, based on the regulatory requirements of PSD and NSR review. TheApplicant has also prepared an estimate of the cogeneration facility emissions based on whatexpected actual operation of the cogeneration are likely to be, shown in Table 3.2-22. Thisestimate was based upon several assumptions. First, the Applicant used an average operatingscenario that was developed based on six years of expected operation (a typicaloperational/maintenance cycle for turbines) while taking into account market conditions andrequired maintenance. Under this average operating scenario, the cogeneration facility isexpected to operate as follows:
• 55% of the time at 100% turbine load and no duct firing.• 39% of the time at 100% turbine load and variable duct burner firing sufficient to maintain
the refinery steam header pressure.• 2% of the time in a forced outage where one turbine is down for maintenance for eight hours
while the other two are operating at 100% turbine load.• 1% of the time in an economic dispatch mode where all three turbines are down for eight
hours.• 3% of the time in a planned outage where turbines would be shut down for more than 72
hours for planned maintenance.
Table 3.2-22: Expected Annual Emissions (Criteria Pollutants)
Expected Annual Emissions (tons/year) NOX CO VOC PM10 SO2
100% load with no duct firing 104.9 45.8 14.4 133.0 27.7100% load with minimal duct firing 65.7 28.2 11.6 95.2 20.4Forced outage 3.9 2.8 0.7 4.6 0.9Economic dispatch 2.3 2.9 0.5 2.3 0.4Planned outage 0.4 0.6 0.1 0.1 0.02Emergency generator 3.44 0.86 0.16 0.09 0.10Firewater pump 0.42 0.021 0.018 0.006 0.013Cooling tower NE NE NE 7.1 NETotal (tons/year) 181.1 81.2 27.5 242.4 49.6PM10 adjustments1 -148.5Total (tons/year) 93.9NE - no emissions1 Approximately 60% of the PM10 emissions are subtracted due to source tests exaggerations of sulfates and the inclusion of
compounds associated with background, ambient air.
Second, the Applicant assumed that average actual NOX emissions would be no more than 90%of the proposed permit limit. In order to ensure constant compliance with the short-term permitlimits, these types of facilities would expect to maintain average emissions somewhat below theirpermit limits. Based on its operating experience, the Applicant indicated that it would bereasonable to expect actual NOX emissions to average 10% below the permit limit.

BP Cherry Point Cogeneration Project 3.2 Air QualityDraft EIS 3.2-30 September 2003
Third, the Applicant assumed that average actual CO emissions would be no more than 80% ofthe proposed permit limit in order to ensure constant compliance with the short-term permitlimits. Since oxidation catalyst performance is more efficient when new and degrades over time,it is reasonable to expect that the CO concentration will be very low initially and then increaseover time. The long-term average CO concentration will always be below the permit limit.
Finally, the Applicant assumed that the project's actual PM10 emissions would be approximately60% below the proposed permit limit due to source test exaggeration of sulfates and theinclusion of compounds associated with background air. The Applicant based these assumptionson research that has been conducted in an effort to determine the source and type of theparticulate matter in the exhaust gas and to determine whether the EPA test method is accurate(England and Wien 2002).
This research shows that up to 90% of the particulate reported by this test method (EPA MethodPRE-4/202) in exhaust from natural gas-fueled combustion turbines is condensable particulate.Of this condensable particulate, about 90% is inorganic and comprised of sulfates, chlorides,ammonia, sodium, and calcium.
This research also shows that the EPA test method significantly exaggerates PM10 emissions. Byfar, the largest source of error in the EPA test method is generated by condensable particulatemeasured by the test. SO2 gas, a constituent of the stack gas, is drawn into the test apparatus. Asexpected of a gas, SO2 passes through the filterable portion of the test apparatus and into an icewater bath, where it is “bubbled” through the cold water. The SO2 dissolves in the cold water.Since gas turbines operate with a large excess of oxygen, oxygen is also dissolved in the coldwater. During the testing, virtually all of the SO2 is slowly oxidized to form sulfate (SO4.), whichis measured as a particulate. This results in the test method significantly overestimating theparticulate emissions because, during normal operation, only a relatively small portion of theSO2 in the exhaust would form SO4 in the stack.
The test method also overstates the particulate emissions by including particulate already presentin the ambient air. This particulate matter was identified in the research as sodium, chloride, andcalcium.
The study concludes that the EPA test method suffers from measurement error due to the smallamount of particulate sample collected from the gas turbine exhaust. The EPA method wasintended to collect samples over a one-hour period, however, the research shows that gas turbinetests must be run for up to six hours to collect enough material.
Based on the information contained in the GE and Sierra Research studies, the actual particulateemissions from the facility are expected to be at least 60% less than the particulate emissionsmeasured by the EPA reference method test.

BP Cherry Point Cogeneration Project 3.2 Air QualityDraft EIS 3.2-31 September 2003
Secondary Particulate
The Applicant also considered secondary particulate in the overall particulate emissions balance.The projected annual emissions shown in Table 3.2-22 are based only on in-stack emission orprimary emissions.
One to two days after leaving the stack, a portion of the NO2 and SO2 emitted from the stack asgas eventually combines with ammonia in the atmosphere to from particles of ammonium nitrateand ammonium sulfate. These newly formed compounds are called secondary particulatebecause they are formed in the atmosphere outside of the stack.
The amount of NO2 and SO2 converted to particulate is dependent on a number of atmosphericfactors, including time, temperature, and moisture. In the following analysis, the 33% of NO2 isconverted to ammonium nitrate and 20% of SO2 is converted to ammonium sulfate. Theconversion factors used for this analysis are consistent with the CALPUFF model conversionfactors and published articles (Stockwell 2000).
As shown in Table 3.2-23, changes in secondary particulate emissions would occur from twosources: frist, NOx and SO2 emitted by the Cogeneration Facility would produce secondaryparticulate emissions; second, reductions of NOx emissions from the Refinery through removalof the utility boilers would lead to a reduction of refinery secondary particulate emissions. Whenboth of these secondary particulate emission changes are taken into account, the proposed projectwould result in an overall regional reduction of NOx and particulate, as shown in Table 3.2-20.
Impacts on Class I Visibility Analyses from Refinery Emission Reductions
The Applicant performed additional modeling for the Class I visibility analysis to account forsome of the reduction in emissions resulting from removal of the utility boilers at the refinery.The results of this revised dispersion modeling for visibility impacts are summarized inTable 3.2-24. The maximum visibility change, when subtracting the emissions for the threeutility boilers, is 2.3%, and the number of days of impact to the Olympic Regional Park isreduced to zero.
Table 3.2-23: Secondary Particulate Emission Balance
Expected Annual Emissions (tons/yr) NOx CO VOC PM10 SO2
Total from Cogeneration 181 81 28 94 50Secondary PM formed by Cogen NOx and SO2 -60 0 0 70 -10Cogen Emissions After Secondary PM Formation 121 81 28 164 40Refinery Emission Reductions through utility boiler removal -499 -54 -3 -10 -7Secondary PM Avoided by Refinery Reductions 165 0 0 -166 1Refinery Emission Reductions After Secondary PM Formation -334 -54 -3 -176 -6Changes in Secondary emissions from Cogen and removal of
Refinery boilers105 0 0 -96 -9
Source: BP 2002Note: These balances assume that no molecular weight change occurs upon formation of secondary particulate matter. This is
a conservative approach for calculating reduction in PM.

BP Cherry Point Cogeneration Project 3.2 Air QualityDraft EIS 3.2-32 September 2003
Table 3.2-24: Air Quality Related Values Modeling Analysis Results Including RefineryEmissions Reductions
Operating Scenario Class I areaVisibility Change when
Subtracting Boiler EmissionReductions
Number of Daysover 5%
Olympic National Park 1.6 0North Cascades National Park 1.4 0Alpine Lakes Wilderness Area 1.9 0Glacier Peak Wilderness Area 1.8 0Pasayten Wilderness Area 1.0 0
Normal operation withoutduct burners operating
Mt. Baker Wilderness Area 2.2 0Olympic National Park 1.7 0North Cascades National Park 1.4 0Alpine Lakes Wilderness Area 2.0 0Glacier Peak Wilderness Area 1.9 0Pasayten Wilderness Area 1.1 0
Normal operation withduct burners
Mt. Baker Wilderness Area 2.3 0Olympic National Park 1.9 0North Cascades National Park 1.5 0Alpine Lakes Wilderness Area 2.3 0Glacier Peak Wilderness Area 2.1 0Pasayten Wilderness Area 1.2 0
Operation with ductburners firing at amaximum rate
Mt. Baker Wilderness Area 2.3 0Maximum 2.3 0Notes: Significance level for visibility change is 5%.
Significance level for deposition is 5 g/ha/yr.
Dust
Onsite roads and parking areas would be constructed with asphalt over a compacted subbase.These roads would be paved to minimize the potential for fugitive dust emissions from vehicletraffic. Significant quantities of dust would not be generated during operation of the proposedfacility.
Odors
Operation of the proposed facility is not anticipated to create any nuisance odors. Natural gasmay be odorized, but it would be contained within the natural gas pipeline and cogenerationfacility piping system up to the point of use in the combustion gas turbines and HRSGs where itwould be combusted.
Anhydrous ammonia would be used in the SCR system as a reaction agent for the control ofNOX emissions. Unreacted ammonia would be present in the HRSG exhaust gas flow. Ammoniais commonly perceived as having an odor (e.g., household cleaners). However, based on thequantity to be released through the HRSG stack, ammonia odor is not expected to be detectable.In fact, the dispersion modeling conducted for ammonia at a rate of 5 ppm (a maximum of13.2 lbs/hour per turbine and about 173 tons/year total) from the HRSG stacks indicates that thepublic exposure to ammonia (approximately 2.8 g/m3 or 0.004 ppm) would be well below the

BP Cherry Point Cogeneration Project 3.2 Air QualityDraft EIS 3.2-33 September 2003
range of detection (5 to 53 ppm) (Clayton 1993). Ammonia emissions would be limited to a 24-hour average of no more than 5 ppm at 15% O2. Relative to the public health exposure ofammonia, the maximum projected ground-level impact of the ammonia emissions, based on the5 ppm level, is about 3% of the 100 µg/m3 24-hour health-based standard identified inWAC 173-460.
Cooling Tower Steam Plume Fogging and Icing
In cold weather, a cooling tower plume would typically persist until the air exiting the coolingtower sufficiently mixes with the surrounding cooler, drier air. If the plume returns to groundlevel prior to dissipating, it can cause localized fogging or icing of downwind structures androadways.
Downwind impacts caused by water vapor and water droplets from the cooling towers weremodeled by the Applicant using the Seasonal/Annual Cooling Tower Impact Program (SACTIP)computer model. SACTIP calculates the occurrence of elevated visible water plumes and saltdeposition, and ground-level fogging and icing. The model simulates downwind dispersion of thesteam plumes based on wind data from the local meteorological station and relative humiditydata.
The objective of this study was to determine if the cooling tower would contribute to foggingand/or icing on Grandview Road on the north side of the project boundary. The analysis showsthat fogging may occur for a total of 2.5 hours a year in the northeast or northwest directions.The area affected by fogging extends from 655 to 1640 feet from the center of the cooling tower.Grandview Road is approximately 1,312-feet in these directions and, therefore, may be affectedby the edge of the plume for these few hours of the year.
In order for roadway icing to occur, the cooling tower plume needs to touch down on the roadsurface, the plume must become condensed, and the temperature of the road surface must bebelow freezing. However, due to the infrequent occurrence of these conditions, if icing were tooccur it would be of short duration.
3.2.4 Impacts of No Action
Under this alternative, existing natural-gas-fired power plants would be more likely to continueoperations. No new hydroelectric generating capacity is being added, and the development ofnuclear power plants has been halted. Wind and solar power do not have the generatingavailability needed to meet continuous electricity demand. Fuel cell technologies are beingdeveloped, but remain relatively small and expensive. Natural-gas-fired combined-cyclecombustion turbine plants would meet the increasing demand for electricity generation. If theproposed cogeneration facility were not built and operated, the refinery and others in the regionwould use electricity produced by existing sources of generation and new gas-fired combined-cycle power plants.

BP Cherry Point Cogeneration Project 3.2 Air QualityDraft EIS 3.2-34 September 2003
3.2.5 Greenhouse Gas
Overview
The issue of how emissions from human activities might affect global climate has been thesubject of extensive international research over the past several decades. There is now a broadconsensus among atmospheric scientists that emissions caused by humans are resulting in a risein global temperatures, although there is still uncertainty about the magnitude of future impactsand the best approach to mitigate the impacts. Two sets of key research documents have recentlybeen published.
The United Nations Intergovernmental Panel on Climate Change (IPCC) published its mostrecent set of five-year progress reports summarizing worldwide research on global warming(IPCC 2001). These reports indicated that some level of global warming related to humanactivity is likely to occur and that there is a significant possibility of severe environmentalimpacts. Several alternative measures were evaluated to achieve the emission reductionsspecified by the Kyoto Protocol.
President Bush requested the National Academy of Sciences to provide a brief comprehensivereview of the IPCC reports (National Academy of Sciences 2001). The review panel includedatmospheric scientists with a range of opinions on future global warming. The NationalAcademy of Sciences review was written in lay terms and focused on addressing severalfundamental issues. The panel concurred with most of the findings by the IPCC.
Regulatory Framework
Currently, there are no international, national, Washington State, or local regulations that setnumerical limits on greenhouse gas emissions, however the Kyoto Protocol has been establishedand is discussed below. Within the State of Washington, rules relating to siting energy facilities(WAC 463-42-225, Proposal-emission control) requires an Applicant to demonstrate that highestand best practicable treatment for control of emissions is used for a number of air pollutants,including CO2. The Washington regulation does not specify how “highest and best practicabletreatment” for CO2 is to be quantified.
Several jurisdictions in the Pacific Northwest have committed to, or require, the mitigation ofgreenhouse gas emissions, for example:
• The State of Oregon’s target is a 17% reduction compared to the most efficient power plantoperating in the United States.
• Seattle City Light’s greenhouse gas program cites a target of 100% elimination of net futureincreases of greenhouse gas emissions from all new fossil fuel generating stations added tothe city’s generating mix (Seattle City Light 2001).
• BC Hydro plans to contract with third-party organizations to procure offsite greenhouse gasprojects to offset 50% of the increase in greenhouse gas emissions from two new natural-gasfired electrical generating stations on Vancouver Island, up through the year 2010 (BC Hydro2001). The year 2010 was specified in the Kyoto Protocol as the date upon which signatory

BP Cherry Point Cogeneration Project 3.2 Air QualityDraft EIS 3.2-35 September 2003
nations must reduce their greenhouse gas emissions. Presumably, new emission reductionprograms enacted in response to the Kyoto Protocol (or similar rules) would take effect afterBC Hydro’s voluntary offset program expired in 2010.
In Washington State, four approved thermal power projects under EFSEC jurisdiction arerequired to mitigate greenhouse gas emissions, as follows:
• The Chehalis Power Project is must aquire greenhouse gas offsets for up to 8% of the overallemissions; Chehalis Power would acquire offsets on a ton-for-ton basis from a recognizedsupplier, such as the Climate Trust, or by participating directly in greenhouse gas mitigationprojects;
• The Sumas Energy 2 Generation Facility is required to mitigate CO2 emissions according tothe monetary path of the Oregon Energy Facility Siting Council, at $0.57 per ton of carbondioxide, based on a 30-year operating life, with no surcharge for administrative expenses; theapproximate $8.04 million payment would be made in five annual installments starting at thetime the facility begins to operate.
• The Satsop Combustion Turbine Project is required to mitigate CO2 emissions from thefacility that exceed 0.675 lb/kWh, at a rate of $0.57 per ton of CO2 to be mitigated basedupon the facility’s maximum potential emissions, and adjusted annually according to theProducer Price Index; 7.5% administrative costs would be paid in addition to the per tonmitigation fee; payments would be made annually for the first 30 years in which the facilityoperates.
• The Wallula Power Project is required to implement a “Greenhouse Gas, EnvironmentalMitigation Enhancement Package” which includes payment of approximately $6.0 million tonon profit and tribal organizations committed to the development of renewable energyresources and projects, and/or preservation and restoration of fish and wildlife habitat andother environmental programs benefiting the Walla Walla region.
Project Greenhouse Gas Emissions
The significant portion of greenhouse gas emissions generated by the project would result fromthe combustion of natural gas, a fossil fuel in the Cogeneration facility. For purposes ofevaluating greenhouse gas emissions, the combustion efficiency of the proposal is quantified bythe CO2 emission factor, with units of pounds of CO2 emitted per kilowatt-hour of electricityproduced. Table 3.2-25 lists the CO2 emission factors for typical fossil-fueled generating stationsoperating today. As shown in the table, combined cycle combustion turbines emit much less CO2
than other types of fossil-fuel power plants. The estimated overall CO2 emission factor for theproposed cogeneration facility is 0.83 pound per kilowatt-hour (lbs per kWhr).
Assuming an 85% capacity factor for the plant, the estimated annual CO2 emissions from thecogeneration facility would be 2.2 million tons per year. Fugitive leaks of natural gas from thesystems serving the proposed cogeneration facility are estimated to emit methane equivalent to12% of the project’s stack emissions of greenhouse gas (U.S. Department of Energy 2000b). Theestimated greenhouse gas emissions generated by leaks from the supply pipelines serving the BPCogeneration project would be 13,000 tons of methane per year.
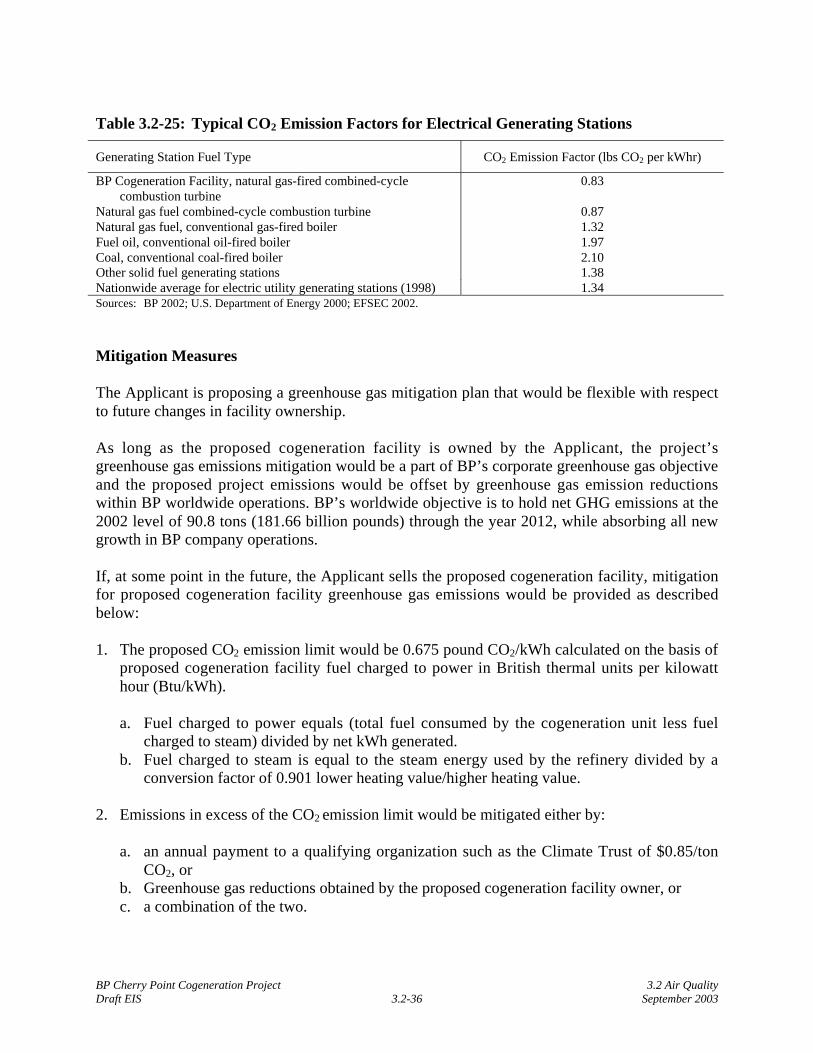
BP Cherry Point Cogeneration Project 3.2 Air QualityDraft EIS 3.2-36 September 2003
Table 3.2-25: Typical CO2 Emission Factors for Electrical Generating Stations
Generating Station Fuel Type CO2 Emission Factor (lbs CO2 per kWhr)
BP Cogeneration Facility, natural gas-fired combined-cyclecombustion turbine
0.83
Natural gas fuel combined-cycle combustion turbine 0.87Natural gas fuel, conventional gas-fired boiler 1.32Fuel oil, conventional oil-fired boiler 1.97Coal, conventional coal-fired boiler 2.10Other solid fuel generating stations 1.38Nationwide average for electric utility generating stations (1998) 1.34Sources: BP 2002; U.S. Department of Energy 2000; EFSEC 2002.
Mitigation Measures
The Applicant is proposing a greenhouse gas mitigation plan that would be flexible with respectto future changes in facility ownership.
As long as the proposed cogeneration facility is owned by the Applicant, the project’sgreenhouse gas emissions mitigation would be a part of BP’s corporate greenhouse gas objectiveand the proposed project emissions would be offset by greenhouse gas emission reductionswithin BP worldwide operations. BP’s worldwide objective is to hold net GHG emissions at the2002 level of 90.8 tons (181.66 billion pounds) through the year 2012, while absorbing all newgrowth in BP company operations.
If, at some point in the future, the Applicant sells the proposed cogeneration facility, mitigationfor proposed cogeneration facility greenhouse gas emissions would be provided as describedbelow:
1. The proposed CO2 emission limit would be 0.675 pound CO2/kWh calculated on the basis ofproposed cogeneration facility fuel charged to power in British thermal units per kilowatthour (Btu/kWh).
a. Fuel charged to power equals (total fuel consumed by the cogeneration unit less fuelcharged to steam) divided by net kWh generated.
b. Fuel charged to steam is equal to the steam energy used by the refinery divided by aconversion factor of 0.901 lower heating value/higher heating value.
2. Emissions in excess of the CO2 emission limit would be mitigated either by:
a. an annual payment to a qualifying organization such as the Climate Trust of $0.85/tonCO2, or
b. Greenhouse gas reductions obtained by the proposed cogeneration facility owner, orc. a combination of the two.

BP Cherry Point Cogeneration Project 3.2 Air QualityDraft EIS 3.2-37 September 2003
3. Mitigation would be satisfied annually for 30 years, which is the assumed economic life ofthe project. Mitigation would be reported to EFSEC annually.
3.2.6 Secondary and Cumulative Impacts
Cumulative Impact of Refinery and Cogeneration Facility Reductions
In combination with the removal of refinery utlility boilers, the proposed cogeneration facilitywould result in an overall reduction in ambient concentrations of PM10. These values representthe modeled impact of primary PM10 emissions. Removal of the refinery boilers resulting fromsteam purchase from the cogeneration facility would significantly reduce NOx emissions fromthe refinery, and would consequently also reduce secondary particulate in the airshed. Thereduction in secondary particulate is expected to be greater than the increase in primaryparticulate emissions.
Bonneville Regional Air Quality Modeling Studies
In response to the regional boom in energy facility proposals which occurred in 2001-2002, andin order to address the cumulative impacts of the large number of proposals requestinginterconnection with the federal transmission system, Bonneville initiated a Regional Air ImpactAnalysis to evaluate the impact of these facilities on airsheds in the pacific northwest.(Bonneville 2001a, 2001b, 2001c).
This study examines the potential contribution of the BP Cherry Point Project to regional haze inClass I areas within the Bonneville Service Area, the Columbia River Gorge National ScenicArea (CRGNSA), and the Mt. Baker Wilderness. Regional haze impacts are assessed followingthe techniques used in the Phase I study conducted by Bonneville. Bonneville’s Phase I studyexamined potential air quality impacts associated with over 40 recently proposed power projectsin the area. Based on the results of the Regional Air Quality Modeling Study, Bonneville is nowexamining potential cumulative regional haze impacts on a case-by-case basis for each newproject before issuing a Record of Decision (ROD). Since it is unlikely all the proposed powerplants will be built, the analysis investigates the cumulative impacts from a Baseline SourceGroup consisting of projects that have already been issued a ROD, other recently permittedpower projects not requesting access to Bonneville’s transmission grid but within the area,facilities well along in their permitting process, and the facility being considered for a ROD. Theremainder of this section describes the Baseline Source Group, provides an overview of thedispersion modeling approach, presents the results of a cumulative analysis for the BaselineSource Group, and discusses the potential contribution of the BP Cherry Point Project to regionalhaze.
Phase I examined three scenarios regarding the number of future power plants to be operated inthe region:
• A worst-case scenario in which a total of 45 new power plants were built and operatedsimultaneously at their rated capacity using their primary fuel for a total of more than 24,000MW;

BP Cherry Point Cogeneration Project 3.2 Air QualityDraft EIS 3.2-38 September 2003
• A second scenario with 28 new power plants, totaling a little over 11,000 MW operatedsimultaneously by 2004; and
• A third scenario with 15 new power plants totaling 7,000 MW by 2004, which is the mostlikely scenario in the next 10 years based on projection of need for new energy.
Phase II attempted to model the individual contribution of each new plant to the overallcumulative impact. The Phase II analysis for the proposed cogeneration facility is essentially thesame as the 7,000 MW scenario from Phase I.
Modeling Overview of Phase I
The dispersion modeling techniques used in the study are as follows:
• The study looked at two scenarios: (1) air impacts that would accrue if 28 of the projectswere built and energized by 2004, and (2) air impacts that would occur if all 45 projects werebuilt as planned and operated simultaneously.
• NOx, PM10, and SO2 emissions from 45 proposed power projects with a combined capacity ofmore than 24,000 MW were considered in the analysis.
• The study evaluated impacts on 16 Class I/Scenic/Wilderness Areas (three National Parks,the Spokane Indian Reservation, and 12 wilderness areas), CRGNSA, and the Mt. BakerWilderness Area.
• PM10 concentrations include both primary and secondary aerosols, and the nitrogendeposition estimates include the ammonium ion.
Areas Showing Greatest Impact
Results showed that the greatest air quality impacts would occur in the Puget Sound lowlandsfrom Centralia to Bellingham, in the Hermiston area, and in the eastern portions of the LowerColumbia River Basin.
Class II Significant Impact Levels Not Exceeded
With the exception of two receptors, predicted concentrations from the proposed power plantsare less than the SILs for all pollutants and averaging periods. The peak PM10 concentrationoccurred near the Wallula Gap. The predicted PM10 concentration at this location was 4.54µg/m3 because all of the plants are scheduled to be energized prior to 2004. The peak PM10
concentration of all the proposed plants at this location was 12.4 µg/m3. The SILs were alsoexceeded in one other location; the 24-hour PM10 SIL was exceeded at a receptor near theTacoma tide flats, where the model predicts a 24-hour PM10 concentration of 6.2 µg/m3. TheSILs are thresholds used in the evaluation of individual, not multiple, facility impacts on theNAAQS.

BP Cherry Point Cogeneration Project 3.2 Air QualityDraft EIS 3.2-39 September 2003
National Ambient Air Quality Standards
This study has not examined local impacts from the power projects, but model results suggestthat even if all the proposed power plants were energized, they are unlikely to exceed theNAAQS.
Proposed Class I Significant Impact Levels Exceeded at Several Locations
If all the plants scheduled to be energized before 2004 are built, their emissions are predicted toexceed the proposed 24-hour PM10 Class I SIL (0.3 µg/m3) in the CRGNSA and in the SpokaneIndian Reservation. When all 45 proposed sources were included in the model, the proposed 24-hour PM10 Class I SIL was exceeded in 100 out of 18 Class I/Scenic/Wilderness Areas.However, Bonneville anticipates only a small portion of these plants will likely be built.
Increment Consumed
Predicted concentrations of PM10, NOx, and SO2 from the proposed power projects are smallfractions of the applicable Class I increments. For example, the peak PM10 concentration wasonly 1.54 µg/ m3 in the CRGNSA, which is well below the 24-hour PM10 Class I increment of 8µg/ m3.
Nitrogen and Sulfur Deposition
Annual nitrogen and sulfur deposition predicted for the Class I/Scenic/Wilderness Areas, theCRGNSA, and the Mr. Baker Wilderness are less than 1% of the background deposition ratesprovided by the federal land managers for these areas.
Affected Visibility
The study results suggest the proposed power projects could degrade visibility in Class I areas, ascharacterized by guidance criteria establish by the federal land managers. The model predictionsindicate emissions from the plants scheduled to be energized prior to 2004 would degradevisibility on very clear days by more than 5% at 14 out of 18 Class I/Scenic/Wilderness Areasand by more than 10% at 8 areas. If all 45 of the proposed plants are built, visibility on very cleardays has the potential to be frequently degraded by more than 10% at 12 out of 18 ClassI/Scenic/Wilderness Areas and in the surrounding Class II areas. The sensitive areas mostaffected by the first group of plants (energized before 2004) are Mt. Rainier, the Alpine LakesWilderness, and the Mt. Baker Wilderness Areas. The inclusion of all proposed plants (pre- andpost-January 2004) results in more than 10% change in visibility in 12 out of 18 of theNorthwest’s Class I/Scenic/Wilderness Areas.
Overview of Phase II
Peak emissions from the 15 projects within the Phase II Baseline Source Group, including the BPCherry Point Project, are listed in Table 3.2-26. Emissions are shown both for primary andsecondary fuels.

BP Cherry Point Cogeneration Project 3.2 Air QualityDraft EIS 3.2-40 September 2003
Table 3.2-26: Baseline Source Group Plus the BP Cherry Point Project Peak Emissionswith Primary Fuel
Peak Emissions (lb/hr)No. Project Name Owner MW
SO2 NOx PM10
1 Fredonia Facility PSE 108 3.5 23.2 6.82 Rathdrum Power, LLC Cogentrix 270 2.7 29.8 21.43 Frederickson Power West Coast 249 10.2 19.7 16.94 Coyote Springs 2 Avista 280 1.1 30.0 4.55 Goldendale Energy Project Calpine 248 12.7 14.9 11.86 Hermiston Power Project Calpine 546 2.5 71.7 38.17 Chehalis Generating Facility Tractebel 520 20.8 40.9 31.68 Goldendale (The Cliffs) GNA Energy 300 3.7 20.3 16.39 Big Hanaford Project TransAlta 267 6.5 23.1 14.310 Mint Farm Generation Mirant 319 4.0 25.1 23.111 Satsop CT Project - Phase I Duke 650 6.7 43.4 47.012 Wanapa Energy Center Confed.Tribes 1200 13.9 98.8 124.813 Plymouth Generation NESCO 307 17.3 18.4 24.014 BP Cherry Point BP NW Products 720 15.9 66.9 70.5
15Summit/Westward(Clatskanie)
Summit 520 8.2 54.0 50.7
Total 6504 130 580 502Peak Emissions with Secondary Fuel
1 Fredonia Facility (Oil-Fired) PSE 104 51.2 23.2 12.27 Chehalis (Oil-Fired) Tractebel 520 238.0 211.5 40.0
The Fredonia Facility has requested fuel oil firing for all hours of the year as a secondary fuel. The Chehalis Generating Facilityhas requested fuel oil firing for 720 hours per year.
Operating Scenarios
The analysis assumes all plants in Table 3.2-26 are operating at peak load with their primary fuelfor the entire simulation period. An oil-firing scenario was also considered, where sourcespermitted to fire with fuel oil were assumed to operate in this manner over the winter season. It isimportant to note that peak load operating assumptions likely overestimate impacts, and with theexception of the Fredonia Facility, the projects are not allowed to fire with fuel oil for an entirewinter season. In practice, virtually all proponents state that they intend to burn gas except intimes of significant shortage.
The oil-burning scenario is a compromise solution to a potentially complex assessment. Thepresent analysis likely overstates potential impacts attributable to the Chehalis GeneratingFacility because it cannot burn oil every day of the winter. The meteorology on winter daysproducing the highest impacts may also not occur concurrently with the economic conditionslikely to cause these power plants to burn oil. On the other hand, the impacts attributable to theFredonia Facility (if they are allowed to burn oil every day) may be under-predicted because theanalysis limits its oil-fired emissions to winter months.

BP Cherry Point Cogeneration Project 3.2 Air QualityDraft EIS 3.2-41 September 2003
Modeling Methods
• The CALPUFF dispersion model was applied to both of the simulations. CALPUFF is theEPA’s preferred model for long-range transport assessments. CALPUFF treats plumes as aseries of puffs that move and disperse according to local conditions that vary in time andspace. CALPUFF estimates processes for wet and dry deposition, aerosol chemistry, andregional haze. The contribution of the BP Cherry Point Project to background extinction wasassessed using the post-processing utilities included with the CALPUFF model system.
• Wind fields are based on the University of Washington’s simulations of Pacific Northwestweather.
• The aerosol concentrations used to characterize background extinction coefficients in thestudy represent excellent visual conditions. Background visibility parameters are presented inTable 4 of the Modeling Protocol.
• The 432-mile by 418-mile study area includes Washington and portions of Oregon, Idaho,and British Columbia. Meteorological, terrain, and land use data were provided to the modelusing a horizontal grid mesh size of 7.5-mile. The terrain data are based on an average foreach grid cell, thus the simulations do not fully resolve potential local impacts in complexterrain. A six-kilometer mesh size sampling grid was used with receptor locations within 16Class I areas (3 National Parks, the Spokane Indian Reservation, and 12 wilderness areas),the CRGNSA, and the Mt. Baker Wilderness.
• Building downwash effects are not considered in the analysis, and emissions werecharacterized using a single stack for each facility.
Phase II Results
The CALPUFF modeling system was applied to simulate emissions from the Baseline SourceGroup using a year of Pacific Northwest weather. The 24-hour average extinction coefficient wasused as a measure of regional haze. The analysis predicted the number of days for each seasonwith greater than 5% and 10% change to background extinction (measure of light), respectively.For both the annual natural gas and the winter oil-fired scenarios, the Baseline Source Groupcould result in a “just perceptible” change to the extinction coefficient on a few days for severalof the areas examined in the study. The areas most affected are the Class I areas near theCRGNSA, Olympic National Park, Mt. Rainier National Park, and the Alpine Lakes Wilderness.In Mt. Rainier National Park, the predicted change to background extinction for the winter oil-fired case exceeds the 10% significance criterion on six days. The Baseline Source Group doesnot exceed the 10% significance criterion on any days when these sources are fired by naturalgas.
Potential changes to background extinction due to emissions from the BP Cherry Point Project toClass I areas, the CRGNSA, and the Mt. Baker Wilderness were evaluated. The modelingsuggests the proposed facility could increase daily background extinction by up to 8.05%,2.23%, and 3.21% in the Mt. Baker Wilderness, the North Cascades National Park, and OlympicNational Park, respectively. The project would contribute greater than 0.4% on only one day inany one area when the combined group’s contribution is greater than 5% and on no days whenthe group’s contribution is greater than 10%. The project would not significantly contribute to

BP Cherry Point Cogeneration Project 3.2 Air QualityDraft EIS 3.2-42 September 2003
regional haze at any of the Class I areas within the Bonneville Service Area, the CRGNSA, orthe Mt. Baker Wilderness when the facilities considered in this analysis are fired by natural gas.
The project’s contribution to predicted changes in extinction for the winter oil-fired scenario wasalso evaluated. This figure was constructed from the highest 24-hour extinction coefficient ateach receptor predicted for the project during a winter simulation. The project’s contributions arenot significant on any of the six days when the Baseline Source Group’s combined change inextinction is greater than 10% in Mt. Rainier National Park.
Cumulative Impact of Greenhouse Gas Emissions
Global warming is a worldwide problem caused by the combined greenhouse gas emissionsthroughout the planet. CO2 emitted from an industrial facility persists in the atmosphere for over100 years before it is eventually metabolized by plants or absorbed into the oceans (ICPP 2001a).During that 100-year lifetime, a parcel of emissions generated anywhere on the planet willdisperse throughout the world and affect climate change everywhere. Thus, climate change inWashington would be affected as much by emissions from power plants in China, for example,as by emissions from the proposed project. To provide perspective on the potential direct impactsof emissions from the proposed project, it is necessary to consider worldwide emissions. Table3.2-27 lists greenhouse gas emissions worldwide, from the U.S., and from the State ofWashington. The table also lists the total estimated future greenhouse gas emissions from thenew gas-fired power plants forecast to be built in the Pacific Northwest (Bonneville 2001a).
Many air pollutants compose “greenhouse gases,” each of which exhibits a different chemicaltendency to affect global warming. The two most common greenhouse gases associated with gas-fired power plants are CO2 emitted from the exhaust stacks and methane emitted as fugitive leaksof natural gas along pipeline systems. Emissions of various greenhouse gas chemicals arecommonly standardized as “carbon equivalents.” The emission rates listed in Table 3.2-27 arestandardized as million metric tons of carbon equivalents (MMTCE) per year, to account for thedifferent global warming potential of each greenhouse gas. For comparison, 1 million tons ofCO2 equals 0.25 MMTCE, and 1 million tons of methane equals 5.2 MMTCE.
As listed in the table, most of the worldwide greenhouse gas emissions are in the form of CO2,while a smaller fraction of the emissions are in the form of other gases such as methane ornitrous oxide. The total annual CO2 emissions associated with the cogeneration facility would be0.56 MMTCE if the facility operates at 85% capacity. Based on the data listed in Table 3.2-27,this is 2.5% of the greenhouse gas presently emitted from all sources in Washington State and5.1% of the amount anticipated to be issued from all proposed future power plants in theNorthwest, assuming all of these plants were constructed. The greenhouse gas emissions fromthe cogeneration facility would be approximately 0.03% of the U.S. emissions. The actual effecton global warming caused solely by emissions from the cogeneration facility is unknown.However, a cogeneration facility produces less greenhouse gas emissions per kilowatt hour ofelectricity produced than a combined-cycle facility with no cogeneration capability. In a regionalperspective, the production of greenhouse gases could be reduced if operation of the BPcogeneration facility displaces the operation of other non-cogeneration facilities.
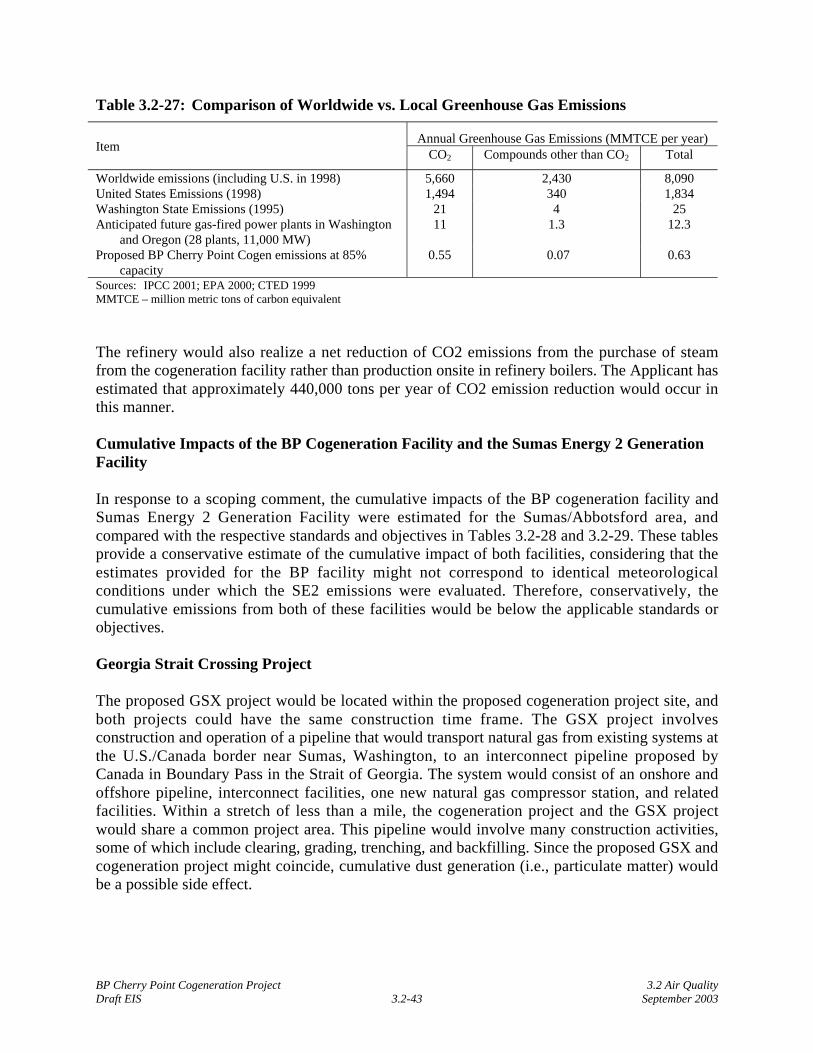
BP Cherry Point Cogeneration Project 3.2 Air QualityDraft EIS 3.2-43 September 2003
Table 3.2-27: Comparison of Worldwide vs. Local Greenhouse Gas Emissions
Annual Greenhouse Gas Emissions (MMTCE per year)Item
CO2 Compounds other than CO2 Total
Worldwide emissions (including U.S. in 1998) 5,660 2,430 8,090United States Emissions (1998) 1,494 340 1,834Washington State Emissions (1995) 21 4 25Anticipated future gas-fired power plants in Washington
and Oregon (28 plants, 11,000 MW)11 1.3 12.3
Proposed BP Cherry Point Cogen emissions at 85%capacity
0.55 0.07 0.63
Sources: IPCC 2001; EPA 2000; CTED 1999MMTCE – million metric tons of carbon equivalent
The refinery would also realize a net reduction of CO2 emissions from the purchase of steamfrom the cogeneration facility rather than production onsite in refinery boilers. The Applicant hasestimated that approximately 440,000 tons per year of CO2 emission reduction would occur inthis manner.
Cumulative Impacts of the BP Cogeneration Facility and the Sumas Energy 2 GenerationFacility
In response to a scoping comment, the cumulative impacts of the BP cogeneration facility andSumas Energy 2 Generation Facility were estimated for the Sumas/Abbotsford area, andcompared with the respective standards and objectives in Tables 3.2-28 and 3.2-29. These tablesprovide a conservative estimate of the cumulative impact of both facilities, considering that theestimates provided for the BP facility might not correspond to identical meteorologicalconditions under which the SE2 emissions were evaluated. Therefore, conservatively, thecumulative emissions from both of these facilities would be below the applicable standards orobjectives.
Georgia Strait Crossing Project
The proposed GSX project would be located within the proposed cogeneration project site, andboth projects could have the same construction time frame. The GSX project involvesconstruction and operation of a pipeline that would transport natural gas from existing systems atthe U.S./Canada border near Sumas, Washington, to an interconnect pipeline proposed byCanada in Boundary Pass in the Strait of Georgia. The system would consist of an onshore andoffshore pipeline, interconnect facilities, one new natural gas compressor station, and relatedfacilities. Within a stretch of less than a mile, the cogeneration project and the GSX projectwould share a common project area. This pipeline would involve many construction activities,some of which include clearing, grading, trenching, and backfilling. Since the proposed GSX andcogeneration project might coincide, cumulative dust generation (i.e., particulate matter) wouldbe a possible side effect.

BP Cherry Point Cogeneration Project 3.2 Air QualityDraft EIS 3.2-44 September 2003
Emissions during the construction of both projects would consist of fugitive dust and combustionexhaust from construction equipment and vehicles. However, with proper mitigation measures(see Section 3.2.7) dust and emission production would be minimal.
Table 3.2-28: Cumulative Total Concentrations Compared to Canadian Air QualityObjective
Highest and Cumulative Concentrations (µg/m3)
CriteriaPollutant
AveragingTime
MaximumExisting
BackgroundConcentration 2 3
(µg/m3)
ModeledMaximumImpacts of
Sumas Energy 2(µg/m3) 1
Modeled MaximumImpacts of BP
Cogeneration Facilityin Abbotsford
(µg/m3)
CumulativeImpact(µg/m3)
MostStringent ofCanadianObjective(µg/m3)
annual 3 0.13 0.0014 3.13 2524-hour 8 1.22 0.58 9.80 150
three-hour 21 4 0.353 25.35 375
SO2
one-hour 29 5.13 1.04 35.17 450annual 14 0.38 0.0079 14.39 30PM10
24-hour 36 3.67 0.16 39.83 50eight-hour 3,480 3.32 0.45 3,484 5,500COone-hour 6,960 6.5 2.7 6,969 14,300
NO2 annual 29 0.26 0.006 29.27 6024-hour 73 2.54 0.12 75.66 200one-hour 109 10.73 3.2 122.93 400
Source: BP 2002, GVRD 1999, 2000, 20011 Modeled maximum impacts of Sumas Energy 2 are taken from the SE2 Second Revised Application dated June 29, 2001,
Table 6.1-16.2 Maximum concentration from a three year monitoring period (1999, 2000, 2001).
Table 3.2-29: Cumulative Total Concentrations Compared to NAAQS or WAAQS
Highest and Cumulative Concentrations (µg/m3)
CriteriaPollutant
AveragingTime
MaximumExisting
BackgroundConcentration
2, 3 (µg/m3)
ModeledMaximumImpacts of
Sumas Energy2 (µg/m3) 1
Modeled MaximumImpacts of BPCogeneration
Facility in Sumas(µg/m3)
CumulativeImpact(µg/m3)
MostStringent ofeither the
NAAQS orWAAQS(µg/m3)
annual 3 0.13 0.0046 3.13 8024-hour 8 1.4 0.13 9.53 365
three-hour 21 3 0.57 24.6 1,300
SO2
one-hour 29 6.97 1.7 37.7 1,065annual 14 0.39 0.027 14.4 50PM10
24-hour 36 4.23 0.43 40.7 150eight-hour 3,480 4.57 0.81 3,485 10,000COone-hour 6,960 8.82 4.4 6,973 40,000
NO2 annual 29 0.27 0.021 29.3 100Source: BP 2002, GVRD 1999, 2000, 20011 Modeled maximum impacts of Sumas Energy 2 are taken from the SE2 Second Revised Application dated June 29, 2001,
Table 6.1-16.2 Maximum concentration from a three year monitoring period (1999, 2000, 2001).

BP Cherry Point Cogeneration Project 3.2 Air QualityDraft EIS 3.2-45 September 2003
3.2.7 Mitigation Measures
Construction
Mitigation Proposed by the Applicant
Any emission of fugitive dust requires implementation of Best Management and GoodConstruction Practices. Incorporating mitigation measures into the construction specifications forthe project would reduce construction impacts. Possible mitigation measures to control PM10,particulate matter deposition, and emissions of CO and NOx during construction are listed below.
• Spraying exposed soil with water would reduce PM10 emissions and particulate matterdeposition. Water would be applied at a rate to maintain a moist surface, but not createsurface water runoff or erosion conditions.
• Providing wheel washers to remove particulate matter that would otherwise be carried offsiteby vehicles would decrease deposition of particulate matter on area roads and subsequententrainment from those roads.
• Removing mud deposited on paved, public roads would reduce particulate matter in the area.• Routing and scheduling construction trucks to reduce delays to traffic during peak travel
times would reduce secondary air quality impacts caused by a reduction in traffic speedswhile waiting for construction trucks.
• Requiring appropriate emission-control devices on all construction equipment powered bygasoline or diesel fuel would reduce CO and NOx emissions in vehicular exhaust. Usingrelatively new, well-maintained equipment would reduce CO and NOx emissions.
• Planting vegetative cover as soon as possible after grading would reduce windblownparticulate matter in the area.
Additional Recommended Mitigation Measures
• Covering all trucks transporting materials, wetting materials in trucks, or providing adequatefreeboard (space from the top of the material to the top of the truck) would further reducePM10 and deposition of particulate matter during transportation.
Operation and Maintenance
Regulated Air Emissions
The Applicant would mitigate air emissions from the proposed cogeneration facility by burningonly natural gas in the combustion turbines and duct burners and only low-sulfur diesel fuel inthe emergency generator and firewater pump. Over and above the CGT vendor’s 9.0 ppm dry,low NOX technology, NOX emissions from the CGTs and duct burners would be controlled to theBACT level (2.5 ppm annual average at 15% O2) through the use of SCR. A catalytic oxidationsystem would be installed for the control of CO emissions from the CGTs and duct burners to anannual level of 2 ppm (at 15% O2). This catalytic oxidation system would also provide the addedbenefit of controlling about 30% of the VOC emissions, including toxic air pollutants. Other

BP Cherry Point Cogeneration Project 3.2 Air QualityDraft EIS 3.2-46 September 2003
pollutants would be controlled using good combustion technology and good operating practicesand the combustion of low-sulfur natural gas as a fuel (BP 2002, Appendix E).
The Applicant would control dust on all the proposed cogeneration facility roads and wouldprovide necessary maintenance and housekeeping to minimize the amount of dust that could begenerated from vehicle traffic.
Additional Mitigation Measures
The Applicant has proposed reductions in refinery emissions through removal of the steamboilers. Because the air emissions from the refinery and the cogeneration facility would beregulated by different state jurisdictions (Ecology for the refinery, and EFSEC for thecogeneration facility), it’s unclear which jurisdiction will enforce these reductions in refineryemissions. Enforceable conditions requiring removal of the refinery’s three utility boilers withinsix months of the beginning of cogeneration facility operation could allow regulatory agencies tomore fully take into account refinery emission reductions in the permitting and environmentalreview processes.
Greenhouse Gas
As long as the proposed cogeneration facility is owned by the Applicant, the project’sgreenhouse gas emissions mitigation would be a part of BP’s corporate greenhouse gas objectiveand the proposed project emissions would be offset by greenhouse gas emission reductionswithin BP worldwide operations. BP’s worldwide objective is to hold net GHG emissions at the2002 level of 90.8 tons (181.66 billion pounds) through the year 2012, while absorbing all newgrowth in BP company operations.
If, at some point in the future, the Applicant sells the proposed cogeneration facility, mitigationwould be provided for greenhouse gas emissions in excess of 0.675 pound CO2/kWh in the formof an annual payment to a qualifying organization such as the Climate Trust of $0.85/ton CO2, orgreenhouse gas reductions would be obtained by the proposed cogeneration facility owner, or acombination of the two. Mitigation would be satisfied annually for 30 years, which is theassumed economic life of the project. Mitigation would be reported to EFSEC annually.
3.2.8 Significant Unavoidable Adverse Impacts
No significant unavoidable adverse impacts on air quality are identified. The proposedcogeneration facility would emit criteria air pollutants and toxic air pollutants into theatmosphere. It could also enable the refinery to implement significant emission reductions. Ifsuch emission reductions were implemented, it is likely there would be no observable changes inambient air quality levels, either in the U.S. or in Canada. The various analyses conducted for thePSD application and for other sensitive areas of interest indicate that air emissions associatedwith the proposed cogeneration facility would occur and would have an impact on the overall airquality of the region. Those emissions are not likely to cause any adverse impacts to theprotection of human health and welfare, to any soils, vegetation, flora, or fauna, or to any other

BP Cherry Point Cogeneration Project 3.2 Air QualityDraft EIS 3.2-47 September 2003
sensitive areas identified by the National Parks Service, U.S. Fish and Wildlife Service, U.S.Forest Service, or by Canadian air quality regulatory agencies.

BP Cherry Point Cogeneration Project 3.3 Water ResourcesDraft EIS 3.3-1 September 2003
3.3 WATER RESOURCES
The following section discusses existing water resources in the region of the proposed project,and assesses the project’s potential for affecting those resources. Mitigation measures to reduceor eliminate impacts that would result from the project are also discussed. The analysis in thissection is primarily based on information provided by the Applicant in the ASC (BP 2002,Section 3.3 and Appendix F). Where additional sources of information have been used toevaluate the potential impacts associated with the proposed project, those sources have beencited. Information regarding water quality is presented in Section 3.4.
3.3.1 Existing Conditions
Surface Water Resources
Regional Area
The proposed project, including all its ancillary facilities, is located within what is commonlycalled the Mountain View upland of Whatcom County (Newcomb et al. 1949). The area consistsof gently rolling hills interspersed with broad areas of relatively level ground. Although nottechnically within the Nooksack River Basin, for purposes of water resource management, theproject is within Water Resource Inventory Area (WRIA) 1. Small seasonal meandering streamsdrain the area to Birch Bay and/or the Strait of Georgia. Review of the Soil Conservation Service(Goldin 1992) soils inventory indicates the area is a mosaic of wetland and upland soils. Many ofthe wetland soils have been logged, ditched, and drained since Euro-American settlement, andconverted to agricultural uses. Despite these activities, the National Wetland Inventory (USFWS1987a, 1987b) shows there is still a mosaic of wetlands within the project vicinity, although notas extensive as previously existed.
Grassland and cultivated farmland predominate in northwestern Whatcom County, mixed withwetland areas and small stands of planted or second-growth forest. A small amount of paved androofed areas exist within the upland, associated with roads, homes, and a few industrialoperations, including the refinery. The wetlands are attributed largely to depressions within theundulating topography and low permeability soils, which result in poor drainage (see Section 3.1for more information about soils, and Section 3.5 for more information about wetlands).
Nooksack River
The Nooksack River is the largest river discharging in Whatcom County, and its 786-square-milewatershed (above Ferndale) encompasses most of the County. Mean annual flow in the river isapproximately 3,800 cubic feet per second (cfs) at Ferndale. At its closest point, the river is morethan 20 miles from the refinery and its watershed is about 18 miles from the refinery. Use ofNooksack River water is discussed below in the Water Uses and Water Rights subsection.

BP Cherry Point Cogeneration Project 3.3 Water ResourcesDraft EIS 3.3-2 September 2003
Project Area
The cogeneration facility, mitigation wetlands, transmission line interconnection, and theassociated refinery interface areas are near the western end of the Terrell Creek drainage basin,as depicted in Figure 3.3-1. The Terrell Creek basin is approximately 17 square miles in area andcomprises an irregularly shaped section of the Mountain View upland between the settlements ofMountain View and Birch Bay. Terrell Creek’s source is Terrell Lake. The creek generallypasses through the basin from east to west. The stream meanders in a northwesterly directionfrom the lake and, after 2 miles, is joined by Fingalson Creek from the east. Shortly thereafter,the mainstem turns west and continues to flow for another 3 miles to its discharge point intoBirch Bay at the Strait of Georgia. The stream is deeply incised in some areas and is containedwithin a broader valley in others.
Most streamflow within Terrell Creek is obtained from surface water runoff rather than fromTerrell Lake or through groundwater recharge (baseflow). As such, streamflow is highlyseasonal, and the creek dries up completely most summers (Washington Department of WaterResources 1960). No quantified hydrologic data were found for Terrell Creek.
The subbasin of the Terrell Creek basin in which the cogeneration facility and the refinery arelocated is approximately 800 acres in size. Surface water generally flows as sheet flow orshallow groundwater (interflow) in a northwesterly direction toward Terrell Creek. Confinedflow is limited mostly to ditches and some short lengths of natural channel close to TerrellCreek.
The cogeneration facility, refinery laydown areas, and transmission line interconnection arelocated in a drainage subbasin measuring approximately 800 acres. Altogether, they occupyapproximately 25% of the subbasin. The subbasin generally slopes downward toward thenorthwest. Surface water runoff drains through a series of ditches and ponds into Terrell Creeknear Jackson Road or through a roadside ditch along the east side of Blaine Road directly intoTerrell Creek where the road crosses the creek. Although most of the ditches (except those alongthe roadsides) have not been maintained for many years and are overgrown with grasses andshrubs, they still convey surface flows during periods of rainfall. Ditches along Grandview Roadand Jackson Road also collect runoff and eventually discharge to the creek at the point where thecreek crosses beneath Jackson Road.
Cogeneration Facility
The proposed cogeneration facility site contains all or part of six wetlands, as shown in Figure3.5-1 and described in Section 3.5. Four of these—A, B2, B3, and C—are partially drained by aditch that directs surface flow in a northwesterly direction toward a ditch that runs northerlyalong the eastern boundary of the refinery. Two westward-flowing ditches drain water fromWetland E in the southern portion of the facility site, and from the south and east of the facilitysite, to the same northerly flowing ditch along the refinery boundary. That ditch, in turn, flows toa ditch on the south side of Grandview Road, which flows westerly to Blain Road. At Blain Roadthe flow is directed through a culvert under Grandview Road and then north in a ditch to TerrellCreek.

BP Cherry Point Cogeneration Project 3.3 Water ResourcesDraft EIS 3.3-3 September 2003
Figure 3.3-1: Surface Water Drainage Basin

BP Cherry Point Cogeneration Project 3.3 Water ResourcesDraft EIS 3.3-4 September 2003
Refinery Interface
Surface flows east of Blaine Road on the refinery site are intercepted by a ditch on the east sideof Blaine Road and carried north to the culvert under Grandview Road and on to Terrell Creek(see Figure 3.3-2). The proposed laydown areas on the refinery site contain four wetlands asshown in Figure 3.5-1 and described in Section 3.5. Three of these, F, G, and J, are surroundedby ditches. Surface flows in the proposed laydown areas on the refinery site are intercepted bynorth and west flowing ditches and carried to a northwest-flowing ditch to a second culvert underGrandview Road approximately 1,500 feet west of Blaine Road. From the culvert, flows enter anatural channel in a northwestward direction to the refinery duck ponds and eventually to aculvert under Jackson Road joining with Terrell Creek.
Transmission System
The transmission line interconnect corridor contains several wetlands, as described in thetransmission line environmental report (Radian International and Dames and Moore 1999) andsummarized in Section 3.5. Discharge from these wetlands and other surface flow is generallyintercepted by north and west flowing ditches and eventually carried to the ditch along the southside of Grandview Road, or the ditch on the east side of the refinery and then to GrandviewRoad. Although construction of the western maintenance road from Brown Road has begun, ithas not altered surface flow across the site since it is oriented primarily north-south.
Custer/Intalco Transmission Line No. 2
The Bonneville transmission line corridor between the Custer substation and the cogenerationfacility interconnection traverses both the Terrell Creek Basin and the California Creek Basin tothe north. The California Creek Basin is also located in the Mountain View upland and has verysimilar geology, geography, topography, historical development, and surface watercharacteristics as the Terrell Creek Basin. It does not, however, have a lake at its headwaters. Awetland and aquatic resources survey was conducted to determine potential adverse impacts(Appendix D). Five streams and 34 wetlands were identified within the corridor.
The five streams include California, Fingalson, and Terrell creeks and two unnamed creekstributary to California Creek. The 34 wetlands are somewhat equally distributed along the 5-milecorridor, varying from four to eight wetlands per mile and occupying from 30 to 1,200 feet ofright-of-way. Most of the wetlands are associated with one of the five creeks and most areemergent marsh wetlands heavily disturbed by current or past agricultural practices. Only a feware scrub-shrub wetlands; these are maintained by Bonneville to a height no greater than 25 feet.
Other Project Facilities
Alcoa Intalco Works. All of the facilities necessary to permit recycling of cooling water fromAlcoa Intalco Works to the cogeneration facility would be within the existing industrial plant.All surface water is directed to an existing stormwater facility and ultimately discharged to theStrait of Georgia through a permitted outfall. Impervious surfaces prevent any interactionbetween surface runoff and groundwater.

BP Cherry Point Cogeneration Project 3.3 Water ResourcesDraft EIS 3.3-5 September 2003
Wetland Mitigation Areas. Two wetland mitigation areas, designated CMA 1 and CMA 2 andtotaling approximately 110 acres, are proposed north of Grandview Road on each side of BlaineRoad. On the east side of Blaine Road, CMA 1 drains in a northerly direction toward TerrellCreek. A total of 40.3 acres of wetland were identified on the 53.3-acre CMA 1 site (AppendixD). A northerly trending ditch bisects the site and carries flow to a natural channel that leadsnortherly to Terrell Creek. Shallow east-west trending ditches on each side of the northerlytrending ditch intercept surface flow and direct it toward the central ditch. About 44.3 acres ofwetland were identified on the 63.5-acre CMA 2 site. Surface water flow patterns on the CMA 2site are much more complicated than on CMA 1 and are depicted in Figure 3.3-3.
Stormwater
Runoff
An average annual 40.7 inches of precipitation has been reported in the project vicinity (Goldin1992), most as rainfall. Stormwater runoff does not infiltrate easily into the ground due to thelow permeability of surface soils (see Section 3.1), and generally moves across the project site asdispersed overland flow. Generally, runoff is not substantial due to the gentle slope of the land,established vegetation, and the lack of well-defined drainage channels. In most of the area,excess runoff is eventually collected in ditches and carried to creeks via roadside ditches.
Flooding Potential
All of the proposed project components are located outside the 5-year, 100-year, and 500-yearfloodplains. Figure 3.3-4 shows the proximity of floodplain boundaries in the project vicinity.
The floodplain boundaries are based on the following FEMA floodplain maps:
• City of Bellingham, Washington, Whatcom County, Panels 1-10 (effective date:September 2, 1982),
• City of Blaine, Washington, Whatcom County, 1 panel only (effective date: July 16, 1979),• City of Everson, Washington, Whatcom County, 1 panel only (effective date: August 2,
1982),• Town of Ferndale, Washington, Whatcom County, 1 panel only (effective date: June 1,
1983),• City of Lynden, Washington, Whatcom County, 1 panel only (effective date: November 3,
1982),• City of Nooksack, Washington, Whatcom County, 1 panel only (effective date: September 2,
1982),• City of Sumas, Washington, Whatcom County, 1 panel only (effective date: May 15, 1985).

BP Cherry Point Cogeneration Project 3.3 Water ResourcesDraft EIS 3.3-6 September 2003
Figure 3.3-2: Project Site Drainage

BP Cherry Point Cogeneration Project 3.3 Water ResourcesDraft EIS 3.3-7 September 2003
Figure 3.3-3: Estimated Existing Surface and Subsurface Flow Near CMA 2

BP Cherry Point Cogeneration Project 3.3 Water ResourcesDraft EIS 3.3-8 September 2003
Figure 3.3-4

BP Cherry Point Cogeneration Project 3.3 Water ResourcesDraft EIS 3.3-9 September 2003
Groundwater
Geology
Geologic conditions beneath the Mountain View upland are described in Section 3.1, Earth, andborehole/well logs from explorations near the cogeneration facility site are provided in BP 2002,Appendix G. Figures 3.3-5 and 3.3-6 provide geologic cross sections developed from the soilborings.
The area is underlain by several hundred feet of Pleistocene glacial and non-glacial sedimentsdeposited in the past 20,000 years during glacial advances and retreats associated primarily withthe Fraser glaciation. These deposits, are in turn, underlain by much older sedimentary bedrock.The principal geologic deposits identified beneath the project site are as follows, from youngestto oldest:
• Sand and gravel overlying the Bellingham drift (recent alluvium),• Bellingham drift,• Deming sand,• Kulshan drift, and• Undifferentiated sedimentary deposits.
Drift deposits are composed of a poorly sorted, heterogeneous mixture of boulders, till, gravel,sand, and clay transported by glaciers and deposited under marine conditions while the studyarea lay below sea level.
Regional Hydrostratigraphy
Major water-bearing units (aquifers) in the region are the coarser-grained sand and graveldeposits associated with the Deming sand and other glacial outwash deposits. Major aquitardsare the finer-grained marine drifts and tills, including the Bellingham and Kulshan drifts andVashon Till. The marine drifts can locally contain elevated sand and gravel content, but havesufficient silt and clay content to have very low permeability. The older undifferentiated depositsand the sedimentary bedrock also contain both aquifer and aquitards.
Project Vicinity Hydrostratigraphy
Although specific investigation data do not exist for any portions of the project site, geologic andhydrostratigraphic conditions illustrated in Figures 3.3-5 through 3.3-7 are anticipated to berepresentative of conditions beneath the project vicinity (for further detail on geologicconditions, refer to Section 3.1, Earth). These sections show the following hydrostratigraphicunits as listed from the surface downward:
• Upper water-bearing zone,• Bellingham drift aquitard,• Deming sand aquifer, and• Kulshan drift aquitard.

BP Cherry Point Cogeneration Project 3.3 Water ResourcesDraft EIS 3.3-10 September 2003
Detailed hydrogeologic studies at the refinery have revealed that the upper portion of theBellingham drift is weathered to depths of 20 feet and is more permeable than the lowerunweathered portions of this deposit. Therefore, the sand and gravel overlying the Bellinghamdrift and the weathered Bellingham drift together comprise the upper water-bearing zone in theproject vicinity. This zone likely occurs under unconfined conditions and is perched on theunderlying Bellingham drift aquitard. The Deming sand is the first major aquifer beneath the siteand is likely confined between the Bellingham drift and Kulshan drift aquitards.
Groundwater Movement
Groundwater movement within the Whatcom Basin has been reported in Newcomb et al. (1949)and Easterbrook (1973). The reports do not provide groundwater movement in specific aquifers,but do indicate recharge from the area of the Mountain View upland and gradients leading awayfrom the upland. Generalized contours of the surface of the water table are shown in Figure 3.3-7, and indicate groundwater flow generally toward the west across the project vicinity. Site-specific hydrogeologic investigations at the refinery also indicate that groundwater within boththe upper water-bearing zone and the Deming sand aquifer flows toward the northwest.
Recharge and Discharge
The upper water-bearing zone is recharged through the direct infiltration of rainfall. Dischargefrom this aquifer is to local ditches, wetlands, and streams, as described in the followingsubsection.
The Deming sand aquifer is likely recharged via the direct infiltration of precipitation overelevated areas such as Holman Hill located about 3 miles east of the refinery, the Mountain Viewuplands, and broadly over the entire area. Although the overlying Bellingham drift is an aquitard,leakage through this deposit over large areas probably does provide some minimal recharge. TheDeming sand aquifer likely discharges to the lower reaches of area drainages near sea level or tothe Strait of Georgia, depending on the location and configuration of the aquifer.
The older and deeper pre-Pleistocene aquifers are likely part of a regional groundwater flowsystem within the overall Whatcom Basin. Recharge likely occurs inland, possibly on the higherelevation fringes of the basin. Groundwater in the deeper aquifer systems likely dischargesoffshore to the Strait of Georgia.
Interaction with Surface Water
Groundwater in the near surface upper water-bearing zone is in hydraulic continuity with localstreams, namely Terrell Creek. The Deming sand is found beneath 50 to over 70 feet of low-permeability Bellingham drift. Water levels in wells in the Deming sand aquifer are often inexcess of 50 feet below ground surface. Terrell Creek is effectively isolated (perched) from theDeming sand, Vashon, and pre-Vashon aquifers in the project vicinity. Water in the Vashon andpre-Vashon deposits would not impact surface water because that groundwater dischargesoffshore to the Strait of Georgia.

BP Cherry Point Cogeneration Project 3.3 Water ResourcesDraft EIS 3.3-11 September 2003
Figure 3.3-5

BP Cherry Point Cogeneration Project 3.3 Water ResourcesDraft EIS 3.3-12 September 2003
Figure 3.3-6

BP Cherry Point Cogeneration Project 3.3 Water ResourcesDraft EIS 3.3-13 September 2003
Aquifer Characteristics
Groundwater average linear horizontal velocities in the weathered (near surface) Bellinghamdrift unit were estimated to be between 0.1 and 0.8 ft/yr (Remediation Technologies, Inc. 1993).By contrast, groundwater average linear horizontal velocity in the Deming sand aquifer has beenestimated to be 25 to 260 ft/yr (CH2M Hill 1985).
Water Rights and Water Supply
Water use in the area is predominantly for agriculture, municipal supplies, commercial andindustrial processes, and domestic supplies. The refinery currently uses an average of 4,170 gpmfor industrial process water, which is supplied under agreement with the Whatcom County PUD.This represents about 55% of the refinery’s 11 mgd water contract. Alcoa Intalco Works also hasa contract for industrial water, which includes 2,780 gpm for once-through cooling of an aircompressor. This is surface water diverted from the Nooksack River, upstream of Ferndale.
Industrial process water is currently supplied through an existing pipeline to Alcoa IntalcoWorks that extends on to the refinery. This pipeline enters the refinery at its southeast cornerfrom Aldergrove Road.
Potable water is supplied to the refinery by the Birch Bay Water and Sewer District. The Districtwould provide potable (treated) water for use by cogeneration facility employees under anexisting agreement with the Applicant. The amount of potable water required for operation of thecogeneration facility is anticipated to average between 1 and 5 gpm. The District currentlypurchases water from the City of Blaine, according to Department of Health data.
A review of Ecology's Water Right Application Tracking (WRAT) database (August 2001) bythe Applicant was conducted to evaluate the potential impacts to water rights as a result ofconstruction and operation of the cogeneration facility. Water rights surrounding the site aredesignated to have a purpose of use for irrigation, domestic single, domestic multiple, municipal,wildlife, and commercial and industrial manufacturing. Water rights certificates, permits, andapplications within a mile of the site are summarized below:
• Three certificated surface water rights, and• nine groundwater rights (four applications and five certificated).
Many small “exempt” wells (less than 5,000 gallons per day do not require a water right) may bein use within the 1-mile radius for domestic water supply, but exempt wells are not documentedin Ecology's WRAT database.
Surface and groundwater certificates, permits, claims, and applications recorded by Ecology forthe PUD, the District, and the City of Blaine are presented in Tables 3.3-1 and 3.3-2. A summaryof water rights is included in the ASC (BP 2002, Appendix F).

BP Cherry Point Cogeneration Project 3.3 Water ResourcesDraft EIS 3.3-14 September 2003
Water Discharge
Wastewater
The refinery’s wastewater is directed to the onsite wastewater treatment facility. Once treated,the water is discharged via the refinery’s existing wastewater discharge point, Outfall 001, at theCherry Point terminal into the Strait of Georgia under an existing NPDES permit. Dischargefrom the outfall averages 2,338 gpm. The refinery’s sanitary wastewater is directed to the BirchBay Water and Sewer District's sewage treatment facility under an existing agreement.
Stormwater
Stormwater runoff from the refinery interface area presently drains uncontrolled as describedabove.
3.3.2 Impacts of the Proposed Action
Construction
Cogeneration Facility
Surface Water
Following clearing, initial site preparation would include temporary stormwater facilities todetain and treat precipitation, and perimeter ditches to intercept and divert any flows fromupslope areas around the site. Clearing and grading would most likely occur during the dryseason, due to the physical limitations of construction in seasonally wet areas. Construction ofthe stormwater facilities and perimeter ditches would result in the immediate alteration in surfacewater flow across the site that would not be exhibited until the beginning of the following wetseason. Run-on flow from upslope would be eliminated and flow onsite from precipitation eventswould be quickly directed to the stormwater detention system. At the same time, elimination ofvegetation would eliminate transpiration, resulting in some increase in flow offsite.
An unlined stormwater detention pond (1) has been proposed during construction, thereforesome leakage to the local shallow groundwater table can be expected. The effect of any leakageis not expected to have a significant effect on local surface or groundwater flows for severalreasons. First, local soils have a relatively low permeability and therefore any leakage would beexpected to be slow. Second, construction is not expected to last long enough (two years) for anyleakage to be significant (Wigfield, pers. comm., 2003). Finally, Grandview Road and itsadjacent roadside ditch are approximately 400 feet north of the detention pond and would likelyintercept any leakage and direct it to the existing culvert under Grandview Road to the east ofBlaine Road.

BP Cherry Point Cogeneration Project 3.3 Water ResourcesDraft EIS 3.3-15 September 2003
Figure 3.3-7

BP
Che
rry
Poi
nt C
ogen
erat
ion
Pro
ject
3.3
Wat
er R
esou
rces
Dra
ft E
IS3.
3-16
Sept
embe
r 20
03
Tab
le 3
.3-1
:W
ater
Rig
hts,
Per
mit
s, C
erti
fica
tion
s, a
nd C
laim
s in
the
Noo
ksac
k B
asin
(U
pstr
eam
of
Fer
ndal
e)
Doc
umen
t Num
ber
Doc
umen
tT
ype
Purp
ose
Cod
ePr
iori
ty D
ate
Loc
atio
nQ
i(g
pm)
Qa
(acr
e-fe
et)
Purp
ose
Star
ting
Dat
ePu
rpos
e E
ndin
gD
ate
Las
tN
ame
Firs
tN
ame
Bus
ines
s N
ame
Sour
ce N
ame
G1-
*012
49C
WR
ISC
ertif
icat
eIR
Oct
ober
7, 1
949
T39
N/R
02E
-22
350
54G
reen
acre
s M
eml P
kIn
filtr
atio
nT
renc
hG
1-*0
2509
CW
RIS
Cer
tific
ate
MU
May
9, 1
952
T39
N/R
02E
-19
1,00
01,
615
Fern
dale
Tow
n O
fW
ell
G1-
*038
99C
WR
ISC
ertif
icat
eM
UFe
brua
ry 2
8, 1
955
T39
N/R
02E
-19
870
440
Fern
dale
Tow
n O
fW
ell
G1-
*057
28C
WR
ISC
ertif
icat
eD
S, F
S,IR
Sept
embe
r 7,
196
0T
40N
/R02
E-0
781
01,
93.6
Le
Coc
q R
BW
ell
G1-
*066
60C
WR
ISC
ertif
icat
eIR
Mar
ch 2
8, 1
963
T40
N/R
02E
-22
380
120
Shad
y N
ook
Farm
sW
ell
G1-
*100
62C
WR
ISC
ertif
icat
eIR
Mar
ch 7
, 196
9T
40N
/R02
E-1
050
084
01-M
ay-9
601
-Oct
-96
Scho
essl
er G
Jr
Infi
ltrat
ion
Tre
nch
G1-
0030
0CW
RIS
Cer
tific
ate
IRJu
ly 1
0, 1
970
T39
N/R
02E
-02
400
108
01-J
un-9
630
-Sep
-96
Vau
ghn
Leo
naIn
filtr
atio
nT
renc
hG
1-00
010C
WR
ISC
ertif
icat
eIR
Nov
embe
r 16
, 197
0T
40N
/R02
E-1
11,
209
6701
-May
-96
30-S
ep-9
6St
eens
ma
Fred
Wel
lG
1-00
444C
WR
ISC
ertif
icat
eIR
Dec
embe
r 28
, 197
0T
40N
/R01
E-1
450
092
01-M
ay-9
631
-Oct
-96
Ola
son
Har
old
Infi
ltrat
ion
Tre
nch
G1-
0034
5CW
RIS
Cer
tific
ate
IR, D
SFe
brua
ry 1
5, 1
972
T40
N/R
02E
-15
450
665/
15/1
996
(IR
)9/
15/1
996
(IR
)Y
oder
Ric
hard
LW
ell
G1-
2632
5C
ertif
icat
eFR
Sept
embe
r 11
, 199
1T
39N
/R02
E-0
61,
350
Jans
enA
lber
tJi
j Con
stru
ctio
n C
o., I
nc.
Infi
ltrat
ion
Tre
nch
S1-0
0708
CW
RIS
Cer
tific
ate
CI,
IR
Sept
embe
r 27
, 196
812
,566
18,5
44W
hatc
om C
nty
PUD
1N
ooks
ack
Riv
erS1
-007
07C
Cer
tific
ate
CI
Apr
il 16
, 196
522
,440
27,6
67W
hatc
om C
nty
PUD
1N
ooks
ack
Riv
erS1
-*11
970C
Cer
tific
ate
CI
Janu
ary
13, 1
953
2,24
40
Wha
tcom
Cnt
y PU
D 1
Noo
ksac
k R
iver
S1-0
0707
CC
ertif
icat
eD
M, I
RA
pril
16, 1
965
22,4
4027
,667
Wha
tcom
Cnt
y PU
D 1
Noo
ksac
k R
iver
G1-
*050
86C
WR
ISC
ertif
icat
eM
UD
ecem
ber
22, 1
958
500
800
City
of
Bla
ine
Wel
lG
1-*0
7623
CW
RIS
Cer
tific
ate
MU
May
21,
196
540
064
0C
ity o
f B
lain
eW
ell
G1-
2248
3CW
RIS
Cer
tific
ate
MU
Apr
il 14
, 197
545
072
6C
ity o
f B
lain
eW
ell
G1-
3000
37C
LC
laim
/M
U80
01,
290
City
of
Bla
ine
Wel
lG
1-26
822
Perm
itM
UN
ovem
ber
13, 1
992
200
320
City
of
Bla
ine
Wel
lSo
urce
:E
colo
gy 2
001a
Tab
le 3
.3-2
:P
endi
ng G
roun
dwat
er R
ight
App
licat
ions
in t
he T
erre
ll C
reek
/Che
rry
Poi
nt W
ater
shed
Doc
umen
t Num
ber
Doc
umen
t Typ
ePu
rpos
e C
ode
Prio
rity
Dat
eL
ocat
ion
Qi (
gpm
)B
usin
ess
Nam
eSo
urce
Nam
e
G1-
2775
8A
pplic
atio
nC
I, M
UA
ugus
t 23,
199
6T
39N
/R01
E-0
970
0W
hatc
om C
ount
y PU
DW
ell
G1-
2774
6A
pplic
atio
nC
I, M
UJu
ne 2
1, 1
996
T39
N/R
01W
-13
1,50
0T
rilli
um C
orpo
ratio
nW
ell
S1-*
0627
3AW
RIS
App
licat
ion
CI,
DM
Dec
embe
r 23
, 194
48,
976
Wha
tcom
Cou
nty
PUD
Sout
h Fo
rk N
ooks
ack
Riv
erG
1-26
820
App
licat
ion
MU
Nov
embe
r 13
, 199
220
0C
ity o
f B
lain
eW
ell
G1-
2682
1A
pplic
atio
nM
UN
ovem
ber
13, 1
992
450
City
of
Bla
ine
Wel
lG
1-28
046
App
licat
ion
DM
Aug
ust 3
, 199
950
0B
irch
Bay
Wat
er a
nd S
ewer
Dis
tric
tW
ell
Sour
ce:
Eco
logy
200
1aPu
rpos
e C
odes
:D
G (
dom
estic
gen
eral
)M
U (
dom
estic
mun
icip
al)
FP (
fros
t pro
tect
ion)
ST (
stoc
k w
ater
ing)
IR (
irri
gatio
n)D
M (
dom
estic
mul
tiple
)C
I (c
omm
erci
al a
nd in
dust
rial
man
ufac
turi
ng)

BP Cherry Point Cogeneration Project 3.3 Water ResourcesDraft EIS 3.3-17 September 2003
Stormwater/Flood Potential
Figure 3.3-4 shows the proximity of floodplain boundaries to the proposed cogeneration facilitysite. The proposed cogeneration facility and all associated components are not located within the5-, 100-, or 500-year floodplains and therefore flooding would not be expected. This is the caseduring construction and operation of the cogeneration project and all its ancillary facilities.
Figure 3.3-8 shows the design basis for the operational stormwater control system.
Stormwater Quantity
Surface flow alterations in CMA 1 will result from filling existing ditches. This will increasesheetflow and hydraulic residence time for surface water moving across the site toward TerrellCreek.
Stormwater runoff rates from the cogeneration facility site have been calculated to determine theavailable flow to CMA 2. The final discharge from the project site would be to CMA 2 north ofGrandview Road and west of Blaine Road. Runoff from the cogeneration site would be treatedand then discharged through a level discharge trench to maximize sheetflow across themitigation site. Ditches on the mitigation site would be filled to maximize residence time on thesite and reduce early interception of sheetflow and redirection to Terrell Creek. Flows from themitigation area will eventually move to Terrell Creek by way of the existing BP wetlandmitigation area located at the west end of CMA 2. Figure 3.3-9 depicts the flow of surface wateracross CMA 2 after mitigation.
Stormwater collection, treatment, and discharge would be within the same hydrologic basinwhere the stormwater originates. As long as stormwater discharge from the facility duringconstruction and operation meets Class AA standards, no significant changes to the quantity ofwater in the basin would result from construction and operation of the cogeneration facility. Thestormwater that does not meet Class AA standards would be diverted to the refinery’swastewater treatment system. This would reduce the surface waterflow to wetlands in CMA 2and the flow to Terrell Creek.
Groundwater
Recharge to the upper (near surface) water-bearing zone is primarily by direct rainfallprecipitation and infiltration. Water levels in the upper water-bearing zone are shallow (< 5-footdepths at many locations) and are best described as perched groundwater in hydrologiccontinuity with the surrounding wetlands. Recharge to this zone would decrease essentially tozero at the project site, but would increase on the mitigation areas as runoff is transferred to themand ditches are eliminated to maximize hydraulic residence time.

BP Cherry Point Cogeneration Project 3.3 Water ResourcesDraft EIS 3.3-18 September 2003
Figure 3.3-8

BP Cherry Point Cogeneration Project 3.3 Water ResourcesDraft EIS 3.3-19 September 2003
Figure 3.3-9

BP Cherry Point Cogeneration Project 3.3 Water ResourcesDraft EIS 3.3-20 September 2003
Recharge to the Deming sand aquifer should not be measurably affected by stormwater controlfor the cogeneration facility or any other components of the project. The Deming sand aquifer isminimally recharged by leakage through the overlying Bellingham drift aquitard over a manysquare mile area, so the relatively small (approximately 70 acres) area of paved and roofed landfor the proposed cogeneration facility and laydown areas should have no material affect.Furthermore, increased recharge of the upper (surface water) bearing zone in the mitigation areasshould provide some additional source for leakage to the Deming sand aquifer.
Most of the stormwater collected on the cogeneration facility site would be routed to a surfacewater detention pond and allowed to discharge to wetlands within the same hydrologic subbasin.The net effect would be returning the collected stormwater to the same hydrologic system forrecharge. Some containment systems, such as secondary containment of tanks for fuels,lubricants, and hazardous materials used during construction, would have a probability forreceiving contaminated stormwater. These systems would be equipped with outlet valves toallow for inspection of the water before its release. The operation of these systems would beaddressed in the SWPP plan procedures to avoid the contamination of the stormwater system.Stormwater that accumulates within storage tank containment structures would represent only asmall portion of the entire stormwater from the construction site and, if contaminated, is the onlystormwater that would not be returned to the same hydrologic basin. Any contaminatedstormwater would be diverted and sent directly to the refinery wastewater treatment system fortreatment and eventual discharge to the Strait of Georgia.
Water Rights and Water Supply
During construction, non-potable water would be supplied by truck to provide dust control(anticipated to be about 7 million gallons over the entire two-year construction period). Potabledrinking water for construction workers would be provided by a water service to be contractedby the general site contractor.
Water for HRSG and export steam line steam-blow tests and hydrostatic tests would be requiredfor the commissioning of the power plant facilities, natural gas connections, and watersupply/discharge connections. The volume of water needed for HRSG steam-blow testing wouldbe about 15.5 million gallons. Export steam line steam-blow testing would require about 1.2million gallons, and hydrostatic testing would likely not exceed 4.8 million gallons. Testingwould take place near completion of construction over a period of two to three months. Thewater source would either be industrial water directly from the PUD, or recycled cooling waterfrom Alcoa Intalco Works if it is in operation.
Wastewater
No discharges to the refinery wastewater system are anticipated during construction, except forthe additional load to the existing wastewater system from hydrostatic testing and other startupneeds. Should there be contamination of stormwater within the secondary containment berms,that stormwater would also be directed to the refinery wastewater treatment facility. Thisadditional load is not expected to cause any overload of volume to the existing system.According to the Applicant, water volumes used for hydrostatic testing are not unlike those used

BP Cherry Point Cogeneration Project 3.3 Water ResourcesDraft EIS 3.3-21 September 2003
for various refinery functions and would not be expected to exceed the capacity of the refinery’swastewater treatment system.
Refinery Interface
Laydown areas on the refinery site would most likely be the first facilities to be constructed,since these would be the initial base for construction operations. Following clearing, initial sitepreparation would include construction of stormwater facilities to detain and treat precipitationfalling on the laydown site, and perimeter ditches to intercept and divert any flows from upslopeareas around the site.
An unlined stormwater detention pond (2) has been proposed, therefore some leakage to the localshallow groundwater table could be expected. The leakage is not expected to have a significanteffect on local surface or groundwater flows for several reasons. First, the local soils have arelatively low permeability and therefore any leakage would be expected to be slow. Second,construction is not expected to last long enough for any leakage to be significant (Wigfield, pers.comm., 2003). Finally, Grandview Road and its adjacent roadside ditch are located 400 feetnorth of the detention pond and would likely intercept leakage to shallow groundwater and directit to the existing culvert under Grandview Road west of the laydown areas. Unlike thecogeneration facility site, stormwater facilities constructed for the laydown areas would be final.All laydown areas would be permanent for other refinery uses except the northern approximately270 feet of Laydown Area 2, which would be restored after construction. Construction of thestorm drainage facilities for the laydown areas would most likely occur during the dry seasonbecause of the physical limitations of construction in seasonally wet areas.
Construction of the three laydown areas and associated stormwater facilities would result in theimmediate alteration to surface water flow across the site, but this alteration likely would not beexhibited until the beginning of the following wet season. Flow from upslope would beeliminated and flow onsite from precipitation events would be quickly directed to the stormwaterdetention system (detention pond 2). At the same time, elimination of vegetation would eliminatetranspiration, resulting in a slight increase in flow offsite during and following precipitationevents. Stormwater would be discharged to a ditch at the northwest end of the laydown areas.Flows go to a culvert under Grandview Road and discharge to a natural swale that supplies theBP duck ponds. The slight increase in total flow should not adversely affect the duck ponds
Construction of Access Road 2 to the cogeneration site would also be an early constructionactivity in order to allow ready access to the site from the laydown areas. This road wouldintercept some northward-flowing surface and shallow groundwater in the area between BlaineRoad and the refinery eastern boundary. Culverts would be necessary at both the east and westends of the road to accommodate existing ditches. Nonetheless, some dewatering of the wetlandimmediately north of the roadway could be expected.
The various ancillary pipelines between the cogeneration facility and the refinery (steam,condensate return, sanitary sewer, potable water, wastewater, etc.) are expected to be laid eitherin the footprint of Access Road 2 or the elevated piperack. In either case they are not anticipatedto have an adverse impact on surface or groundwater flows in the project vicinity.

BP Cherry Point Cogeneration Project 3.3 Water ResourcesDraft EIS 3.3-22 September 2003
It has not yet been determined precisely where the industrial water pipeline from the southeastcorner of the refinery to the cogeneration facility would be laid. Construction of this pipelinecould have a minor impact on surface water flows, depending on where it is located and if hereare precipitation events during the construction activity. Regardless of its location, however, theimpacts are not expected to be significant.
Transmission System
As with other facilities, construction of any access/maintenance roads for the transmissioninterconnection would result in an immediate alteration of surface water flows in the immediatevicinity of the roads. Such alteration would not be experienced until the following wet season. Itis assumed that culverts would be placed wherever roads cross ditches or other surface waterfeatures. Nonetheless, where roads pass through wetlands, some dewatering of wetlands on thedownslope (northwestern) side of the road would be expected.
Custer/Intalco Transmission Line No. 2
Similar to the transmission interconnection corridor, construction of any access/maintenanceroads would result in an immediate alteration of surface water flows in the immediate vicinity ofthe roads. Such alteration would not be experienced until the following wet season. It is assumedthat culverts would be placed wherever roads cross ditches or other surface water features.Nonetheless, where roads pass through wetlands, some dewatering of wetlands on the downslope(northwestern) side of the road would be expected.
Other Project Facilities
Alcoa Intalco Works
Construction of the collection sump, pump station, and approximately 1,600-foot pipeline mayhave a short-term effect on surface water flows as a result of earth disturbance. Since the exactlocation of these facilities has not been identified, it can only be assumed that they would belocated within the confines of an already significantly altered industrial facility. It is alsoassumed that construction would only occur during the dry season, so that exposed soils wouldbe covered and restored prior to any precipitation. If this assumption is not true, some alterationof local surface water flows during construction might be expected. Assuming construction doesoccur during the dry season, any impacts are expected to be minimal.
Wetland Mitigation Areas
Construction of the project and its ancillary facilities would not have an affect on flows throughCMA 1, since that area does not presently receive any surface or groundwater flows from thecogeneration facility or refinery interface areas and that situation would not change. Filling ofthe ditches on CMA 1 is expected to increase stormwater detention time on the site. The resultshould be an improvement in wetland hydrologic characteristics in the area.

BP Cherry Point Cogeneration Project 3.3 Water ResourcesDraft EIS 3.3-23 September 2003
Increased flows to CMA 2, combined with more effective distribution and plugging of ditches, isalso expected to increase hydraulic residence time on the site, thus enhancing existing wetlandsand restoring wetlands that have been effectively drained.
Operation
Cogeneration Facility
Surface Water
Alterations to surface water flow through the cogeneration facility site would continue asinitially implemented during project construction. Flows from upslope of the cogenerationfacility site would be diverted around the perimeter of the site and discharged to CMA 1 wherethey are presently directed. As noted earlier under construction impacts, the ditch along the eastside of the cogeneration facility could likely initiate drainage of wetland C that might not beapparent until several years into operation.
Stormwater
Once construction is complete, operation of stormwater facilities on the principal facility sitewould entail collection by a combination of storm drainage pipes and ditches that would routestormwater to detention pond 1 and subsequently discharge to CMA 2 following treatment, asdescribed under construction impacts.
Groundwater
As discussed under construction impacts above, recharge to the shallow (near surface)groundwater table would essentially go to zero at both the cogeneration facility and theassociated refinery laydown areas. Also as discussed under construction, some leakage from theunlined detention ponds could be expected, but this likely would be intercepted by GrandviewRoad and its associated roadside ditch.
Water Rights and Water Supply
Industrial process water would be supplied through a water re-use agreement between the PUD,the Applicant, and Alcoa Intalco Works for once-through cooling water from Alcoa, assumingAlcoa Intalco is in operation. Under this scenario, Alcoa would be able to provide approximately2,770 gpm and the excess not used by the cogeneration facility could be used by the refinery,resulting in a net reduction of water withdrawal from the Nooksack River. If Alcoa is not inoperation, the approximately 2,244-2,316 gpm of process water required by the cogenerationfacility would be supplied directly by the PUD. In either case there would be no net increase inwater withdrawal from the Nooksack River.
Potable water use of 1 to 5 gpm is anticipated from the cogeneration facility, as is an equivalentincrease in sanitary waste discharge to the refinery and ultimately to the Blaine WastewaterTreatment Plant. This is considered minimal to overall refinery use, and the district has indicated

BP Cherry Point Cogeneration Project 3.3 Water ResourcesDraft EIS 3.3-24 September 2003
this increased usage would not impact available supplies or resources of potable water undercurrent certified rights, as noted in the discussion of affected environment. The district currentlypurchases potable water from the City of Blaine, according to Department of Health data.
Normal fluctuations in the refinery’s steam demand and seasonal ambient temperature changeswould affect the cogeneration facility’s water consumption. Warmer ambient temperatures in thesummer increase water use, and cooler ambient temperatures in the winter decrease water use asa result of changes in evaporation rates in the cooling tower. Lower steam consumption by therefinery increases cogeneration facility water usage because of higher condensing duty.
Refinery Interface
Alterations to surface water flow through Laydown Areas 1 through 3 would continue as initiallyimplemented during project construction. Most of the flows from upslope of the laydown areaswould be diverted around the site and discharged to the culvert under Grandview Road northwestof the laydown areas where they are presently directed. After construction is completed, fill onLaydown Area 4 and the northern approximately 273 feet of Laydown Area 2 will be removedand the areas restored to a combination of wetland and upland habitats. These are identified asthe east and west restoration areas, respectively. The east restoration area will be recontoured toapproximate its pre-project topography and will receive surface flows from upslope to recreate awetland at the western, downslope end. The west restoration area will be recontoured to includea shallow swale and flow-through ponds. A portion of the flows going down the east side ofBlaine Road will be diverted to the west restoration area by way of a weir and culvert underBlaine Road. From the west, restoration area flows will enter detention pond 2 and then bedischarged to the ditch flowing to Grandview Road, in the existing culvert under the road, andthen northwestward to the BP duck ponds. No other impacts on water resources are expected.
Transmission System
After construction, the transmission line interconnection maintenance road would continue tohave some minor adverse impacts on local surface water flow. No other impacts to waterresources are expected.
Custer/Intalco Transmission Line No. 2
After construction, any new transmission line maintenance road would continue to have someminor adverse impacts on local surface water flow. No other impacts to water resources areexpected.
Other Project Facilities
Alcoa Intalco Works
Operation of the recycled water connection with Alcoa Intalco Works should not have anyimpact on surface or groundwater resources. The effect of the interconnection on industrial waterresources and withdrawals from the Nooksack River are discussed under construction impacts.

BP Cherry Point Cogeneration Project 3.3 Water ResourcesDraft EIS 3.3-25 September 2003
Wetland Mitigation Areas
As noted above, construction of the project and its ancillary facilities would not affect flowsthrough CMA 1, since that area does not presently receive any surface or groundwater flowsfrom the cogeneration facility or refinery interface area, a situation that would not change.During operation, surface water from the cogeneration facility would continue to be dischargedto the CMA 2 site as described under construction. As noted above, increased flows to CMA 2,combined with more effective distribution and plugging of ditches, is also expected to increasehydraulic residence time on the site, thus enhancing existing wetlands and restoring wetlands thathave been effectively drained.
3.3.3 Impacts of No Action
Under the No Action Alternative, there are no immediate plans to develop the proposedcogeneration or refinery interface areas. These areas are within the county’s Heavy ImpactIndustrial area and could be developed for another project in the future. Any future development,however, would need to reflect constraints associated with wetlands both on the cogeneration siteand in the laydown areas on the refinery site.
Under the No Action Alternative, a stand-alone merchant plant would likely be built somewherein the region to supply needed electricity. This “replacement plant” would not be likely be ableto take advantage of the cogeneration and possible water re-use opportunities that the proposedproject has at the refinery location. While the potential cogeneration opportunities are clear, therecycling and reuse possibilities are less so, due to the uncertainty of the continued operation ofthe Alcoa Intalco Works. Identification of other potential impacts would be speculative.
Under the No Action Alternative, the wetland mitigation in areas CMA 1 and CMA 2 and theeast and west restoration areas would not be constructed, and thus any improvement in habitatvalue or hydrologic function would not occur. Without these improvements, these areas wouldcontinue to provide limited wetland habitat or hydrologic functions.
3.3.4 Secondary and Cumulative Impacts
Some small cumulative impacts on surface and groundwater resources could result fromconstruction of the cogeneration facility and the neighboring GSX pipeline, if these two projectsoccurred simultaneously. The use of recycled once-through cooling water would reduce the needfor freshwater withdrawal from the Nooksack River by an average of 484 to 556 gpm. Even ifAlcoa Intalco Works never operates again, there would still be a net decrease in withdrawal fromthe Nooksack River since the proposed project would not use as much industrial water as Alcoadid.

BP Cherry Point Cogeneration Project 3.3 Water ResourcesDraft EIS 3.3-26 September 2003
3.3.5 Mitigation Measures
Construction
Mitigation Proposed by the Applicant
The following discussion of the Applicant’s proposed mitigation measures applies toconstruction impacts at all construction components of the project.
Surface Water
During construction, BMPs and the requirements of the Puget Sound Stormwater TreatmentManual for Western Washington would be applied at all construction sites where grounddisturbance would occur. This could include all elements of the project. These procedures havebeen developed to contain and slow the flow of surface and stormwater on construction sites.While primarily associated with the need to reduce or eliminate water quality impacts associatedwith construction activities, they also help to regulate surface and stormwater flow. SWPP plansfor both construction and operational activities would be prepared by the Applicant for thecogeneration facility site, and would include stormwater management procedures. The SWPPplan for construction would include a TESC plan for each phase of the cogeneration facility site.The SWPP plan and TESC plan would include the specification of all necessary BMPs forconstruction activities. The grading plan for the site would also specify the necessary BMPs forerosion. All erosion-control BMPs would be in place and functioning prior to the start ofconstruction. BMPs would include such features as hay bale barricades, silt fences, and adetention pond to slow stormwater. Slowing of stormwater would increase infiltration andrecharge of the shallow (near surface) aquifer.
Routing of surface water flowing onto the construction sites could slightly increase flow ratesdownstream of the project, but BMPs installed in newly constructed perimeter ditches shouldoffset this slight increase in flows.
The restoration areas and compensatory mitigation areas would mitigate impacts on wetlandhydrologic conditions on the project site. Other than BMPs to prevent excessive surface waterflows as described above, no mitigation measures would be necessary.
Stormwater
BMPs discussed in the surface water subsection above should also control stormwater flowsfrom the construction sites.
Flooding
Since none of the construction sites would have an impact on flooding or experience floodingevents, no mitigation measures for flooding are proposed.

BP Cherry Point Cogeneration Project 3.3 Water ResourcesDraft EIS 3.3-27 September 2003
Groundwater
All BMPs that function to slow the flow of surface water would also increase discharge togroundwater in the shallow (near surface) aquifer.
Water Rights and Water Supply
During construction, non-potable water would be supplied by a temporary connection to therefinery. A piping system would distribute the water to taps, including a fill station for watertrucks located in the work area. Water trucks would provide dust control during construction.Flow volumes would represent a slight increase over existing uses but are not expected to exceedthe capacity of the refinery’s existing contract.
Drinking water to construction workers would be provided by a water service to be contracted bythe site contractor. It is anticipated that this water would infiltrate or evaporate. Mitigationmeasures would not be required.
Wastewater
With the exception of contaminated stormwater from inside the secondary containment areas tobe discharged to the refinery wastewater treatment system, no wastewater would be expectedduring construction. Such flows would be minimal and would not require any mitigation.Sanitary waste would be handled with temporary facilities provided by an offsite contractor. Noimpacts would be expected and no mitigating measures are proposed.
Additional Recommended Mitigation Measures
If the industrial water supply pipeline from the southeast corner of the refinery to thecogeneration facility is constructed in the undeveloped area east of Blaine Road, pipeline collarsand/or trench plugs should be installed to prevent the pipeline trench from draining any wetlandsalong the alignment.
Operation
The Applicant’s proposed mitigation measures for operation of the cogeneration facility and therefinery interface portions of the project site would be the same. No operational mitigationmeasures are proposed for the transmission interconnection or transmission corridor.
Surface Water/Stormwater
The SWPP plan for operation would include structural and operational BMPs, an SPCC plan, afinal stormwater management plan, and general operating procedures. This plan would becompleted and onsite upon commencement of facility operation. The SPCC plan for operationwould include structural, operational, and treatment BMPs. Structural BMPs would includeimpervious containment, covers, and spill control and cleanup equipment. Operational BMPswould include good housekeeping, employee training, spill prevention procedures, preventative

BP Cherry Point Cogeneration Project 3.3 Water ResourcesDraft EIS 3.3-28 September 2003
maintenance, and inspections. Treatment BMPs would include oil/water separation systems andtreatment/detention ponds, as discussed below.
Groundwater
Leakage from the unlined detention facilities would increase discharge to shallow groundwater,offsetting any decreases as a result of loss of pervious surface. The mitigation wetlands have alsobeen designed to increase discharge to the shallow aquifer as mitigation for the loss of wetlandhydrologic functions.
Water Rights and Water Supply
The PUD would supply 1 to 5 gpm of water for potable and sanitation water needs. This quantityof water is small and would not impact water supply resources. Mitigation is not necessary.
If the Alcoa Intalco Works remains operational, the PUD would supply recycled industrialwastewater to the congeneration facility. The recycled water would be once-through coolingwater. The cogeneration facility would require an average of 2,244 to 2,316 gpm. The PUDwould have an average of 2,780 gpm of water; any water not used by the cogeneration facilitycould be provided to the refinery. The need to withdraw freshwater from the Nooksack Riverwould be reduced by an average of 484 to 556 gpm. The refinery’s water use would also bereduced by about 20 gpm as a result of steam provided by the cogeneration facility.
Wastewater
Industrial wastewater from the cogeneration facility would be treated in the refinery’swastewater treatment system prior to discharge to the Strait of Georgia through the BP CherryPoint Refinery's NPDES permitted outfall. Sanitary wastewater would be routed to the PUD'swastewater treatment plant for treatment and discharge to the Strait of Georgia.
3.3.6 Significant Unavoidable Adverse Impacts
The proposed project, with all its associated mitigation measures, would have a limited impacton water resources in the area. Loss of wetlands and their hydrologic functions due to fillactivities would be offset by enhancement of wetlands within the wetland mitigation areas.Increased stormwater runoff due to impervious surfaces would be offset by stormwater detentionsystems and wetland mitigation. Total water withdrawal from the Nooksack River would eitherbe slightly less or the same, depending on whether Alcoa Intalco Works was operating.Construction and operation of the project could have a significant adverse impact on theotherwise undisturbed portion of Wetland C if the ditches on the east side of the cogenerationfacility intercept surface and/or shallow groundwater flows.

BP Cherry Point Cogeneration Project 3.4 Water QualityDraft EIS 3.4-1 September 2003
3.4 WATER QUALITY
The following section describes existing water quality in the region of the proposed BP CherryPoint cogeneration facility, and assesses the project’s potential for affecting water quality.Mitigation measures to reduce or eliminate impacts that would result from the project are alsodiscussed. The analysis in this section is primarily based on information provided by theApplicant in the ASC (BP 2002, Appendix F).
3.4.1 Existing Conditions
Surface water resources are described detail in Section 3.3. The cogeneration project, includingall its ancillary facilities, is located within what is commonly called the Mountain View Uplandof Whatcom County (Newcomb et al. 1949).
The cogeneration facility, refinery site interface, and transmission line intertie are situated nearthe western end of the Terrell Creek drainage basin. Lake Terrell is the headwaters for TerrellCreek. The creek generally passes through the basin from east to west to its discharge point intoBirch Bay at the Strait of Georgia. Stormwater from the project site would be discharged to theTerrell Creek drainage basin.
The Bonneville Transmission Line No. 2 corridor between Custer and the cogeneration facilitysite traverses both the Terrell Creek Basin and the California Creek Basin. The California CreekBasin, which lies north of the Terrell Creek basin, is also located in the Mountain View Uplandand has very similar geology, geography, topography, historical development, and surface watercharacteristics to the Terrell Creek Basin. It does not, however, have a lake at its headwaters.California Creek flows generally northwest to Drayton Harbor.
Terrell Creek is classified as Class AA, extraordinary waters. Class AA waters must meet thewater quality criteria as found in Chapter 173-201A–030. The Washington State Department ofEcology has established a water quality monitoring station on Terrell Creek near Jackson Road,northwest of the cogeneration facility. Sampling during 2001 and 2002 revealed exceedancesfrom state water quality criteria for Class AA waters for fecal coliform bacteria (twoexceedances) and dissolved oxygen (seven exceedances).
Neither Terrell Creek nor Lake Terrell are included in Ecology's section 303(d) list of impairedwaters and there are no Total Maximum Daily Load (TMDL) plans or other existing waterquality limitations in effect for either water body.
No water quality data were found for California Creek in Ecology’s Internet databases. Nospecific classification for California Creek was found in WAC 173-201a. Therefore, CaliforniaCreek falls under WAC 173-201A-120 general classification and is classified as Class AA.Given that the California Creek Basin is similar in physical makeup and land use to the TerrellCreek Basin, it is reasonable to assume that water quality conditions and concerns are alsosimilar.

BP Cherry Point Cogeneration Project 3.4 Water QualityDraft EIS 3.4-2 September 2003
Industrial wastewater from the cogeneration facility would be discharged to the Strait of Georgiavia the BP Cherry Point Refinery’s wastewater treatment system. Cogeneration facilitywastewater would be treated and combined with the refinery’s wastewater and dischargedthrough the NPDES-permitted (WA-002290-0) Outfall 001. This outfall was established duringthe original refinery construction and was put in place between 1969 and 1971. The Strait ofGeorgia is designated as a Class AA marine receiving water in the vicinity of the outfall. Nosurface water quality information for the Strait of Georgia in the vicinity of the outfall could befound.
The Nooksack River is the source of industrial process water for the project. Water from theNooksack River would be piped to the site by the Whatcom County PUD, either from oncethrough non-contact cooling water from a jacketed air compressor at the Alcoa Intalco Works ifthat facility is operational or directly from the river. Water quality parameters of once throughnon-contact cooling water are presented in Table 3.4-1. It is expected that the jacketed aircompressor would alter only temperature (an increase of approximately 5°F) of the once throughnon-contact cooling water (Torpey, pers. comm., 2003).
The Nooksack River is a Class A surface water. Ecology maintains five water quality monitoringstations on the Nooksack River. The closest is located southeast of the cogeneration site atBrennan in western Whatcom County. Sampling between 1996 and 2002 revealed exceedancesfrom state water quality criteria for Class A waters for fecal coliform bacteria (five exceedances)and total mercury (two exceedances).
Table 3.4-1: Source Water Quality
Constituent Result Units
Dissolved Oxygen 8.2 mg/lHydrogen Ion 7.2 pHTemperature 21.4 CChemical Oxygen Demand ND mg/lTotal Organic Carbon 0.55 mg/lTotal Nitrate/Nitrite 0.15 mg/lFluoride ND mg/lBromide ND mg/lVanadium 0.009 mg/lAluminum 0.523 mg/lAntimony ND mg/lArsenic ND mg/lBarium 0.010 mg/lBeryllium ND mg/lCadmium ND mg/lChromium ND mg/lCobalt ND mg/lCopper ND mg/lIron 0.368 mg/l

BP Cherry Point Cogeneration Project 3.4 Water QualityDraft EIS 3.4-3 September 2003
Table 3.4-1: Continued
Constituent Result Units
Lead ND mg/lManganese 0.009 mg/lMercury ND mg/lNickel 0.001 mg/lSelenium ND mg/lThallium ND mg/lTin ND mg/lZinc 0.005 mg/lSource: Bechtel 2001
Groundwater Quality
The physical setting for regional and local groundwater is described in Section 3.3.
Groundwater within the Whatcom Basin in general, and specifically within the Mountain ViewUpland, typically has low dissolved solid content and is suitable for domestic and public watersupply. The salinity of the aquifers in this area is low (generally below 20 ppm of chloride).Reports indicate that the deeper pre-Vashon sediments also contain water of good quality evenfrom strata hundreds of feet below sea level (Newcomb et al. 1949). By contrast, groundwater inTertiary bedrock, which primarily acts as an aquitard, commonly has elevated salinity levelswhen encountered.
The most objectionable constituent in basin groundwater in the western Whatcom Basin iselevated iron (Newcomb et al. 1949). Its occurrence is confined almost entirely to recessionaloutwash sands and gravels and recent alluvial deposits. A borehole log of well 40/1E-33 Greports a “sulfur smell odor,” possibly hydrogen sulfide. Such occurrence may be due to peat orswamp deposits in close proximity to the aquifer (Newcomb et al. 1949).
A potential exists for shallow groundwater beneath the project site to be contaminated because ofits proximity to the BP industrial operation. The area appears hydraulically upgradient of facilityoperations, however, and therefore is not especially vulnerable to releases from the facility, ifthey have occurred in the past.
Refinery Wastewater
Process water from the BP Cherry Point refinery receives primary and secondary treatment in awastewater treatment system consisting of parallel oil/water separators, an equalization tank, anactivated sludge unit, a secondary clarifier, and two clarification ponds. The discharge from thewastewater treatment system is pumped into the Strait of Georgia. An NPDES permit was issuedto BP by Ecology on October 1, 1999. Table 3.4-2 lists the limitations on the treated processwastewater discharged from the refinery, as outlined in the NPDES permit:

BP Cherry Point Cogeneration Project 3.4 Water QualityDraft EIS 3.4-4 September 2003
Table 3.4-2: Refinery Effluent Limitations (pounds per day, except where noted)
Parameters Monthly Average Daily Maximum
Biochemical Oxygen Demand (five-day) 1,240 2,260Chemical Oxygen Demand 8,540 16,610Total Suspended Solids 990 1,570Oil and Grease 360 680Oil and Grease Concentration shall at no time exceed 15 mg/l and shall
not exceed 10 mg/l more than three days per month.Phenolic Compounds 8.1 16.7Ammonia as N 870 1,910Sulfide 6.7 14.7Total Chromium 12.5 27.5Hexavalent Chromium 0.9 2.0pH Within the range of 6.0 to 9.0
In a report dated May 28, 2002, BP documented the results of a study conducted in 2000-2001 todetermine the treatment and removal efficiencies of its wastewater treatment system. This reportalso includes an engineering analysis of the wastewater treatment system’s design capacity. Therefinery currently uses approximately 50% of the organic and hydraulic capacity of thewastewater treatment system (EFSEC 2003). Once treated, the water is discharged via therefinery’s existing wastewater discharge point at the Cherry Point terminal through Outfall 001under an existing NPDES permit to the Strait of Georgia.
3.4.2 Impacts of the Proposed Action
Construction
This section describes potential impacts to water quality from construction activities and projectdesign elements proposed by the Applicant to minimize or eliminate those potential impacts.
Cogeneration Facility
Potable Water and Construction Wastewater
During construction, nonpotable water would be necessary for dust control (anticipated to beabout 7 million gallons over the entire construction period). Drinking water for constructionworkers would be provided by a water service to be contracted by the site contractor. Thereshould be no impacts on the quality of the potable water source from these activities.
Water for HRSG and export steam line steam-blow tests and hydrostatic tests would be requiredfor the commissioning of the cogeneration facility, natural gas connections, and watersupply/discharge connections. The source of the test water would be the fresh industrial watersupplied by the PUD. About 15.5 million gallons of water would be needed for HRSG steam-blow testing. Export steam line steam-blow testing would require about 1.2 million gallons, andhydrostatic testing would require no more than 4.8 million gallons. Testing would take place nearthe completion of construction over a period of two to three months.

BP Cherry Point Cogeneration Project 3.4 Water QualityDraft EIS 3.4-5 September 2003
The water generated from these activities is anticipated to be “clean,” but could contain smallamounts of oil and grease. Consequently, the Applicant plans to collect and discharge the testwater to the refinery wastewater treatment system. As described above, the refinery wastewatertreatment system currently operates at approximately 50% of its organic and hydraulic capacity.Impacts on the refinery wastewater treatment system are not anticipated.
Water used for HRSG steam-blow tests would be discharged as steam to the atmosphere. Ifcontaminants are present in the water, the contaminants may be discharged to the atmospherewith the steam.
Stormwater (Surface Runoff)
The potential exists for impacts on stormwater quality either from sediment loading or fromaccidental spills and leaks. Turbid sediment-laden surface water runoff could discharge relativelydirectly to Terrell Creek along the Blaine Road ditch, or more circuitously to Terrell Creek byway of the wetland/pond areas north of Grandview Road.
A Construction SWPP plan would be developed in accordance with BMPs and would detail thesediment and erosion control measures and accidental spill prevention and control measures. TheBMPs would be implemented, inspected, and maintained to minimize the potential for adverselyaffecting downstream water quality. These may include such things as silt fencing and hay bales,and placement of polyethylene tarps to cover exposed surfaces. Control of fuel storage andequipment fueling operations for spill prevention and control would be detailed in the SWPPplan. These BMPs would be inspected after every storm event greater than 0.5 inches ofprecipitation in 24-hours to assess damage and maintenance requirements, if any.
As described in Section 3.3, the construction stormwater collection and treatment system wouldinclude diversion ditches to prevent runoff from areas outside the cogeneration project site fromentering the site. Stormwater runoff from within the cogeneration project site would becontained, collected, and routed to the stormwater treatment and detention system. Silt fencesand temporary swales on the construction site would lead runoff to the treatment and detentionsystem. Perimeter silt fences around the construction zone would be installed to remove sedimentfrom runoff before it reaches the site boundary. Additional localized silt fencing would be usedas required during construction to minimize erosion and transport of soil. Temporary swaleswould be constructed to accommodate areas being excavated or filled. Once the preliminary cut-and-fill work is complete, the swales would likely remain in place until final grading. Whereverpossible, temporary swales would be incorporated into the permanent stormwater collectionsystem. The perimeter silt fence would not be removed until the site has been stabilized. Ingeneral, the stormwater treatment and detention system would consist of oil/water separationsystem equipped with a shutoff valve in case of an accidental release for containment.Emergency cleanup equipment and supplies would be available onsite for rapid response.Stormwater would be discharged from the oil/water separation system into a final treatment anddetention pond (1) located near the northwest corner of the site. The unlined pond would beproperly sized in accordance with Whatcom County and Ecology requirements, and theneventually discharged to wetlands from the treatment/detention pond. Additional stormwater

BP Cherry Point Cogeneration Project 3.4 Water QualityDraft EIS 3.4-6 September 2003
quality treatment would be achieved when water discharged from the construction stormwatertreatment system reaches the wetlands between the project area and Terrell Creek.
As elements of the permanent stormwater collection system are installed within the cogenerationproject site (see discussion below), they would be used to contain, collect, and treat constructionrunoff. Silt fencing intended to prevent sediments from entering would protect inlets to thepermanent system. Seeding and mulching would be used where practical for slope stabilizationas rough grading is completed.
Containment pits or other means of confinement would be provided locally near each potentialsource of contaminating materials to provide for protection against spillage. A SWPP plan wouldbe established prior to commencement of construction activities.
With implementation of the planned construction stormwater collection and treatment system,SWPP plan, and BMPs, there would be no adverse change to the returning quality of thecollected stormwater to the Terrell Creek drainage basin.
Sanitary Waste
Portable sanitation units would be used during construction of the cogeneration facility. Theseunits would be maintained on a regular basis, and a licensed Sanitary Waste ManagementContractor would collect waste from the units for disposal in accordance with applicableregulations. Sanitary waste generation is anticipated to be 500 gallons per day in conjunctionwith the construction phase.
Groundwater
A potential exists for impacts on groundwater through accidental spills of construction chemicalsor through fuel and lubricant leaks from construction equipment. A list of chemicals anticipatedto be used during construction is provided in Table 3.4-3.
If an accidental release did occur and reached bare ground, the surface soils and underlyingBellingham drift are expected to be an effective medium for chemical absorption and retardation.Both the surface soils and Bellingham drift contain fine-grained silts and clays, which wouldslow infiltration but not prevent it.
There is limited potential for impacts to the Deming aquifer from construction-related spills orleaks due to the thickness of the overlying Bellingham drift and its low permeability. Bycontrast, there is a greater potential for impacts to the upper water-bearing zone due to itsshallow depth and higher permeability soils. Impacts to this shallow groundwater zone wouldlikely require a large-volume spill that was undetected for an extended period of time. A large-volume spill that was immediately detected and cleaned up would have a very low potential forimpacting the upper water-bearing zone.

BP Cherry Point Cogeneration Project 3.4 Water QualityDraft EIS 3.4-7 September 2003
Table 3.4-3: Chemicals to Be Used and Stored During Construction
Chemical Purpose Estimated Quantity Storage Location
STG and pre-boiler pipingcleaners
STG and pre-boiler piping cleaningwaste, chelant chemical cleaner, ordemineralized water treated withoxygen scavenger and amine
400,000 gallons Brought to site byequipment vendor/contractor
Solvents, used equipmentlube oils, paints, adhesives
Used in construction 200 gallons monthly Not known at this time
Used and waste oils For CGT and STG lube oil flushes 200 55-gallon drumsover life of construction
Not known at this time
Spent lead batteries Various 3 batteries annually Not known at this timeSpent alkaline batteries Various 80 batteries monthly Not known at this timeWaste oil from oily wasteholding tank
Collected onsite 25 gallons monthly Not known at this time
Oil rags, oil absorbent Generated during normalconstruction activities, excludinglube oil flushes
55 gallons monthly Not known at this time
Argon Gas Welding and HRSG components Not known at this time Temporary warehouseAcetylene Cutting torches Not known at this time Temporary warehouseHelium Welding aluminum ducts Not known at this time Temporary warehouseNitrogen Welding Not known at this time Temporary warehouseOxygen Cutting torches Not known at this time Temporary warehouseSource: BP 2002
Refinery Interface
Stormwater treatment measures for the refinery interface would be similar to those described forthe cogeneration facility. Construction stormwater would be routed through oil/water separationfacilities then to an unlined stormwater detention pond (2) located in the southwest corner ofLaydown Area 2.
The refinery interface includes most of the piping systems that would require hydrostatic testingprior to operation. As discussed above, this test water would be routed through the refinerywastewater treatment system prior to discharge to the Strait of Georgia via Outfall 001. Noimpact on the refinery’s wastewater treatment system nor the Strait of Georgia surface water andsediment is expected. The refinery wastewater treatment system currently operates at 50% of itscapacity and should, therefore, accommodate the additional temporary inputs without reductionin outfall quality.
Transmission System
This new 0.8-mile transmission line would require the construction of five towers. As describedabove for the cogeneration facility, the potential for contamination of stormwater from sedimentor accidental spills is possible during tower construction. Implementation of the constructionSWPP plan and appropriate BMPs would protect against adverse impacts on surface water andgroundwater quality.

BP Cherry Point Cogeneration Project 3.4 Water QualityDraft EIS 3.4-8 September 2003
The 150-foot-wide electrical transmission line corridor has not yet been cleared of trees,although the access/maintenance roads leading to the transmission line corridor have beendeveloped. Three pads for the transmission towers have already been constructed. The gravelpads are approximately 50 feet by 50 feet. One additional pad will be constructed at a later dateadjacent to the existing Bonneville Transmission Corridor. There are two gravel access roads,approximately 15 feet wide, which have been developed for construction and access of thetransmission pads and footings. These pads and access roads were constructed under an existingClean Water Act permit. BMPs such as silt fences, straw bales, and munching would be used asnecessary during clearing of the corridor and construction of the remaining tower pad to controlerosion until the area can be stabilized with gravel or vegetation.
Custer/Intalco Transmission Line No. 2
Upgrading the existing approximately 5-mile corridor may require placement of several newtowers (the number of new towers required has not been determined). Potential impacts onsurface water and groundwater quality are similar to those described for the cogeneration facility.Implementation of the construction SWPP plan and appropriate BMPs would protect againstadverse impacts on surface water and groundwater quality.
The upgrade option involving the Remedial Action Scheme, rather than the option requiringplacement of new towers, would not impact water quality.
Other Project Components
Potential impacts on surface water and groundwater quality during construction of the otherproject components are similar to those described for the cogeneration facility. Implementationof the construction SWPP plan and appropriate BMPs would protect against adverse impacts onsurface water and groundwater quality.
The new section of the industrial water supply pipeline would need to be hydrostatically testedprior to operation. As discussed above, this test water would be routed through the refinerywastewater treatment system prior to discharge to the Strait of Georgia via Outfall 001. Noimpact to the refinery’s wastewater treatment system nor the Strait of Georgia surface water andsediment is expected.
Operation
Cogeneration Facility
Process Wastewater
Wastewater sources would include the following:
• Treatment of raw water to produce high-quality boiler feedwater (BFW) and refinery returncondensate treatment;

BP Cherry Point Cogeneration Project 3.4 Water QualityDraft EIS 3.4-9 September 2003
• Equipment drains - collection of water and/or other minor drainage from various types ofequipment (“oily wastewater”); and
• Cooling tower blowdown.
The estimated flows and chemical compositions of waste streams from the cogeneration project,except for sanitary wastewater, are provided in Table 3.4-4.
Table 3.4-4: Wastewater Flows and Chemical Composition
Demineralization PlantRegeneration Water (Includes
Filter Backwash)
Equipment Drain andWashdown Oily
Wastewater
CogenerationCooling Tower
Blowdown
Average Flow (gpm) 54 5 131 10
Peak Flow 300 gpm 50 gpm 400 gpmDuration 1 hr/day 30 min/day 8 hrs/dayGeneral ParameterspH (pH units) 6.5 – 8.5 7.0 – 7.5 8.0 – 9.5 13
Dissolved oxygen (mg/L) 8 8 8COD 8 1 65 1 200 12
BOD 4 1 33 1 81 12
Oil and grease (mg/L) 2 20 0.3TDS (mg/L) 5,000 62 2,200TSS (mg/L) 28 20 50Temperature (ºF) < 80 < 80 < 100Major Cation Concentration (mg/L)Ca 54 14 207Mg 20 5 77Na 1,688 11 165K 3.6 1 14Major Anions Concentration (mg/L)HCO3 62 67 200CO3 0 0 0Cl 12 3.2 287 9
SO4 2,950 14 1,024 9
Trace Metals Concentration (mg/L)Ag 2a 0.004 0.001 0.015Al 2 3.0 0.75 11.25As 2a 0.004 0.001 0.24 (0.512) 7
Ba 2 0.072 0.018 0.27Trace Metals Concentration (mg/L)Be 2a 0.004 0.001 0.015Cd 2a 0.004 0.001 0.015Cr 2 0.008 0.002 0.20 (0.918) 7
Co 2a 0.02 0.005 0.075Cu 2a 0.02 0.005 0.23 (0.291) 7
Fe 2 0.308 0.077 1.16Hg 2a 0.002 0.0005 0.0075Mn 2 0.588 0.147 2.205Ni 2a 0.004 0.001 0.015Pb 2a 0.004 0.001 0.015Sb 2a 0.004 0.001 0.015Se 2a 0.004 0.001 0.015

BP Cherry Point Cogeneration Project 3.4 Water QualityDraft EIS 3.4-10 September 2003
Table 3.4-4: Continued
Demineralization PlantRegeneration Water (Includes
Filter Backwash)
Equipment Drain andWashdown Oily
Wastewater
CogenerationCooling Tower
Blowdown
Sn 2a 0.16 0.04 0.6Tl 2a 0.004 0.001 0.015V 2 0.036 0.009 0.135Zn 2 0.04 0.01 2.0 9
Other Anions Concentration (mg/L)SiO3 40 10 150PO4 2.0 0.5 10 9
F 2a 2.0 0.5 7.5NO3 /NO2 4.0 1.0 15NH3 /NH4
3 3 3
Br 2a 0.02 0.005 0.075Organics Concentration (mg/L)Dissolved organic carbon 4 4 4
Polymers (polyquarternaryamine) 19 5 0 0Polymers (polyacrylamide) 0 0 10 8
Total organic carbon 48 6 12 50 11
Source: Bechtel 2001Notes: 1 Based on typical ratio between oil and grease, COD and BOD in industrial wastewater.
2 Trace metal data reported, except aluminum (Al), are based on a single test report by Edge Analytical (Ref 01-4184, 08/29/2001). Actual quantities would be related to background concentrations as follows:• For Denim Plant Regeneration Water (Includes Filter Backwash), the actual concentration would be
approximately four times the background concentration in the Whatcom PUD water.• For Equipment Drain and Washdown Oily Wastewater, the actual concentration would be the background
concentration in the Whatcom PUD water.• For Cogeneration Cooling Tower Blowdown, the actual concentration would be approximately 15 times the
background concentration in the Whatcom PUD water.Values for Aluminum are based on historical average values as supplied by Whatcom County PUD andconcentrated on the same basis as the rest of the trace metals.
2a The Edge Analytical test showed no detectable quantity of this component. The quantities shown are based on thedetection limit for the analytical test and are concentrated by 1, 4, or 15 times as described in Note 2.
3 Not detected in site samples; not normally present in surface waters at detectable levels.4 Included with total organic carbon concentration value.5 This type of polymer may be used to treat makeup water, which is filtered prior to demineralization.6 This is an assumed value and is based on four times the value typical for surface waters subject to elevated TOC
due to seasonal runoff.7 This is an estimated value, and is 15 times the value obtained in a test performed by Edge Analytical (Reference #
01-4184) plus the highest anticipated leachate rate from CCA-C wood used in cooling tower construction. Thishighest concentration occurs initially upon cooling tower startup. Over a period of about one year, this initialconcentration would decrease about 40–80%. The number in parentheses is the highest initial concentration; theother number in the cell is the longer-term concentration.
8 This type of polymer may be used as a dispersant in the cooling tower recirculating water.9 This value reflects addition of this substance to the cooling tower recirculating water to control pH and limit
biofouling and corrosion.10 This value could increase to 203 gpm if the cooling tower is operated at 10 cycles of concentration as opposed to
15. Concentrations of chemical species relating to the cooling tower would then be reduced in inverse proportion.Total mass flow of species listed would remain constant. Because 10-cycle operation requires 72 gpm moremakeup water on an average basis than 15-cycle operation, freshwater requirements for the cogeneration facilityare given for 10-cycle operation.
11 This value is based on a typical average surface water TOC concentration of 3 to 4 mg/L, with the cooling toweroperating at 15 cycles of concentration.
12 Based on typical ratios between TOC, COD, and BOD in municipal wastewater; which represent theserelationships when the TOC, COD, and BOD are not derived from petrochemical wastes.
13 Normal control range: 8.2 to 8.8 pH

BP Cherry Point Cogeneration Project 3.4 Water QualityDraft EIS 3.4-11 September 2003
There would also be a periodic wastewater stream generated when a gas turbine is shut down inorder to wash the turbine blades and restore peak operating efficiency. This is done once perquarter per gas turbine at most, depending on blade fouling severity. The operation generatesapproximately 2,300 gallons of water per wash that contains dirt deposits removed from theblades, along with detergents used for the cleaning operation. The current plan, because it is notknow what effect the detergent would have on the refinery’s wastewater treatment system, is tocollect this water in a sump and transport it offsite for treatment and disposal. The collected washwater would be tested, and if determined to be appropriate, would be treated by the refinery’swastewater treatment system and discharged to the Strait of Georgia through Outfall 001.
Anticipated water quality from the boiler blowdown is also listed in Table 3.4-4.
The streams generated during normal operation represent the majority of the wastewater flowsand are proposed to be handled as follows:
• Raw Water Treatment Waste and Refinery Return Condensate Treatment Waste: Filters areused to remove the relatively small amount of suspended solids present in the water receivedfrom the PUD. Filtration is required as a first step in the production of high-quality BFW.Periodically, each of the three filters in the unit would be backwashed to remove the solidsfrom the filter media. The backwash water is collected in a large tank (equalization tank),which is then pumped at a controlled rate to the refinery’s wastewater treatment system.
The condensate being returned from the refinery to the cogeneration facility would be treatedthrough a precoat filter system to remove any trace oil. When the precoat filter material isreplaced, the spent precoat material (a mixture of powdered cellulose and powdered activatedcarbon) would be collected in a tank and dewatered for disposal. The water removed as aresult of the dewatering process would be sent to the refinery wastewater treatment plant.
Ion exchange units are also used to purify water from the PUD and condensate returned fromthe refinery. Dissolved ionic species must be removed in order to generate high-pressuresteam in the HRSGs without fouling or corroding the boiler tubes. The resins in the ionexchange units eventually become saturated as their capacity for removing ions has beenreached. It is then necessary to regenerate these resins with dilute sulfuric acid and sodiumhydroxide. These chemicals, along with the removed ions and rinse waters, are collected inthe neutralization tank, neutralized to a pH of between 6.5 and 8.5, pumped to theequalization tank, and then pumped to the refinery’s wastewater treatment system. The filterbackwash is also part of this stream.
• Equipment Drains: Some pumps and steam turbines may use small quantities of water to coolbearings or lubricate seals. Water draining from this equipment has the potential to come incontact with surfaces that may have lubricating oil on them. As such, this wastewater has thepotential to contain trace free oil. In addition, some equipment must be flushed with waterprior to being opened for maintenance. This water may also contain impurities, which wouldrequire treatment. These waters would be collected in a sump, held in an equalization tank,and pumped to the refinery's wastewater treatment system.

BP Cherry Point Cogeneration Project 3.4 Water QualityDraft EIS 3.4-12 September 2003
• Cooling Tower Blowdown: The blowdown from the cogeneration facility cooling towerwould be held in an equalization tank with other cogeneration wastewater streams (exceptsanitary wastes) and pumped at a controlled rate to the refinery wastewater treatment system.
After treatment in the refinery wastewater treatment system, wastewater from the cogenerationfacility would be discharged along with the refinery wastewater to the Strait of Georgia. Thecogeneration facility would add approximately 190 gpm on average, assuming 15 cycles ofconcentration in the cooling tower of non-recyclable process wastewater, to the refinerydischarge. Table 3.4-5 presents a numerical analysis of the potential impact of the cogenerationfacility wastewater on the refinery’s wastewater stream. The impact analysis is based on theaverage discharge from the refinery wastewater treatment study that was conducted in July,August, and September of 2001.
Table 3.4-5: Potential Impact of Proposed Cogeneration Facility on the Existing RefineryWastewater Discharge to Outfall 001 to the Strait of Georgia
ParameterCogeneration
ProcessWastewater
Refinery ProcessWastewater after
Treatment
Percentage of Increase withCogeneration Contribution
(after treatment by refinery) 1
Discharge Flow (gpm) 190 2,338 8.1%Biochemical Oxygen Demand (BOD)
lbs./day mg/l132 275 1%
Chemical Oxygen Demand (COD) lbs./day 323 2,235 0.6%Total Suspended Solids (TSS) lbs./day 98 427 14.9%Oil and Grease (lbs./day) 3 115 0.1%Total Chromium (lbs./day) 0.32 (1.45) 0 2
Temperature (oF) 93.8 82.7 1%pH 6.5 - 9.5 8.0 - 8.6 Minimum -1%1 Based upon treatment efficiencies documented in the BP Cherry Point Treatment Efficiency Study and Engineering Report,
May 2002.2 Not estimated – the Treatment Efficiency Study report does show that metal concentrations are reduced through the refinery
wastewater treatment system.
Stormwater
The potential exists for impacts on stormwater quality from accidental spills of chemicals usedduring operations, from runoff across surfaces containing contaminants, or from runoff acrossareas of bare soil. Of these, runoff across bare soil is the least likely, given that most industrialfacilities landscape those parts of the site that are not otherwise covered by buildings orpavement.
Chemicals anticipated to be used or stored during the cogeneration facility operation are listed inTable 3.4-6. There is a potential for accidental release of these chemicals to areas subject tostormwater runoff.

BP Cherry Point Cogeneration Project 3.4 Water QualityDraft EIS 3.4-13 September 2003
Table 3.4-6: Chemicals Used During Operations and Maintenance
ChemicalEstimatedQuantity
Storage Purpose
Lubricating oil 22,900 gallons In STG and GTG equipment,lockers for smaller rotatingequipment
Lubrication of rotatingequipment
Control oil 230 gallons In STG equipment STG equipmentHydrogen 60,400 scf GTG/STG gas bottles Coolant for power
generationCarbon dioxide 41,000 scf GTG/STG gas bottles Purge and fire
protection for powergeneration equipment
Transformer oil 48,000 gallons Combustion turbine transformers CoolantTransformer oil 30,000 gallons Steam turbine transformer CoolantTransformer oil 6,000 gallons Auxiliary transformers CoolantAnhydrous Ammonia 940,000 annually Above grade horizontal
cylindrical tankNox reduction
SCR Catalyst 4,800 ft3 In HRSG Nox reductionCO Catalyst 990 ft3 In HRSG CO reductionPropylene glycol 17,500 gallons Above grade tank Closed loop cooling
water systemBPC-68170 (nitrate/borate) corrosion
inhibitor50 gallons Drum Closed loop cooling
water systemBPB-59396 (diethyl hydroxylamine)
oxygen scavenger500 gallons Tank Water treatment system
BPB-59465 (morpholine) corrosioninhibitor
500 gallons Tank Water treatment system
Di- and trisodium phosphatepH/scale control agent
200 pounds Bags/tank Water treatment system
Cation resin 950 ft3 Warehouse/tank Water treatment systemAnion resin 900 ft3 Warehouse/tank Water treatment systemCaustic (50 wt%) 8,000 gallons Tank Water treatment systemSulfuric acid (93 wt%) 8,000 gallons Tank Water treatment systemBPW-76321 (polyquaternary amine)
polymer350 gallons Tank Water treatment system
Natural Gas N/A Pipeline FuelSource: Duke/Fluor Daniel 2001
Stormwater quality may also be impacted by runoff from surfaces containing oil and grease, suchas parking areas or roadways.
A SWPP plan for operational procedures, in conjunction with the SPCC plan, would providestructural, operational, and erosion/spill control BMPs for all stormwater operational activities ofthe plant site.
The cogeneration facility site would be divided into three primary drainage areas for thepurposes of runoff design. The first area would consist of the switchyard area on the easternportion of the site. The second area would consist of the remainder of the developed site, whichincludes the power block, cooling tower, and administrative functions. The third would bestormwater that could become impacted from a storage tank accidental release.

BP Cherry Point Cogeneration Project 3.4 Water QualityDraft EIS 3.4-14 September 2003
The switchyard area would be surfaced with crushed rock to allow some percolation into the soilbelow. The area would be graded at about a 1 percent slope so as to sheet flow excess runofftoward a collection system consisting of swales, catch basins, manholes, and underground pipe.
Most of the remaining plant areas would be asphalt-paved, covered with crushed rock or grass,or covered with buildings or enclosures. The finish surfaces of the cogeneration facility sitewould be sloped from a high point located near the center of the main piperack toward lowpoints along the edge of plant roads. Runoff would sheet flow across the site toward a collectionsystem similar to that described above. All surface runoff would be captured by the surfacedrainage system then be directed through an underground piping system to the stormwatertreatment and detention system. The stormwater treatment and detention system would consist ofan oil/water separation system equipped with a shutoff value in case of an accidental release forcontainment. Emergency cleanup equipment and supplies would be available onsite for rapidresponse. Stormwater would be discharged from the oil/water separation system into a finaltreatment and detention pond properly sized in accordance with Whatcom County and Ecologyrequirements. The detention pond, located in the same location as the construction stormwaterdetention pond (1), will either be lined or unlined. If unlined, a groundwater impact evaluationwould need to be preformed by the Applicant. Stormwater would be discharged to mitigationwetlands from the detention pond.
The third area for stormwater collection results from stormwater accumulating within thesecondary containment structures for outside tanks and chemical storage areas. This stormwater,expected to be of small volume, would be separated from other stormwater because of releasesthat could potentially occur from the tanks. This stormwater would be retained withincontainment structures and analyzed for contaminants. If contaminants are present, thisstormwater would be routed to the refinery wastewater system. The water would leave thecogeneration facility site along with the plant wastewater, be discharged into the existing refinerywastewater treatment system, and then processed by the refinery’s wastewater treatment plant. Ifwater quality analysis indicates no contaminants are present, the stormwater would be routed tothe cogeneration facility’s stormwater treatment system.
Sanitary Waste
Sanitary waste from cogeneration facility employees would be collected and routed for treatmentby the Birch Bay Wastewater Treatment Plant (WWTP) via the refinery’s sanitary wastewatersystem. The estimated amount of sanitary waste generated by the cogeneration facility isbetween 1 and 5 gpm. The Birch Bay Water and Sewer District has confirmed that it has thecapacity to accommodate the incremental combined loading to its sanitary sewage wastewatertreatment system from the refinery and the proposed cogeneration facility. The WWTP wouldtreat the refinery and cogeneration facility sanitary wastes before discharge to the Strait ofGeorgia. The quantity of sanitary waste that would be generated by the cogeneration facility isnot expected to affect receiving water quality in the Strait of Georgia.
BP Cherry Point Cogeneration Project 3.4 Water QualityDraft EIS 3.4-15 September 2003
Groundwater
Fuels, lubricants, and other chemicals that would be used during operation are listed in Table3.4-6. There is a potential for short-term accidental spills or long-term leaks of these chemicalsto affect the shallow (near surface) groundwater system. The upper water-bearing zone is atgreatest risk due to its shallow depth. The deeper Deming aquifer is protected by the Bellinghamdrift aquitard and is at significantly less risk.
If an accidental release did occur, the surface soils and underlying Bellingham drift are expectedto be an effective medium for chemical absorption and retardation. Both the surface soils andBellingham drift contain fine-grained silts and clays, which would reduce infiltration andenhance retardation.
The operational SWPP plan and SPCC would outline measures to minimize and prevent impactson groundwater from accidental spills during facility operations.
Refinery Interface
Maintenance activities on components of the refinery interface could result in chemical spillsthat could impact surface water and groundwater quality. Potential spills could enter thestormwater collection system, if not contained at the site of the spill, and eventually reach theoil/water separation system of the cogeneration facility stormwater collection and treatmentsystem. Contaminated water would be isolated at the oil/water separator(s), collected, and treatedas appropriate. Surface water and groundwater quality would not be affected.
Transmission System
Maintenance activities on the transmission system could result in chemical spills that couldimpact surface water and groundwater quality. A SWPP plan for maintenance procedures, inconjunction with the SPCC plan, would provide structural, operational, and erosion/spill controlBMPs for all maintenance activities on the transmission system. The transmission intertie accessroads and tower pads allow stormwater infiltration to occur and would not substantially increasethe amount of stormwater runoff over existing conditions. The surrounding areas are undisturbedgrassland and forest.
Custer/Intalco Transmission Line No. 2
Maintenance activities on the Custer/Intalco Transmission Line No. 2 could result in chemicalspills that could impact surface water and groundwater quality. This element of the project wouldbe owned and operated by the Bonneville Power Administration. Presumably, Bonneville has aSWPP plan for maintenance procedures, in conjunction with a SPCC plan that would providestructural, operational, and erosion/spill control BMPs for all maintenance activities on thetransmission line.

BP Cherry Point Cogeneration Project 3.4 Water QualityDraft EIS 3.4-16 September 2003
Other Project Components
Operation and maintenance of the industrial water supply pipeline and associated components atthe Alcoa Intalco Works could result in potential erosion/sedimentation and chemical spills thatcould impact surface water and groundwater quality. This element of the project would be ownedand operated by Whatcom County PUD. Presumably, the PUD has a SWPP plan for maintenanceprocedures, in conjunction with a SPCC plan that would provide structural, operational, anderosion/spill control BMPs for maintenance activities at their facilities.
3.4.3 Impacts of No Action
Under the No Action Alternative, there would be no immediate plans to develop the proposedsite. There would, therefore, be none of the impacts on water quality that are described above.The area is within the Heavy Impact Industrial area could be developed for another project in thefuture. Presumably, future industrial projects would have similar impacts to those described forthe cogeneration project.
3.4.4 Secondary and Cumulative Impacts
Secondary Impacts
Construction and operation of the cogeneration project would result in the removal of 30.51acres of wetland from the cogeneration facility site and laydown areas. There is a potential waterquality impact to water reaching Terrell Creek from the loss of water quality treatment that thosewetlands currently provide. This would be offset by the establishment of construction andoperation stormwater collection and treatment systems on the affected areas and mitigationwetlands associated with the project.
Cumulative Impacts
Several industrial dischargers are located in the general vicinity of the proposed cogenerationproject. These include the BP Cherry Point Refinery, the Conoco-Phillips Refinery, TenaskaWashington Cogeneration Power Plant, and Alcoa/Intalco. All these facilities currently dischargeto the Strait of Georgia. Also in the general vicinity is the Birch Bay sewage treatment plantwhich discharges to Birch Bay, an embayment of the Strait of Georgia. The area is zoned heavyindustrial. It is possible that additional industrial development would occur in the area in thefuture. Future industries locating in this area would likely discharge wastewater to the Straight ofGeorgia and stormwater to the Terrell Creek and California Creek basins.
The cogeneration facility would add 190 gpm of treated wastewater to the Strait of Georgia atCherry Point, which is an increase of about 8% over the current discharge from the BP CherryPoint Refinery. Although a relatively small increase, this adds to the overall burden to waterquality of the Strait of Georgia.

BP Cherry Point Cogeneration Project 3.4 Water QualityDraft EIS 3.4-17 September 2003
3.4.5 Mitigation Measures
Mitigation measures for potential water quality impacts from the project are discussed below.Much of what would typically be considered mitigation for impacts is inherent in the projectdesign, and is discussed in greater detail in the impacts discussion above. Water quality impactmitigation would primarily be addressed by development and implementation of constructionand operation SWPP plans that include erosion and sedimentation control plans and SPCC plans.A required State Waste Discharge Permit and Fact Sheet for construction and operation of theproject are currently under development by EFSEC. The permit and fact sheet would outlinewater quality and quantity effluent limitations, required treatment strategies, and performancestandards.
Construction
Mitigation Proposed by the Applicant
Industrial Water Mitigation Measures
Water used for hydrostatic testing would require capture and discharge. The destination of thehydrostatic test water would be to the refinery wastewater system. The quality of the waterwould be tested prior to discharge to that system. Hydrostatic test water would only bedischarged to the refinery’s wastewater treatment system if testing confirmed that it was withinacceptable limits for discharge to that system. After treatment, the hydrostatic test water wouldbe discharged to the Strait of Georgia through the Refinery Outfall 001.
Stormwater Mitigation Measures
Stormwater quality will be preserved during construction by preventing erosion on the site to thegreatest extent possible and using settling and detention basins prior to discharging thestormwater into the natural drainage system north of Grandview Road. The constructionstormwater treatment system design is discussed in Section 3.4.2. SWPP plans for constructionactivities would be prepared for the cogeneration facility site, and would include stormwatermanagement procedures. The SWPP plan for construction would include a TESC plan for eachphase of cogeneration facility construction. The SWPP plan and TESC plan would include thespecification of all necessary BMPs for construction activities as specified in the StormwaterManagement Manual for Western Washington (Ecology 2001b). The grading plan for the sitewould also specify the necessary BMPs for erosion. All erosion control BMPs would be in placeand functioning prior to the start of construction.
The SWPP plan for construction would include a TESC plan with the 12 elements required byEcology:
1. Mark Clearing Limits2. Establish Construction Access3. Control Flow Rates4. Install Sediment Controls

BP Cherry Point Cogeneration Project 3.4 Water QualityDraft EIS 3.4-18 September 2003
5. Stabilize Soils6. Protect Slopes7. Protect Drain Inlets8. Stabilize Channels and Outlets9. Control Pollutants10. Control Dewatering11. Maintain BMPs12. Manage the Project
The SWPP plan for construction also would include general operation and maintenancedescriptions of the BMPs used onsite. This plan would be completed and onsite forimplementation upon commencement of construction. Containment pits or other means ofconfinement would be provided locally near each potential source of contaminating materials toprotect against spillage.
BMPs as described in the Stormwater Management Manual for Western Washington (Ecology2001b) would be used to control stormwater runoff during construction and to minimize soilerosion. The stormwater design for the project is described in detail in Section 3.4.2.
Wastewater Mitigation Measures
Wastewater would be generated for HRSG and export steam line steam-blow and hydrostatictests necessary for commissioning the cogeneration facility, natural gas connections, and watersupply/discharge connections. About 15.5 million gallons of water would be needed for HRSGsteam-blow testing. Export steam line steam-blow testing would require about 1.2 milliongallons, and hydrostatic testing would likely require no more than 4.8 million gallons. Testingwould take place near completion of construction over a period of two to three months.
The water generated from these activities is anticipated to be clean, but could contain smallamounts of oil and grease. Consequently, the Applicant plans to collect and discharge the testwater to the refinery’s wastewater treatment system. The potential for deleterious impacts on therefinery system is expected to be low; the Applicant has stated that large volumes of test waterhave been routed to the refinery system in the past without difficulty (BP 2002, Responses toComments).
Groundwater Mitigation Measures
A SWPP plan would be prepared and implemented for construction activities, which wouldinclude worker training, refueling procedures, and operational/structural controls to minimize thepotential for spills and leaks to occur. To minimize the potential release of chemicals duringconstruction, BMPs would be employed. These would include good housekeeping measures,inspections, containment facilities, minimum onsite inventory, and spill prevention practices.Construction personnel would be instructed regarding the management requirements, and theApplicant's onsite Project Manager would be responsible for their implementation.

BP Cherry Point Cogeneration Project 3.4 Water QualityDraft EIS 3.4-19 September 2003
Additional Recommended Mitigation Measures
EFSEC is currently developing State Waste Discharge Permit conditions for construction of thecogeneration facility project. These conditions would include elements of the proposed projectdesign intended to reduce or eliminate impacts on water quality as well as additional measuresnot currently included in the project design. The State Waste Discharge Permit would specifyconstruction stormwater effluent limits and monitoring requirements. The draft State WasteDischarge Permit effluent limitations are described in Table 3.4-7.
Monitoring of stormwater would commence at the beginning of construction.
Also covered under the State Waste Discharge Permit are conditions related to hydrostatic testwater. The Applicant would be required to develop and implement a plan to characterize thehydrostatic test wastewater for conventional and priority pollutants and determine if thiswastewater can be properly disposed of in the refinery’s wastewater treatment system prior todischarge.
Table 3.4-7: Stormwater Effluent Limitations
Parameter Daily Maximum Monthly Average
Oil and Grease1 15 mg/L2 10 mg/LTotal Suspended Solids3 25 mg/L 15 mg/LToxics No toxics in toxic amounts4
1 Measured at discharge of oil/water separators.2 The oil and grease concentration shall not exceed 10 mg/l more than three days each month.3 Measured at discharge of stormwater treatment/detention pond.4 No toxics in toxic amounts” is generally evaluated by comparing the results of priority pollutant testing to state and federal
water quality standards to determine compliance.
Operation
Mitigation Proposed by the Applicant
Stormwater Mitigation Measures
SWPP plans for operational activities would be prepared for the cogeneration facility, and wouldinclude stormwater management procedures. The SWPP plan for operation would includestructural and operational BMPs; a SPCC plan; a final stormwater management plan; and generaloperating procedures. This plan would be completed and onsite upon commencement of plantoperation. The SPCC plan for operation would include structural, operational, and treatmentBMPs. Structural BMPs would include impervious containment, covers, and spill control andcleanup equipment. Operational BMPs would include good housekeeping, employee training,spill prevention procedures, preventative maintenance, and inspections. Treatment BMPs wouldinclude oil-water separation systems and treatment/detention ponds as discussed below. Thestormwater design for cogeneration facility operation is described in Section 3.4.2.

BP Cherry Point Cogeneration Project 3.4 Water QualityDraft EIS 3.4-20 September 2003
During cogeneration facility operation, runoff from operational areas within the facility sitewould be within required limits after treatment. Runoff from surfaces, which potentially may beimpacted by grease or oil, would be treated using an oil-water separation system. Stormwatereffluent limits would be contained within the State Waste Discharge Permit being prepared byEFSEC. Draft effluent limits for stormwater are presented in Table 3.4.7.
Runoff quantities from the water supply and natural gas connections during operation would beapproximately the same as the natural (existing) conditions. Runoff quality from these areaswould be controlled by revegetation of the surface after installation and backfilling. Therefore,additional mitigation would not be needed.
Wastewater Mitigation Measures
Industrial wastewater from the cogeneration facility would be treated in the refinery’swastewater treatment system prior to discharge to the Strait of Georgia through the refinery'sNPDES-permitted outfall. Sanitary wastewater would be routed to the WWTP for treatment anddischarge to the Strait of Georgia through Birch Bay Sewer District’s NPDES permitted outfall.
Groundwater Mitigation Measures
Prior to operation of the cogeneration facility, a SPCC plan would be prepared. The SPCC planwould contain spill response, containment, and prevention procedures. The SPCC plan foroperation of the facility would include structural, operational, and treatment BMPs. StructuralBMPs include impervious containment, covers, and spill control kits. Operational BMPs includegood housekeeping, employee training, spill prevention, preventative maintenance, andinspections. Treatment BMPs include Stormwater Treatment Pond 1 and oil water separators asdiscussed above.
A number of safeguards would be incorporated to mitigate the risks of a release to theenvironment from stored operational chemicals. These include but are not limited to secondarycontainment, tank overfill protection, routine maintenance, safe handling practices, supervisionof all loading/unloading by plant personnel and the truck driver, and appropriate training ofoperation and maintenance staff.
Additional Recommended Mitigation Measures
EFSEC has developed draft State Waste Discharge Permit conditions for operation of thecogeneration facility. These conditions include discharge limitations, monitoring requirements,reporting and record keeping requirements, an operation and maintenance plan for water qualitytreatment facilities, development of SPCC and hazardous waste management plans, and a SWPPplan.
Stormwater effluent limits are presented in Table 3.4-7. Additionally, no discharge that causes orcontributes to a violation of water quality standards established under section 307(a) of the CleanWater Act or Chapter 173-201A WAC shall be allowed. There shall be no discharge of

BP Cherry Point Cogeneration Project 3.4 Water QualityDraft EIS 3.4-21 September 2003
polychlorinated biphenyl and there shall be no detectable concentrations in the discharge ofpriority pollutants as listed in 40 CFR Part 423.
Process water monitoring must begin 90 days after startup of the cogeneration facility.Monitoring will include measurement of pH, flow, and temperature on a daily basis, and prioritypollutant metals semi-annually the first year and annually thereafter.
Additionally, it is recommended that bioswales be established at the outlet of detention pond 1 tofurther treat water quality and attenuate flow of treated stormwater being discharged from thepond.
3.4.6 Significant Unavoidable Adverse Impacts
Construction and operation of the cogeneration facility has the potential to affect surface andgroundwater quality through contaminated stormwater runoff and wastewater discharge. Theproposed project has numerous design elements and mitigation measures that, if employed,would reduce or eliminate impacts on water quality. Therefore, no significant unavoidableadverse impacts on water quality are expected.

BP Cherry Point Cogeneration Project 3.5 WetlandsDraft EIS 3.5-1 September 2003
3.5 WETLANDS
This section discusses existing wetland conditions, addresses potential impacts on wetlandsassociated with the proposed project, and identifies mitigation measures designed to limit thoseimpacts. The wetland analysis in this section is based primarily on information found in thefollowing technical reports: Revised Wetland Delineation Report: BP Cherry Point CogenerationProject (BP 2002, Appendix H); Revised Cogeneration Project Compensatory Mitigation Plan(Appendix E); Revised Cogeneration Project Compensatory Mitigation Areas WetlandDelineation Report BP Cherry Point (Appendix E); and the May 22, 2003 Addendum: Changes toRevised Cogeneration Project Compensatory Mitigation Plan (Appendix E). The analysis ofwetlands associated with the transmission lines is based on information from several technicalreports including the Environmental Resources Report: BPA Transmission Line Brown Road toCuster Substation (Appendix B). Wetland delineations were not performed as part of the analysisof this last report. Wetland determinations were made during a reconnaissance-level investigationof the transmission line corridor. Wetlands were rated using Ecology’s Wetland Rating System(Ecology 1993). Additional reports include the Wetland Report for Arco Products Company:Proposed Cherry Point Refinery Distribution Lines, ROW Towers, and Substation (RadianInternational and Dames and Moore 1999) and the Wetland Compensatory Mitigation Plan forBPA/PUD Transmission Line Project: JARPA Application and SEPA checklist (Arco ProductsCompany 1999). Where additional sources of information have been used to evaluate thepotential impacts associated with the proposed project, those sources have been cited.
3.5.1 Existing Conditions
Several wetland communities have been identified in the project vicinity. Wetland systems nearor within the project site have been delineated wholly or partially and are shown in Figure 3.5-1.Three wetlands—Wetlands E, I, and K—were evaluated as part of the technical reports preparedfor the project, but are located outside the footprint of the proposed project site and would notbe disturbed under the proposed project (Figure 3.5-1). According to the U.S. Fish and WildlifeService wetland classification system (Cowardin et al. 1979), most of the wetlands in the projectvicinity are considered palustrine emergent (PEM), although some palustrine scrub-shrub (PSS)and palustrine forested (PFO) wetlands also are present. All of the wetlands associated with theproject were rated as Category III wetlands based on Ecology’s Washington State WetlandsRating System for Western Washington (Ecology 1993). Before the Applicant acquired theproperty more than 30 years ago, wetland areas in the project site were associated withagricultural uses. The extent, types, and rating of wetlands within the various portions of theproject site are identified in Tables 3.5-1, 3.5-3, and 3.5-4. Plant species observed in theproposed project area are presented in Table 3.5-2.
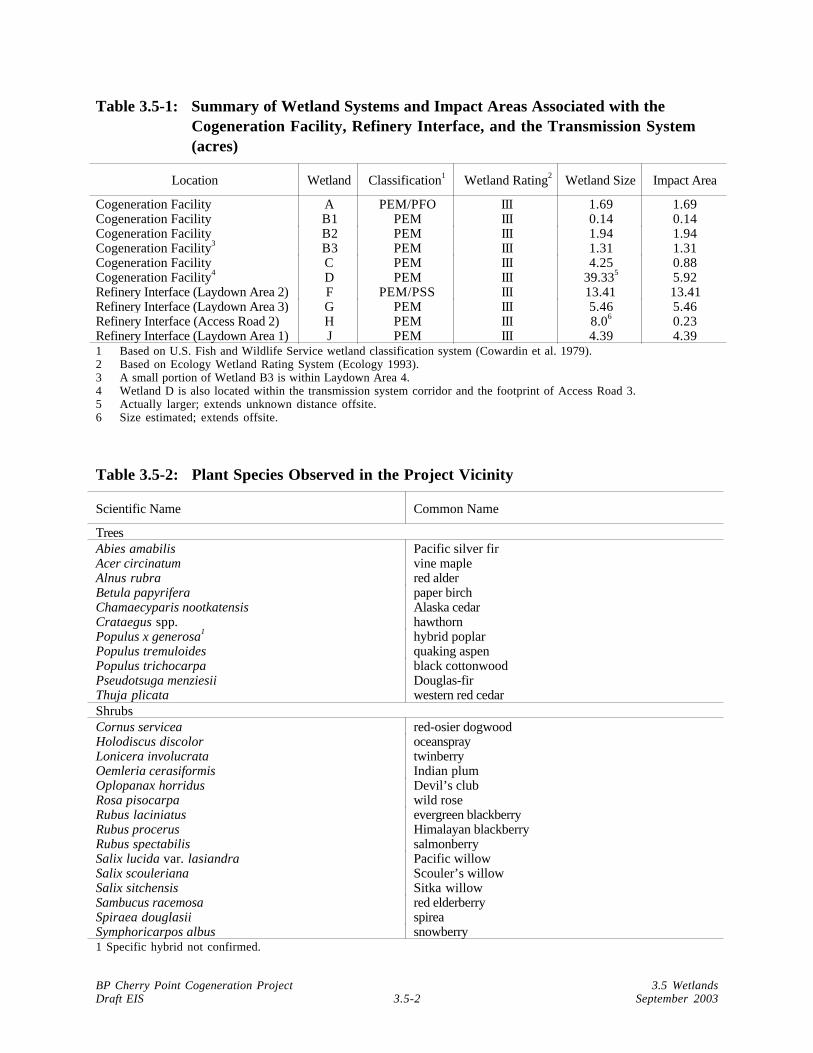
BP Cherry Point Cogeneration Project 3.5 WetlandsDraft EIS 3.5-2 September 2003
Table 3.5-1: Summary of Wetland Systems and Impact Areas Associated with theCogeneration Facility, Refinery Interface, and the Transmission System(acres)
Location Wetland Classification1 Wetland Rating2 Wetland Size Impact Area
Cogeneration Facility A PEM/PFO III 1.69 1.69Cogeneration Facility B1 PEM III 0.14 0.14Cogeneration Facility B2 PEM III 1.94 1.94Cogeneration Facility3 B3 PEM III 1.31 1.31Cogeneration Facility C PEM III 4.25 0.88Cogeneration Facility4 D PEM III 39.335 5.92Refinery Interface (Laydown Area 2) F PEM/PSS III 13.41 13.41Refinery Interface (Laydown Area 3) G PEM III 5.46 5.46Refinery Interface (Access Road 2) H PEM III 8.06 0.23Refinery Interface (Laydown Area 1) J PEM III 4.39 4.391 Based on U.S. Fish and Wildlife Service wetland classification system (Cowardin et al. 1979).2 Based on Ecology Wetland Rating System (Ecology 1993).3 A small portion of Wetland B3 is within Laydown Area 4.4 Wetland D is also located within the transmission system corridor and the footprint of Access Road 3.5 Actually larger; extends unknown distance offsite.6 Size estimated; extends offsite.
Table 3.5-2: Plant Species Observed in the Project Vicinity
Scientific Name Common Name
TreesAbies amabilis Pacific silver firAcer circinatum vine mapleAlnus rubra red alderBetula papyrifera paper birchChamaecyparis nootkatensis Alaska cedarCrataegus spp. hawthornPopulus x generosa1 hybrid poplarPopulus tremuloides quaking aspenPopulus trichocarpa black cottonwoodPseudotsuga menziesii Douglas-firThuja plicata western red cedarShrubsCornus servicea red-osier dogwoodHolodiscus discolor oceansprayLonicera involucrata twinberryOemleria cerasiformis Indian plumOplopanax horridus Devil’s clubRosa pisocarpa wild roseRubus laciniatus evergreen blackberryRubus procerus Himalayan blackberryRubus spectabilis salmonberrySalix lucida var. lasiandra Pacific willowSalix scouleriana Scouler’s willowSalix sitchensis Sitka willowSambucus racemosa red elderberrySpiraea douglasii spireaSymphoricarpos albus snowberry1 Specific hybrid not confirmed.

BP Cherry Point Cogeneration Project 3.5 WetlandsDraft EIS 3.5-3 September 2003
Table 3.5-2: Continued
Scientific Name Common Name
HerbaceousAgropyron repens quackgrassAgrostis alba red topAgrostis tenuis colonial bentgrassAlopecurus pratensis meadow foxtailAnthoxanthum odoratum sweet vernal grassCarex obnupta slough sedgeCirsium arvense Canada thistleCirsium vulgare bull thistleDactylis glomerata orchard grassDicentra formosa bleeding heartEleocharis acicularis least spikerushElymus canadensis rye grassEquisetum telmateia giant horsetailFestuca arundinacea tall fescueHolcus lanatus velvet grassHypochaeris glabra cat’s earIris missouriensis irisJuncus balticus Baltic rushJuncus effusus soft rushLotus corniculatus bird’s foot trefoilPhalaris arundinacea reed canarygrassPlantago lanceolata English plantainPlantago major common plantainPoa pratensis bluegrassPoa trivialis rough bluegrassPolygonum persicaria lady’s thumbPolystichum munitum sword fernRanunculus repens creeping buttercupRumex crispus curly dockScirpus acutus hardstem bulrushSolanum dulcamara bittersweet nightshadeStellaria media chickweedTaraxacum officinale dandelionTolmiea menziesii piggy-back plantTrifolium pratense red cloverUrtica dioica stinging nettleVicia hirsuta tiny vetchSource: BP 2002, Section 3.4
Cogeneration Facility
Wetlands associated with the cogeneration facility are primarily PEM systems (Figures 3.5-1 and3.5-2). Some PFO wetland habitat is associated with Wetland A.
Wetland A is a 1.69-acre PEM and PFO wetland system located in the northwest corner of thecogeneration facility site. Forested vegetation associated with Wetland A is part of a hybridpoplar plantation. Emergent vegetation species are dominated by creeping buttercup, bentgrass,and bluegrass.
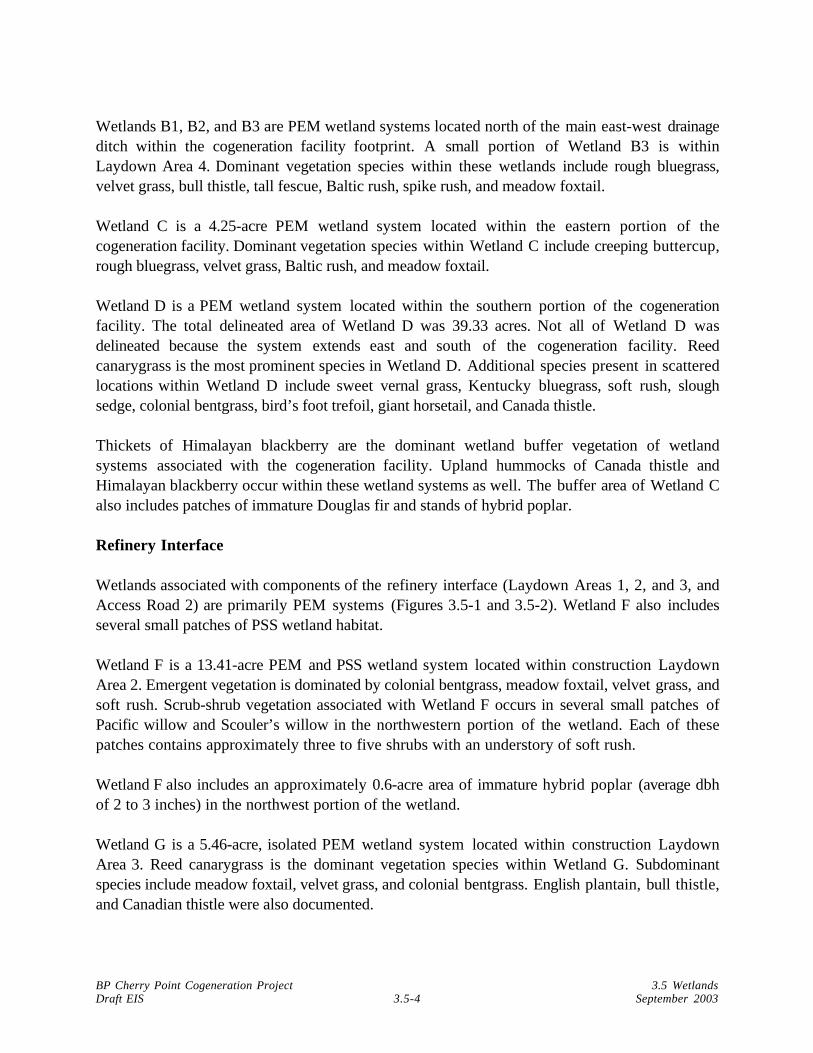
BP Cherry Point Cogeneration Project 3.5 WetlandsDraft EIS 3.5-4 September 2003
Wetlands B1, B2, and B3 are PEM wetland systems located north of the main east-west drainageditch within the cogeneration facility footprint. A small portion of Wetland B3 is withinLaydown Area 4. Dominant vegetation species within these wetlands include rough bluegrass,velvet grass, bull thistle, tall fescue, Baltic rush, spike rush, and meadow foxtail.
Wetland C is a 4.25-acre PEM wetland system located within the eastern portion of thecogeneration facility. Dominant vegetation species within Wetland C include creeping buttercup,rough bluegrass, velvet grass, Baltic rush, and meadow foxtail.
Wetland D is a PEM wetland system located within the southern portion of the cogenerationfacility. The total delineated area of Wetland D was 39.33 acres. Not all of Wetland D wasdelineated because the system extends east and south of the cogeneration facility. Reedcanarygrass is the most prominent species in Wetland D. Additional species present in scatteredlocations within Wetland D include sweet vernal grass, Kentucky bluegrass, soft rush, sloughsedge, colonial bentgrass, bird’s foot trefoil, giant horsetail, and Canada thistle.
Thickets of Himalayan blackberry are the dominant wetland buffer vegetation of wetlandsystems associated with the cogeneration facility. Upland hummocks of Canada thistle andHimalayan blackberry occur within these wetland systems as well. The buffer area of Wetland Calso includes patches of immature Douglas fir and stands of hybrid poplar.
Refinery Interface
Wetlands associated with components of the refinery interface (Laydown Areas 1, 2, and 3, andAccess Road 2) are primarily PEM systems (Figures 3.5-1 and 3.5-2). Wetland F also includesseveral small patches of PSS wetland habitat.
Wetland F is a 13.41-acre PEM and PSS wetland system located within construction LaydownArea 2. Emergent vegetation is dominated by colonial bentgrass, meadow foxtail, velvet grass, andsoft rush. Scrub-shrub vegetation associated with Wetland F occurs in several small patches ofPacific willow and Scouler’s willow in the northwestern portion of the wetland. Each of thesepatches contains approximately three to five shrubs with an understory of soft rush.
Wetland F also includes an approximately 0.6-acre area of immature hybrid poplar (average dbhof 2 to 3 inches) in the northwest portion of the wetland.
Wetland G is a 5.46-acre, isolated PEM wetland system located within construction LaydownArea 3. Reed canarygrass is the dominant vegetation species within Wetland G. Subdominantspecies include meadow foxtail, velvet grass, and colonial bentgrass. English plantain, bull thistle,and Canadian thistle were also documented.

BP Cherry Point Cogeneration Project 3.5 WetlandsDraft EIS 3.5-5 September 2003
Figure 3.5-1

BP Cherry Point Cogeneration Project 3.5 WetlandsDraft EIS 3.5-6 September 2003
Figure 3.5-2

BP Cherry Point Cogeneration Project 3.5 WetlandsDraft EIS 3.5-7 September 2003
Wetland J is a 4.39-acre, isolated PEM wetland system located within construction LaydownArea 1. Reed canarygrass is the dominant vegetation species within Wetland J, often consisting ofmonotypic stands. Subdominant species include meadow foxtail, red top, and colonial bentgrass.
Wetland H is a PEM wetland system in the location of Access Road 2. Blaine Road separatesWetland H from Wetland G. The total area of Wetland H is estimated to be approximately 8acres. The estimated impact area of Wetland H associated with Access Road 2, approximately0.23 acre, was delineated. A complete delineation of Wetland H was not performed becauseapproximately 10 inches of snow covered the ground at the time of the January 2002 site visit.Vegetation species within Wetland H are similar to that described above for Wetland G. Wetlandbuffers within the components of the refinery interface include parking lots, paved and unpavedroads, and upland grassland areas. The buffer area of Wetland F also includes a small patch ofDouglas fir, about 10 to 15 feet tall.
Transmission System
Wetland D is located within a portion of the transmission system corridor. Wetland D, a PEMwetland system, is described above in the cogeneration facility discussion. Federal permitsassociated with the transmission system corridor have been previously approved (Arco ProductsCompany 1999). Information from those permits, a JARPA application and SEPA checklist,identify PEM, PSS, and PFO wetland systems within the corridor. Wetland vegetation within thePEM, PSS, and PFO wetlands within the transmission system corridor was consistent with whatwas described for the cogeneration facility and refinery interface site.
Custer/Intalco Transmission Line No. 2
Several wetlands are located within the existing right-of-way of the transmission line corridor(Appendix B). Wetland delineations were not performed within the transmission line corridor.Wetland determinations were made during a reconnaissance-level investigation. Based on theinvestigation, wetlands were rated using Ecology’s Wetland Rating System (Ecology 1993).Wetland delineations would need to be performed where impacts are proposed before wetlandpermits could be issued.
Wetlands within the transmission line corridor are primarily PEM systems. Wetland vegetationwithin these PEM wetlands was consistent with that described for the cogeneration facility andrefinery interface site. The majority of these PEM wetlands are disturbed due to regular mowingand livestock grazing. Some PSS and one PFO wetland system were also identified. Vegetationwithin the PSS and PFO wetlands include spirea, salmonberry, red-osier dogwood, willow, paperbirch, and red alder (Alnus rubra). In most areas, trees growing in the PSS and PFO wetlands areremoved or topped by Bonneville to maintain a safe distance between the trees and the electricallines, typically about 25 feet.

BP Cherry Point Cogeneration Project 3.5 WetlandsDraft EIS 3.5-8 September 2003
Wetlands associated with the transmission line corridor are summarized in Table 3.5-3. The tableidentifies wetlands within each 1-mile segment of the approximately 5-mile transmission linecorridor from west to east, as well as wetland classifications and the span of each wetland inlinear feet within and parallel to the transmission line corridor.
Table 3.5-3: Summary of Wetland Systems Associated with the Custer/IntalcoTransmission No. 2 Line Corridor
Study Area Mile Wetland System Classification Approximate Length in Corridor (feet)
Mile 1 PEM/PSS 1,200PEM 100PEM 250PEM 125
PEM/PSS 375PEM 300PEM 250PEM 75
Mile 2 PEM 500PEM 30PEM 40PEM 50PEM 130PEM 60
PEM/PSS/PFO 375PEM 200
Mile 3 PEM 50PEM 60PEM 500PEM 30
Mile 4 PEM 125PEM 375PEM 375PEM 40PEM 500
PEM/PSS 150PEM 40PEM 300
Mile 5 PEM 180PEM 600PEM 60PEM 300PEM 60PEM 850
Source: Appendix B
Other Project Components
A small portion of Wetland B3 is within Laydown Area 4. Access Road 3 is partially locatedwithin Wetland D. Wetlands B3 and D, which are PEM wetland systems, are described above inthe cogeneration facility discussion.

BP Cherry Point Cogeneration Project 3.5 WetlandsDraft EIS 3.5-9 September 2003
Two mitigation sites have been identified immediately north of the cogeneration facility andrefinery interface site (Figure 3.5-3). The mitigation sites have been designated CMA 1 and 2.CMA 1 is 50.3 acres and CMA 2 is 59.8 acres (Table 3.5-4). According to the U.S. Fish andWildlife Service wetland classification system (Cowardin et al. 1979), wetland communities in theproposed mitigation sites are considered temporarily flooded palustrine emergent (PEMA),seasonally flooded palustrine emergent (PEMC), seasonally flooded palustrine forested (PFOC),and temporarily flooded palustrine scrub-scrub (PSSA). Of the 50.3 acres of CMA 1, 38.3 acresincludes wetland systems and 12 acres is upland habitat (Table 3.5-4). Of the 59.8 acres of CMA2, 42.35 acres includes wetland systems and 18.4 acres is upland habitat (Table 3.5-4). Emergentwetlands associated with CMA 1 and CMA 2 are large systems that extend outside theboundaries of the proposed mitigation areas. Wetland systems associated with CMA 1 and 2 arein a degraded condition due to historical agricultural practices.
CMA 1 is composed primarily of emergent vegetation with scattered upland patches. Vegetationspecies include reed canarygrass (often consisting of monotypic stands), soft rush, velvet grass,bentgrass, and creeping buttercup. A small area of PFOC wetland in the center of the parcel isdominated by a dense grove of quaking aspen. Wetland communities cover about 76% of CMA 1.Much of this area is actively grazed.
Table 3.5-4: Summary of Wetland Systems and Upland Areas Associated with theProposed Wetland Mitigation Area (acres)
Location Wetland Classification1 Wetland Rating2 Size % of Site
CMA 1 PEMA II 25.8 51%CMA 1 PEMC II 12.2 24%CMA 1 PFOC II 0.3 1%
CMA 1 Wetland Total - - 38.3 76%CMA 1 Upland - 12.0 24%
CMA 1 Total - 50.3 100%CMA 2 PEMA II 29.7 50%CMA 2 PEMC II 11.6 19%CMA 2 PSSA II 0.27 1%
CMA 2 Wetland Total - - 41.56 69%CMA 2 Upland - 18.42 31%
CMA 2 Total - - 59.8 100%1 Based on U.S. Fish and Wildlife Service wetland classification system (Cowardin et al. 1979).2 Based on Ecology Wetland Rating System (Ecology 1993).
CMA 2 is composed primarily of emergent vegetation with scattered upland patches. Vegetationincludes reed canarygrass (often consisting of monotypic stands), soft rush, velvet grass,bentgrass, and tall fescue. Spirea and willow dominate a small patch of PSSA wetland in thenortheastern portion of CMA 2. Wetland communities cover about 70% of CMA 2.

BP Cherry Point Cogeneration Project 3.5 WetlandsDraft EIS 3.5-10 September 2003
Figure 3.5-3

BP Cherry Point Cogeneration Project 3.5 WetlandsDraft EIS 3.5-11 September 2003
Wetland Functions and Values Assessment
A wetland functions and values assessment was conducted for all of the wetlands associated withthe proposed cogeneration project, refinery interface, and mitigation areas (BP 2002, Section 3.4,and BP 2002, Appendix H3). The functions and values assessment was based on Ecology’sMethods for Assessing Wetland Functions (Ecology 1999). A numerical index of 0 to 10 (0 is verypoor and 10 is very high) represents the potential level of performance for each assessedfunction. Overall, wetland functions and values were rated as low, due primarily to historicaldegradation from agricultural practices and the dominance of non-native vegetation species withinthe wetland systems. The majority of the parameters in the functions and values assessment foreach of the evaluated wetlands received a value of 4 or less.
3.5.2 Impacts of the Proposed Action
This section describes potential impacts to wetlands from construction activities and projectdesign elements proposed by the Applicant to minimize or compensate for those potentialimpacts. Potential impacts and design elements applicable to all project components arediscussed first, followed by discussions specific to individual project components.
Construction
The permanent fill of wetlands and their buffer areas would be the primary impact associatedwith construction of the proposed project. Some wetlands would be cleared, graded, and filled forconstruction. Wetland buffers would also be affected. Implementation of BMPs and mitigationmeasures presented below would protect surface water features from the introduction ofsediments or contaminants during construction.
Wetland functions that would be reduced as a result of construction include floodwater detentionand retention, flood flow desynchronization, groundwater recharge and discharge, and waterquality improvement. Vegetated wetland and adjacent upland areas that currently allowinfiltration of rainwater would be replaced by impervious surfaces. Increases in impervioussurfaces could change hydrologic functions in the wetlands. Based on the functions and valuesassessment prepared for the project, wetlands within the project site are functioning at a lowlevel. Additional discussion of stormwater and water quality issues is included in Section 3.4,Water Quality.
Impacts on wetlands associated with the proposed project have been avoided and minimized tothe extent practicable. Zoning regulations, as defined in Section 20 of the Whatcom CountyMunicipal Code, require minimum setbacks from public roads associated with heavy industrialdevelopment. The proposed project site was located as close to Grandview Road as possible(250 feet) to avoid wetlands south of the project site, under these setback requirements.

BP Cherry Point Cogeneration Project 3.5 WetlandsDraft EIS 3.5-12 September 2003
Temporarily disturbed wetland areas would be restored to support native wetland communities.Permanent impacts to wetlands would be compensated by rehabilitating approximately 110 acresof nearby lands that currently consist mainly of degraded wetland systems. Proposed wetlandrestoration and compensatory mitigation would establish wetland and wetland buffercommunities that perform wetland functions at moderate to high levels. In addition, proposedtopographic and hydrologic modifications would restore historic drainage patterns.
Under the proposed project, 35.52 acres of Category III wetlands associated with thecogeneration facility, the refinery interface area, and the 0.8-mile transmission system would betemporarily or permanently disturbed (Table 3.5-5).
Table 3.5-5: Summary of Wetland Community Impact Areas Associated with theCogeneration Facility, Refinery Interface Site, and the TransmissionSystem (acres)
Location Wetland Temporary Impact Area Permanent Impact Area
Cogeneration Facility A 0.00 1.69Cogeneration Facility B1 0.00 0.14Cogeneration Facility B2 0.00 1.94Cogeneration Facility B31 0.20 1.11Cogeneration Facility C 0.00 0.88Cogeneration Facility D2 0.00 5.923
Cogeneration Facility Total - 0.20 11.68Refinery Interface (Laydown Area 2) F 4.66 8.75Refinery Interface (Laydown Area 3) G 0.00 5.46Refinery Interface (Laydown Area 1) J 0.00 4.39Refinery Interface (Access Road 2) H 0.00 0.23Refinery Interface Total - 4.66 18.83Transmission System - 0.00 0.154
Total Wetland Impacts - 4.86 30.661 A small portion of Wetland B3 is within Laydown Area 4.2 Wetland D is also located within the transmission system corridor and the footprint of Access Road 3.3 Includes impacts associated with Access Road 3.4 Wetland impacts associated with the transmission system have been permitted by the Corps under previous permits.
Cogeneration Facility
Construction activity associated with the cogeneration facility would result in the permanent fillor disturbance of 11.88 acres of PEM Category III wetlands. Of this amount, 11.68 acres wouldbe permanently filled and 0.2 acres would be temporarily disturbed (Table 3.5-5). All ofWetlands B1, B2, and B3 would be cleared. While only about a third of Wetland A would becleared, construction of the project would hydrologically isolate Wetland A. Therefore, all ofWetland A is considered disturbed as a result of the project. Approximately 0.2 acre of WetlandB3 associated with Laydown Area 4 would be restored after project construction is completed.Portions of Wetland C and D would be cleared. Laydown Area 4 and Access Road 3 are elementsof the project included in the category of “other project components.” Impacts to Wetland B3

BP Cherry Point Cogeneration Project 3.5 WetlandsDraft EIS 3.5-13 September 2003
associated with Laydown Area 4 and to Wetland D associated with Access Road 3 are includedin the cogeneration facility discussion and in Table 3.5-5 instead of partitioning impacts to thesewetlands between different project components.
Refinery Interface
Construction activity associated with the refinery interface site would disturb approximately23.49 acres of PEM Category III wetlands. Of this amount, 18.83 acres would be permanentlyfilled and 4.66 acres would be temporarily disturbed. All of Wetlands F, G, and J would becleared and filled. Approximately 4.66 acres of Wetland F would be temporarily disturbed, butwould be restored after project construction is completed. Construction activity associated withAccess Road 2 would result in the permanent fill of 0.23 acre of Wetland H. Under the currentproposal, Access Road 2 would be wide enough to accommodate the natural gas and watersupply pipes associated with the refinery interface. Wetland impacts associated with theelevated piperack have not been quantified at this time. Construction of the elevated piperackwould include some minor additional temporary wetland impacts associated with construction ofthe footings. Permanent impacts associated with the footings of the elevated piperack would beminor. Construction Laydown Areas 1, 2, and 3 would be maintained as impervious areas afterconstruction is completed to accommodate necessary storing and holding areas associated withoperation of the refinery. Construction Laydown Area 4 would be converted to upland bufferwith potential for wetland mitigation areas.
Transmission System
This 150-foot-wide, 0.8-mile transmission system corridor would require the construction of 5towers. Construction activity associated with the transmission system would result in thepermanent fill or disturbance of approximately 0.15 acre of PEM Category III wetlands.Wetlands would be cleared during construction of the transmission tower pads. The access roadassociated with the transmission system corridor has already been constructed under previouslyapproved permits (Arco Products Company 1999). Trees growing in the PSS and PFO wetlandswould be removed or topped during construction to maintain a safe distance between the treesand the electrical lines.
Custer/Intalco Transmission Line No. 2
Under Option 1, a RAS would install additional electrical equipment, such as new breakers andwiring, within the Custer and Intalco substations. This option would not require any changes tothe existing lines or towers. No new towers would be constructed, but the option would requireagreement among the Applicant, Alcoa Intalco Works, and Bonneville. No impacts on wetlandsystems associated with construction of the transmission line would occur under this option.Under both Option 2a and Option 2b, a second transmission line would be installed inside the125-foot right-of-way of the existing transmission line corridor from Custer substation to thetransmission system interconnection. Under Option 2a new lattice style towers would be

BP Cherry Point Cogeneration Project 3.5 WetlandsDraft EIS 3.5-14 September 2003
constructed; under Option 2b new monopole style towers would be constructed. Somefoundation work would be required to accommodate the new towers under either Option 2a or2b. While the number of new towers required for either option has not been determined, moremonopole towers than lattice towers would be required to accommodate a new electrical linebecause monopole towers require a shorter distance between towers. The location and amount ofclearing that would be required to construct new towers have not been identified. Wetlandsystems and associated wetland buffers would be avoided where possible during construction ofthe transmission line. If wetland impacts cannot be avoided, wetland delineations would need tobe performed before wetland impacts can be quantified and wetland permits can be issued.
Other Project Components
A small portion of Wetland B3 is within Laydown Area 4. Access Road 3 is located withinWetland D. Impacts associated with Wetlands B3 and D, PEM wetland systems, are describedabove in the cogeneration facility discussion and in Table 3.5-5 instead of partitioning impacts tothese wetlands between different project components.
Wetland systems associated with CMA 1 and 2 will be enhanced to improve overall wetlandfunctional performance and to convert low quality Category II wetlands dominated by reedcanarygrass into high quality Category II wetlands composed of native grass, shrub, and treespecies within 25 years. Existing native trees and shrubs within CMA 1 and 2 would not bedisturbed. A reed canarygrass control program has been proposed to remove and control thisinvasive species.
Operation
Other than those communities affected by construction, operation of the project is not expectedto affect existing wetland systems associated with the refinery interface, transmission system,Custer/Intalco Transmission Line No. 2, and other project components. A perimeter ditchadjacent to the cogeneration facility on the west side of Wetland C may affect the hydrology ofWetland C because of the ditch’s sloped topography. See Section 3.3 for additional details.Operation activities associated with the project would occur within developed roads andsurfaces.
3.5.3 Impacts of No Action
Under the No Action Alternative, new facilities would not be constructed at the site. Impacts towetlands associated with the proposed project would not occur. No impacts or constructionwould occur that would entail removal or alteration of existing wetland habitat within theproposed project site.

BP Cherry Point Cogeneration Project 3.5 WetlandsDraft EIS 3.5-15 September 2003
The proposed wetland enhancement and the creation of new wetlands associated with theProposed Action would not occur. As a result, associated increases in the quality of both wetlandand wildlife communities and habitats within the watershed would not take place.
3.5.4 Secondary and Cumulative Impacts
The proposed project site is zoned as Heavy Impact Industrial by Whatcom County, and islocated within the Cherry Point Major Industrial Urban Growth Area/Port Industrial Zone asdefined in the Whatcom County Comprehensive Plan (BP 2002, Section 3.6). The BP CherryPoint Refinery is located near the proposed project site. A variety of industrial facilities such asAlcoa Intalco Works, an aluminum smelter, and the Conoco-Phillips Refinery are located within afew miles of the proposed project site.
The temporary and permanent disturbance of 35.52 acres of wetland habitat, which wouldgenerally be considered of low quality, is unlikely to result in significant adverse cumulativeimpacts on wetland habitat within the area. Existing wetland habitats within the proposed projectsite are not unique and do not provide high functional values.
The proposed Georgia Strait Crossing project is anticipated to be constructed concurrently withthe proposed project. At this time the County envisions growth and development in the generalarea. Potential impacts to wetland systems associated with these projects would depend on thequantity and quality of affected wetland systems. The proposed project would not contribute topotential cumulative impacts on wetland communities because proposed mitigation measureswould create and enhance wetlands that would provide high functional values to replace disturbedwetlands with low functional values.
Additional development projects anticipated to occur in the project vicinity in future yearswould contribute to cumulative impacts on wetland habitat. Because of the zoning status,development options are limited to industrial use and would be consistent with zoningrequirements and federal, state, and local regulations. The proposed project would not directlycause development or serve as a mechanism to enable it. The extent of cumulative impacts onwetland habitat associated with the proposed project would depend on the location, nature, andscale of future development projects in the general area.
3.5.5 Mitigation Measures
Construction
Mitigation measures consistent with those generally required by the U.S. Army Corps ofEngineers and Washington Department of Ecology for Category III wetlands within westernWashington would be implemented during construction and operation of the project to protectwetlands that would not be filled. Wetlands adjacent to the project site, such as Wetland I, wouldbe protected using silt fencing and hay bales. The portions of Wetlands A, B, C, and D that

BP Cherry Point Cogeneration Project 3.5 WetlandsDraft EIS 3.5-16 September 2003
would not be disturbed would also be protected using silt fencing and hay bales. Approximately4.66 acres of Wetland F and 0.2 acre of Wetland B3 would be temporarily disturbed and wouldbe restored after project construction is completed. Under the proposed mitigation plan, inaddition to the 0.2 acre of wetland restoration of Wetland B3, 0.3 acre of wetland creation wouldoccur, for a total of 0.5 acre of wetland restoration and creation in this area of the project site(Appendix E).
To compensate for impacts on Wetlands A, B, C, D, F, G, H, and J, the Applicant has designed amitigation plan in consultation with state and federal agencies. The proposed mitigation areas arein an area of low-quality wetlands north of Grandview Road that are good candidates for wetlandrehabilitation and enhancement. A survey of site conditions, including a delineation of existingwetlands, has been completed to aid development of an appropriate mitigation plan.
The proposed location for the compensatory mitigation areas has a high potential for successfulrehabilitation. Current performance of wetland functions is low due to historical degradation fromagricultural practices. The Applicant is proposing to significantly improve wetland functionalperformance by establishing a mosaic of wetland habitats with diverse structure and speciescomposition. This would be accomplished by filling ditches constructed to drain the areas and, inthe case of CMA 2, diverting stormwater runoff from the cogeneration project site into the areato enhance wetland hydrology functions. Detailed information associated with proposedmitigation measures is provided in the Revised Cogeneration Project Compensatory MitigationPlan (Appendix E) and the May 22, 2003 Addendum: Changes to Revised Cogeneration ProjectCompensatory Mitigation Plan (Appendix E).
Operation
A monitoring plan and a contingency plan have been prepared to monitor the status of thewetland mitigation areas following construction and to address any issues if wetland mitigationperformance standards, such as planted vegetation survival and areal cover, required by agencypermits are not fulfilled.
3.5.6 Significant Unavoidable Adverse Impacts
A total of 30.51 acres would be permanently converted to the cogeneration facility site andlaydown areas within the refinery interface area. At this time it is not known if any wetland areaswithin the Custer/Intalco Transmission Line No. 2 corridor would be permanently affected; itwould depend on tower spacing and foundation requirements. The permanent disturbance of30.51 acres of generally low quality wetland systems would be compensated by the restorationand creation of 110 acres of higher quality wetlands.
An additional 4.86 acres of wetland within Laydown Areas 2 and 4 would be temporarily, butunavoidably, adversely affected. Mitigation for these impacts would entail restoration of wetlandhabitats following construction of the proposed project.

BP Cherry Point Cogeneration Project 3.5 WetlandsDraft EIS 3.5-17 September 2003
An additional 0.15 acre within the transmission system corridor would be permanently convertedto transmission tower foundation pads and maintenance roads; these unavoidable adverse impactshave already received Clean Water Act Section 404 permit approval from the Corps of Engineers,but they have not been permitted by Whatcom County.
BP Cherry Point Cogeneration Project 3.6 Agricultural Land, Crops, and LivestockDraft EIS 3.6-1 September 2003
3.6 AGRICULTUAL LAND, CROPS, AND LIVESTOCK
3.6.1 Existing Conditions
Agricultural Land
The Natural Resources Conservation Service (NRCS) defines prime agricultural land as “land thathas the best combination of physical and chemical characteristics for producing food, feed, fiber,forage, oilseed, livestock, timber, and other agricultural crops with minimum inputs of fuel,fertilizer, pesticides, and/or labor. Prime farmland does not include land already in or committedto urban development or water storage" (NRCS 2003).
Whatcom County classifies prime agricultural land in five categories based on NRCS soilclassification. The categories include:
• Category I – All areas are prime farmland• Category II – Prime farmland when drained• Category III – Prime farmland when protected from flooding• Category IV – Prime farmland when irrigated• Category V – Prime farmland when drained and protected from flooding
Whatcom County also has designated Agricultural Protection Overlay (APO) soils, APOProtection Areas, and Open Space (Whatcom County 1997, as amended). The purpose of theAPO is to promote commercial agriculture and provide a reasonable mix of uses and a variety ofland uses that are not inconsistent or incompatible with agricultural activities. Table 3.6-1identifies components of the project site that include these APO designations. Figure 3.6-1presents western Whatcom County's designations for APO soils and APO protection areas.
The area around the proposed project site has not been used for agricultural cultivation forapproximately 30 years, with the exception of an area of hybrid poplar trees that the Applicantplanted in 1989-1991. The existing grassland immediately to the west of the planted poplar treesand east of the Blaine Road right-of-way has not been cultivated since the Applicant purchasedthe land in the 1960s. Nearby lands are also fallow agricultural fields.
Cogeneration Facility
The cogeneration facility footprint is located within the Cherry Point Major Industrial/PortIndustrial Urban Growth Area (UGA) and is zoned for industrial land uses. Because this area hasbeen designated for long-term urban development, these lands do not meet the federal definitionof prime farmlands protected under the Farmland Protection Policies Act (FPPA).
The Whatcom County Comprehensive Plan (Whatcom County 1997, as amended) indicates thatportions within the fenceline of the cogeneration facility contain prime agricultural soils.

BP Cherry Point Cogeneration Project 3.6 Agricultural Land, Crops, and LivestockDraft EIS 3.6-2 September 2003
Although the comprehensive plan map is not at the scale to clearly identify soil types within thecogeneration facility fenceline, it appears that the cogeneration facility would be located withinareas identified as Category I and Category II prime agricultural soils. APO designations withinthe cogeneration facility footprint are identified in Table 3.6-1 and Figure 3.6-1.
Table 3.6-1: Whatcom County-Designated APO Soils, APO Protection Areas, and OpenSpace Areas Mapped within Project Site Components
Project Element APO Soils APO Protection Areas Open Space
Cogeneration Facility yes no yesRefinery Interface Area yes no yesCogeneration Facility Transmission System yes no yesCuster/Intalco Transmission Line No. 2 yes, in less than half
of corridoryes, in majority of
corridoryes, in about half
of corridorOther Project Components yes, in majority of
areano yes, in majority
of areaSource: Whatcom County 1997, as amended
Refinery Interface
The refinery interface area, located west of the cogeneration facility, is within the Cherry PointMajor Industrial/Port Industrial UGA, and is zoned for industrial land uses. The interface areadoes not meet the federal definition of prime farmlands protected under the FPPA. Portions ofthe refinery interface area would be located within areas identified as Category I and Category IIprime agricultural soils (Whatcom County 1997, as amended). APO designations within therefinery interface area are identified in Table 3.6-1 and Figure 3.6-1.
Transmission System
The transmission line corridor is located within the Cherry Point Major Industrial/Port IndustrialUGA, is zoned for industrial land uses, and does not meet the federal definition of primefarmlands protected under the FPPA. Portions of the transmission line corridor would be locatedwithin areas identified as Category I and Category II prime agricultural soils (Whatcom County1997, as amended). APO designations within the transmission line corridor are identified in Table3.6-1 and Figure 3.6-1.
Custer/Intalco Transmission Line No. 2
The western portion of the transmission line corridor that runs north and south is located withinthe Cherry Point Major Industrial/Port Industrial UGA and is zoned for industrial land uses.Near where the transmission line begins to run east and west, the transmission line corridor is nolonger within the UGA. Within the UGA, the transmission line corridor does not meet the federaldefinition of prime farmlands protected under the FPPA.

BP Cherry Point Cogeneration Project 3.6 Agricultural Land, Crops, and LivestockDraft EIS 3.6-3 September 2003
Figure 3.6-1

BP Cherry Point Cogeneration Project 3.6 Agricultural Land, Crops, and LivestockDraft EIS 3.6-4 September 2003
Portions of the transmission line corridor would be located within areas identified as Category Iand Category II prime agricultural soils (Whatcom County 1997, as amended). APO designationswithin the transmission line corridor are identified in Table 3.6-1 and Figure 3.6-1.
Other Project Components
Other project components (Access Road 3, industrial water supply pipeline, Laydown Area 4,and CMA 1 and CMA 2) are located within the Cherry Point Major Industrial/Port IndustrialUGA, are zoned for industrial land uses, and do not meet the federal definition of primefarmlands protected under the FPPA. These other project components would be located withinareas identified as Category I and Category II prime agricultural soils (Whatcom County 1997, asamended). APO designations are identified in Table 3.6-1 and Figure 3.6-1.
Agricultural Crops
In 1997, the U.S. Department of Agriculture (USDA) reported 1,228 farms with a cumulativetotal of 103,600 acres of farmland in Whatcom County (USDA 2000). The number of farms andamount of agricultural cropland have decreased over the past decade. Table 3.6-2 shows cropfarms and acreages per crop. Crops are dominated by hay-alfalfa. According to the 1997 Censusof Agriculture, Whatcom County ranks sixth in the state and 95th in the country for the value ofagricultural crops sold (USDA 1997).
Table 3.6-2: Crop Cultivation, Number of Farms, Acres Harvested, and Yield forSelected Crops
Crop Farms Acres Planted Harvested Yield
Wheat 8 626 50,914 bushelsHay-Alfalfa 658 40,910 146,740 tonsCorn 3 Data unavailable 4,334 bushelsPotatoes 12 1,585 475,550 hundred weightStrawberries 14 297 2,306,552 poundsRaspberries 107 5,255 36,500,750 poundsOther domesticated berries 27 482 2,671,318 poundsFruit orchards 58 419 Data unavailableSource: USDA 2000
In addition to the above crops, tree farming constitutes another agricultural activity in WhatcomCounty. Excluding state and national forests, some agricultural land in Whatcom County is usedfor tree farming, including growing Christmas trees and hybrid softwood trees for harvesting aspulpwood. No data are available on the actual number of acres dedicated to tree farmingthroughout Whatcom County.

BP Cherry Point Cogeneration Project 3.6 Agricultural Land, Crops, and LivestockDraft EIS 3.6-5 September 2003
Cogeneration Facility
From 1989 to 1991, the Applicant planted approximately 142 acres of hybrid poplar trees on theBP Cherry Point Refinery property for future harvesting as pulpwood. No records are availableto confirm the density of the planting or actual number of trees planted by the Applicant. TheApplicant has not actively managed the poplar crop since the original planting.
Visual inspections performed during wetland and wildlife surveys revealed that approximately 30acres have grown into dense stands in the eastern portion of the planted area, east of theproposed cogeneration facility and close to the railway crossing near Chemco Industries. Treeheights within this area are uniform at approximately 45 to 50 feet high with a diameter at breastheight (dbh) ranging from approximately 6 to 10 inches. Most of these trees have straight,uniform trunks.
Planted hybrid poplars within the cogeneration facility fenceline are generally concentrated westof Access Road 1 and east of the Blaine Road right-of-way. They generally exhibit poor growthcharacteristics and inconsistent spacing. These trees are generally less than 40 feet tall, althoughthey have a similar diameter as those farther east of the proposed cogeneration facility. Several ofthe trees in this area exhibit split or forked trunks. The density of hybrid poplars in the easternportion of the cogeneration facility is approximately 4 trees per 100 square feet. Poplars in thewestern portion, immediately east of Blaine Road, typically occur in patches with a density of 3trees per 100 square feet.
The Applicant has no plan or schedule to harvest any of the planted hybrid poplars, except forthose that may be removed during construction of the facility. Some of the hybrid poplar trees inthe northwest area of the proposed cogeneration facility would be left in place as an aestheticbuffer between Grandview Road and the facility.
Refinery Interface
An approximately 0.6-acre area of immature hybrid poplars (average dbh of 2 to 3 inches) islocated within the northwest portion of Wetland F within Laydown Area 2 (Figure 3.5-1).
Transmission System
The transmission line corridor crosses a narrow band of hybrid poplars that is part of the standseast of the cogeneration facility’s footprint.
Custer/Intalco Transmission Line No. 2
Agricultural crop production has not been identified within the existing transmission line corridor(Appendix B). Some agricultural activity may occur adjacent to the corridor.
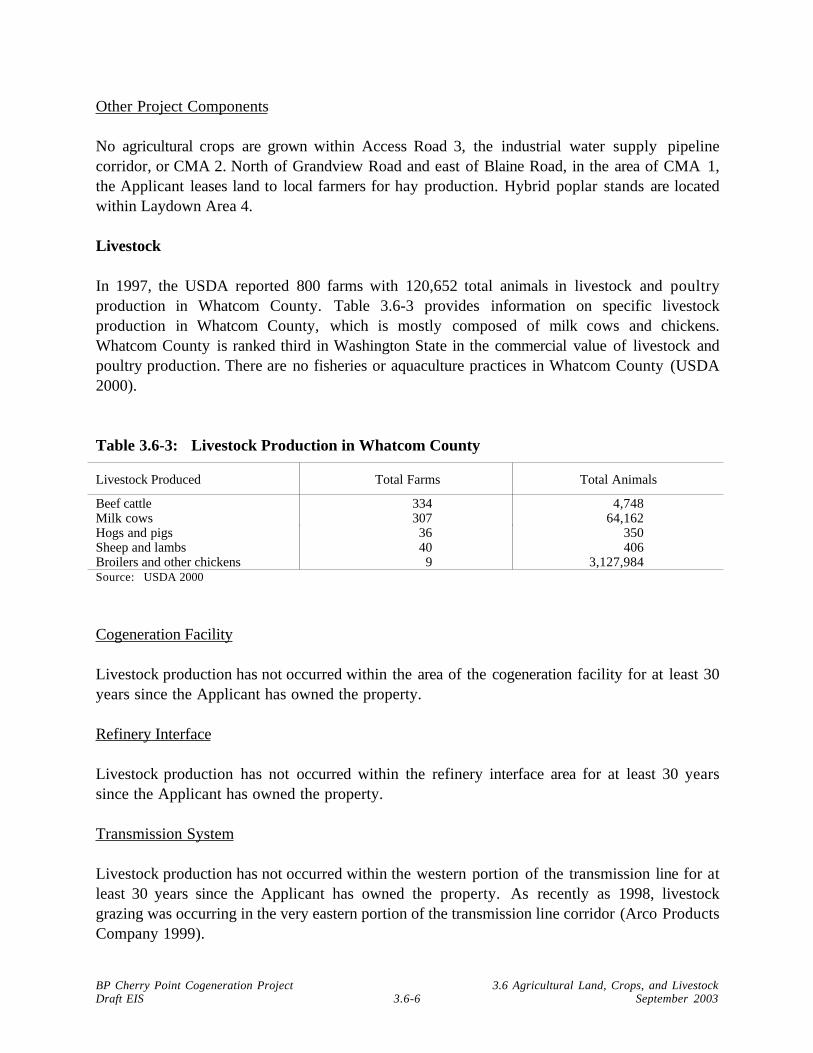
BP Cherry Point Cogeneration Project 3.6 Agricultural Land, Crops, and LivestockDraft EIS 3.6-6 September 2003
Other Project Components
No agricultural crops are grown within Access Road 3, the industrial water supply pipelinecorridor, or CMA 2. North of Grandview Road and east of Blaine Road, in the area of CMA 1,the Applicant leases land to local farmers for hay production. Hybrid poplar stands are locatedwithin Laydown Area 4.
Livestock
In 1997, the USDA reported 800 farms with 120,652 total animals in livestock and poultryproduction in Whatcom County. Table 3.6-3 provides information on specific livestockproduction in Whatcom County, which is mostly composed of milk cows and chickens.Whatcom County is ranked third in Washington State in the commercial value of livestock andpoultry production. There are no fisheries or aquaculture practices in Whatcom County (USDA2000).
Table 3.6-3: Livestock Production in Whatcom County
Livestock Produced Total Farms Total Animals
Beef cattle 334 4,748Milk cows 307 64,162Hogs and pigs 36 350Sheep and lambs 40 406Broilers and other chickens 9 3,127,984Source: USDA 2000
Cogeneration Facility
Livestock production has not occurred within the area of the cogeneration facility for at least 30years since the Applicant has owned the property.
Refinery Interface
Livestock production has not occurred within the refinery interface area for at least 30 yearssince the Applicant has owned the property.
Transmission System
Livestock production has not occurred within the western portion of the transmission line for atleast 30 years since the Applicant has owned the property. As recently as 1998, livestockgrazing was occurring in the very eastern portion of the transmission line corridor (Arco ProductsCompany 1999).

BP Cherry Point Cogeneration Project 3.6 Agricultural Land, Crops, and LivestockDraft EIS 3.6-7 September 2003
Custer/Intalco Transmission Line No. 2
Grassland habitat within the transmission line corridor is disturbed due to mowing and livestockgrazing (Appendix B). Information was not available to quantify the amount of livestock activitycurrently occurring within the existing transmission line corridor. Grazing pastures for livestockwithin the corridor would be limited by maintenance activities and the variety of paved andunpaved roads that are located within and/or cross the transmission line corridor.
Other Project Components
North of Grandview Road and east of Blaine Road, the Applicant leases land to local farmers forcattle grazing. The majority of the 50.3-acre wetland compensatory mitigation area, CMA 1, iscurrently used for cattle grazing by a local diary farmer under a five-year contract with theApplicant. Livestock production does not occur within the areas for Access Road 3 or LaydownArea 4.
3.6.2 Impacts of the Proposed Action
Construction
Agricultural Land
Cogeneration Facility
Construction of the cogeneration facility would not affect any prime farmlands because thecogeneration facility site has been designated for long-term urban development and does not meetthe definition of prime farmlands protected under the FPPA.
Construction of the cogeneration facility would result in the development or modification of landthat Whatcom County has identified as Category I and II prime farmland soils and mapped asAPO soils and Open Space (Table 3.6-1).
Refinery Interface
Construction within the refinery interface area would not affect any prime farmlands protectedunder FPPA. Construction would, however, result in the development or modification of landthat Whatcom County has identified as Category I and II prime farmland soils and mapped asAPO soils and Open Space (Table 3.6-1).
Transmission System
Construction and erection of electrical transmission towers and improvement of the maintenanceroad within the transmission line corridor would not affect any prime farmlands protected under

BP Cherry Point Cogeneration Project 3.6 Agricultural Land, Crops, and LivestockDraft EIS 3.6-8 September 2003
FPPA. Construction would result in the development or modification of land that WhatcomCounty has identified as Category I and II prime farmland soils and mapped as APO soils andOpen Space (Table 3.6-1).
Custer/Intalco Transmission Line No. 2
Option 1 - Remedial Action Scheme. Under Option 1, no additional transmission lines orsupporting structures would be required for Custer/Intalco Transmission Line No. 2; therefore,there would be no impacts on agricultural land for this project element.
Option 2a - New Transmission Line with Lattice Towers. Under Option 2a, approximately 5miles of Custer/Intalco Transmission Line No. 2 would be reconstructed between the Custersubstation and the new 230-kV transmission system interconnection. The reconstruction wouldreplace the existing single-circuit towers with new double-circuit steel lattice towers and install anadditional 230-kV transmission line to be suspended from the new towers.
Approximately 3.5 miles of the transmission line to be reconstructed is located outside theCherry Point UGA. This portion of the existing transmission corridor encompassesapproximately 53 acres of land that is outside the UGA and potentially includes areas of primefarmland as designated by the NRCS under the FPPA. Whatcom County has identified portionsof the transmission line corridor that contain Category I and II Prime Farmland soils, APO soils,APO Protection Areas, and designated Agricultural Open Space (see Table 3.6-1).
At this time, Bonneville has not determined the number or location of towers that would be usedunder this option; therefore, it is not possible to identify and quantify areas of specific impact onprime farmland. In general, construction activities within the transmission corridor would likelyaffect some areas of NRCS-designated prime farmland and Whatcom County-designatedagricultural lands in the 53-acre portion of the corridor located outside the UGA. These impactswould typically consist of relatively small (0.25 acres or less) areas that would be permanentlyused for the new (or modified) tower sites, and the areas located between the towers that wouldbe temporarily required for installation of the new overhead transmission lines.
Option 2b - New Transmission Line with Monopole Towers. Option 2b would be similar toOption 2a, except that steel monopole towers would be installed instead of steel lattice towers.Because monopole towers use a different foundation design and require a shorter span betweentowers than lattice towers, new foundations would be required for all towers, and a greaternumber of towers would need to be installed.
As with Option 2a, Bonneville has not determined the number or location of towers that wouldbe used under this option. General impacts on agricultural land would be similar to thosedescribed for Option 2a, except that a greater number of sites within the 53-acre corridormodification area would be permanently used for construction of the towers.
BP Cherry Point Cogeneration Project 3.6 Agricultural Land, Crops, and LivestockDraft EIS 3.6-9 September 2003
Other Project Components
Construction activities associated with Access Road 3, the industrial water supply pipeline,Laydown Area 4, and CMA 1 and CMA 2, would not affect any prime farmlands. Constructionactivities would result in the development or modification of land that Whatcom County hasidentified as Category I and II prime farmland soils and mapped as APO soils and AgriculturalOpen Space (Table 3.6-1).
Agricultural Crops
Project construction would result in a direct and permanent loss of approximately 2.6 acres ofexisting hybrid poplars associated with the cogeneration facility, Access Road 1, and LaydownAreas 2 and 4. Of the 2.6 acres of hybrid poplars that would be cleared, 1.5 acres is associatedwith upland vegetation communities, 0.6 acre are associated with Wetland F (Laydown Area 2),and approximately 0.4 acre is associated with Wetland A (cogeneration facility).
Cogeneration Facility
As described above in the existing conditions section, hybrid poplars within the cogenerationfacility site that would be cleared during construction are generally of poorer quality relative tothe stands east of the footprint of the cogeneration facility.
Refinery Interface
An approximately 0.6-acre area of immature hybrid poplars located within the northwest portionof Wetland F, within Laydown Area 2, would be cleared.
Transmission System
The transmission line corridor would cross a narrow band of hybrid poplars that is part of thestand east of the cogeneration facility. Based on the design plan, transmission line tower padswould not be located in the area of the hybrid poplar stand (Arco Products Company 1999). Noother agricultural crops are grown within the corridor.
Custer/Intalco Transmission Line No. 2
Agricultural crop production has not been identified within the existing transmission line corridor(Appendix B). Agricultural activity adjacent to the corridor would not be disturbed.
Other Project Components
No agricultural crops would be effected with the construction of Access Road 3, installation ofthe industrial water supply pipeline, or CMA 2. Land leased to local farmers for hay production

BP Cherry Point Cogeneration Project 3.6 Agricultural Land, Crops, and LivestockDraft EIS 3.6-10 September 2003
in CMA 1 would be converted to a wetland mitigation site. Hybrid poplars located withinLaydown Area 4 would be cleared.
Livestock
Cogeneration Facility
There would be no impacts to livestock associated with the cogeneration facility. Livestockproduction does not occur within the area of the cogeneration facility.
Refinery Interface
There would be no impacts to livestock associated with the components of the refinery interface.Livestock production does not occur within the area of refinery interface components.
Transmission System
There would be no impacts to livestock associated with the majority of the transmission linecorridor. The very eastern portion of the transmission line corridor traverses grazing pastures forlivestock that were active in 1998 (Arco Products Company 1999). Current grazing activity inthis portion of the corridor is unknown.
Custer/Intalco Transmission Line No. 2
Construction of transmission line tower pads would occur adjacent to the existing tower pads and“stringing” the new 230-kV transmission line would be done from the existing maintenance roads.Livestock currently graze on the upland vegetation within the existing transmission line corridor.Significant impacts on livestock or on vegetation within the transmission line corridor are notlikely since the proposed construction activities would not significantly change habitat conditionswithin the corridor. A quantitative evaluation of the potential impacts, if any, would requireadditional information on livestock activity and an assessment of the condition of the vegetationhabitats within the transmission corridor.
Other Project Components
The proposed compensatory wetland mitigation plan would preclude the continued use ofmitigation area CMA 1 for cattle grazing. It is assumed that the current lessee would be able tolease other suitable grazing land. There would be no impacts to livestock associated with AccessRoad 3, the industrial water supply pipeline, Laydown Area 4, and CMA 2.

BP Cherry Point Cogeneration Project 3.6 Agricultural Land, Crops, and LivestockDraft EIS 3.6-11 September 2003
Operation
Air emissions from the proposed cogeneration facility that have the potential to affectagricultural lands, crops, and livestock include primary particulate matter and secondaryformation of ammonium nitrate and ammonium sulfate. Air quality impacts resulting fromoperation of the facility are projected to be below the secondary ambient air quality standardsestablished to protect public welfare. Air emissions from plant operations are addressed inSection 3.2.
Water-cooled condensers will be used for cooling and condensing low-pressure steam from thesteam turbine. These condensers will be designed and operated to minimize the potential drift, orwater droplet plume, that is typically associated with water-cooling towers. There would be anegligible impact on agricultural crops or livestock from drift emissions. Based on the results ofthe air dispersion modeling analyses, facility emissions are expected to have a negligible effect onsoils and vegetation. Low-sulfur natural gas fuel will be the primary energy source, thusminimizing the emission of sulfur compounds. For emissions of NOX (assuming full conversionto NO2), potential vegetation damage could begin to occur with NO2 concentrations of 15 to 50ppb. However, according to the modeling results, the maximum annual concentration of NO2
would below 1.0 µ/m3 or about 1.1 ppb; no impacts on vegetation are anticipated.
The proposed project would store and use anhydrous ammonia in its emissions control system.Numerous design features would be used, including water deluge systems, to minimize thepossibility of an ammonia release and to prevent the transport of any ammonia that isaccidentally released. If anhydrous ammonia were released from within the cogeneration facilityand transported offsite by winds, it would be in a gaseous state and released in minor amountsover time and would not be expected to adversely affect agricultural crops or livestock.
Operation of the project associated with the refinery interface, cogeneration facility transmissionline, Custer/Intalco Transmission Line No. 2, and other project components are not anticipated toaffect existing agricultural lands, crops, or livestock.
3.6.3 Impacts of No Action
Under the No Action Alternative, the proposed cogeneration project would not be constructedand operated. Because the area is zoned for industrial uses, it is possible that any futuredevelopment of the project site would eventually affect some or all of the existing poplar trees onthe site. Under the No Action Alternative, existing livestock grazing areas north of GrandviewRoad and east of Blaine Road would not be affected by the wetland mitigation proposed for theproject.

BP Cherry Point Cogeneration Project 3.6 Agricultural Land, Crops, and LivestockDraft EIS 3.6-12 September 2003
3.6.4 Secondary and Cumulative Impacts
The project site is zoned for industrial uses and is located within the Cherry Point MajorIndustrial Urban Growth Area/Port Industrial Zone as defined in the Whatcom CountyComprehensive Plan. The potential cumulative impacts on agricultural lands and uses have beenconsidered in the comprehensive planning and zoning process. Nevertheless, the conversion of upto 195 acres of land with prime agricultural soils and the harvest of approximately 0.6 acre ofplanted hybrid poplars would result in a relatively small contribution to any cumulative impacton agricultural land and crops in Whatcom County.
The potential loss of some grazing land north of Grandview Road on BP property would notcontribute to a significant cumulative loss of grazing land because this area is incrementally beingset aside as conservation easements and mitigation areas. There would be no cumulative loss oflivestock associated with the proposed project because remaining pastureland north ofGrandview Road beyond CMA 1 could accommodate the cattle currently grazing in this area.
The proposed Georgia Strait Crossing project, as described in Section 3.10, is anticipated to beconstructed concurrently with the proposed project. At this time, the County envisionsadditional growth and development in the area of the proposed project. Impacts associated withthese future projects would generally be similar to the type of cumulative impacts on agriculturalcrops, land, and livestock as described for the proposed project.
3.6.5 Mitigation Measures
Construction
No construction mitigation measures for agricultural land, crops, and livestock are proposedbecause there are no anticipated significant impacts on agricultural crops or livestock.
Operation
No mitigation measures for agricultural land, crops, and livestock are proposed.
3.6.6 Significant Unavoidable Adverse Impacts
No significant unavoidable adverse impacts on agricultural land, crops, or livestock areanticipated. Whatcom County has zoned the project area for industrial land uses and thereforethe loss of potential agricultural soils is not considered significant. In addition, no agriculturalcrops would be lost with the construction and operation of the project, and with the exception ofthe loss of grazing lands on leased land, no livestock would be adversely affected with theconstruction and operation of the proposed project.

BP Cherry Point Cogeneration Project 3.7 Vegetation, Wildlife, FisheriesDraft EIS 3.7-1 September 2003
3.7 UPLAND VEGETATION, WILDLIFE AND HABITAT, FISHERIES, ANDTHREATENED AND ENDANGERED SPECIES
This section discusses four elements: upland vegetation, wildlife and habitat, fisheries, andthreatened and endangered species within the project site and surrounding area. It discussesexisting conditions, addresses potential impacts on these elements associated with the proposedproject, and identifies mitigation measures designed to limit those impacts. The analysis ofexisting conditions and potential effects resulting from the construction and operation of theproposed project is based on literature review, agency information, and onsite surveys conductedin 2001, 2002, and 2003. Where sources of information have been used to evaluate the potentialimpacts associated with the proposed project, those sources have been cited. Wildlife and habitatof the project site are discussed together because of the close interaction between these tworesources. The fisheries section discusses the freshwater and marine habitat near the project site,and the threatened and endangered species section discusses species that are regulated under theEndangered Species Act (ESA). Wetland communities are discussed in Section 3.5.
Existing documentation and information from the U.S. Fish and Wildlife Service (USFWS) andNational Oceanic and Atmospheric Administration (NOAA) Fisheries (previously known asNational Marine Fisheries Service) were used to identify threatened and endangered species thatmay occur within the proposed project site. Existing documentation and information from theWashington Department of Fish and Wildlife (WDFW), including the WDFW Priority Habitatsand Species database, also was reviewed regarding federal and state protected species that mayuse the proposed project site and to identify the presence of priority habitats near the proposedproject site. The Washington Department of Natural Resources (WDNR) Natural HeritageProgram was reviewed regarding priority habitats and sensitive plant and wildlife species thatmay be near the project site. A Biological Evaluation (BE) prepared by the Applicant for theproject was reviewed to provide information on threatened and endangered species (BP 2002,Appendix H5).
The technical report Environmental Resources Report: BPA Transmission Line Brown Road toCuster Substation was reviewed to provide information on potential fish habitat within thetransmission line corridor. This document is included as Appendix B.
3.7.1 Existing Conditions
Upland Vegetation
The proposed project site is located within the Fraser lowland ecological zone and lies within thewestern hemlock zone, which is characterized by a wet, mild, maritime climate (Franklin andDyrness 1988).
Five types of upland vegetation communities are located within the proposed project site:grassland; shrubland; mixed coniferous/deciduous forest; coniferous forest; and deciduous forest

BP Cherry Point Cogeneration Project 3.7 Vegetation, Wildlife, FisheriesDraft EIS 3.7-2 September 2003
(Figure 3.5-2). Most or all of these five upland vegetation communities are present within each ofthe five project components discussed below. Plant species observed in the proposed projectarea are presented in Table 3.5-2.
Dominant habitats within the proposed project site are grassland and wetland communities.When the refinery acquired the property more than 30 years ago, grassland and wetland areaswere associated with agricultural uses. Wetlands are described in Section 3.5. Vegetation withinthe grassland habitat includes a mixture of native and non-native upland and wetland species suchas bentgrass, reed canarygrass, Canada thistle, velvetgrass, bird’s foot trefoil, bull thistle, andhorsetail.
Shrubland habitats are dominated by Himalayan blackberry, a non-native invasive plant species.Himalayan blackberry is located adjacent to the wetland and grassland communities. Additionalspecies within the shrubland community include evergreen blackberry and stinging nettle. Shrubcommunities in the project site with vegetation such as salmonberry, red-osier dogwood, andwillow, are associated with scrub-shrub wetland systems.
Forested communities include mixed coniferous/deciduous forest, coniferous forest, anddeciduous forest. Coniferous forest habitat is characterized by patches of even-aged Douglas firtrees, typically 10 to 20 feet tall, within a shrub community dominated by Himalayanblackberry. Himalayan blackberry is also the dominant understory vegetation associated withDouglas fir.
Deciduous forest habitat is dominated by even-aged stands of hybrid poplars planted forharvesting. The hybrid poplar stands are typically 30 to 40 feet tall, with a dbh ranging fromapproximately 6 to 10 inches. Dominant understory species include creeping buttercup and reedcanarygrass. An approximately 0.6-acre area of immature hybrid poplars (average dbh of 2 to 3inches) is located within the northwestern portion of Wetland F.
Mixed coniferous/deciduous forest includes species such as Douglas fir, black cottonwood,western red cedar, quaking aspen, oceanspray, snowberry, and willow. Large areas of mixedconiferous/deciduous forest and deciduous forest habitats are located near the project site. Only asmall amount of mixed coniferous/deciduous forest and deciduous forest habitat is located withinthe footprint of the proposed project site (Figure 3.5-2). Species of western red cedar andquaking aspen occur within the transmission system and transmission line corridors, but are notpresent within the footprints of the cogeneration facility, refinery interface, and other projectcomponents.
Cogeneration Facility
Upland vegetation communities associated with the cogeneration facility include grassland,shrubland, coniferous forest, and deciduous forest (Figure 3.5-2).

BP Cherry Point Cogeneration Project 3.7 Vegetation, Wildlife, FisheriesDraft EIS 3.7-3 September 2003
Grassland habitat within the cogeneration facility site is a mosaic of upland and wetland systemswith a mixture of native and non-native upland and wetland species.
Coniferous forest habitat is limited to patches of young, even-aged Douglas fir trees within ashrub community dominated by Himalayan blackberry.
Planted hybrid poplars within the cogeneration facility site exhibit poor growth characteristicsand inconsistent spacing. These are generally concentrated west of proposed Access Road 1 andeast of the refinery boundary. These trees are generally less than 40 feet tall with a similardiameter as those farther east of the proposed cogeneration facility. Several of the trees in thisarea exhibit split or forked trunks. Hybrid poplar density in the eastern portion of thecogeneration facility footprint is approximately 4 trees per 100 square feet. Hybrid poplar in thewestern portion, immediately east of Blaine Road, typically occurs in patches with a density of 3trees per 100 square feet.
Refinery Interface
Upland vegetation communities associated with the refinery interface include grassland,shrubland, and deciduous forest, similar to the discussion above for the cogeneration facility.These upland vegetation communities typically occur in patches surrounded by wetland systems(Figure 3.5-1). An approximately 0.6-acre area of immature hybrid poplar (average dbh of 2 to 3inches) is located in the northwestern portion of Wetland F, within Laydown Area 2.
Transmission System
Upland vegetation communities associated with the transmission system corridor includedeciduous forest and mixed coniferous/deciduous forest (Figure 3.5-2). A narrow band of blackcottonwood is located along the perimeter of the mixed coniferous/deciduous forest habitat.These forested systems located east of the cogeneration facility footprint are generally moremature, less fragmented, and include fewer nonnative invasive species than the forestedcommunities within the footprints of the cogeneration facility, refinery interface, and otherproject components.
Custer/Intalco Transmission Line No. 2
Upland vegetation communities associated with the transmission line corridor include grasslandand shrubland habitat (Appendix B). An unpaved road is located along most of the corridor toprovide access for maintenance. The majority of vegetation communities associated with thetransmission line corridor is grassland habitat, which is disturbed due to mowing and livestockgrazing. Shrubland habitats are dominated by Himalayan blackberry. Mixed coniferous/deciduousforest is located adjacent to the transmission line corridor in several areas but is not locatedwithin the corridor.

BP Cherry Point Cogeneration Project 3.7 Vegetation, Wildlife, FisheriesDraft EIS 3.7-4 September 2003
Other Project Components
Upland vegetation communities associated with the other project components (Access Road 3,Laydown Area 4, and CMA 1 and CMA 2) include grassland, shrubland, deciduous forest, andmixed coniferous/deciduous forest (Figure 3.5-2). Grassland, shrubland, and deciduous forest aredescribed above. A small amount of mixed coniferous/deciduous forest is located in the northeastportion of Laydown Area 4 (Figure 3.5-3). Most of the vegetation associated with Access Road3 is wetland systems.
Threatened and Endangered Plant Species
The WDNR Natural Heritage Program was reviewed regarding priority habitats; high qualityecosystems; and endangered, threatened, and sensitive plant species that may be near the projectsite. Information from WDNR indicates that there are no known occurrences of rare plants,priority habitats, or high-quality ecosystems near the proposed project site (WDNR 2001).
Noxious Weeds
Vegetation surveys conducted in the spring and summer of 2001 determined the presence andabundance of weed species considered Class C noxious weeds by Whatcom County (BP 2002,Section 3.4). These include reed canarygrass, bull thistle, and Canada thistle. Class C weeds arenon-native weeds considered widespread in the state. Although not required, control of Class Cweeds, particularly reed canarygrass, is encouraged.
Wildlife and Habitat
The majority of wildlife habitat associated with the proposed project site is a mosaic of uplandgrassland and wetland communities. Additional habitats include shrubland, mixedconiferous/deciduous forest, coniferous forest, and deciduous forest. These vegetationcommunities are described above in the upland vegetation section and in Section 3.5. Most of theupland habitat within the project site is in fragmented patches within the wetland systems. Morethan 4 acres of impervious surface is also located within the area of the refinery interfacecomponents. A variety of paved and unpaved roads are located within the transmission systemcorridor and the transmission line corridor.
The majority of wetlands within the proposed project site are emergent herbaceous andpalustrine emergent systems with some patches of scrub-shrub habitat (Section 3.5). Grass andherbaceous species within these habitats include a mixture of upland and wetland species asdescribed in Section 3.5. Reed canarygrass, a non-native invasive plant species, dominates amajority of the wetland habitat. Himalayan blackberry is frequently the dominant wetland buffervegetation.
BP Cherry Point Cogeneration Project 3.7 Vegetation, Wildlife, FisheriesDraft EIS 3.7-5 September 2003
Proposed wetland mitigation sites CMA 1 and CMA 2 are composed primarily of emergentvegetation with scattered upland patches characterized by plant species similar to thosedescribed above in the vegetation section for the project site. Proposed wetland mitigation sitesCMA 1 and CMA 2 are described in Section 3.5.
Riparian habitat is not located within approximately 0.5 mile of the cogeneration facility, refineryinterface area, or the transmission system corridor. Riparian habitat is located adjacent to otherproject components (CMA 1 and CMA 2). Seven riparian corridors are located within thetransmission line corridor. Riparian habitat is described below in the individual discussion ofthese project elements.
A moderate variety of native birds, mammals, reptiles, and amphibians are expected to inhabitgrassland, shrubland, forested, and wetland habitats in the general project vicinity. Wildlifediversity is generally related to the structure and plant species composition within thesevegetative communities. Wetlands and forested areas with well-developed vegetation layers arelikely to support the greatest number of species and populations of wildlife (Brown 1985). Even-aged forest stands generally provide less diversity than mature mixed-aged forested areas.
Wetlands, grassland, shrubland, and forested habitat within the project site generally have lowspecies diversity of vegetation and a dominant presence of nonnative invasive species. Himalayanblackberry and reed canarygrass provide dominant cover or understory cover in the majority ofhabitats within the project site. Forested communities of black cottonwood and Douglas firwithin the project site are even-aged stands and often occur in fragmented patches. While wildlifehabitat in the project site likely provides cover, foraging, and breeding habitat for a variety ofwildlife species, wildlife habitat characteristics associated with the project site does not provideconditions typically associated with high-quality habitat for wildlife. Mixed deciduous/coniferousforest stands located near the project site generally provide higher quality habitat than theavailable habitats within the project site. Table 3.7-1 lists wildlife species that have beenobserved in the project vicinity or that occupy and breed in similar habitats in westernWashington.
Table 3.7-1: Wildlife Species Observed in the Project Vicinity or Known to Occur inSimilar Habitats in Western Washington
Common Name Scientific Name
Amphibiansnorthwestern salamander Ambystoma gracilePacific chorus frog Pseudacris regillared-legged frog Rana aurorarough-skinned newt Taricha granulosawestern red-backed salamander Plethodon vehiculum

BP Cherry Point Cogeneration Project 3.7 Vegetation, Wildlife, FisheriesDraft EIS 3.7-6 September 2003
Table 3.7-1: Continued
Common Name Scientific Name
Reptilesnorthern alligator lizard Gerrhonotus coeruleuswestern fence lizard Sceloporus occidentaliswestern garter snake Thamnophis elegansMammalsbat Myotis sp.black bear Ursus americanusblack-tailed deer Odocoileus hemionus columbianuscoyote Canis latransdeer mouse Peromyscus maniculatusDouglas' squirrel Tamiasciurus douglasiieastern gray squirrel Sciurus carolinensisEuropean rabbit Oryctolagus cuniculusleast chipmunk Tamias minimuslong-tailed weasel Mustela frenatanorway rat Rattus norvigicusraccoon Procyon lotorshrew Sorex sp.striped skunk Mephitis mephitisTownsend's mole Scapanus townsendiiVirginia opossum Didelphis virginianavole Microtus sp.BirdsAmerican crow Corvus brachyrhynchosAmerican goldfinch Carduelis tristisAmerican robin Turdus migratoriusblack-capped chickadee Parus articapillusblack-throated gray warbler Dendroica nigrescensbushtit Psaltriparus minimusCalifornia quail Callipepla californicachestnut-backed chickadee Parus rufescenscommon yellowthroat Geothlypis trichasdark-eyed junco Junco hyemalisdowny woodpecker Picoides pubescensEuropean starling Sturnus vulgarishairy woodpecker Picoides villosushouse finch Carpodacus mexicanushouse sparrow Passer domesticushouse wren Troglodytes aedonnorthern flicker Colaptes auratusnorthern harrier Circus cyaneusred-breasted nuthatch Sitta canadensisred-tailed hawk Buteo jamaicensisred-winged blackbird Agelaius phoeniceusrock dove Columba liviaruby-crowned kinglet Regulus calendulaSavannah sparrow Passerculus sandwichensissong sparrow Melospiza melodiaspotted towhee Pipilo erythrophthalmusSteller's jay Cyanocitta stellerivaried thrush Ixoreus naeviusyellow warbler Dendroica petechiaNote: Table 3.7-1 is not a comprehensive list of all wildlife species that could occur on the project site, but a general
summary of the variety of wildlife species known to occupy and breed in similar habitats in western Washington.

BP Cherry Point Cogeneration Project 3.7 Vegetation, Wildlife, FisheriesDraft EIS 3.7-7 September 2003
Wetlands provide habitat for amphibian, mammal, and bird species that depend on water forforaging and breeding. A wetland assessment prepared for the project concluded that wetlandswithin the project site function on a very low level for wetland-dependent wildlife species(Section 3.5).
Mammals likely to occur regularly in the forested habitat include species such as raccoon, easterngray squirrel, striped skunk, coyote, and Virginia opossum. Black-tailed deer and black bear areknown to occupy the forested habitat near the proposed project site (BP 2002, Section 3.6).Raptors such as red-tailed hawks and northern harrier likely use grassland habitat for foraging. Avariety of resident and migratory bird species likely occupy the edge habitat associated with theforest and grassland habitats.
The WDFW Priority Habitats and Species database identifies wetlands within the proposedproject site as priority habitats. Information from the WDNR Natural Heritage Program indicatesthat there are no known high-quality ecosystems located in the vicinity of the project site(WDNR 2001).
Habitats associated with specific project components are discussed below.
Cogeneration Facility
A mosaic of upland and wetland grassland communities is the dominant wildlife habitat withinthe cogeneration facility footprint. Patches of Himalayan blackberry and even-aged forest standsof black cottonwood and Douglas fir also are present. Overall, the fragmented nature anddominant presence of nonnative invasive plant species associated with these habitats reducestheir effectiveness as quality habitat for wildlife.
Refinery Interface
Most of the wildlife habitat associated with the components of the refinery interface (LaydownAreas 1, 2, and 3, and Access Road 2) includes wetland systems with relatively small, isolatedpatches of upland grassland, Himalayan blackberry, small Douglas fir, and black cottonwood.Impervious surfaces, buildings, and other structures are also located within the components ofthe refinery interface.
Transmission System
The proposed transmission system corridor passes through an emergent wetland system, anarrow band of black cottonwood, and mixed coniferous/deciduous forest habitat. The blackcottonwood and mixed deciduous/coniferous forest stands, located east of the cogenerationfacility, generally provide higher quality habitat than the available habitats within thecogeneration facility, refinery interface, and the other project components. A diverse assemblage

BP Cherry Point Cogeneration Project 3.7 Vegetation, Wildlife, FisheriesDraft EIS 3.7-8 September 2003
of birds, amphibians, reptiles, and mammals likely occupy the forested habitats associated withthe transmission system corridor.
Custer/Intalco Transmission Line No. 2
The transmission line corridor passes through a combination of grassland and shrubland wetlandand upland wildlife habitat, with grassland as the dominant habitat (Appendix B). Upland andwetland grassland habitat are disturbed due to mowing and livestock grazing. Shrubland habitatsare dominated by Himalayan blackberry. Mixed coniferous/deciduous forest habitat is locatedadjacent to the transmission line corridor in several areas but is not located within the corridor.An unpaved road is located along most of the corridor to provide access for maintenance. Thecorridor also passes over at least seven paved, public roads.
Four PSS and one PFO wetland are located within the transmission line corridor. Shrubs and treesassociated with PSS and PFO wetlands are removed or topped by Bonneville to maintain a safedistance between the trees and the electrical lines, typically about 25 feet.
Seven riparian corridors are located within the transmission line corridor (Appendix B).Dominant riparian vegetation associated with each stream system within the transmission linecorridor is presented on Table 3.7-2. As with other habitats associated with the project site, thedominance of nonnative invasive plant species associated with the riparian corridors reduces thepotential quality of habitat for wildlife compared to habitats with diverse native vegetation.
Table 3.7-2: Dominant Riparian Vegetation of Stream Channels within theTransmission Line Corridor
Stream Name Dominant Riparian Vegetation
California Creek reed canarygrassTributary 1 Himalayan blackberryTributary 2 Himalayan blackberryTributary 3 spireaTributary 4 Himalayan blackberry, spirea, vine maple, red-osier dogwood, reed canarygrassFingalson Creek Himalayan blackberry, red alder saplingsTerrell Creek Himalayan blackberrySource: Appendix E
Wetlands associated with the transmission line corridor are summarized in Table 3.5-3. Table 3.5-3 identifies wetlands within each 1-mile segment of the approximately 5-mile transmission linecorridor from east to west and the span of each wetland in linear feet within the transmission linecorridor. Based on this information, the linear feet of wetland habitat and non-wetland habitat(upland vegetation communities, unpaved roads, paved roads, and stream corridors not identifiedas wetlands) within the transmission line corridor was estimated and is provided below in Table

BP Cherry Point Cogeneration Project 3.7 Vegetation, Wildlife, FisheriesDraft EIS 3.7-9 September 2003
3.7-3. Based on these calculations, 33% of the transmission line corridor is comprised of wetlandhabitat and 67% is comprised of upland habitat.
Table 3.7-3: Summary of Wetland and Upland Habitat Associated with the TransmissionLine Corridor
Corridor Mile Approximate Length of WetlandHabitat in Corridor (feet)
Approximate Length of UplandHabitat in Corridor (feet)
Mile 1 2,675 2,605Mile 2 1,385 3,895Mile 3 640 4,640Mile 4 1,905 3,375Mile 5 2,050 3,230Total 8,655 17,745
Based on the 5-mile transmission corridor length
Other Project Components
The majority of wildlife habitat associated with the other project components (Access Road 3,Laydown Area 4, and CMA 1 and CMA 2) include a mosaic of upland and wetland grasslandcommunities with patches of Himalayan blackberry, black cottonwood, and Douglas fir. A smallamount of mixed coniferous/deciduous forest is located in the northeast portion of Laydown Area4 (Figure 3.5-2). The location of Access Road 3 is dominated by emergent wetland systems.Overall, the fragmented nature and dominant presence of nonnative invasive plant speciesassociated with these habitats reduces their effectiveness as quality habitat for wildlife.
Forested riparian habitat associated with Terrell Creek is located adjacent to the north sides ofCMA 1 and CMA 2. The WDFW Priority Habitat and Species database identifies the riparianhabitat of Terrell Creek as priority habitat.
Fisheries
Based on the literature review and information in the WDFW Priority Habitat and Speciesdatabase, fish-bearing aquatic resources in the project site vicinity include Terrell Creek,Fingalson Creek, California Creek, four unnamed tributaries to California Creek, Lake Terrell, andPuget Sound (see Figure 2-2).
Drainage ditches that traverse components of the project site and the surrounding area wereoriginally created to drain wetlands for agricultural use. They are no longer maintained and manyare partially vegetated. These drainages lack organic debris, pools, and natural meanders.Wetlands and surface water runoff are the apparent source of these drainages. The drainages areseasonally inundated and do not provide habitat for resident or anadromous fish (Williams et. al.1975; WDFW 2001). The drainage system eventually connects with Terrell Creek outside of the

BP Cherry Point Cogeneration Project 3.7 Vegetation, Wildlife, FisheriesDraft EIS 3.7-10 September 2003
project site boundary. The marine waters that receive the treated wastewater from the BP CherryPoint Refinery would also receive the combined treated wastewater associated with the proposedproject. The refinery discharges industrial wastewater in the area of Cherry Point (Figure 2-2).
Terrell Creek is an 8.7-mile-long stream that flows from Lake Terrell and discharges to the marinewaters of Birch Bay in Puget Sound. Terrell Creek flows east and north of the proposed projectsite (Figure 3.7-1). Birch Bay is approximately 1.5 miles northwest of the proposed project site(Figure 2-2). The WDFW Priority Habitat and Species database identifies the riparian habitat ofTerrell Creek as priority habitat.
According to WDFW, anadromous and resident fish species occurring in Terrell Creek includecoho salmon (Oncorhynchus kisutch), sea-run cutthroat (O. clarki), resident cutthroat (O. clarki),and winter steelhead (O. mykiss). WDFW regional habitat biologists have documented coho,resident cutthroat juveniles, and largemouth bass (Micropterus salmoides) in the creek (Huddle,pers. comm., 2002; Warinner, pers. comm., 2002).
Lake Terrell is approximately 1 mile southeast of the proposed project site. The WDFW PriorityHabitat and Species database identifies wetlands associated with Lake Terrell as priority habitat(WDFW 2001).
Fingalson Creek flows into Terrell Creek east of the proposed project site. Sea-run cutthroat andwinter steelhead are documented in Fingalson Creek (Huddle, pers. comm., 2002; Warinner, pers.comm., 2002). The WDFW Priority Habitat and Species database identifies the riparian habitatof Fingalson Creek as priority habitat (WDFW 2001).
California Creek is a 7.25-mile-long stream that discharges to the marine waters of DraytonHarbor (Strait of Georgia). California Creek flows north of the proposed project site (Figure 3.7-1). Drayton Harbor is approximately 3 miles northwest of the proposed project site (Figure 2-2).Anadromous fish species occurring in California Creek include coho and chum salmon (O. keta)(Williams et. al 1975, WDFW 2001). The WDFW Priority Habitat and Species databaseidentifies the riparian habitat of California Creek as priority habitat.
Four unnamed tributaries to California Creek are located within the project site. These tributariesare not identified in the WDFW Priority Habitat and Species database. Fish use of these systemsis unknown (Williams et. al 1975).
The marine environment of Puget Sound provides habitat for a variety of shellfish, anadromoussalmon, and other marine fish species. Nearshore habitats and characteristic species near thewastewater discharge at Cherry Point are typical of those found along the Cherry Point shoreline.The seafloor habitat within the industrial wastewater chronic dilution zone is silty gravelly sandsediment with relatively strong tidal currents (1 or more knots during maximum ebbs and floods).This habitat is characterized by a sparse epifauna.

BP Cherry Point Cogeneration Project 3.7 Vegetation, Wildlife, FisheriesDraft EIS 3.7-11 September 2003
Figure 3.7-1

BP Cherry Point Cogeneration Project 3.7 Vegetation, Wildlife, FisheriesDraft EIS 3.7-12 September 2003
A variety of salmonids are known to occur along the Cherry Point shoreline. Large numbers ofpink (O. gorbuscha), chum, coho, and chinook (O. tshawytscha) salmon have been found in thecobble habitats of the Cherry Point shoreline and in the protected eelgrass beds of Birch Bay.Juvenile sockeye salmon (O. nerka) were also found in Birch Bay, but were generally lessabundant than other species (BP 2002, Section 3.7). These species can be expected to migrate andfeed along the Cherry Point shoreline. Pacific herring (Clupea pallasi) and surf smelt (Hypomesuspretiosus) use beaches north and south of the wastewater discharge location for spawning fromJune through August.
Aquatic resources with potential fish habitat are not located within about 0.5 mile of thecogeneration facility footprint, refinery interface footprint, or the transmission system corridor.Aquatic resources associated with other project components (CMA 1 and CMA 2) and thetransmission line corridor are discussed below.
Custer/Intalco Transmission Line No. 2
Seven stream channels, Terrell Creek, Fingalson Creek, California Creek, and four unnamedtributaries to California Creek, flow within the proposed transmission line corridor (AppendixB). Ditches and swales present within the transmission line corridor are isolated systemsassociated with wetland habitat. Characteristics of stream channels associated with thetransmission line corridor are described in Table 3.7-4 in the order they occur from east to west.
Table 3.7-4: Characteristics of Stream Channels within the Transmission LineCorridor
CorridorMile
Stream Name Location Size and Shape Comments
Mile 1 CaliforniaCreek
southwest of Custersubstation
straightened channel, 2 to 3feet deep, 2 feet wide
flow 5 to 7 cfs, water very silty
Mile 2 Tributary 1 east of Elk Road bottom of 50-foot-wide and 30-foot-deep gully, 10 to 15 feetwide
flows through 24-inch culvertbeneath unpaved road, flow0.25 cfs
Mile 2 Tributary 2 joins Tributary 1 fromthe southeast withincorridor
larger stream than Tributary 1 flows through 24-inch culvertbeneath unpaved road prior tojoining with Tributary 1
Mile 2 Tributary 3 west of Elk Road 30-foot-wide, V-shapedchannel, steep-banked gully 10feet deep downstream ofconfluence
flows west within north part ofcorridor for about 300 feetbefore joining Tributary 4within corridor, flow 0.3 cfs,continues offsite for more than2 miles before joiningCalifornia Creek
Mile 2 Tributary 4 west of Elk Road smaller stream than Tributary 3 flows northwest across corridorbefore joining Tributary 3,flow 0.15 cfs

BP Cherry Point Cogeneration Project 3.7 Vegetation, Wildlife, FisheriesDraft EIS 3.7-13 September 2003
Table 3.7-4: Continued
CorridorMile
Stream Name Location Size and Shape Comments
Mile 4 FingalsonCreek
about 2,500 feet eastof Kickerville Road
6 to 10 feet wide, steep-bankedgully 40 feet deep
flows west within south part ofcorridor for about 500 feetbefore flowing out of thecorridor to the south, flow 0.25cfs
Mile 4 FingalsonCreek
about 1,500 feet eastof Kickerville Road
6 to 10 feet wide crosses corridor from southabout 1,000 feet west fromwhere stream exited corridor,drains into Terrell Creek about300 feet after crossing corridor
Mile 4 Terrell Creek about 700 feet east ofKickerville Road
4 feet wide with steep banks flows north across corridor,flow 10 cfs
Source: Appendix E
Other Project Components
Aquatic resources with potential fish habitat are not located within about 0.5 mile of AccessRoad 3 or Laydown Area 4. Proposed wetland mitigation sites CMA 1 and CMA 2 are locatedadjacent to the forested riparian corridor of Terrell Creek (Figure 3.5-2).
Threatened and Endangered Species
Section 7(c) of the ESA of 1973 requires an analysis of the effects of construction projects with afederal nexus (permits, funds, land) on any federally listed or proposed threatened or endangeredspecies that may use the project site. Consultation with USFWS and NOAA Fisheries isnecessary if any threatened or endangered species would be adversely affected by the project.Applicable regulations are found in 50 CFR 17. The ESA does not protect candidate species orspecies of concern, but if a species were to be elevated to the proposed, endangered, orthreatened category once the project had begun, additional analysis would be required todetermine the project’s potential effects on that species.
A BE prepared for the project in 2002 was reviewed to provide information on threatened andendangered species documented as potentially occurring near the proposed project site (BP 2003,Appendix H5). Wildlife and fish species identified by USFWS, NOAA Fisheries, and/or WDFWas likely to occur in the project vicinity are discussed below.
USFWS indicates that there are two federally listed threatened species under USFWS jurisdictionthat are likely to occur in the project vicinity: the bald eagle (Haliaeetus leucocephalus) and theCoastal-Puget Sound population of bull trout (Salvelinus confluentus) (USFWS 2001) (Table 3.7-2).

BP Cherry Point Cogeneration Project 3.7 Vegetation, Wildlife, FisheriesDraft EIS 3.7-14 September 2003
NOAA Fisheries identifies two federally listed endangered species, two federally listedthreatened species, and one species that is currently a candidate for listing, as potentiallyoccurring near the project site. Humpback whale (Megaptera novaeangliae) and leatherback seaturtle (Dermochelys coriacea) are federally listed endangered species. Steller sea lion (Eumetopiasjubatus) and Puget Sound chinook salmon (Oncorhynchus tshawytscha) are federally listedthreatened species. Puget Sound/Strait of Georgia coho salmon (Oncorhynchus kisutch) is acandidate for listing (NOAA Fisheries 2003) (Table 3.7-2).
According to the WDFW Priority Habitats and Species database, no federal or state-listedsensitive, threatened, or endangered wildlife species regularly forage, breed, or occur within theproposed project site (WDFW 2001). Information from the WDNR Natural Heritage Programindicates that there are no known occurrences of priority habitats or high-quality ecosystemsnear the proposed project site (WDNR 2001) (Table 3.7-5).
Table 3.7-5: Threatened, Endangered, Proposed, Candidate Species, and Species ofConcern Potentially Occurring in the Project Vicinity
Common Name Scientific Name Federal Status State Status
USFWSbald eagle Haliaeetus leucocephalus Threatened Threatenedbull trout (Coastal-Puget Sound Distinct
Population Segment)Salvelinus confluentus Threatened Candidate
long-eared myotis Myotis evotis Species of Concern Nonelong-legged myotis Myotis volans Species of Concern Noneolive-sided flycatcher Contopus cooperi Species of Concern NonePacific lamprey Entosphenus tridentatus Species of Concern Noneriver lamprey Lampetra ayresi Species of Concern CandidateNOAA Fisherieshumpback whale Megaptera novaeangliae Endangered Endangeredleatherback sea turtle Dermochelys coriacea Endangered EndangeredSteller sea lion Eumetopias jubatus Threatened ThreatenedChinook salmon (Puget Sound
Evolutionarily Significant Unit)Oncorhynchus tshawytscha Threatened Candidate
Coho salmon (Puget Sound/Strait of GeorgiaEvolutionarily Significant Unit)
Oncorhynchus kisutch Candidate None
Source: USFWS 2001; NOAA Fisheries 2003
Federally Listed Endangered Species
Humpback whale sightings are a common occurrence along the Washington outer coast, withoccasional sightings in the Strait of Juan de Fuca (Everitt et al. 1980). While humpback whalesmay wander into Puget Sound during migrations between summer breeding grounds in coastalAlaska and wintering grounds around subtropical coastal areas, their presence in Puget Sound israre. There have been only two or three sightings in Washington inland waters in the last 10 years(Norberg, pers. comm., 2000).

BP Cherry Point Cogeneration Project 3.7 Vegetation, Wildlife, FisheriesDraft EIS 3.7-15 September 2003
The leatherback sea turtle may occasionally wander into Puget Sound from coastal Washingtonbut is not known to breed in inland waters. These turtles breed in tropical and subtropicalhabitats. Sightings in Washington waters have been rare, with only one or two unconfirmedsightings off the outer coast of Washington in the last 10 years (Norberg, pers. comm., 2000).
Federally Listed Threatened Species
Bald eagles typically nest in large trees within view of a foraging area. Bald eagles prefer foragingin or near open water. Fish is the major component of their diet, but waterfowl, seagulls, andcarrion are also eaten (Federal Register 1999). Bald eagle breeding habitat typically requires anadequate supply of moderate- to large-sized fish, nearby nesting sites of large coniferous treeswithin 0.6 mile of water, and a reasonable degree of freedom from disturbance during the nestingperiod (Johnsgard 1990). Wintering populations of bald eagles use shoreline areas along PugetSound for foraging and perch sites.
The WDFW Priority Habitats and Species database and WDFW personnel identify several baldeagle breeding sites within 2 miles of the proposed project site (WDFW 2001). The closest nestis approximately 1.2 miles northwest of the site near Birch Bay. Sixteen breeding occurrencesassociated with Lake Terrell have been documented, more than 1.5 miles southeast of the projectsite (WDFW 2001; Reed, pers. comm., 2001). Quality perching and foraging habitat typicallyassociated with bald eagles is not located within the project site.
Bull trout live in cold mountain waters spanning from the northern United States into Canada.Terrell Creek does not provide suitable cold water habitat required by bull trout for spawning.The closest known stream that contains bull trout is the Nooksack River, which drains intoBellingham Bay. Bull trout associated with the Nooksack River could occur in the marine watersoff Cherry Point. These adults could use nearshore waters and habitats for feeding. Adults orjuveniles could incidentally use the lower reaches of Terrell Creek for feeding (Huddle, pers.comm., 2002).
Steller sea lions range from Southern California through coastal Oregon, Washington, BritishColumbia, and Alaska. These species are typically associated with coastal Washington and arenot regularly observed in Puget Sound waters (NOAA Fisheries 2003). There are no knownbreeding or haulout sites for sea lions in the Cherry Point vicinity.
The Puget Sound chinook salmon Evolutionarily Significant Unit (ESU) includes all naturallyspawning populations of chinook salmon from rivers and streams flowing into Puget Sound,including the Strait of Juan De Fuca from the Elwha River eastward, and the rivers and streamsflowing into Hood Canal, South Sound, North Sound, and the Strait of Georgia in Washington(NOAA Fisheries 2003).

BP Cherry Point Cogeneration Project 3.7 Vegetation, Wildlife, FisheriesDraft EIS 3.7-16 September 2003
The nearest stream used by chinook salmon for spawning is the Nooksack River (Berger/ABAM2000; Williams et al. 1975). Adult chinook salmon use offshore waters for feeding or duringmigration. Some adult fish could be found along Cherry Point and Birch Bay from March throughOctober. Juveniles of chinook salmon would be expected to use nearshore marine habitats offCherry Point for feeding and refuge during migration. Juveniles are likely to be found alongCherry Point and Birch Bay from March through August (Myers et al. 1998; Williams et al.1975). Chinook salmon are not known to use Terrell Creek for spawning. WDFW has notobserved use of Terrell Creek by chinook salmon adults or juveniles (WDFW 2001).
Candidate Species
The Puget Sound/Strait of Georgia ESU includes all naturally spawning populations of cohosalmon from drainages of Puget Sound and Hood Canal, the eastern Olympic Peninsula, and theStrait of Georgia from the eastern side of Vancouver Island and the British Columbia mainland(NOAA Fisheries 2003).
WDFW regional habitat biologists have documented coho salmon in Terrell Creek (Williams et al.1975). Coho salmon may use Terrell Creek for spawning. However, no actual spawning has beendocumented by WDFW. If spawning occurred, adult fish would be expected in Terrell Creekfrom November through January. Juvenile coho salmon would be expected in the nearshorewaters off Cherry Point from March through July (Huddle, pers. comm., 2002).
Species of Concern
USFWS identified five species of concern that may occur in the project vicinity: long-earedmyotis, long-legged myotis, olive-sided flycatcher, Pacific lamprey, and river lamprey (Table 3.7-5). Species of concern are not protected under the ESA, but if a species were to be elevated to theproposed category after the project had begun, additional analysis in the BE would be required todetermine the project’s potential effects on this species. Quality terrestrial habitat typicallyassociated with these species (mature forests) do not occur within the proposed project site.Freshwater streams are located within the transmission line corridor, as described in the fisheriessection above.
State Priority Species
A review of the WDFW Priority Habitats and Species database revealed that no federal or state-listed sensitive, threatened, or endangered wildlife species regularly use or breed within theproposed project site (WDFW 2001). The WDFW Priority Habitats and Species database doesidentify habitat for several state priority species located more than 1 mile from the proposedproject site.
Pacific herring Cherry Point stock (Clupea pallasi) is a state priority species. Herring stocks aredefined by WDFW by spawning grounds, one of which is the Cherry Point shoreline from Birch

BP Cherry Point Cogeneration Project 3.7 Vegetation, Wildlife, FisheriesDraft EIS 3.7-17 September 2003
Bay to Sandy Point in the southeast Strait of Georgia. Most Washington state herring stocksspawn from late January through early April. The Cherry Point stock is an exception to thisspawning time, spawning from early April through early June. Herring deposit their eggs onsubtidal eelgrass and marine algae (WDFW 2003).
Sea-run cutthroat is a state priority species. According to the WDFW Priority Habitat Speciesdatabase, this species is known to occur in Terrell Creek and Fingalson Creek. WDFW regionalhabitat biologists have documented cutthroat juveniles in Terrell Creek (Huddle, pers. comm.,2002; Warinner, pers. comm., 2002). Spawning activities have not been observed.
Surf smelt (Hypomesus pretiosus) are state forage fish. Surf smelt occur within the upperintertidal zone within gravel beaches. There are known spawning areas on beaches north ofCherry Point.
Common loon (Gavia immer), a state sensitive species, and trumpeter swan (Cygnusbuccinator), a state priority species, are known to occur in habitat associated with Lake Terrell.Birch Bay is known to support relatively high concentrations of great blue heron (Ardeaherodias) nests on land that was placed in a conservation trust by the Applicant. Great blueheron are a state monitor species. Birch Bay and Lake Terrell are approximately 1.5 miles and 1mile, respectively, from the proposed project site
The WDFW Priority Habitats and Species Data System also indicates that two gray wolves(Canis lupus) were reported near the proposed project site in 1991. Gray wolves are a federallylisted threatened species under USFWS jurisdiction. USFWS does not identify gray wolves aslikely to occur in the project vicinity (USFWS 2001). Although there are occasional reports ofwolf sightings in the state, there are no documented wolf breeding pairs or packs currently in thestate. WDFW believes that sightings here involve lone wolves from Canada or wolf/dog hybridsthat have been released into the wild (Leigh, pers. comm., 2001).
Based on the literature review and information from natural resource agencies, no federal or stateprotected species regularly forage, breed, or occur within the proposed cogeneration facility area,refinery interface footprint, transmission system corridor, or the other project components.Breeding or foraging habitat typically associated with federal or state protected species is notlocated within the footprint of these elements of the project.
Custer/Intalco Transmission Line No. 2
No federal or state protected terrestrial species regularly forage, breed, or occur within thetransmission line corridor. Federal or state protected fish species may occur in the reaches ofTerrell Creek, Fingalson Creek, and California Creek that flow through the transmission linecorridor.

BP Cherry Point Cogeneration Project 3.7 Vegetation, Wildlife, FisheriesDraft EIS 3.7-18 September 2003
3.7.2 Impacts of the Proposed Action
Potential impacts associated with the proposed project would be minimized and avoided throughimplementation of the BMPs described in the Mitigation Measures section below. The impactsdescribed below assume implementation of all of the proposed BMPs.
Construction
This section describes potential impacts from associated construction activities and projectdesign elements, including mitigation measures proposed by the Applicant to minimize oreliminate those potential impacts. Potential impacts and design elements applicable to all projectcomponents are discussed first, followed by discussions specific to individual projectcomponents. Detailed information associated with proposed mitigation measures is provided inthe Revised Cogeneration Project Compensatory Mitigation Plan and the May 22, 2003Addendum: Changes to Revised Cogeneration Project Compensatory Mitigation Plan (AppendixE).
Upland Vegetation
The primary impact construction of the proposed project would have on vegetation communitiesis the direct removal of vegetation, soil, and water. It is anticipated that the conversion ofvegetation communities to impervious surfaces would be permanent. Therefore, vegetation wouldno longer occur in those areas of the proposed project site that would be converted to impervioussurfaces during construction.
Vegetation communities in the project area contain a mixture of native and non-native plantspecies. Non-native vegetation is the dominant cover in the shrub habitat. Additionally, non-native vegetation is established throughout the grassland, coniferous forest, and deciduous foresthabitats. Grading and clearing of the proposed project site would remove existing noxious weedspecies. This is not considered an adverse impact because eradication of Class C noxious weeds isstrongly encouraged by both the state and local noxious weed control boards.
No federal or state endangered, threatened, or sensitive plant species occur within the proposedproject site and therefore none would be affected by construction of the proposed project.
Cogeneration Facility
Upland vegetation community impacts associated with the cogeneration facility, the refineryinterface site (Access Road 2 and Laydown Areas 1, 2, and 3), and elements of the other projectcomponents (Access Road 3 and Laydown Area 4) include the clearing and removal of grassland,shrubland, mixed coniferous/deciduous forest, coniferous forest, and deciduous forest (Table 3.7-6).

BP Cherry Point Cogeneration Project 3.7 Vegetation, Wildlife, FisheriesDraft EIS 3.7-19 September 2003
Table 3.7-6: Summary of Vegetation Community Impacts Associated with theCogeneration Facility, Refinery Interface, and Other Project Components(acres)
Vegetation Community Acres
Coniferous forest 7.3Deciduous forest 1.5Mixed coniferous/deciduous forest 0.2Shrubland 1.2Grassland 19.7Wetland 35.37Existing impervious surface 3.6Total 68.9Source: BP 2002, Section 3.4Totals may not sum due to rounding.
Upland vegetation communities in the northern portion of the cogeneration facility nearGrandview Road, west of Laydown Area 4, would not be disturbed or cleared as part of theproject (Figure 3.7-1). A reed canarygrass control program has been developed to remove andcontrol this invasive species within the project site. Zoning regulations, as defined in Title 20 ofthe Whatcom County Municipal Code, require minimum setbacks from public roads associatedwith heavy industrial development. The proposed project site was located as close to GrandviewRoad as possible (250 feet) to avoid upland and wetland communities south of the project site,under these setback requirements. BMPs would be implemented to avoid and reduce impactsresulting from construction.
Refinery Interface
Construction activity associated with the refinery interface site would disturb small uplandpatches of grassland, Himalayan blackberry, and black cottonwood surrounded by wetlandsystems (Table 3.7-6). As part of the restoration effort associated with Wetland F in thenorthern portion near Grandview Road, upland vegetation communities would be restored andenhanced following construction with native grass, shrub, and forested vegetation. ConstructionLaydown Areas 1, 2, and 3 would be maintained as impervious areas after construction iscompleted to accommodate necessary storing and holding areas associated with operation of theproject.
Transmission System
This new 0.8-mile-long and 150-foot-wide electrical transmission system corridor has not yetbeen cleared of trees, although the access/maintenance roads leading to the transmission systemline corridor have been constructed under previously approved permits (ARCO Products

BP Cherry Point Cogeneration Project 3.7 Vegetation, Wildlife, FisheriesDraft EIS 3.7-20 September 2003
Company 1999). Trees growing in the corridor would be removed or topped during constructionto maintain a safe distance between the trees and the electrical lines. The transmission system linewould require the construction of five towers. The gravel pads for the towers are approximately50 feet by 50 feet, a total area of 12,500 square feet or 0.29 acre. Approximately 0.15 acre ofPEM Category III wetland impacts have been identified associated with the tower padconstruction (Section 3.5). Therefore, up to 0.14 acre of upland vegetation associated with thetransmission system would be cleared. The tower pads are likely to be constructed in grasslandand mixed coniferous/deciduous forest habitats. BMPs, including silt fences, straw bales, andmulch, would be used as necessary during clearing of the corridor and construction of tower padsto control erosion until the area can be stabilized with gravel or vegetation.
Custer/Intalco Transmission Line No. 2
Existing access/maintenance roads are located within the approximately 5-mile transmission linecorridor. No road construction would be associated with this component of the project.
Under Option 1, a RAS would install additional electrical equipment, such as new breakers andwiring, within the Custer and Intalco substations. This option would not require any changes tothe existing lines or towers and no new towers would be constructed, but this would requireagreement among the Applicant, Alcoa Intalco Works, and Bonneville. No impacts to uplandvegetation associated with construction of the transmission line would occur under this option.
Under both Option 2a and Option 2b, a second transmission line would be installed inside theexisting 125-foot right-of-way of the existing transmission line corridor. Under Option 2a, newlattice-style towers would be constructed. Under Option 2b, new monopole-style towers wouldbe constructed. Some foundation work would be required to accommodate the new towers undereither Option 2a or 2b. While the number of new towers required for either option has not beendetermined, more monopole-style towers than lattice towers would be required to accommodate anew electrical line because monopole-style towers require a shorter distance between towers. Thelocation and amount of clearing that would be required to construct new towers has not beenidentified. The majority of upland vegetation communities associated with the transmission linecorridor that would be disturbed during tower construction is grassland habitat that is disturbeddue to mowing and livestock grazing (Appendix B). Himalayan blackberry shrub habitat wouldalso be disturbed. Implementation of appropriate BMPs would protect against adverse impactson upland vegetation communities.
Other Project Components
Impacts associated with Laydown Area 4 and Access Road 3 are included in Table 3.7-6. A smallamount of mixed coniferous/deciduous forest is located in the northeast portion of Laydown Area4. Following construction, the entire 4.74-acre area of Laydown Area 4 would be restored. Therestoration of Laydown Area 4 would include 2.9 acres of wetland (0.5 acre) and upland (2.4)restoration and creation within the cogeneration facility fenceline. The other 1.8 acres in the
BP Cherry Point Cogeneration Project 3.7 Vegetation, Wildlife, FisheriesDraft EIS 3.7-21 September 2003
eastern portion of Laydown Area 4 would include restoration of upland habitat outside thefenceline. Laydown Area 4 would be restored and enhanced with native grass, shrub, and forestedvegetation. Most of the vegetation associated with Access Road 3 is associated with wetlandsystems.
As shown on Table 3.5-4 in Section 3.5, 12 acres (24%) of CMA 1 and 18.42 acres (30%) ofCMA 2 is comprised of upland vegetation communities. Upland vegetation associated withCMA 1 and 2 would be enhanced by removing non-native invasive plant species. Somereplanting of native species would also occur. These measures will improve the functionalperformance of upland areas as wetlands in this area are converted from low quality Category IIwetlands into high quality Category II wetlands. The cogeneration project compensatorymitigation plan documents are included in Appendix E. Existing native trees and shrubs withinupland areas in CMA 1 and 2 would not be disturbed. A reed canarygrass control program hasbeen developed to remove and control this invasive species. Implementation of appropriateBMPs would protect against adverse impacts on upland vegetation communities.
Wildlife and Habitat
The primary effect from project construction would be removal and loss of habitat. In general,the severity of impact varies depending on the type and quantity of affected vegetation. Loss ofplant communities that offer limited wildlife habitat, such as shrub communities dominated byHimalayan blackberry, would result in less of an adverse effect than loss of more complexvegetation associations, such as forested upland and wetland areas.
Grassland and wetland communities are the primary habitats that would be cleared under theproposed project. Other habitats that would be cleared include shrubland, mixedconiferous/deciduous forest, coniferous forest, and deciduous forest.
Clearing of vegetation during construction would eliminate and modify existing wildlife habitat.Such impacts to habitats would displace and/or eliminate wildlife that currently depend on thisvegetation. Most wildlife species (such as birds, raccoons, or coyotes) would be able to moveaway from areas of disturbance. Wildlife populations are generally considered to be at or nearcarrying capacity in all habitat types (Krebs 1994; Morrison et. al. 1992; Miller 1990; Robinsonand Bolen 1989; Wallace 1987). Once vegetation has been removed, wildlife displaced intoadjacent habitats may be unsuccessful in colonizing nearby suitable habitats because these areasare usually already occupied. The increased stress of competition for limited resources andsusceptibility to predation may cause displaced animals to perish or to displace other individualsthat in turn may perish. Small mammals, amphibians, and reptiles would be directly affected byconstruction because of their limited mobility. Some individuals of such species would perishduring construction operations.
Disturbances caused by construction may affect wildlife in adjacent habitats by disruptingfeeding and nesting activities. Increased noise levels created by heavy machinery could cause

BP Cherry Point Cogeneration Project 3.7 Vegetation, Wildlife, FisheriesDraft EIS 3.7-22 September 2003
birds to abandon their nests and may displace wildlife during construction. Constructionactivities could result in avoidance behavior by some wildlife species. Wildlife would likelyinhabit available habitat once construction is complete. Some wildlife species in the projectvicinity are likely acclimated to human disturbance because human-related disturbance associatedwith the BP Cherry Point Refinery has been occurring in the project vicinity for more than 30years.
Cogeneration Facility
The cogeneration facility would occupy approximately 33.4 acres of the project site. Conversionof wildlife habitat to developed areas is described and quantified above in the upland vegetationdiscussion (Table 3.7-6). Permanent loss of habitat would occur in developing the cogenerationfacility, which would lead to direct impacts on wildlife species using this area. Generally, thefragmented nature and dominant presence of nonnative invasive plant species associated withwildlife habitat within the cogeneration facility does not provide conditions typically associatedwith high quality habitat for native wildlife. BMPs would be implemented during construction toavoid and reduce impacts to wildlife habitat resulting from construction activities.
No critical or priority upland habitat is located within the proposed cogeneration facilityfootprint. Wetland systems within the cogeneration facility are identified by WDFW as priorityhabitat. As described in Section 3.5, wetlands within the project site function on a very low levelfor wildlife species, and proposed wetland mitigation would convert emergent wetlands with lowfunctional performance into higher quality scrub-shrub and forested wetlands systems. Uplandwetland buffers would also be restored and enhanced (Appendix E).
Overall, impacts on wildlife and habitat associated with the cogeneration facility, withimplementation of the recommended mitigation measures, are expected to be small and areunlikely to result in a significant impact on native wildlife.
Refinery Interface
Components of the refinery interface (Laydown Areas 1, 2, and 3) would occupy 31.46 acres ofthe project site. BMPs would be implemented during construction to avoid and reduce impactson wildlife habitat resulting form construction activities. All of construction Laydown Areas 1and 3, and portions of Laydown Area 2, would be maintained as impervious areas afterconstruction is completed to accommodate necessary storing and holding areas associated withoperation of the refinery. Wildlife habitat within the refinery interface is similar to habitatassociated with the cogeneration facility. Overall, impacts on wildlife and habitat associated withconstruction of the refinery interface are consistent with those described for the cogenerationfacility above.

BP Cherry Point Cogeneration Project 3.7 Vegetation, Wildlife, FisheriesDraft EIS 3.7-23 September 2003
As discussed in Section 3.5 (Table 3.5-5), 4.66 acres of wetland habitat and associated wetlandbuffer habitat within Laydown Area 2 would be restored and enhanced following constructionwith native grass, shrub, and forested vegetation (Appendix E).
No critical or priority upland habitat is located within the refinery interface area. Wetlandsystems within the refinery interface are identified by WDFW as priority habitat. As describedabove for the cogeneration facility, wetlands within the project site function on a very low leveland proposed wetland mitigation would create higher quality wetlands systems.
Overall, impacts on wildlife and habitat associated with the refinery interface, withimplementation of the recommended mitigation measures, are expected to be small and areunlikely to result in a significant impact on native wildlife.
Transmission System
Installation of the transmission system requires a 150-foot-wide, 0.8-mile-long corridorconsisting of five new towers. This transmission system corridor has not yet been cleared oftrees, although the access/maintenance roads leading to the transmission system line corridor havebeen constructed under previously approved permits (ARCO Products Company 1999). Treesgrowing in the corridor would be removed or topped during construction to maintain a safedistance between them and the electrical lines. As described above in the upland vegetationsection, the five tower pads would cover approximately 0.29 acre. The total area within thetransmission system corridor is 14.6 acres. Estimated impacts on wildlife habitat associated withtower pad construction would include the clearing of 0.15 acre of PEM wetlands and up to 0.14acre of upland grassland and mixed coniferous/deciduous forest habitats. Noise levels associatedwith construction of the towers may displace wildlife during construction. BMPs, including siltfences, straw bales, and mulch, will be used as necessary during clearing of the corridor andconstruction of the tower pads to control erosion until the area can be stabilized with gravel orvegetation.
No critical or priority upland habitat is located within the transmission system corridor. Wetlandsystems within the transmission system corridor are identified by WDFW as priority habitat. Asdescribed above in the cogeneration facility section, wetlands within the project site function on avery low level and proposed wetland mitigation would create higher quality wetlands systems.
Overall, with implementation of the recommended mitigation measures, impacts associated withthe transmission system on wildlife would be temporary and habitat impacts would be small andnot significantly affect most wildlife populations.
Custer/Intalco Transmission Line No. 2
The transmission line corridor passes through a combination of grassland and shrub wetland, aswell as upland wildlife habitat that is disturbed due to mowing and livestock grazing (Appendix

BP Cherry Point Cogeneration Project 3.7 Vegetation, Wildlife, FisheriesDraft EIS 3.7-24 September 2003
B). Mixed coniferous/deciduous forest habitats are located adjacent to the transmission linecorridor in several areas but are not located within the corridor and would not be cleared duringconstruction. Seven riparian corridors are located within the transmission line corridor. Riparianhabitat within the transmission corridor is degraded due to steep banks and a dominant presenceof nonnative invasive vegetation species (Table 3.7-2). An estimated 33% of the transmission linecorridor is comprised of wetland habitat and 67% is comprised of upland habitat. Wetlandsassociated with the transmission line corridor are described in Section 3.5 and summarized inTable 3.5-3.
An unpaved road located along most of the corridor provides access for maintenance, and pavedroads cross the corridor in several locations. No road construction would be associated with thetransmission line corridor. Shrubs and trees within the corridor are currently removed or toppedby Bonneville to maintain a safe distance between the trees and the electrical lines, typicallyabout 25 feet.
As described above in the upland vegetation section, Option 1 would not require any changes tothe existing lines or towers and no new towers would be constructed. No impacts on wildlifehabitat associated with construction of the transmission line would occur under Option 1.
The other two transmission line options, replacing the existing tower structures with latticetowers (Option 2a) or monopole-style towers (Option 2b), are described above in the uplandvegetation section. The location and amount of clearing that would be required to construct newtowers has not yet been identified. The majority of habitat associated with the transmission linecorridor that would be disturbed during tower construction is grassland that has been disturbeddue to mowing and livestock grazing and Himalayan blackberry shrub habitat. Sensitive areas,wetland systems, stream channels, and associated wetland and stream buffers would be avoided,where possible, during construction of the transmission line tower pads. If wetland impactscannot be avoided, wetland delineations would need to be performed where impacts are proposedbefore wetland impacts can be quantified and wetland permits can be issued. BMPs, including siltfences, straw bales, and mulch will be used as necessary during clearing of the corridor andconstruction of tower pads to control erosion until the area can be stabilized with gravel orvegetation.
WDFW priority habitat located within the transmission system corridor, stream channels, andwetlands would be avoided where possible. No tower pad construction would occur withinstream channels or associated riparian buffers. Some PEM wetland systems may be disturbedduring construction. As discussed above for the cogeneration facility, wetlands within the projectsite function on a very low level and proposed wetland mitigation would create higher qualitywetlands systems.
Overall, tower pad construction would require the clearing of a relatively small area within theexisting 70-acre transmission line corridor. With implementation of the recommended mitigationmeasures, impacts associated with the transmission line on wildlife would be temporary and

BP Cherry Point Cogeneration Project 3.7 Vegetation, Wildlife, FisheriesDraft EIS 3.7-25 September 2003
habitat impacts would be small. The proposed transmission line corridor would not significantlyaffect most wildlife populations.
Other Project Components
Impacts associated with Laydown Area 4 and Access Road 3 would be the same as thosedescribed above for the cogeneration facility and the refinery interface. Most of the habitat thatwould be cleared is disturbed and is generally of low quality. A small amount of mixedconiferous/deciduous forest habitat, approximately 0.2 acre, in the northeast portion of LaydownArea 4 would be cleared. Vegetation communities in Laydown Area 4 would be restored andenhanced following construction with native grass, shrub, and forested vegetation (Appendix E).Implementation of appropriate BMPs would protect against adverse impacts on wildlife habitat.
As discussed in Section 3.5 under the proposed mitigation plan, in addition to the 0.2 acre ofwetland restoration of Wetland B3, 0.3 acre of wetland creation would occur, for a total of 0.5acre of wetland restoration and creation in Laydown Area 4 (Appendix E).
Existing native trees and shrubs within CMA 1 and CMA 2 would not be disturbed. A reedcanarygrass control program has been developed to remove and control this invasive specieswithin the mitigation areas.
Proposed wetland enhancement and the creation of new wetlands associated with proposedwetland mitigation sites CMA 1 and CMA 2 would result in an increase in habitat quality, wouldbenefit wildlife species that currently use the area, and would likely attract a more diverseassortment of wildlife species. The riparian corridor of Terrell Creek is adjacent to CMA 1 andCMA 2. Wetland enhancement associated with CMA 1 and CMA 2 would provide a significantbenefit to the overall quality of wildlife habitat of the Terrell Creek system.
No critical or priority upland habitat is located within the other project components. Wetlandsystems within CMA 1 and CMA 2 are identified by WDFW as priority habitat. As describedpreviously, wetlands within the project site function on a very low level and proposed wetlandmitigation would create higher quality wetlands systems.
Overall, with implementation of the recommended mitigation measures, impacts associated withLaydown Area 4 and Access Road 3 on wildlife would be temporary and habitat impacts wouldbe small and would not significantly affect most wildlife populations. Wetland enhancementassociated with CMA 1 and CMA 2 would provide a significant benefit to the overall quality ofwildlife and habitat in the project vicinity.
Fisheries
Potential impacts on fish or fish habitat associated with construction of the proposed projectinclude impacts on water quality and changes in water quantity. No construction activity would

BP Cherry Point Cogeneration Project 3.7 Vegetation, Wildlife, FisheriesDraft EIS 3.7-26 September 2003
occur within 1.5 miles of the waters of Puget Sound. Wetlands within the project site arehydrologically isolated with no known fish use. General mitigation measures associated withpotential water quality and quantity changes have been developed to minimize potential impactson fish and fish habitat. In addition, mitigation measures and impacts would be further detailedand refined as the design phase proceeds prior to construction.
Water quality can be degraded by accidental spills of petroleum hydrocarbons from constructionactivities and exposure to construction waste, such as concrete wash water. Potential significantimpacts due to erosion and sedimentation are not likely because stormwater detention pondswould trap and filter runoff associated with construction activities. Potential water qualityimpacts related to construction are expected to be short term and negligible with propermanagement. Section 3.4, Water Quality, contains more detailed information on water qualityimpacts. There are no aquatic resources with potential fish habitat located within or near (about0.5 mile) the footprint of the cogeneration facility, components of the refinery interface, or thetransmission system corridor. With implementation of the recommended mitigation measures,impacts on fish or fish habitat associated with construction of these components of the projectwould not occur.
Custer/Intalco Transmission Line No. 2
Seven stream channels, Terrell Creek, Fingalson Creek, California Creek, and four unnamedtributaries to California Creek, flow within the proposed transmission line corridor (Table 3.7-4).The WDFW Priority Habitats and Species database identifies the riparian corridors of TerrellCreek, Fingalson Creek, and California Creek within the transmission line corridor as priorityhabitats (WDFW 2001). Ditches and swales within the transmission line corridor associated withwetland habitat are seasonally inundated and are unlikely to provide habitat for fish.
An unpaved road is located along most of the corridor to provide access for maintenance, andpaved roads cross the corridor in several locations. No road construction would be associatedwith the transmission line.
As described above in the upland vegetation section, Option 1 would not require any changes tothe existing lines or towers and no new towers would be constructed. With implementation of therecommended mitigation measures, no impacts on fish or fish habitat associated withconstruction of the transmission line would occur under this option.
The other two transmission line options, replacing the existing tower structures with latticetowers (Option 2a) or monopole-style towers (Option 2b), are described above in the uplandvegetation section. The number of new towers required for either option has not been determined.Even with construction of monopole-style towers or lattice towers, impacts on fish or fishhabitat are unlikely because the towers would be placed outside of stream and associated riparianzone buffers. The existing maintenance road would be used, so no new roads, culverts, or streamcrossings would be constructed. A SWPP plan and BMPs, including silt fences, straw bales, and

BP Cherry Point Cogeneration Project 3.7 Vegetation, Wildlife, FisheriesDraft EIS 3.7-27 September 2003
mulch, would be used as necessary during clearing of the corridor and construction of the towerpads to control erosion until the area can be stabilized with gravel or vegetation.
Overall, with implementation of the recommended mitigation measures and avoidance of streamand riparian habitat, impacts associated with the transmission line would not significantly affectfish or fish habitat.
Other Project Components
Aquatic resources with potential fish habitat are not located within the footprint of the otherproject components. Potential fish habitat is not located within about 0.5 mile of Access Road 3or Laydown Area 4. Proposed wetland mitigation sites CMA 1 and CMA 2 are located adjacentto the forested riparian corridor of Terrell Creek. The WDFW Priority Habitats and Speciesdatabase identifies the riparian corridor of Terrell Creek as priority habitat.
Construction activity associated with wetland mitigation sites CMA 1 and CMA 2 would notdisturb fish or fish habitat associated with Terrell Creek. BMPs would be implemented to avoidand reduce impacts on fish habitat resulting from construction of the wetland mitigation sites.
Wetland enhancement and the creation of new wetlands associated with the proposed wetlandmitigation sites CMA 1 and CMA 2, located adjacent to the forested riparian corridor of TerrellCreek, would increase the quality of habitat in vegetation communities near the riparian corridorof Terrell Creek.
Overall, with implementation of the recommended mitigation measures and avoidance of streamand riparian habitat, impacts associated with the other project components would notsignificantly affect fish or fish habitat.
Threatened and Endangered Species
As part of the project, several documents analyzed potential project impacts on federally listedthreatened and endangered species. A BE was prepared, pursuant to the ESA, associated with thecogeneration facility, refinery interface area, and the other project components (BP 2003,Appendix H). A SEPA checklist and JARPA application was prepared for the transmissionsystem corridor (ARCO Products Company 1999). An environmental resources report evaluatedthe transmission line component of the project (Appendix B).
Existing documentation and information from the USFWS, NOAA Fisheries, and WDFW wereused to identify federal and state protected species that may use the proposed project site and toidentify the presence of priority habitats near the proposed project site.
Based on an analysis and review of natural resource documents and information from naturalresource agencies, no federal or state protected species regularly forage, breed, or occur within the

BP Cherry Point Cogeneration Project 3.7 Vegetation, Wildlife, FisheriesDraft EIS 3.7-28 September 2003
cogeneration facility, refinery interface area, transmission system corridor, or the other projectcomponents of the project site. Breeding or foraging habitat typically associated with federal orstate protected species is not located within the area of these elements of the project. Nobreeding or foraging habitats associated with protected species would be affected by constructionactivities associated with these elements of the proposed project.
Custer/Intalco Transmission Line No. 2
No federal or state protected terrestrial species regularly forage, breed, or occur within thetransmission line corridor. No breeding or foraging habitats associated with protected terrestrialspecies would be affected by construction activities associated with these elements of theproposed project.
Federal or state protected fish species may occur in the reaches of Terrell Creek, Fingalson Creek,and California Creek that flow through the transmission line corridor. As described above in thefisheries section, under the option to connect with the existing transmission line additionalelectrical equipment and wiring would be needed but new towers would not be constructed. Noimpacts on protected fish or fish habitat associated with construction of the transmission linewould occur under this option. The existing maintenance road would be used, so no new roads,culverts, or stream crossings would be constructed.
The number of new towers required for either the monopole-style towers or lattice towers optionhas not been determined. Even with the construction of monopole-style towers or lattice towers,impacts on protected fish or fish habitat are unlikely because the towers would be placed outsideof stream and associated riparian zone buffers. BMPs, including silt fences, straw bales, andmulch, will be used as necessary for clearing the corridor and construction of tower pads tocontrol erosion until the area can be stabilized with gravel or vegetation.
Overall, with implementation of the recommended mitigation measures and avoidance of streamand riparian habitat, impacts associated with the transmission line would not significantly affectprotected fish or fish habitat.
Operation
Upland Vegetation
Other than those communities affected by construction, operation of the project would not affectexisting vegetation communities associated with the cogeneration facility, refinery interface, orthe other project components. Long-term vegetation maintenance objectives would beimplemented from guidance in a landscaping plan (Appendix E). A weed control program wouldbe implemented during operation of the proposed facility (BP 2002, Section 3.6). Ornamentalspecies or lawn may be planted near the facilities. Some areas currently dominated by noxiousweed species may be converted to landscaped areas. These areas would require maintenance. The

BP Cherry Point Cogeneration Project 3.7 Vegetation, Wildlife, FisheriesDraft EIS 3.7-29 September 2003
establishment of noxious weed species may occur within the proposed site. These species wouldbe controlled by procedures acceptable to the Whatcom County Noxious Weed Control Board.
Transmission System
Operation and maintenance associated with the transmission system corridor would includeremoving or topping trees to maintain a safe distance between the trees beneath the electricallines. Existing access and maintenance roads associated with the transmission system corridorwould be maintained to prevent vegetation from growing in these areas. Vegetation that becomesestablished in disturbed areas such as unpaved roads are often nonnative invasive species.
Custer/Intalco Transmission Line No. 2
Operation and maintenance measures associated with the transmission line corridor would besimilar to those described above for the transmission system corridor. Since the transmission lineis currently in operation, mowing, tree trimming, and road maintenance would be a continuationof current activity.
Wildlife and Habitat
Cogeneration Facility
Other than wildlife habitat affected by construction, operation of the proposed project is notexpected to affect existing wildlife habitats associated with the cogeneration facility. Under theproposed project, adverse operational impacts on wildlife would be minor. Wildlife has coexistedwith the BP Cherry Point Refinery for over 30 years. Noise levels associated with operation ofthe proposed project are expected to be consistent with current ambient noise levels. Thecogeneration facility would not block wildlife movement corridors, because areas to the eastwould remain available for species use.
Refinery Interface
Potential impacts associated with operation of the refinery interface would be the same as thosedescribed for the cogeneration facility.
Transmission System
Transmission system operation and maintenance activities would include road grading andvegetation clearing, as described above for upland vegetation. Some wildlife habitat loss, noise,and disturbance could occur during maintenance activities. Impacts associated with maintenancewould be similar to those associated with construction activities, but would not be as extensive.

BP Cherry Point Cogeneration Project 3.7 Vegetation, Wildlife, FisheriesDraft EIS 3.7-30 September 2003
Custer/Intalco Transmission Line No. 2
Transmission line operation and maintenance activities would be the same as those described forthe transmission system, except that operation and maintenance of the transmission line wouldbe a continuation of current activity.
Other Project Components
Potential impacts associated with operation of the other project components would be the sameas those described for the cogeneration facility.
Fisheries
Operation activities associated with the proposed project that could affect fish or fish habitatinclude stormwater, water use, and wastewater. Potential impacts resulting from operation of theproposed project are unlikely due to the absence of streams within about 0.5 mile of thecogeneration facility, components of the refinery interface, or the transmission system corridor.Water resources within the area of these project components are limited to wetland habitat withno known fish use. Operation of the project would have negligible impacts on fish and fishhabitat if proper drainage, erosion-control plans, and stormwater management practices areimplemented. The proposed design approach, operational procedures, mitigation measures,BMPs, and other pollution prevention measures described in detail in Sections 2.2 and 3.3 wouldprotect water quality associated with the proposed project and freshwater habitat downstream ofthe proposed project site.
Cogeneration Facility
The quantity and quality of stormwater runoff could be affected by operation of the cogenerationfacility because of the increase in impervious surfaces, which could result in impacts on fisherieshabitats downstream of the project site if not mitigated. Stormwater runoff associated withexisting impervious surfaces within the BP Cherry Point Refinery are currently routed totreatment facilities and detention ponds prior to being discharged to mitigation wetlands north ofGrandview Road. Drainage ditches associated with these wetlands eventually connect withTerrell Creek, about 0.5 mile from the project site. Stormwater from new impervious surfacesassociated with the cogeneration facility would be collected and diverted into detention andtreatment facilities. Treated stormwater would be discharged to the existing wetland drainagesystem as part of the wetland mitigation. No component of the proposed project would be builtnear Terrell Creek, and no storm or other surface water would be discharged directly to it.
A Construction SWPP plan would be developed in accordance with BMPs and would detail thesediment and erosion control measures and accidental spill prevention and control measures. TheBMPs would be implemented, inspected, and maintained to minimize the potential for adverselyaffecting downstream water quality. These may include such things as silt fencing and hay bales,

BP Cherry Point Cogeneration Project 3.7 Vegetation, Wildlife, FisheriesDraft EIS 3.7-31 September 2003
and placement of polyethylene tarps to cover exposed surfaces. Control of fuel storage andequipment fueling operations for spill prevention and control would be detailed in the SWPPplan. Stormwater impacts and management are discussed in additional detail in Section 3.4, WaterQuality.
Based on the mitigation methods that would be implemented and the distance between theproposed project and the stream, effects on fish or fish habitat associated with stormwater runoffare unlikely.
Contaminated industrial process wastewater associated with the proposed project would bedischarged to the Strait of Georgia via the BP Cherry Point Refinery’s wastewater treatmentsystem. The Nooksack River is the source of industrial process water for the project. TheWhatcom County PUD would pipe water from the Nooksack River to the site, either from oncethrough non-contact cooling water from a jacketed air compressor at the Alcoa Intalco Worksfacility if that facility is operational, or directly from the river. Water quality parameters of oncethrough non-contact cooling water are presented in Table 3.4-1. Cogeneration facility wastewaterwould be treated and combined with the refinery’s wastewater and discharged through theNPDES-permitted (WA-002290-0) Outfall 001. Table 3.4-4 in Section 3.4 presents the flowsand chemical composition of the project’s wastewater, except for sanitary wastewater. Netprocess wastewater from the cogeneration facility to the refinery wastewater treatment plantwould be approximately 190 gpm, assuming 15 cycles of concentration in the cooling tower.Table 3.4-5 presents a numerical analysis of the potential impact of the project wastewater onthe refinery’s wastewater stream. The impact analysis is based on the average discharge from therefinery over the months of July, August, and September 2001. Because the volume ofwastewater is small and contains very low levels of contaminants, it would have little to no effecton the quality of water discharged.
Treated wastewater associated with the NPDES permitted outfall is not likely to significantlyaffect Puget Sound habitat that supports a variety of aquatic species such as salmon, other fish,shellfish, and other marine wildlife.
Sanitary waste from cogeneration facility employees would be collected and routed for treatmentby the Birch Bay WWTP via the refinery’s sanitary wastewater system. The estimated amountof sanitary waste generated by the cogeneration facility is between 1 and 5 gpm. The Birch BayWater and Sewer District has confirmed that it has the capacity to accommodate the incrementalcombined loading to its sanitary sewage wastewater treatment system from the refinery and theproposed cogeneration facility. The Birch Bay WWTP would treat the refinery and cogenerationfacility sanitary wastes before discharge to the Strait of Georgia. The quantity of sanitary wastethat would be generated by the cogeneration facility is not expected to impact receiving waterquality in the Strait of Georgia.

BP Cherry Point Cogeneration Project 3.7 Vegetation, Wildlife, FisheriesDraft EIS 3.7-32 September 2003
Refinery Interface
Stormwater runoff associated with impervious surfaces of the refinery interface componentswould be treated for water quality and quantity as described above for the cogeneration facility.Potential stormwater impacts associated with operation of the refinery interface would be thesame as those described for the cogeneration facility.
Transmission System
Maintenance and operation activities associated with the transmission system could result inchemical spills that could affect fish habitat. A SWPP plan for maintenance procedures, inconjunction with the SPCC plan, would provide structural, operational, and erosion/spill controlBMPs for all maintenance activities. The transmission system access roads and tower pads allowstormwater infiltration to occur and would not substantially increase the amount of stormwaterrunoff over existing conditions.
Custer/Intalco Transmission Line No. 2
Maintenance and operation activities associated with the transmission line could result inchemical spills that could affect fish habitat. This element of the project would be owned andoperated by the Bonneville Power Administration. Bonneville has a SWPP plan for maintenanceprocedures, in conjunction with a SPCC plan that would provide structural, operational, anderosion/spill control BMPs for all maintenance activities on the transmission line.
Overall, transmission line operation and maintenance would be a continuation of currentactivities. Impacts associated with operation and maintenance of the transmission line withimplementation of the recommended mitigation measures and avoidance of stream and riparianhabitat, would not significantly affect fish or fish habitat.
Other Project Components
Stormwater runoff associated with Access Road 3 would be treated for water quality andquantity as described above for the cogeneration facility. Laydown Area 4 would not beconverted to impervious surfaces and would be restored and enhanced following constructionwith native grass, shrub, and forested vegetation (Appendix E).
Operation activity associated with wetland mitigation sites CMA 1 and CMA 2 would notdisturb fish or fish habitat associated with Terrell Creek. A reed canarygrass control program hasbeen developed to remove and control this invasive species within the mitigation areas, whichwould benefit the riparian habitat of Terrell Creek.

BP Cherry Point Cogeneration Project 3.7 Vegetation, Wildlife, FisheriesDraft EIS 3.7-33 September 2003
Overall, with implementation of the recommended mitigation measures and avoidance of streamand riparian habitat, operation impacts associated with the other project components would notsignificantly affect fish or fish habitat.
Threatened and Endangered Species
No federal or state protected species regularly occur within the cogeneration facility, refineryinterface area, transmission system corridor, or the other project components of the project site.Operation impacts on protected species are not likely. Treated wastewater associated with theNPDES-permitted outfall is not likely to have a significantly adverse impact on Puget Soundhabitat that supports species such as chinook and coho salmon.
Custer/Intalco Transmission Line No. 2
No federal or state protected terrestrial species regularly forage, breed, or occur within thetransmission line corridor. No breeding or foraging habitats associated with protected terrestrialspecies would be affected by operation activities associated with this component of theproposed project.
Federal or state protected fish species may occur in the reaches of Terrell Creek, Fingalson Creek,and California Creek that flow through the transmission line corridor. As described above in thefisheries section, with implementation of the recommended mitigation measures and avoidance ofstream and riparian habitat, operation impacts associated with the transmission line would notsignificantly affect protected fish or fish habitat.
3.7.3 Impacts of No Action
Under the No Action Alternative, new facilities would not be constructed at the site. Impacts onupland vegetation, wildlife and habitat, fisheries, and threatened and endangered speciesassociated with the proposed project would not occur. No impacts or construction would occurthat would entail removal or alteration of existing habitat within the proposed project site.
Proposed wetland enhancement and the creation of new wetlands would not occur. Withdrawalfrom the Nooksack River would not change. Industrial wastewater from the Alcoa Intalco Workswould continue to be discharged to marine waters while the smelter was operating.
3.7.4 Secondary and Cumulative Impacts
The proposed project site is zoned as Heavy Impact Industrial by Whatcom County, and islocated within the Cherry Point Major Industrial Urban Growth Area/Port Industrial Zone asdefined in the Whatcom County Comprehensive Plan (Whatcom County 1997, as amended). TheBP Cherry Point Refinery is adjacent to the proposed project site. A variety of industrial

BP Cherry Point Cogeneration Project 3.7 Vegetation, Wildlife, FisheriesDraft EIS 3.7-34 September 2003
facilities such as Alcoa Intalco Works, an aluminum smelter, and the Conoco-Phillips Refinery,are located within a few miles of the proposed project site.
The loss of approximately 33 acres of upland vegetation from the project site would not result insignificant adverse cumulative impacts to wildlife habitat of the area. Wildlife habitats within theproposed project site are not unique or valuable relative to the native forested communities thatexisted in the area prior to land use conversion.
As part of the proposed enhancement associated with the project, existing ponds and wetlandmitigation areas would be connected through corridors to the enhanced wetland area. Thesemeasures would increase habitat quality, benefit wildlife species that currently use the area, andlikely attract a more diverse assortment of wildlife species.
The proposed Georgia Strait Crossing project, as described in Section 3.10, is anticipated to beconstructed concurrently with the proposed project. At this time, the County envisionsadditional growth and development in the area of the proposed project. Impacts associated withthese future projects would generally be similar to the type of cumulative impacts on wildlife andassociated habitat as described for the proposed project. Aquatic resources within the boundariesof the proposed Georgia Strait Crossing project would include Terrell Creek and Puget Sound.The proposed project would not contribute to potential cumulative impacts on fish or fishhabitat because impacts to aquatic resources are not anticipated under the proposed project.
Additional development projects anticipated to occur in the project vicinity in future yearswould contribute to cumulative impacts to wildlife, fish, and associated habitat. Because of thezoning status, development options are limited to industrial use and would be consistent withzoning requirements and regulations. The proposed project would not directly causedevelopment or serve as a mechanism to enable it. The extent of cumulative impacts on wildlifeand habitat associated with the proposed project would depend on the location, nature, and scaleof current and planned future development projects in the region.
The addition of the proposed project would add impervious surfaces to the watershed and createstormwater runoff. Stormwater runoff would be contained and treated before entering mitigationwetlands. The proposed project would not result in significant adverse cumulative impacts onfish or fish habitat in the region.
No breeding or foraging habitats associated with listed threatened and endangered species wouldbe affected by the proposed project. The proposed project would not result in significant adversecumulative impacts on listed threatened and endangered species.
3.7.5 Mitigation Measures
Much of what would typically be considered mitigation for impacts is inherent in the projectdesign, and is discussed in greater detail under the impacts discussion above.

BP Cherry Point Cogeneration Project 3.7 Vegetation, Wildlife, FisheriesDraft EIS 3.7-35 September 2003
BMPs would be implemented to protect upland vegetation communities within the proposedproject site that are not disturbed during construction. Native vegetation, including seed mixeswith native grasses, would be used to replace vegetation, particularly areas infested by weedyspecies that are disturbed due to construction activities. A landscaping plan would be preparedand implemented that includes long-term weed control measures. To minimize and control thespread of noxious weed species, all equipment would be cleaned before leaving the site.
A portion of Laydown Area 2, about 4.66 acres, would be restored following construction as partof the wetland mitigation proposal. The entire 4.74-acre area of Laydown Area 4 would berestored. The restoration of Laydown Area 4 would include 2.9 acres of wetland (0.5 acre) andupland (2.4) restoration and creation within the cogeneration facility fenceline. The other 1.8acres of Laydown Area 4 would include restoration of upland habitat outside the fenceline. Theserestored areas would provide wetland, upland, wildlife habitat, and a visual buffer between theproposed project and Grandview Road. As part of the proposed enhancement associated withthe proposed project, existing ponds and wetland mitigation areas would be connected throughcorridors to the enhanced wetland area. Replacing invasive, non-native vegetation such as reedcanarygrass and Himalayan blackberry with native grass, shrub, and tree vegetation wouldincrease habitat quality and diversity, which would benefit wildlife species that currently use thearea. High-quality native vegetation communities could attract a more diverse assortment ofwildlife species. See Section 3.5 for additional details of mitigation measures recommended forwetlands. Detailed information associated with proposed mitigation measures is provided in theRevised Cogeneration Project Compensatory Mitigation Plan and the May 22, 2003 Addendum:Changes to Revised Cogeneration Project Compensatory Mitigation Plan (Appendix E).
Fish habitat is not located within 0.5 mile of construction and operation activities associated withthe cogeneration facility, the refinery interface, or the transmission system corridor. Wetlandenhancement and the creation of new wetlands associated with the proposed wetland mitigationsites CMA 1 and CMA 2, located adjacent to the forested riparian corridor of Terrell Creek,would increase habitat quality of vegetation communities near the riparian corridor of TerrellCreek. Construction and operation activities would avoid stream channels within thetransmission line corridor. Water resources that could be affected by the proposed project arelimited to wetlands with no known fish use.
Water quality-related design guidelines and other forms of mitigation would be required tocomply with various federal, state, and local permit requirements. Conditions of permits orgovernment approvals include erosion- and sediment-control plans, stormwater managementplans, and BMPs (e.g., mulching, hydroseeding, check dams, biofiltration swales, phased clearing,silt fencing, and sediment ponds). These mitigation requirements are expected to preventsignificant impacts on water quality from construction and operation of the proposed project.Stormwater and runoff increases due to increases in impervious surface area would be containedin stormwater detention ponds and then treated before being discharged into wetland mitigationsites.

BP Cherry Point Cogeneration Project 3.7 Vegetation, Wildlife, FisheriesDraft EIS 3.7-36 September 2003
Wastewater associated with the project would be retained, treated, and monitored prior todischarge. Water quality impact mitigation would primarily be addressed by development andimplementation of construction and operation SWPP plans that include erosion andsedimentation control plans and SPCC plans. A required State Waste Discharge Permit and FactSheet for construction and operation of the project is currently under development by EFSEC.The permit and fact sheet would outline water quality and quantity effluent limitations, requiredtreatment strategies, and performance standards. BMPs would detail the sediment and erosioncontrol measures and accidental spill prevention and control measures. The BMPs would beimplemented, inspected, and maintained to minimize the potential for adversely affectingdownstream water quality. BMPs may include silt fencing and hay bales, and placement ofpolyethylene tarps to cover exposed surfaces. Control of fuel storage and equipment fuelingoperations for spill prevention and control would be detailed in the SWPP plan. A more detaileddiscussion of potential permit requirements, construction BMPs, and stormwater treatmentpertaining to potential water quality impacts is presented in Section 3.4, Water Quality.
Potential impacts on migratory birds may be mitigated through a variety of measures. USFWShas developed guidelines to aid in the reduction of fatal bird collisions with prominent structures,including HRSG stacks. The primary mitigation measure applicable to the proposed project is touse best engineering practices to construct the transmission towers at the minimum heightallowable with no guy wires or lighting, to avoid impacts to birds. The transmission lines andtower design would be defined by the Bonneville interconnection agreement.
In addition, the HRSG exhaust stacks would not be lighted. Studies performed on OntarioHydro’s two HRSG stacks suggest that the use of lights on HRSG exhaust stacks actuallyattracts birds and may increase fatalities (BP 2002, Section 3.6).
3.7.6 Significant Unavoidable Adverse Impacts
With implementation of the recommended mitigation measures and avoidance of sensitive areassuch as stream and riparian corridors, no significant unavoidable adverse impacts on uplandvegetation, wildlife and habitat, fish, and threatened and endangered species are identified. Theproposed project would be located adjacent to a facility with associated human-relateddisturbance that has been operating for more than 30 years. Vegetation communities that providehabitat for wildlife would be cleared, but that vegetation is generally of low quality. Proposedwetland and upland creation and restoration efforts would create higher quality habitat that islikely to attract a more diverse variety of native wildlife species than currently occupy theproject site. Fish habitat is not located within about 0.5 mile of the footprint of the cogenerationfacility, the refinery interface, or the transmission system corridor. Wetland mitigation sitesCMA 1 and CMA 2 would enhance habitat adjacent to the riparian corridor of Terrell Creek.Construction and operation activities would avoid stream channels within the transmission linecorridor. Breeding and foraging habitat typically associated with federal and state protectedspecies or listed threatened and endangered species would not be disturbed under the proposedproject.

BP Cherry Point Cogeneration Project 3.8 Energy and Natural ResourcesDraft EIS 3.8-1 September 2003
3.8 ENERGY AND NATURAL RESOURCES
This section discusses the anticipated energy and natural resources use of the proposed project,the sources and availability of energy for the cogeneration facility, the facility’s impacts onenergy and natural resources, and mitigation measures to be implemented. The analysis in thissection is primarily based on information provided by the Applicant in the ASC (BP 2002,Section 3.8). Where additional information has been used to evaluate the potential impactsassociated with the proposal, that information has been referenced. Information regarding wateruse and conservation is presented in Sections 3.3 and 3.4.
3.8.1 Existing Conditions
Energy Resources
Existing energy resources within the project vicinity primarily include electricity, natural gas,and a variety of petroleum products, including gasoline, diesel fuel, and lubricating oils. Figure2-3 presents the existing electrical and natural gas infrastructure in the project vicinity.
Electricity
Project Area
Sources of electricity in the project vicinity include power provided by Puget Sound Energy(PSE) and Bonneville.
Two power plants are in the vicinity of the BP Cherry Point Refinery: the PSE Point WhitehornPower Generation Plant and the Tenaska Cogeneration Plant. The PSE Point Whitehorn Plant isjust west of the refinery. This 150-MW power plant can be fired by natural gas, diesel, or jet fueland is primarily used to provide power during peak demand periods. Tenaska Power Partnersoperates a 249-MW gas-fired cogeneration power plant at the Conoco-Phillips Refinery, locateda few miles south of the BP Cherry Point Refinery. A third power plant, the Sumas Energy 2(SE2) project, is a 660-MW natural gas-fired power plant proposed in Sumas, Washington,approximately 25 miles east of the proposed cogeneration site. The SE2 plant has beenpermitted, but not yet constructed.
Electricity is supplied to the refinery by PSE through two 115-kV transmission lines that arerouted within easements adjacent to Aldergrove and Blaine roads. The power lines enter therefinery area adjacent to Blaine Road and connect to a substation within the refinery boundaries.
Bonneville owns a substation at Custer, Washington (approximately 4 miles northeast of therefinery), from where two 230-kV transmission lines are routed west and then south to theIntalco substation at the Alcoa Intalco Works aluminum smelter. The Applicant has proposed theconstruction of a 0.8-mile-long 230-kV electrical transmission line (referred to throughout thisEIS as the “transmission system”) to provide a connection between the cogeneration facility andthe Custer/Intalco Transmission Line No. 2.

BP Cherry Point Cogeneration Project 3.8 Energy and Natural ResourcesDraft EIS 3.8-2 September 2003
In 1999, an earlier version of the transmission system was proposed by the Applicant to providea means for supplying the refinery and other industrial customers in the area with electricalpower from the Bonneville transmission system. That proposal received federal wetland permitand water quality certification approvals and has been partially constructed (two transmissionline maintenance roads and three transmission tower gravel pads).
The transmission system element of the current cogeneration project proposal, which wouldsupersede the original transmission line proposal, would use a portion of the original permittedtransmission line design. Instead of using the new transmission line to supply power to therefinery and other customers from the Bonneville transmission system, the transmission linewould normally be used to export power generated by the cogeneration facility to the Bonnevilletransmission system for distribution within the western power market. See Section 2 foradditional discussion of the transmission system.
Northwest Region
Regional Demand. Based on data published by the Northwest Power and Conservation Council(NWPCC), electricity demand for the Council’s four-state Pacific Northwest planning region(Washington, Oregon, Idaho, and Montana) was 20,080 average megawatts in 2000 (NWPCC2003).
As shown below in Table 3.8-1, the Council’s recently revised 20-year demand forecast projectsthat electricity demand in the region will grow from 20,080 average megawatts in 2000 to 25,423average megawatts by 2025 (medium forecast), an average annual growth rate of just less than1% per year. While the Council's forecast indicates that the most likely range of demand growth(between the medium-low and medium-high forecasts) is between 0.4 and 1.50% per year, thelow to high forecast range used by the Council recognizes that growth as low as -0.5% per year,or as high as 2.4% per year, is possible although relatively unlikely (NWPCC 2003).
Table 3.8-1: Projected Pacific Northwest Electricity Demand, 2000-2025
Electricity Demand (Average Megawatts) Growth Rates (Percent Change)Forecast Scenario
2000 2015 2025 2000-2015 2000-2025
Low 20,080 17,489 17,822 -0.92 -0.48Medium Low 20,080 19,942 21,934 -0.05 0.35Medium 20,080 22,105 25,423 0.64 0.95Medium High 20,080 24,200 29,138 1.25 1.50High 20,080 27,687 35,897 2.16 2.35Source: NWPCC 2003
Bonneville Transmission System. Bonneville owns and operates 15,000 miles of power lines thatcarry power from the dams and other power plants to utility customers throughout the PacificNorthwest. The Bonneville service area includes Oregon, Washington, Idaho, western Montana,and small portions of Wyoming, Nevada, Utah, California, and eastern Montana.

BP Cherry Point Cogeneration Project 3.8 Energy and Natural ResourcesDraft EIS 3.8-3 September 2003
Generation resources typically require interconnection with a high-voltage electricaltransmission system for delivery to purchasing retail utilities. Bonneville owns and operates theFCRTS, comprising more than three-fourths of the high-voltage transmission grid in the PacificNorthwest, including extra regional transmission facilities. Bonneville operates the FCRTS inpart to integrate and transmit “electric power from existing or additional Federal or non-Federalgenerating units.” Interconnection with the FCRTS is essential to deliver power from manygeneration facilities to loads both within and outside the Pacific Northwest.
Public agencies get preference to power from Bonneville. About half the power Bonneville sellsgoes to Northwest public utility districts, city light departments, and rural electric cooperatives.An additional 15% of Bonneville's annual sales is to investor-owned utilities. Sales to Northwestaluminum companies and a few other large industries account for about one-fourth ofBonneville's annual revenues. After Northwest customers are served, Bonneville sells anysurplus power to utilities outside the region.
System Constraints. Bonneville has indicated that portions of the Northwest transmission systemare approaching gridlock, resulting in chronic congestion on a number of critical transmissionpaths, which has curtailed firm power deliveries. One effect of these constraints is that they limitwholesale power trading, which in turn drives up prices for all consumers in the West. As of2001, approximately 1,000 MW of generation projects under construction had contracted forwheeling (transferring power) over the Bonneville system. An additional 3,000 MW of newgeneration is proposed by 2004, and developers for nearly 30,000 MW of generation haverequested interconnection. While many of the proposed generation projects will not be built,Bonneville has determined that a transmission capacity shortfall of approximately 3,000 MWwill occur by 2004 (Bonneville 2001d).
Planned Generation Projects. As of April 2003, there were 39 new merchant power generationprojects proposed in the State of Washington, representing in excess of 10,000 MW of additionalgeneration capacity (see Table 3.8-2). While not all of these will be constructed, it is likely thatadditional generation capacity will continue to be added in the Northwest during the next two tothree years. In 2002, over 1,100 MW of additional capacity has become operational in the region,with gas-fired facilities comprising a majority of the newly installed capacity (see Table 3.8-3).Table 3.8-4 lists four additional plants currently under construction in Washington with theirexpected commercial operation dates (PSE 2003).
Table 3.8-2: Proposed Generation Projects in Washington
Facility Developer Facility Type Size (MW)
Bickleton PacifiCorp Power Marketing, Inc. Wind 200Big Horn PacifiCorp Power Marketing, Inc. Wind 200BP Cherry Point Refinery BP Cherry Point Refinery Combined Cycle/Cogen 720Columbia River 1 Nordic Electric, Llc Combust Turbine 100Columbia River 2 Nordic Electric, Llc Combust Turbine 100Cowlitz Cogneration Weyerhaeuser Co. Combined Cycle/Cogen 405Darrington National Energy Systems Co. Boiler/Cogen 15Everett Delta Power Project FPL Energy, Inc. Combined Cycle 248Frederickson (USGECO) PG&E Generating Co. Combust Turbine 100

BP Cherry Point Cogeneration Project 3.8 Energy and Natural ResourcesDraft EIS 3.8-4 September 2003
Table 3.8-2: Continued
Facility Developer Facility Type Size (MW)
Frederickson (Tahoma) Tahoma Energy Combined Cycle 270Frederickson 2 EPCOR Combined Cycle 290Goldendale Smelter Westward Energy Llc Combined Cycle 300Horse Heaven Washington Winds Inc. Wind 150King County Fuel Cell Plant Fuel Cell Energy Inc Other 1Kittitas Valley Sagebrush Power Partners (Zilkha) Wind 250Klickitat Columbia Wind Power Waste 80Longview (MIR) Mirant Corp. Combined Cycle 286Moses Lake National Energy Systems Co. CC/Cogen 306Plymouth Energy LLC Plymouth Energy Llc Combined Cycle 306Port Of Washington Continental Energy Services, Inc. Combust Turbine 290Rainier National Energy Systems Co. Combined Cycle 306Richland (COMPOW) Composite Power Corp. Combust Turbine 2600Roosevelt (SEENGR) SeaWest Energy Group, Inc. Wind 150Roosevelt Landfill PUD No. 1 of Klickitat County Intern Combustion 13Seattle (Globaltex) Globaltex Industries Inc. Coal 249Six Prong SeaWest Energy Group, Inc. Wind 150Stateline Wind Project (Wash) FPL Energy, Inc. Wind 40Sumas Energy 2, Inc. Sumas Energy 2, Inc. Combined Cycle 530Sumas Energy 2, Inc. Sumas Energy 2, Inc. Duct Firing 130Sumner (PG&E) PG&E Dispersed Generating Co., Combust Turbine 87Tacoma (Mscg) Morgan Stanley Capital Group, Inc. Combust Turbine 324Underwood PacifiCorp Power Marketing, Inc. Wind 70Waitsburg SeaWest Energy Group, Inc. Wind 50Wallula Newport Northwest Combined Cycle 1000Wallula Newport Northwest Duct Firing 300Washington (Elcap) El Cap I Combust Turbine 10Wild Horse Wind Power Wind Ridge Power Partners (Zilkha) Wind 250Source: PSE 2003; Makarow, pers. comm., 2003
Table 3.8-3: Washington/Oregon Generation Facilities Online in 2002
Facility Developer Facility Type Size (MW) On-Line Date
Boulder Park Avista Corp Intern Combust 25 5/31/2002Centralia (TRAENE) TransAlta Energy Corp. Comb Cycle 248 8/12/2002Frederickson Power Frederickson Power (EPCOR) Comb Cycle 248 8/19/2002Hermiston Calpine Comb Cycle 630 6/1/2002Klondike Northwest Wind Power Wind 25 4/30/2002Nine Canyon Wind Project Energy Northwest Wind 50 9/25/2002Source: PSE 2003
Table 3.8-4: Washington Generation Facilities Currently Under Construction
Facility Developer Facility Type Size (MW) On-Line Date
Chehalis Power Station Tractebel Power, Inc. Comb Cycle 520 Qtr. 3/2003Coyote Springs 2 Avista Comb Cycle 260 Qtr. 3/2003Goldendale Calpine Corp. Comb Cycle 248 Qtr. 2/2004Satsop CT Project Duke Energy Comb Cycle 650 Construction SuspendedSource: PSE 2003

BP Cherry Point Cogeneration Project 3.8 Energy and Natural ResourcesDraft EIS 3.8-5 September 2003
Planned Transmission Projects. Bonneville has determined that there is a need to upgradeportions of the Northwest transmission grid, and has identified nine high priority projects inWashington and Oregon that would improve Bonneville's ability to maintain reliable service toloads, integrate new generation, and restore or enhance transfer capability across keytransmission paths. While none of the projects is in Whatcom County, three projects (G1, G6,and G8) would address north-south transmission capacity along the I-5 corridor. The identifiedpriority projects are summarized below (from Bonneville 2001d).
• G1. Kangley - Echo Lake 500 kV line
- Build approximately 9 miles of new 500-kV line from Echo Lake to a point on theSchultz-Raver 500-kV line (near the community of Kangley).
- Move the existing Monroe-Sammamish-SnoKing 230-kV tap to the Monroe-Echo Lake500-kV line and add a new 500/230-kV transformer at SnoKing.
- Tap the Bothell-Sammamish 230-kV line into SnoKing.- Remove the Horse Ranch tap from the Monroe-Snohomish 230-kV lines and reterminate
the Horse Ranch line directly to the Snohomish 230-kV bus.- Reconfigure Bothell substation to add fifth bus section.- Add another transformer bank in the Puget Sound area in 2005-2006. Possible locations
are Covington or Maple Valley.
• G6. Schultz series capacitors
- Add two 500-kV series capacitors at Schultz substation in the Schultz-Echo Lake #2 andSchultz-Raver #1 500-kV lines.
• G8. Monroe - Echo Lake 500 kV line
- Construct approximately 32 miles of a new single-circuit 500-kV line betweenBonneville’s Echo Lake substation and Monroe substation.
- Add terminal facilities at Monroe and Echo Lake substations to terminate the new line.- To meet the Western System Coordinating Council reliability criteria for simultaneous
multiple-circuit outages, it is recommended that this line be constructed on a separateROW, at least 1,200 feet from the existing 500-kV ROW.
Natural Gas
Transmission Facilities
Approximately 80% of the natural gas used in the Northwest comes from Canada. Natural gasexported from Canada to the Northwest and other western states uses either the Duke Energy,Inc. pipeline that transports gas through British Columbia to the border at Sumas, Washington, orthrough Alberta on the Alberta Natural Gas Pipeline (TransCanada) to the border at Kingsgate,British Columbia. Two interstate natural gas transmission pipelines, the Northwest Pipelineoperated by the Williams Company and the Gas Transmission, Northwest (GTN) Pipelineoperated by PG&E National Energy Group (PG&E), supply natural gas to the Pacific Northwest

BP Cherry Point Cogeneration Project 3.8 Energy and Natural ResourcesDraft EIS 3.8-6 September 2003
and other western states from Canada and the Rocky Mountain region. The two transmissionlines interconnect just south of the Washington border near Hermiston, Oregon. Natural gas fromeither pipeline can be delivered to any point in the state currently served by a natural gasdistribution system (Washington State Office of Trade and Economic Development [OTED]2001a).
Northwest Pipeline. The Northwest Pipeline Corporation (a subsidiary of Williams Company)owns and operates a natural gas transmission system from interconnections with El Paso NaturalGas Company and Transwestern Pipeline Company near Blanco, New Mexico. NorthwestPipeline can deliver gas to northwest Washington from both the Rocky Mountains and Canada.The Northwest Pipeline connects with West Coast Energy and Sumas International Pipeline nearthe Canadian border in Sumas. The pipeline is a bi-directional pipeline that relies on acombination of physical and displacement capacity to meet firm contract commitments.Northwest Pipeline is a one-third owner of the Jackson Prairie Storage Project in Lewis County,Washington, and also owns and operates the Plymouth LNG facility in Benton County,Washington, both used by Northwest Pipeline to provide contract storage services. NorthwestPipeline also has contracted for underground natural gas storage capacity from Questar in theClay Basin Field in Utah (OTED 2001b). Total firm delivery capacity of the Northwest Pipelineat the receipt point is 2,580 MDth/day (million decatherms per day).
Capacity on Northwest Pipeline is fully subscribed, although some capacity is sold under short-term arrangements. Because of the design and physical capacity of the system, under certainconditions capacity on the system becomes constrained and displacement must be used to meetcontract demand (OTED 2001b).
Gas Transmission, Northwest Pipeline. The GTN pipeline is owned and operated by PG&E, asubsidiary of PG&E Corporation, which also owns Pacific Gas and Electric Company of SanFrancisco. The GTN pipeline is routed across the southeast corner of the state, interconnectingwith TransCanada at Kingsgate, British Columbia; Northwest Pipeline at Spokane and Palouse,Washington, and Stanfield, Oregon; and Pacific Gas and Electric Company and Tuscarora GasTransmission Company at Malin, Oregon (OTED 2001b). GTN also connects with AvistaUtilities and Cascade Natural Gas. The GTN pipeline is a dual pipeline system consisting ofapproximately 630 miles of 36-inch-diameter gas transmission pipeline, and approximately 590miles of 42-inch transmission pipeline. The GTN natural gas transmission pipelines can transporta total of 2,700 MDth/day to the Pacific Northwest, of which more than 1,800 MDth/day can besent on to California and Nevada. In 2000, typical deliveries to the Pacific Northwest from theGTN system averaged 522 MDth/day in the winter and 300 MDth/day in the summer (OTED2001b).
GTN has 2,732 MDth of firm transportation capacity under contract, or 100% of its nominaltransportation capacity. Nearly all of these contracts have expiration dates in 2005 or later. Themajority of gas transported by large customers like Pacific Gas & Electric Company is passingthrough the GTN system en route to California. The exceptions are Avista Corporation,Northwest Natural Gas Company, Puget Sound Energy, Pan-Alberta Gas (US), Inc.,PanCanadian Energy Services, Duke Energy, and Chevron USA Inc., all of which deliver topoints in Washington and Oregon (OTED 2001b).

BP Cherry Point Cogeneration Project 3.8 Energy and Natural ResourcesDraft EIS 3.8-7 September 2003
Ferndale Pipeline. Within the Cherry Point industrial area, the Applicant and Alcoa jointly ownthe proprietary Ferndale gas pipeline that transports natural gas from the Sumas gas-trading hubto the BP Cherry Point Refinery and the Alcoa Intalco Works aluminum smelter. Arco and Alcoaconstructed the Ferndale pipeline in 1990 to provide natural gas service to the BP (formerlyArco) Cherry Point Refinery and the Alcoa Intalco Works facility. The 16-inch pipeline extendsfor approximately 31 miles.
The Ferndale pipeline has a nominal design capacity of approximately 104 million standardcubic feet per day, or approximately 104,000 decatherms per day (Dth/d), with a supply pressureof 500 psig at Sumas and a minimum delivery pressure of 350 psig at Cherry Point. Currentdemands on the Ferndale pipeline typically range from approximately 6,000 to 38,000 Dth/day,with average demand typically in the 15,000 to 20,000 Dth/day range. An 8-inch lateral linecontinues south from the BP Cherry Point Refinery to supply Alcoa Intalco Works (Torpey, pers.comm., 2002).
Cascade Natural Gas Pipeline. Cascade Natural Gas owns a second distribution pipeline in theCherry Point industrial area that parallels Grandview Road adjacent to the refinery and providesgas to the PSE Point Whitehorn generation facility. This pipeline previously transported naturalgas to the refinery until the Ferndale pipeline was constructed in 1990.
Georgia Strait Crossing Pipeline (Proposed). A third natural gas pipeline has been proposedwithin the Cherry Point industrial area. BC Hydro and the Williams Company have formed ajoint venture to construct the GSX pipeline. The proposed project would include 32 miles of 20-inch pipeline from an interconnection station at Sumas, Washington, to a new compressor stationto be constructed near Cherry Point. From the compressor station, approximately 53 miles of 16-inch onshore and offshore pipeline would be constructed to extend the pipeline to VancouverIsland, British Columbia. Within the immediate cogeneration project vicinity, the proposedpipeline corridor runs east-west along the north side of Grandview Road and would connect to anew compression station to be constructed on the west side of Jackson Road. From there, thepipeline would run south to the Strait of Georgia along the west side of Jackson Road.
The proposed pipeline would provide natural gas to Vancouver Island, and would have an initialdesign capacity of 95,700 Dth/d. Although providing natural gas to customers in WhatcomCounty is not specifically part of the GSX proposal, the project would include the installation ofa tap valve assembly at the Cherry Point compression station to facilitate the potential futureaddition of a major industrial customer in the area (FERC 2002). See Section 3.10.5 foradditional discussion of this planned project.
Transmission System Outlook. A 2001 survey of the Pacific Northwest natural gas industryprepared by the OTED concluded that the natural gas transmission system supplying WashingtonState is severely constrained. Among its findings, the report noted:
• The Northwest and GTN pipelines are currently operating at or near their capacity;• There is no firm capacity available and as the load factor on the pipelines grow, the
availability of non-firm capacity is likely to be limited;

BP Cherry Point Cogeneration Project 3.8 Energy and Natural ResourcesDraft EIS 3.8-8 September 2003
• The existing pipelines are not sized to meet large new demands for natural gas;• Demand for gas has increased at a much faster rate than expected by pipeline companies and
major shippers largely because of greatly increased use of natural gas for electric generationnecessitated by higher electric demand and lower hydroelectric production;
• Recent price volatility and large price differentials at various points on pipelines servingWest Coast markets have demonstrated that even the existing level of gas consumption forelectric generation during low water years is not sustainable with current infrastructure; and
• Meeting new demand will require major investments in pipeline capacity (OTED 2001b).
However, the report also noted that pipeline expansion activities are under way, and that theseexpansions will likely ease some of the constraints on the existing pipelines. The reportconcluded that expansions on upstream pipelines such as TransCanada and Westcoast would berequired to bring additional Canadian gas supplies to the region.
Transmission System Expansion Projects. Interstate natural gas providers serving Washingtonhave identified plans for expansion of their transmission facilities to meet current and futuredemand in the region. These planned projects are listed in Tables 3.8-5 and 3.8-6.
Table 3.8-5: Northwest Pipeline/Williams Expansion Plans
Capacity(MDth/day)
Cost(million $)
Compression(horsepower)
New Pipe(miles)
ServiceCommencement
Columbia Gorge Expansion 50 35.5 14,600 6 CompletedNov. 1, 1999
Sumas to Chehalis Expansion 224 N/A N/A N/A June 2003Opal to Stanfield Displacement
Replacement175 125 24,000 90 Nov. 2003
Georgia Strait Pipeline 94 159 9,400 85 Nov. 2003Grants Pass Lateral Expansion 136 64.9 14,300 45.4 Project postponedSource: OTED 2001b
Table 3.8-6: GTN Pipeline Expansion Plans
CapacityMDth/day
Cost(million $)
Compression(horsepower)
Pipeline(miles)
Timeline
2002 Expansion – Kingsgate to Malin 200 115 75,000 21 (looping) June 20022003 Expansion – Kingsgate to Malin 200-500 -- -- -- --(depends on interest) TBD TBD TBD Late 2003 --Phase 2 – Vantage Pipeline 300-500
(speculative)More than
Phase 1Much less than
Phase 1260-270 (new) 2004
Phase 3 – Alaskan and MacKenzieDelta Pipeline
6,000 – 7,000 unknown unknown unknown 2008
Source: OTED 2001b

BP Cherry Point Cogeneration Project 3.8 Energy and Natural ResourcesDraft EIS 3.8-9 September 2003
Canadian Expansion Plans
Expansion of the GTN and Northwest pipelines would not result in additional ability to delivergas to consuming areas in Washington unless pipeline capacity from producing fields in northernBritish Columbia and Alberta to interconnection points at Sumas and Kingsgate is alsoexpanded. At least two options for expanding this capacity are under consideration.
Westcoast Pipeline. Westcoast has identified approximately 300 MDth/day of additions on itsmain line from the British Columbia gas fields to Sumas. These would involve a slightly higherdelivery rate than the current pipeline transportation tariff. In February 2001, Westcoastannounced that shippers had fully renewed all firm service on its Southern mainlinetransportation facilities. This means that all available annual contractible firm service onWestcoast’s mainline north of Compressor Station 2 (with the exception of certain facilities inthe Fort St. John area) and on Westcoast’s Southern mainline from Compressor Station 2 toSumas are fully contracted on a firm basis. Westcoast is now assessing options for expandingcapacity on its Southern mainline to meet growing demand in traditional markets and new gas-fired generation in the Pacific Northwest.
Southern Crossing/IPC Pipeline. BC Gas is planning an extension of its existing SouthernCrossing Pipeline to Sumas. The Southern Crossing Pipeline, completed in November 2000,connects the TransCanada system to the BC Gas distribution system in the southern interior ofBritish Columbia. The current capacity is 250 MDth/day, which is used to displace capacity onWestcoast, which formerly served the southern interior areas.
The project would involve 150 miles of 24-inch pipe and additional compression, and wouldbring up to 350 MDth/day of new capacity to Sumas. The project is expected to cost around $300million (U.S.), resulting in a transportation toll of approximately 34 cents per MMBtu. BC Gas iscurrently in discussion with TransCanada about a matching expansion of that system upstream ofthe interconnection point at Yahk, British Columbia. BC Gas is targeting an in-service date ofNovember 2003.
Natural Gas Supply
In 2001, total demand for natural gas in the U.S was approximately 22.7 trillion cubic feet (tcf).Between 2001 and 2025, annual natural gas demand in the West (including Alaska, westernCanadian and most of the offshore Gulf of Mexico) is projected to increase by 2.1 tcf. The U.S.Energy Information Administration estimates that national demand will increase by an averageannual rate of 1.8% between 2001 and 2025, resulting in an annual consumption of 34.9 tcf by2025 (U.S. Energy Information Administration 2003).
Projected future demand is expected to be largely driven by rapid growth in the demand forelectricity generation. Most new electricity generation capacity is expected to be fueled bynatural gas, and natural gas consumption in the electricity generation sector is projected to growrapidly as electricity consumption increases. Demand by electricity generators is expected toaccount for 33% of total end-use natural gas consumption in 2025 (U.S. Energy InformationAdministration 2003).

BP Cherry Point Cogeneration Project 3.8 Energy and Natural ResourcesDraft EIS 3.8-10 September 2003
The U.S. Energy Information Administration estimates that the lower 48 states and Canada haveapproximately 230 tcf of proven natural gas reserves (OTED 2001b). Total foreign and domesticnatural gas supplies are projected to grow by 11.4 tcf between 2001 and 2025. Domestic naturalgas production is expected to increase by 7.3 tcf, accounting for 64% of the total growth insupply, and net imports are projected to increase by 4.1 tcf, accounting for the remaining 36%.
The largest increase in domestic natural gas production from 2001 through 2025 is projected tocome from the Rocky Mountain region, predominantly from unconventional sources. RockyMountain natural gas production is projected to increase by 2.7 tcf between 2001 and 2025.Another large increase in domestic production is projected to come from Alaska, primarily as aresult of the expected completion of a pipeline from the North Slope. Alaskan natural gasproduction in 2025 is expected to be 2.2 tcf above its 2001 level. Other production regions, bothonshore and offshore, are projected to collectively increase domestic natural gas production by aprojected 2.4 tcf between 2001 and 2025.
Net imports of Canadian natural gas are projected to provide 15% of total U.S. supply in 2025,about the same as in 2001 (U.S. Energy Information Administration 2003). Canada’s natural gasreserves are found primarily in the Western Canada Sedimentary Basin of British Columbia,Alberta, and Saskatchewan. A recent report from the Canadian National Energy Board estimatedthat 271 tcf of this resource is recoverable. At current rates of production in Canada, this isapproximately a 50-year supply (BP 2002, Section 3.8).
Petroleum Products
Several petroleum fuel pipelines are located within the general vicinity of the proposedcogeneration facility; however, the project would not be connected to these pipelines. A numberof petroleum products, including vehicle, equipment gasoline, and diesel fuels, and machinerylubricants are available from numerous commercial outlets in the project vicinity.
Other Nonrenewable Resources
Other nonrenewable resources in the project vicinity are primarily sand and gravel that areextracted from local sources and used locally. Primary consumption of these resources is relatedto construction projects (sand, gravel, and other mineral resources as used in steel, aluminum,concrete, and other building products).
Washington State is ranked seventh in the nation in annual tonnage of sand and gravel extractedand six of the top 100 producers of sand and gravel in the U.S. operate facilities in or adjacent toWhatcom County. The largest gravel mines in Whatcom County account for approximately 68million tons of gravel, including one deposit of 12.8 million tons that is currently not permitted.Total gravel resource reserves in the County equal approximately 105 million tons. Total gravelresources that have been permitted for extraction in the County equal approximately 55.2 milliontons. See Section 3.1 for additional discussion regarding the distribution of sand and gravelresources in Whatcom County (BP 2002, Section 3.8).

BP Cherry Point Cogeneration Project 3.8 Energy and Natural ResourcesDraft EIS 3.8-11 September 2003
Renewable Resources and Conservation
Renewable resources are materials that can be regenerated, such as wood, other fibers, wind, andsunlight. Neither wind nor sunlight is present at this location in sufficient quantifiable amounts tomake them usable for bulk electricity generation, given the current state of technology.
Hybrid poplar trees used for making pulp have been planted at the BP Cherry Point Refinery andapproximately half an acre of these trees would be affected by the project. No specific schedulefor harvesting these trees has been established by the Applicant.
The Applicant has a conservation program in place at the refinery and has conducted both energyand water audits to find ways to conserve these resources. In addition, the Applicant has apollution prevention plan that identifies areas where it can conserve or reduce the amount ofhazardous and other materials it uses at the refinery. The Applicant has committed to a resourceconservation plan similar to that in existence at the refinery and would continue to seek ways tominimize the use of both nonrenewable and renewable resources.
3.8.2 Impacts of the Proposed Action
Construction
Cogeneration Facility, Refinery Interface, and Other Project Components
Construction of the cogeneration facility, systems, and components that interface with therefinery, construction laydown areas, wetland mitigation areas, facility access roads, andindustrial water supply modification at Alcoa Intalco Works would require the use of bothnonrenewable and renewable resources. Required resources would include such materials asgravel, sand, steel, glass, concrete, asphalt, paper products, and wood. The demand for thesematerials would primarily be associated with project construction; large quantities of thesematerials would not be required on an ongoing basis during operation of the proposed project.The approximately half-acre of existing hybrid poplar trees on the project site would be removedas part of cogeneration project site preparation.
Construction would also consume various forms of energy, including electricity, natural gas, andpetroleum products. The use of these resources would continue after the cogeneration facility isoperational. A discussion of the impacts related to the use of energy and materials during theconstruction phase of the project follows below.
Energy Resources
Electricity. During construction, electricity would be used for lighting and heating inconstruction offices, temporary lighting at the facility, and to power various pieces ofconstruction equipment. During non-working hours, electricity consumption would includelighting for security purposes. The estimated peak electrical demand during construction is 2.5million volt amps at 480 volts.

BP Cherry Point Cogeneration Project 3.8 Energy and Natural ResourcesDraft EIS 3.8-12 September 2003
Natural Gas. Natural and propane gas would be consumed in very small quantities during theconstruction process. Typical uses would include the operation of construction equipment andheaters.
Petroleum Products. During construction, diesel fuel and gasoline would be delivered to theproject site by trucks and would be consumed by portable generators, vehicles transportingworkers and materials, and other construction equipment. It is estimated that construction of theproposed project would consume 592,000 gallons of petroleum products.
Other Nonrenewable Resources
Other natural resources that would be used in the construction of the project include importedfill, sand, gravel, concrete (from aggregate, sand, cement quarries, and pits), and steel (from ironore). Table 3.8-7 lists estimated quantities of materials to be used during construction of theproposed project. This list does not include bulk materials included in equipment packages orsystems purchased from equipment suppliers.
Table 3.8-7: Construction Materials and Commodities Consumed
Material Quantity
Imported Fill 126,000 cubic yardsSand 7,500 cubic yards
Gravel 18,150 cubic yardsConcrete 25,200 cubic yards
Steel 1,050 tonsSource: BP 2002, Section 3.8
Acquisition of fill material, sand, and gravel would be the responsibility of the constructioncontractor, who would be required to obtain these materials from an approved source. InWhatcom County, total gravel resources that have been permitted for extraction equalapproximately 55.2 million tons. Based on estimates developed for construction of thecogeneration facility, approximately 27,000 tons of gravel would be required. This amount ofgravel represents a small percentage (less than 0.05%) of the permitted local supply; therefore,the construction of the cogeneration project is not expected to significantly affect localavailability of this resource.
Transmission Facility and Custer/Intalco Transmission Line No. 2
Aluminum, steel, wood, gravel, sand, concrete, and other nonrenewable material would be usedto construct the transmission line’s tower structures and foundations, conductors, insulators, andother transmission line components. Aluminum and steel would be obtained from mills andfabrication facilities. Sand, gravel, and crushed rock would be obtained from approved localsources. Some petroleum-based fuels would be used for construction vehicles and equipment.

BP Cherry Point Cogeneration Project 3.8 Energy and Natural ResourcesDraft EIS 3.8-13 September 2003
Operation
Cogeneration Facility, Refinery Interface, and Other Project Components
Energy Resources
The cogeneration facility design includes high efficiency natural gas combustion turbines, heat-recovery steam generators, a steam turbine generator, and an integrated steam system to supplythe BP Cherry Point Refinery. In addition to generating electrical energy, the cogenerationfacility would generate steam for use at the refinery. The cogeneration facility is projected toexport approximately 4,200 million pounds (MMlb) of steam per year to the refinery based on arate of approximately 510 thousand pounds per hour (kpph) and a pressure of 600 pounds persquare inch (psi). The Applicant anticipates that the cogeneration facility and the refinery wouldexecute an operating agreement that would specify the terms and conditions under which thecogeneration facility would provide the refinery with electrical power and steam to ensure areliable supply of these energy sources for the refinery (Torpey, pers. comm., 2003). See Section2.2 Description of the Proposed Action for an operational overview of the proposed facility.
Cogeneration offers efficiency and environmental benefits because it turns otherwise wasted heatinto a useful energy source. The main benefit of cogeneration is the more efficient use of fossilfuels when used for the generation of electricity and production of steam. The efficiencies arisefrom the use of the latent heat of the steam in the refinery. This heat would otherwise be lost inthe steam turbine condenser. Thus, cogeneration eliminates the need to burn additional fuels forthe sole purpose of providing steam. This normally reduces the overall costs of producingelectricity and heat because less fuel is consumed.
Electricity. The primary purpose of the cogeneration facility would be to generate electricalpower and steam for the refinery. The projected electrical power that would be produced by thefacility’s four generators (three gas turbines and one steam turbine) is shown in Table 3.8-8. Thepower output estimate reflects the maximum annual electrical energy output, and assumes 94%availability of the cogeneration facility to allow for routine scheduled maintenance activities thatwould require taking the facility’s generators off-line temporarily from time to time. The actualoutput may be less depending on market conditions, but in all cases would include provision ofelectrical power to the refinery.
Table 3.8-8: Estimated Maximum Annual Electrical Energy Output
Component Each Train (MWh/yr) Total (Three Trains) (MWh/yr)
Combustion gas turbine gross output (172.5 MW ea.) 1,418,787 4,256,361Steam turbine generator gross output (214 MW ea.) 1,827,213 1,827,213Gross power output 3,246,000 6,083,574Auxiliary power used by cogeneration project 146,325Net power output 5,937,249Source: BP 2002, Section 3.8Notes: Basis - Average ambient conditions at 500F, 44% relative humidity and lower heat value fuel, 94% capacity factor.

BP Cherry Point Cogeneration Project 3.8 Energy and Natural ResourcesDraft EIS 3.8-14 September 2003
The cogeneration facility is projected to consume approximately 146,325 MWh of electricalpower annually during operation at 94% capacity factor and would supply its own electricalenergy from its own generators. For initial startup power or to restart the entire cogenerationunit, power would be back-fed from the Bonneville system via the 230-kV transmission system.The general cogeneration facility components that consume power are shown in Table 3.8-9.
Table 3.8-9: Cogeneration Facility Power Demand
Cogeneration Facility Component Power Demand
Station power (cogeneration facility auxiliary load) 17.8 MWNatural gas compression station 3.5 MWTotal project auxiliaries 21.3 MWSource: BP 2002, Section 3.8
Electrical energy produced in excess of the operating needs of the refinery and the cogenerationfacility (up to approximately 635 MW) would be exported from the site to the Northwest powergrid through the 230-kV transmission system to the Bonneville transmission system. Electricalpower transmitted to the Northwest power grid is sold to public utility districts, city lightdepartments, and rural electric cooperatives from within the region. Regional power customersinclude public agencies, investor-owned utilities, and a number of large industrial concerns.After Northwest customers are served, Bonneville sells any surplus power to utilities outside theregion.
Bonneville has determined that modifications would need to occur to the Bonneville system toaccommodate the cogeneration facility’s interconnection. Two interconnection options have beenidentified.
Option 1 – Remedial Action Scheme. Under Option 1, a RAS would install additionalelectrical equipment within the Custer and Intalco substations, which would automatically reducethe load at Alcoa Intalco Works if thermal operating limits were to be exceeded on theBonneville transmission lines. This option would require an operating agreement among theApplicant, Alcoa Intalco Works, and Bonneville.
Option 2 – New Transmission Line. Under Option 2, a second 230-kV transmission linewould be installed between the Custer substation and the cogeneration facility’s interconnectionto increase transmission capacity along this segment of the Bonneville transmission system.Refer to Chapter 2 for additional discussion of the Bonneville transmission system’sinterconnection options.
Natural Gas. The cogeneration facility would use natural gas as its only source of fuel togenerate electrical power. The source of natural gas for the project would be the Sumas gas-trading hub. Although the Applicant has not made a commitment to purchase natural gas from aparticular provider, it is anticipated that natural gas would be supplied by the Sumas hub via theexisting Ferndale and/or Cascade pipelines that are routed through the refinery in the utilitycorridor immediately east of Blaine Road. A new natural gas pipeline interconnection would be

BP Cherry Point Cogeneration Project 3.8 Energy and Natural ResourcesDraft EIS 3.8-15 September 2003
installed within the refinery at the existing Ferndale pipeline metering station. At this time, theApplicant has not determined who would design, construct, own, or operate the proposedpipeline interconnection.
Natural gas would be delivered to the project at a pressure of approximately 250-300 psig. Thecogeneration facility and some refinery operations require a higher fuel pressure, so a natural gascompressor station would be constructed in the refinery to raise the pressure of the gas toapproximately 500 psig. At this time, it has not been determined who would design, construct,own, or operate the natural gas compressor station.
The annual natural gas consumption for operation of the cogeneration facility would beapproximately 42,457,356 MMBtu, or approximately 43 MDth as shown in Table 3.8-10. Thisprojection reflects 94% availability of the cogeneration facility because of the need for scheduledroutine maintenance shutdowns. The consumption estimates also depend on actual cogenerationfacility output, which may be less depending on market circumstances.
The cogeneration facility's projected annual natural gas consumption would be relatively small incomparison to the region's existing and projected future supply, and would not be expected tosignificantly affect the overall supply for other users in northwest Washington.
The proposed project would, however, have an effect on the transmission capacity of theFerndale pipeline. Although a new compression station would need to be installed in the refineryto provide “end of the line” compression that would increase the capacity of the pipeline toapproximately 130,000 Dth/d, there may be periods when the combined demands of thecogeneration facility and the refinery exceed the pipeline's increased delivery capacity. Duringperiods of peak demand, the Applicant estimates that up to about 40,000 Dth/d of additionalcapacity of may be needed. The Applicant anticipates that the additional natural gas would besupplied by a third party in the area with extra capacity (Torpey, pers. comm., 2002).
The cogeneration facility would not have an alternative or emergency source of fuel if naturalgas were not available. In the unlikely event that gas supplies are curtailed, the cogenerationfacility would go through a series of steps to reduce power and steam production. If the naturalgas supply were completely curtailed, the cogeneration facility and the refinery would not beable to operate.
Table 3.8-10: Estimated Maximum Annual Natural Gas Energy Consumption
MMBtu/year (lower heat value)Natural Gas Energy Consumption by Facility Component
One Train Total (Three Trains)
Combustion gas turbine (1,613.7 MMBtu/hr lower heat value) 13,287,840 39,863,520HRSG duct burners (105 MMBtu/hr lower heat value) 864,612 2,593,836Total fuel (natural gas) 14,152,452 42,457,356Source: BP 2002, Section 3.8Notes: Basis - Average ambient conditions at 500F, 65% relative humidity, and 94% capacity factor.

BP Cherry Point Cogeneration Project 3.8 Energy and Natural ResourcesDraft EIS 3.8-16 September 2003
Petroleum Products. Operation of the cogeneration facility would consume petroleum products,primarily lubricants associated with the operation of equipment and a minor amount of gas anddiesel fuel for vehicles around the facility. A 1,500-kW diesel-powered emergency generatorwould consume diesel fuel in the event of a total grid power failure at the cogeneration facility.In addition, a 265-horsepower (hp) diesel-powered fire suppression water pump would consumediesel fuel in the event of a power failure or low water supply situation. Onsite storage capacitiesfor the emergency generator and fire suppression water pump would be approximately 1,500gallons and 460 gallons, respectively. The use of petroleum products at the cogeneration facilityis not expected to have a significant impact on the availability of petroleum products locally.
Other Nonrenewable Resources
The demand for nonrenewable materials such as sand, gravel, and other minerals used in themanufacture of steel, aluminum, and other building products would primarily be associated withproject construction. Significant quantities of these materials would not be required on anongoing basis during operation of the cogeneration project.
The cogeneration facility would use various chemicals during operation to facilitate desiredchemical reactions, control water quality, and for other facility operational purposes. See Table3.16-5 for an estimate of the chemicals that would be used during operation and maintenance ofthe facility.
Transmission Facility and Custer/Intalco Transmission Line No. 2
The new 230-kV transmission system and the modifications to Custer/Intalco Transmission LineNo. 2 would be permanent additions to the Bonneville transmission network. Over the life of thetransmission line, relatively small quantities of fuel for maintenance vehicles and helicoptersengaged in transmission line surveillance and monitoring would be consumed. Small amounts ofelectricity would be consumed to maintain and operate equipment at the Custer substation. Roadmaintenance activities would require the use of crushed rock, gravel, and sand over the years onan as-needed basis. Periodic replacement of conductor wires, ground wires, fiber-optic cables,insulators, and structural elements may be required over time. The quantities of fuel andmaterials required for operation and maintenance activities would not be sufficient to createimpacts on the availability of fuel and materials locally, regionally, or nationally.
3.8.3 Impacts of No Action
Under the No Action Alternative, the cogeneration facility, refinery interface, 230-kVtransmission facility, and other project components would not be constructed and theconsumption of energy or natural resources associated with construction and operation of theproject would not occur. The Applicant would likely continue to meet the electrical power needsof the refinery with a combination of onsite generation and purchase of electrical power fromother sources. The existing refinery boiler system would continue to be used to meet therefinery's steam demand.

BP Cherry Point Cogeneration Project 3.8 Energy and Natural ResourcesDraft EIS 3.8-17 September 2003
Under this alternative, the cogeneration facility would not generate and transmit electrical powerfor use on the Northwest power grid. The No Action Alternative would not remove the need forpower production; it would potentially transfer the impacts to another site and potentially anothertechnology. There would be no increase in the power supply reliability for the BP Cherry PointRefinery and no contribution to new electrical generation required to meet increasing powerdemands in the Pacific Northwest and adjoining regions.
3.8.4 Secondary and Cumulative Impacts
The project would consume 42,457,356 MMBtu (approximately 43 MDth) of natural gasannually in the production of electrical energy and steam. The proposed project would result inan incremental contribution to the regional demand for natural gas, however, and given existingnatural gas transmission system capacity in the region, would represent an additional incrementof demand on the system.
The project would use 146,325 MWh of electrical power annually in the generation of electricityand steam. However, the overall impacts of electrical energy use would not be significantcompared to the total amount of energy being produced by the proposed facility. Operation of thecogeneration facility would cumulatively add to the availability of energy in the PacificNorthwest by generating up to 635 MW of electrical power for distribution on the Northwestpower grid.
Approximately 176,850 cubic yards of sand, gravel, fill dirt, and concrete, and 1,050 tons of steelwould be used to construct the cogeneration facility, representing an incremental contribution tothe regional consumption of these resources. Total permitted gravel resources in WhatcomCounty are estimated to be approximately 55.2 million tons. The proposed project would use lessthan 0.05% of the total permitted gravel sources in Whatcom County and would not result in asignificant cumulative impact on these resources.
3.8.5 Mitigation Measures
Construction
The Applicant has proposed the following mitigation measure to minimize impacts on naturalresources and energy associated with the construction of the project:
• Conservation of energy and natural resources during construction of the cogeneration facilitycould take place through the implementation and use of industry standard BMPs by theselected contractor. These BMPs may include using energy-efficient lighting, lighting onlycritical areas during non-working hours, encouraging carpooling, scheduling constructioncrews efficiently, minimizing idling of construction equipment, recycling used motor oils andhydraulic fluids, and installing signs to remind construction workers to conserve energy andother resources.

BP Cherry Point Cogeneration Project 3.8 Energy and Natural ResourcesDraft EIS 3.8-18 September 2003
Although not proposed by the Applicant, the following mitigation measure could beimplemented to minimize impacts on natural resources and energy associated with theconstruction of the project:
• Construction could be coordinated with energy and natural resource providers to ensure thatother users in the area would not experience any service interruptions. For example, as partof the proposed project, modifications to the natural gas pipeline that supplies Alcoa IntalcoWorks are proposed at the Ferndale metering station. This work could be coordinated withFerndale pipeline staff and the management of Alcoa Intalco Works to ensure that therequired piping modifications do not disrupt natural gas service to Alcoa Intalco Works orthat any necessary disruptions are minimized.
Operation
The Applicant has identified the following mitigation measures to reduce potential impacts onenergy and natural resources during operation and maintenance of the project:
• Because the cogeneration facility would produce enough steam to meet the operating needsof the refinery, the existing boilers currently providing steam to the refinery would be takenout of service.
• The cogeneration design of the facility would provide for a more efficient use of natural gasby using the residual steam from the cogeneration facility to meet the needs of the refinery,as compared with a combined-cycle plant without cogeneration capability.
3.8.6 Significant Unavoidable Adverse Impacts
The proposed project would consume approximately 42,457,356 MMBtu (approximately 43MDth) of natural gas annually in the production of electricity and steam for the BP Cherry PointRefinery and electrical power for distribution on the Bonneville transmission system. However,the project design features high efficiency natural gas combustion turbines used in acogeneration facility design. This design provides for a more efficient use of fossil fuels in thegeneration of electricity and production of steam.

BP Cherry Point Cogeneration Project 3.9 NoiseDraft EIS 3.9-1 September 2003
3.9 NOISE
This section documents existing noise conditions at 15 locations in the project vicinity andpresents projected noise levels resulting from the operation of the proposed project. For thepurpose of this evaluation, projected noise levels must exceed regulatory residential, commercial,or industrial noise standards to be considered an impact requiring mitigation.
According to an EPA study, average noise levels in an urban environment are not hazardous tohuman hearing (EPA 1974). Urban noise would be more appropriately classified as anannoyance resulting in interference with activity, particularly speech communication (EPA1974). Since most buildings offer effective noise shielding for their occupants, this sectionfocuses on annoyance and interference with outside activities resulting from operational noiseassociated with the proposed project. Noise mitigation resulting from construction activities isnot addressed because the potential impacts are exempt from local and state regulations. Thereare no federal regulations that apply to mitigation of construction noise.
3.9.1 Noise Background and Characteristics
Sound is created when objects vibrate, resulting in a minute variation in surrounding atmosphericpressure called sound pressure. The human response to sound depends on the magnitude of asound as a function of its frequency and time pattern (EPA 1974). Magnitude describes thephysical sound in the air. The range of magnitude from the faintest to the loudest sound humanscan hear is so large that sound pressure is expressed on a logarithmic scale in units calleddecibels (dB). Magnitudes of typical noise levels are presented in Table 3.9-1.
Table 3.9-1: Sound Pressure Levels of Representative Noises
Source Decibels Description
Large rocket engine (nearby) 180Jet takeoff (nearby) 150Pneumatic riveter 130Jet takeoff (200 feet) 120 Pain thresholdConstruction noise (10 feet) 110Subway train 100Heavy truck (50 feet) and Niagara Falls 90 Constant exposure endangers hearingAverage factory 80Busy traffic 70Normal conversation (3 feet) 60Quiet office 50 QuietLibrary 40Soft whisper (16 feet) 30 Very quietRustling leaves 20Normal breathing 10 Barely audibleHearing threshold 0
Source: Tipler 1976
BP Cherry Point Cogeneration Project 3.9 NoiseDraft EIS 3.9-2 September 2003
Humans respond to a sound's frequency or pitch. Environmental noise is composed of manyfrequencies, each occurring simultaneously at its own sound pressure level. As measured by anelectronic sound level meter, frequency weighting combines the overall sound frequency intoone sound level. The commonly used frequency weighting for environmental noise is A-weighting, or dBA, which approximates how an average person hears sounds. C-weighting, ordBC, is a measure of the lowest frequencies of sound and vibration. Low frequency noise isusually described as humming or engine-like sounds or a feeling of pressure or vibration.
Loudness, compared to physical sound measurement, refers to how people subjectively judge asound and varies from person to person. A listener often judges an increase of 10 dBA to betwice as loud. In general, an increase in noise from 1 to 3 dBA will not be noticeable, 3 to 5 dBAwill be noticeable to most people, 5 to 7 dBA will be easily heard, and 7 to 10 dBA will bejudged as substantial.
Because of the logarithmic decibel scale, a doubling of the number of noise sources, such astraffic volume, increases noise levels by 3 dBA. A tenfold increase in the number of noisesources will add 10 dBA. Thus, a noise source emitting a noise level of 60 dBA combined withanother noise source of 60 dBA results in a combined noise level of 63 dBA, not 120 dBA.
Audible noise levels depend on a variety of factors including, but not limited to, topography,vegetation, distance from the source to receptor, and whether the source of the noise is stationaryor moving. Noise levels decrease with distance from the noise source. Traffic noise levels willdecrease 3 dBA over hard ground (concrete or pavement) or 4.5 dBA over soft ground (grass) forevery doubling of distance between the source and the receptor. For a point source such asstationary construction equipment, noise levels will decrease between 6 and 7.5 dBA for everydoubling of distance from the noise source.
A descriptor for audible noise is the equivalent sound level (Leq). Leq is defined as the constantlevel that, over a given period of time, transmits to the receptor the same amount of acousticalenergy as the actual time-varying sound. For example, two sounds, one of which contains twiceas much energy but lasts only half as long, have the same Leq noise levels. The Leq can beconsidered a measure of the average noise level during a specified period of time. It is a measureof total noise, a summation of all sounds during a time period. As such, it places more emphasison occasional high noise levels than accompanying general background noise levels.
Noise Regulations
Applicable agency noise regulations and guidelines provide a basis for defining and evaluatingnoise impacts and mitigation for the proposed project. Noise regulations and guidelines specifylimits of noise levels, above which noise is considered an impact. Maximum permissible noiselevels apply to a single source of noise and depend on the zoning district of both the source ofnoise and the receptor property.
BP Cherry Point Cogeneration Project 3.9 NoiseDraft EIS 3.9-3 September 2003
Federal Noise Regulations
Other than the Occupational Safety and Health Administration (OSHA) regulations, no otherfederal noise regulations would govern sound at the proposed project.
Washington State Department of Ecology Noise Standards
Chapter 173-60 of the WAC specifies maximum environmental noise levels. The limits are basedon the noise source and the receptor. The noise level designations shown below are themaximum levels permitted from an industrial facility:
Residential Day (7 a.m. to 10 p.m.)/Night (10 p.m. to 7 a.m.): 60/50 dBA• Commercial: 65 dBA• Industrial: 70 dBA
Maximum noise levels outlined above are allowed a 5 dBA increase for 15 minutes in one hour,a 10 dBA increase for 5 minutes in one hour, or a 15 dBA increase for 1.5 minutes in one hour.
Noise from temporary construction activities is exempt from all limits, except for those thatapply to noise received at residential properties at night (10 p.m. to 7 a.m.) (WAC 173-60).
Whatcom County Noise Ordinance
The Whatcom County Zoning Code (Title 20) includes general prohibitions against noise as anuisance or annoyance. It also defines some acts that are declared unnecessary noises, althoughnone apply to the normal operation of a power generation facility. There are no numerical noiselimits in the Whatcom County Code, and all references are to the state code. Therefore, the limitsin WAC 173-60 were used to evaluate the estimated noise effects resulting from the operation ofthe proposed project.
Impact Criteria for Low Frequency Noise
Although the state of Washington regulates low frequency noise through noise regulations usingthe A-weighted decibel scale, the American National Standards Institute (ANSI) presentsrecommendations to provide protection from low frequency noise disturbance in Gas TurbineInstallation Sound Emissions (ANSI 1989). ANSI recommends limiting noise levels atresidences near new gas turbine facilities to 75 to 80 dBC.
3.9.2 Existing Conditions
Golder Associates, Inc. (BP 2002) performed a noise monitoring study to assess the existingnoise levels at 15 locations within the project vicinity. Noise levels were monitored on May 31and June 7, 2001. The noise monitoring program was performed at the property boundaries ofthe refinery, at the proposed cogeneration facility site, and at the nearest residences located from1 to 2 miles away. Monitoring also was performed at the entrance to Birch Bay State Park. Thelocations are described in Table 3.9-2 and shown in Figure 3.9-1.

BP Cherry Point Cogeneration Project 3.9 NoiseDraft EIS 3.9-4 September 2003
Table 3.9-2: Noise Monitoring Locations
LocationNumber
Type ofReceiver
Description
1 I On Grandview Road in front of the Chemco Plant, 0.69 mile northeast of the proposedproject site
2 R Northwest corner of the four-way stop at Aldergrove Road and Kickerville Roadintersection, 1.26 miles southeast of the project site
3 I Aldergrove Road at the entrance to the PraxAir facility, 0.82 mile south of the proposedproject site
4 I Southeast corner of two-way stop at the Aldergrove Road and Jackson Road intersection,1.37 miles southwest of proposed project site
5 I At Cascade Natural Gas regulator station on the west side of Jackson Road, 1.11 milessouthwest of proposed project site. (The regulator was not operating.)
6 I Southeast corner of four-way stop at the Grandview Road and Jackson Road intersection,1.10 miles west of proposed project site
7 R West side of Jackson Road at the Birch Bay Community Church, 1.22 miles northwest ofproposed project site
8 R Southwest corner of the three-way stop at Grandview Road at Point Whitehorn, 2.08 mileswest of the proposed project site
9 R Northwest corner of Jackson Road and Helweg, 1.44 miles northwest of the proposedproject site
10 R In front of the residence at 4570 Bay Road, 1.20 miles north of the proposed project site11 R Northwest corner of the four-way stop at Kickerville Road and Bay Road, 1.48 miles
northeast of the proposed project site12 I Intersection of Grandview Road and Blaine Road on the south side of the street, 300 feet
north of the proposed project site13 I West side of Blaine Road north of Grandview Road at the turnout, 0.51 mile north of the
proposed project site14 R Northwest corner of Kickerville Road and Brown Road, 1 mile east-southeast of the
proposed project site near the residence closest to the site15 R Birch Bay State Park near the park entrance, 1.92 miles northwest of the proposed project
siteProject Site Open field on Applicant property south of Grandview and east of the refinery.
I Industrial ReceiverR Residential Receiver
For the Golder study, locations 1 through 15 were monitored for two periods of 15 minutes, oncein the hours defined as day (7 a.m. through 10 p.m.) and once in the hours defined as night (10p.m. through 7 a.m.). The project site location described in the table above was monitored for aperiod of 24 hours. No unusual natural environmental circumstances were present such as heavywind or rain that would have influenced the field measurements.
In a second, more recent study, Hessler Associates (2003) conducted a noise monitoring programthat included more extensive background sound level measurements at four locationsrepresentative of the nearest sensitive receptors in the Golder study (Receptors 7, 10, 11, and 14).The same environmental conditions were measured for each study, however the time duration forthe measurements spanned three nights and two days. These measurements began on April 8,2003 and concluded on April 11, 2003.

BP Cherry Point Cogeneration Project 3.9 NoiseDraft EIS 3.9-5 September 2003
Figure 3.9-1: Noise Monitoring Locations
BP Cherry Point Cogeneration Project 3.9 NoiseDraft EIS 3.9-6 September 2003
Two types of ambient noise were monitored during data collection. The first type of noise issteady noise or background noise. Background noise in the project vicinity includes the steadysound of wind, creeks, wave action, and nearby industrial sources. The second type of noisemonitored during data collection is transient noise, with sources that include vehicular traffic,wind gusts, airplanes, animals, trains, and other human-caused disturbances.
The results of the noise measurements indicated that the existing noise levels, which are made upof background sound levels including transient noise, in the areas surrounding the proposedproject range from a low of 47 dBA to a high of 68 dBA during the day (7 a.m. to 10 p.m.) andfrom a low of 39 dBA to a maximum of 65 dBA during the night (10 p.m. to 7 a.m.). Differencesin existing noise levels depended mainly on the proximity of transient noise sources. The averagecontribution of transient noise is 4 to 12 dBA. The results of existing conditions for day andnight periods are presented in Table 3.9-5.
To avoid private property access issues, noise monitoring was performed on public propertyalong public roads near transient noise generated by vehicular traffic. The results of this noisemonitoring indicate that the background levels are low, and are significantly influenced bytransient sources, especially vehicular traffic. If sampling had been performed on the privateproperty farther away from the road, at particular homes for example, the influence of passingvehicles would be reduced and a stronger assessment of existing backgrounds conditions couldbe established.
As shown in Table 3.9-5, some of the residential receptors’ existing noise levels are shown toexceed the regulatory limit outlined in the WAC 170-60. Without knowing the distance of theproperty from the measurement location, it is difficult to determine the exact noise levels at theproperty. However, as stated above, transient noise from passing traffic contributed significantlyto the overall Leq level reported in the table.
3.9.3 Impacts of the Proposed Action
Construction
Construction activities of the proposed project are expected to be typical of other industrial plantconstruction projects. Construction activities include mobilization, site preparation, utilitydevelopment, heavy equipment movement, clearing/grading of roadways and right-of-ways, andinstallation of the new facility components. General construction equipment to be used includesbut is not limited to: heavy, medium, and light equipment such as excavators; roller compactors;front-end loaders; bulldozers; graders; backhoes; dump trucks; water trucks; concrete trucks;pump trucks; utility trucks; cranes; pile drivers; man lifts; forklifts; and lube, oil, and fuel trucks.The levels of noise produced during these activities are anticipated to vary depending on theconstruction phase. Table 3.9-3 outlines typical construction noise levels at a distance of 50 feet.
In addition to noise produced from onsite construction equipment, traffic volumes wouldincrease as construction employees commute to and from work at the site. Additional transientnoise would occur as a result of increased volumes of delivery and service vehicles (includingtrucks of various sizes) doing business at the site. Truck and delivery traffic is further discussed

BP Cherry Point Cogeneration Project 3.9 NoiseDraft EIS 3.9-7 September 2003
in Section 3.15, Traffic and Transportation. The construction traffic is temporary and expected tooccur during the daytime hours of 7 a.m. and 6 p.m. Under these conditions, the transientconstruction traffic is exempt from state regulations.
Table 3.9-3: Construction Equipment Noise Ranges
Equipment Examples Noise Level (dBA) at 50 feet
Earth Moving Compactors, loaders, backhoes, tractors, graders, pavers 73-96Materials Handling Concrete mixers and pumps, cranes, derricks 74-88Stationary Pumps, compressors, generators 69-87Hauling Trucks 83-94Impact Equipment Pile drivers 95-106Impact Tools Jackhammers, rock drills, pneumatic wrenches 81-98Source: EPA 1971
Noise associated with construction activities is highly variable and is exempt from WashingtonState noise standards, as stated in WAC 173-60-050, with the exception of residential locationsbetween the hours of 10 p.m. and 7 a.m.
Because construction noise is exempt from Washington State standards, no construction-phasenoise modeling was conducted. Other impacts from construction noise may include effects onwildlife. Disturbances caused by construction on the project site may affect wildlife in adjacenthabitats by disrupting feeding and nesting activities. Habitats on and surrounding the site may beused for breeding by migrant and resident songbirds. Increased noise levels created by operationof heavy machinery could cause birds to abandon their nests and may temporarily displacewildlife during construction. Once construction activities are complete, wildlife may resume useof the area. Construction and operational impacts on wildlife are addressed in Section 3.7 of thisEIS.
Operation
Both the Golder and Hessler noise studies predicted operational noise levels at the chosen 15receptors. Each study estimated noise levels at the selected offsite receptors, based on theanticipated noise levels produced by the proposed cogeneration facility without inclusion of thebackground or transient sounds. The baseline analysis assumed standard power-generatingequipment would be used throughout the facility without any special or unusual improvementsspecifically intended to reduce far-field noise. This calculation indicated that the noise levels ofthe proposed project would be below the regulatory daytime and nighttime allowable levels asshown in Table 3.9-4.
After initial modeling, the Hessler study found that a moderate reduction in HRSG stack noisewould significantly lower the overall noise levels facility-wide. Consequently, the Applicantrecommended the addition of stack silencers with a nominal reduction of 10 dBA in stack sound;it was accepted and incorporated into the project design. With this improvement, total noiselevels at some of the more critical locations will be reduced by 3 to 4 dBA. The stack silencers

BP Cherry Point Cogeneration Project 3.9 NoiseDraft EIS 3.9-8 September 2003
also carry an additional benefit that stack noise is less likely to adversely affect levels atreceptors situated downwind from the facility. The high elevation of the stacks makes their noisemore susceptible to wind effects.
Each study assumed the primary noise-generating equipment would consist of three CTGs, oneSTG, three HRSGs, and an air/water cooling tower. Modeling assumed that the CTGs and STGwould be housed within standard, acoustically treated enclosures (but not within buildings). TheGolder study did not assume any stack silencers on the HRSGs, however the Hessler study didincorporate this new design feature into the final model. Besides the main components, otherequipment that could generate potentially significant noise levels, such as boiler feedwaterpumps, circulating water pumps, main transformers, and various steam lines, were included inthe model. To ensure the modeling results are conservative, the noise impact modeling predictedthe maximum noise levels to be produced by the proposed project. To achieve these conditions,no attenuation factors, such as vegetation or topography, were included in the modeling forexisting or future noise results.
Table 3.9-4 presents the projected noise levels of the proposed project at the 15 receptors asoriginally modeled by Golder and then by Hessler following the design inclusion of stacksilencers.
Table 3.9-4: Estimated Noise Levels without Background Ambient Sound Levels (Leq
dBA)
Receptor LocationGolder’s Predicted
Noise LevelHessler’s Predicted Noise Level
(with stack silencers)Most Stringent State
Regulatory Limit (nighttime)
1 (I) 52 47 702 (R) 45 41 503 (I) 50 46 704 (I) 43 39 705 (I) 46 40 706 (I) 46 41 707 (R) 44 40 508 (R) 38 34 509 (R) 42 38 50
10 (R) 45 40 5011 (R) 42 40 5012 (I) 65 60 7013 (I) 54 48 7014 (R) 48 44 5015 (R) 39 35 50
I=industrial, R=residential
As shown above, all of the modeled noise levels produced solely by the cogeneration facilitywould be below the state regulatory thresholds. Because stack silencers were added to the projectdesign, Hessler’s modeled results were used to calculate the noise levels at the 15 receptorlocations to include the background noise conditions combined with the noise produced from thecogeneration facility. Table 3.9-5 outlines the existing background conditions measured by

BP Cherry Point Cogeneration Project 3.9 NoiseDraft EIS 3.9-9 September 2003
Golder, the estimated combined noise levels as predicted by Hessler (existing conditions plus thepredicted cogeneration noise levels with stack silencers), and the regulatory limits for daytimeand nighttime.
Table 3.9-5: Estimated Noise Levels Combining Modeled and Background Sources (Leq
dBA)
Daytime Noise Level Nighttime Noise LevelReceptor Existing
ConditionExisting
Conditionplus
ModeledLevel with
StackSilencers
RegulatoryLimit
Increaseabove
ExistingCondition
ExistingCondition
ExistingCondition
plusModeled
Level withStack
Silencers
RegulatoryLimit
Increaseabove
ExistingCondition
1 (I) 68 68 70 0 65 65 70 02 (R) 58 59 60 1 63 63 50 03 (I) 61 61 70 0 60 61 70 14 (I) 50 51 70 1 52 53 70 15 (I) 63 63 70 0 58 58 70 06 (I) 61 61 70 0 59 59 70 07 (R) 63 63 60 0 56 56 50 08 (R) 55 55 60 0 52 52 50 09 (R) 57 57 60 0 50 50 50 010 (R) 62 62 60 0 54 54 50 011 (R) 61 61 60 0 53 53 50 012 (I) 64 65 70 1 61 63 70 213 (I) 62 62 70 0 57 57 70 014 (R) 60 60 60 0 51 52 50 115 (R) 47 48 60 1 39 40 50 1
I=industrial, R=residential
The modeling results presented in Table 3.9-5 indicate that none of the 15 receptors wouldexperience a perceptible increase (above 3 dBA) in noise during the daytime or evening. Onlyone receptor would experience a noise increase over 1 dBA. Receptor 12 is estimated to increase2 dBA at night over existing noise conditions. This location is located 0.1 mile north of thecogeneration project on industrially zoned BP property across from Grandview Road. A 2 dBAincrease is not expected to be perceivable and would not exceed state regulatory limits.
The changes in noise levels would also not be perceptible to residences situated farther away inthe communities of Birch Bay and Cottonwood.
Low Frequency Noise Results
Localized disturbance from low frequency noise has sometimes been associated with simple-cycle combustion turbine installations. Combustion turbines are capable of producing high levelsof low frequency (40 Hz or less) noise when the exhaust gas exits the equipment. In simple-cycle

BP Cherry Point Cogeneration Project 3.9 NoiseDraft EIS 3.9-10 September 2003
configurations, the exhaust gas passes through an exhaust silencer that is effective at reducingmid- and high frequency noise but is less effective at reducing low frequency noise emissions.
Low frequency noise, however, has not typically been a reported concern when combustionturbines are placed in combined-cycle configurations. In combined-cycle configurations, theexhaust gas passes through the HRSG equipment, which is effective at reducing the lowfrequency combustion noise associated with turbine operation. The cooling of the exhaust gassesin combined-cycle facilities also reduced the low frequency noise emissions.
As with the original Golder modeling study, the newer Hessler modeling also evaluated lowfrequency noise levels at the receptors. In general, the new modeling results indicate that lowfrequency noise from the cogeneration facility (C-weighted sound levels and the lower frequencylevels) would be similar to or less than the levels reported by Golder for the original projectconfiguration. Consequently, both studies conclude that low frequency noise would not reachperceptibility thresholds at any of the residential receptors. The normal threshold ofperceptibility for low frequency noise and vibration is 75 to 78 dBC (ANSI 1989). The ANSIrecommends C-weighted plant levels should be significantly below 75 dBC at residentialreceptors.
Table 3.9-6 shows the lowest frequency bands and the overall C-weighted sound level at eachreceptor location. All receptors, with the exception of the industrial property at Receptor 12, arepredicted to experience low frequency noise well below the 75 dBC residential recommendation.
Table 3.9-6: Summary of Low Frequency Receptor Levels due to the Cogeneration BaseLoad Plant Operation
Receptor Total Level (dBC)
1 (I) 63.82 (R) 59.43 (I) 62.84 (I) 58.45 (I) 58.76 (I) 58.97 (R) 58.78 (R) 54.39 (R) 57.310 (R) 58.611 (R) 58.212 (I) 73.313 (I) 64.814 (R) 61.015 (R) 55.4
I=industrial, R=residential
Other low frequency noise to be considered is “corona” discharge. When water droplets stand onthe transmission line’s conductor surface, small-radius irregularities increase the electricalstresses that can lead to audible, low frequency humming and crackling. Corona discharge is

BP Cherry Point Cogeneration Project 3.9 NoiseDraft EIS 3.9-11 September 2003
often weather-dependent. Because the new 230-kV transmission system would be located morethan 0.5 mile from the nearest residence and a new transmission line in the Custer/Intalcotransmission corridor (if Option 2 is selected) would be within the existing 125-foot utilityROW, disruptive corona effects on local residences are not anticipated.
3.9.4 Impacts of No Action
Under the No Action Alternative, the proposed project would not be constructed and noise wouldremain at levels documented in the existing conditions section.
3.9.5 Secondary and Cumulative Impacts
Georgia Strait Crossing Pipeline LP is proposing to construct a pipeline and compressor stationto deliver gas from Sumas to Vancouver Island. The compressor station is proposed at CherryPoint west of the refinery. The noise study for the compressor station project evaluated expectednoise levels at the north, south, east, and west property boundaries of the compressor station(Williams Gas Pipeline West 2001), where the maximum noise level would occur. The levelsranged between 46 and 54 dBA. The nearest receptor to the Georgia Strait Pipeline project isReceptor 5, the industrial power plant. The expected 54 dBA from the north boundary of thecompressor station falls below the predicted 63 dBA of the cogeneration facility. Given theadditional distance from the northern property boundary of the Georgia Strait Crossingcompressor station and the location of the power plant, cumulative operation noise impacts arenot expected to occur.
Impacts on various receptors identified in this study may occur during the construction phase ofthe Georgia Strait Crossing project. These impacts may occur at receptors located near theproposed compressor station or near where the pipeline is placed in the ground. As with theproposed project, construction noise is considered temporary and is exempt from WashingtonState noise standards. However, site-specific construction plans for areas where there areresidences or structures within 50 feet of the construction right-of-way would address noiseminimization.
3.9.6 Mitigation Measures
Construction
The Golder noise study indicated that construction noise could be reduced by providing mufflerson engines, using quieter equipment or construction practices, and turning off equipment whennot in use. To reduce construction noise at nearby receptors, the construction industry’s bestmanagement practices would be incorporated into construction plans and contractorspecifications. The proposed project would include the following noise mitigation measuresduring construction:
• Limiting noisier construction activities to between 7 a.m. and 10 p.m. would reduceconstruction noise during sensitive nighttime hours. If construction were to occur outside thisperiod, measures to minimize noise would be implemented to the maximum extent possible.

BP Cherry Point Cogeneration Project 3.9 NoiseDraft EIS 3.9-12 September 2003
• Equipping engines of construction equipment with adequate mufflers, intake silencers, orengine enclosures would reduce their noise by 5 to 10 dBA (EPA 1971).
• Specifying the quietest equipment available would reduce noise by 5 to 10 dBA.• Turning off construction equipment when not in use for prolonged periods would eliminate
noise from the equipment during those periods.• Requiring contractors to maintain all equipment and train their equipment operators would
reduce noise levels and increase efficiency of operation.• Locating stationary equipment away from receiving properties would decrease noise from
that equipment in relation to the increased distance.
Operation
Although no noise impacts requiring mitigation would result from operation of the proposedcogeneration facility, the design and siting of the facility have integrated many noise mitigationmeasures.
When considering the location and orientation of the proposed project, many factors includingnoise were evaluated. The project site was set back approximately 340 feet from the centerline ofthe nearest public road, Grandview Road, and this resulted in a reduction of noise levels at theroad and beyond. The configuration of the project equipment, which includes the three gasturbine generators perpendicular to Grandview Road, is an orientation that allows for optimalsound reduction through physical barriers. The equipment noise from the two most southerngenerators would be blocked by the presence of the generator closest to Grandview Road.
The three gas turbine generators and the steam turbine generators would be located withinenclosures, which would attenuate sound. The HRSG exhaust stacks have also been designedwith silencers to provide additional noise mitigation. This operation mitigation is demonstratedin the modeling completed by Hessler and outlined in Table 3.9-4.
3.9.7 Significant Unavoidable Adverse Impacts
None of the receptors in the modeling program would experience significant increases in noiselevels. Implementing BMPs during the construction of the project will reduce the temporaryconstruction noise impacts at nearby receptors. Thus, no significant unavoidable adverse impactsare associated with construction or operation of the project.

BP Cherry Point Cogeneration Project 3.10 Land UseDraft EIS 3.10-1 September 2003
3.10 LAND USE
This section discusses land use and the consistency of the proposal with adopted land use plansand policies for the project site and surrounding area. The analysis in this section is based oninformation provided by the Applicant in the ASC (BP 2002). Where additional information hasbeen used to evaluate the potential impacts associated with the proposal, that information hasbeen referenced.
3.10.1 Existing Conditions
The project site consists of approximately 195 acres of Applicant-owned property in the westernportion of unincorporated Whatcom County, approximately 2 miles inland from Birch Bay alongthe Strait of Georgia. In addition, the portion of the Custer/Intalco Transmission Line No. 2 thatwould be affected by the project is located within approximately 70 acres of existing Bonnevilletransmission system right-of-way.
A number of U.S. and Canadian jurisdictions are located within 25 miles of the project site. Alist of these, along with their distances from the project site and recent population estimates, isprovided in Table 3.10-1.
Table 3.10-1: Population Estimates and Distance to Project Site
Location Population (2000 estimate) Distance (direct)
U.S. JurisdictionsBritish Columbia/Washington State Boundary NA 8 milesLummi Indian Reservation 4,193 5 milesNooksack Indian Reservation 740 (1999 est.) 23 milesSkagit County 102,979 19 milesSan Juan County 14,077 9 milesWhatcom County 166,814 N/ABellingham, Wash. 67,171 15 milesBlaine, Wash. 3,770 7 milesEverson, Wash. 2,035 17 milesFerndale, Wash. 8,758 6 milesLynden, Wash. 9,020 12 milesNooksack, Wash. 851 18 milesSumas, Wash. 960 22 milesCanadian JurisdictionsAbbotsford, BC 115,126 21 milesDelta, BC 101,433 21 milesLangley, BC 24,287 15 milesSurrey, BC 340,094 21 milesWhite Rock, BC 17,371 11 milesSource: BP 2002

BP Cherry Point Cogeneration Project 3.10 Land UseDraft EIS 3.10-2 September 2003
Existing Land Use
Whatcom County
The Whatcom County land base consists of 1,377,645 acres of land, the majority of which(874,045 acres) is managed as federal national forest or national park lands by the U.S. ForestService and National Park Service, respectively. Of the 475,044 acres of non-federal lands in theunincorporated portion of the county, 79% (374,730 acres) is used for forestry and agriculture.An additional 9% (43,070 acres) is used for residential, and approximately 7% (32,915 acres) isvacant/undeveloped. The 3,060 acres of industrial uses in Whatcom County account for less than1% of the land within the unincorporated county (Whatcom County 1997, as amended).
Project Site and Surrounding Area
Land uses in the project vicinity include a variety of recreational, industrial, commercial,residential, and agricultural uses. Low-density residential uses occur to the north and east of thesite, and west of the BP Cherry Point Refinery at Point Whitehorn. These residential uses areprimarily single-family houses on large lots. Northwest of the refinery, seasonal residentialproperties occur in the bayfront community of Birch Bay. Approximately 2 miles northwest ofthe refinery, the 194-acre Birch Bay State Park extends along the shoreline of the Strait ofGeorgia. The Birch Bay Wastewater Treatment Plant also is located in this area.
South of the proposed cogeneration facility site, the Praxair liquid carbon dioxide productionplant is located on Applicant-owned land near the intersection of Blaine Road and AldergroveRoad. Farther south, other existing industrial uses include the Conoco-Phillips Refinery and theAlcoa Intalco Works primary aluminum smelter. Approximately 2 miles southeast of the projectsite is Lake Terrell and the publicly managed 1,500-acre Lake Terrell Wildlife Area, whichprovides for a variety of active and passive recreational uses including hunting, fishing, andwildlife viewing. An operating farm at the Lake Terrell Wildlife Area uses between 80 and 100acres annually to produce winter food for waterfowl and upland game. Just over 4 miles to thesouth is the Lummi Reservation.
To the east, a Burlington Northern Santa Fe (BNSF) rail line runs north-south approximately 0.5miles east of the cogeneration facility site. An existing 230-kV Bonneville transmission corridoris located approximately 0.8 mile east of the site and connects Bonneville’s Custer substationwith the substation at the Alcoa Intalco Works. The Chemco wood treatment plant is also locatedin this area. Applicant land ownership extends to the east across the BNSF railroad track to theedge of the Bonneville transmission corridor. The City of Ferndale is approximately 5 miles eastof the project site. Land uses between the Bonneville transmission line and the City of Ferndalegenerally include rural residential, agriculture, and livestock farming.
West of the BP Cherry Point Refinery, Puget Sound Energy’s Whitehorn power generation plantis located west of Jackson Road. Approximately 3 miles west of the cogeneration facility site isthe Strait of Georgia, which supports multiple uses including recreation, navigation, andcommercial fishing industries. The land between the refinery and Strait of Georgia ispredominantly agricultural.

BP Cherry Point Cogeneration Project 3.10 Land UseDraft EIS 3.10-3 September 2003
Cogeneration Facility
The proposed cogeneration facility site consists of approximately 33 acres of land previouslyused for agriculture but has not been cultivated for several decades. A stand of hybrid poplartrees, planted for production of pulp for paper manufacturing, separates the proposedcogeneration facility from Grandview Road. No active management of the hybrid poplar treeshas occurred since planting was stopped in 1991 (BP 2002, Section 3.10).
Refinery Interface
Immediately west of the cogeneration facility site is the BP Cherry Point Refinery. The refinery,which began operation in 1971, covers an area of approximately 450 acres and is bounded byGrandview Road and Aldergrove Road to the north and south, respectively, and Blaine Road andJackson Road to the east and west, respectively.
Access Road 2 would be located on undeveloped Applicant-owned property adjacent to the BPCherry Point Refinery, and would intersect with Blaine Road.
Transmission System
The proposed cogeneration facility/Bonneville transmission system corridor would be 150 feetwide and extend for approximately 0.8 mile, connecting the 230-kV switchyard at the southeastcorner of the cogeneration facility with Bonneville’s 230-kV Custer/Intalco Transmission LineNo. 2. This corridor consists primarily of undeveloped lands used historically for agriculture.The north-south running BNSF railroad tracks would be crossed by the proposed transmissionline at the east end of the corridor.
Custer/Intalco Transmission Line No. 2
Custer/Intalco Transmission Line No. 2 is located within an existing Bonneville utility easementfrom the transmission facility interconnection to the Custer substation. Existing land uses alongthe approximately 5-mile corridor are predominantly agricultural, agricultural/open space, andrural residential. The transmission line crosses the following rural roads: Grandview Road,Kickerville Road, Ham Road, Valley View Road, Elk Road, Olson Road, Fox Road, and VistaDrive.
Other Project Components
North of Grandview Road, the area proposed for compensatory wetland mitigation sites CMA 1and CMA 2 encompasses approximately 110 acres and consists predominantly of undevelopedgrasslands once cultivated for hay. A portion of this area is now leased to local farmers forgrazing cattle.

BP Cherry Point Cogeneration Project 3.10 Land UseDraft EIS 3.10-4 September 2003
Immediately northeast and south of the cogeneration facility site, the approximately 5-acreLaydown Area 4 and the site for extension of Access Road 3 consist of vacant land previouslyused for agriculture.
Freshwater supply piping modifications to allow for the use of recycled industrial water when theAlcoa Intalco Works facility is operating would be located within the existing industrialenvironment of the Alcoa Intalco Works facility.
Tribal Lands
Other land uses near the project site include the Lummi Reservation located in the northwestcorner of Washington State approximately 12 miles south of the U.S.-Canada border and 5 milesfrom the project site. The Lummi Reservation occupies land on two peninsulas and consists ofapproximately 12,000 acres of mixed-use lands used for commercial, residential, farming, andmarine activities. The reservation also includes approximately 8,000 acres of tidelands.Associated resources include forestry and agricultural land, salmon and shellfish hatcheries, aseafood processing plant, a convenience store, a casino, and a marina.
Existing Zoning
Existing zoning for the project site and surrounding area is shown in Figure 3.10-1.
Cogeneration Facility
The cogeneration facility site is zoned Heavy Impact Industrial (HII) and is entirely containedwithin the Cherry Point Major Industrial UGA/Port Industrial as defined within the WhatcomCounty Comprehensive Plan (Whatcom County 1997). This designated area comprisesapproximately 6,500 acres, of which approximately 2,500 acres are currently used for heavyimpact industry. Land to the east of the proposed site is zoned HII for approximately 0.25 mile,and Rural (R5A) for an additional 2 miles east of Kickerville Road. Land south of thecogeneration facility site is zoned HII for approximately 4 miles extending to the Strait ofGeorgia. To the west, HII zoning extends for approximately 1 mile to the Birch Bayunincorporated residential/recreational UGA and the residential area at Point Whitehorn, both ofwhich are zoned Urban Residential 4 (UR4). North of the proposed site, zoning is Rural andRural Residential for approximately 0.25 mile (EFSEC 2001; BP 2002, Section 3.10).
Refinery Interface
All project components that interface with the refinery would be constructed within the refinery.Land within the refinery is zoned HII and is entirely contained within the Cherry Point MajorIndustrial UGA/Port Industrial area.

BP Cherry Point Cogeneration Project 3.10 Land UseDraft EIS 3.10-5 September 2003
Figure 3.10-1

BP Cherry Point Cogeneration Project 3.10 Land UseDraft EIS 3.10-6 September 2003
Transmission System
The corridor for the proposed new transmission line between the cogeneration facility andBonneville’s Custer/Intalco Transmission Line No. 2 is zoned HII and is entirely containedwithin the Cherry Point Major Industrial UGA/Port Industrial area.
Custer/Intalco Transmission Line No. 2
The existing Custer/Intalco Transmission Line No. 2 corridor between the interconnection withthe proposed new transmission line and Bonneville's Custer substation traverses three differentzoning districts. The segment of the corridor that runs north-south between the interconnectionwith the new transmission line and Grandview Road is zoned HII. The short segment of thecorridor that extends north of Grandview Road is zoned Light Impact Industrial (LII). These twosegments of the existing transmission line corridor are located within the Cherry Point MajorIndustrial UGA/Port Industrial area. The remaining portion of this corridor that extends east ofKickerville Road and north of and parallel to Grandview Road before connecting into the Custersubstation is zoned R5A. The portion of this segment between Kickerville Road and Vista Roadis designated Rural in the Whatcom County Comprehensive Plan. The portion of this segmentbetween Vista Road and the Custer substation is located within the Ferndale UGA.
Other Project Components
The proposed site of wetland mitigation areas CMA 1 and CMA 2 is zoned LII and is entirelycontained within the Cherry Point Major Industrial UGA/Port Industrial area.
The proposed sites of Laydown Area 4 and Access Road 3 are zoned Heavy Impact Industrial,and are entirely contained within the Cherry Point Major Industrial UGA/Port Industrial area.
The site of industrial water supply piping modifications at the Alcoa Intalco Works facility iszoned HII and is entirely contained within the Cherry Point Major Industrial UGA/Port Industrialarea.
Applicable Land Use Plans and Regulations
The proposed project lies entirely within Whatcom County. The following land use plans andregulations would be applicable to the project. Each is discussed further in Table 3.10-2 at theend of this section.
• Whatcom County Comprehensive Plan (1997);• Whatcom County Zoning Regulations (Title 20);• Whatcom County Critical Areas Regulations (Title 16);• Whatcom County Shoreline Management Program (1998);• Whatcom County Park and Open Space Plan (1991); and• Energy Facility Site Locations (Chapter 80.50 RCW and Title 463 WAC).

BP Cherry Point Cogeneration Project 3.10 Land UseDraft EIS 3.10-7 September 2003
3.10.2 Impacts of the Proposed Action
Construction
Cogeneration Facility
The cogeneration facility would be constructed on land that Whatcom County has zoned forHeavy Impact Industrial use. Construction of the proposed facility would result in the permanentconversion of approximately 33 acres of predominantly undeveloped, vacant land to developedindustrial uses. Project development would generally be compatible with existing industrial usesin the area, including the BP Cherry Point Refinery, the Chemco wood treatment facility, and thePraxair carbon dioxide facility.
Refinery Interface
Construction of the natural gas connections and piping, raw water supply line, steam andcondensate system piping, elevated piperack, and other cogeneration facilities that interface withthe refinery would occur on Applicant-owned property within the BP Cherry Point Refinery. Therefinery is located within the Cherry Point UGA, and would result in the conversion ofapproximately 31 acres of predominantly undeveloped, vacant land for use as constructionLaydown Areas 1, 2, and 3. Approximately 4.7 acres within Laydown Area 2 would be restoredas wetland mitigation area after the project is constructed.
Transmission System
A 150-foot-wide utility right-of-way would be required for construction and operation of thecogeneration facility/Bonneville 230 kV transmission system. The right-of-way would extend forapproximately 0.8 mile between the cogeneration facility and Bonneville’s Custer/IntalcoTransmission Line No. 2, and would result in the permanent conversion of approximately 15acres of predominantly undeveloped, vacant land. At this time, it is not known if additionaltemporary construction laydown areas would be required for construction of this element of theproject. If additional temporary laydown and staging areas were required outside of the existingright-of-way, these would not be located within wetlands, required buffers, or other sensitiveareas.
Custer/Intalco Transmission Line No. 2
Option 1 – Remedial Action Scheme
Under Option 1, a new transmission line between the Custer substation and the cogenerationfacility interconnect would not be installed, and existing towers for Custer/Intalco TransmissionLine No. 2 would not be replaced. This option would not result in any work within the existingCuster/Intalco transmission corridor, and would therefor not result in any land use impacts.

BP Cherry Point Cogeneration Project 3.10 Land UseDraft EIS 3.10-8 September 2003
Option 2a – New Transmission Line with Lattice Towers
Under Option 2a, a second transmission line would be constructed and existing transmissiontowers would be replaced within the existing 125-foot right-of-way of Custer/IntalcoTransmission Line No. 2. At this time, it is not known if additional temporary constructionlaydown areas would be required for construction of this element of the project. If additionaltemporary laydown and staging areas were required outside of the existing right-of-way, thesewould not be located within wetlands, required buffers, or other sensitive areas.
Option 2b – New Transmission Line with Monopole Towers
Under Option 2b, double circuit steel monopole towers would be used to replace the existingsingle circuit steel lattice towers for Custer/Intalco Transmission Line No. 2. As with Option 2a,it is anticipated that all work would be performed within the existing Bonneville right-of-way.Potential construction-related land use impacts under Option 2b would be the same as thosediscussed under Option 2a.
Other Project Components
North of Grandview Road, approximately 110 acres of undeveloped and agricultural land wouldbe permanently altered to provide wetland mitigation for the proposed project.
Immediately northeast of and adjacent to the cogeneration facility site, approximately 0.2 acre ofLaydown Area 4 would be restored as wetland mitigation upon completion of construction.
Widening and extending Access Road 3 south of the cogeneration facility would convertapproximately 0.6 acre of vacant, undeveloped land to industrial transportation uses.
Construction of the freshwater supply piping modifications proposed for the Alcoa IntalcoWorks facility would be consistent with current industrial use of the Alcoa Intalco site and wouldnot result in any impacts on land use.
Operation
The cogeneration facility, refinery interface, and cogeneration facility/Bonneville transmissionsystem would be located within the Cherry Point Major Industrial Urban Growth Area/PortIndustrial Zone as defined in the Whatcom County Comprehensive Plan. The project, includingall ancillary facilities, would be consistent and compatible with existing zoning, land uses, andland use plans and regulations. Although the project site and surrounding lands were historicallyused for agricultural purposes, much of the area has been used for industrial purposes for the past30 years.

BP Cherry Point Cogeneration Project 3.10 Land UseDraft EIS 3.10-9 September 2003
Cogeneration Facility
The cogeneration facility and Access Road 1 would occupy approximately 33 acres of vacantand undeveloped agricultural lands, and would represent the permanent conversion of this land toindustrial uses.
Refinery Interface
The natural gas connections, compressor station and piping, water supply piping, steam andcondensate system piping, elevated piperack, and other elements of the project that interface withthe refinery would be installed in the existing industrial setting within the refinery. Operation ofthese facilities would not result in any impacts on land use.
Transmission System
The cogeneration facility/Bonneville transmission system corridor would occupy approximately15 acres of vacant and undeveloped agricultural lands, and would represent the permanentconversion of this land to utility right-of-way uses.
Custer/Intalco Transmission Line No. 2
Option 1 – Remedial Action Scheme
Under this option, modifications to the existing Bonneville transmission lines would not berequired. New electrical equipment and cabling to support operation of the RAS would beinstalled within the existing Custer and Intalco substations. Operation of the transmission linewould not result in any impacts on land use.
Option 2a – New Transmission Line with Lattice Towers
Under this option, all new equipment and cabling to upgrade the Custer/Intalco TransmissionLine No. 2 would be installed within the existing Bonneville right-of-way. Operation of thetransmission line would not result in any impacts on land use.
Option 2b – New Transmission Line with Monopole Towers
Land use impacts under Option 2b would be the same as those described under Option 2a.
Other Project Components
Wetland mitigation areas CMA 1 and CMA 2 would occupy approximately 110 acres of vacantand undeveloped agricultural lands. This would preclude the future use of this land foragricultural or other uses.
Upon completion of construction, Laydown Area 4 would be restored as a wetland mitigationarea. This would preclude the future use of this land for agricultural or other uses.

BP Cherry Point Cogeneration Project 3.10 Land UseDraft EIS 3.10-10 September 2003
Access Road 3 would permanently occupy approximately 0.6 acre of previously undevelopedvacant land.
Operation of the freshwater supply piping modifications proposed for the Alcoa Intalco Worksfacility would be consistent with current industrial use of the Alcoa Intalco site and would notresult in any impacts on land use.
3.10.3 Impacts of No Action
Under the No Action Alternative, the proposed project, including the proposed wetlandmitigation sites, would not be constructed. Therefore, there would be no impacts on land use.
3.10.4 Secondary and Cumulative Impacts
Secondary Impacts
During preparation of the Potential Site Study (PSS) in 2001 (EFSEC 2001), two concernsrelated to potential secondary land use effects were identified by agencies and the public. Thefirst related to the potential for growth-inducing impacts to occur from the additional work forcethat would be required to operate the cogeneration facility. The Applicant estimates thatapproximately 30 additional jobs would be created to operate the facility. The number of thesenew employees from outside of the region would most likely be extremely small in comparisonto the existing housing stock available in the region; therefore, significant growth-inducingimpacts associated with operation of the project are unlikely. Section 3.12 provides additionaldiscussion of the project’s work force requirements and associated impacts.
A second issue that was raised during the PSS public involvement process related to concernsabout the existing and future proximity of residences to the existing alignment of natural gaspipeline connections, particularly in portions of the pipeline where increases in pipelineoperating pressure would be required to meet the needs of the proposed project. The natural gascompression station proposed as part of the project would be located west of Blaine Road withinthe BP Cherry Point Refinery. All natural gas pipes and components between the newcompression station, the existing metering station, and the cogeneration facility would be new,and would be located within the refinery and the cogeneration facility. Because the nearestresidence is approximately 0.75 mile from the project site, land use impacts on residential usesassociated with the construction and operation of the project’s natural gas components are notanticipated.
Cumulative Impacts
The Council on Environmental Quality (CEQ) regulations implementing NEPA definecumulative effects as "the impact on the environment which results from the incremental impactof the action (the proposal) when added to other past, present, and reasonably foreseeable futureactions regardless of what agency or person undertakes such other actions" (40 CFR 1508.7).

BP Cherry Point Cogeneration Project 3.10 Land UseDraft EIS 3.10-11 September 2003
Whatcom County’s planning processes, comprehensive plan, and zoning all contemplate that thearea surrounding the proposed project site would be developed for heavy industrial uses. Thefundamental purpose of the Cherry Point UGA is to recognize the unique characteristics thatmake the area locally and regionally important for the siting of industrial development. Indesignating the project site for industrial uses, the planning process has taken cumulative impactsinto consideration.
Other major industrial development that is proposed or planned to occur within the Cherry PointUGA includes the following:
“Clean Fuels” Project
A major planned project within the BP Cherry Point Refinery is the Isomerization Project, alsoknown as the Clean Fuels project. The Clean Fuels project, which consists of a newisomerization unit and a new boiler within the refinery, is currently under construction. Thepurpose of the project is to process light naptha feedstocks to produce a gasoline blendcomponent that will allow the Applicant to meet the 2005 federal standard for sulfur in gasolineand to decrease benzene in all gasoline produced at the refinery. Construction of the project isplanned to take 14 to 18 months, and require approximately 250 construction workers at the peakconstruction phase. Operation of the new facility is expected to result in 8 permanentemployment positions (MFG 2002).
Georgia Strait Crossing Natural Gas Transmission Pipeline
GSX-US, a subsidiary of the Williams Pipeline Company, is currently proposing to construct andoperate a natural gas transmission pipeline that would transport natural gas from an existingpipeline system at the U.S./Canada border near Sumas, Washington, to an interconnect with apipeline proposed by GSX-Canada at Boundary Pass in the Strait of Georgia. The proposedfacilities would include new interconnect piping between the proposed system and the west coastand northwest pipeline systems in Sumas, approximately 47 miles of 16- and 20-inch mainlinepipeline in Whatcom County and the Strait of Georgia, a new compressor station near CherryPoint, and six mainline valves.
The proposed corridor for the GSX project would route the new pipeline through thecogeneration project site through a new utility ROW along the north side of Grandview Road.During construction, the GSX project would require a 100-foot construction ROW. Afterconstruction of the project is completed, the project would require a 50-foot operation ROWalong the pipeline. The project, currently undergoing SEPA environmental review, is tentativelyscheduled to begin construction in summer 2004 and operation in 2006. See Section 3.8, Energyand Natural Resources, for additional discussion of this proposed project.
Gateway Pacific Marine Terminal
Gateway Pacific Partners has proposed the construction and operation of the Gateway PacificTerminal (GPT), a new multi-user import/export facility that would be located on the Strait ofGeorgia shoreline between the existing BP Cherry Point Refinery and the Alcoa Intalco Works

BP Cherry Point Cogeneration Project 3.10 Land UseDraft EIS 3.10-12 September 2003
aluminum plant approximately 0.5 mile south of the refinery’s marine terminal. Whencompleted, the GPT would be the only site north of California capable of accepting vessels witha draft weight of up to 250,000 tons.
The GPT is being designed to handle bulk commodities, principally feed grains (Midwesterncorn), coke, ores, petroleum, potash, sulfur, and alumina for multiple users. The GPT would be athree-berth facility with a total berth length of 2,820 feet accessible by a 1,100-foot trestle thatwould accommodate trucks, conveyor systems, and piping. In addition to the pier itself, a 100-acre onshore industrial complex would be developed to provide support facilities for terminaloperations and provide the opportunity to integrate heavy industrial developments directly withthe port. Infrastructure within the terminal complex would include a 24-inch water main, a high-pressure natural gas mainline, and a 115-kV transmission line. A BNSF rail line would providerail shipping and switching services on the site.
Considered together, the proposed project and the other projects described above (if they goforward) would result in the conversion of lands to industrial uses in this area of WhatcomCounty. However, because the projects would be consistent with established zoning regulationsand comprehensive plan goals, no significant cumulative impacts are anticipated.
3.10.5 Mitigation Measures
There are no additional mitigation measures required for potential impacts on land use for theproject beyond those committed to in the project design and project description.
3.10.6 Significant Unavoidable Adverse Impacts
The project’s conversion of Applicant-owned undeveloped vacant and agricultural land on theproject site to industrial and utility right-of-way uses would be an unavoidable impact that cannotbe mitigated. Because the required conversion would be consistent with the Whatcom CountyComprehensive Plan and the Cherry Point Major Industrial Area UGA designation and existingindustrial zoning of the site, these impacts are not considered significant.
Conversion of vacant and agricultural land within the project site to industrial and utility right-of-way uses would permanently change the use of those lands. However, the proposed uses ofthe project site would be consistent with adopted land use plans and zoning regulations.Therefore, no significant unavoidable adverse impacts are expected for land use as a result of theproposed project.

BP
Che
rry
Poi
nt C
ogen
erat
ion
Pro
ject
3.10
Lan
d U
seD
raft
EIS
3.10
-13
Sept
embe
r 20
03
Tab
le 3
.10-
2:Su
mm
ary
of P
lans
, Pol
icie
s, a
nd R
egul
atio
ns a
nd t
heir
Rel
atio
nshi
p to
the
Pro
pose
d P
roje
ct
Plan
, Pol
icy,
or
Reg
ulat
ion
Des
crip
tion
Rel
atio
nshi
p to
Pro
pose
d Pr
ojec
t
Cog
ener
atio
n Fa
cilit
y, R
efin
ery
Inte
rfac
e, a
nd O
ther
Pro
ject
Com
pone
nts
Wha
tcom
Cou
nty
Com
preh
ensi
ve P
lan
(199
7)C
herr
y Po
int U
rban
Gro
wth
Are
a
The
Wha
tcom
Cou
nty
Com
preh
ensi
ve P
lan
(Wha
tcom
Cou
nty
1997
, as
amen
ded)
des
igna
tes
the
coge
nera
tion
faci
lity
site
and
sur
roun
ding
are
a as
aM
ajor
Ind
ustr
ial U
rban
Gro
wth
Are
a/Po
rt I
ndus
tria
l are
a re
ferr
ed to
as
the
Che
rry
Poin
t UG
A. T
he C
herr
y Po
int U
GA
con
tain
s ne
arly
6,5
00 a
cres
of
indu
stri
al la
nd, i
nclu
ding
the
BP
Che
rry
Poin
t Ref
iner
y, th
e C
onoc
o-Ph
illip
sR
efin
ery,
and
the
Alc
oa I
ntal
co W
orks
alu
min
um s
mel
ter.
A p
eaki
ng e
lect
rica
lge
nera
tion
plan
t ow
ned
by P
uget
Sou
nd E
nerg
y al
so is
loca
ted
in th
e U
GA
.B
P’s
Che
rry
Poin
t Ref
iner
y ha
s ne
arly
2,5
00 a
cres
with
in it
s ow
ners
hip.
The
Cou
nty’
s co
mpr
ehen
sive
pla
n st
ates
that
the
rem
aini
ng u
ndev
elop
ed a
crea
geat
Che
rry
Poin
t will
like
ly b
ecom
e fu
lly d
evel
oped
dur
ing
the
20-y
ear
plan
ning
per
iod.
The
sta
ted
goal
in th
e co
mpr
ehen
sive
pla
n fo
r th
e C
herr
y Po
int U
GA
is a
sfo
llow
s:
“Goa
l 2A
A: M
aint
ain
Che
rry
Poin
t as
an u
ninc
orpo
rate
d ur
ban
grow
th a
rea
base
d on
its
uniq
ue lo
catio
n an
d ch
arac
teri
stic
s an
d its
sig
nifi
cant
con
trib
utio
nto
the
over
all i
ndus
tria
l lan
d su
pply
and
Wha
tcom
Cou
nty'
s ta
x ba
se.”
Spec
ific
pol
icie
s to
ach
ieve
the
stat
ed g
oal i
nclu
de th
e fo
llow
ing:
• Po
licy
2AA
-1: D
esig
natin
g C
herr
y Po
int a
s a
maj
or in
dust
rial
UG
A to
acco
mm
odat
e m
ajor
use
rs th
at n
eed
to b
e lo
cate
d aw
ay f
rom
con
cent
rate
dur
ban
resi
dent
ial a
reas
.•
Polic
y 2A
A-2
: Ens
urin
g th
at C
herr
y Po
int's
uni
que
feat
ures
of
larg
epa
rcel
s, p
ort a
cces
s, a
nd tr
ansp
orta
tion
avai
labi
lity
are
mai
ntai
ned
and
prot
ecte
d fr
om in
com
patib
le d
evel
opm
ent.
• Po
licy
2AA
-3: R
equi
ring
the
mas
ter
plan
ning
of
each
larg
e pa
rcel
inad
vanc
e of
any
dev
elop
men
t or
subd
ivis
ion
at C
herr
y Po
int.
• Po
licy
2AA
-4: R
equi
ring
the
desi
gnat
ion
and
site
pla
n fo
r a
maj
or u
ser
(gen
eral
ly 4
0 ac
res
or m
ore)
bef
ore
the
deve
lopm
ent o
f ac
cess
ory
orsu
ppor
ting
uses
to e
nsur
e th
at a
cces
sory
or
supp
ortin
g us
es a
reco
mpa
tible
with
the
maj
or in
dust
rial
use
r.
The
pro
pose
d pr
ojec
t wou
ld b
e co
nsis
tent
with
the
Wha
tcom
Cou
nty
Com
preh
ensi
ve P
lan.
The
pro
ject
site
is lo
cate
d w
ithin
the
Che
rry
Poin
t Maj
or I
ndus
tria
l Urb
anG
row
th A
rea/
Port
Ind
ustr
ial Z
one
as d
efin
ed in
the
Wha
tcom
Cou
nty
Com
preh
ensi
ve P
lan.
The
com
preh
ensi
ve p
lan
desi
gnat
es th
is a
rea
for
indu
stri
alus
es, f
inds
that
suc
h in
dust
ries
are
eco
nom
ical
lysi
gnif
ican
t to
Wha
tcom
Cou
nty,
and
sta
tes
that
thes
e us
esth
eref
ore
cons
titut
e a
bene
fici
al u
se o
f th
e de
sign
ated
area
.

BP
Che
rry
Poi
nt C
ogen
erat
ion
Pro
ject
3.10
Lan
d U
seD
raft
EIS
3.10
-14
Sept
embe
r 20
03
Tab
le 3
.10-
2:C
onti
nued
Plan
, Pol
icy,
or
Reg
ulat
ion
Des
crip
tion
Rel
atio
nshi
p to
Pro
pose
d Pr
ojec
t
• Po
licy
2AA
-5: S
peci
fyin
g 16
0 ac
res
as a
min
imum
are
a fo
r pl
anni
ngbe
fore
a p
arce
l can
be
com
mitt
ed b
y a
maj
or u
ser
(40
acre
s or
mor
e,si
ngul
arly
or
as a
clu
ster
or
grou
p).
• Po
licy
2AA
-6: P
erm
ittin
g su
ppor
t act
iviti
es, w
areh
ousi
ng, s
hipp
ing,
mac
hine
rep
air
and
serv
ice,
edu
catio
nal s
ervi
ces,
foo
d se
rvic
e, a
ndco
nven
ienc
es to
loca
te o
n a
parc
el o
nly
afte
r th
e co
mpl
etio
n of
a m
aste
rpl
an a
nd th
e id
entif
icat
ion
and
site
pla
n ap
prov
al f
or th
e m
ajor
use
r.•
Polic
y 2A
A-7
: Wor
king
with
oth
er a
genc
ies
and
indu
stri
al o
wne
rs a
tC
herr
y Po
int t
o ad
d ad
ditio
nal d
ocks
, as
nece
ssar
y, th
at a
lso
can
serv
eup
land
use
rs, p
rovi
ded
that
the
use
is c
onsi
sten
t with
sou
nden
viro
nmen
tal p
ract
ices
.•
Polic
y 2A
A-8
: Res
istin
g in
clus
ion
of C
herr
y Po
int a
s pa
rt o
f an
y fu
ture
inco
rpor
atio
n of
Bir
ch B
ay to
pro
tect
inte
rest
s of
the
prop
erty
ow
ner
inte
rms
of ta
xatio
n an
d ur
ban
regu
latio
ns, t
o pr
eclu
de u
rban
ism
nea
r"s
mok
esta
ck"
indu
stri
es, a
nd to
pre
serv
e th
e co
unty
’s ta
x ba
se.
• Po
licy
2AA
-9: C
ontin
uing
to w
ork
with
ser
vice
pro
vide
rs th
at s
erve
Che
rry
Poin
t to
ensu
re th
e de
liver
y of
ser
vice
s an
d to
allo
w it
to d
evel
opto
its
fulle
st p
oten
tial.
Bir
ch B
ay U
rban
Gro
wth
Are
a
The
Bir
ch B
ay U
GA
bor
ders
the
Che
rry
Poin
t UG
A a
t its
nor
thw
est c
orne
ral
ong
Koe
hn a
nd G
rand
view
roa
ds (
see
Figu
re 3
.10-
1). T
here
are
abo
ut 3
,000
acre
s of
und
evel
oped
land
in B
irch
Bay
with
urb
an z
onin
g, m
ore
than
1,0
00ac
res
of w
hich
are
use
d fo
r pa
rks
and
othe
r pu
blic
use
s or
are
und
evel
oped
beca
use
of w
etla
nds
and
othe
r en
viro
nmen
tally
sen
sitiv
e ar
eas.
A D
raft
Bir
ch B
ay S
ubar
ea P
lan
has
been
dev
elop
ed f
or th
e B
irch
Bay
UG
Aan
d su
rrou
ndin
g ar
ea (
Wha
tcom
Cou
nty
2003
a). W
hen
adop
ted
by W
hatc
omC
ount
y, th
e pl
an w
ill b
e in
corp
orat
ed a
s pa
rt o
f th
e C
ount
y’s
com
preh
ensi
vepl
an. T
he d
raft
pla
n pr
opos
es to
des
igna
te th
e po
rtio
n of
the
proj
ect s
ite n
orth
of G
rand
view
Roa
d fo
r pr
ivat
e re
crea
tiona
l/ope
n sp
ace
uses
. Nor
th o
f Ter
rell
Cre
ek, t
he p
lan
prop
oses
a m
ix o
f re
side
ntia
l use
s w
ith a
min
imum
den
sity
of
four
dw
ellin
g un
its (
du)
per
acre
, inc
ludi
ng a
n ar
ea c
ente
red
on B
lain
e an
dA
lder
son
road
s th
at is
pro
pose
d fo
r m
ultif
amily
res
iden
tial (
min
imum
of
16du
per
acr
e) s
urro
undi
ng a
des
igna
ted
com
mer
cial
cen
ter.
Wes
t of
Jack
son
Roa
d, th
e dr
aft p
lan
prop
oses
a m
ix o
f lig
ht in
dust
rial
, ope
n sp
ace
(par
ks a
ndre
crea
tion)
, ope
n sp
ace
buff
er (
bike
and
ped
estr
ian
trai
ls),
res
iden
tial,

BP
Che
rry
Poi
nt C
ogen
erat
ion
Pro
ject
3.10
Lan
d U
seD
raft
EIS
3.10
-15
Sept
embe
r 20
03
Tab
le 3
.10-
2:C
onti
nued
Plan
, Pol
icy,
or
Reg
ulat
ion
Des
crip
tion
Rel
atio
nshi
p to
Pro
pose
d Pr
ojec
t
neig
hbor
hood
com
mer
cial
, and
gov
ernm
ent.
The
pla
n st
ates
that
the
exac
tbo
unda
ries
of
each
land
use
and
land
are
a w
ould
be
dete
rmin
ed a
t som
e fu
ture
date
.
Oth
er d
esig
nate
d zo
ning
in th
e vi
cini
ty o
f th
e C
herr
y Po
int U
GA
is R
ural
toth
e no
rth
and
east
, and
Pub
lic R
ecre
atio
n (L
ake
Ter
rell)
and
Sub
urba
n E
ncla
veto
the
sout
h.W
hatc
om C
ount
y Z
onin
gR
egul
atio
ns (
Titl
e 20
,W
hatc
om C
ount
y C
ode)
Acc
ordi
ng to
Wha
tcom
Cou
nty
Zon
ing
Reg
ulat
ions
, the
site
of
the
coge
nera
tion
faci
lity
and
the
230
kV tr
ansm
issi
on f
acili
ty is
zon
ed H
II. L
and
nort
h of
Gra
ndvi
ew R
oad,
bot
h ea
st a
nd w
est o
f B
lain
e R
oad,
is z
oned
LII
.T
he la
nd f
arth
er to
the
east
and
nor
th is
des
igna
ted
as R
ural
, and
the
area
toth
e w
est a
nd n
orth
wes
t alo
ng th
e sh
ores
of
Bir
ch B
ay, h
isto
rica
lly a
res
ort
com
mun
ity, i
s a
UG
A. O
ther
nea
rby
zoni
ng in
clud
es U
rban
Res
erve
land
nea
rth
e C
ity o
f Fe
rnda
le, P
arks
/Rec
reat
ion
land
to th
e so
uthe
ast,
and
both
Rur
alan
d R
esid
entia
l-R
ural
pro
pert
y to
the
nort
h (s
ee F
igur
e 3.
10-1
)
The
pro
pose
d pr
ojec
t wou
ld b
e co
nsis
tent
with
the
Wha
tcom
Cou
nty
Zon
ing
Reg
ulat
ions
. The
cog
ener
atio
nfa
cilit
y si
te is
zon
ed f
or in
dust
rial
use
s. T
he W
hatc
omC
ount
y C
ode
iden
tifie
s po
wer
gen
erat
ing
faci
litie
s be
low
the
EFS
EC
juri
sdic
tiona
l thr
esho
ld a
s pe
rmitt
ed u
ses
with
in th
e H
eavy
Im
pact
Ind
ustr
ial z
one
(see
Wha
tcom
Cou
nty
Cod
e, s
ectio
n 20
.68.
060)
. The
zon
ing
code
curr
ently
ref
eren
ces
the
prev
ious
250
-MW
EFS
EC
juri
sdic
tiona
l thr
esho
ld, b
ut th
is is
exp
ecte
d to
be
revi
sed
to r
efle
ct th
e cu
rren
t 350
-MW
thre
shol
d (M
iddl
eton
,pe
rs. c
omm
., 20
01).
Fac
ilitie
s w
ith a
gre
ater
pow
erou
tput
req
uire
EFS
EC
app
rova
l. T
he W
hatc
om C
ount
yPl
anni
ng D
epar
tmen
t ind
icat
es th
at la
rger
fac
ilitie
s ar
eco
nsis
tent
with
the
Cou
nty
zoni
ng c
ode
prov
ided
that
EFS
EC
app
rova
l is
obta
ined
(B
P 20
02, S
ectio
n 3.
10).
Wha
tcom
Cou
nty
Cri
tical
Are
a R
egul
atio
ns (
Titl
e 16
,W
hatc
om C
ount
y C
ode)
The
Wha
tcom
Cou
nty
Cri
tical
Are
as R
egul
atio
ns in
clud
e w
ithin
thei
rob
ject
ives
the
iden
tific
atio
n an
d m
anag
emen
t of
envi
ronm
enta
lly c
ritic
al a
reas
and
ecos
yste
ms
to b
alan
ce h
uman
act
ivity
and
the
natu
ral e
nvir
onm
ent.
The
regu
latio
ns r
equi
re th
at a
n ap
plic
ant m
ust:
(1)
dem
onst
rate
that
the
prop
osal
subm
itted
is g
ener
ally
con
sist
ent w
ith th
e pu
rpos
es a
nd s
tand
ards
of
this
ordi
nanc
e, (
2) a
sses
s im
pact
s on
the
criti
cal a
rea
from
act
iviti
es a
nd u
ses
prop
osed
, and
(3)
iden
tify
prot
ectiv
e m
echa
nism
s ad
equa
te to
mee
t the
requ
irem
ents
of
this
ord
inan
ce.
Spec
ific
goa
ls o
f th
e C
ritic
al A
reas
Ord
inan
ce in
clud
e th
e fo
llow
ing:
• R
educ
e po
tent
ial l
osse
s to
pro
pert
y an
d hu
man
life
.•
Prot
ect t
he p
ublic
fro
m h
arm
fro
m la
ndsl
ide,
sub
side
nce,
ero
sion
, sei
smic
,fl
oodi
ng, a
nd o
ther
nat
ural
haz
ards
.•
Min
imiz
e ad
vers
e im
pact
s on
the
qual
ity a
nd q
uant
ity o
f w
ater
res
ourc
es.
The
pro
pose
d pr
ojec
t, w
ith m
itiga
tion
mea
sure
s in
pla
ce,
wou
ld c
ompl
y w
ith th
e W
hatc
om C
ount
y C
ritic
al A
reas
Reg
ulat
ions
. The
reg
ulat
ion
requ
irem
ents
app
licab
le to
dist
urbe
d w
etla
nd a
reas
wou
ld b
e ad
dres
sed
thro
ugh
requ
ired
wet
land
miti
gatio
n, w
hich
is p
ropo
sed
as p
art o
fth
e pr
ojec
t. (S
ee S
ectio
ns 2
and
3.5
for
fur
ther
dis
cuss
ion
and
anal
ysis
of
prop
osed
wet
land
miti
gatio
n.)

BP
Che
rry
Poi
nt C
ogen
erat
ion
Pro
ject
3.10
Lan
d U
seD
raft
EIS
3.10
-16
Sept
embe
r 20
03
Tab
le 3
.10-
2:C
onti
nued
Plan
, Pol
icy,
or
Reg
ulat
ion
Des
crip
tion
Rel
atio
nshi
p to
Pro
pose
d Pr
ojec
t
• Pr
even
t des
truc
tion
to th
e na
tura
l res
ourc
es n
eces
sary
to m
aint
ain
the
viab
ility
of
natu
ral e
cosy
stem
s.•
Prot
ect u
niqu
e, f
ragi
le, a
nd v
alua
ble
elem
ents
of
the
envi
ronm
ent,
incl
udin
g fi
sh, s
hellf
ish,
and
wild
life
habi
tat.
• Pr
otec
t the
ben
efic
ial f
unct
ions
of
wet
land
s, r
iver
s, a
nd s
trea
ms
and
avoi
d, m
inim
ize,
or
miti
gate
for
dam
age
to w
etla
nds,
riv
ers,
or
stre
ams
whe
neve
r pr
actic
able
.
Des
igna
ted
criti
cal a
rea
cate
gori
es a
re g
eolo
gic
haza
rd a
reas
incl
udin
gla
ndsl
ide,
sei
smic
, min
e, a
nd a
lluvi
al f
an h
azar
d ar
eas;
fre
quen
tly f
lood
edar
eas;
cri
tical
aqu
ifer
rec
harg
e ar
eas;
wet
land
s; a
nd f
ish
and
wild
life
habi
tat
cons
erva
tion
area
s. A
lim
ited
rang
e of
act
iviti
es is
aut
hori
zed
with
in c
ritic
alar
eas
and
thei
r as
soci
ated
buf
fers
. The
se a
ctiv
ities
can
not r
esul
t in
incr
ease
dri
sk o
r ha
zard
, and
adv
erse
impa
cts
mus
t be
min
imiz
ed a
nd th
e di
stur
bed
area
rest
ored
imm
edia
tely
aft
er c
onst
ruct
ion.
Miti
gatio
n m
ay b
e de
term
ined
nece
ssar
y to
res
tore
or
enha
nce
dist
urbe
d se
nsiti
ve r
esou
rces
.W
hatc
om C
ount
y Sh
orel
ine
Man
agem
ent P
rogr
am (
1998
)T
he W
hatc
om C
ount
y Sh
orel
ine
Man
agem
ent P
rogr
am (
SMP)
impl
emen
ts th
eW
ashi
ngto
n Sh
orel
ine
Man
agem
ent A
ct (
SMA
) in
Wha
tcom
Cou
nty.
The
SMP
esta
blis
hes
a po
licy
fram
ewor
k fo
r re
gula
ting
shor
elin
e de
velo
pmen
t and
prot
ectin
g co
asta
l res
ourc
es in
Wha
tcom
Cou
nty.
The
SM
P ha
s ju
risd
ictio
nov
er a
ll de
sign
ated
sho
relin
es o
f th
e st
ate
and
asso
ciat
ed u
plan
d ar
eas
with
in20
0 fe
et th
e sh
orel
ine,
whi
ch m
ay in
clud
e th
e en
tiret
y of
an
asso
ciat
edw
etla
nd a
nd/o
r fl
oodp
lain
. The
pro
ject
is n
ot w
ithin
a s
hore
line
zone
.
Bec
ause
the
proj
ect i
s no
t loc
ated
with
in a
des
igna
ted
shor
elin
e zo
ne, t
he r
equi
rem
ents
of W
hatc
om C
ount
ySh
orel
ine
Man
agem
ent P
rogr
am a
re n
ot a
pplic
able
.
Wha
tcom
Cou
nty
Park
and
Ope
n Sp
ace
Plan
and
the
Nat
ural
Her
itage
Pla
n (1
991)
Whe
n it
was
pub
lishe
d in
199
1, th
e W
hatc
om C
ount
y Pa
rk a
nd O
pen
Spac
ePl
an a
nd th
e N
atur
al H
erita
ge P
lan
for W
hatc
om C
ount
y re
com
men
ded
that
iden
tifie
d pr
iori
ty la
nds
be a
ddre
ssed
in, o
r re
cogn
ized
by,
exi
stin
g po
licie
san
d pl
ans.
The
rec
reat
ion
elem
ent o
f th
e W
hatc
om C
ount
y C
ompr
ehen
sive
Plan
incl
udes
pol
icie
s th
at r
efle
ct th
ese
reco
mm
enda
tions
. See
the
prec
edin
gpa
ragr
aphs
for
add
ition
al d
iscu
ssio
n of
the
com
preh
ensi
ve p
lan.
Ope
n sp
ace
incl
udes
land
s de
sign
ated
und
er th
e pr
ovis
ions
of
the
Ope
n Sp
ace
Tax
atio
nA
ct (
RC
W 8
4.34
). T
he A
pplic
ant h
as e
nrol
led
appr
oxim
atel
y 1,
000
acre
s of
land
s w
ithin
the
proj
ect v
icin
ity a
s op
en s
pace
tim
berl
and.
The
pro
pose
d pr
ojec
t wou
ld g
ener
ally
be
cons
iste
nt w
ithth
e W
hatc
om C
ount
y Pa
rk a
nd O
pen
Spac
e Pl
an. A
nypo
rtio
n of
the
prop
osed
cog
ener
atio
n fa
cilit
y si
te th
at is
curr
ently
enr
olle
d as
ope
n sp
ace
timbe
rlan
d w
ould
be
rede
sign
ated
for
indu
stri
al u
ses;
how
ever
, thi
s am
ount
wou
ld b
e m
inor
com
pare
d to
the
1,00
0 ac
res
ofA
pplic
ant-
owne
d la
nd c
urre
ntly
enr
olle
d as
ope
n sp
ace
timbe
rlan
d. S
ee S
ectio
n 3.
13 f
or a
dis
cuss
ion
of e
xist
ing
park
and
rec
reat
ion
faci
litie
s an
d po
tent
ial i
mpa
cts
asso
ciat
ed w
ith th
e pr
ojec
t.W
ashi
ngto
n St
ate
Ene
rgy
Faci
lity
Site
Eva
luat
ion
Cou
ncil
The
siti
ng o
f en
ergy
fac
ilitie
s, s
uch
as th
e B
P C
herr
y Po
int C
ogen
erat
ion
Proj
ect,
is r
egul
ated
by
EFS
EC
und
er C
hapt
er 8
0.50
RC
W (
Ene
rgy
Faci
litie
sSi
te L
ocat
ions
) an
d C
hapt
er 4
63-4
2 W
AC
. The
App
lican
tre
ques
ting
cert
ific
atio
n fr
om E
FSE
C is
req
uire
d to
sub
mit
deta
iled
info
rmat
ion
on th
e pr
opos
ed p
roje
ct a
nd im
pact
s th
e pr
ojec
t may
hav
e on
the
The
pro
pose
d pr
ojec
t is
unde
r E
FSE
C ju
risd
ictio
n, a
ndth
e A
pplic
ant h
as s
ubm
itted
an
ASC
in J
une
2002
and
an
amen
ded
ASC
in A
pril
2003
.

BP
Che
rry
Poi
nt C
ogen
erat
ion
Pro
ject
3.10
Lan
d U
seD
raft
EIS
3.10
-17
Sept
embe
r 20
03
Tab
le 3
.10-
2:C
onti
nued
Plan
, Pol
icy,
or
Reg
ulat
ion
Des
crip
tion
Rel
atio
nshi
p to
Pro
pose
d Pr
ojec
t
natu
ral a
nd b
uilt
envi
ronm
ents
. The
App
lican
t is
also
req
uire
d to
des
crib
e th
em
eans
to b
e us
ed to
min
imiz
e or
miti
gate
pos
sibl
e ad
vers
e im
pact
s on
the
phys
ical
or
hum
an e
nvir
onm
ent (
Cha
pter
463
-42-
085
WA
C).
Fur
ther
, the
App
lican
t is
requ
ired
to s
et f
orth
insu
ranc
e, b
ondi
ng, o
r ot
her
arra
ngem
ents
prop
osed
to m
itiga
te d
amag
e or
loss
to th
e en
viro
nmen
t (C
hapt
er 4
63-4
2-07
5W
AC
).
Cha
pter
80.
50 R
CW
pre
empt
s st
ate
and
loca
l jur
isdi
ctio
n re
latin
g to
ene
rgy
faci
lity
site
s th
at a
re u
nder
the
purv
iew
of
EFS
EC
. Cer
tific
atio
n pu
rsua
nt to
Cha
pter
80.
50 R
CW
is g
iven
in li
eu o
f an
y pe
rmit,
cer
tific
ate,
or
sim
ilar
docu
men
t tha
t mig
ht o
ther
wis
e be
req
uire
d. C
hapt
er 4
63-2
8 W
AC
Pro
cedu
re –
Initi
al P
ublic
Hea
ring
s an
d In
form
atio
nal M
eetin
g, r
equi
res
EFS
EC
to m
ake
ade
term
inat
ion
as to
whe
ther
the
prop
osed
fac
ility
is c
onsi
sten
t and
inco
mpl
ianc
e w
ith C
ount
y or
Reg
iona
l lan
d us
e pl
ans
or z
onin
g or
dina
nces
.Sh
ould
EFS
EC
fin
d th
at la
nd u
se is
not
con
sist
ent,
Cha
pter
463
-28
WA
CE
FSE
C P
roce
dure
Stat
e Pr
eem
ptio
n pr
ovid
es p
roce
dure
s to
be
follo
wed
by
EFS
EC
in d
eter
min
ing
whe
ther
to r
ecom
men
d th
at th
e st
ate
pree
mpt
loca
lla
nd u
se p
lans
or
zoni
ng o
rdin
ance
s fo
r a
site
or
port
ions
of
a si
te f
or a
nen
ergy
fac
ility
. An
App
lican
t una
ble
to r
esol
ve s
peci
fic
nonc
ompl
ianc
e is
sues
may
file
a w
ritte
n re
ques
t for
sta
te p
reem
ptio
n as
aut
hori
zed
in C
hapt
er 4
63-
28-0
20 W
AC
.
At t
he ti
me
of p
repa
ratio
n of
this
Dra
ft E
IS, E
FSE
C h
asno
t yet
mad
e a
dete
rmin
atio
n of
com
plia
nce
with
reg
ards
to th
e W
hatc
om C
ount
y C
ompr
ehen
sive
Pla
n an
dW
hatc
om C
ount
y Z
onin
g C
ode.
Tra
nsm
issi
on F
acili
ty a
nd C
uste
r/In
talc
o T
rans
mis
sion
Lin
e N
o. 2
Wha
tcom
Cou
nty
Com
preh
ensi
ve P
lan
(199
7)T
he p
ropo
sed
tran
smis
sion
fac
ility
and
the
nort
h-so
uth
segm
ent o
f th
e ex
istin
gtr
ansm
issi
on c
orri
dor
that
cro
sses
Gra
ndvi
ew R
oad
are
loca
ted
with
in th
eC
herr
y Po
int U
GA
. Det
ails
on
the
Che
rry
Poin
t UG
A a
re s
umm
ariz
ed in
this
tabl
e un
der
the
Cog
ener
atio
n Fa
cilit
y, R
efin
ery
Inte
rfac
e, a
nd O
ther
Pro
ject
Com
pone
nts
sect
ion
abov
e.
The
seg
men
t of
the
exis
ting
tran
smis
sion
line
cor
rido
r fo
r C
uste
r/In
talc
oT
rans
mis
sion
Lin
e N
o. 2
bet
wee
n V
ista
Roa
d an
d th
e C
uste
r su
bsta
tion
islo
cate
d in
the
nort
hern
por
tion
of a
n ar
ea d
esig
nate
d as
the
Fern
dale
UG
A.
The
sta
ted
goal
in th
e co
mpr
ehen
sive
pla
n fo
r th
e Fe
rnda
le U
GA
(G
oal 2
V)
isto
"Pr
ovid
e a
suff
icie
nt U
rban
Gro
wth
Are
a fo
r Fe
rnda
le to
ret
ain
exis
ting
char
acte
r an
d at
tain
Gro
wth
Man
agem
ent A
ct a
nd c
ount
y la
nd u
se g
oals
."
The
por
tion
of C
uste
r/In
talc
o T
rans
mis
sion
Lin
e N
o. 2
bet
wee
n K
icke
rvill
eR
oad
and
Vis
ta R
oad
is d
esig
nate
d R
ural
in th
e W
hatc
om C
ount
yC
ompr
ehen
sive
Pla
n. A
n ap
plic
able
Cou
nty
goal
as
it re
late
s to
rur
al la
nds
is
The
tran
smis
sion
line
ele
men
ts o
f th
e pr
opos
ed p
roje
ctw
ould
be
cons
iste
nt w
ith th
e W
hatc
om C
ount
yC
ompr
ehen
sive
Pla
n.T
he p
ropo
sed
tran
smis
sion
fac
ility
and
a p
ortio
n of
Cus
ter/
Inta
lco
Tra
nsm
issi
on L
ine
No.
2 w
ould
be
loca
ted
with
in th
e C
herr
y Po
int U
GA
. The
com
preh
ensi
ve p
lan
desi
gnat
es th
e C
herr
y Po
int U
GA
for
indu
stri
al u
ses,
find
s th
at s
uch
indu
stri
es a
re e
cono
mic
ally
sig
nifi
cant
toW
hatc
om C
ount
y, a
nd s
tate
s th
at th
ese
uses
ther
efor
eco
nstit
ute
a be
nefi
cial
use
of
the
desi
gnat
ed a
rea.
Rec
onst
ruct
ing
the
port
ion
of C
uste
r/In
talc
oT
rans
mis
sion
Lin
e N
o. 2
loca
ted
with
in th
e Fe
rnda
leU
GA
wou
ld a
lso
be c
onsi
sten
t with
the
Com
preh
ensi
vePl
an b
ecau
se it
wou
ld n
ot c
hang
e th
e ex
istin
g ch
arac
ter
of th
is p
ortio
n of
the
Cou
nty.

BP
Che
rry
Poi
nt C
ogen
erat
ion
Pro
ject
3.10
Lan
d U
seD
raft
EIS
3.10
-18
Sept
embe
r 20
03
Tab
le 3
.10-
2:C
onti
nued
Plan
, Pol
icy,
or
Reg
ulat
ion
Des
crip
tion
Rel
atio
nshi
p to
Pro
pose
d Pr
ojec
t
"Ret
ain
the
rura
l cha
ract
er a
nd li
fest
yle
of W
hatc
om C
ount
y" (
Goa
l 2C
C).
In
supp
ort o
f th
is g
oal,
Polic
y 2C
C-1
sta
tes
"Con
cent
rate
gro
wth
in u
rban
are
as.
In a
reas
whe
re e
xist
ing
deve
lopm
ent p
atte
rns
do n
ot a
lrea
dy p
rohi
bit i
t, dr
aw a
dist
inct
ion
betw
een
urba
n/ru
ral u
ses
to p
reve
nt u
rban
spr
awl."
The
sta
ted
goal
s an
d co
rres
pond
ing
polic
ies
in th
e co
mpr
ehen
sive
pla
n th
atw
ould
be
appl
icab
le to
the
tran
smis
sion
line
ele
men
ts o
f th
e pr
opos
ed p
roje
ctar
e as
fol
low
s:
“Goa
l 5C
: Fac
ilita
te a
cces
sibi
lity
of u
tiliti
es."
Spec
ific
pol
icie
s to
ach
ieve
the
stat
ed g
oal i
nclu
de th
e fo
llow
ing:
• Po
licy
5C-7
: Pub
lic f
acili
ties
and
utili
ties
will
be
desi
gned
and
loca
ted
ina
man
ner
whi
ch p
rote
cts
the
inte
grity
of
plan
ned
land
use
s, e
xist
ing
land
form
s, d
rain
age
way
s, n
atur
al s
yste
ms,
cri
tical
are
as, a
nd r
esou
rce
land
s.•
Polic
y 5C
-8: E
xten
sion
of
urba
n ut
ility
ser
vice
s w
ill b
e ca
refu
lly s
tage
d to
disc
oura
ge n
ew d
evel
opm
ent i
n ar
eas
that
are
pre
mat
ure
in te
rms
ofpl
anni
ng, t
imin
g, a
nd f
undi
ng.
• Po
licy
5C-9
: Ext
ensi
on o
f ur
ban
gove
rnm
enta
l ser
vice
s an
d ut
ilitie
s w
illbe
con
fine
d to
are
as p
lann
ed f
or u
rban
dev
elop
men
t and
be
cons
iste
ntw
ith th
e op
timal
land
use
and
urb
an g
row
th a
rea
plan
.•
"Goa
l 5H
: Fac
ilita
te m
aint
enan
ce a
nd r
ehab
ilita
tion
of e
xist
ing
utili
tysy
stem
s an
d fa
cilit
ies
and
enco
urag
e us
e of
exi
stin
gtr
ansm
issi
on/d
istr
ibut
ion
corr
idor
s."
Spec
ific
pol
icie
s to
ach
ieve
the
stat
ed g
oal i
nclu
de th
e fo
llow
ing:
• Po
licy
5H-1
: Enc
oura
ge u
tility
pro
vide
rs to
exp
lore
exp
ande
d an
d/or
join
tus
e of
exi
stin
g ut
ility
cor
rido
rs b
efor
e se
ekin
g si
tes
for
new
rig
hts-
of-
way
.•
Polic
y 5H
-2: P
rom
ote,
whe
n re
ason
able
and
fea
sibl
e, th
e co
-loc
atio
n of
new
pub
lic a
nd p
riva
te u
tility
dis
trib
utio
n fa
cilit
ies
in s
hare
dtr
ench
es/c
orri
dors
, as
wel
l as
coor
dina
tion
of c
onst
ruct
ion
timin
g.
Rec
onst
ruct
ing
Cus
ter/
Inta
lco
Tra
nsm
issi
on L
ine
No.
2w
ould
invo
lve
repl
acin
g ex
istin
g to
wer
s w
ithin
this
tran
smis
sion
line
cor
rido
r; th
eref
ore
this
pro
ject
ele
men
tw
ould
not
res
ult i
n a
chan
ge in
land
use
or
deve
lopm
ent
patte
rns
and
wou
ld e
nsur
e th
at th
is p
ortio
n of
the
Cou
nty
reta
ins
its e
xist
ing
rura
l cha
ract
er.
The
pro
pose
d tr
ansm
issi
on li
ne e
lem
ents
wou
ld b
eco
nsis
tent
with
Wha
tcom
Cou
nty
Com
preh
ensi
ve P
lan
goal
s an
d po
licie
s co
ncer
ning
pub
lic u
tiliti
es. T
he n
ewtr
ansm
issi
on f
acili
ty w
ould
be
loca
ted
in, a
nd c
onsi
sten
tw
ith, t
he C
herr
y Po
int U
GA
. The
pro
pose
d re
plac
emen
tof
Cus
ter/
Inta
lco
Tra
nsm
issi
on L
ine
No.
2 w
ould
be
cons
iste
nt w
ith th
e C
ount
y's
goal
to e
ncou
rage
use
of
exis
ting
tran
smis
sion
/dis
trib
utio
n co
rrid
ors
beca
use
cons
truc
tion
wou
ld o
ccur
with
in B
onne
ville
's e
xist
ing
righ
t-of
-way
.

BP
Che
rry
Poi
nt C
ogen
erat
ion
Pro
ject
3.10
Lan
d U
seD
raft
EIS
3.10
-19
Sept
embe
r 20
03
Tab
le 3
.10-
2:C
onti
nued
Plan
, Pol
icy,
or
Reg
ulat
ion
Des
crip
tion
Rel
atio
nshi
p to
Pro
pose
d Pr
ojec
t
Wha
tcom
Cou
nty
Zon
ing
Reg
ulat
ions
(T
itle
20,
Wha
tcom
Cou
nty
Cod
e)
Acc
ordi
ng to
Wha
tcom
Cou
nty
Zon
ing
Reg
ulat
ions
, the
cor
rido
r fo
r th
epr
opos
ed n
ew tr
ansm
issi
on li
ne b
etw
een
the
coge
nera
tion
faci
lity
and
Bon
nevi
lle’s
Cus
ter/
Inta
lco
Tra
nsm
issi
on L
ine
No.
2 is
zon
ed H
II. T
heex
istin
g tr
ansm
issi
on li
ne c
orri
dor
for
the
Cus
ter/
Inta
lco
Tra
nsm
issi
on L
ine
No.
2 b
etw
een
the
inte
rcon
nect
ion
with
the
prop
osed
new
tran
smis
sion
line
and
Bon
nevi
lle's
Cus
ter
subs
tatio
n tr
aver
ses
thre
e di
ffer
ent z
onin
g di
stri
cts:
HII
, LII
, and
R5A
.
Publ
ic u
tiliti
es, i
nclu
ding
ele
ctri
cal t
rans
mis
sion
line
s, a
re r
egul
ated
und
erC
hapt
er 2
0.82
, Pub
lic U
tiliti
es, o
f th
e W
hatc
om C
ount
y C
ode.
Use
s th
atre
quir
e a
cond
ition
al u
se p
erm
it or
maj
or p
roje
ct p
erm
it an
d sh
all b
e su
bjec
t to
a th
resh
old
dete
rmin
atio
n in
acc
orda
nce
with
the
Wha
tcom
Cou
nty
SEPA
Ord
inan
ce in
clud
e: (
8) E
lect
rica
l sub
stat
ions
and
ele
ctri
cal p
ower
line
sca
rryi
ng v
olta
ges
in e
xces
s of
55
kV (
55,0
00 v
olts
); p
rovi
ded
that
no
cond
ition
al u
se p
erm
it sh
all b
e gr
ante
d fo
r el
ectr
ical
tran
smis
sion
line
sca
rryi
ng m
ore
than
115
kV
(11
5,00
0 vo
lts)
exce
pt o
n la
nd w
here
suc
h pe
rmits
have
alr
eady
bee
n gr
ante
d or
in in
dust
rial
dis
tric
ts.
The
tran
smis
sion
line
ele
men
ts o
f th
e pr
opos
ed p
roje
ctw
ould
be
cons
iste
nt w
ith th
e W
hatc
om C
ount
y Z
onin
gR
egul
atio
ns, b
ut w
ould
be
subj
ect t
o a
cond
ition
al u
sean
d m
ajor
dev
elop
men
t per
mit.
Bot
h th
e ne
w p
ropo
sed
tran
smis
sion
fac
ility
and
pro
pose
d re
plac
emen
t lin
ein
side
the
exis
ting
Cus
ter/
Inta
lco
Tra
nsm
issi
on L
ine
No.
2 ri
ght-
of-w
ay a
re p
lann
ed a
s 23
0 kV
line
s, a
bove
the
Cou
nty'
s 11
5 kV
thre
shol
d fo
r gr
antin
g a
cond
ition
al u
sepe
rmit
(Wha
tcom
Cou
nty
Cod
e Se
ctio
n 20
.82.
030(
8)).
How
ever
, the
pro
pose
d tr
ansm
issi
on f
acili
ty w
ould
be
loca
ted
in a
n in
dust
rial
zon
ing
dist
rict
(H
II)
and
the
repl
acem
ent t
rans
mis
sion
line
wou
ld b
e lo
cate
d w
ithin
the
righ
t-of
-way
of
an e
xist
ing
tran
smis
sion
line
that
had
been
pre
viou
sly
appr
oved
by
the
Cou
nty
for
cons
truc
tion.
The
refo
re, t
hese
two
prop
osed
pro
ject
ele
men
ts w
ould
be
cons
iste
nt w
ith lo
cal z
onin
g re
gula
tions
sub
ject
toC
ount
y ap
prov
al o
f co
nditi
onal
use
and
maj
orde
velo
pmen
t per
mits
.W
hatc
om C
ount
y C
ritic
alA
rea
Reg
ulat
ions
(T
itle
16,
Wha
tcom
Cou
nty
Cod
e)
See
deta
ils u
nder
Cog
ener
atio
n Fa
cilit
y, R
efin
ery
Inte
rfac
e, a
nd O
ther
Pro
ject
Com
pone
nts
abov
e.C
onst
ruct
ion
activ
ity a
ssoc
iate
d w
ith th
e ne
wtr
ansm
issi
on f
acili
ty w
ould
res
ult i
n th
e pe
rman
ent f
ill o
rdi
stur
banc
e of
app
roxi
mat
ely
0.15
acr
e of
PE
M C
ateg
ory
III
wet
land
s, a
nd a
Sec
tion
404(
b) (
wet
land
) pe
rmit
has
alre
ady
been
issu
ed b
y th
e U
. S. A
rmy
Cor
ps o
fE
ngin
eers
for
wor
k in
this
cor
rido
r. W
etla
nd d
elin
eatio
nsw
ould
nee
d to
be
perf
orm
ed in
are
as to
be
dist
urbe
d fo
rre
cons
truc
ting
the
Cus
ter/
Inta
lco
Tra
nsm
issi
on L
ine
No.
2 be
fore
wet
land
impa
cts
can
be q
uant
ifie
d an
d w
etla
ndpe
rmits
can
be
issu
ed. H
owev
er, t
he r
egul
atio
nre
quir
emen
ts a
pplic
able
to d
istu
rbed
wet
land
are
as w
ould
be a
ddre
ssed
thro
ugh
requ
ired
wet
land
miti
gatio
n, w
hich
is p
ropo
sed
as p
art o
f th
e pr
ojec
t (se
e Se
ctio
ns 2
and
3.5
for
furt
her
disc
ussi
on a
nd a
naly
sis
of p
ropo
sed
wet
land
miti
gatio
n.)
Wha
tcom
Cou
nty
Shor
elin
eM
anag
emen
t Pro
gram
(19
98)
See
deta
ils u
nder
Cog
ener
atio
n Fa
cilit
y, R
efin
ery
Inte
rfac
e, a
nd O
ther
Pro
ject
Com
pone
nts
abov
e.B
ecau
se th
e tr
ansm
issi
on li
ne e
lem
ents
of
the
proj
ect a
reno
t loc
ated
with
in a
des
igna
ted
shor
elin
e zo
ne, t
here
quir
emen
ts o
f W
hatc
om C
ount
y Sh
orel
ine
Mas
ter
Prog
ram
are
not
app
licab
le.

BP
Che
rry
Poi
nt C
ogen
erat
ion
Pro
ject
3.10
Lan
d U
seD
raft
EIS
3.10
-20
Sept
embe
r 20
03
Tab
le 3
.10-
2:C
onti
nued
Plan
, Pol
icy,
or
Reg
ulat
ion
Des
crip
tion
Rel
atio
nshi
p to
Pro
pose
d Pr
ojec
t
Wha
tcom
Cou
nty
Park
and
Ope
n Sp
ace
Plan
and
the
Nat
ural
Her
itage
Pla
n (1
991)
See
deta
ils u
nder
Cog
ener
atio
n Fa
cilit
y, R
efin
ery
Inte
rfac
e, a
nd O
ther
Pro
ject
Com
pone
nts
abov
e.T
he tr
ansm
issi
on li
ne e
lem
ents
of
the
proj
ect w
ould
be
cons
iste
nt w
ith th
e W
hatc
om C
ount
y Pa
rk a
nd O
pen
Spac
e Pl
an. T
he T
rans
mis
sion
fac
ility
wou
ld b
eco
nstr
ucte
d on
App
lican
t-ow
ned,
indu
stri
al-z
oned
land
with
in th
e C
herr
y Po
int M
ajor
Ind
ustr
ial U
GA
. Wor
kas
soci
ated
with
the
reco
nstr
uctio
n of
Cus
ter/
Inta
lco
Tra
nsm
issi
on L
ine
No.
2 w
ould
occ
ur w
ithin
Bon
nevi
lle’s
exi
stin
g ut
ility
rig
ht-o
f-w
ay f
or th
e co
rrid
or.
See
Sect
ion
3.13
for
a d
iscu
ssio
n of
exi
stin
g pa
rk a
ndre
crea
tion
faci
litie
s an
d po
tent
ial i
mpa
cts
asso
ciat
ed w
ithth
e pr
ojec
t.
BP Cherry Point Cogeneration Project 3.11 Visual Resources, Light, and GlareDraft EIS 3.11-1 September 2003
3.11 VISUAL RESOURCES, LIGHT, AND GLARE
3.11.1 Introduction
The visual resource analysis evaluates potential impacts from construction and operation of theproposed project, including the cogeneration facility and refinery interface, the 230-kVtransmission facility, and modifications to Custer/Intalco Transmission Line No. 2. The analysiswas based on the visual resource inventory and analyses reported in the ASC (BP 2002, Section3.11) and a visual resources study for the Custer/Intalco transmission line prepared by URS(Appendix C). The evaluation of potential impacts on visual resources included the followingactivities:
• Compiling an inventory of existing visual quality,• Identifying sensitive viewers and estimating their potential view of the proposed facilities
(general visibility and distance zone),• Describing visual changes introduced by the construction and operation of the facilities,• Preparing visual simulations of the proposed facility from representative viewpoints,• Assessing visual impacts from sensitive viewpoints, and• Recommending mitigation measures for possible visual impacts.
The visual impact assessment considers the impacts to visual resources for the Proposed Actionand No Action alternatives. Explanations of the methods used in the visual analyses are asfollows:
Visual Quality Inventory
Topography, vegetation (size and shape), and developed land uses were reviewed using USGSquadrangle and project maps. Field reconnaissance was conducted to determine the generalvisibility of the project facilities and the reconstructed Bonneville transmission lines from theidentified sensitive viewpoints (e.g., residences, travel routes, or other sensitive viewpoints).Visual impacts were assessed based on the visibility of change to the existing environmentresulting from construction and operation of the project from sensitive viewpoints in relationshipto the viewer type. Levels of visual impact are documented as high, moderate, or low.
Visual quality is the visual pattern created by the combination of natural character landscapesand industrial and man-made features. Visual quality was evaluated using the followingdescriptions:
• Urban/Industrial. Landscape is primarily human-made and affected by elements common tothe built environment of urban/industrial areas. Human elements are prevalent or landscapemodifications exist, which do not compatibly blend with the natural surroundings (low visualintactness and unity).
• Rural. The landscape consists of natural and human-made features/patterns, often the resultof altering the landscape for farming, mineral extraction, or forestry. These areas may not bevisually distinctive or unusual within the region. The landscape integrity of the area,

BP Cherry Point Cogeneration Project 3.11 Visual Resources, Light, and GlareDraft EIS 3.11-2 September 2003
however, may provide positive visual experiences such as natural areas with some existingagricultural areas (farm fields, etc.), or well-maintained and landscaped residential areas.
• Natural. The landscape exhibits distinctive and memorable natural visual features (landforms,rock outcrops, etc.) and patterns (vegetation/open space) that are largely undisturbed, usuallya rural or open space setting. Few human-made developments or disturbances are present.
Viewer Sensitivity
Viewer sensitivity is a component of the visual experience that estimates the importance to aviewer of features, conditions that affect visual perception, and social factors that contribute toviewer perceptions. Three types of viewers were considered: residents, workers, and travelers.Viewer sensitivity depends on viewer types and exposure (number of viewers and viewfrequency), view orientation and duration, and viewer awareness/sensitivity to visual changes.Levels of viewer sensitivity were evaluated using the following criteria:
• Low. Viewers in this group are focused on a work activity and not on the surrounding views.This category might include those who work in agriculture or industrial/warehouse settings.Compared with other viewer types, the number of low sensitivity viewers is generallyconsidered small. Viewer activities typically limit awareness/sensitivity to the visual settingimmediately outside the workplace.
• Moderate. Viewers in the moderate visual sensitivity group consist of highway and localtravelers. The number of viewers varies depending on location; however, on average theytend to be moderately large based on overall densities of surrounding areas and highwaycommuters. Viewer awareness and sensitivity also are considered moderate becausedestination travelers often have a focused orientation.
• High. Residential, recreational, and other viewers congregating in public gathering places(churches, schools, etc.) are considered to have comparatively high visual sensitivity. Viewsmay be of long duration and high frequency. In some cases, views may be perceived to affectproperty value.
Visual Simulations
Preparation of visual simulations included the following steps:
• Viewpoints were identified from which the projects might be visible. This was undertakenusing professional judgment based on accepted methods of visual impact determination andevaluation and nearby public viewpoints.
• Photographs were taken of the existing topographic, vegetative, and human-made features.
Using the preliminary plans, building elevations, and photographs from various viewpoints,project features were illustrated using visual modeling within individual photographs todemonstrate how a particular view is likely to change following project construction, both for thecogeneration facility and the Bonneville transmission lines.

BP Cherry Point Cogeneration Project 3.11 Visual Resources, Light, and GlareDraft EIS 3.11-3 September 2003
Visual Impact Assessment
Visual impacts relate to changes in available views of the landscape, and the effects of thosechanges on people. They arise from the changes in land use, the development or construction ofbuildings and structures, changes in land management, and less commonly, the changes inproduction processes and emissions. In addition, over the life of a project, different sources ofimpact occur at various stages during construction, operation, decommissioning, and restoration.
Potential impacts were subjectively evaluated based on a combination of contrasts betweennatural, rural, and urban/industrial levels of visual quality and the levels of viewer sensitivity.These guidelines show that high sensitivity and moderate visual quality change or moderatesensitivity and a high degree of visual quality change could be considered potentially significant.Where sensitivity and visual change are judged to be moderate or low, potential impacts areconsidered adverse, but not significant. If there is no change in visual quality or sensitivity, thereis little or no assumed impact.
Distance from the proposed project was also considered. Table 3.11.1 summarizes how the visualimpact is related to distance from the project site.
Table 3.11-1: Visual Impact Rating
Distance 0 – 0.5 mile 0.5 mile – 3 miles 3 miles or more
Project Project Site Power Line Project Site Power Line Project Site Power LineVisual Change Moderate Moderate Moderate Low Low LowViewer Sensitivity Moderate Moderate Low Low Low Low
3.11.2 Existing Conditions
Cogeneration Facility, Refinery Interface, and Transmission System
Landscape Setting
The proposed project is located on land formerly used for agriculture. Since the construction ofthe BP Cherry Point Refinery, the land has been left fallow except for the planting of hybridpoplar trees (see Section 3.6). The proposed project site is adjacent to and east of the refinery.The nearest community is Birch Bay, Washington, about 2 miles northwest of the site.
Grandview Road, a two-lane state highway, is located to the north of the proposed cogenerationfacility. An approximately 340-foot vegetated buffer lies between the centerline of GrandviewRoad and the north fence line of the cogeneration facility site. The proposed project site wouldbe entirely within the refinery property.
The refinery, other industrial uses, and agricultural activities characterize the built environmentin the immediate project site. Large stands of evergreen and deciduous trees dominate thelandscape to the east of the project site, screening views of the site from the east. To the north

BP Cherry Point Cogeneration Project 3.11 Visual Resources, Light, and GlareDraft EIS 3.11-4 September 2003
across Grandview Road, a variety of habitat areas have been created and managed by therefinery. Some of these areas are intermittently used for cattle grazing and hay production. Tothe north beyond the fields, a narrow band of mixed deciduous and evergreen forest screensviews of the site from residences to the north. To the northwest, the views are across fields thathave constructed ponds, wetlands, and small stands of trees and shrubs. Jackson Road intersectsGrandview Road about 1 mile west of the project site. About 0.25 mile north of this intersectionalong Jackson Road are a church and some residences. An existing Bonneville transmission lineextends southwest from the Custer substation near I-5 to a point due east of the project site, thensouth toward the Alcoa Intalco Works.
Industrial operations of the refinery and Praxair are to the west and south. Forested areas andopen fields are south of Aldergrove Road. These forested areas and other forested areas west ofthe refinery block views of the project site from the south and southwest outside of theApplicant’s property.
The Strait of Georgia is located more than 2 miles from the proposed project site to thesouthwest. The entrance to Birch Bay State Park is located 1.9 miles to the northwest of the site.This park includes forests, wetlands, and a portion of the shoreline of Birch Bay. An importantfeature of the park is Terrell Creek marsh, a saltwater/freshwater estuary.
Southeast of the project site, stands of deciduous and coniferous trees block views of the projectsite from locations outside the Applicant’s property. Lake Terrell and the 1,500-acre wildlifearea managed by the Washington Department of Fish and Wildlife are almost 2 miles beyondthis area to the southeast. The Lake Terrell area is popular for fishing and hunting. The LakeTerrell area is also an operating farm, with between 80 and 100 acres in use annually to producewinter food for waterfowl and upland game.
Visual Quality
The project site would be located in an industrial zone characterized by existing industrialdevelopment. The BP Cherry Point Refinery dominates the view from the project site lookingwest. Of the two other nearby industrial operations, Praxair can be seen to the south of theproject site. Hybrid poplar trees screen the view of Chemco to the east (see Figure 3.11-1). Thesurrounding undeveloped land is relatively flat with some hybrid poplar tree stands, wetlands,and grasslands. The project site is bordered by existing roads and utility corridors on the north,west, and south.
Overall, the visual quality of the landscape setting would be classified as a mixture ofurban/industrial and rural in character. The natural landscape features and patterns are notvisually distinctive or unusual within the region, and industrial development is intermixed withthis rural landscape. Visual integrity of the landscape is low in the project vicinity, due to thedisturbed nature of the site, a mixture of vegetation types, and surrounding industrialdevelopments, residences, and open space. The landscape does provide some positive visualexperiences, however, such as adjacent natural areas and existing agricultural areas, primarilynorth of Grandview Road and east of Kickerville Road.

BP Cherry Point Cogeneration Project 3.11 Visual Resources, Light, and GlareDraft EIS 3.11-5 September 2003
Custer/Intalco Transmission Line No. 2
Landscape Setting
The Bonneville transmission line lies between approximately 1/2 mile and 4 miles east of theproject site. As such, it has similar relationships to local and regional features, but is set in amosaic of farmland and mixed deciduous and evergreen forest. Several rural residences arescattered throughout the area. The existing Bonneville transmission line extends southwest fromthe Custer substation near I-5 through this area to a point due east of the project site, then southtoward the Alcoa Intalco Works.
Visual Quality
In contrast to the project site, the Bonneville transmission line to be modified under Options 2aand 2b is located within a largely rural setting characterized by grazing, hay production, scatteredfarm buildings and residences, and forested areas.
Overall, the visual quality of the landscape setting would be classified as a mixture ofurban/industrial, rural, and natural in character. The landscape features and patterns are notvisually distinctive or unusual. Visual integrity of the landscape is slightly greater than thecogeneration facility area due to fewer industrial sites.
3.11.3 Impacts of the Proposed Action
Cogeneration Facility, Refinery Interface, and Transmission System
Construction
In general, visual impacts on the overall landscape setting resulting from construction at thecogeneration facility are expected to be low to moderate. The size of the facility (33 acres) isrelatively small compared to existing and ongoing land disturbances created by the refinery.Prior to construction, some of the trees in the buffer zone on the south side of Grandview Roadwould be removed, leaving a partially unobstructed view of the facility for travelers along thatroad. Construction activities would be visible from this corridor on Grandview Road, but notvisible from residential locations. The temporary visual impacts from construction of thetransmission link to the Bonneville lines would likely be low to moderate. Farm buildings and aresidence are located along Kickerville Road 500 feet east of the connection point between thetransmission link and the Bonneville lines. Clearing of the corridor and installation of severaltowers could be viewed temporarily while the transmission link is under construction.
Operation
When construction is complete, the area along the south side of Grandview Road would bereplanted with trees to help screen the site from the road. South of the replanted area would be aforested wetlands mitigation area. Once constructed, the cogeneration facility is expected tointroduce low to moderate visual impacts, depending on the viewer type and viewing distance.

BP Cherry Point Cogeneration Project 3.11 Visual Resources, Light, and GlareDraft EIS 3.11-6 September 2003
The facility would be visually compatible with the industrial development already existing at therefinery, Chemco, and Praxair. The form, color, and scale of buildings would be similar tonearby industrial/warehouse development.
Occasionally, a water droplet plume related to operation of the cooling tower at the facility maybe visible. The visibility of the plume would depend on the ambient temperature and relativehumidity. The cooling tower’s location would partially mitigate the visibility of the plume. On avery cold day, it may be possible to see water vapor from the HRSG exhaust stacks because ofthe moisture in the flue gas condensing as it contacts and mixes with the cold air outside thestacks. Similar water vapor is produced by the refinery's existing boilers and heaters on colddays. Plumes would be seen from several locations as noted in the descriptions of the viewpoints.
Visual impacts related to the transmission towers and lines linking the cogeneration facilitywould likely be low. Only several towers would be visible within the context of forest andexisting Bonneville towers.
Viewpoints
To analyze potential visual impacts, 15 locations were selected as viewpoints that might affectall three types of viewers. Figure 3.11-1 shows the location of the viewpoints. The followingsections summarize the existing visual conditions and potential viewer sensitivity at each of theselected viewpoints. For the purposes of this subsection, the project includes the cogenerationfacility and the refinery interface unless otherwise noted. The transmission systems, both theBonneville lines and the connector from the Bonneville lines to the project, are treated asseparate entities and only discussed where towers and lines would be visible from a particularviewpoint.
• Viewpoint 1 (Intersection of Brown and Kickerville Roads). This viewpoint was selectedbecause it is near the closest residences and the Whitehorn Fire Hall. Views at thisintersection currently include a pasture to the northwest, beyond which is a deeply forestedarea, a dairy to the northeast, and residences to the southeast and southwest. From thislocation, residents currently have no view of the refinery or location of the proposed projectbecause of the forested area to the west of the viewpoint. The residents would be consideredto have moderate sensitivity. However, there would be no visual impacts from thisintersection.
• Viewpoint 2 (Intersection of Hewleg and Jackson Roads). This viewpoint was selectedbecause it is the entrance to Birch Bay State Park and is near Beachwood Park. Currently, itis possible to see a portion of the stacks associated with the refinery (see Figure 3.11-2).Depending on the time of the year and the presence of vegetation, it may be possible to seeupper portions of the proposed cogeneration facility and the water droplet plume from thecooling tower. The sensitivity of travelers at this location is moderate. Because the view ofthe proposed project site may be obscured by vegetation for much of the year from thislocation, it is considered to have low impacts. Construction impacts would also be low.
• Viewpoint 3 (Jackson Road and Birch Bay Community Church). The Birch Bay CommunityChurch is located on Jackson Road. From the parking lot of the church, it is possible to seethe higher elevation equipment at the refinery, and portions of the water droplet plume from

BP Cherry Point Cogeneration Project 3.11 Visual Resources, Light, and GlareDraft EIS 3.11-7 September 2003
Figure 3.11-1

BP Cherry Point Cogeneration Project 3.11 Visual Resources, Light, and GlareDraft EIS 3.11-8 September 2003
Figure 3.11-2: Existing and Simulated Views Viewpoint 2

BP Cherry Point Cogeneration Project 3.11 Visual Resources, Light, and GlareDraft EIS 3.11-9 September 2003
the cooling tower may also be visible depending on meteorological conditions. Theintervening vegetation is low grass up to Grandview Road, beyond which tall forested areasare present (see Figure 3.11-3). Based on the viewer type, traffic volume, and viewing range,visual sensitivity for visitors to the church or southbound travelers along this section ofJackson Road is considered moderate. Potential visual impacts are considered to be low.Construction impacts would also be low.
• Viewpoint 4 (Blaine Road North of the Project Site). This viewpoint is on Blaine Road,which is primarily used by local residents and people conducting business in the surroundingarea. No residential development is present in this location. A viewer traveling south onBlaine Road would see the proposed project and transmission system at this location andwould observe it for approximately 0.5 mile before stopping at the corner of Blaine Road andGrandview Road. At this intersection, the viewer would either turn east or west. If turningeast, the viewer would continue to observe the proposed project and transmission system forapproximately another 0.25 mile. This view would have the longest duration of all views ofthe project site, but since it is in an existing industrial setting and most viewers are travelingby automobile, the visual sensitivity is considered low. See Figure 3.11-4 for a visualrepresentation from the corner of Blaine Road and Grandview Road.
• Viewpoint 5 (Intersection of Kickerville and Aldergrove Roads). This intersection wasevaluated because from this viewpoint a traveler on both roads would see tall trees, powerlines, various signs, and drainage features for the streets. No residential or industrial featuresare visible from this location. There would be no visual impacts, either from construction oroperation, on travelers or residents in this location.
• Viewpoint 6 (Praxair Facility on Aldergrove Road). The primary view at this location is thePraxair operation next to Aldergrove Road. The dominant existing view from this location isof the refinery. The visual sensitivity for viewers, including travelers and employees of theindustrial facilities, at this location is low. No significant visual impact from this locationwould occur during construction or operation.
• Viewpoint 7 (Intersection of Aldergrove and Jackson Roads). This location is approximately8,000 feet from the proposed project at the southwest corner of the refinery’s industrialboundary. The view from this location was evaluated because it is a public intersection wherea traveler would stop; however, neither the refinery nor the proposed project site is visible atthis location. The visual sensitivity of these travelers is low. No visual impact from thislocation would occur, either during construction or operation.
• Viewpoint 8 (Puget Sound Energy Peaking Station on the West Side of Jackson Road).Because of the extensive, tall vegetation on this portion of the refinery property, very fewviews of the refinery are possible from this viewpoint. Travelers on this road would primarilybe involved with local industrial commerce. Therefore, the visual sensitivity of thesetravelers is low. Because the proposed project would not be visible from this location, novisual impact will occur either during construction or operation.
• Viewpoint 9 (Intersection of Grandview Road and Jackson Roads). This viewpoint wasselected because it is a major intersection for travelers. Viewers at this location would beclassified as moderately sensitive. From this location, the exhaust stacks of the refinery arenot visible because of extensive, tall vegetation. Because the proposed project would not bevisible from this location, no visual impact is anticipated during construction or operation.
• Viewpoint 10 (Intersection of Point Whitehorn and Grandview Roads). This viewpoint wasselected because residences are present on the north side of Grandview Road at this location.

BP Cherry Point Cogeneration Project 3.11 Visual Resources, Light, and GlareDraft EIS 3.11-10 September 2003
Viewers at this location would have a high sensitivity to visual impacts. Neither the refinerynor the proposed project site is visible from this viewpoint. Therefore, no visual impacts ontravelers or residents are anticipated at this viewpoint, either during construction andoperation.
• Viewpoint 11 (Main Entrance to Birch Bay State Park). Viewers at this location would havea high sensitivity to visual impacts. However, because of the trees present in the park, nostructure outside the park, including structural features at the refinery and proposed projectsite, are discernible. Therefore, no visual impacts are anticipated at this location duringconstruction or operation.
• Viewpoint 12 (Residential Development on Bay Road). This viewpoint is located at theresidential development approximately 1 mile north of the proposed project site. Viewers atthis location are of moderate sensitivity. The view from this location includes tall vegetationto the south and other features associated with residential development. No features of therefinery or of the proposed project site are visible at this location. Therefore, no visualimpacts are anticipated at this location during construction and operation.
• Viewpoint 13 (Intersection of Bay and Kickerville Roads). This viewpoint is locatedapproximately 1 mile northwest of the project site and was selected because of its proximityto residential areas. Travelers at this intersection may be recreational visitors, residents,and/or employees of the local industrial facilities. Because of the viewpoint location, viewerswould have moderate sensitivity. Based on its distance from the site and the tall vegetation tothe south and southwest, no features of the proposed project would be discernible. Therefore,no visual impacts are anticipated at this location during construction and operation.
• Viewpoint 14 (Intersection of Grandview Road and the Railroad Tracks). At this viewpoint,westbound travelers on Grandview Road slow down because of the railroad tracks and areclose to the industrial operation of Chemco. Accordingly, viewers at this location are ofmoderate sensitivity. The refinery is not visible. However, with the construction of theproposed project, some of the tree line along the south side of Grandview Road may beremoved. This tree removal would not likely make the refinery or the proposed projectvisible to viewers at this location. Therefore, no visual impacts are anticipated at this locationduring construction and operation.
• Viewpoint 15 (Kickerville Road between Brown and Grandview Roads). This viewpoint wasselected because of its proximity to the proposed 230-kV transmission lines that wouldconnect the cogeneration facility to Custer/Intalco Transmission Line No. 2. Viewers at thislocation are of moderate sensitivity. Travelers at this viewpoint can see barns to the south andthe Chemco industrial plant to the north. Travelers would be able to see a tall transmissiontower constructed to the east of the existing tree line (see Figure 3.11-5). The corridor wouldbe partially obstructed by other trees and vegetation, depending on the location of thetraveler. The refinery could be visible for very short durations. However, the proposedproject would not be visible. During operation, the visual impact of the transmission systemlines and towers at this location is considered to be low based on viewer sensitivity, distance,and the presence of pre-existing farm buildings and industrial structures. Duringconstruction, however, the visual impact may be considered moderate because of an increasein activity near the viewpoint. This increase would be related to construction and wouldlikely consist of material stockpiles, construction-related traffic, and installation of newtowers and lines. Construction-related impacts, however, would be temporary.

BP Cherry Point Cogeneration Project 3.11 Visual Resources, Light, and GlareDraft EIS 3.11-11 September 2003
• Figure 3.11-3: Existing and Simulated Views Viewpoint 3

BP Cherry Point Cogeneration Project 3.11 Visual Resources, Light, and GlareDraft EIS 3.11-12 September 2003
Figure 3.11-4: Existing and Simulated Views Viewpoint 4
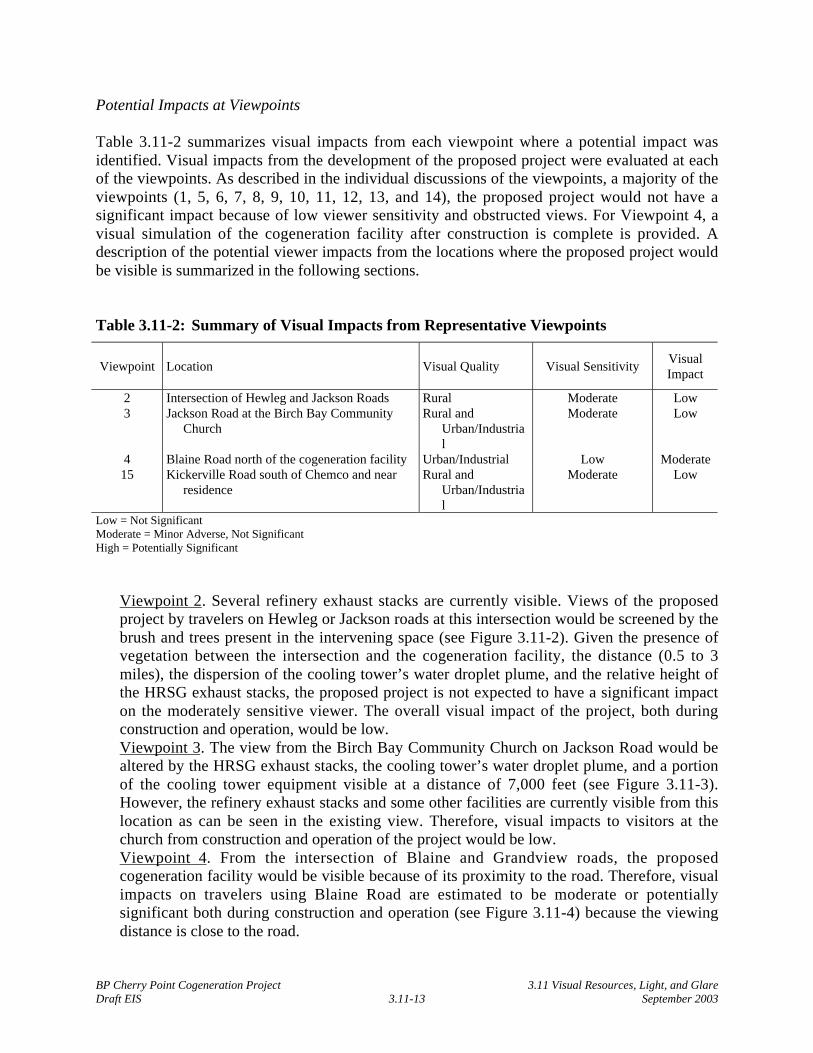
BP Cherry Point Cogeneration Project 3.11 Visual Resources, Light, and GlareDraft EIS 3.11-13 September 2003
Potential Impacts at Viewpoints
Table 3.11-2 summarizes visual impacts from each viewpoint where a potential impact wasidentified. Visual impacts from the development of the proposed project were evaluated at eachof the viewpoints. As described in the individual discussions of the viewpoints, a majority of theviewpoints (1, 5, 6, 7, 8, 9, 10, 11, 12, 13, and 14), the proposed project would not have asignificant impact because of low viewer sensitivity and obstructed views. For Viewpoint 4, avisual simulation of the cogeneration facility after construction is complete is provided. Adescription of the potential viewer impacts from the locations where the proposed project wouldbe visible is summarized in the following sections.
Table 3.11-2: Summary of Visual Impacts from Representative Viewpoints
Viewpoint Location Visual Quality Visual SensitivityVisualImpact
2 Intersection of Hewleg and Jackson Roads Rural Moderate Low3 Jackson Road at the Birch Bay Community
ChurchRural and
Urban/Industrial
Moderate Low
4 Blaine Road north of the cogeneration facility Urban/Industrial Low Moderate15 Kickerville Road south of Chemco and near
residenceRural and
Urban/Industrial
Moderate Low
Low = Not SignificantModerate = Minor Adverse, Not SignificantHigh = Potentially Significant
• Viewpoint 2. Several refinery exhaust stacks are currently visible. Views of the proposedproject by travelers on Hewleg or Jackson roads at this intersection would be screened by thebrush and trees present in the intervening space (see Figure 3.11-2). Given the presence ofvegetation between the intersection and the cogeneration facility, the distance (0.5 to 3miles), the dispersion of the cooling tower’s water droplet plume, and the relative height ofthe HRSG exhaust stacks, the proposed project is not expected to have a significant impacton the moderately sensitive viewer. The overall visual impact of the project, both duringconstruction and operation, would be low.
• Viewpoint 3. The view from the Birch Bay Community Church on Jackson Road would bealtered by the HRSG exhaust stacks, the cooling tower’s water droplet plume, and a portionof the cooling tower equipment visible at a distance of 7,000 feet (see Figure 3.11-3).However, the refinery exhaust stacks and some other facilities are currently visible from thislocation as can be seen in the existing view. Therefore, visual impacts to visitors at thechurch from construction and operation of the project would be low.
• Viewpoint 4. From the intersection of Blaine and Grandview roads, the proposedcogeneration facility would be visible because of its proximity to the road. Therefore, visualimpacts on travelers using Blaine Road are estimated to be moderate or potentiallysignificant both during construction and operation (see Figure 3.11-4) because the viewingdistance is close to the road.

BP Cherry Point Cogeneration Project 3.11 Visual Resources, Light, and GlareDraft EIS 3.11-14 September 2003
• Viewpoint 15. The 230-kV transmission line connection from the cogeneration facility to theexisting Bonneville power grid would involve the installation of tall steel lattice towers,which would be located in a corridor through the forested area on the east side of therefinery-owned land. These structures would be visible to travelers along Kickerville Roadalong with the Chemco facility and from various barns and sheds associated with farmanimals (see Figure 3.11-5). No other project-related structures would be visible. Based onthe viewer type, traffic volume, and viewing range, visual impact related to the transmissiontowers for travelers along Kickerville Road would be low for operation and moderate forconstruction
Visual Contrast
During construction of the proposed project, grass and other vegetation would be stripped awayas part of grading operations. This activity would be visible to travelers on Grandview or Blaineroads.
The heights of project components following construction are summarized in Table 3.11-3.Visible components would include the gas turbines, the steam turbine enclosure, liquid storagetanks, the electrical switchyard, the cooling tower, and the HRSG exhaust stacks. Thecomponents would be painted gray.
Once completed, the proposed project would appear to be similar to the adjacent refinery,thereby presenting little visual contrast. Metal buildings with vertical and horizontal elements,colors, and large proportional sizes would be similar to those constructed at the refinery site.
Table 3.11-3: Heights of Project Components
Structure Height
Administration building 30 feetSteam turbine enclosure 50 feetCombustion turbine equipment 75 feetWater tank (demineralization) 50 feetCooling tower 60 feetHRSGs 95 feetHRSG exhaust stacks 150 feet
Light and Glare
The area surrounding the cogeneration facility would be illuminated at night. Lighting wouldconsist of low-level lighting around exit areas (minimum 2-foot candles) and general outsideareas (0.2- to 5-foot candles) including ground-level operating areas, stairs and platforms,roadways, storage areas, and parking areas. This lighting would be provided for purposes ofgeneral operator access and safety under regular operating conditions. The precise number andplacement of light fixtures have not yet been determined. However, outdoor lights would be a

BP Cherry Point Cogeneration Project 3.11 Visual Resources, Light, and GlareDraft EIS 3.11-15 September 2003
Figure 3.11-5

BP Cherry Point Cogeneration Project 3.11 Visual Resources, Light, and GlareDraft EIS 3.11-16 September 2003
combination of pole-mounted and structure-mounted lights. Outside lighting on the exterior ofbuildings and ancillary equipment would likely be placed above doorways. Lighting angleswould vary depending on fixture wattage, light patterns, and light levels. No high-mast, wide-area lighting would be used.
Spot lighting would be provided to illuminate operating equipment, where needed. This lightingwould be higher in intensity than general outside lighting (up to 10-foot candles), but would belimited to specific areas and occasional usage. This lighting could be adjusted to minimize lightspillover or direct glare in response to specific site conditions.
Emergency lighting would be provided for workers to find exits and continue critical activitiesduring power failures or emergency conditions. These instances are anticipated to be infrequent.Incandescent emergency lighting would be provided for the gas turbine, steam turbine, controlroom, and other operations buildings.
The steel HRSG exhaust stacks would be 150 feet high. This height would be below the aircraftlighting requirements of the Federal Aviation Administration (FAA). The stacks would haveplatform lighting at emission monitoring locations, which would only be used during equipmentinspection and maintenance.
Light and glare impacts on neighboring properties are expected to be minimal. During the day,potential glare impacts would be minimal because of the planned use of non-reflective gray onexterior surfaces. The potential for adjusting light directions and the use of supplemental lightshields/vegetation to provide additional screening, if necessary, would minimize light spillover atnight. No glare impacts are anticipated for drivers on Grandview or Blaine roads. As anindustrial land use, the cogeneration facility is expected to make a slight contribution to overallambient light levels in the immediate vicinity. Because of the flat topography of the site, somelights may be seen by distant or elevated viewers. Overall, potential impacts from lighting wouldbe negligible.
Custer/Intalco Transmission Line No. 2
A component of the cogeneration project is the interconnection with the existing Bonnevilletransmission system. One option known as the Remedial Action Scheme would involveinstallation of new electrical equipment at nearby substations. No visual impacts would occur asa result of this action. The other option would be to reconstruct Custer/Intalco Transmission LineNo. 2 to safely handle the additional power generated by the cogeneration facility. Options 2aand 2b have been identified as part of the second option, and involve two types of towers. UnderOption 2a, 120-foot-high, double-circuit steel lattice towers would be spaced 1,150 feet apart.Option 2b would involve the use of 120-foot-high, double-circuit steel poles spaced 900 feetapart. Either option would replace existing single-circuit steel lattice towers 85 feet high and1,150 feet apart (Figure 1-2).
Viewer sensitivity along the route varies from low to high. Sensitivity of viewers is low in thearea of the Custer substation at the east end of the project site. Low to moderate viewer

BP Cherry Point Cogeneration Project 3.11 Visual Resources, Light, and GlareDraft EIS 3.11-17 September 2003
sensitivity occurs along Grandview Road south of the transmission lines. Viewer sensitivity ishigh at residences along the route where the transmission lines interrupt many of the views.
Construction
Impacts to visual quality would vary depending on viewer sensitivity. While temporary, impactsare likely to occur as a result of tower replacement, and would consist of construction equipment,material stockpiles, and temporary buildings on or adjacent to the site.
Operation
Option 2a
Under Option 2a, the use of larger double-circuit steel lattice towers may result in a slightincrease in effects over the existing towers near residences because of their greater height.
Option 2b
The closer spacing of the double-circuit steel poles that would be used under this option mayreduce the visual effects of individual towers, but the decreased spacing would result in a greaternumber of towers and may offer a slightly greater interruption of views than would the steellattice towers.
Under either option, operational effects of tower and line replacement over most of the routewould have little effect. Near residences, however, the visual effects of the new towers mayincrease slightly. Overall, the visual effects would be low.
Viewpoints
To analyze potential visual impacts of the transmission line modifications, four locations wereselected as viewpoints that might affect all three types of viewers. Figure 3.11-1 shows thelocation of the viewpoints.
The following sections summarize the existing visual conditions and potential viewer sensitivityat each of the selected viewpoints. Photographs showing existing visual conditions andsimulations of potential visual changes associated with the project are included in Appendix C.
• Viewpoint 16. This viewpoint is located where the transmission line crosses Blaine-FerndaleRoad and was selected to represent low viewer sensitivity. The Custer substation and existingtransmission lines are a prominent feature in the viewshed. Based on the viewer type, trafficvolume, and viewing range and small viewsheds, visual impact related to the replacement oftransmission towers for travelers along Blaine-Ferndale Road would be low for operation andmoderate for construction (Appendix C, Figure A-2, top).
• Viewpoint 17. Although existing transmission lines interrupt north and east viewsheds, viewsare primarily of rural and natural features, pastoral landscapes with mountains in thedistance. Based on viewer type, viewing range, and quality of the view, the visual effects

BP Cherry Point Cogeneration Project 3.11 Visual Resources, Light, and GlareDraft EIS 3.11-18 September 2003
from the project could be high. Because transmission lines are already visible from thisviewpoint, the project would have a low visual impact (Appendix C, Figure A-2, bottom).
• Viewpoint 18. Existing transmission lines also interrupt the view west from the Bannermanproperty, and views are primarily of rural pastoral landscapes. Based on viewer type, viewingrange, and quality of the view, the visual effects from the project, as with Viewpoint 17,could be high. Because transmission lines are already visible from this viewpoint, the projectwould have a low visual impact (Appendix C, Figure A-3, top).
• Viewpoint 19. Viewer sensitivity along Grandview Road is low to moderate as a result of thetransmission lines being intermittently visible only from about 60% of the road. Views fromthe road encompass rural and urban industrial features. As a result, low visual impacts ontravelers from the project would be expected (Appendix C, Figure A-3, bottom).
Potential Impacts at Viewpoints
Visual impacts from the implementation of the proposed tower replacement were evaluated ateach of the viewpoints. Slight increases in effects above existing conditions could occur. SeeAppendix C for simulated views of potential visual changes along the corridor.
Visual Contrast
During construction of the proposed project, removal of grass and other vegetation may occur aspart of gaining vehicle access to towers. This activity may be visible to travelers on GrandviewRoad, Kickerville Road, Blaine-Ferndale Road, and several minor roads in the area. Stockpilesof construction materials may be placed in areas where none now exist. It is unknown ifhelicopters would be used as part of the tower and line replacement effort.
Once completed, the proposed towers would appear to be similar to conditions existing prior totower replacement, thus presenting little visual contrast.
Light and Glare
Because the new towers would not be lighted, no effects from light and glare would occur.
3.11.4 Impacts of No Action
Under the No Action Alternative, the proposed project would not be constructed and existingviews of the project site would be maintained. However, at some time in the future, views to thesite could be altered when the hybrid poplar trees are harvested. Light and glare levels wouldremain the same as existing conditions. Because the land is zoned for industrial uses, futureindustrial development on the project site would likely occur.
3.11.5 Secondary and Cumulative Impacts
When completed, the proposed project will be visually similar to the refinery that has beenpresent on the site for over 30 years. This development will appear as an extension of theexisting refinery with an additional water droplet plume, fencing, signs, roadwork, and

BP Cherry Point Cogeneration Project 3.11 Visual Resources, Light, and GlareDraft EIS 3.11-19 September 2003
landscaping. Because the area surrounding the project site is also zoned for industrial uses,additional development could be anticipated in the future.
In designating the land for industrial uses, Whatcom County considered the visual impact offuture industrial development. In its zoning ordinance, the County requires all new developmentbe set back from public roads. By complying with the zoning regulations, future industrialdevelopment will minimize cumulative visual impacts on workers, travelers, and residents in thearea.
The Applicant has considered cumulative visual impacts by limiting its industrial development tothe area south of Grandview Road near the existing refinery complex. The refinery-owned landnorth of Grandview Road has retained its rural character. The Applicant intends to use this areafor wetlands and other environmental mitigation.
3.11.6 Mitigation Measures
To avoid visual impacts at the closest public viewpoints along Grandview and Blaine roads, theApplicant would undertake the following:
• Prepare and implement a site management plan to minimize overall visual impacts associatedwith construction of the proposed project.
• Cogeneration project elements would be painted gray. This color is intended to reducesurface glare from direct sunlight.
• The cogeneration facility would be located approximately 340 feet south of the centerline ofGrandview Road, creating opportunities to plant screening trees, shrubs, and vines consistentwith final approved landscape designs. In addition, existing trees between the road and thesite would remain, based on the project description.
• Project site lighting would be designed to minimize light spillover and glare.
3.11.7 Significant Unavoidable Adverse Impacts
No significant unavoidable adverse impacts on visual resources are identified.

BP Cherry Point Cogeneration Project 3.12 Population, Housing, and EconomicsDraft EIS 3.12-1 September 2003
3.12 POPULATION, HOUSING, AND ECONOMICS
This section discusses potential impacts and mitigation measures associated with changes inpopulation, the availability of housing, and state and local economic conditions. The analysis inthis section is primarily based on information provided by the Applicant in the ASC (BP 2002,Section 3.12 and Appendix L). Where additional sources of information were used to evaluatethe potential impacts associated with the proposal, those sources have been cited.
3.12.1 Existing Conditions
Study Area
For the purposes of this section, the study area is defined as Whatcom County and SkagitCounty, Washington. The primary focus is on those communities within a 50-mile radius of theproposed cogeneration facility site at Cherry Point. The majority of project construction andoperation workers are expected to commute from within this 50-mile radius.
Communities within the study area include the Lummi Reservation, which lies 5 miles south ofthe project site, and the Nooksack Reservation, 23 miles to the east. The incorporated cities ofBlaine, Ferndale, Bellingham, Everson, and Lynden are within a 25-mile radius, as are the twosmaller cities of Sumas and Nooksack. A number of other unincorporated small communities arefound within commuting distance of the project site. Farther south in Skagit County, a 50-mileradius of the project site includes the cities of Anacortes, Burlington, Mount Vernon, and Sedro-Woolley, as well as a number of smaller incorporated and unincorporated communities.
A number of Canadian jurisdictions also lie within the 50-mile radius of the project site,including the urban centers of Vancouver and Victoria, British Columbia. However, most of thepotential economic and social impacts would likely be experienced in Whatcom and Skagitcounties, rather than in Canadian communities.
Population
Much of the population of Whatcom and Skagit counties is found in the western one-third ofeach county along the Interstate 5 corridor. The eastern two-thirds of both counties is largelydedicated to National Park and National Forest lands and have relatively few permanentresidents. Whatcom County contains 2.8% of Washington State’s population and Skagit Countycontains 1.7%. Table 3.12-1 presents population data for Whatcom and Skagit counties, withWashington State data provided for comparison purposes.
Washington State’s population increased approximately 21.1% from 1990 to 2000, with fastergrowth occurring early in the decade. In Whatcom County, the population growth rate washigher than that of the state at approximately 30.5% during this period with steady annualgrowth. More than 75% of this growth was the result of in-migration, a response to the boomingeconomy of the early 1990s. Skagit County also followed the pattern of high steady growth withnet in-migration accounting for almost 80% of population growth.

BP Cherry Point Cogeneration Project 3.12 Population, Housing, and EconomicsDraft EIS 3.12-2 September 2003
Table 3.12-1: Population Data
JurisdictionPopulation
1990Population
2000% Change
1990-2000 Actual% Change
2000-2010 Forecast% Change
2010-2020 Forecast
Washington State 4,866,663 5,894,121 21.1 12.8 13.5Whatcom County 127,780 166,814 30.5 17.2 17.8
Unincorporated 59,187 76,060 28.5 - -Incorporated 68,593 90,754 32.3 - -
Skagit County 79,545 102,979 29.5 20.2 21.5Unincorporated 37,841 44,506 17.6 - -Incorporated 41,704 58,473 40.2 - -
Source: BP 2002, Appendix L; OFM 2002
Population growth forecasts were last published in 2002. As shown in Table 3.12-1, growth inWhatcom and Skagit counties is expected to continue to outpace that of Washington Statealthough the future rates of growth in the counties and the state are expected to be lower than inthe 1990s. Assuming a construction start date of early 2004, peak construction employmentwould occur in early 2005. At that time the population of Whatcom County is estimated to be180,463. This estimate represents an increase of 13,649 people or 8.2% over the 2000 population(OFM 2002). The cogeneration facility would become fully operational approximately 12months later, early in 2006. At a constant rate of annual growth in Whatcom County of 1.6%, thepopulation is calculated to grow by approximately 2,900 people between 2005 and 2006.
The data on race show that in 2000, whites made up approximately 88.4% and 86.5% of thepopulations in Whatcom and Skagit counties, respectively, as compared to 81.8% forWashington State overall. Representation of other races is generally low across both counties,although Mount Vernon and nearby Burlington are more diverse with a relatively higherproportion of Hispanics compared to other parts of Whatcom and Skagit counties and the rest ofWashington State (BP 2002, Appendix L).
Housing
In 2000, Whatcom County had a total of 73,893 housing units and Skagit County had 42,681.Both counties saw growth in housing stock comparable to population growth over the decade1990-2000, although to a lesser degree for Skagit County compared to Whatcom County.Housing is more likely to be privately owned in both counties and vacancy rates are higher forrental properties than for owned properties. Housing data are presented in Table 3.12-2.
Based on calculations using the above vacancy rates, the total number of vacant units inWhatcom County is 2,572, of which about 1,400 (55%) are in the incorporated communities,including more than 1,000 vacant units in Bellingham. Skagit County has 1,173 vacant units with750 (64%) in incorporated areas.
Over the past decade, housing construction in the study area has kept pace with populationgrowth. Vacancy rates are in excess of the 4% threshold, which represents a balanced condition(BP 2002, Appendix L). Forecasts of slower population growth over the 2001-2020 time framemay somewhat constrain new construction.

BP Cherry Point Cogeneration Project 3.12 Population, Housing, and EconomicsDraft EIS 3.12-3 September 2003
Table 3.12-2: Housing
Jurisdiction
TotalHousing
Units1990
TotalHousing
Units2000
% Change1990-2000
VacancyRate -
Owners
VacancyRate -
Renters
TotalVacantUnits
Owner-Occupied
Renter-Occupied
Washington State 2,032,306 2,451,075 20.6 1.8 5.9 79,694 64.6 35.4Whatcom County 55,742 73,893 32.6 2.2 5.7 2,572 63.4 36.6Skagit County 33,580 42,681 27.1 1.9 4.7 1,173 69.7 30.3Source: BP 2002, Appendix L
In 2000, the average rent in Whatcom County for a two-bedroom unfurnished apartment was$588. Skagit County average rents are not available. The median sales price for existing homes is$151,800 in Whatcom County and $162,000 in Skagit County.
A number of temporary housing options are available in Whatcom County. More than 120facilities are within a 25-mile radius of the project, including at least 21 bed and breakfasts, 15RV parks, and 15 campgrounds. More than 30 hotels and motels are members of theBellingham/Whatcom County Convention and Visitors Bureau; collectively, they haveapproximately 1,700 rooms. About 30 non-member hotels are located in the area as well. Most ofthese facilities offer long-term rates.
Economics
Major Industries and Top Employers
Table 3.12-3 provides employment data by sector for Whatcom and Skagit counties as compiledby the Washington State Employment Security Department. For both counties, the servicessector is the largest based on number of people employed, followed by retail trade, government,and manufacturing. The manufacturing sector experienced large job losses in 2001, particularlyin Whatcom County.
Washington State Economic Security Department projections on employment growth forWhatcom County indicate that the services and government sectors will grow the fastest at ratesof more than 16% over the five-year period, 1998-2003. Because these sectors employ largenumbers of people, they will grow the most in absolute terms as well. Construction and retail,two sectors closely aligned with population growth, are forecast to grow approximately 10% forthis five-year period, more or less equal to expected population growth. Other economic sectorswill likely see growth rates of less than 5%.
The BP Cherry Point Refinery is one of the top employers in Whatcom County with 400proprietary employees and an average of 400 contract employees. The refinery’s use of contractmaintenance employees peaks at approximately 2,400 during major refinery maintenanceactivities every few years. Other significant employers in Whatcom County are St. JosephHospital (1,700), Western Washington University (1,292), Bellingham School District (1,200),

BP Cherry Point Cogeneration Project 3.12 Population, Housing, and EconomicsDraft EIS 3.12-4 September 2003
Alcoa Intalco Works (925), and Whatcom County government (700). The employment figures inparentheses include both full- and part-time employees.
Significant full- and part-time employers in Skagit County include Affiliated Health Services(1,039), Skagit Valley College (790), Mount Vernon School District (638), Sedro-WoolleySchool District (590), Draper Valley Farms (500), Island Health Northwest (466), Brown andCole, Inc, retail food (410), Skagit County government (408), Anacortes School District (374),and Skagit Valley Medical Center (354). These largest employers employ approximately 5,500people, a third of whom work part time. The above employers account for about 10% of SkagitCounty employment.
Table 3.12-3: Employment by Sector, 1999
Employment % of Total EmploymentSector Whatcom Skagit Whatcom Skagit Washington
Total Private 77,308 45,425 87.0 84.3 84.3Agriculture, Forestry, and Fishing 2,486 1,999 2.8 3.7 1.8Construction 8,457 4,519 9.5 8.4 6.3Manufacturing 10,135 5,838 11.4 10.8 11.3Transportation and Public Utilities 3,408 2,154 3.8 4.0 4.7Wholesale Trade 4,035 1,836 4.5 3.4 4.9Retail Trade 17,402 11,162 19.6 20.7 17.1Finance, Insurance, and Real Estate 6,179 3,445 7.0 6.4 7.8Services 25,206 14,472 28.4 26.9 30.4Government 11,505 8,470 13.0 15.7 15.7Total Employment 88,813 53,895 100.0 100.0 100.0Source: BP 2002, Appendix L
Employment and Wages
Selected employment and income data compiled by the Washington State Employment SecurityDepartment are presented in Table 3.12-4. Unemployment rates fluctuated in Whatcom andSkagit counties during the 1990s. Fluctuations arise because almost half of private sectorworkers are in businesses that are seasonal, cyclical, or suffering from long-term decreases inemployment.
Whatcom County experienced an unemployment rate of 5.7% in 2000, which representsapproximately 4,500 unemployed people. More recently, unemployment has risen in 2001,surpassing 6% in Whatcom County. Skagit County has an unemployment rate of 6.9%, whichrepresents approximately 3,500 unemployed people. In both counties, although theunemployment rate has generally fallen over the past decade, rapid population growth has meantthat the fall was not sufficient enough to reduce the number of unemployed people. Incomparison, the statewide rate for Washington was 5.2% in 2000, and the total number ofunemployed has fallen.

BP Cherry Point Cogeneration Project 3.12 Population, Housing, and EconomicsDraft EIS 3.12-5 September 2003
Table 3.12-4: Employment and Income, 1990-2000
PopulationUnemployment
RateNumber of
UnemployedAverage
Annual WageMedian Annual
Household Income
Washington State1991 5,021,335 6.4 162,290 23,936 34,3742000 5,894,121 5.2 158,458 37,038 50,152% Growth 17.4 - -2.4 54.7 45.4Whatcom County1991 132,576 6.5 4,472 19,866 32,0012000 166,814 5.7 4,650 26,295 41,300% Growth 25.8 - 4.0 32.4 29.1Skagit County1991 82,882 8.3 3,336 19,481 30,7482000 102,979 6.9 3,560 26,634 41,585% Growth 24.2 - 6.7 36.7 35.2Source: BP 2002, Appendix L
The average annual wage (mean earnings per job per capita) in 2000 was $26,295 in WhatcomCounty and $26,634 in Skagit County, both lower than the average of $37,038 for WashingtonState. The pattern is repeated for median household income (the income at which half of thehouseholds have a higher income and half have a lower income). Both average wages andmedian household income increased steadily over the decade for both counties, although at asomewhat slower rate than they did for Washington State as a whole.
3.12.2 Impacts of the Proposed Action
In the following analyses of construction and operational impacts, the components of theproposed action are considered together. The nature of potential population, housing, andeconomic impacts are such that the overall effect on these elements of the environment needs tobe considered together to adequately evaluate their significance.
Construction
Population
To estimate the number of workers that would relocate to the study area, the availability of locallabor was examined. This approach compares the number of people currently employed by tradewithin the local labor pool with the number required during construction of the project. Wherethe construction requirements for a specific trade approach or exceed the number currentlyemployed locally, some relocation to offset potential labor shortages can be assumed. Table3.12-5 provides estimated labor requirements by trade for construction of the project relative tothe total number employed within each trade in the study area in 2000.
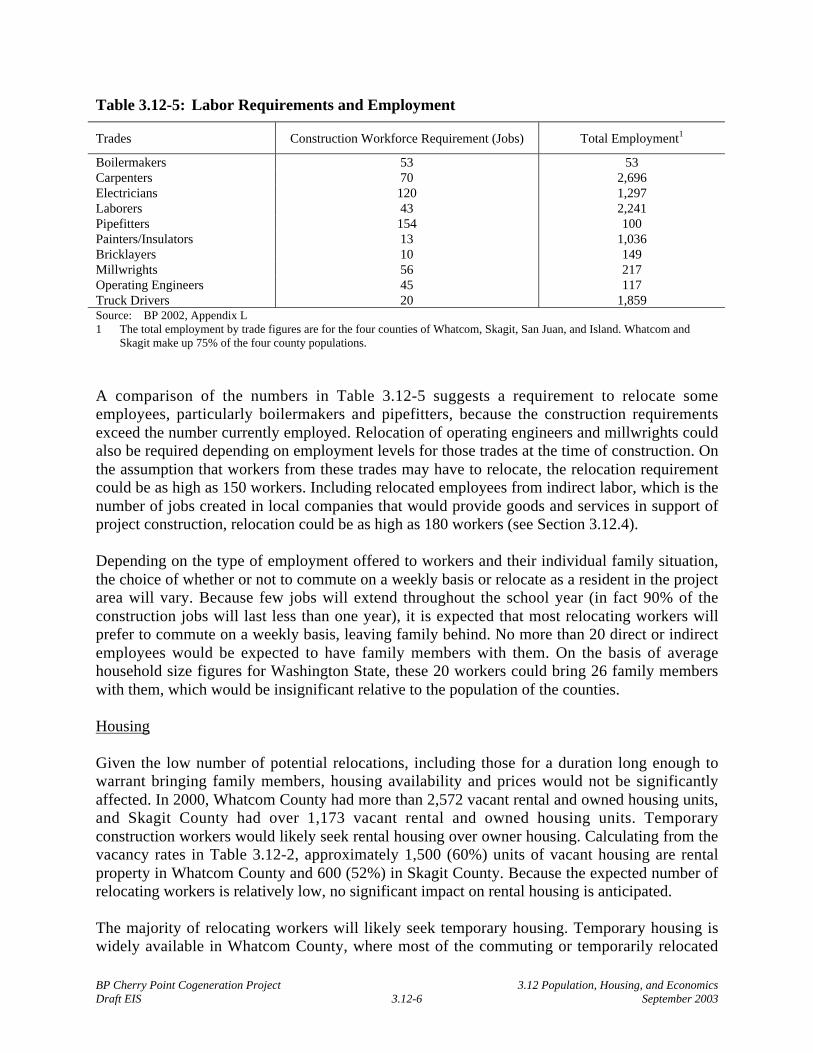
BP Cherry Point Cogeneration Project 3.12 Population, Housing, and EconomicsDraft EIS 3.12-6 September 2003
Table 3.12-5: Labor Requirements and Employment
Trades Construction Workforce Requirement (Jobs) Total Employment1
Boilermakers 53 53Carpenters 70 2,696Electricians 120 1,297Laborers 43 2,241Pipefitters 154 100Painters/Insulators 13 1,036Bricklayers 10 149Millwrights 56 217Operating Engineers 45 117Truck Drivers 20 1,859Source: BP 2002, Appendix L1 The total employment by trade figures are for the four counties of Whatcom, Skagit, San Juan, and Island. Whatcom and
Skagit make up 75% of the four county populations.
A comparison of the numbers in Table 3.12-5 suggests a requirement to relocate someemployees, particularly boilermakers and pipefitters, because the construction requirementsexceed the number currently employed. Relocation of operating engineers and millwrights couldalso be required depending on employment levels for those trades at the time of construction. Onthe assumption that workers from these trades may have to relocate, the relocation requirementcould be as high as 150 workers. Including relocated employees from indirect labor, which is thenumber of jobs created in local companies that would provide goods and services in support ofproject construction, relocation could be as high as 180 workers (see Section 3.12.4).
Depending on the type of employment offered to workers and their individual family situation,the choice of whether or not to commute on a weekly basis or relocate as a resident in the projectarea will vary. Because few jobs will extend throughout the school year (in fact 90% of theconstruction jobs will last less than one year), it is expected that most relocating workers willprefer to commute on a weekly basis, leaving family behind. No more than 20 direct or indirectemployees would be expected to have family members with them. On the basis of averagehousehold size figures for Washington State, these 20 workers could bring 26 family memberswith them, which would be insignificant relative to the population of the counties.
Housing
Given the low number of potential relocations, including those for a duration long enough towarrant bringing family members, housing availability and prices would not be significantlyaffected. In 2000, Whatcom County had more than 2,572 vacant rental and owned housing units,and Skagit County had over 1,173 vacant rental and owned housing units. Temporaryconstruction workers would likely seek rental housing over owner housing. Calculating from thevacancy rates in Table 3.12-2, approximately 1,500 (60%) units of vacant housing are rentalproperty in Whatcom County and 600 (52%) in Skagit County. Because the expected number ofrelocating workers is relatively low, no significant impact on rental housing is anticipated.
The majority of relocating workers will likely seek temporary housing. Temporary housing iswidely available in Whatcom County, where most of the commuting or temporarily relocated

BP Cherry Point Cogeneration Project 3.12 Population, Housing, and EconomicsDraft EIS 3.12-7 September 2003
workers are expected to seek accommodation. As described in Section 3.12.1, more than 120facilities are located within a 25-mile radius of the project site. With an estimated total of 4,000rooms or other types of short-term accommodation in the project area, 180 relocating workersseeking temporary housing would represent about 5% of supply. This figure is well withintypical vacancy rates for temporary housing facilities in Whatcom County of more than 10% (BP2002, Appendix L), even in the peak summer months. The supply of temporary housing is,therefore, unlikely to be significantly affected.
Economics
Construction Workforce
The Applicant has developed an estimate of preliminary staffing requirements for theconstruction phase of the project. During construction, which would last about 25 months,monthly employment on the site would average 372 people, with peak employment of 706individuals. The project would have a total labor requirement of 8,566 person-months, equivalentto 714 jobs of one-year duration.
The labor force would vary from month to month, rising fairly slowly from an initial coreconstruction team of 45 people. The workforce numbers would then rise as increasing numbersof craft workers are needed. Over a 12-month period, workforce numbers are expected to peak at706, and then fall over the remaining 11 months until the last month of construction when only23 people would be employed on the site. Table 3.12-6 provides information on labor forcerequirements by trade. The highest craft demand will be for pipefitters, electricians, carpenters,millwrights, and boilermakers, in that order.
Table 3.12-6: Total Workforce Demand by Trade
Trade Project Workforce (Person-Months) Project Workforce (Number of Jobs)
Boilermakers 632 53Carpenters 845 70Electricians 1,441 120Ironworkers 329 27Laborers 512 43Pipefitters 1,851 154Painters/Insulators 159 13Bricklayers/Masons 117 10Millwrights 671 56Operating Engineers 534 45Truck Drivers 236 20Mechanical 110 9Civil 146 12Field Staff 983 82Total 8,566 714Source: BP 2002, Appendix L

BP Cherry Point Cogeneration Project 3.12 Population, Housing, and EconomicsDraft EIS 3.12-8 September 2003
In 2000, 8,457 construction workers were employed in Whatcom County and 4,519 wereemployed in Skagit County, for a total of almost 13,000. The average construction workforce forthe project at 372 workers is equal to 2.9% of employed construction workers in the twocounties. The peak workforce during construction of the proposed project would be 706 workers,which is equal to 5.5% of employed construction workers in the two counties. Given the seasonalnature of the construction work, the locally available construction workforce in Whatcom andSkagit counties would be sufficient, pending the availability of specific skills.
Wages
Although actual wage costs would not be known until the Applicant selects its contractor, it isexpected that wage rates would approximate typical wages paid for various construction trades inWhatcom County. Table 3.12-7 presents data on average wages in Whatcom County for thosetrades that would be required for construction of the project. Average wages for WashingtonState are also presented for comparison purposes.
Table 3.12-7: Mean Hourly and Annual Wages by Trade
Whatcom WashingtonTrade Mean (hr) Mean (yr) Mean (hr) Mean (yr)
Project Jobs Total Wages
Boilermakers 23.66 49,200 24.16 50,260 53 2,591,200Carpenters 18.11 37,670 19.50 40,560 70 2,652,596Electricians 20.61 42,880 21.99 45,740 120 5,149,173Ironworkers - 42,646 21.58 44,890 27 1,169,197Laborers 16.95 35,250 16.71 34,750 43 1,504,000Pipefitters 21.14 43,970 22.91 47,650 154 6,782,373Painters/Insulation Workers 17.12 35,610 16.08 33,440 13 471,833Bricklayers/Masons - 46,712 23.64 49,170 10 455,437Millwrights - 42,190 21.35 44,410 56 2,359,096Operating Engineers 17.82 37,080 21.85 45,440 45 1,650,060Teamsters 15.59 32,420 16.63 34,600 20 637,593Mechanical 19.84 41,261 21.45 44,609 9 378,226Civil 19.84 41,261 21.45 44,609 12 502,009Field Staff 23.66 49,200 27.44 57,080 82 4,030,300Total 714 30,333,093Average Wage 18.19 37,830 20.15 41,920 42,493Source: BP 2002, Appendix L
Local Fiscal Effects
Of the $465 million in estimated direct construction costs, approximately $30 million would bepaid as wages. The percentage of the $30 million wage that would be spent in Whatcom andSkagit counties would be strongly related to the percentage of the workforce that resides in thetwo counties. Because most of the construction workers would be recruited from within the studyarea, approximately $19 to $20 million of wages would be spent locally by construction workers.

BP Cherry Point Cogeneration Project 3.12 Population, Housing, and EconomicsDraft EIS 3.12-9 September 2003
Sources of equipment, materials, and services for the project would be determined when thecontractor is selected and materials contracts are awarded. However, given the nature of theproject, some broad conservative estimates can be provided.
The equipment costs for the project, estimated to be approximately $300 million, would likely bespent outside of the study area because the vendors of electrical generation and associatedequipment are located elsewhere in the U.S.
The balance of direct construction costs, approximately $135 million, would be spent on servicesand materials related to architectural design, engineering, construction of civil works, buildingmaterials, and construction management. Possibly 10%, or $13 million, would be spent withinthe project area and throughout Washington State.
Tax Revenue
Tax revenue from construction of the project would accrue to Whatcom County and WashingtonState. The state imposes a 6.5% sales or use tax on products sold or used within the state, andWhatcom County imposes an additional 1.1% tax. Because the project is in an unincorporatedarea, the full amount of this 1.1% tax would go to county revenue. This total of 7.6% tax on the$300 million in equipment costs is equivalent to $22.8 million, of which $3.3 million would flowto Whatcom County and the balance to Washington State.
Of the $165 million estimated costs for services and materials associated with construction,approximately $65 million would be used to pay for materials. At the combined 7.6% sales taxrate, $4.9 million in revenue would be generated, of which $700,000 would accrue to WhatcomCounty and the balance would flow to the state.
The fiscal benefit to Whatcom County would be slightly higher than the $4 million from theabove calculations. State revenue, which includes the taxes paid on this project, is in partdistributed to counties according to annual plans at the state level. Also, part of the expendituresby construction workers as well as by individuals benefiting from indirect employment creation,whether resident or commuting, would be subject to sales tax. The state also would benefit fromtaxes that are embedded in the price of consumer items purchased with increased incomesresulting from the project.
Sales and use tax revenue from the purchase of project construction materials and from theexpenditures of construction workers are a significant one-time benefit to Whatcom County andthe state. Total sales and use taxes in Whatcom County are expected to be $8.2 million in 2002.Sales and use tax revenue generated from the project would represent an almost 25% increase inthis tax revenue at the county level.
In addition, property taxes are applied to construction sites on the basis of an evaluation of workcompleted to date in each year. The actual amount paid would depend not only on levy rates atthe time the construction is under way, but also on the construction schedule relative to thetiming of evaluation. However, overall it would increase the total tax revenue to WhatcomCounty and the state by several million dollars.

BP Cherry Point Cogeneration Project 3.12 Population, Housing, and EconomicsDraft EIS 3.12-10 September 2003
Operation
Population
During operation of the cogeneration facility, the Applicant anticipates employing approximately30 staff on a permanent basis, which is a very small number relative to the local population size.This staff will likely be recruited from the study area, with the possible exception of somespecialized management staff. Assuming that some specialized management staff may berecruited from outside the area, it is possible that up to 10 people may be direct hires and another5 as indirect hires, for a total potential relocated labor force of 15 during operation of the project.Indirect hires would be new employment in local companies that would provide goods andservices in support of project operation.
During operation of the cogeneration facility, direct and indirect personnel from out of the areawould likely move to Whatcom County permanently and distribute themselves between ownedand rental accommodation according to prevailing housing patterns. Using Washington Statefamily size figures for owners and renters, the relocation of a maximum of 15 workers is likely toresult in an increase in the county population by approximately 38 people, which represents aninsignificant increase.
Housing
Given the low number of potential relocations, housing availability and prices would not besignificantly affected. In 2000, Whatcom County had more than 2,572 vacant rental and ownedproperties, and Skagit County had more than 1,173 vacant rental and owned properties.
Economics
Operation Workforce
During operation of the cogeneration facility, the Applicant anticipates employing approximately30 staff on a permanent basis. Plant management and technical staff constitute about one-third ofthe prospective workforce; two-thirds of employees would be operation and maintenancetechnicians. The workforce breakdown by skill is shown in Table 3.12-8. Staff would work inshifts to run the facility 24 hours per day, seven days per week.
In addition to the permanent workforce, maintenance periods varying from two weeks per year to18 weeks every six years would increase the workforce on a temporary basis. The maintenanceschedule would repeat on a six-year cycle, and over the cycle a total of 50 person-months or fourjobs of one-year duration of maintenance work would be required.

BP Cherry Point Cogeneration Project 3.12 Population, Housing, and EconomicsDraft EIS 3.12-11 September 2003
Table 3.12-8: Expected Operation Workforce
Position Workforce
Plant Manager 1Business Manager 1Business Analyst 1Scheduler 1Plant Engineer 1Operations Supervisor 1Operations Foremen 4Operations Technicians 11Maintenance Supervisor 1Maintenance Technicians 6Health and Safety Specialist 1Controls Engineer 1Total 30Source: BP 2002, Appendix L
Local Fiscal Effects
Salaries, wages, and benefits for cogeneration facility employees are expected to total about $1.8million per year. The average project wage would be significantly higher than the averageWhatcom County wage of $26,295. It is likely that all personnel would be residents of WhatcomCounty, and these employees would spend a large part of their annual wages locally.
In addition, temporary labor would likely be contracted from within the study area. The annualestimated cost of wages and benefits paid for these services would be about $200,000, whichbrings the annual cogeneration facility labor cost to approximately $2 million.
Annual operation and maintenance costs for the cogeneration facility, excluding the cost ofnatural gas, are estimated at $18.2 million. Of this, $2 million is for wages and benefits and $6million is for maintenance and repair of materials, and water and chemical costs. The potentialfor purchase of materials in the study area is limited and would not likely exceed 5% of the total.A further $3 million would be spent on contractors hired to complete specialized maintenanceactivities that cannot be undertaken by permanent staff. Annual property tax to Whatcom Countycould be up to $6 million. The balance of $1.2 million would be spent on insurance and othercosts.
Tax Revenue
Tax revenue during operation would be derived from brokerage tax imposed on natural gaspurchases, property taxes on the cogeneration facility, sales and use taxes on materials purchasedin the course of operating and maintaining the facility, and sales tax on expenditures by the 30employees who would fill new jobs created by the project.

BP Cherry Point Cogeneration Project 3.12 Population, Housing, and EconomicsDraft EIS 3.12-12 September 2003
Washington State applies a brokerage tax of 3.852% on purchases of natural gas. The Applicanthas estimated gas consumption at between 39,240,000 and 46,110,000 million Btu/yr HigherHeat Value (HHV) on the assumption of a facility capacity utilization of 80-94%. Assuming anatural gas price of $3.00 per million Btu HHV, brokerage tax revenue accruing to the statewould be between $4.5 and $5.3 million annually. This figure would vary with fluctuations in theprice of natural gas, and with the volume of gas purchased on an annual basis by thecogeneration facility.
In 2001, Whatcom County levied total property taxes of $149.7 million for property with acumulative assessed value of $11,547 million. Assuming an assessed value for the cogenerationfacility equal to its $465 million construction cost, total assessed value of taxable property in thecounty would increase by approximately 4%. At the time of project completion, total propertytaxes could be up to $6 million annually using the 2001 average tax rate. Of this, approximately$0.7 million would accrue directly to Whatcom County, $1.5 million to Washington State, andthe balance of $3.8 million to the county’s school, fire, hospital, water, recreation, and portdistricts and to its incorporated cities.
During operation, the cogeneration facility would also pay business and occupation (B&O) andpublic utility tax to the state of Washington. The B&O tax is levied on product revenues at a rateof 0.484%. The public utility tax is levied on the basis of gross operating revenue at a rate of3.873%. The total tax paid would depend not only on the tax rate, but also on the taxclassification of the cogeneration facility; available exemptions, deductions, and creditsassociated with project operation; the volume of production; the location of sale of the energy;and the price of energy. Nevertheless, taken together these taxes are likely to be several milliondollars per year.
Because of the relatively few number of relocating employees created by the cogenerationfacility, the project is not expected to place significant additional demands on local publicservices. No impacts on government service costs either from project construction or operationhave been identified, and the net fiscal balance would remain positive throughout the projectlifecycle because of the additional tax revenue collected.
Environmental Justice
In 1997, Whatcom County had a poverty rate of approximately 11.4%, equal to 17,650 people(BP 2002, Appendix L). The Lummi Reservation has been identified as a “low income” censustract area, which means that more than 20% of the population has an income less than nationalpoverty rates. The U.S. government has identified the Nooksack Reservation as a “distressedcommunity,” which means that more than 30% of the population has an income below thenational poverty rate, and the unemployment rate is greater than the national average of 1.5%.The only other area in Whatcom County identified as either low income or distressed is thesparsely populated rural southwest corner. The reservations are therefore disadvantaged relativeto the rest of county jurisdictions with poverty rates two to three times higher and significantlymore unemployment.

BP Cherry Point Cogeneration Project 3.12 Population, Housing, and EconomicsDraft EIS 3.12-13 September 2003
Construction and operation of the cogeneration facility would not displace any people, includingany low-income or minority people, or those living on the reservations. It also would not haveany disproportionately negative impacts on these people.
3.12.3 Impacts of No Action
Under the No Action Alternative, the cogeneration facility would not be constructed. Noadditional employment or tax revenues would be created, and no workers would relocate to theproject area. No construction or operational impacts related to population, housing, or economicswould occur.
3.12.4 Secondary and Cumulative Impacts
The indirect workforce associated with the construction stage of the project is estimated at 210people (BP 2002, Appendix L). Indirect employment includes jobs created in local companiesthat would provide goods and services in support of the project. Unlike construction labor, whichmay be recruited from outside the study area because of trade-specific shortages, indirect labor ismore likely to be locally recruited with local businesses benefiting from increased expendituresby the construction workforce. If 15% of indirect labor were recruited from outside the studyarea, this is equivalent to approximately 30 people. The recruitment outside the study area wouldtotal about 180 direct or indirect workers, who could choose to relocate to the study area. Laboravailability for indirect employment would be unconstrained given local unemployment rates.
The project would also be a source of induced employment, which is employment that resultsfrom the increased economic activity that occurs when workers and local suppliers and theiremployees have increased disposable income as a result of project construction. In an economysuch as Whatcom County’s, which is characterized by much seasonal employment (related notonly to a strong construction industry, but also to tourism and to a lesser extent agriculture andfisheries), induced employment tends to be absorbed. That is, rather than mobilizing anddemobilizing to service particular projects or seasonal events, the local economy andinfrastructure can absorb and respond to temporary economic events. Swings in revenue areexperienced by local businesses, for example, but do not necessarily result in constant hiring andfiring. On this assumption, impacts from induced employment expected from construction of thecogeneration facility are not considered to be significant, although local businesses are likely toexperience increases in income.
With the current unemployment rate, the construction and operation of the cogeneration facilitywould reverse recent losses of jobs and revenue in the county. No significant cumulative impacton population growth or the availability of housing would occur.
3.12.5 Mitigation Measures
Because no significant adverse impacts related to population, housing, or economics wouldoccur, mitigation measures would not be necessary.
BP Cherry Point Cogeneration Project 3.12 Population, Housing, and EconomicsDraft EIS 3.12-14 September 2003
3.12.6 Significant Unavoidable Adverse Impacts
Increases in population and housing demand created by construction and operation of thecogeneration facility would be relatively low compared to the population and housing market inWhatcom and Skagit counties. Also, because of the relatively small number of relocatingemployees created by the cogeneration facility, the project is not expected to place significantadditional demands on local public services; therefore, no significant unavoidable adverseimpacts on population, housing, or economics are identified.

BP Cherry Point Cogeneration Project 3.13 Public Services and UtilitiesDraft EIS 3.13-1 September 2003
3.13 PUBLIC SERVICES AND UTILITIES
This section discusses existing conditions, impacts, and mitigation measures for public servicesand utilities within the vicinity of the project site. The analysis in this section is primarily basedon information provided by the Applicant in the ASC (BP 2002, Section 3.13 and Appendix L).Where additional sources of information were used to evaluate the potential impacts associatedwith the proposal, those sources have been cited.
3.13.1 Existing Conditions
Recreation
Recreational opportunities for both residents and tourists range from the national parks andforests found in the eastern two-thirds of Whatcom County, to the opportunities offered by PugetSound in the west, to the urban attractions of the historic village of Fairhaven. Table 3.13-1presents a listing of major public recreational areas in Whatcom County. With the exception ofthe smaller, specific-purpose areas such as the Hovender Homestead Park, most of therecreational areas listed in Table 3.13-1 offer multiple-use opportunities for sport, education, andaccommodation.
Table 3.13-1: Major Public Recreational Areas
Recreational Area LocationApproximatedistance from
project siteFacilities
FederalMt. Baker-SnoqualmieNational Forest
Whatcom and south,1,709,700 acres
100 miles Water sports, winter sports, Wild andScenic River, Mt. Baker Wilderness Area,trails, 30 US Forest Service campgrounds
North Cascades NationalPark
Whatcom and south,505,000 acres
100 miles Water sports, winter sports, trails, rafting,camping, lodging
StateBirch Bay State Park Birch Bay, 194 acres 2 miles Boat launch, picnic sites, fishing,
swimming, water sports, AudubonSanctuary, camping
Larrabee State Park Bellingham, 2,683 acres 15 miles Boat launch, picnic sites, fishing,swimming, water sports, camping
Lake Terrell Wildlife Area Lake Terrell, 1,500 acres 2 miles Hunting, fishing, hiking, boating, wildlifeviewing, and birdwatching
Peace Arch Blaine, 20 acres 8 miles Picnic sitesCountyHovender Homestead Park Ferndale 4 miles Historic Place, picnic sites, trails, fishingLighthouse Marine Park Point Roberts, 22 acres 15 miles Boat launch, picnic sites, campingSamish Park Bellingham, 39 acres, 15 miles Boat rentals, picnic sites, swimmingSemiahmoo Park Blaine, 300 acres of
tideland8 miles Paths
Silver Lake Park Sumas, 411 acres 20 miles Boat launch, picnic sites, trails, horsebackriding, camping, cabins

BP Cherry Point Cogeneration Project 3.13 Public Services and UtilitiesDraft EIS 3.13-2 September 2003
Table 3.13-1: Continued
Recreational Area LocationApproximatedistance from
project siteFacilities
City of BellinghamLake Padden Park Bellingham, 900 acres 15 miles Boat launch, picnic sites, fishing,
swimming, trails, sports facilitiesWhatcom Falls Bellingham, 209 acres 15 miles Picnic sites, fishing, trails, sports facilitiesSehome Arboretum Bellingham, 175 acres 15 miles TrailsSource: BP 2002, Section 3.13
The cogeneration facility would be built within Applicant-owned property, adjacent to the BPCherry Point Refinery, in an area of Whatcom County zoned for heavy industry and populatedwith a number of other heavy industry facilities. There are no recreational facilities within thisHeavy Impact Industrial zone of Whatcom County. The nearest public recreational facilities tothe proposed cogeneration facility site are Birch Bay State Park, approximately 2 milesnorthwest of the project site, and the Lake Terrell Wildlife Area, approximately 2 miles southeastof the project site. Beachwood Resort, an 80-acre private membership recreational vehicle resort,is also approximately 2 miles northwest of the site.
Schools
Whatcom County has 34 elementary schools, 11 middle schools, 9 high schools, and 10alternative education facilities. It has four colleges and universities: Bellingham TechnicalCollege, Whatcom Community College, Western Washington University, and the NorthwestIndian College. Total enrollment in Whatcom County’s public education system from elementaryto high school is more than 23,000. The colleges have a total enrollment of more than 14,000 andthe university has more than 12,000 students. In addition to schools in the public system, thereare 21 private schools, 4 in Lynden and the remainder in Bellingham.
Table 3.13-2 provides capacity and enrollment information for Whatcom County public schooldistricts. The proposed site for the cogeneration facility, refinery interface, and cogenerationfacility/Bonneville transmission system is located within the Blaine School District. The existingBonneville transmission corridor for Custer/Intalco Transmission Line No. 2 is located withinthe Ferndale School District.
As Table 3.13-2 indicates, the Blaine School District comprises three elementary schools, onemiddle school, and one high school, and is currently operating at 100% capacity. The FerndaleSchool District consists of seven elementary schools, two middle schools, and one high school,and is operating at approximately 84% capacity.

BP Cherry Point Cogeneration Project 3.13 Public Services and UtilitiesDraft EIS 3.13-3 September 2003
Table 3.13-2: Public Schools
LevelSchool District Elementary Middle High Capacity Students % use
Bellingham 13 4 3 12,550 9,986 79.6Blaine 3 1 1 <2,043 2,043 100.0Ferndale 7 2 1 5,860 4,941 84.3Lynden 3 1 1 3,125 2,431 77.8Nooksack Valley 2 1 1 -- -- --Meridian 2 1 1 1,756 1,572 89.5Mt. Baker 4 1 1 2,505 2,321 92.7Total 34 11 9 27,839 23,294 83.7Source: BP 2002, Section 3.13
Fire Response Services
Firefighting resources in Whatcom County are provided through 17 fire protection districts and 2municipal city fire departments, with a total of 175 paid firefighters and 645 volunteerfirefighters. The project site is within Whatcom County Fire District No. 7, which hasjurisdictional responsibility for coverage of a 73-square-mile area of the county, from Bay Roadsouth to Slater Road and from the Strait of Georgia east to Aldrich/Guide Meridian Road. Thejurisdiction includes the City of Ferndale, all the major industrial complexes, and a population ofapproximately 17,500.
Fire District No. 7 consists of six fire stations. Two of these stations are near the project site at4047 Brown Road (1.5 miles from the project site) and 5419 Grandview Road (2.5 miles fromthe project site). District 7 is a combination department consisting of 16 career and 70 volunteerfirefighters. District 7 maintains and staffs seven engines, (three 1,750 gpm and four 500 gpm)out of the six stations, along with five licensed aid units, (three rescue and two transport-capableambulances). District 7 is currently purchasing a 100-foot aerial ladder truck designed forrefinery and power plant firefighting needs.
The Applicant has proposed that the existing onsite fire protection services of the BP CherryPoint Refinery would be expanded to provide fire protection services for the cogenerationfacility. Fire protection services associated with the refinery typically include 100 fire responderson call during the week, at least 12 of whom are specifically assigned to locations around therefinery property. During the weekend, 20 fire responders are on call, at least 12 of whom areassigned to specific locations around the property. Given the specialized nature of refineryoperations, refinery firefighting personnel are specifically trained to respond to these types offires. Several of these firefighters are fire response instructors who routinely provide trainingcourses at other industrial installations around the state and nation. In addition, all refineryemployees are required to attend annual safety courses and pass written exams to educate themon required procedures, protocols, and emergency response expectations at the refinery. Theseefforts are focused on preventing fires and, in the event of a fire or other emergency, limitingtheir potential impact (BP 2002, Section 3.13).

BP Cherry Point Cogeneration Project 3.13 Public Services and UtilitiesDraft EIS 3.13-4 September 2003
Refinery equipment available for firefighting includes three pumper trucks (1,250 gpm, 1,500gpm, and 2,000 gpm capacity); an extensive system for the supply of water for firefighting basedon pipelines, pumps, and fire hydrants distributed around the site; a stock of 10,000 gallons offoam; a 6,000 gpm, trailer-mounted pump; and a Hazardous Materials Management truck.
Historically, the refinery has averaged one fire incident per year, and with one exception, thesehave been minor and immediately extinguished by refinery personnel. The infrequency of eventssuggests that there may be no discernible pattern in terms of seasonal or operational peaks.
Only one fire (in 1977) has occurred during the life of the BP Cherry Point Refinery thatrequired outside assistance to control. That fire occurred on the Hydrocracking Unit when a finfan tube developed a leak and high pressure oil and gas leaked from the tube and ignited. Thefire was extinguished by the onsite Refinery Emergency Response team, and outside firedepartment equipment and personnel were used to help cool surrounding equipment andstructures. Following the incident, a number of modifications were made to equipment andprocedures to prevent a reoccurrence (Torpey, pers. comm., 2003).
Police and Security Services
The Whatcom County Sheriff’s Office provides police services within unincorporated WhatcomCounty. In the event of a criminal incident at the refinery, the Whatcom County Sheriff’s Officewould normally be called to the site by the Applicant’s security personnel. During the 30 yearsthe refinery has been in operation, such an event has never occurred.
Whatcom County statistics for 2000 show a total of 256 incidents of violent crime, broken downas aggravated assaults (44), assaults (161), rapes (50), and homicides (1) (BP 2002, Section3.13). This represents a decrease in violent crimes of approximately 9.5% over the previous year.As a ratio of incidents to population using the 2000 population figures, this represents 1 incidentfor every 650 people.
The Applicant has proposed that the existing onsite security services of the refinery would beexpanded to provide security services for the cogeneration facility. The refinery maintains theservices of a professional contract security force, which patrols the property 24 hours a day, 365days a year. During the week, 12 security staff are onsite, while 8 security staff are presentduring the weekend. Volunteers are not used. Security staff are provided with training bothgeneral to security work, and specific to refinery operations at Cherry Point. They are trained, forexample, in bomb threats, safety, emergency medical care, oil spill response, terrorist awareness,radio, locks and keys, threatening call diffusion, and pipeline inspection. In addition, theyundergo monthly refresher sessions and weekly exams. Three four-wheel-drive vehicles arestationed onsite at all times so that security personnel are able to quickly reach all areas of theApplicant’s property at Cherry Point.
Incidents at the site have been limited to the occasional theft of small equipment, on averageabout once a year. Security personnel also respond to incidents around the site perimeter of therefinery. There has never been a case of such an incident leading to personal injury or physicaldamage to refinery facilities or equipment.

BP Cherry Point Cogeneration Project 3.13 Public Services and UtilitiesDraft EIS 3.13-5 September 2003
Emergency Medical Services
The Applicant has proposed that the existing onsite emergency medical services of the BPCherry Point Refinery would be expanded to provide emergency medical services for thecogeneration facility. The existing emergency medical services resources, including facilities,personnel, and training programs at the refinery, include the following (BP 2002, Section 3.13):
• A full-time certified Physician Assistant during the week, with more than 20 years ofexperience at the refinery;
• A full-time Nurse Practitioner (who is also a Registered Nurse) during the week, with morethan five years experience at the refinery;
• Four Emergency Medical Technicians on call as the first to respond to medical emergenciesafter regular working hours and on weekends;
• Between 100 and 120 First Aid Providers available across the refinery to respond to needs,with at least 25 present per shift; and
• A rotational pool of three doctors, one of whom visits the refinery for one day each week.
Emergency medical facilities at the refinery include a staff clinic with two examining rooms, amajor treatment room, and a supply room. The clinic has one ambulance and a helipad forairlifting patients to hospitals in either Bellingham or Seattle. The clinic has an emergency radiosystem directly connected to the Whatcom County Emergency Center as well as to St. JosephHospital in Bellingham, an approximately 20-minute drive from the refinery. The clinic isequipped with automated defibrillators (which can be operated by the emergency medicaltechnicians) as well as a manual defibrillator (operated by medical professionals), and is fullysupplied, including intravenous and airway supplies, cardiac medication, and a multi-trauma kit.Medical emergencies occur infrequently at the refinery, typically less than once per year, andmost have been within the capability of the refinery’s onsite resources to manage.
The only hospital in Whatcom County is St. Joseph Hospital, which is operated as a non-profit,voluntary, private institution, unsupported by tax revenue. The hospital charges for its services,but provides services regardless of ability to pay. The hospital has 253 beds and 24 newbornbassinets. It has 300 doctors, employs a total of 1,700 full and part-time employees, of whom515 are nurses, and has an average of 250 volunteers. The hospital provides a full range ofnursing services, as well as advanced cardiovascular, cancer, mental health, radiological,respiratory, rehabilitation, and surgery services.
The hospital is a Level II Certified Trauma Center. In Washington State, only Seattle has ahigher Certified Level I Center that is open 24 hours a day, 365 days a year. St. Joseph Hospitalis an integral part of the Whatcom County Emergency Medical Services network, connected byradio to the paramedics and emergency medical technicians from fire departments (whichprovide local ambulance service), and other organizations such as the refinery. The hospitaloperates with Airlift Northwest to bring assistance to scenes of emergencies throughoutWhatcom County, Skagit County, Island County, and San Juan County.

BP Cherry Point Cogeneration Project 3.13 Public Services and UtilitiesDraft EIS 3.13-6 September 2003
The hospital currently has a $70 million expansion program underway, which would addapproximately 170,000 square feet of space for major services, inpatient beds, and parking. Theexpansion is part of a 20-year Master Facility Plan, developed with the City of Bellingham andthe hospital board of community leaders. The primary drivers for expanding the hospitalfacilities include anticipated strong growth in the population of the area and an aging population.Funds have been raised from the hospital’s cash reserves and from a private bond issue (BP2002, Section 3.13)
Local medical facilities would also respond to the requirements of the anticipated weeklycommuting and relocating workers and their families, who are estimated to be no more than 414people at a maximum during the peak of construction. This represents a relatively low number ofpeople coming into the area as a result of the cogeneration facility, relative to the localpopulation of Whatcom County and of the Bellingham, Blaine, and Ferndale areas. There arealso no reports of over-extended medical facilities locally.
Communications
Whatcom County is served by two daily newspapers, both published in Bellingham. These arethe Bellingham Herald and the Northwest Citizen. Bellingham, Birch Bay, Blaine, Ferndale, andLynden each have one or more smaller community newspapers, usually published weekly. TheBusiness Pulse is a Whatcom County magazine.
Cable and satellite service companies, including AT&T, DIRECTV, and TCI Cablevision ofWashington, provide the full range of television stations, as well as a local community accesstelevision station. Bellingham, Blaine, Ferndale, and Lynden all have broadcast radio stations.The telephone infrastructure is provided by Qwest, while AT&T and Sprint also offer the fullrange of long distance, internet access, and other telephone services.
Water Supply and Wastewater Discharge Infrastructure
Sections 3.3 and 3.4 characterize the existing surface water and groundwater regimes within theproject site and surrounding area, and describe the stormwater management, water supply, andwastewater treatment processes to be implemented during construction and operation of theproject.
Solid Waste
There are currently no operating landfills in Whatcom County. Three transfer stations operate atBirch Bay, Cedarville, and Point Roberts on sites leased out by the county. A fourth site locatedon private property in Lynden is also open to the public. Disposal of solid waste is carried out byprivate waste haulers through agreements with the county (Whatcom County 2003b). Currently,the Applicant retains the services of licensed waste haulers to collect and dispose of recyclableand non-recyclable wastes generated at the refinery to approved disposal facilities.

BP Cherry Point Cogeneration Project 3.13 Public Services and UtilitiesDraft EIS 3.13-7 September 2003
3.13.2 Impacts of the Proposed Action
Construction
Cogeneration Facility, Refinery Interface, and Other Project Components
Recreation
Impacts on recreational facilities as a result of construction activities for the cogeneration facilitywould primarily be related to potential increases in facility use associated with the project’sconstruction workforce. Any increased use of recreational facilities would likely come from anon-local workforce. This would include both weekly commuters, who are less likely to accessrecreational facilities because they are not present in the area on weekends, and temporarilyrelocated workers and their families. Temporary relocations associated with project constructionare estimated to not exceed 180 individuals at any one time (BP 2002, Appendix L). Thisrelatively small number of construction workers and their families is not expected to imposeunmanageable demands on existing recreation infrastructure in Whatcom County. See Section3.12 for additional discussion of temporary worker relocations associated with construction ofthe project.
An additional potential impact on recreational facility users during construction would be theeffects of construction traffic on access roads to recreational facilities near the cogenerationfacility site – specifically Birch Bay State Park and the Lake Terrell Wildlife Area. Such effects,however, would be relatively short term, and would not be likely to significantly impact thepublic's ability to use these facilities.
Schools
With the exception of the Blaine School District, which only accepts students from within itsown district, other schools in the Bellingham, Ferndale, and Birch Bay areas are not filled tocapacity, and would have room for an incremental increase in the number of students fromfamilies who could move to the area during construction of the cogeneration facility. Asdescribed in Section 3.12, very few of the estimated 180 relocating construction workers areexpected to bring their families, given that only 27 jobs would last longer than a 10-monthperiod. Given that relatively few families with children would be expected to relocate to the areaduring project construction, construction of the project is not expected to significantly affectoverall school enrollments for the area. Individual family decisions regarding where to residewould determine which schools students in those families would be eligible to attend. It ispossible that families choosing to reside within the boundaries of the Blaine School Districtcould add students to that district's enrollment, which is currently at capacity.
Fire Response Services
The probability of a significant fire or explosion at the cogeneration facility site or within therefinery during construction is considered low, and construction of the cogeneration facility isnot expected to significantly impact the delivery of firefighting services (see Section 3.16, Health

BP Cherry Point Cogeneration Project 3.13 Public Services and UtilitiesDraft EIS 3.13-8 September 2003
and Safety, for a discussion of the potential for fire or explosion during construction of thecogeneration facility).
The Applicant is proposing that existing firefighting services and infrastructure currently in placeto support the refinery would support fire preparedness and response needs for the cogenerationfacility as well. Section 3.16 discusses proposed changes to the refinery’s Fire EmergencyResponse Operations (FERO) plan and Emergency Preparedness Plan (EPP) to address theconstruction and operation of the cogeneration facility and refinery interface components.
Fire District 7 has Mutual Aid Agreements in place with all Whatcom County Fire Agencies toensure full support in the event that onsite refinery and District 7 firefighting resources areinsufficient to mitigate an emergency. The refinery’s onsite resources, personnel, and equipment,with available support from Fire District 7, would be sufficient to respond to most emergencies.Additional resources or agencies are unlikely to be required, except in the event of a large-scaleor long-term emergency.
In the unlikely event of an emergency beyond the capability of the refinery’s resources, theWhatcom County emergency services would be called upon. Whatcom County’s Division ofEmergency Management is responsible for developing and maintaining communityinfrastructure for emergency/disaster mitigation, planning, response, and recovery. It is mandatedto maintain a constant state of readiness to respond to events that might exceed the capability ofany single jurisdiction or entity, and works closely with local industry (including the Applicant)to exercise that mandate. The division has an Emergency Operations Center that can be activatedto gather and disseminate information, make strategic decisions, allocate resources, andcoordinate responses to emergencies. This structure is in place, and is funded and staffed to thelevel required. Construction and operation of the cogeneration facility would not introduce newhazards that would require initiative on the part of the division to incorporate into its work.
Police and Security Services
Access to the project site would be controlled through gates from Grandview Road. Duringconstruction, additional security measures would be provided by installing and maintainingfencing around the perimeter of the cogeneration facility construction site and around theperimeter of Laydown Areas 1, 2, and 3, which are currently within existing fenced areas. Siteaccess would be controlled for personnel and vehicles by a contracted security service.
The Applicant would provide for project site security by using contracted security staff. It isunlikely that the addition of approximately 180 relocated construction workers into the WhatcomCounty area during construction of the cogeneration facility would significantly increase theincidence of violent crimes. Consequently, it is not anticipated that local law enforcementagencies would need to increase their staff or resources as a result of project construction.
There is the remote possibility of an extreme security or emergency incident that would involvelocal police. Section 3.16 describes the response to such an incident. Should such an event occur,local police would be notified and would likely draw upon other state and federal security

BP Cherry Point Cogeneration Project 3.13 Public Services and UtilitiesDraft EIS 3.13-9 September 2003
agencies, such as the Division of Emergency Management resources, as described above for afire emergency.
Emergency Medical Services
During construction of the cogeneration facility, there would be a large number of workers onsiterelative to the permanent operational workforce for the project. The Applicant has managed itsown emergency medical services at the refinery for the last 30 years, and proposes to provide itsown onsite medical services for the cogeneration facility as well.
During construction of the cogeneration facility, the Applicant would implement a safety planthat would include mandatory health and safety orientation for all personnel onsite, periodicadditional safety training for the duration of construction, safety audits, and monitoring of workprocesses by a safety engineer. Because the Applicant would manage its own emergency medicalservices for construction and operation of the cogeneration facility through existing refineryresources, there would be little or no demand for support from other community emergencymedical services during construction.
Communications
Construction of the cogeneration facility would require the establishment of temporarycommunications. A project construction office with telephone, computer, and facsimiletransmission systems would likely be established on the project site. Cell phones, pagers, andportable computers would also be used by some construction personnel. The demand for thesecommunication systems and services associated with the construction of the cogeneration facilityis not expected to significantly affect the quality or availability of communication services in thevicinity of the project site.
Public Water Supplies
During construction of the cogeneration facility, water would be supplied from the refinery orthe Engineering Procurement and Construction (EPC) contractor to provide dust control. Thewater service would be contracted out to a local company or supplied by the EPC contractor.
Water for HRSG and export steam line steam-blow tests and hydrostatic tests would be requiredfor commissioning of the power plant facilities, natural gas connections, and watersupply/discharge connections. The volume of water needed for HRSG steam-blow testing wouldbe about 15.5 million gallons. Export steam line steam-blow testing would require about 1.2million gallons, and hydrostatic testing would likely not exceed 4.8 million gallons. Testingwould take place near completion of construction over a period of two to three months. Thewater source would either be industrial water directly from the PUD, or recycled cooling waterfrom Alcoa Intalco Works if it is in operation.

BP Cherry Point Cogeneration Project 3.13 Public Services and UtilitiesDraft EIS 3.13-10 September 2003
Wastewater
During construction of the cogeneration facility, the EPC contractor would be responsible for theremoval and disposal of sanitary wastes associated with the construction workforce. As for otherservices, sanitary waste removal would be provided by a commercial service provider.
Water used for hydrostatic testing and other startup needs would be discharged to the refinerywastewater treatment system. Should there be contamination of stormwater within the secondarycontainment berms, that stormwater would also be directed to the refinery wastewater treatmentfacility. This additional volume is not expected to cause any overload to the existing system.According to the Applicant, water volumes used for hydrostatic testing are not dissimilar fromthose used for various refinery functions and are not expected to exceed the capacity of therefinery’s wastewater treatment system.
Stormwater
During construction of the cogeneration facility, BMPs for sediment and erosion control wouldbe implemented and maintained. These would include the construction of diversion ditches toprevent runoff from entering the site and temporary swales to filter and divert stormwater to thetreatment and detention system. After the settling of eroded materials in the detention basins, thewater would be discharged to wetlands north of Grandview Road.
The proposed stormwater collection and treatment system would allow infiltration to occur andproper detention of stormwater to minimize peak discharge flows. The final discharge would beto wetlands for enhancement, where the water would be able to infiltrate and recharge theshallow groundwater-bearing zone. Stormwater collection, treatment, and discharge would bewithin the same hydrologic basin where the stormwater originates, primarily the Terrell Creekwatershed. Therefore, no significant changes to the quantity of water would result to the TerrellCreek drainage basin during construction of the cogeneration facility. Additional informationabout stormwater control during construction may be found in Section 3.4.2.
Solid Waste
Table 3.13-3 summarizes anticipated categories and volumes of wastes to be generated duringconstruction of the cogeneration facility and systems and components that would interface withthe refinery.
During construction of the project, the EPC contractor would be required to segregate anddispose of wastes in accordance with applicable federal and state laws, and with local countyregulations. This is normally undertaken through contracted local solid waste disposal haulerswho are licensed to transport and dispose of construction waste materials in accordance with theWhatcom County comprehensive plan for solid waste. Non-hazardous wastes would betransported to state-permitted solid waste transfer stations, and/or to permitted landfills withinWashington and/or Oregon. Hazardous waste disposal facilities are available locally at theBellingham Disposal of Toxics Facility, although it reportedly has limited capacity. Dependingupon the actual types and quantities of hazardous wastes to be generated during construction of

BP Cherry Point Cogeneration Project 3.13 Public Services and UtilitiesDraft EIS 3.13-11 September 2003
the cogeneration facility, the EPC contractor would be responsible for identifying alternativelicensed hazardous waste disposal facilities.
Table 3.13-3: Summary of Anticipated Construction Waste Streams
Waste StreamWaste StreamClassification
EstimatedAmount
EstimatedFrequency ofGeneration
No. Trucks andFrequency
QuantityShipped
Scrap wood, steel, glass, plastic,paper calcium silicate insulation,mineral wool insulation
Non-hazardoussolids
50 cubicyards
Weekly 1 per week 50 cubicyards
Empty hazardous materialcontainers
Hazardous solids 1.5 cubicyard
Weekly 1 per week 1.5 cubicyard
Used and waste lube oil duringCT and ST lube oil flushes
Hazardous or non-hazardous liquids
55 gallondrums
200 drumsover life ofconstruction
1 per 60 days 2255-gallon
drumsOil rags, oil absorbent generatedduring normal constructionactivities, excluding lube oilflushes
Hazardous liquids 55 gallons Monthly 1 per month 55 gallons
Solvents, used constructionequipment lube oils, paint,adhesives
Hazardous liquids 200 gallons Monthly 1 per month 200 gallons
Spent lead acid batteries Hazardous solids 3 batteries Yearly 1 per year 3 batteriesSpent alkaline batteries Hazardous solids 80 batteries Monthly 1 per month 80 batteriesST and pre-boiler pipingcleaning water, chelant
Hazardous or non-hazardous liquids
400,000gallons
Once beforeinitial startup
34 400,000gallons
Waste oil from oily wasteholding tank
Hazardous or non-hazardous liquids
25 gallons Monthly 1 per month 25 gallons
Sanitary waste from potablechemical toilets and constructionoffice holding tanks
Non-hazardousliquids
1,500gallons
Daily 3 per week 1,500gallons
Stormwater from constructionarea
Non-hazardousliquids
950,000gallons
For a once intwo years,24-hour
storm event
NA NA
Fluorescent, mercury vaporlamps
Hazardous solids 40 Yearly 1 per year 40
Hydrotest water Non-hazardousliquids
4.8 milliongallons
Once beforeinitial startup
Discharged torefinery water
treatment system
4.8 milliongallons
Source: BP 2002
Transmission System and Custer/Intalco Transmission Line No. 2
Fire Response Services
The risk of fire during construction of the transmission lines is considered low. The greatest riskmay occur if construction activities occur during periods of moderate to high wildfire conditions.

BP Cherry Point Cogeneration Project 3.13 Public Services and UtilitiesDraft EIS 3.13-12 September 2003
Police and Security Services
Law enforcement concerns during construction of the transmission lines would be limitedprimarily to theft of construction equipment and materials, and vandalism. Given the relativelyshort duration of the proposed transmission line work, the potential for additional demands onlaw enforcement personnel is expected to be minimal.
Emergency Medical Services
During transmission line construction, the local demand for emergency medical services couldincrease due to construction accidents that could occur at or near the transmission line corridors.Construction workers would be exposed to hazards typical of major construction projects. If anaccident were to occur, local emergency response units would be required to provide initialtreatment and transportation to a local medical treatment facility, followed by the need formedical services at the receiving facility.
Communications
Transmission line construction would not adversely affect communications service providers.Existing communications systems, including telephone and wireless communications, wouldhave the capacity to accommodate peak construction demands.
Public Water Supplies
Transmission line construction would not depend upon existing water supply systems to meetproject water needs. There would be no significant impacts on water supply during projectconstruction.
Solid Waste
The Applicant has not established solid waste management procedures. Solid waste fromconstruction of the proposed transmission line would likely be managed through a servicecontract with a local waste management firm.
Existing transmission tower structures that would be removed under Option 2 would be removedfrom their foundations by crane or helicopter, and disassembled either onsite or at a nearbylaydown area. The old wire, steel lattice towers, and other structures could be salvaged or madeavailable for reuse, as appropriate. Other transmission line materials (such as hardware, crossarms, and insulators) would be removed from the ROW and properly disposed of.

BP Cherry Point Cogeneration Project 3.13 Public Services and UtilitiesDraft EIS 3.13-13 September 2003
Operation
Cogeneration Facility, Refinery Interface, and Other Project Components
Recreation
Potential impacts on recreational facilities associated with project operation are primarily relatedto potential increases in facility use associated with the project’s work force, noise, and airemissions. None of these are expected to be significant.
The operational workforce of the cogeneration facility would not exceed 30 full-time individuals,no more than half of whom are expected to actually relocate, representing additional populationto the area. The estimated total increase in population of less than 30 people associated withoperation of the cogeneration facility would have an insignificant effect on recreational usewithin Whatcom and Skagit counties.
Potential increases in noise levels during routine operation of the cogeneration facility areunlikely to be detected at the nearest recreational facility (Birch Bay State Park). Noise analysesconducted for the project projected that sound from the proposed project would increase noiselevels at the park entrance by only 1 dBA. Because a 1 dBA increase is barely perceptible bymost people in a laboratory setting, people at the park entrance are not expected to perceive anydifference in noise levels. Park users are expected to be even less likely to perceive anydifference in sound levels because they would be inside the park, farther from the project site.See Section 3.9 for additional discussion of operational noise levels for the project.
Air quality analyses conducted for the project indicate that emissions from the cogenerationfacility are not expected to result in any significant impacts on air quality or to visibility in thearea. Therefore, operation of the cogeneration facility is not expected to impact recreationalopportunities in Whatcom County. Section 3.2 provides additional discussion of air emissionsfrom the project and associated air quality and visibility impacts.
Schools
Operation of the cogeneration facility is projected to create 30 new jobs. Even if a maximum of15 families relocated from outside of the area and they all had school-age children, the additionof their children to the local school population within Whatcom County would not significantlyimpact overall local school enrollment levels. As with project construction, individual familydecisions regarding where to reside would determine which schools students in those familieswould be eligible to attend. It is possible that families choosing to reside within the boundaries ofthe Blaine School District could add students to that district's enrollment, which is currently atcapacity.
BP Cherry Point Cogeneration Project 3.13 Public Services and UtilitiesDraft EIS 3.13-14 September 2003
Fire Protection Services
During operation and maintenance of the cogeneration facility, mechanical failure, malfunctionsin the electrical system, acts of terrorism, and human error are potential risks that could result infire or explosion.
The Applicant is proposing that existing firefighting services and infrastructure currently in placeto support the refinery would support fire preparedness and response needs for the cogenerationfacility as well. The Applicant has proposed to modify the existing refinery FERO plan toprovide detailed guidelines to facilitate effective response actions to emergencies at thecogeneration facility. In the event of fire or other emergency, the FERO plan would be activated.The plan provides detailed guidelines to assist responders and includes a command structure,duties and responsibilities, checklist for responders, equipment lists, instruction guides, andstrategic actions for potential or critical incident scenarios that may occur in or around thefacility. The FERO plan would be consistent with the Applicant’s EPP, which providespreparedness and planning information for emergency conditions. Again, should this everbecome necessary, the Applicant would coordinate efforts with local emergency agencies. Allfacility employees would receive regular training to ensure that effective and safe actions limitthe potential occurrence of fire, and to increase the ability to respond effectively in the event of afire (See Section 3.16, Health and Safety, for additional discussion of the FERO plan and EPP).
During operation of the cogeneration facility, existing staff and equipment at the refinery areconsidered sufficient to meet all but the most severe of potential fires. The fire protection systemwould consist of a site perimeter firewater loop with post indicating valves and hydrants, anautomatic deluge system for transformers, a sprinkler system for steam turbine lube oilequipment and bearings, and detection and alarm equipment. A carbon dioxide system, providedby the CGT supplier, would protect this equipment. Buildings would have fire protection,including a pre-action system for the Administration Building and Auxiliary Substation Building,and dry stand pipe and Class III hose stations for all other buildings. Portable fire extinguishersof appropriate sizes and types would be located throughout the facility.
One trained employee would be assigned specifically to coordinate fire response actions at thecogeneration facility. Only in the event of an extraordinary incident would assistance be neededfrom outside of the Applicant’s onsite fire response resources and infrastructure. The Applicantwould maintain regular communication with the local sheriff, firefighting, and emergencyresponse services in Whatcom County; Whatcom County’s Emergency Planning Commission,and the Washington State Department of Ecology. By maintaining full disclosure on capabilitiesand resources to respond to fires with these other agencies, and by remaining current onlegislated and regulatory requirements, the Applicant would ensure a state of readiness andpreparedness to respond to potential fires.
The Applicant and refinery’s onsite resources, personnel, and equipment, with available supportfrom Fire District 7, would be sufficient to respond to most emergencies. Additional resources oragencies are unlikely to be required except in the event of a large-scale or long-term emergency.Similar to the discussion under project construction, in the event of an emergency beyond the

BP Cherry Point Cogeneration Project 3.13 Public Services and UtilitiesDraft EIS 3.13-15 September 2003
capability of the Applicant and refinery’s own resources, the Whatcom County emergencyservices would be called upon.
Police and Security Services
The Applicant is proposing that existing security services and infrastructure currently in place tosupport the refinery would support the security needs for the cogeneration facility as well.
Project operation is not expected to have a significant effect on long-term demands for policeand security services. Operation of the cogeneration facility is projected to create approximately30 positions, which would have a minimal effect on traffic safety in the project vicinity.Cogeneration facility security measures would be incorporated into the project’s facility andoperation plans. Consequently, there would be no need for additional staff and equipmentresources to maintain local law enforcement service levels.
Emergency Medical Services
The Applicant is proposing that existing emergency medical services and infrastructure currentlyin place to support the BP Cherry Point Refinery would support the cogeneration facility as well.The operational workforce for the cogeneration facility is well within the handling capacity ofthe existing facilities within the refinery. In addition, all employees of the cogeneration facilitywould receive training in first aid and cardiopulmonary resuscitation (CPR). Onsite treatmentwould be provided where the medical requirement is either first aid treatment only and/or patientstabilization until professional medical attention is obtained.
Given the extent and sophistication of the refinery’s onsite medical resources, routine supportfrom offsite community medical facilities during construction and operation of the cogenerationfacility would most likely not be required. Medical emergencies, which historically haveoccurred infrequently at the refinery, could require medical assistance from the nearby St. JosephHospital in Bellingham. Whatcom County recently reported a population-to-physician ratio ofapproximately 555/1, which would not be significantly affected by the addition of approximately30 permanent employees, or the potential addition of up to 15 relocating employees (and theirfamily members), to the local population associated with operation of the cogeneration facility.
In the event of an extreme emergency that might necessitate involving local police, fire, ormedical services, these services would be involved as part the coordination with the Division ofEmergency Management resources, as previously described.
Communications
Operation of the cogeneration facility would require the use of communication systems andservices, which would be most heavily concentrated at the facility's administration building. Thisdemand for communications services would not likely be significant, and services would beprovided by a local communications company.

BP Cherry Point Cogeneration Project 3.13 Public Services and UtilitiesDraft EIS 3.13-16 September 2003
Public Water Supplies
Industrial Water Supply. Fresh water is currently supplied to the refinery by Whatcom CountyPUD via an existing 24-inch pipeline, which enters the refinery at the southeast corner of theproperty. Fresh water or recycled industrial water from the Alcoa Intalco Works would beconveyed to the cogeneration facility through a new 16-inch underground pipe to be constructedwithin the refinery.
No new water rights or changes to existing water rights would be required for operation of thecogeneration facility. Letters of intent have been entered into by the Applicant, Whatcom CountyPUD, and Alcoa Intalco Works to allow the cogeneration facility to purchase industrial waterthat is currently allocated to the aluminum smelter. Under this scenario, Alcoa IntalcoWorks, when operational, would be able to provide approximately 2,770 gpm, and the excess notused by the cogeneration facility could be used by the refinery, resulting in a net reduction ofwater withdrawal from the Nooksack River. If Alcoa Intalco Works is not in operation, theapproximately 2,244-2,316 gpm of process water required by the cogeneration facility would besupplied directly by the PUD. In either case, there would be no net increase in water withdrawalfrom the Nooksack River. The refinery’s water use would also be reduced by about 20 gpm as aresult of steam provided by the cogeneration facility. See Section 3.3 for additional discussion ofproject water supply/water rights issues.
Potable Water Supply. Birch Bay Water and Sewer District currently purchases water from theCity of Blaine. The Birch Bay Water and Sewer District provides potable water to the refineryvia an existing 6-inch potable water pipeline that enters the refinery in the vicinity of thecontractor's gate from a utility right-of-way along Grandview Road. Potable water to thecogeneration facility would be provided by a new potable water pipe routed between the refineryand cogeneration facility.
During operation, the cogeneration facility is expected to require only 1 to 5 gpm on the averageof potable water. This nominal amount would not impact available supplies or resources ofpotable water under current certified rights. See Section 3.3 for additional discussion of projectwater supply/water rights issues.
Wastewater
The cogeneration facility would generate wastewater from the cooling tower, the water treatmentfacility, blowdown from the heat recovery steam generators, collection of drainage fromequipment and other sources, occasional turbine blade washing, and sanitary waste. Sections 3.3and 3.4 provide detailed discussion of the expected flows and quality of various wastewaters.
During operation of the cogeneration facility, spent boiler feedwater, blowdown water, anddrainage water from various sources would enter the refinery’s existing refinery wastewatertreatment system, which currently discharges treated wastewater under the terms and conditionsof an NPDES Permit, to the Strait of Georgia through Outfall 1 at a depth of approximately 60feet beneath the refinery’s dock. The predicted flow and chemical composition of wastewatersfrom the cogeneration facility are provided in Sections 3.3 and 3.4.

BP Cherry Point Cogeneration Project 3.13 Public Services and UtilitiesDraft EIS 3.13-17 September 2003
After treatment in the refinery wastewater treatment system, wastewater from the cogenerationfacility would be discharged along with the refinery wastewater to the Strait of Georgia. Thecogeneration facility would add approximately 190 gpm on average, assuming 15 cycles ofconcentration in the cooling tower of non-recyclable process wastewater, to the refinerydischarge. EFSEC has developed draft State Waste Discharge Permit conditions for operation ofthe cogeneration facility. These conditions include discharge limitations, monitoringrequirements, reporting and record keeping requirements, an operation and maintenance plan forwater quality treatment facilities, development of SPCC and hazardous waste management plans,and a SWPP plan.
Sanitary wastes would be discharged to the Birch Bay Water and Sewer District’s treatmentsystem in accordance with the terms and conditions of an Agreement between the refinery andthe Birch Bay Water and Sewer District. The District has confirmed that it has the capacity toaccommodate the incremental combined sewage loading from the refinery and the proposedcogeneration facility. The estimated volume of sanitary waste discharge from the cogenerationfacility, which, when operational, would employ up to 30 people, would be between 1 and 5gpm.
There would be no incremental cost to the District for connection or provision of sanitary wasteservices for the cogeneration facility. Under the terms of the negotiated agreement between theApplicant and the District, the Applicant would pay for all costs associated with the connectionto the system, would hand over ownership of equipment outside the facility fence line to theDistrict, and would pay connection and monthly service fees for the service. Potential impacts onpublic wastewater treatment infrastructure associated with operation of the cogeneration facilityare considered negligible.
Sanitary waste discharges during operation of the cogeneration facility would account for a verysmall volume of discharge to the District's sanitary treatment system. Further, the capital costsassociated with connection to the District's sanitary sewer treatment system would be funded bythe Applicant and would not impose financial constraints or demands on public utilities.
Stormwater
During operation of the cogeneration facility, stormwater from site runoff would be managedthrough an onsite oil/water separation system and a wetpond for additional treatment anddetention. Stormwater that could have come into contact with oils, greases, or other contaminantswould be routed through the refinery’s wastewater treatment system. EFSEC has developed draftState Waste Discharge Permit conditions for operation of the cogeneration facility. Theseconditions include discharge limitations, monitoring requirements, reporting and record keepingrequirements, and an operation and maintenance plan for water quality treatment facilities.
The Applicant would implement and maintain BMPs to minimize potential impacts of thecogeneration facility on both the volume and quality of stormwater. A SWPP plan foroperational procedures, in conjunction with the SPCC plan, would provide structural,operational, and erosion/spill control BMPs for all stormwater operational activities at the plantsite. Because potentially contaminated stormwater associated with operation of the cogeneration

BP Cherry Point Cogeneration Project 3.13 Public Services and UtilitiesDraft EIS 3.13-18 September 2003
facility would be processed through the refinery’s existing wastewater treatment system, theproject would not impose demands on the public wastewater treatment system. Therefore,potential impacts on community stormwater infrastructure systems associated with the projectwould not occur.
Solid Waste
Table 3.13-4 summarizes anticipated categories and volumes of wastes to be generated duringoperation of the cogeneration facility.
The Applicant has not yet developed solid waste handling procedures for the cogenerationfacility. It is anticipated that during operation of the cogeneration facility, the Applicant wouldimplement similar protocols and procedures for the handling, segregation, and disposal of wastestreams and recyclables as currently managed at the refinery. Typically, the refinery retains theservices of licensed waste haulers to collect and dispose of recyclable and non-recyclable wastesat approved disposal facilities.
Table 3.13-4: Summary of Anticipated Operation Waste Streams
Waste StreamWaste StreamClassification
Estimated Amount Disposition
Boiler feedwater demineralizerregeneration waste, boiler blowdown,treated wash down, and oily drains
Non-hazardous liquids 50 gpm Discharged to refineryfor treatment per State
Waste DischargePermit
Spent SCR catalyst (heavy metals) Hazardous solids Approximately 4,800cubic feet (once every
3 - 5 years)
Recycle
Spent oxidation catalyst (noblemetals, heavy metals)
Hazardous /non-hazardous solids
Approximately 990cubic feet (once every
3 - 5 years)
Recycle/reclaim
CTG used air filters Non-hazardous Approximately 1,500filters (once every 3
years)
Landfill disposal
CGT off-line wash water Non-hazardous liquiddepending on soap type
< 4,000 gallons/month Refinery watertreatment system
Scrap wood, steel, glass, plastic,paper
Non-hazardous solids 3 cubic yards/week Landfill disposal orrecycle/reuse
Used oil filters, grease, oil rags, oilabsorbent
Hazardous solids 1 cubic yard/month Hazardous wastedisposal facility
Spent batteries Hazardous solids 100 batteries/year RecycleEmpty hazardous material containers Hazardous solids <1 cubic yard/week Hazardous waste
disposal facilitySolvents, paint, adhesives Hazardous solids <55 gallons/month Hazardous waste
disposal facilityUsed lube oils and hydraulic fluids Hazardous liquid 25,000 gallons (once
every 10 years)Recycle
Oil-water separator oil Hazardous liquid 20 gallons/month RecycleSource: BP 2002

BP Cherry Point Cogeneration Project 3.13 Public Services and UtilitiesDraft EIS 3.13-19 September 2003
Public Utilities
The cogeneration facility would generate electricity over and above the immediate requirementsof the refinery. The excess power would be transmitted through Bonneville’s Custer/AlcoaIntalco Works transmission line to the Northwest grid. A contingency analysis performed byBonneville determined that upon the loss of one of the 230 kV transmission lines from the Custersubstation, the existing 230 kV transmission lines could exceed thermal operating limitsestablished by Bonneville under certain conditions.
Two Bonneville transmission system modification options have been identified to address thispotential condition. Under Option 1, a RAS would be installed. A RAS would includeinstallation of additional electrical equipment within the Custer and Alcoa Intalco Workssubstations, and would provide for an automatic reduction in load at the Alcoa facility in theevent of a potential overtemperature condition on the Bonneville transmission lines. This optionwould not require any changes to the 230 kV lines or towers themselves, but would require theagreement of the Applicant and Alcoa Intalco Works.
Under Option 2, a second transmission line inside the existing westernmost 230 kV line corridorleading from the cogeneration interconnection point to the Custer substation would be installedto increase the transmission capacity along this segment. The existing transmission towers in thisapproximately 5-mile-long segment would not be strong enough to carry a second line, so theexisting towers would be replaced with new towers. Under this option, a RAS would not berequired.
Of the two options, the Applicant prefers Option 1 because the implementation requirements ofOption 1 would be less than those for Option 2 and the installation of new high voltagetransmission lines and associated tower replacement would not be required.
Fiscal Impacts
The refinery’s existing security, emergency medical, and fire response infrastructure would becapable of supporting the needs of these services during construction and operation of thecogeneration facility. It is anticipated that only in an extreme emergency, would localcommunity fire, police, medical services, and other government resources be called upon to helprespond to an event at the facility. During operation of the cogeneration facility, the number ofindividuals with their families that would move permanently into the area represents aninsignificant percentage of both the existing local population and the forecasted populationgrowth. Therefore, during routine construction and operation phases of the project, there wouldbe no significant staffing or other financial demands placed on external or community resourcesfor fire prevention and response, security and policing, and medical services.
Whatcom Country operates on a revenue base that has seen its revenues grow from about $92million in 1997 to $113 million in 2003. Expenditures have grown more quickly from $84million in 1997 to $121 million in 2003 (Whatcom County 2003c). Whatcom County’s 2003budget forecasts a deficit in excess of $8.5 million. The largest portion of revenue comes from

BP Cherry Point Cogeneration Project 3.13 Public Services and UtilitiesDraft EIS 3.13-20 September 2003
property, sales, excise, and timber harvest taxes, which based on 2003 projections, are expectedto generate 43% of total revenue, equal to approximately $49 million. The other major revenuecategories are intergovernmental transfers at 18%, and charges for goods and services at 16%.
The cogeneration facility would generate additional revenue to Whatcom County through salestaxes on project-related local expenditures, property taxes, and sales taxes attributable to indirecteconomic impact. These revenues are estimated at $10 million over the two-year constructionperiod, and another $4.6 million annually during operation of the cogeneration facility (seeSection 3.12). These estimates are conservative; they do not account for fiscal benefits resultingfrom indirect or induced employment, or the redistribution of increased tax revenue withinWhatcom County that would accrue to Washington State as a result of the cogeneration facility.
Relative to the present revenue of Whatcom County, the additional contribution of revenueresulting from expenditure, taxes, and income resulting from construction and operation of thecogeneration facility would be significant.
Transmission Facility and Custer/Intalco Transmission Line No. 2
Communications
Radio Interference (RI). Radio reception in the AM broadcast band (535 to 1605 kilohertz [kHz])is most often affected by corona-generated electromagnetic interference (EMI). FM radioreception is rarely affected. Generally, RI can affect only residences very near to transmissionlines. Because the new 230 kV transmission facility would be located more than 0.5 mile fromthe nearest residence and a new transmission line in the Custer/Intalco transmission corridor (ifCuster/Intalco Transmission Line Option 2 is selected) would be within the existing 125-footutility right-of-way, disruptive RI effects on local residences are not expected.
Television Interference (TVI). Corona-caused TVI occurs during foul weather and is generally ofconcern for transmission lines with voltages of 345 kV or above, and only for conventionalreceivers within about 600 feet of a line. Gap sources on distribution and low-voltagetransmission lines are the principal observed sources of TVI, and the use of modern hardwareand construction practices for the proposed transmission facility would minimize such sources.
There is a potential for interference with television signals at locations very near the proposedline in fringe reception areas. However, several factors reduce the likelihood of occurrence.Corona-generated TVI occurs only in foul weather; consequently, signals would not be interferedwith most of the time. Because television antennas are directional, the impact of TVI is related tothe location and orientation of the antenna relative to the transmission line. If the antenna werepointed away from the line, then TVI from the line would affect reception much less than if theantenna were pointed toward the line. Since the level of TVI falls off with distance, the potentialfor interference becomes minimal at distances greater than several hundred feet from thecenterline. Because the new 230 kV transmission facility would be more than 0.5 mile from thenearest residence and a new transmission line in the Custer/Intalco transmission corridor (ifCuster/Intalco Transmission Line Option 2 is selected) would be within the existing 125-footutility right-of-way, disruptive TVI effects on local residences are not expected.

BP Cherry Point Cogeneration Project 3.13 Public Services and UtilitiesDraft EIS 3.13-21 September 2003
Other forms of TVI from transmission lines are signal reflection (ghosting) and signal blockingcaused by the relative locations of the transmission structure and the receiving antenna withrespect to the incoming television signal. Television systems that operate at higher frequencies,such as satellite receivers, are not affected by corona-generated TVI, and cable televisionsystems are similarly unaffected.
Interference with television reception can be corrected by any of several approaches: improvingthe receiving antenna system; installing a remote antenna; installing an antenna for TV stationsless vulnerable to interference; connecting to an existing cable system; or installing a translator.Bonneville has an active program to identify, investigate, and mitigate legitimate RI and TVIcomplaints. It is anticipated that any instances of TVI caused by the proposed line could beeffectively mitigated.
Interference with Other Devices. Corona-generated interference can conceivably causedisruption on other communications bands such as the citizens band (CB) and mobile bands.However, mobile-radio communications are not susceptible to transmission-line interferencebecause they are generally frequency modulated (FM). Similarly, cellular telephones operate at afrequency of about 900 MHz, which is above the frequency where corona-generated interferenceis prevalent. In the unlikely event that interference occurs with these or other communications,mitigation can be achieved with the same techniques used for television and AM radiointerference.
3.13.3 Impacts of No Action
Under the No Action Alternative, the cogeneration facility would not be constructed and thepotential effects associated with the project would not occur. Tax revenue associated withconstruction and operation of the project would not be realized by the State of Washington andWhatcom County.
3.13.4 Secondary and Cumulative Impacts
The project would not contribute to any significant cumulative adverse impacts on publicservices or utilities. Construction and operation of the cogeneration facility would bring a netfiscal benefit to Whatcom County and to the State of Washington in the form of additional taxrevenues. There would be tax payments over the life cycle of the project, as well as from othergovernment revenue deriving from local employment and contracting of local services. At thesame time, the project would not impose incremental demands on local government spending,public services and utilities, or other community resources.
3.13.5 Mitigation Measures
No mitigation measures would be necessary because there are no significant adverse impacts onpublic services and utilities expected from the project. The Applicant would extend the fire,security, and emergency medical resources of the refinery to cover all but the most extremeemergencies. The project would develop response protocols with the Jurisdiction Having

BP Cherry Point Cogeneration Project 3.13 Public Services and UtilitiesDraft EIS 3.13-22 September 2003
Authority, Fire District No. 7, to ensure that additional support and resources are available fromthe district and other fire jurisdictions through the District Mutual Aid Agreements. TheApplicant would provide for treatment of industrial wastewater and stormwater using onsite andrefinery treatment systems.
3.13.6 Significant Unavoidable Adverse Impacts
No significant unavoidable adverse impacts on public services or utilities have been identified.The Applicant would extend the fire, security, and emergency medical resources of the refineryto cover all but the most extreme emergencies.
BP Cherry Point Cogeneration Project 3.14 Cultural ResourcesDraft EIS 3.14-1 September 2003
3.14 CULTURAL RESOURCES
Cultural properties or resources may include prehistoric or historic sites, districts, buildings,structures, or objects that are listed in, or eligible for listing in, the National Register of HistoricPlaces. Artifacts, records, and material remains associated with these properties and traditionalcultural properties, which include archaeological, traditional procurement, history or landmark,and religious sites, are also important resources. Several federal and state laws protect culturalresources, such as Section 106 of the National Historic Preservation Act (NHPA) and RCWchapters 27.44 and 27.53.
This section describes and summarizes archaeological and cultural resources within the BPCherry Point Cogeneration Facility study area, identifies potential impacts on these resources,and suggests mitigation measures designed to limit those impacts. Information for this sectionwas summarized from the BP Cherry Point Cogeneration Project Application for SiteCertification (BP 2002), three cultural resource reports of surveys that include the project site(Appendix B; Stone 2002; Whiteman and Sts’aStelQuyd 2002), historical maps, and otherbackground literature.
3.14.1 Existing Conditions
Introduction
The proposed cogeneration facility, its interface systems with the BP Cherry Point Refinery,electrical transmission system intertie connection, and wetland mitigation areas are locatedapproximately 15 miles northwest of Bellingham, Whatcom County, Washington. The projectsite lies about 5 miles west of I-5 and 3 miles east of Point Whitehorn and the Strait of Georgia.The proposed upgrade to a section of the Custer/Intalco Transmission Line No. 2 extends eastfrom the project site to the Custer substation adjacent to I-5. The proposed recycled wastewaterpipeline would be located in the Alcoa Intalco Works facility about 1 mile south of the projectsite.
This section of the EIS summarizes the assessments for historic, archaeological, and traditional-use resources that were conducted within the Area of Potential Effect (APE) or the geographicarea within which the proposed BP cogeneration project may affect cultural resources. The APEfor cultural resources includes the approximate footprint of the cogeneration plant site, therefinery interface, the Bonneville electrical transmission system intertie, the Custer/IntalcoTransmission Line No. 2, and other project components. The interface systems area, which islocated inside the refinery boundary, comprises Access Road 2; water, natural gas, industrial andsanitary waste pipelines; and a segment of an elevated piperack. A proposed gas compressorstation, power substations, steam and condensate piping, the remainder of the piperackassembly, Laydown Area 1-3, and detention pond 2 are additional components of thecogeneration interface with the refinery located within the refinery boundary. Other projectcomponents include a water pipeline modification at Alcoa Intalco Works, Access Road 3,
BP Cherry Point Cogeneration Project 3.14 Cultural ResourcesDraft EIS 3.14-2 September 2003
Laydown Area 4, and compensatory wetland mitigation areas. The cogeneration facility will betreated as a footprint, with no detailed discussion of impacts and mitigation of individual projectelements or features. However, the remaining components of the project will be described indetail with a discussion of impacts and mitigation measures for each feature.
The Applicant contracted with the Lummi Nation for cultural investigations of the cogenerationfacility footprint, refinery interface area including Access Road 2, Access Road 3, LaydownAreas 1-4, and a portion of the transmission system intertie line between transmission pads 1and 2. The Lummi Nation subcontracted the work to BOAS, Inc., but provided tribal members asarchaeological trainees. The Applicant also contracted with URS Corporation to conduct acultural resources assessment of the approximately 5-mile-long section of the Custer/IntalcoTransmission Line No. 2 located between the project site and the Custer substation. Native plantand archaeological surveys of the wetland mitigation areas will be conducted by BOAS, Inc. andthe Lummi Nation, but have not yet been completed. Archaeological native plant surveys havenot been conducted for Access Road 1, detention pond 2 and its discharge apron, the powersubstation located inside the refinery, the piperack assembly, the Alcoa water pipeline, and theremainder of the 0.8-mile-long transmission system intertie.
The archaeological survey associated with BOAS, Inc.’s study of the cogeneration facility andlaydown areas recorded one previously unknown archaeological site (Whiteman andSts’aStelQuyd 2002).
Applicable Historic Preservation Regulations
This section provides a list of pertinent federal and state statutes that require consideration ofimpacts on historic properties for projects with federal or state involvement. Collectively, theseregulations and guidelines establish a comprehensive program for the identification, evaluation,and treatment of cultural resources.
The National Register of Historic Places was authorized by the NHPA of 1966 and is thenation’s official list of historic properties worthy of preservation. Properties listed in theNational Register include districts, sites, buildings, structures, and objects that are significant inAmerican history, architecture, archaeology, engineering, and culture, at a local, state, or nationallevel of significance. Within the state of Washington, the Office of Archaeology and HistoricPreservation (OAHP), under the direction of the State Historic Preservation Officer, administersthe National Register program.
The following criteria are used in evaluating cultural properties that are more than 50 years old orthat have achieved significance in the last 50 years for listing in the National Register (36 CFR60.4):
• properties that are associated with events that have made a significant contribution to thebroad patterns of our history; or

BP Cherry Point Cogeneration Project 3.14 Cultural ResourcesDraft EIS 3.14-3 September 2003
• properties that are associated with the lives of people significant in our past; or• properties that embody the distinctive characteristics of a type, period, or method of
construction, or that represent the work of a master, or that possess high artistic values, orthat represent a significant and distinguishable entity whose components may lack individualdistinction; or
• properties that have yielded, or may be likely to yield, information important to prehistoryor history.
As mandated by Section 106 of the NHPA, agencies are required to take into account the effectsof their actions on historic properties and to allow the Advisory Council on Historic Preservationan opportunity to comment. Properties eligible for inclusion in the National Register areidentified, and the effect of the undertaking on each historic property must be determined, eitherno effect or effect. If an effect is determined, measures to mitigate or reduce the effect aredeveloped, agreed upon, and implemented.
The Archaeological and Historic Preservation Act (AHPA) of 1974, also known as theArchaeological Data Preservation or Moss-Bennett Act, directs agencies to report to theSecretary of the Interior if a project will cause the loss of significant scientific, prehistoric,historic, or archaeological data. The agency may request that the Department of the Interiorconduct or assist with the salvage of these data. The AHPA is largely redundant to the NHPA,however, this act is used as the authority if an archaeological site is discovered after thecompletion of Section 106 of the NHPA review.
The American Indian Religious Freedom Act of 1978, as amended in 1996, requires agencies toconsult with Indian tribes to determine if an undertaking may affect the practice of traditionalreligions and the places and physical paraphernalia needed for those practices.
The Native American Graves Protection and Repatriation Act (NAGPRA) of 1990 requires thatfederal agencies repatriate Indian ancestral human remains to tribes with cultural or geneticaffiliation with such remains and funerary items.
Executive Orders (EOs) 13084 and 13175 establishes government-to-government relationshipsbetween Indian tribes and the federal government and its agencies. EO 13175, signed in 2000 andrevoking the earlier EO 13084, requires that agencies have an accountable process for tribalofficials to provide comment and input on regulatory policies that have tribal implications.
RCW Chapter 27.44 protects Indian burial sites, cairns, petroglyph (incised in stone) andpictograph (painted) markings, and historic graves on public and private land. The chapter furtherstipulates that persons knowingly removing, destroying, or defacing these resources will becharged with a Class C felony.
RCW Chapter 27.53 protects sites, objects, structures, artifacts, and locations of prehistoric orarchaeological interest located in, on, or under the surface of any lands or waters owned or under

BP Cherry Point Cogeneration Project 3.14 Cultural ResourcesDraft EIS 3.14-4 September 2003
the control of the state of Washington or its counties, cities, or political subdivisions. Disturbingarchaeological resources without an archaeological excavation permit is punishable as a Class Cfelony.
3.14.2 Cultural Context
Methods
Background archival research for the proposed project assisted in the evaluation of the NationalRegister eligibility of resources that are 50 years or older located within the APE. URS conducteda record search and literature review at OAHP in Olympia, Washington. URS staff reviewedmaps, site files, and Whatcom County survey report files to determine the presence or absence ofpreviously recorded archaeological sites in the Custer/Intalco Transmission Line No. 2 corridor aswell as the extent of previous archaeological survey coverage in the project vicinity. URS alsoreviewed General Land Office plats and patent records to assess historic land use patterns andthe potential for early historic period sites or features in the project area.
The field survey for this portion of the proposed project occurred on January 23-24, 2003, andconsisted of a pedestrian survey conducted at approximately 49-foot transect intervals within the131-foot-wide corridor. URS field staff examined exposed cuts and banks, rodent spoil piles, andother soil exposures. To increase the amount of subsurface examined, URS also excavated 6-inch-diameter soil probes at periodic intervals along the corridor’s length. Additional soil probes wereplaced at anticipated tower locations. The probes averaged approximately 16 to 23 inches belowthe ground surface, reaching groundwater as little as 4 to 6 inches below the ground surface inmany of the probes. URS identified no historic or archaeological resources in the Custer/IntalcoTransmission Line No. 2 survey corridor.
BOAS, Inc. conducted two studies for components of the project. A May 2002 assessmentincluded an archaeological and native plant survey of most of Access Road 3 located south of theproposed cogeneration facility site. BOAS also surveyed a second access road locatedapproximately 0.5 mile east of Access Road 3. The December 2002 BOAS study examined theproposed cogeneration facility site, the refinery interface area extending from Grandview Roadsouth to the existing Ferndale natural gas metering station, the remainder of Access Road 3, and atransmission pad to be located at the junction of the transmission intertie line and Custer/IntalcoTransmission Line No. 2. BOAS performed background research at OAHP, the University ofWashington Library, Whatcom County Auditor’s office, Western Washington UniversityLibrary, Whatcom County Museum of History and Art, Bellingham Public Library, BP CherryPoint Refinery, and the BOAS, Inc. office library.
BOAS’ two sets of archaeological field work began on July 18, 2001, and October 14, 2002. Thepedestrian survey of the access roads used three transects spaced at approximately 3- to 5-footintervals. BOAS excavated a single line of subsurface 20-by-20-inch shovel probes in the roadcorridor spaced at approximately 66 feet. Additional probes were placed beyond the corridor

BP Cherry Point Cogeneration Project 3.14 Cultural ResourcesDraft EIS 3.14-5 September 2003
centerline in areas of potential turns in the route. The shovel probes averaged approximately 20-23 inches below the ground surface. Bucket augers were used to extract sediments from greaterdepths than could be reached by a shovel in each probe, averaging approximately 27 inches belowthe ground surface. An approximately 0.6 inch3 sample from every 12th probe was screenedthrough 1/8-inch wire mesh. The pedestrian survey of the remainder of BOAS’ assessment areaused an approximately 98-foot transect interval for the laydown areas and an approximately 33-foot interval for the access roads and transmission line segment. Subsurface probing in the secondBOAS survey followed the same protocols as the first, except that probes were placed at anapproximately 98-foot interval and all sediments were screened through 1/4-inch wire mesh. Theaverage depth of the probes was approximately 19 inches below the ground surface in LaydownAreas 1-3, approximately 16 inches in Laydown Area 4, approximately 17 inches in the northernportion of Access Road 3, approximately 19 inches at the cogeneration site, and approximately21 inches in the transmission pad areas.
The Lummi Nation and BOAS conducted a native plant study during the first survey, butpostponed the study for the second survey area until plants could be more readily identified inthe spring and summer. During the first survey, the survey corridor was mowed and traditionallyused plants were identified at 3.3-inch intervals on the periphery of the mowed areas betweenshovel probe locations. The Lummi plant surveyors identified several sensitive areas that wereavoided during road construction under the supervision of archaeological and tribal monitoringstaff.
Ground visibility in the URS study area was low due to the majority of the route crossingthrough pasture. Dense grass and blackberry thickets obscured ground visibility along the accessroad routes during BOAS’ first assessment. Similar conditions existed prior to the second survey,but the cogeneration area was mowed prior to the pedestrian survey to increase visibility.
Prehistory
Descriptions of cultural change in Northwest Coast prehistory is based on changes inarchaeological artifact assemblages, food and resource procurement, and settlement patterns overtime within a regional environmental framework. The prehistoric record for Puget Sound isdivided into three broad chronological periods: the Early Period (15,000–5,000 Before Present),the Middle Period (5,000-1,000 Before Present), and the Late Period (1,000-250 Before Present).
The Early Period is characterized by chipped stone assemblages attributable to fluted projectilepoint, leaf-shaped projectile point, and cobble tool traditions. Subsistence patterns exhibit areliance upon inland hunting, supplemented with fishing and marine invertebrate procurement inriverine and coastal areas. Settlements were typically located on upland plateaus or river terraces,although coastal occupations may have been flooded because of seismic activity or changes in sealevel related to glaciation (Carlson 1990; Kidd 1964; Nelson 1990).

BP Cherry Point Cogeneration Project 3.14 Cultural ResourcesDraft EIS 3.14-6 September 2003
The Middle Period represents a proliferation in tool diversity within regional assemblages.Notched stone projectile points were characterized by a decrease in size, and toolkits weresupplemented with groundstone, bone, and antler industries. Subsistence practices showed anincreased orientation toward marine and riverine habitats; shellfish, salmon, and sea mammalsbecame more important resources; and shell middens appeared in the archaeological record.Occupation areas expanded to include modern shorelines and islands and the earliest evidence ofseasonal village sites dates to this period (Carlson 1990; Kidd 1964; Nelson 1990).
The Late Period is characterized by assemblages containing exotic trade goods imported fromindigenous populations in the Columbia Plateau as well as metal arrowheads and trade beads fromEuro-American groups. Small side-notched and triangular stone projectile points persisted butwere superceded by an emphasis on bone and antler tools. Salmon became a major staple asevidenced by elaborate fish traps; subsistence practices were supplemented by terrestrial huntingand plant procurement. Permanent, village sites described by Euro-American settlers andethnographers were established and persisted into the historic period (Carlson 1990; Kidd 1964;Nelson 1990).
Ethnohistory
During late historic times, Central Coast Salish Indians occupied the northern Puget Sound area.Three linguistic subdivisions of Central Salish occur in the vicinity of Cherry Point. Halkomelemspeakers lived north of Birch Point and along the lower Fraser River valley. Nooksack speakerslived in inland sections of the Nooksack River drainage, and North Straits’ speakers occupied thecoastal areas north of Anacortes as well as the San Juan and other islands in the southern sectionof the Strait of Georgia. The BP Cherry Point Cogeneration project is situated in an area ceded bythe Lummi, Nooksack, and Samish Indians; these groups now comprise the Lummi Indian Nation(Ruby and Brown 1986; Suttles 1990; Thompson and Kinkade 1990).
The Lummi are thought to have derived their name from Lkungen, the name that the NorthStraits-speaking Songish of Vancouver Island called themselves. The Lummi occupied coastalareas surrounding the mouth of the Nooksack River as well as several islands in Puget Sound. TheNooksack, meaning “mountain men,” lived in the Nooksack River drainage. The Samish occupiedadditional islands in Puget Sound, including one that now bears their name as well as Guemes andFidalgo islands (Ruby and Brown 1986; Suttles 1990; Swanton 1978).
The focus of the Central Coast Salish yearly cycle was the permanent winter village, whichconsisted of one or more cedar plank longhouses in which several families resided. The CentralCoast Salish traded resources with other groups during the fall, and tool maintenance, basket andblanket weaving, woodcarving, and storytelling occurred during the winter in the villages. Thehouses measured between 20 and 60 feet in width and 40 and 120 feet in length and were builtparallel to the shore. Each house featured wall and shed roof planks that were removable in fairweather. Principal villages near the project vicinity include Sce’wex on Birch Bay, S’ilec andTa’telew on Semiahmoo Bay, and Elek and Sxwelisen on Bellingham Bay. The name for Cherry

BP Cherry Point Cogeneration Project 3.14 Cultural ResourcesDraft EIS 3.14-7 September 2003
Point, Xwechi’exen, derives from the word for “weasel” in the Lummi language. Lake Terrell isalso known as Xwhal le man and refers to twined-rope reef net materials gathered in its vicinity(Stone 2002; Suttles 1990; Swanton 1978).
Subsistence revolved around seasonal harvests of marine and terrestrial foods that were eatenfresh or dried and stored for winter use. Salmon, halibut, herring, lingcod, and flounder werecaught with reef nets, hook-and-line, and spears. The Central Coast Salish men used pitfalls,snares, bow and arrow, and nets to hunt deer, elk, bear, and over 30 species of waterfowl.Women gathered clams, mussels, herring eggs, crabs, sea urchins, and barnacles along the coast.Indian people also harvested many varieties of roots, berries, and other fruits (BP 2002; Suttles1990). The Central Coast Salish used western yarrow, creambush oceanspray, western red cedar,swordfern, salal, skunk cabbage, and vine maple for pharmaceutical, technological, and ceremonialuse (Moerman 1999; Suttles 1990). In the project vicinity, people mined the Cherry Pointshoreline for stone to use as anchors, sinkers, other weights, and for hammers and mauls. TheLummi people continue to maintain their usual and accustomed use of the resources in the projectvicinity for traditional purposes (BP 2002).
The arrival of Euro-Americans was presaged by outbreaks of epidemics that decimated nativepopulations. Euro-American fur traders were followed by incursions of missionaries and settlerswho dislocated native groups. Alcohol, disease, and relocation disrupted social and politicalorganization (Suttles 1990).
Between 1854 and 1855, Isaac Stevens, the first governor of Washington Territory, compelledthe Lummi and other Puget Sound Indians to relocate to reservations. Under the Point ElliotTreaty of 1855, the Lummi were sent to the Lummi Reservation that included one of theirprincipal village locations. However, the territorial government expected them to share it with theNooksack and Samish. Most tribal members found work in local Euro-American mills, canneries,and mines. A court decision in 1897 awarded Euro-Americans rights to the Lummi IndianNation’s ancestral fishing grounds that were not reversed until 1974 (Ruby and Brown 1986;Suttles 1990).
History
Although Russian, Spanish, and British naval expeditions are thought to have penetrated thecoastal waters off Washington as early as the middle 1700s, British Captain George Vancouver’sarrival in 1792 marks the earliest undisputed record of Euro-American contact in the Puget Soundregion (Cole and Darling 1990; Kirk and Alexander 1990; Marino 1990).
Exploration was followed by incursions of Euro-American fur traders under the aegis of theHudson’s Bay Company during the 1830s. Early contacts between Euro-American traders andnative populations proved disastrous to the latter as they fell victim to waves of malaria,tuberculosis, and smallpox epidemics in the late 1700s and middle 1800s (Cole and Darling 1990;Marino 1990; Suttles 1990).

BP Cherry Point Cogeneration Project 3.14 Cultural ResourcesDraft EIS 3.14-8 September 2003
In 1818, the Oregon Country, which included Washington State, was subject to both UnitedStates and British rule. By 1846, disputes over the area drew to a close when a treaty confirmedthe international boundary line between Washington Territory and British Columbia (Kirk andAlexander 1990; Marino 1990).
A General Land Office (GLO) survey map made in 1859 shows no Euro-American developmentsuch as houses or roads in the project site (GLO 1859).
Agency and Tribal Consultation
Bonneville has contacted the Lummi Nation and consultation is ongoing. Documentation of theSection 106 consultation process will be included in a future version of this EIS once discussionshave been completed.
Previous Cultural Investigations in the Project Vicinity
The University of Washington and Western Washington University conducted some of theearliest archaeological investigations in the Birch Bay area, beginning in the 1960s. Archaeologistsrecorded a shell midden site, three prehistoric sites that included fire-cracked rock and flakedstone artifacts, and two possible earth ovens all within one mile of the project site. These sitelocations ranged from coastal areas 25 to 100 feet above the beach to inland areas, including theTerrell Creek drainage (Bailey 1970; Grabert and Hall 1978; King 1990; Larsen 1969; Larsen andOsier 1969).
Investigations in the Cherry Point Industrial Park noted sparse deposits of flaked stone tools,stone tool manufacture debris, fire-cracked rock, and the remains of a historic house. Althoughthese materials were determined not to be significant, the researchers recommended archaeologicalmonitoring of construction activities in the area (Miss 1992; Rice 1992). A survey of theFerndale pipeline, which included a segment along Grandview Road, did not uncover any culturalresources in the project site (Kusmer and Blukis Onat 1989). A second pipeline survey for aproposed Cascade Natural Gas line, which was located approximately 1,000 feet east of theproject site, also did not record any cultural resources (Woodman and Mighetto 1992).
Eastern Washington University conducted a survey in 1995 within the BP Cherry Point Refineryfor a substation and associated transmission corridor that cross the current project site. Thesurvey noted poor ground visibility because of heavy vegetation cover and high groundwaterlevels that prevented subsurface investigations. Although their survey did not uncover culturalresources, the researchers concluded that the area had the potential to contain archaeological sitesbecause of the number of recorded artifacts in the surrounding area (Luttrell 1995).

BP Cherry Point Cogeneration Project 3.14 Cultural ResourcesDraft EIS 3.14-9 September 2003
Results of Cultural Resource Studies for the Proposed Project
BOAS, Inc. conducted two archaeological surveys and the first of two native plant studies for thecurrent project (Stone 2002; Whiteman and Sts’aStelQuyd 2002). The May 2002 work consistedof a pedestrian survey, subsurface probing, archaeological construction monitoring, and the nativeplant survey for the east and west access road areas. No cultural resources or buriedarchaeological deposits were recorded by the survey. Lummi Indian Nation elders identifiedseveral culturally important plants in the native plant survey, including horsetail, reedcanarygrass, bracken fern, plantain, wild carrot, nettle, various berries, red willow, oceanspray,vine maple, alder, and several types of coniferous trees. BOAS and the Lummi Indian Nationanticipate finding similar plant resources in a subsequent plant survey of the project’s wetlandmitigation area and propose that the data be used in conjunction with restoration of native planthabitat in the wetland mitigation area. Wetland mitigation area plants will be studied beforeSeptember 2003. The wetland mitigation area will be disced to reduce reed canarygrass cover andBOAS will survey the area for archaeological materials at that time (BP 2002; Stone 2002;Whiteman and Sts’aStelQuyd 2002).
The second BOAS survey covered the construction Laydown Areas, main cogeneration facilitylocation, an additional access road, transmission tower pad location, and wetland mitigation area.Pedestrian survey and shovel probing of these areas identified one scatter of stone tools andstone flake debris. The materials were discovered between 4 and 12 inches below the groundsurface. The site was recommended as insignificant (BP 2002; Whiteman and Sts’aStelQuyd2002).
3.14.3 Impacts of the Proposed Action
Construction
Cogeneration Site
BOAS, Inc. recorded no cultural resources in this area. However, the Lummi Indian Nation’ssecond native plant survey has not been completed. The results of this study may identifytraditional resources in this area. An archaeological survey has not been conducted for the AccessRoad 1 area. Impacts on cultural resources in this area cannot be assessed until an evaluation hasbeen made.
Refinery Interface
A BOAS, Inc. survey in 2002 recorded one archaeological site in Laydown Area 3 that appears tobe insignificant and therefore ineligible for listing in the National Register. Because the site is notconsidered significant, the proposed project would not have any impacts on cultural resources.However, the Lummi Indian Nation’s second native plant survey has not been completed. Theresults of this study may identify traditional resources in this area.

BP Cherry Point Cogeneration Project 3.14 Cultural ResourcesDraft EIS 3.14-10 September 2003
In addition, archaeological surveys have not been conducted for detention pond 2 and itsdischarge apron, the power substation located inside the refinery, industrial or sanitarywastewater pipelines, or the piperack assembly. Impacts on cultural resources in this area cannotbe assessed until an evaluation has been made.
Transmission System
BOAS, Inc. recorded no cultural resources in the segment of this area that was surveyed.However, the Lummi Indian Nation’s second native plant survey has not been completed. Inaddition, an archaeological survey has not been conducted for the remaining portion of the 0.8-mile-long transmission system intertie. The results of these studies may identify traditionalresources or sites in this area.
Custer/Intalco Transmission Line No. 2
URS recorded no cultural resources in this area that would be affected by the lattice tower ormonopole options. However, a native plant survey has not been conducted for this area. Theresults of this study may identify traditional resources in this area.
Other Components
Alcoa Water Pipeline
An archaeological survey has not been conducted for this area. Impacts on cultural resources inthis area cannot be assessed until an evaluation has been made.
Access Road 3
BOAS, Inc. recorded no cultural resources in the Access Road 3 area. No impacts on culturalresources would result in this area.
Laydown Area 4
BOAS, Inc. recorded no cultural resources in this area. However, the Lummi Indian Nation’ssecond native plant survey has not been completed. The results of this study may identifytraditional resources in this area.
Wetland Mitigation Area
Archaeological surveys have not been conducted for the wetland mitigation area. In addition, theLummi Indian Nation’s second native plant survey has not been completed. The results of thisstudy and its associated archaeological survey may identify traditional resources or sites in the
BP Cherry Point Cogeneration Project 3.14 Cultural ResourcesDraft EIS 3.14-11 September 2003
wetland mitigation area. Impacts on cultural resources in this area cannot be assessed until anevaluation has been made.
Operation
Operation of the project would not affect any cultural resources at any of the projectcomponents.
3.14.4 Impacts of No Action
Under the No Action Alternative, the cogeneration facility would not be constructed, andpotential cultural resource impacts associated with the project would not occur.
3.14.5 Secondary and Cumulative Impacts
The BP Cherry Point Cogeneration Project and the GSX project may not spur furtherdevelopment within the refinery area. Construction for continued facility development, such asroad building or transmission line construction, could affect archaeological deposits, tribalresources, and historic properties in currently undeveloped areas within the refinery complex.Specific locations where this development might occur, however, are unknown.
3.14.6 Mitigation Measures
Construction
Cogeneration Site, Refinery Interface, Transmission System, and Other Project Components
In the areas it surveyed, BOAS Inc. recommends that if intact archaeological resources or humanburials are encountered during construction, then the construction foreman should immediatelydirect activities that could further disturb the deposits away from their vicinity. The constructionforeman or the Applicant would then contact EFSEC, Dr. Robert G. Whitlam, Washington StateArchaeologist, and Lummi Indian Nation cultural resource staff who would assist in determininghow the materials should be treated. BOAS further recommends construction monitoring of thearea within approximately 100 feet of the boundaries of the archaeological site discovered inLaydown Area 3.
In addition to the mitigation measures proposed by the Applicant, it is recommended thatarchaeological and native plant surveys be conducted for detention pond 2 and its dischargeapron, the power substation located inside the refinery, industrial or sanitary wastewaterpipelines, the piperack assembly, Alcoa water pipeline route, Access Road 3, and the wetlandmitigation areas. If no significant archaeological resources are discovered or if they would not beaffected by the project, construction of the proposed facility would not affect cultural resources

BP Cherry Point Cogeneration Project 3.14 Cultural ResourcesDraft EIS 3.14-12 September 2003
and no mitigation is necessary. If significant resources were found that would be affected by theproject, however, appropriate mitigation measures should be devised before construction begins.
Custer/Intalco Transmission Line No. 2
URS recommends if intact archaeological resources or human burials are encountered duringconstruction, that the construction foreman should immediately direct activities that could furtherdisturb the deposits away from their vicinity. A qualified archaeologist should evaluate the findand determine an appropriate course of action.
Operation
Operation of the project would not affect any cultural resources, and no mitigation measures arerequired in this area.
3.14.7 Significant Unavoidable Adverse Impacts
Because cultural resources are not anticipated to be affected, no significant unavoidable adverseimpacts on cultural resources would result from construction, operation, and maintenance of theproposed project.

BP Cherry Point Cogeneration Project 3.15 Traffic and TransportationDraft EIS 3.15-1 September 2003
3.15 TRAFFIC AND TRANSPORTATION
This section discusses potential traffic and transportation impacts associated with the proposedproject and identifies mitigation measures designed to limit the extent and magnitude of theimpacts. Transportation and traffic data and the impact analysis are based on a literature reviewand field surveys performed by the Applicant.
3.15.1 Existing Conditions
Site Location and Access
The proposed project would be sited on the eastern edge of the refinery between Grandview andBrown roads. The project area is approximately 6 miles northwest of Ferndale, Washington, 7miles southeast of Blaine, Washington, and about 15 miles north of Bellingham, Washington.The nearest community is Birch Bay, Washington, approximately 2 miles northwest of the site.The U.S.-Canada border is approximately 8 miles directly north of the proposed project site.
Figure 3.15-1 shows the transportation network in the surrounding area. The cogenerationfacility and construction laydown areas are located on the south side of Grandview Road, eastand west of Blaine Road, respectively, and on the east side of the existing refinery.
Roadways
Figure 3.15-2 shows existing roadway characteristics in the project vicinity. SR 548 is a two-lanestate highway classified by WSDOT as a collector and a class two access highway.
SR 548 was recently improved from I-5 to Blaine Road under a project that provided a pavementoverlay and improved pavement markings and traffic signs. The roadway has 11-foot-wide lanes,8-foot-wide paved shoulders, drainage ditches, and wire fences on both sides. The posted speedlimit is 50 mph.
The SR 548/Blaine Road intersection is in the center of the project site. SR 548 makes a right-angle turn at this intersection, with the state highway designation on the east and north legs.North of the Blaine Road intersection, the posted speed limit is 45 mph.
Other than SR 548, the other public roads in the vicinity are county roads such as GrandviewRoad, which is west of Blaine Road along the north frontage of the refinery. County roads in thearea are two-lane rural roads. Speed limits are generally 50 mph, except for more developedareas such as in the Birch Bay area and near Blaine, Ferndale, and the I-5 interchanges, wherethe speed limits are lower.
The Applicant’s property has a network of private roads that serve the refinery and provideaccess to the project site. The south leg of the SR 548/Blaine Road intersection is a paved,private road with a locked gate. It is posted with a sign that reads, “BP Property, ContractorEntrance, Not a Through Road.” The gate, marked with orange reflectors, is normally closed andlocked.

BP Cherry Point Cogeneration Project 3.15 Traffic and TransportationDraft EIS 3.15-2 September 2003
Pedestrian and Bicycle Facilities
There are no improved pedestrian or bicycle facilities in the project vicinity.
Traffic Volumes
Table 3.15-1 summarizes average daily traffic (ADT) volumes at various locations on SR 548(from 1996 through 2000). Trucks comprised approximately 12% of the 1999 ADT on SR 548between I-5 and Portal Way, of which 6% were single unit, 3% double units, and 3% triple units.
Figure 3.15-3 shows available historical daily traffic counts on the roads in the project vicinity,taken from traffic counts conducted by WSDOT and Whatcom County (from 1995 through2000). During 2000, the ADT on I-5 south of SR 548 was 33,000 and the ADT on I-5 north ofSR 548 was 25,000.
Average weekday traffic volumes are generally higher in the summer and lower in the winterbecause of increased recreational, agricultural, and construction traffic in the summer. Augusthas the highest traffic volumes, approximately 13% higher than the annual average, and Januaryhas the lowest traffic volumes, approximately 20% lower than the annual average.
Table 3.15-1: Average Daily Traffic Volumes on SR 548
Location 1996 ADT 1997 ADT 1998 ADT 1999 ADT 2000 ADT
West of I-5 7,300 7,500 7,500 7,600 9,100West of Portal Way Not Available Not Available Not Available 6,100 6,200West of Vista Drive 2,800 2,900 3,500 3,600 3,700West of Kickerville Road 2,700 2,800 2,800 3,200 3,200South of Birch Bay-Lynden Road 2,000 2,000 2,100 2,100 2,800South of Peace Portal Drive 7,400 5,700 5,800 6,000 6,000Source: WSDOT and Whatcom County
Figure 3.15-4 shows 2001 average daily traffic volumes on roads in the project vicinity. Existingtraffic volumes were predicted by applying a 6% annual growth rate in traffic volumes, whichwas determined by comparing the growth in ADT on SR 548 contained in WSDOT’s annualtraffic reports.
Figure 3.15-5 shows 2001 weekday PM peak-hour traffic volumes at intersections on SR 548.The Applicant identified these intersections as locations that would be used by project traffictraveling to and from the proposed project. Weekday PM peak-hour traffic volumes are typicallyused for analysis because they reflect traffic conditions when the potential for congestion isgreatest. The PM peak-hour traffic volumes shown in Figure 3.15-5 were counted during thetwo-hour commuter peak period from 4 to 6 p.m. The PM peak hour typically begins between4:30 and 5 p.m. The peak traffic direction on SR 548 is eastbound during the PM peak hour,largely from employees leaving the refinery.

BP Cherry Point Cogeneration Project 3.15 Traffic and TransportationDraft EIS 3.15-3 September 2003
Figure 3.15-1: Transportation Network in the Project Vicinity

BP Cherry Point Cogeneration Project 3.15 Traffic and TransportationDraft EIS 3.15-4 September 2003
Figure 3.15-2: Existing Roadway Characteristics

BP Cherry Point Cogeneration Project 3.15 Traffic and TransportationDraft EIS 3.15-5 September 2003
Figure 3.15-3: Available, Historical Daily Traffic Counts

BP Cherry Point Cogeneration Project 3.15 Traffic and TransportationDraft EIS 3.15-6 September 2003
Figure 3.15-4: 2001 Average Daily Traffic Volumes

BP Cherry Point Cogeneration Project 3.15 Traffic and TransportationDraft EIS 3.15-7 September 2003
Figure 3.15-5: 2001 Weekday PM Peak-Hour Traffic Volumes

BP Cherry Point Cogeneration Project 3.15 Traffic and TransportationDraft EIS 3.15-8 September 2003
Refinery Construction Activity
Construction activities are a regular occurrence at the refinery site. The number of constructionworkers varies between approximately 400 and 2,400 depending on the type and number ofprojects under way. According to the Applicant, the construction peak occurs during a two- tothree-week period every two to three years, when a major maintenance overhaul is performed atthe refinery.
Transit, Pedestrian, and Nonmotorized Traffic
There is no transit bus service in the project vicinity. Existing pedestrian and bicycle trafficvolumes on roadways in the area are extremely low.
Levels-of-Service
Level-of-service (LOS) is a qualitative measure that is typically used to describe operationalconditions within a traffic flow and the perception of these conditions by drivers or passengers.These conditions include factors such as speed, delay, travel time, freedom to maneuver, trafficinterruptions, comfort, convenience, and safety. LOS is given letter designations from A to F,with A representing the best operating conditions (free flow, little delay) and F representing theworst (congestion, long delays).
Table 3.15-2 shows existing PM peak-hour LOS and average delays at eight intersections on SR548. Because of the relatively low existing traffic volumes, these intersections currently operateat LOS B or C, which indicates there is no significant traffic queuing or congestion.
Table 3.15-2: PM Peak-Hour Level-of-Service Summary
Intersection Movement/Approach LOS1
SR 548/I-5 northbound on-ramp (MP 0.00) Northbound C (17.6)SR 548/I-5 southbound on-ramp (MP 0.09) Southbound B (11.7)SR 548/Portal Way (MP 0.29) Overall C (16.3)SR 548/Vista Drive (MP 0.97) Overall B (10.7)SR 548/Kickerville Road (MP 4.93) Northbound B (14.0)SR 548/Blaine Road (MP 5.93) Southbound B (12.0)SR 548/Birch Bay-Lynden Road (MP 8.96) Overall B (13.8)SR 548/Peace Portal Drive (MP 11.80) Southbound C (16.8)1 Number shown is the average control delay in seconds per vehicle for the overall intersection at an all-way, stop-controlled
intersection, or worst-case approach at a stop-sign-controlled intersection. These values determine the LOS for intersectionsaccording to the 2000 Highway Capacity Manual (Transportation Research Board 2000).
MP = milepost
The transportation element of the Whatcom County Comprehensive Plan designates LOS C asthe LOS standard for rural state routes and LOS D as the LOS standard for urban state routes inWhatcom County (1997). The comprehensive plan designates various UGAs within the county.The proposed cogeneration facility is located within the Major/Port Industrial UGA. SR 548 iswithin the UGA from Kickerville Road to approximately one-half mile east of Blaine Road, and
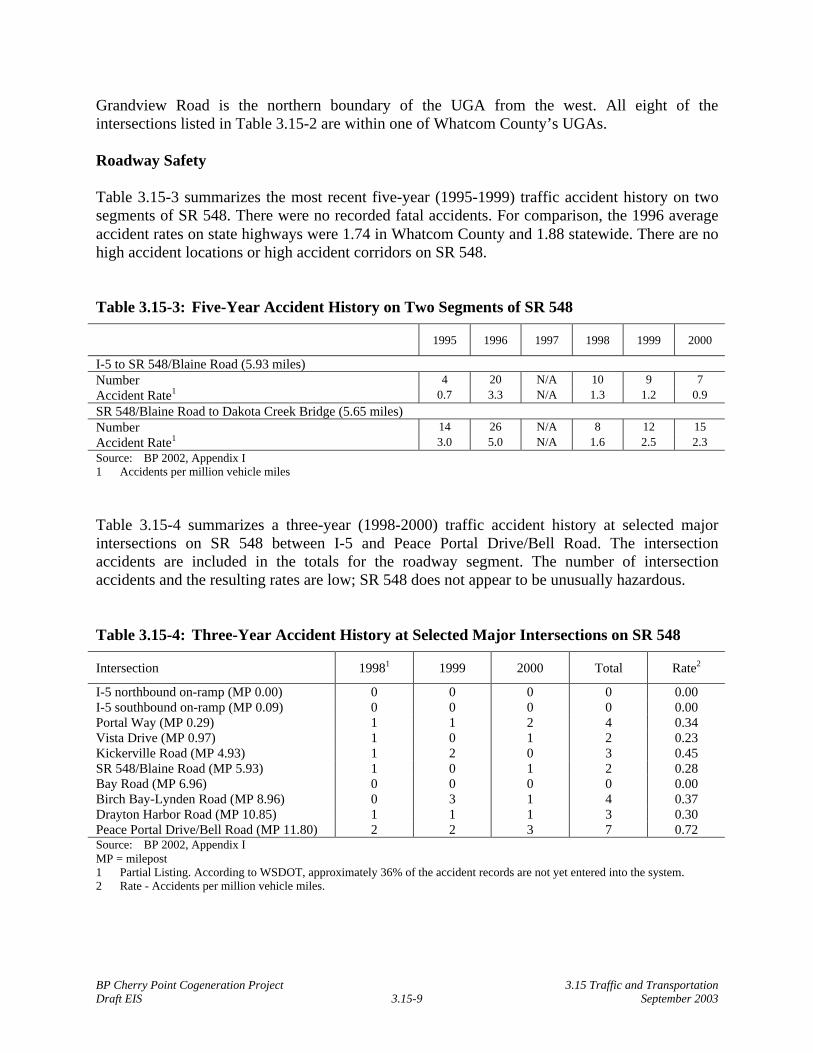
BP Cherry Point Cogeneration Project 3.15 Traffic and TransportationDraft EIS 3.15-9 September 2003
Grandview Road is the northern boundary of the UGA from the west. All eight of theintersections listed in Table 3.15-2 are within one of Whatcom County’s UGAs.
Roadway Safety
Table 3.15-3 summarizes the most recent five-year (1995-1999) traffic accident history on twosegments of SR 548. There were no recorded fatal accidents. For comparison, the 1996 averageaccident rates on state highways were 1.74 in Whatcom County and 1.88 statewide. There are nohigh accident locations or high accident corridors on SR 548.
Table 3.15-3: Five-Year Accident History on Two Segments of SR 548
1995 1996 1997 1998 1999 2000
I-5 to SR 548/Blaine Road (5.93 miles)Number 4 20 N/A 10 9 7Accident Rate1 0.7 3.3 N/A 1.3 1.2 0.9
SR 548/Blaine Road to Dakota Creek Bridge (5.65 miles)Number 14 26 N/A 8 12 15Accident Rate1 3.0 5.0 N/A 1.6 2.5 2.3Source: BP 2002, Appendix I1 Accidents per million vehicle miles
Table 3.15-4 summarizes a three-year (1998-2000) traffic accident history at selected majorintersections on SR 548 between I-5 and Peace Portal Drive/Bell Road. The intersectionaccidents are included in the totals for the roadway segment. The number of intersectionaccidents and the resulting rates are low; SR 548 does not appear to be unusually hazardous.
Table 3.15-4: Three-Year Accident History at Selected Major Intersections on SR 548
Intersection 19981 1999 2000 Total Rate2
I-5 northbound on-ramp (MP 0.00) 0 0 0 0 0.00I-5 southbound on-ramp (MP 0.09) 0 0 0 0 0.00Portal Way (MP 0.29) 1 1 2 4 0.34Vista Drive (MP 0.97) 1 0 1 2 0.23Kickerville Road (MP 4.93) 1 2 0 3 0.45SR 548/Blaine Road (MP 5.93) 1 0 1 2 0.28Bay Road (MP 6.96) 0 0 0 0 0.00Birch Bay-Lynden Road (MP 8.96) 0 3 1 4 0.37Drayton Harbor Road (MP 10.85) 1 1 1 3 0.30Peace Portal Drive/Bell Road (MP 11.80) 2 2 3 7 0.72Source: BP 2002, Appendix IMP = milepost1 Partial Listing. According to WSDOT, approximately 36% of the accident records are not yet entered into the system.2 Rate - Accidents per million vehicle miles.

BP Cherry Point Cogeneration Project 3.15 Traffic and TransportationDraft EIS 3.15-10 September 2003
Waterborne, Air, and Rail Traffic
Recreational boats, commercial ships, and barges operate in the Strait of Georgia and its bays inthe project vicinity. Boat launch ramps and associated facilities are available to recreationalboaters at Birch Bay.
The refinery owns and operates a pier at Cherry Point, about 1 mile southwest of the proposedproject site. The refinery pier serves ocean-going tankers that deliver crude oil from Alaska tothe refinery. Ships and barges also operate from the pier to move refined petroleum productsfrom the refinery to market. Tanker trucks move petroleum products from a truck rack located atthe refinery to local markets. The nearest airport is Blaine Municipal Airport, approximately 7miles north of the proposed project site in Blaine. The other airport in the area is BellinghamAirport, approximately 12 miles to the southeast.
An active railroad track owned and operated by BNSF railway parallels I-5 along the west sideof Portal Way and Peace Portal Drive (Figures 3.15-1 through 3.15-8). The single-track lineconnects the BNSF transcontinental mainline in Everett with Bellingham, Ferndale, Blaine, andVancouver, Canada. The railroad speed limit is 50 mph. Between Ferndale and Blaine, the BNSFrailroad track crosses 10 roadways. SR 548 is the principal route to and from I-5 for haulingmaterials. All of the railroad grade crossings on SR 548 are protected by active warning devices,including flashing red lights and gate arms, as well as passive warning devices such as signs andpavement markings. The railroad crossing and other locations are shown in Table 3.15-5 bymilepost between I-5 and Peace Portal Drive.
Table 3.15-5: Railroad Crossings on SR 548
Crossing Milepost
I-5 Overcrossing MP 0.00Portal Way MP 0.29BNSF Railroad Grade Crossing (No. 084841X) MP 0.31Vista Drive MP 0.97Kickerville Road MP 4.93BNSF Railroad Grade Crossing (No. 096133H) MP 5.16Blaine Road/SR 548 MP 5.93Bay Road MP 6.95Birch Bay-Lynden Road MP 8.96Dakota Creek Bridge MP 11.58BNSF Railroad Grade Crossing (No. 084853S) MP 11.78Peace Portal Drive/Bell Road MP 11.80
A BNSF spur track runs to the refinery from the junction just north of Custer on the Everett-Vancouver track approximately 5 miles south. The railroad speed limit on the spur track is 25mph.

BP Cherry Point Cogeneration Project 3.15 Traffic and TransportationDraft EIS 3.15-11 September 2003
3.15.2 Impacts of the Proposed Action
Construction
Site Access and Parking
Primary access to the project area during construction would be from Grandview Road to BlaineRoad, then Blaine Road to the west access road (Access Road 1). Secondary access to the facilitywould be from a proposed private access road (Access Road 2) that would run from thesouthwest corner of the site to the existing private road extension of Blaine Road. The BlaineRoad extension, Brown Road, and other existing private roads within the Applicant’s propertywould provide internal access.
A third access road (Access Road 3) would connect the facility to a private transmission corridormaintenance road located on the Applicant’s property that extends south to Brown Road. Thisproposed access road would provide access to the transmission corridor south of thecogeneration facility and Tower 4. Another maintenance road within the transmission corridorconnects Tower 3 and Tower 2 and intersects with Brown Road. If the option to reconstruct thetowers and transmission lines of the Custer/Intalco Transmission Line No. 2 is selected, thenaccess to the transmission corridor would be from various locations.
During construction, most of the site-generated traffic would use the existing private roadextension of Blaine Road south from SR 548 into the Applicant’s property. The contractors’parking lot, construction trailer parking, and Laydown Areas 1, 2, and 3 would be located on thewest side of this existing Blaine Road extension. Laydown Area 4 would also be used duringconstruction. The laydown areas would be used for the storage and assembly of constructionmaterials and equipment.
Vehicle Trip Generation
Project-generated traffic volumes during construction would be produced by employeescommuting to and from work at the job site, as well as owner, contractor, supplier, regulator, andservice vehicles (including trucks of various sizes) doing business at the site. The Applicant hasestimated the number of vehicle round trips each month during construction, assumingmobilization in February 2004 through December 2005 (Duke/Fluor Daniel 2001). These round-trip estimates are based on detailed monthly estimates of the number of workers onsite for eachconstruction craft and trade, the number of management staff onsite, truck deliveries ofequipment, heavy equipment deliveries, and deliveries of site preparation materials.
Construction would require approximately 24 months, during which time the size of the workforce would vary. Construction work at the cogeneration facility is expected to occur primarilyon weekdays during the daytime.
Table 3.15-6 shows the estimated vehicle trip generation during average and peak constructionconditions. Estimates are also shown for an average weekday and for the AM and PM peakhours. Trip generation estimates are based on the Applicant’s round-trip estimates, supplemented

BP Cherry Point Cogeneration Project 3.15 Traffic and TransportationDraft EIS 3.15-12 September 2003
by published trip generation data available for utilities and other comparable land uses (Instituteof Transportation Engineers 1997).
A vehicle trip, as shown in Table 3.15-6 and as used in this analysis, is defined as a single orone-direction vehicle movement with either the origin or destination (exiting or entering) insidethe project site. The trip generation values shown in Table 3.15-6 account for all site trips madeby all vehicles for all purposes, including employee, owner, contractor, supplier, regulator,visitor, and service and delivery vehicle trips.
Table 3.15-6: Estimated Vehicle Trip Generation
Time Period Trips Entering Trips Exiting Total Trips
Average Construction ConditionsAverage Weekday 325 (50%) 325 (50%) 650AM Peak Hour 144 (90%) 16 (10%) 160PM Peak Hour 25 (15%) 140 (85%) 165Peak Construction ConditionsAverage Weekday 600 (50%) 600 (50%) 1,200AM Peak Hour 266 (90%) 30 (10%) 296PM Peak Hour 46 (15%) 258 (85%) 304Project Operation ConditionsAverage Weekday 70 (50%) 70 (50%) 140AM Peak Hour 23 (90%) 3 (10%) 26PM Peak Hour 4 (15%) 23 (85%) 27
Based on information developed by the Applicant, the peak number of monthly round tripswould be approximately 10,300 in December 2004. This would be approximately 600 round tripseach workday, or 1,200 one-way trips. For this analysis, an estimate of 1,200 (one-way) site-generated trips is shown in Table 3.15-6 for an average weekday during peak constructionconditions.
The roadway traffic PM peak hour is the highest traffic volume hour of the day and is used as thebasis for determining traffic impacts. As shown in Table 3.15-6, the PM peak-hour vehicle tripsgenerated by the proposed project during peak construction are estimated to be 46 entering thesite and 258 exiting, for a total of 304 trips.
Truck Trips
Truck trips are included in the trip generation estimates shown in Table 3.15-6. Large, heavyequipment would be transported to the refinery site by rail. Cranes would probably transfer thislarge, heavy equipment from the railroad car to an oversize truck for delivery to the job site.
During construction, some onsite soil would be removed and disposed of at approved sites.Various quantities of fill, including sand and gravel, would also be imported to the site. Inaddition, construction materials would be brought to the site that would include concrete, sheetand metal piping. Table 3.8-1 in Section 3.8 lists estimated quantities of these materials to be

BP Cherry Point Cogeneration Project 3.15 Traffic and TransportationDraft EIS 3.15-13 September 2003
used during construction of the proposed project. Imported fill, sand, and aggregate quantities areestimated at 151,650 cubic yards. Assuming trucks with a 20-cubic-yard capacity, this wouldresult in 7,583 one-way truck trips.
Acquisition of fill material, sand, and gravel would be the responsibility of the constructioncontractor. Specific routings to and from the sources of materials would need to be identified inthe Construction Transportation Management Program and approved by WSDOT and WhatcomCounty.
While specific routings are not known at this time, truck traffic would most likely use theprincipal arterials or roadways from material sources to the cogeneration facility. Potentialimpacts could affect roadway and/or intersection operations thereby worsening levels of serviceor increasing queue lengths or delays. Other impacts could include an increase in accidents or atleast the potential for more accidents that accompany increased congestion (see Figure 3.1-6).
Vehicle Trip Distribution
Figure 3.15-6 shows the estimated distribution and assignment of project-generated trips for peakconstruction conditions. The distribution of site-generated trips is based on the characteristics ofthe road network, existing traffic patterns, historical and projected development in the area,locations where workers would likely reside, and the location of other potential trip origins anddestinations.
Construction materials would arrive at the project site in trucks via I-5 and SR 548, except forlarge, heavy equipment that would arrive by rail. Heavy equipment would be transported by railand off-loaded at the BNSF rail spur at the refinery. Heavy equipment would be loaded ontoheavy haul vehicles or trailers and delivered to the cogeneration facility area via interior refineryroads. The steam turbine would be delivered in sections and assembled onsite.
Heavy equipment would include the following: turbines, generators, transformers, and otherpieces of large, heavy equipment required for the project The approximate sizes of these variouspieces of equipment range up to almost 17 feet in height, over 19 feet in width, and 77 feet inlength. Approximate weights range from 85,000 to 741,000 pounds.
The project’s trip distribution for average construction conditions is expected to be the same asfor the peak construction conditions. Since the estimated vehicle trip generation is proportionalto employment, the average weekday and PM peak-hour volumes generated during averageconstruction conditions would be approximately 54% of the volumes shown in Figure 3.15-6 forpeak conditions.

BP Cherry Point Cogeneration Project 3.15 Traffic and TransportationDraft EIS 3.15-14 September 2003
Figure 3.15-6: Project-Generated Trips for Peak Construction Conditions

BP Cherry Point Cogeneration Project 3.15 Traffic and TransportationDraft EIS 3.15-15 September 2003
Traffic Volumes
Travel demand on the roadway network is typically composed of three elements:
• Existing traffic• Estimated project-generated traffic• Estimated future non-project traffic
Estimated future non-project traffic may include traffic volumes generated by other landdevelopment projects that are planned, but not yet operational, changes in traffic patterns fromroadway improvements or operations, and the effects of population and business growth. Nochanges in traffic patterns from roadway improvements or operations are expected by 2004. A5% annual growth rate for traffic volumes was used to estimate future traffic volumes. This ratewas calculated based on PM peak-hour traffic volumes at the SR 548/Kickerville Roadintersection. This 5% growth rate accounts for the effects of general population and businessgrowth in the project vicinity.
Figure 3.15-7 shows projected 2004 PM peak-hour and average weekday traffic volumes duringpeak construction conditions at intersections on SR 548. These volumes include the existingtraffic volumes, the estimated project-generated traffic volumes, and the 5% growth rate.
Levels-of-Service
LOS was determined at the intersections on SR 548 during the PM peak hour during peakconstruction conditions (Table 3.15-7). Average delays would increase because of the project,but the intersections would continue to operate at LOS B or C, which is within acceptable countystandards. Exceptions are the I-5 northbound ramp intersections and the Portal Way intersection.The I-5 northbound ramp intersections would drop to LOS D during the PM peak hour duringpeak construction conditions, which is still considered to be acceptable by WSDOT.
Table 3.15-7: PM Peak Hour Level-of-Service Summary – Proposed Action
Intersection Movement/Approach 2004 With Project1
SR 548/I-5 northbound on-ramp (MP 0.00) Northbound D (29.4)SR 548/I-5 southbound on-ramp (MP 0.09) Southbound B (13.3)SR 548/Portal Way (MP 0.29) Overall F (64.6)SR 548/Vista Drive (MP 0.97) Overall C (18.1)SR 548/Kickerville Road (MP 4.93) Northbound C (21.7)SR 548/Blaine Road (MP 5.93) Southbound C (24.0)SR 548/Birch Bay-Lynden Road (MP 8.96) Overall C (21.6)SR 548/Peace Portal Drive (MP 11.80) Southbound C (20.8)1 Number shown is the average control delay in seconds per vehicle for the overall intersection at an all-way, stop-controlled
intersection, or worst-case approach at a stop-sign-controlled intersection. These values determine the LOS for intersectionsaccording to the 2000 Highway Capacity Manual (Transportation Research Board 2000).
MP = milepost

BP Cherry Point Cogeneration Project 3.15 Traffic and TransportationDraft EIS 3.15-16 September 2003
The SR 548/Portal Way intersection would operate at LOS F during the PM peak hour duringpeak construction conditions without any mitigation. The project is not expected to have asignificant impact on I-5 because of its distance from the project site (more than 5 miles) and itslarge capacity. Approximately 45% of site-generated traffic (approximately 540 vehicles per dayduring the construction peak) is expected to use I-5 south of SR 548. Significantly less site-generated traffic would use I-5 north of SR 548. Therefore, even with the project, I-5 wouldcontinue to operate at a high level-of-service, with traffic volumes well below capacity.
Other Traffic Impacts
Other traffic impacts may include the following:
• Accident rates are not expected to increase with construction of the proposed project.• Any modifications or improvements made to county roads and SR 548 would be done in
accordance with the appropriate county and WSDOT safety standards.• The amount of hazardous waste generated at the site during construction is expected to be
small. However, any hazardous waste would be transported by licensed contractors tolicensed disposal facilities, in accordance with existing county and state regulations.
Waterborne, Air, and Rail Traffic
Most construction materials for the facility would not require rail transport. However, large,heavy pieces of equipment (such as turbines, generators, and transformers) may be delivered byrail and transferred to oversize trucks, as discussed above. Such transport is anticipated to beincidental, and the transfer of components to oversized trucks for onsite delivery would occur atexisting local railroad tracks. If rail transport is used, it is expected that BNSF would be able tocoordinate transport and unloading activities without adversely affecting its system. The projectis not expected to require waterborne or air transport during construction of the proposed facility.
Operation
Site Access and Parking
Primary access to the project site (Access Road 1) would be from a proposed access road thatwould intersect the south side of SR 548. Passenger vehicle parking would be provided in aparking lot adjacent to the administration building on the west side of the proposed access road.The primary access would be used by nearly all of the site-generated traffic during operation ofthe proposed project.

BP Cherry Point Cogeneration Project 3.15 Traffic and TransportationDraft EIS 3.15-17 September 2003
Figure 3.15-7: Projected 2004 PM Peak-Hour and Average Weekday Traffic Volumes withProject

BP Cherry Point Cogeneration Project 3.15 Traffic and TransportationDraft EIS 3.15-18 September 2003
Secondary access to the site (Access Road 2) would be available from the existing extension ofBlaine Road into the refinery. Access Road 3 would link the existing maintenance road that runssouth to Brown Road. The existing private roads within the Applicant’s property would providefor the relatively small amount of internal traffic expected between the refinery and the proposedcogeneration facility. These internal roads would allow access to the project from the existingrefinery gates. However, the Blaine Road extension and other existing gates would not normallybe used by traffic generated by the proposed project.
Access Road 3 to the maintenance road from the project site south would be used formaintenance and security access to the transmission line corridor just south of the project.
Vehicle Trip Generation
Traffic volumes during operation of the project would result from employees commuting to andfrom work at the site, as well as owners, suppliers, regulators, and maintenance and serviceworkers (including trucks of various sizes) conducting business at the site. When the project isoperational, about 30 employees would be needed to staff the facility daily. A maximum of 25employees are expected to be present on the site at any point in time (including shift change andtraining). The cogeneration facility is expected to operate 24 hours per day, seven days per week.It is anticipated that some employees would work standard office hours, while others wouldwork in shifts.
Table 3.15-6 shows the project construction and operation vehicle trip generation. Estimates areshown for an average weekday and for AM and PM peak hours. Trip generation estimates arebased on the number of employees and published average vehicle trip generation rates availablefor utilities and other comparable land uses. The trip generation rate is 4 trips per employee on anaverage weekday, 0.74 trips per employee during the AM peak hour, and 0.76 trips per employeeduring the PM peak hour.
Chemicals to be used during operation would be shipped to the project site in tanker trucks,including anhydrous ammonia, caustic, sulfuric acid, and BFW chemicals (oxygen scavenger,neutralizing amine). Each truck typically holds approximately 8,000 gallons. The number ofestimated truck trips is as follows:
• Approximately 23 round-trip tanker truck trips (46 one-way trips) per year would be requiredfor anhydrous ammonia deliveries.
• Approximately 28 round-trip tanker truck trips (56 one-way trips) per year would be requiredfor caustic deliveries.
• Approximately 13 round-trip tanker truck trips (26 one-way trips) per year would be requiredfor sulfuric acid deliveries.
• Approximately three round-trip tanker truck trips (six one-way trips) per year would berequired for each BFW chemical.
As shown in Table 3.15-6, the PM peak-hour vehicle trips generated by operation of the projectare estimated to be four entering the site and 23 exiting, for a total of 27 trips. Truck trips areincluded in the trip generation estimates shown in the Table 3.15-6.
BP Cherry Point Cogeneration Project 3.15 Traffic and TransportationDraft EIS 3.15-19 September 2003
Vehicle Trip Distribution
The distribution of vehicle trips during project operation is estimated to be the same as for thepeak construction conditions shown in Figure 3.15-6. The resulting trip assignment on anaverage weekday during project operation would be 104 trips on SR 548 east of the project site(including 20 PM peak-hour trips), six trips on Grandview Road west of Blaine Road (includingone PM peak-hour trip), and 31 trips on SR 548 north of the Blaine Road intersection (includingsix PM peak-hour trips). Chemicals and most other materials and equipment would arrive at thesite in trucks from I-5 and SR 548.
Traffic Volumes
Project-generated traffic volumes during operation would be minimal. The increase in trafficvolumes from operation of the proposed project would be low. Total volumes on SR 548 wouldremain low relative to the capacity of the roadway.
Because of the low traffic volumes during project operation, the study area intersections on SR548 would continue to operate at LOS B or C. The only exception is the SR 548/Portal Wayintersection; it is calculated to operate at LOS D, which is considered acceptable by WSDOT.Delays would be few, and no substantial traffic queuing or congestion is expected.
The volume of maintenance and security traffic generated by the transmission line towers wouldbe very low. The amount of hazardous waste generated at the site during project operation isexpected to be small.
An analysis of the potential occurrence of icing and fogging as a result of the cooling tower wasperformed by the Applicant to determine if there would be any impact to local traffic. Theanalysis determined that there is no potential for icing, and that fogging may occur 2.5 hours peryear, approximately 650 to 1,650 feet to the northwest and northeast, which is on the north sideof Grandview Road, and would not impact vehicle traffic.
Waterborne, Air, and Rail Traffic
Operation of the cogeneration facility would not require waterborne, air, or rail transport exceptfor the unanticipated need to replace a large piece of equipment. In that case, rail transportationmay be used.
The presence of the cogeneration facility, the exhaust stacks, and the new 230-kV transmissionline is not anticipated to result in a significant impact on air traffic. Air traffic in the area is lowsince the nearest airport is 7 miles away, and there are no major destination areas in the projectvicinity. The Federal Aviation Administration has indicated that warning lights are not needed onthe exhaust stacks (BP 2002).

BP Cherry Point Cogeneration Project 3.15 Traffic and TransportationDraft EIS 3.15-20 September 2003
3.15.3 Impacts of No Action
Proposed Roadway Improvements
Whatcom County's Six-Year Transportation Improvement Program lists the following proposedroad improvements in the project vicinity:
• Birch Bay-Lynden Road/Portal Way intersection: Traffic signalization• Kickerville Road from Rainbow Road to SR 548: Reconstruction• Vista Drive from Ferndale city limits to SR 548: Reconstruction• Grandview/Point Whitehorn from Koehn Road to Jackson Road: Reconstruction• Bay Road from Valleyview Road to the east 0.25 mile: Intersection improvements• Kickerville Road from SR 548 to Birch Bay-Lynden Road: Reconstruction
WSDOT has three proposed improvement projects scheduled for SR 548, as follows:
• SR 548 from MP 3.75 to MP 3.80 Northstar Road vicinity: Culvert replacement• SR 548 MP 5.16 Kickerville railroad crossing: Culvert installation• SR 548 from MP 11.54 to MP 11.58 Dakota Creek Bridge 548/10: Bridge replacement
Traffic Volumes
Travel demand on the roadway network would be composed of two elements:
• Existing traffic• Estimated future non-project traffic
Existing traffic volumes were discussed in Section 3.15.1. Estimated future non-project trafficgrowth is generally composed of the following:
• Traffic volumes generated by other land development projects that are planned but not yetoperational,
• Changes in traffic patterns from roadway improvements or operations, and• Effects of population and business growth.
No new developments are proposed in the project vicinity that would add traffic volumes to theroadway system in the next few years. Also, no anticipated changes in area traffic patterns fromroadway improvements or changes in traffic operations are expected by 2004. Finally, a 5%annual traffic growth rate was used to estimate future impacts from population and businessgrowth in the area. This rate was based on historical traffic counts during the PM peak hour atthe SR 548/Kickerville Road intersection.
The 5% annual growth rate in traffic volumes, which accounts for the effects of generalpopulation and business growth in the area, provides a conservative estimate since the rate ofpopulation growth in Whatcom County is expected to be about 2% per year.

BP Cherry Point Cogeneration Project 3.15 Traffic and TransportationDraft EIS 3.15-21 September 2003
Figure 3.15-8 shows projected No Action 2004 ADT volumes and PM peak-hour traffic volumesat intersections on SR 548. These volumes include the existing traffic volumes plus the 5%annual traffic growth rate.
Under the No Action Alternative, traffic volumes in the area would be expected to increase atapproximately 5% per year. As shown in Table 3.15-2, intersections on SR 548 would continueto operate at LOS B or C. The only exception is the SR 548/Portal Way intersection, whichwould operate at LOS D, which is still considered acceptable by WSDOT. No traffic ortransportation impacts would result.
Levels-of-Service
LOS was determined at the intersections on SR 548 during the PM peak hour for the No ActionAlternative (Table 3.15-8). Average delays would increase over existing conditions, but theintersections would continue to operate at LOS B or C, which is within acceptable countystandards. The only exception is the SR 548/Portal Way intersection; it is calculated to operate atLOS D, which is still considered acceptable. Delays would be of short duration, and nosubstantial traffic queuing or congestion is expected. No traffic or transportation impacts wouldresult from the proposed project.
Table 3.15-8: PM Peak Hour Level-of-Service Summary – No Action
Intersection Movement/Approach 2004 Without Project1
SR 548/I-5 northbound on-ramp (MP 0.00) Northbound C (24.8)SR 548/I-5 southbound on-ramp (MP 0.09) Southbound B (12.7)SR 548/Portal Way (MP 0.29) Overall D (25.6)SR 548/Vista Drive (MP 0.97) Overall B (12.1)SR 548/Kickerville Road (MP 4.93) Northbound C (15.6)SR 548/Blaine Road (MP 5.93) Southbound B (13.0)SR 548/Birch Bay-Lynden Road (MP 8.96) Overall B (18.8)SR 548/Peace Portal Drive (MP 11.80) Southbound C (20.6)1 Number shown is the average control delay in seconds per vehicle for the overall intersection at an all-way, stop-controlled
intersection, or worst-case approach at a stop-sign-controlled intersection. These values determine the LOS for intersectionsaccording to the 2000 Highway Capacity Manual (Transportation Research Board 2000).
MP = milepost
3.15.4 Secondary and Cumulative Impacts
No significant cumulative traffic or transportation impacts are anticipated for the followingreasons:
• Because of the low population and rural nature of the surrounding area, there are nocommercial services such as housing, lodging, retail, restaurant, or medical facilities in theimmediate vicinity of the site.
• The nearest facilities are 2 miles to the north in Birch Bay and 5 miles to the east near I-5.More extensive commercial facilities and services are located in Blaine, Ferndale, andBellingham.

BP Cherry Point Cogeneration Project 3.15 Traffic and TransportationDraft EIS 3.15-22 September 2003
Figure 3.15-8: Projected 2004 PM Peak-Hour and Average Weekday Traffic Volumes withoutProject

BP Cherry Point Cogeneration Project 3.15 Traffic and TransportationDraft EIS 3.15-23 September 2003
• Because of the anticipated short-term project construction (24 months) and the associatedworkforce, permanent commercial services would not likely be established near the site.
• The low employment levels during project operation also would not support permanentcommercial services near the site.
The construction schedule of the GSX Pipeline coincides with construction of the cogenerationfacility. There may be a degree of cumulative impact during construction, but the magnitude isnot possible to quantify at this time.
3.15.5 Mitigation Measures
The Applicant is meeting with WSDOT and traffic engineers from Whatcom County to discussappropriate mitigation measures to address the impacts described above.
Mitigation Proposed by the Applicant
• A traffic signal would be installed at the intersection of Grandview Road (SR 548)/PortalWay to improve LOS.
• A westbound left-turn lane would be constructed on SR 548 at the Blaine Road intersection.• An access road would be located approximately 1,000 feet east of Blaine Road. WSDOT has
determined that the access road has adequate sight stopping distance. The access road wouldbe constructed and paved to meet applicable geometric and safety standards. Pavementmarkings, gates, and traffic signs would be installed on the proposed road, including a stopsign at the SR 548 intersection.
• Temporary traffic control plans would be developed and implemented to ensure safe travelconditions during construction within the Grandview Road and SR 548 rights-of-way.
• An onsite Transportation Coordinator could be designated during construction. Duties of thecoordinator would include managing site-generated traffic and parking at the site,establishing and managing any remote parking lots and related shuttle bus or van services,and promoting carpooling and vanpooling to site workers. The Transportation Coordinatorwould also serve as the point of contact for county and state agencies regarding traffic andtransportation issues and permits related to the construction project.
• Preferential parking for carpools and vanpools could be established at the site duringconstruction.
• To the extent practical, the work hours of various groups of workers (such as a constructiontrade or employees of a company) during the daytime on weekdays would be shifted slightlyaway from each other. This would disperse the site-generated traffic during the AM and PMpeak hours and reduce the potential for queuing.
• Permits or approvals would be obtained as required to conduct oversize or overweight hauls.Delivery of heavy or oversized equipment would be by rail or barge, as practical.
Additional Recommended Mitigation Measures
• Intersection improvements to accompany traffic signalization should be investigated at thePortal Way/Grandview Road (SR 548) and Blaine Road/Grandview Road (SR 548)

BP Cherry Point Cogeneration Project 3.15 Traffic and TransportationDraft EIS 3.15-24 September 2003
intersections. Traffic signalization may warrant changes to intersection operation such as left-or right-turn lanes.
• All mitigation measures listed above should be carried out by the Applicant to maintain apositive and safe traffic flow. Preferably, these would be incorporated into a TransportationManagement Plan that would be applicable during both construction and operation of theproposed project and approved by EFSEC prior to the beginning of construction.
• The Applicant would keep and maintain county roads and SR 548 free of any debris orhazardous material related to the project. Any spilled material would be cleaned up promptly.
3.15.6 Significant Unavoidable Adverse Impacts
No significant unavoidable adverse impacts on surface or rail transportation systems areanticipated. During regular operation of the facility, intersection LOS are within acceptablelimits. During construction, intersection LOS are acceptable except for one location, whichexceeds LOS standards. At the completion of facility construction, all intersections operatewithin acceptable limits.

BP Cherry Point Cogeneration Project 3.16 Health and SafetyDraft EIS 3.16-1 September 2003
3.16 HEALTH AND SAFETY
This section describes the potential environmental health and safety impacts associated with theconstruction and operation of the proposed project. For purposes of this section, potentialenvironmental health and safety impacts refer to potential levels of risk to workers and thegeneral public during construction and operation of the proposed project. The level of riskpresented herein is based on the current level of design of the proposed project, health and safetyand spill prevention regulations, operating procedures, and mitigation plans to be prepared priorto the start of construction or operation of the project.
The existing BP Cherry Point Refinery is adjacent to the proposed cogeneration facility. Therefinery has established health, safety, and emergency and security plans. The proceduresdescribed in these plans are practiced by refinery employees on a periodic basis, are updatedregularly, and comply with applicable local, state, and federal regulations. In many instances, thepotential hazards and risks present at the refinery would be the same or similar to the potentialhazards and risks that may be present at the proposed cogeneration facility. The refinery’s health,safety, and emergency and security plans would be modified for use at the cogeneration facility.Where additional sources of information have been used to evaluate the potential impactsassociated with the proposal, those sources have been cited.
State, federal, and local health and safety regulations would govern work activities duringconstruction and operation of the proposed project. Additionally, industrial codes and standardsalso apply to worker and public health and safety. Should any of the existing regulations,standards, or codes be updated during construction and operation of the proposed project, theApplicant would ensure its personnel and its contractors’ personnel adhere to the revised orupdated regulations. For a listing of the applicable state and federal health and safety regulations,standards, and applicable industrial standards and codes governing the construction andoperation of the proposed project, see Table 3.16-1 below.
Table 3.16-1: Applicable Health and Safety Regulations
Applicable State RequirementsLabor and Industries • Chapter 49.17 RCW, Washington Industrial Safety And Health Act;
• Chapter 296-24 WAC, L&I General Safety And Health Standards;• Chapter 296-27 WAC, L&I Record keeping and Reporting, which provides for
record keeping and reporting for employees covered under Chapter 49.17 RCW;• Chapter 296-36 WAC, L&I Safety Standards - Compressed Air Work, which
provides safety standards for compressed air work;• Chapter 296-45 WAC, L&I Safety Standards For Electrical Workers;• Chapter 296-46A WAC, L&I Safety Standards - Installing Electrical Wires and
Equipment - Administration Rules;• Chapter 296-62 WAC, L&I General Occupational Health Standards;• Chapter 296-67 WAC, L&I Safety Standards For Process Safety Management Of
Highly Hazardous Chemicals, which establishes requirements for preventing orminimizing consequences of releases of toxic, reactive, flammable or explosivechemicals;
• Chapter 296-155 WAC L&I Safety Standards For Construction Work;• Chapter 173-60 WAC Maximum Environmental Noise Levels, and• Chapter 173-303 WAC Dangerous Waste Regulations.

BP Cherry Point Cogeneration Project 3.16 Health and SafetyDraft EIS 3.16-2 September 2003
Table 3.16-1: Continued
Washington Utilities andTransportation Commission
• Chapter 480-93-020 WAC Gas companies – safety – proximity considerations.• Chapter 480-93-180 WAC Gas companies – safety – operations and maintenance
procedures.Applicable Federal Requirements
• 29 CFR 1952 170-1952.175, et seq., which gives full enforcement powers to thestate of relevant occupational and health standards;
• 29 CFR 651, et seq., which implements the Occupational Safety and Health ActOf 1970 to protect the health and safety of workers;
• 29 CFR 1910, et seq., which contains the minimum occupational health andsafety standards for general industry in the U.S.;
• 29 CFR 1926, et seq., which contains the minimum occupational health andsafety standards for the construction industry in the U.S.; and
• 29 CFR 171-177, et seq., which generally implements the Occupational Safetyand Health Act of 1970 to protect the health and safety of workers.
Applicable Industry Requirements• U.S. Environmental Protection Agency Standards, including Standard of
Performance for New Stationary Sources;• National Electrical Code, National Fire Protection Association (NFPA) 70, 1999;• National Electrical Safety Code, American National Standards Institute (ANSI)
C2, 1997;• Standards administered through the ANSI;• Standards and guidelines administered through the Institute of Electrical and
Electronics Engineers;• Standards and guidelines administered through the Insulated Cable Engineers
Association;• Standards and guidelines administered through the National Electric
Manufacturers Association;• Standards and guidelines administered through the NFPA;• Codes administered through the American Society of Mechanical Engineers;• Uniform Building Code;• Uniform Plumbing Code;• 40 CFR 112 (Oil Spill Containment Structures);• American Institute of Steel Construction Standards;• Standards and guidelines administered through the American Society of Testing
and Materials;• Standards administered through the American Welding Society;• American National Standard for the Storage and Handling of Anhydrous
Ammonia, K61.1.; and• All applicable Washington State, Whatcom County, and local codes and
regulations.Pertinent Local Ordinances and Permits
• Chapter 8.06 Smoking in the Workplace• Chapter 8.12 Solid Waste Disposal• Chapter 8.16 Flammable Liquids
Whatcom County Fire District No. 7 provides firefighting resources within a 73-square-mile areaof the County including the project area, the City of Ferndale, and all major industrial facilities.The Whatcom County Sheriff’s Office provides police services to unincorporated WhatcomCounty including the project area. The Whatcom County Emergency Center and St. JosephHospital in Bellingham provide medical services to the general public and to refinery personnelas needed. For a description of these public safety services, see Section 3.13.
BP Cherry Point Cogeneration Project 3.16 Health and SafetyDraft EIS 3.16-3 September 2003
In addition to the public services noted above, the refinery has established communicationprotocols and a response plan in the event of a large refinery fire. The plan stipulates thatWhatcom County Fire Department would be notified and the refinery’s FERO plan would beimplemented. The FERO plan provides detailed guidelines to facilitate effective response actionsto emergencies. The plan is described further later in this section.
3.16.1 Existing Health and Safety Risks
Cogeneration Facility and Refinery Interface
Land surrounding the proposed cogeneration facility and the refinery interface area is zoned forindustrial or rural use and is generally undeveloped. The cogeneration facility would be sited onthe eastern edge of the refinery between Grandview and Brown roads. The existing refinery andcogeneration facility are approximately 6 miles northwest of Ferndale, Washington, 7 milessoutheast of Blaine, Washington, and about 15 miles north of Bellingham. The nearestcommunity is Birch Bay, Washington, located approximately 2 miles northwest of the refinery.The U.S.-Canada border is approximately 8 miles directly north of the proposed project.
The proposed cogeneration facility and the interconnecting piping, transmission lines, accessroads, and laydown areas would be constructed on undeveloped land that has not been graded.Drainage ditches were constructed in the past to drain the proposed project site and surroundingarea for use as farmland. According to the Applicant, there is no evidence that hazardous wasteor contaminated materials were deposited within the area of the cogeneration facility or theeastern portion of the refinery (refinery interface). However, a Phase I Environmental SiteAssessment of the area has not been performed; therefore, the level of potential health riskassociated with contaminated soils is not known at this time. Natural and cultural resourceswithin and surrounding the project area are described in Sections 3.1 through 3.7, and Section3.14, respectively.
Transmission System
A new 230 kV double circuit transmission line would be installed between the cogenerationfacility switchyard and existing Bonneville Custer/Intalco Transmission Line No. 2. The newtransmission line would require four lattice-style towers and one monopole-style tower andwould be approximately 0.8 mile long. The Applicant has not performed a Phase IEnvironmental Site Assessment of this transmission corridor; therefore, the health risk associatedwith contaminated soil is not known at this time.
Custer/Intalco Transmission Line No. 2
An option for interconnection with the existing Bonneville transmission system would involvereconstructing an existing transmission line between the Custer Substation and the cogenerationfacility interconnection point (approximately 5 miles in length). The existing single-circuit linewould be replaced with a double-circuit line using either lattice steel or steel monopolestructures. The Applicant has not performed a Phase I Environmental Site Assessment of this

BP Cherry Point Cogeneration Project 3.16 Health and SafetyDraft EIS 3.16-4 September 2003
transmission corridor; therefore, the health risk associated with contaminated soil is not known atthis time.
Other Project Components
The Applicant has not performed a Phase I Environmental Site Assessment for the corridor ofthe industrial water supply piping from the Alcoa Intalco Works to Access Road 3, wetlandmitigation areas, and Laydown Area 4. Therefore, the level of potential health risk associatedwith contaminated soil areas is not known at this time.
3.16.2 Impacts of the Proposed Action
This subsection describes potential health and safety risks associated with construction andoperation of the proposed project. Features inherent in the design of proposed project facilities aswell as compliance with mandatory regulations, plans, and policies to reduce these potential risksare summarized within each risk category. Additional mitigation measures proposed by theApplicant are summarized in Section 3.16.5. Risk levels present during construction andoperation consider the degree or probability of exposure to hazardous and toxic substances andthe exposure pathway (ingestion, inhalation, and dermal contact).
Construction
Cogeneration Facility and Refinery Interface
Potential health and safety risks present during construction of the cogeneration facility andancillary structures connecting the refinery with the facility are generally typical of the riskspresent on major industrial/commercial construction sites. Health and safety concerns include therisk of fire or explosion from general construction activities; chemical storage and handling; spillresponse and release reporting; collection, storage, and disposal of non-hazardous and hazardouswastes; sanitary waste handling; risk of fire or explosion associated with a natural gas release;worker exposure to radiation; and medical emergencies. Anticipated construction wastes to begenerated throughout the four-year construction period are shown in Table 3.16-2. Chemicals tobe used during construction are shown in Table 3.16-3.
Risk of Fire or Explosion from General Construction Activities
Contractors experienced with the construction of gas-fired electrical generation plants wouldbuild the proposed cogeneration facility. Construction specifications would require thatcontractors prepare and implement a construction health and safety program that is intended tocontrol worker activities as well as establish procedures to prevent, manage, and control possiblefires or explosions, should they occur. The probability of a significant fire or explosion duringconstruction of the proposed project is considered low. With implementation of mitigationmeasures and procedures described in the following paragraphs, health and safety risks toconstruction workers and the public are also considered low.

BP Cherry Point Cogeneration Project 3.16 Health and SafetyDraft EIS 3.16-5 September 2003
During construction, small quantities of flammable liquids and compressed gases would be usedand stored onsite. Liquids would include construction equipment fuels, paints, and cleaningsolvents. Compressed gases would include argon gas, acetylene, helium, nitrogen, and oxygenfor welding (see Table 3.16-4). Potential risk hazards associated with the use of flammableliquids and compressed gases would be reduced by compliance with a construction health andsafety program and proper storage of these materials when not in use, in accordance with allapplicable local, state, and federal regulations. The construction health and safety program wouldinclude the following major elements:
• An injury and illness prevention program,• A written safety program (including hazard communication),• A personnel protection devices program, and• Onsite fire suppression and prevention plans.
Table 3.16-2: Anticipated Construction Waste Streams
Waste StreamWaste StreamClassification
EstimatedAmount
EstimatedFrequency ofGeneration
No. TruckTrips andFrequency
QuantityShipped
Scrap wood, steel, glass, plastic,paper, calcium silicate insulation,mineral wool insulation
Non-hazardoussolids
50 cubicyards
Weekly 1 per week 50 cubicyards
Empty hazardous materialcontainers
Hazardous solids 1.5 cubicyard
Weekly 1 per week 1.5 cubicyard
Used and waste lube oil duringCT and ST lube oil flushes
Hazardous or non-hazardous liquids
55 gallondrums
200 drumsover life of
construction
1 per 60days
25 55-gallondrums
Oil rags, oil absorbent generatedduring normal constructionactivities, excluding lube oilflushes
Hazardous liquids 55 U.S.gallons
Monthly 1 per month 55 U.S.gallons
Solvents, used constructionequipment lube oils, paint,adhesives
Hazardous liquids 200 U.S.gallons
Monthly 1 per month 200 U.S.gallons
Spent lead acid batteries Hazardous solids 3 batteries Yearly 1 per year 3 batteriesSpent alkaline batteries Hazardous solids 80 batteries Monthly 1 per month 80 batteriesST and pre-boiler piping cleaningwaste, chelant
Hazardous or non-hazardous liquids
400,000 U.S.gallons
Once beforeinitial startup
34 400,000 U.S.gallons
Waste oil from oily waste holdingtank
Hazardous or non-hazardous liquids
25 U.S.gallons
Monthly 1 per month 25 U.S.gallons
Sanitary waste from potablechemical toilets and constructionoffice holding tanks
Non-hazardousliquids
500 U.S.gallons
Daily 1 per week 500 U.S.gallons
Storm water from constructionarea
Non-hazardousliquids
950,000 U.S.gallons
For a once in 2year, 24-hourstorm event
N/A N/A
Fluorescent, mercury vapor lamps Hazardous solids 40 Yearly 1 per year 40Hydrotest water Non-hazardous
liquids2 to 3
million U.S.gallons
Once beforeinitial startup
N/A 2 to 3million U.S.
gallonsSource: BP 2002

BP Cherry Point Cogeneration Project 3.16 Health and SafetyDraft EIS 3.16-6 September 2003
Table 3.16-3: Chemicals to be Used and Stored during Construction
Chemical Purpose Estimated Quantity Storage Location
STG and pre-boiler pipingcleaners
STG and pre-boiler pipingcleaning waste, chelant chemicalcleaner, or demineralized watertreated with oxygen scavengerand amine
400,000 gallons Brought to site byequipmentvendor/contractor
Solvents, used equipmentlube oils, paints, adhesives
Used in construction 200 gallons monthly Not known at this time
Used and waste oils For CGT and STG lube oilflushes
200 55-gallon drumsover life of construction
Not known at this time
Spent lead batteries Various 3 batteries annually Not known at this timeSpent alkaline batteries Various 80 batteries monthly Not known at this timeWaste oil from oily wasteholding tank
Collected on site 25 gallons monthly Not known at this time
Oil rags, oil absorbent Generated during normalconstruction activities, excludinglube oil flushes
55 gallons monthly Not known at this time
Argon gas Welding and HRSG components Not known at this time Temporary warehouseAcetylene Cutting torches Not known at this time Temporary warehouseHelium Welding aluminum ducts Not known at this time Temporary warehouseNitrogen Welding Not known at this time Temporary warehouseOxygen Cutting torches Not known at this time Temporary warehouse
Source: BP 2002
Table 3.16-4: Anticipated Compressed Gases Use during Construction
Gas Estimated Quantity Storage Use
Argon Gas Not known at this time Temporary warehouse Welding and heat recovery steamgenerator components
Acetylene Not known at this time Temporary warehouse Cutting torchesHelium Not known at this time Temporary warehouse Welding aluminum ducts
Nitrogen Not known at this time Temporary warehouse WeldingOxygen Not known at this time Temporary warehouse Cutting torches
During construction mobilization, the general contractor would coordinate with the BP CherryPoint Refinery Fire Marshal and the Whatcom County Fire District regarding planned activitiesat the construction site. Also, a Joint Unified Command Structure or system would be establishedprior to the start of construction.
During construction, fire prevention and detection would be the responsibility of individualsworking at the site. Heat and smoke detectors would be provided in buildings and temporarywarehouses as required by federal, state, and local regulations. In addition, safe workingpractices would also be exercised. These would include, but would not be limited to, thefollowing:
• Maintaining appropriate fire extinguishers within easy access of all work areas,

BP Cherry Point Cogeneration Project 3.16 Health and SafetyDraft EIS 3.16-7 September 2003
• Prohibiting the general public from entering working areas, in areas where heavy equipmentis used, and where there would be potential exposure to toxic or hazardous materials,
• Prohibiting smoking in all areas, and• Using a permit system for all hot work (welding, cutting, and grinding) outside of designated
“free-burn” areas.
During construction, personnel properly trained in fire extinguisher deployment would addresssmall fires controllable by handheld extinguishers. If a larger fire occurs, the Whatcom CountyFire Department would be notified and the refinery’s FERO plan would be implemented.
• The FERO plan provides detailed guidelines to facilitate effective response actions toemergencies. The FERO plan provides specific information to assist responders, and includesset up of command structure, duties and responsibilities, checklists for responders, equipmentlists, instructional guides, and strategic actions for potential or critical incident scenarios thatmay occur in or around the refinery. The plan applies to all emergency response activitiesexcept oil spill and response, which are covered by regulatory-mandated response plans.General incident and response categories covered by the plan that would be modified toapply to the proposed cogeneration facility and refinery interface are summarized in Section3.16.5. In the case of a large fire or explosion, a companion Emergency Preparedness Plan(EPP), which provides preparedness and planning information, would be implemented. Thisplan is intended to conform with, and incorporate, applicable regulatory guidelines of local,state, and federal agencies. General incident and response categories covered by the EPP thatwould be modified to apply to the proposed cogeneration facility and refinery interface aresummarized in Section 3.16.5.
Where appropriate, the refinery would coordinate emergency response efforts with localemergency agencies (sheriff/fire services/emergency medical services), the WashingtonDepartment of Ecology, the local emergency planning commission, and other organizations tomitigate potential emergency situations.
As described in the FERO plan, Whatcom County Fire District No. 7 and the Refinery FireDepartment would be summoned in the case of a large fire and/or explosions. Although therefinery has specialized equipment to fight fires unique to refineries and power plants and trainedpersonnel to fight these fires, the Applicant may require additional resources to mitigate anyincident beyond the firefighting resources of the refinery. In this event, the Applicant woulddevelop response protocols with the Jurisdiction Having Authority, Whatcom County FireDepartment District No. 7, to ensure that additional support and resources would be availablefrom the district and other jurisdictions through the District Mutual Aid Agreements. Firefightingresources in Whatcom County are provided through 17 fire protection districts and twomunicipal city fire departments, and a total of approximately 175 paid firefighters andapproximately 645 volunteer firefighters.
Chemical Storage and Handling
During construction, chemicals stored onsite may include paints, coatings, solvents, and adhesivematerials, as listed in Table 3.16-3. These materials would be stored in a locked utility shed or
BP Cherry Point Cogeneration Project 3.16 Health and SafetyDraft EIS 3.16-8 September 2003
secured in a fenced area. Storage of the various types of chemicals would conform to OSHA andapplicable state guidelines. Construction personnel would be trained in handling chemicals,including hazardous materials, and would be alerted to the dangers associated with the storage ofchemicals. An onsite Environmental Health and Safety Representative would be designated toimplement the construction health and safety program and to contact emergency responsepersonnel and the local hospital (St. Joseph Hospital), if necessary. Material Safety Data Sheets(MSDS) for each onsite chemical would be kept onsite, and construction employees would bemade aware of their location and content.
The specific procedures for managing petroleum product storage tanks to be located onsiteduring and after construction and onsite petroleum use would be as follows:
• Lubrication oil used in construction equipment would be contained in labeled barrels. Thebarrels would be stored in a secondary containment area to contain any spillage, or intemporary warehouses.
• Vehicle refueling would occur at a designated area and would be closely supervised to avoidleaks or releases. Should a spill occur during refueling, the fuel would be properly cleaned upby the safety engineer and properly documented. If fuel tanks are used during construction,the fuel tank(s) would be located within a secondary containment with an oil-proof linersized to contain the single largest tank volume plus an adequate space allowance forrainwater.
• When filling transformers with non-PCB mineral oil, the oil would be pumped from a trucklocated within a temporary secondary containment area to contain any spillage.
• All paint containers would be sealed and properly stored to prevent leaks or spills. Unusedpaints would be disposed of in accordance with applicable local and state regulations. Spraypainting would not be performed on windy days, and drop cloths and vertical walls would beused to stop, collect, and dispose of drips and over-spray associated with painting activities.
During construction, the worst-case scenario would be a major leak during chemical cleaning ofthe HRSGs and steam and water piping before being placed into service. This method ofcleaning consists of an alkaline degreasing step (in which a surfactant, caustic, or ammoniasolution is used), a 3 to 4% citric acid cleaning step, and a passivation step. Most of the solutionwould be contained in permanent facility piping and equipment (specifically the HRSGs). Thecomponents of the process that would be most likely to leak are the temporary chemical cleaningpiping, pump skids, and transport trailers. The HRSGs would be within curbed areas, and spillswould be manually cleaned up and contaminated materials disposed of in accordance with theSPCC plan described in the following section.
Impacts to the public are unlikely. All these chemicals are liquid, and the likelihood of a spillreaching or affecting the area of Grandview Road, the nearest public thoroughfare locatedapproximately 300 feet north of the proposed facility, is low.
Spill Response and Release Reporting
Machinery fluids, including diesel fuel, gasoline, motor oil, hydraulic fluid, brake fluid, and anti-freeze, could spill during construction. The general contractor’s responsibility would include

BP Cherry Point Cogeneration Project 3.16 Health and SafetyDraft EIS 3.16-9 September 2003
implementation of spill control measures and training of all construction personnel andsubcontractors in spill avoidance. Training would also include appropriate response when spillsoccur, and containment, cleanup, and reporting procedures consistent with applicableregulations. The primary plan to be developed by the Applicant would describe spill responseand clean up procedures.
Construction equipment would be monitored for leaks and undergo regular maintenance toensure proper operation and reduce the chance of leaks. Maintenance of onsite vehicles wouldoccur in a designated location. To further reduce the possibility of spills, no topping-off of fueltanks would be allowed. Petroleum products would be stored in clearly labeled and sealedcontainers or tanks. If fuel or oil spills occur, the resultant contaminated soil would be removedand disposed of at an approved disposal site in accordance with the SPCC plan.
The State of Washington Utilities and Transportation Commission (WUTC), WashingtonDepartment of Labor and Industries (L&I), and the Local Emergency Planning Committee(Whatcom County Fire District No. 7 and Whatcom County Sheriff's Department) are theagencies primarily responsible for the administration of programs for managing a release ofdangerous and hazardous chemicals and the notification of the appropriate agencies or parties.Additional mitigation measures regarding accidental spills and spill control and reportingprocedures are described in Section 3.16.5.
Onsite supervisory personnel would coordinate with the Department of Ecology and otherappropriate agencies to ensure spill control compliance and notification in case of an emergencyrelease. The Comprehensive Environmental Response, Compensation, and Liability InformationSystem (CERCLIS) notification and reporting requirements would be made directly to the EPA.
Non-Hazardous and Hazardous Waste Collection, Storage, and Disposal
All non-hazardous waste materials such as empty containers, scrap wood, scrap metal, and trashwould be collected, deposited, and stored in appropriate containers provided by a licensed solidwaste management contractor. The general contractor would remove the containers and recycleor dispose of the material in accordance with applicable federal, state, and/or local regulations.No construction waste material would be burned or buried onsite. The onsite safety engineerwould instruct all site personnel regarding proper waste disposal procedures.
Hazardous solid waste materials may be generated during the cleanup of a spill, particularly ifcontaminated soils must be removed from the site. Other hazardous materials potentiallygenerated by construction activities include used oil, spent antifreeze, unused adhesives,discarded water treatment chemicals and residuals, and spent lead acid batteries, as listed inTable 3.16-2. The exact type and quantity of hazardous and toxic materials to be generatedduring construction have not been established at this time. However, Tables 3.16-2 and 3.16-3list typical hazardous and toxic materials that may be used during construction.
A discussion of risks associated with the use and storage of hazardous materials and steps tomitigate those risks is presented in the previous section. A licensed waste management contractor

BP Cherry Point Cogeneration Project 3.16 Health and SafetyDraft EIS 3.16-10 September 2003
would be responsible for treating or disposing of the various hazardous materials in compliancewith all federal, state, and local regulations.
To minimize the potential release of hazardous materials during construction, BMPs would beemployed. These would include good housekeeping measures, inspections, containmentfacilities, and spill prevention practices. Construction personnel would be instructed regardingthe use of BMPs, and the onsite safety engineer would be responsible for the enforcement of theuse and maintenance of the BMPs.
During pre-construction geotechnical investigations at the cogeneration facility site as well asduring ground-disturbing construction activities, the Applicant would monitor and analyze soilsto identify contaminated material. If contaminated soil were encountered, soils would be tested,handled, and disposed of in accordance with all applicable federal, state, and local requirements.
The Department of Ecology and the Whatcom County Fire District No. 7 would be notified ifunknown water wells or underground storage tanks are discovered during construction.Subsequent abandonment, removal, and/or remediation of such facilities would be conducted inaccordance with applicable federal, state, and local codes.
Sanitary Waste Management
Portable sanitation units would be used during construction. These units would be regularlymaintained, and a licensed sanitary waste management contractor would collect waste from theunits for disposal in accordance with applicable regulations. The production of 500 gallons ofsanitary waste per day is anticipated during the construction phase of the project.
Risks of Fire or Explosion from a Natural Gas Release
Natural gas is currently supplied to the refinery via the Ferndale natural gas pipeline. Natural gasfrom this pipeline would be the primary source of fuel for the proposed project. The Ferndalenatural gas pipeline system receives natural gas from the Westcoast Pipeline near Sumas, at theWashington State/Canadian border. The gas is then metered and odorized by Arco Western GasPipeline near the border. The Ferndale pipeline then transports and delivers natural gas to therefinery and to the Alcoa Intalco Works aluminum smelter near Ferndale.
The 16-inch Ferndale natural gas pipeline passes along the western and northern edges of theproposed project site adjacent to Grandview Road. The existing refinery metering station is thepreferred tie-in location to connect the natural gas pipeline system with the proposedcogeneration facility. The metering station is immediately east of Blaine Road and immediatelywest of the proposed cogeneration facility. A short pipeline connection (150 feet) would beconstructed from the metering station to a gas compressor, and then another short pipeconnection (375 feet) would be constructed from the gas compressor to the cogeneration facility.
Generally, the risks of fire or explosion during pipeline construction are minimal, althoughnatural disasters such as earthquakes or volcanic releases could trigger an accidental fire orexplosion incident. Excavation/placement of soil and the welding of pipe sections are the

BP Cherry Point Cogeneration Project 3.16 Health and SafetyDraft EIS 3.16-11 September 2003
primary construction tasks. “Lockout tagout” procedures would be used to verify that sections ofthe pipeline are isolated and free of gas prior to the start of work. The exact locations of existingnatural gas pipelines near the metering station would be established and kept marked duringconstruction. A 10-foot minimum clearance (buffer zone) between the existing and new pipewould be maintained to preclude stocking of soil on, or work over, the existing natural gaspipeline. Heavy construction equipment would not be allowed to run over the existing pipe in thenew pipe construction zone. Construction methods and safety procedures would be established toavoid damaging the existing pipe. The contractor installing the new gas pipeline would befamiliar with and experienced in performing this type of work. Implementation of normalpipeline construction BMPs and elements of the construction health and safety plan wouldreduce the risk of fire or explosion. A description of additional construction methods and safetyprocedures to be implemented during pipeline construction include the following:
• Existing utilities on Blaine Road would be located and staked before construction begins, andwould be physically located every 1,000 feet and at intersections of other pipes andcrossings. This would confirm the location and depth to ensure new construction does notimpact the existing utilities.
• OSHA regulations for excavations would be followed. The trench for the new gas pipelineconnections would be covered or cordoned off after work hours to prevent anything fromfalling into the trench. Heavy equipment would not normally be operating over the existingutilities during construction of the new line. If heavy equipment or trucks must cross theexisting utilities, they would cross at right angles and the ground would be covered with matsor additional soil cover to protect the existing pipe.
• As the trench is excavated, the pipeline connections would be constructed in sections at theedge of the trench. After the welds are X-rayed, the pipe would be lowered into the trenchusing a series of side booms. Tie-in welds performed in the trench would be X-rayed after thepipe is in the trench. Once the pipe is completed in the trench and backfilled with soil, itwould be pressure-tested with water. Onsite inspectors representing the Applicant would bepresent during construction to verify that the construction contractor is following engineeringspecifications and meeting regulatory requirements.
Radiation Risks
Some radioactive sources may be used for quality-control purposes during construction of thenatural gas pipeline connections and high-pressure steam-lines. Examples of these uses mayinclude soil density testers and X-ray sources for evaluating weld quality. No releases ofradioactive materials would occur during these uses because these materials are strictlyregulated. The radiation levels of these devices, and their use, storage, and application would bein accordance with all applicable state and federal regulations. Therefore, the risk of radiationexposure to workers is considered low.
Medical Emergencies during Construction
Selected construction personnel working on the cogeneration facility piping would receive firstaid and CPR training. Onsite treatment would be provided in medical situations that require onlyfirst aid treatment or stabilization of the victim(s) until professional medical attention is attained.

BP Cherry Point Cogeneration Project 3.16 Health and SafetyDraft EIS 3.16-12 September 2003
Any injury or illness that requires treatment beyond first aid would be referred to the refinery’smedical clinic or to St. Joseph Hospital in Bellingham.
Transmission System
The transmission line connecting the cogeneration facility switchyard to Bonneville’sTransmission Line No. 2 would be constructed in accordance with Bonneville standards. Thetransmission line would require four lattice-style structures and one monopole. Aninterconnection agreement between the Applicant and Bonneville would establish protocols andprocedures to prevent fires within the electrical transmission corridor.
The Applicant has been issued a Corps of Engineers permit to construct the 0.8-miletransmission line. As part of the application for the permit, a SEPA Checklist described thepotential impacts resulting from constructing and operating the line. Although the county madeno SEPA determination, few impacts were identified and described in the checklist. Theprincipal risks associated with construction of the transmission line were fire or explosion andreleases or potential releases of hazardous materials to the environment, as described below.
Risk of Fire or Explosion
The risk of a fire or explosion during construction of the transmission line should be low. Duringconstruction, small quantities of flammable liquids and compressed gases would be used. Liquidswould include construction equipment fuels, paints, and cleaning solvents. Compressed gaseswould include acetylene, oxygen, helium, hydrogen, and argon for welding.
The potential hazards associated with the compressed gases and flammable liquids used duringconstruction welding, painting, and other activities as well as general worker risks associatedwith constructing elevated structures and installing electrical transmission lines would bereduced by compliance with a construction health and safety program (see description for thecogeneration facility). For example, while working to assemble and erect the towers, workerswould be required to wear warning vests to increase their visibility to heavy equipmentoperators. In addition, workers would be trained to maintain safe distances from elevated loads,avoiding heavy working equipment, and preventing potentially dangerous situations.
The general construction contractor would administer the health and safety program to ensurecompliance with construction safety laws, ordinances, regulations, and standards pertaining toworker safety, including the State of Washington construction safety standards and Bonnevilleregulations dealing with elevated structures and installation of electrical transmission lines. Theprogram would also include requirements to meet OSHA regulations. In the event of a fire, theApplicant’s fire-fighting personnel would assist Whatcom County Fire District No. 7 insuppressing a grass fire.

BP Cherry Point Cogeneration Project 3.16 Health and SafetyDraft EIS 3.16-13 September 2003
Releases or Potential Releases of Hazardous Materials to the Environment
Hazardous materials used during construction of the transmission line would be limited togasoline, diesel fuel, motor oil, hydraulic fluid, solvents, cleaners, sealants, welding flux andgases, various lubricants, paint, and paint thinner.
Small quantities of fuel, oil, and grease may leak from construction equipment. Such leakageshould not be a risk to health and safety or the environment because of low relative toxicity andlow concentrations. Fuel oil and greases used would be biodegradable. If a large spill from aservice or refueling truck were to occur, a licensed, qualified waste contractor would placecontaminated soil in barrels or trucks for off-site disposal. Appropriate procedures would dependon the waste classification of the contaminated soil. For example, if soils were classified asdangerous waste, they would be transported to a permitted hazardous waste disposal facility.
If a spill were to involve hazardous materials equal to or greater than the specific reportablequantity, all federal, state, and local reporting requirements would be met. Other wastes likely tobe generated include used oil, spent antifreeze, unused adhesives, and discarded chemicals andresiduals. Non-hazardous solid waste associated with construction activities could include emptycontainers, scrap wood, scrap metal, and trash.
In general, the construction contractor would be considered the generator of waste oil andmiscellaneous hazardous waste produced during construction and would be responsible forcompliance with applicable federal, state, and local laws, ordinances, regulations, and standards.This would include licensing, personnel training, accumulation limits, reporting requirements,and record keeping.
During pre-construction geotechnical investigations as well as during ground-disturbingconstruction activities along the proposed transmission corridor, the Applicant has proposed andis committed to monitoring and analyzing soils to identify contaminated material. Ifcontaminated soil is encountered, soils would be tested, handled, and disposed of in accordancewith all applicable federal, state, and local requirements.
The Department of Ecology and the Whatcom County Fire District No. 7 would be notified ifunknown water wells or underground storage tanks are discovered during construction.Subsequent abandonment, removal, and/or remediation of such facilities would be conducted inaccordance with applicable federal, state, and local codes.
Custer/Intalco Transmission Line No. 2
Assuming the interconnection with the existing Bonneville transmission system involves thereconstruction of approximately 5 miles of an existing transmission line between the CusterSubstation and the cogeneration facility interconnection point, then construction activities withinthe existing Bonneville transmission line right-of-way would occur. One of two types oftransmission line towers would be used to replace the existing towers within the Bonnevilletransmission right-of-way. The new towers would either be a double circuit monopole or double

BP Cherry Point Cogeneration Project 3.16 Health and SafetyDraft EIS 3.16-14 September 2003
circuit lattice design as shown in Figure 1-2. The towers that connect the cogeneration facilitywith the Bonneville transmission system would be the lattice design.
The potential environmental impacts resulting from the reconstruction of Custer/IntalcoTransmission Line No. 2 would be similar to the impacts described for the construction of the 0.8mile transmission line connecting the cogeneration facility to the Bonneville intertie point. Thosemitigation measures described in the previous section for the proposed transmission line wouldbe implemented during the reconstruction of Bonneville’s transmission line. Minor electricalmodification to the Custer Substation would be within the fence line of the substation and nosignificant impacts to the environment or to the public are anticipated.
Other Project Components
Construction of Access Road 3, the industrial water supply piping at Alcoa Intalco Works,Laydown Area 4, and the wetland mitigation areas would not result in significant environmentalimpacts. Potential impacts resulting from the construction of these project components would besimilar to those impacts resulting from the construction and installation of pipelines,transmission connections, and support structures associated with the cogeneration facility andrefinery interface.
As described above for the proposed transmission system, the Applicant would monitor soils forcontamination during pre-construction geotechnical investigations as well as during ground-disturbing construction activities in these areas. If contaminated soil is encountered, soils wouldbe tested, handled, and disposed of in accordance with all applicable federal, state, and localrequirements. The Department of Ecology and the Whatcom County Fire District No. 7 would benotified if unknown water wells or underground storage tanks are discovered duringconstruction. Subsequent abandonment, removal, and/or remediation of such facilities would beconducted in accordance with applicable federal, state, and local codes.
Operation and Maintenance
The potential risks present during operation of the proposed project are similar to those presentduring construction. Three categories of accidents could occur that would pose a health andsafety risk to individuals at the cogeneration facility, the refinery, or in the project vicinity: riskof anhydrous ammonia release, risk of fire or explosion either from general facility operations orspecifically from a natural gas release, and risk of a hazardous chemical release or spill. Inaddition, potential effects of electromagnetic fields (EMF) created with the use of electricalequipment, including the transmission lines, are described below.
All operational systems would be designed to provide the safest working environment possiblefor all site personnel. Design provisions and health and safety policies would comply withOSHA standards and consist of, but not be limited to, the following:
• Safe egress from all confined areas;• Adequate ventilation of all enclosed work areas;• Fire protection;

BP Cherry Point Cogeneration Project 3.16 Health and SafetyDraft EIS 3.16-15 September 2003
• Pressure relief of all pressurized equipment to a safe location;• Isolation of all hazardous substances to a confined and restricted location;• Separation of fuel storage from oxidizer storage; and• Prohibition of smoking in the workplace.
For these reasons, the potential risks resulting from operation of the proposed cogenerationfacility and associated infrastructure are considered low, as described in further detail below.
Cogeneration Facility and Refinery Interface
Risk of Anhydrous Ammonia Release
Each HRSG would be equipped with a SCR system used to inject anhydrous ammonia tominimize the production of NOx emission. The anhydrous ammonia storage and transfer systemwould consist of equipment intended to vaporize the anhydrous ammonia. This equipment wouldbe located next to each SCR system, and there would be a common ammonia storage vessel(tank), ammonia transfer pumps, vaporizer, associated piping, and controls. An unloading stationfor trucks would be set up at the common ammonia storage tank located adjacent to the proposedcogeneration facility.
Approximately 60,000 pounds or 1,579 cubic feet (at 70°F) of anhydrous ammonia would bestored at the cogeneration facility. The ammonia would be stored in a 7-foot by 45-foot tank andwould be sufficient for approximately four weeks of operation. A spill containment facility(curbed area to contain small spills) would be constructed around the truck unloading station,and a curbed containment area large enough to contain spilled ammonia and deluge water wouldbe constructed around the liquid ammonia storage tank.
The refinery currently uses anhydrous ammonia in one of its process units. The original refineryammonia tank was sized to contain a working volume of 59,200 pounds. A few years ago, asmaller tank containing a working volume of 40,000 pounds replaced the 59,200-pound tank.When the refinery Risk Management Plan (RMP) was first developed and submitted to the U.S.EPA, the refinery was using the larger ammonia tank and the modeling for the worst-case releaseof ammonia used the larger tank volume.
Potential Impact from an Uncontrolled Ammonia Release
Although the liquid ammonia storage tank would be designed with appropriate controls towithstand the risk of potential upset, an accidental or uncontrolled release of ammonia couldoccur during a natural disaster, such as an earthquake or volcanic eruption, or possibly due tointentional acts such as vandalism or terrorism. Therefore, the Applicant modeled the potentialeffects of an ammonia release at the proposed cogeneration facility to human health and safety atthe project site and in the project vicinity under different release scenarios, as described below.
Because the cogeneration facility proposes a nominal 60,000-pound ammonia storage tank, theApplicant used the same worst-case scenario for a release of ammonia as the refinery used for itsRMP. Under this scenario, the tank containing 59,200 pounds of ammonia was assumed to fail,

BP Cherry Point Cogeneration Project 3.16 Health and SafetyDraft EIS 3.16-16 September 2003
releasing a liquid and vapor of ammonia at a rate of 5,900 pounds per minute, with a releaseduration of 10 minutes. Wind speed was set at 5 feet per second with an atmospheric stabilityclass “F.” Atmospheric stability class “F” refers to “stable atmospheric conditions, clear skiesand light winds with very little horizontal or vertical turbulence.” Topography was set as“urban.” “Urban” topography refers to tree-covered terrain with buildings. The modeling resultsand a description of the potential human health effects from a release of ammonia from therefinery are described in the following paragraphs.
Under the worst-case scenario, the projected concentration of anhydrous ammonia above 200ppm would be within approximately 2.8 miles north of the refinery; this general area includesportions of the residential community of Birch Bay as well as recreational sites such as BirchBay State Park. Following the recommended Emergency Response Planning Guidelines (ERPG)of the American Industrial Hygiene Association (AIHA), the potential effects of vaporizedammonia at this concentration would be: “maximum airborne concentration below which it isbelieved that nearly all individuals could be exposed for up to one hour without experiencing ordeveloping irreversible or other serious health effects or symptoms which could impair anindividual’s ability to take protective action. There would likely be a strong odor and some eyeirritation at this level, but serious health effects would be unlikely” (AIHA 1988). This wouldmean that workers and members of the general public would have approximately one hour toseek indoor shelter to avoid the transitory ammonia vapor before they would notice the odor andexperience eye irritation. The exposure pathway would be through inhalation and dermal contact.There is a low probability of this worst-case scenario occurring due to storage tank equipmentfeatures designed to prevent releases and the highly regulated nature of ammonia, therefore thehealth and safety impacts to workers and the public is considered low.
Under the same worst-case scenario, projected concentration of anhydrous ammonia of 1,000ppm would be within approximately 0.8 mile north of the refinery. Following ERPG, thepotential effects of vaporized ammonia at this concentration would be: "maximum airborneconcentration below which it is believed that nearly all individuals could be exposed for up toone hour without experiencing or developing life-threatening health effects. This concentrationmay cause severe eye and nasal irritation; however, based on animal toxicology data, lethalitywould not be expected" (AIHA 1988). This would mean that workers and members of thegeneral public would have approximately one hour to seek indoor shelter to avoid the transitoryammonia vapor before they would notice severe eye and nasal irritation. The exposure pathwaywould also be through inhalation and dermal contact. There is a low probability of this worst-case scenario occurring due to the storage tank equipment features designed to prevent releasesand the highly regulated nature of ammonia, therefore the health and safety impacts to workersand the public is considered low. If, however, there is less than an hour’s warning of an ammoniarelease, it is anticipated that Whatcom County Emergency Service personnel would assistmembers of the public in seeking temporary indoor shelter until the vapor has dissipated and isno longer at a concentration that could cause health effects.
The Applicant also modeled a failure event that more closely represents a potential release.Under this scenario, 14,500 pounds of ammonia would be released through a ruptured transferhose at a rate of 1,450-pounds per minute; the release duration would be 10 minutes. Wind speedwas set at 10 feet per second with an atmospheric stability class “D.” Topography was set as

BP Cherry Point Cogeneration Project 3.16 Health and SafetyDraft EIS 3.16-17 September 2003
“urban.” Atmospheric stability class “D” refers to neutral atmospheric conditions, cloudy skies,and moderate-to-strong winds.
Under this scenario, the projected concentration of anhydrous ammonia over 200 ppm would bewithin approximately 1.10 miles north of the refinery. The potential health impacts within 1.10miles would be the same as the impacts described above. An analysis to determine thelocation/direction of anhydrous ammonia at a concentration of 1,000 ppm was not performed bythe Applicant.
Applicant-proposed mitigation measures to be implemented in the case of an accidental ammoniarelease are summarized in Section 3.16.5. In addition, EFSEC has asked the Applicant toperform additional modeling to identify the probable area of exposure to ammonia at aconcentration of 1,000 ppm or higher under a realistic release scenario to allow assessment ofhealth impacts from such an exposure.
Risk of Fire or Explosion from General Facility Operations
Operation of the proposed cogeneration facility and refinery interface would involve the use offlammable and combustible materials that pose an overall risk of fire or explosion at the projectsite. The potential for fire or explosion at the cogeneration facility and refinery interface wouldbe minimized through implementation of appropriate fire protection measures. Prevention is thefirst consideration in any fire protection program. Specific elements of a facility-wide fireprevention program implemented during project operations are identified in Section 3.16.5 andsummarized below.
Facility personnel would use general good housekeeping practices to control the accumulation offlammable and combustible waste materials and residues so that they do not contribute to a fireemergency. Proper storage and use of chemicals are also important for fire prevention. MSDSwould be consulted to aid in determining the correct storage for incompatible chemicals.
All state and local fire codes would be adhered to during operation of the proposed project. Allareas of high risk would have engineered safeguards and automatic fire suppression systems inplace.
The combustion turbine generator units would be equipped with specialized fire detection andprotection systems. The details of this system would be determined at the time the manufacturerand model of the generator are decided.
Qualified personnel following written procedures would operate the proposed facility.Procedures would provide clear instructions for safely conducting activities involved in theinitial startup, normal operations, temporary operations, normal shutdowns, emergencyshutdowns, and subsequent startups. The procedures for emergency shutdowns would include theconditions under which emergency shutdowns are required and the assignment of shutdownresponsibilities to qualified operators to ensure that shutdowns are done in a safe and timelymanner. Also covered in the procedures would be the consequences of operational deviations andthe steps required to correct or avoid the deviations.

BP Cherry Point Cogeneration Project 3.16 Health and SafetyDraft EIS 3.16-18 September 2003
Before they are allowed to operate the facility, employees would be given a facility plan,including a health and safety plan, and would receive training regarding the operating proceduresand other requirements for safe operation of the proposed cogeneration facility. In addition,employees would receive annual refresher training, which would include the testing of theirunderstanding of the procedures. The Applicant would maintain training and testing records.
Risk of Fire or Explosion from a Natural Gas Release
The proposed natural gas pipeline would be a specific source of potential fire or explosion duringproject operations. The first line of defense against a natural gas leak is the shutoff valves thatcan isolate a section of the gas line. Actuating these valves limits the amount of gas that can leakfrom any breach of the line. Shutoff values would be installed along the new gas pipelineconnecting the cogeneration facility to the Ferndale pipeline. A mercaptan (similar to odorantused for propane) is used in the existing natural gas line for leak detection because it has a verystrong distinctive odor and makes a gas leak readily apparent. The gas would continue to beodorized and signage would be placed over the new pipeline to reduce the risk of pipelinerupture resulting from unauthorized excavation above or near the buried pipeline. Finally,operating and emergency plans would be prepared in accordance with state codes andregulations, and routine safety inspections would be conducted in accordance with state pipelinesafety rules. Based on these design features and operating procedures, the risk of a fire orexplosion resulting from the failure of or from a leak in the natural gas pipeline is consideredlow. Specific information regarding notification in the case of an emergency is described inSection 3.16.2.
Corrosion potential is a primary safety concern relating to the operation of gas pipelines in thevicinity of power generation. The Applicant proposes to use special pipeline coatings andcathodic protection to reduce the likelihood of corrosion. Cathodic protection is the use of directcurrent electricity from an external source to oppose the discharge of corrosion current fromanodic areas that would be present naturally in the soil. When a cathodic protection system isinstalled, the protected structure (the new pipeline in this case) collects current from thesurrounding electrolyte and the entire exposed surface becomes a single cathodic area.
In the unlikely event there is a fire and/or explosion resulting from the release of natural gasfrom the connecting pipeline to the cogeneration facility, the pipeline shutoff valves would close,and fire response services would be called. Specifically, the Applicant would call WhatcomCounty Fire District No. 7. Two stations within the district are located near the proposed project,at 4047 Brown Road (1.5 miles from the project) and 5419 Grandview Road (2.5 miles from theproject). The district is a combination department consisting of 16 career and 70 volunteerfirefighters. The district maintains and staffs seven engines out of the six stations, along with fivelicensed aid units (three rescues and two transport-capable ambulances). The district is currentlypurchasing a 100-foot aerial platform ladder truck designed to meet refinery and power plantneeds.

BP Cherry Point Cogeneration Project 3.16 Health and SafetyDraft EIS 3.16-19 September 2003
Risk of Hazardous Chemical Release or Spill
The chemicals and hazardous substances to be used and stored at the proposed project duringoperation are listed in Table 3.16-5. The estimated waste streams that would be generated duringoperation are listed in Table 3.16-6. Petroleum products used onsite during operation would bestored following the same storage and handling guidelines described for construction. Additionalmeasures planned by the Applicant during operation to minimize the risk of an accidentalchemical release or spill are summarized in Section 3.16.5. During operation, the worst-casescenario would be a major leak during chemical cleaning of the HRSGs and associated piping.This method of cleaning consists of an alkaline degreasing step (in which surfactant, caustic, orammonia solution is used), a 3 to 4% citric acid cleaning step, and a passivation step. Most of thesolution would be contained in permanent facility piping and equipment (specifically theHRSGs). The components that would be most likely to leak would be the temporary chemicalcleaning piping, pump skids, and transport trailers. The probability of a major leak of thecleaning solution is considered low and therefore the potential worker and pubic health andsafety risk is considered low. The exposure pathway would be inhalation and dermal contact. Allthese chemicals are liquid, and the likelihood of a spill reaching or affecting Grandview Road,the nearest public thoroughfare, is low.
Table 3.16-5: Chemical and Hazardous Substances Anticipated to be Used duringOperation
Chemical Estimated Quantity Storage Purpose
Lubricating oil 25,800 gallons In STG and GTG equipment STG/GTG equipmentControl oil 400 gallons In STG equipment STG equipmentHydrogen 605,000 scf GTG/STG gas bottles Power generationCarbon dioxide 32,500 scf GTG/STG gas bottles Power generation,
estimate based on purgeand fire protectionrequirements
Transformer oil 49,500 gallons Combustion turbinetransformers
Coolant
Transformer oil 17,000 gallons Steam turbine transformers CoolantTransformer oil 10,000 gallons Auxiliary transformers CoolantAnhydrous ammonia 168,500 gallons
annuallyAbove grade horizontalcylindrical tank
Nox reduction
SCR Catalyst 1 4,800 ft3 In HRSG Nox reductionCO Catalyst 1 990 ft3 In HRSG CO reductionPropylene glycol 22,800 gallons Above-grade tank Closed-loop cooling
water systemNitrate/borate corrosion inhibitor 50 gallons Drum Closed-loop cooling
water systemDiethyl hydroxylamine oxygenscavenger
500 gallons Tank Boiler feedwatertreatment
Morpholine corrosion inhibitor 500 gallons Tank Boiler feedwatertreatment
Di- and trisodium phosphatepH/scale control agent
200 pounds Bags/tank Boiler feedwatertreatment
Source: BP 20021 Total amount of catalyst for all three HRSGs

BP Cherry Point Cogeneration Project 3.16 Health and SafetyDraft EIS 3.16-20 September 2003
Table 3.16-5: Continued
Chemical Estimated Quantity Storage Purpose
Cation resin 950 ft3 Warehouse/tank Water treatment systemAnion resin 900 ft3 Warehouse/tank Water treatment systemCaustic (50 wt%) 8,000 gallons Tank Water treatment systemSulfuric acid (93 wt%) 16,000 gallons Two tanks Water treatment systemPolyquaternary amine polymer 350 gallons Tank Water treatment systemPowered cellulose and activatedcarbon
2,000 lb Bags or drums Water treatment system
Sodium hypochlorite 15%solution
16,000 gallons Two tanks Cooling tower circulatingwater treatment
Polyacrylamide polymer 800 gallons Two tanks Cooling tower circulatingwater treatment
Zinc and phosphonate solution 800 gallons Two tanks Cooling tower circulatingwater treatment
Natural gas N/A Pipeline Plant fuel systemSource: BP 20021 Total amount of catalyst for all three HRSGs
Table 3.16-6: Estimated Waste Streams during Operation
Waste Stream Classification Amount Disposition
Boiler feedwater deminregeneration waste, boiler B/D,treated washdown, misc. oilydrains
Non-hazardous liquids 70 gpm Discharged to refinery fortreatment per NPDES
Spent SCR catalyst (heavymetals)
Hazardous solids Approx. 4,800 cubicfeet (once every 3 - 5
years)
Recycle
Spent oxidation catalyst (noblemetals, heavy metals)
Hazardous /non-hazardous solids
Approx. 990 cubic feet(once every 3 - 5 years)
Recycle/reclaim
CGT used air filters Non-hazardous Approx. 1,500 filters(once every 3 years)
Landfill disposal
CGT offline wash water Non-hazardous liquidbased on soap type
< 4,000 gallons/month Refinery water treatmentsystem
Scrap wood, steel, glass, plastic,paper
Non-hazardous solids 3 cubic yards/week Landfill disposal
Used oil filters, grease, oil rags,oil absorbent
Hazardous solids _ cubic yard/month Hazardous waste disposalfacility
Spent batteries Hazardous solids 100 batteries/year RecycleSolvents, paint, adhesives Hazardous solids <55 gallons/month Hazardous waste disposal
facilityUsed lube oils and hydraulicfluids
Hazardous liquid 25,000 gallons(once every 10 years)
Recycle at refinery
Oily water separator oil Hazardous liquid 20 gallons/month Recycle at refinerySource: BP 2002
A chemical cleaning contractor would be responsible for supplying neutralization chemicals andthe technical expertise to address any spill or release. To mitigate the risks, the contractor wouldbe expected to provide temporary berms around the chemical cleaning equipment and chemicals.

BP Cherry Point Cogeneration Project 3.16 Health and SafetyDraft EIS 3.16-21 September 2003
A number of safeguards would be incorporated to further reduce potential risks. These include,but are not limited to, bermed secondary containment, tank overfill protection, routinemaintenance, safe handling practices, supervision of all loading/unloading by site personnel andthe truck driver, and appropriate training of operation and maintenance staff. Additionalmitigation measures are described in Section 3.16.5.
Medical Emergencies
All permanent employees at the cogeneration facility would receive first aid and CPR training.Onsite treatment would be provided in medical situations that require only first aid treatment orstabilization of the victim(s) until professional medical attention is obtained. Any injury orillness that requires treatment beyond first aid would be referred to the refinery’s medical clinicor to a local medical facility.
Spill Prevention and Control
The emergency response plan and a SPCC plan for the BP Cherry Point Refinery would bemodified for applicability to possible spills at the site during project operations. The Applicantwould coordinate with the Washington State Department of Ecology during the preparation ofboth plans.
Transmission System
Risk of Fire or Explosion
The transmission line conductors would be located high above ground. Only qualified personnelwould perform maintenance on the transmission lines. Sufficient clearance would be providedfor all types of vehicles traveling under the transmission lines. Bonneville, the operator of theline, would establish and maintain safe clearance between the tops of trees and the proposedtransmission lines to prevent fires.
Ground wires and counterpoise wires would be installed on the new transmission system,providing lightning strike protection and therefore reducing the risk of explosion. However, abrush fire could occur in the rare event that a conductor parted and one end of the energized wirefell to the ground, or perhaps in the event of lightning strikes. Under these circumstances, thenormal fire fighting capabilities of both Whatcom County and the refinery would be called upon.
Bonneville would operate and maintain the transmission facilities consistently with Bonnevillesafety and health programs (similar to the construction health and safety program).
Releases or Potential Releases of Hazardous Materials to the Environment
Hazardous materials used during maintenance of the transmission facilities would be limited togasoline, diesel fuel, motor oil, hydraulic fluid, solvents, cleaners, sealants, welding flux andgases, various lubricants, paint, and paint thinner. Small quantities of fuel, oil, and grease may

BP Cherry Point Cogeneration Project 3.16 Health and SafetyDraft EIS 3.16-22 September 2003
leak from maintenance equipment. Such leakage should not be a risk to health and safety or theenvironment because of low relative toxicity and low concentrations.
Electric and Magnetic Fields
Magnetic fields are the result of movement of electrons in a wire (current), and electric fields arecreated by voltage, the force that drives the electrical current. All electrical wiring, devices, andequipment, including transformers, switchyards, and transmission lines, produce EMF. Thestrength and distance of EMF depends on the voltage and the design of the electrical component,and the distance from the electrical component. The strength of EMF diminishes rapidly withdistance from the EMF source. Building material, insulation, trees, and other obstructions canreduce electric fields, but do not significantly reduce magnetic fields.
The electrical field strength can be measured and expressed as kilovolts per meter, or kV/m. Themagnetic field strength is expressed as a unit of magnetic induction (gauss) and is normallymeasured as a milligauss (mG), which is one thousandth of a gauss. The average home electricappliance typically has an electrical field of less than 0.01 kV/m. In most homes, when in a roomaway from electrical appliances, the magnetic field is typically less than 2 mG. However, whenvery close to an appliance carrying high voltage, the magnetic field can be tens of hundreds ofmG. Table 3.16-7 lists the typical electric and magnetic field strengths from common householdappliances.
Table 3.16-7: Typical Electric and Magnetic Field Strengths at 1 foot from CommonAppliances
ApplianceElectric Fields
(kV/m)Magnetic Fields 1
(mG)
Coffee maker 0.03 1 – 1.5Electric range 0.004 4 – 40Hair dryer 0.04 0.1 – 70Television 0.3 0.4 – 20Vacuum cleaner 0.016 20 – 200Electric blanket 2 0.01 – 1.0 15 - 100Source: Miller 1975; Gauger 1985kV/m = kilovolt per meter; mG = milligauss1 By 3-5 feet the magnetic field from appliances is usually decreased to less than 1 mG.2 Values are for distances from a blanket in normal use, less than 1 foot away.
Electric fields from power lines are relatively stable because line voltage does not vary much.However, magnetic fields on most lines fluctuate greatly as current changes in response tochanging loads (consumption or demand). Magnetic fields are described statistically in terms ofaverages, maximums, etc. Figure 3.16-1 shows typical mean magnetic fields calculated for 321power lines for 1990 annual mean loads. During peak loads (about 1% of the time), magneticfields are about twice as strong as the mean levels shown in Table 3.16-7.

BP Cherry Point Cogeneration Project 3.16 Health and SafetyDraft EIS 3.16-23 September 2003
Figure 3.16-1: Typical Electromagnetic Levels for Transmission Lines

BP Cherry Point Cogeneration Project 3.16 Health and SafetyDraft EIS 3.16-24 September 2003
Electric transmission lines contribute a relatively small portion of the electric and magnetic fieldsto which people are exposed. Nonetheless, members of the public often express concerns aboutEMF from transmission lines. Scientific research about EMF from transmission lines has focusedon magnetic fields, because electric fields are shielded from the interior of homes and buildingswhere people spend the vast majority of their time. To evaluate potential impacts from magneticfields, hundreds of epidemiological and laboratory studies have been conducted in the UnitedStates and other countries. The results of these studies do not demonstrate any link betweenexposure to magnetic fields from transmission lines and adverse health effects (Frey 1993).
For nearby homes, businesses, and other facilities, transmission lines can be a source of exposureto magnetic fields. There are no national standards for electrical or magnetic fields, but somestates have established electric or magnetic field standards. In the Northwest, Bonneville has notestablished a standard or magnetic field strength, but has established an electrical field standardof 9 kV/m maximum on the right-of-way and 5 kV/m at the edge of the right-of-way.Washington State does not have a regulatory standard for electrical or magnetic field exposure.
With the startup of the cogeneration facility, the three existing substations within the confines ofthe refinery would be disconnected. Any potential health risks present within and adjacent to thesubstations would be eliminated. The 230 kV switchyard to be located within the cogenerationfacility would contain transformers to step down the power from 230 kV to an internal ratevoltage (either 69 kV or 115 kV) to supply the refinery. Given that the results of studies haveindicted that there are no known health effects from exposure to magnetic fields, operation of thecogeneration facility substation would not present health risks to workers or the general public.
Custer/Intalco Transmission Line No. 2
Following the reconstruction of Bonneville’s Transmission Line No. 2 no significant humanhealth and safety risks are anticipated from operation of the transmission line. The transmissionline, including tower construction, wires, and clearances, would meet the requirements ofBonneville, including meeting the electrical field strength standards described above.
A locked fence encloses the existing Custer Substation and access is limited to authorizedpersonnel. The substation’s ground surface is covered with crushed rock, and no combustiblevegetation is located within the fenced area. The risk of a major fire is low because the substationswitchyard does not contain large oil-filled equipment. The substation contains couplingcapacitor voltage transformers, each containing non-PCB oil.
Other Project Components
Following installation of the industrial water supply pipeline below grade, no health and safetyimpacts are anticipated from operation of the pipeline. Use of Access Roads 1 and 3 andconversion of the open space north of Grandview Road to the wetland mitigation areas would notresult in health and safety effects either to the public, to workers at the refinery, or at thecogeneration facility.

BP Cherry Point Cogeneration Project 3.16 Health and SafetyDraft EIS 3.16-25 September 2003
3.16.3 Impacts of No Action
The Ferndale and Cascade natural gas pipelines and the BP Cherry Point Refinery have beenadjacent to the project site for decades. If the proposed project were not constructed, the workerand public health and safety risks related to the use, storage, collection, and treatment of non-hazardous and hazardous chemicals at the refinery would still exist. Under the No ActionAlternative, there would be no additional health and safety risks related to construction andoperation of any of the components of the proposed project.
3.16.4 Secondary and Cumulative Impacts
No significant cumulative impacts on workers or public health and safety were identifiedresulting from fire and explosion, spill or releases of hazardous or toxic materials, and toxic airemissions during the construction of the cogeneration facility and ancillary infrastructure. Themitigation measures described above would reduce potential worker and public health and safetyimpacts under normal construction and operational conditions. During the two-year constructionperiod, additional chemicals and hazardous and toxic materials would be transported to theproject area. The additional chemicals and hazardous and toxic materials transported through thisindustrial region with several operating industrial facilities also transporting, storing, and usingchemicals and hazardous and toxic materials, is not expected to result in cumulative impacts. Thetransport of these chemicals and materials is regulated by local, state, and federal regulations;should an accidental release of these chemicals and/or materials occur, the resulting impactwould be less than significant and local in extent.
Potential operational risks to worker and public health and safety relate to the unexpected oraccidental release of toxic and flammable gases. With the transport and use of toxic andflammable gases by the cogeneration facility and surrounding industrial facilities, there is thepotential for a release due to an operational accident and/or through a natural catastrophe such asan earthquake. The probability of this type of worker and public risk is considered low given thedesign of the industrial facilities, proposed safety protocols in maintenance plans and programs,and mitigation measures described previously. Although workers, both within the proposedproject and in surrounding industries, and the general pubic could be exposed to the toxic andflammable gases, the significance of the potential cumulative impact has not been determined. Aregional determination of cumulative impacts would require a risk analysis based on proceduresand operating conditions of regional industrial facilities.
Another project is planned for construction in the project vicinity. The GSX natural gas pipelinewould be constructed along Grandview Road immediately north of the proposed project.Potential increased health risks resulting from construction of the pipeline include accidentalrupture and failure of the Ferndale and Cascade natural gas pipelines and the occupationalhazards associated with the operation of heavy equipment and use of hazardous materials. Thenew buried pipeline would have the same risks as other existing pipelines that transport naturalgas—that is the risk of leaks, fires, and explosions resulting from an accidental rupture of thepipeline. Operation of the GSX natural gas pipeline would increase the potential risk for fire andexplosion of the existing natural gas pipelines, the proposed cogeneration facility, and therefinery.
BP Cherry Point Cogeneration Project 3.16 Health and SafetyDraft EIS 3.16-26 September 2003
3.16.5 Mitigation Measures
Worker and public health and safety risks would be minimized through an integratedcombination of health and safety plans, procedures, and training proposed by the Applicant. TheApplicant ensures that these plans and procedures would be adhered to and enforced. In additionto the mitigation measures and design features described previously in this section, the followingmitigation measures are proposed by the Applicant to reduce potential health and safety impactsresulting from construction and operation of the proposed project.
Construction
Before construction starts, the Applicant would require its Engineering, Procurement, andConstruction (EPC) contractor to prepare an Environmental, Health, and Safety Program (EHSP)to address the management, prevention, and control of possible fire or explosion duringconstruction. During construction mobilization, the contractor would coordinate with therefinery’s Fire Marshal, Whatcom County Fire District No. 7, and regulating authoritiesregarding activities that would be occurring at the various construction sites.
The following is an overview of the mitigation plans to be prepared by the Applicant's EPCcontractor. For the most part, these plans represent a modification of plans currentlyimplemented at the refinery. The plans, when approved by regulatory agencies, would be part ofthe EHSP, implemented by the EPC contractor, and overseen by the Applicant.
Fire Prevention and Response Plan
This plan would address fire prevention and detection, and describe the responsibility ofsubcontractors and individuals working at the various sites. Safe working practices such asmaintaining appropriate fire extinguishers within easy access of any work area, restrictingsmoking to designated locations, and using a permit system for all hot work (welding, cutting,and grinding) outside of designated "free burn" areas.
A FERO plan would be prepared for the cogeneration facility. This plan, a modification of therefinery’s FERO plan, would describe procedures and protocols to address the followingconditions:
• Fire and explosion• Rescue• Emergency medical services• Insulation removal during emergencies• Terrorist and bomb threats• Civil disorder• Earthquakes• Pipeline leak/rupture• Offsite ammonia release

BP Cherry Point Cogeneration Project 3.16 Health and SafetyDraft EIS 3.16-27 September 2003
To address potentially larger fires, a companion plan known as the EPP would be prepared. Thisplan would describe preparedness and planning information and would conform with andincorporate applicable regulatory guidelines of local, state, and federal agencies.
Medical Emergency Plan
This plan would describe how construction staff would address minor injuries and provide initialfirst aid on more serious situations. Onsite treatment guidelines for first aid and/or injurystabilization would be described. A procedural plan to handle any injury or illness that requirestreatment beyond first aid would also be described.
Spill Prevention Plan
This plan would describe who would have the responsibility for implementing spill controlmeasures and training in spill avoidance. Training procedures to be described include appropriatespill response, containment, cleanup, and reporting protocols consistent with applicableregulations and refinery policy.
With respect to petroleum products located onsite during and after construction, specificinstructions for the handling and storage of petroleum products would be described. Examplesinclude:
• Lubrication oil stored onsite would be contained in barrels. The barrels would be stored in asecondary containment area to contain any spillage or in temporary warehouses.
• Construction refueling would be closely supervised to avoid leaks or releases. If fuel tanksare used during construction, they would be located within a secondary containment with anoil-proof liner sized to contain the single largest tank volume plus an adequate spaceallowance for rainwater.
• When filling transformers with oil, the oil would be pumped from a truck within a temporarysecondary containment area to contain any spillage.
Hazardous Materials Management Plan
This plan would describe a specific area within a construction site designated for servicing andfueling the construction equipment. Also included in the plan would be instructions for trainingof all construction personnel and subcontractors in spill avoidance, containment, cleanup, andreporting procedures consistent with the Applicant’s policy and regulatory requirements. Theplan would identify an onsite Safety Engineer who would be designated to implement health andsafety guidelines and to contact emergency response personnel and the local hospital, ifnecessary.
Hazardous Waste Management Plan
This plan would describe the responsibilities of a licensed Solid Waste Management contractorwho would be responsible for collection, treatment, or disposal of wastes generated duringconstruction in compliance with all federal, state, and local regulations. In addition, the plan

BP Cherry Point Cogeneration Project 3.16 Health and SafetyDraft EIS 3.16-28 September 2003
would identify BMPs to be used, including good housekeeping measures, inspections,containment facilities, and spill prevention practices. Finally, the responsibilities of theApplicant's onsite project manager would be described in the plan.
Explosion Risk Management Plan
The risks of fire or explosion during construction of the pipeline connections are consideredminimal. Nevertheless, a management plan to reduce the risks of explosion would be prepared.The plan would include work and pipeline isolation procedures to safeguard against accidentswhile working around pipelines. Examples of such procedures include locating and marking theexisting gas pipeline to avoid construction damage, and limiting construction equipment orheavy haul crossings to suitably designated locations.
Operation and Maintenance
During operation and maintenance of the proposed project, specific plans, procedures, andprotocols for managing worker and public health and safety would be developed. These mayinclude:
• Safety and Health Manual;• Emergency Preparedness Response Plan; and• Fire Emergency Response Operations Plan.
Operational plans would be prepared before startup of the cogeneration facility. Mitigationfeatures have been incorporated into the design of the cogeneration facility. The following plansto be prepared and design features are described below.
Fire Prevention and Response Plan
The following elements of the fire prevention and response plan would be described:
• Protective materials to be used for equipment and pipelines;• Means to gauge the contents of materials contained in storage vessels;• Spill kits;• Signs;• Preventive maintenance program;• Procedures for visual inspections;• Good housekeeping procedures;• Procedures for handling flammable liquids;• Mandatory hazardous communication written procedures and training program;• Procedures for establishing designated flammable storage areas;• Employee training; and• Safety and environmental audits.

BP Cherry Point Cogeneration Project 3.16 Health and SafetyDraft EIS 3.16-29 September 2003
In addition, a response protocol would be developed with Whatcom County Fire District No. 7 toensure that additional support and resources are available from the district and other firejurisdictions through the District Mutual Aid Agreements.
Spill Prevention Plan
To minimize the potential for hazardous material and chemical spills during operation of theproposed project, an operational spill prevention plan would be prepared. Design features havebeen incorporated into the layout of the project. The design and location of storage tanks andsecondary containment areas are intended to prevent spills from tanks and transfer locations.
The following tanks would hold diesel fuel oil for the emergency generator and fire suppressionwater pump or lube oil for major rotating equipment. These tanks would have secondarycontainment for spill control with adequate space for rainwater.
• The fire pump diesel fuel storage tank would be a horizontal tank with a capacity ofapproximately 460 gallons.
• The diesel generator diesel fuel storage tank would be a vertical tank with a capacity ofapproximately 1,500 gallons.
• The steam turbine lube oil storage tank would be a rectangular tank with a capacity ofapproximately 7,200 gallons. Depending on the supplier of the steam turbine, the electro-hydraulic control oil system may be integrated with the lube oil system or it may be a stand-alone system.
• One combustion turbine lube oil storage tank would be provided for each of the three CGTs.Each tank would have a capacity of approximately 6,200 gallons. These lube oil tanks wouldbe located inside the accessory module.
• Transformers would be installed into secondary containment areas that would hold thetransformer’s volume plus an adequate space to accommodate rainwater. Transformer oilwould be pumped from a truck within a temporary secondary containment area. Spills thatoccur during filling of the transformer would be properly cleaned up and reported.
• A secondary containment area would be constructed around the ammonia tank that wouldcontain 150% of the working volume. The additional containment would be provided toaccommodate water from a deluge spray system and rainwater.
• The caustic tanks would be surrounded by a secondary containment area and sized withsufficient space for rainwater.
• The acid tanks would be located within a secondary containment area lined with an acid-proof coating and sized with sufficient space for rainwater.
• Oxygen scavenger, neutralizing amine, corrosion inhibitors, phosphate, and cooling towerchemical storage tanks would be contained in a curbed area sufficiently sized to contain thevolume of the single largest storage tank.
The design of the cogeneration facility includes an oil-water separator system that collectsselected drainage and runoff from within curbed areas that could carry trace oil. Collecteddrainage and runoff would be pumped to the refinery’s treatment system.

BP Cherry Point Cogeneration Project 3.16 Health and SafetyDraft EIS 3.16-30 September 2003
Hazardous Waste Management
Little waste would be produced during the operation and maintenance of the proposed project.Used lubrication and transformer oils, small quantities of used paints, thinners, and solvents usedduring operation would be disposed of in accordance with federal, state, and local regulations.Safeguards would include bermed secondary containment, tank overfill protection, routinemaintenance, safe handling practices, supervision of all loading/unloading by plant personneland truck drivers, and appropriate training of operation and maintenance staff.
Prevention of Natural Gas Release During Operation
The Applicant would comply with all federal and state regulatory requirements regardingpipeline safety. In addition, all underground gas piping and pipeline connections to thecogeneration facility would be have cathodic protection systems and corrosion-resistant coatings.
Explosion Risk Management
Several proposed mitigation measures would ensure prompt detection of a natural gas release atthe project site. First, the natural gas would be odorized with mercaptan to give the gas a strong,distinctive odor that should make any gas leak immediately apparent. Second, a breach in thenatural gas system would result in a drop in the pressure of the gas line, which would be detectedin the control room so that the system would be shut down until the situation is resolved.Automatic shutoff valves in the existing pipeline would close to limit the amount of gas thatcould leak from the system.
If a local, small gas leak were suspected, a combustible gas indicator would be used to measurethe percentage of oxygen and concentrations of natural gas in the ambient air.
In the event of a leak, the pipeline system would be isolated by closing a shutoff valve. Theleaking section would be repaired or replaced by a licensed contractor. Upon completion of therepair work, the pipeline system would be pressure tested to ensure that the leak has beenappropriately addressed.
The Applicant has taken additional steps to reduce the opportunities for pipeline failure. Thesesteps include: (1) pipeline appurtenances would be limited to fenced (controlled) areas within theproject site, (2) the pipeline would be buried in all other uncontrolled locations, (3) the pipelineappurtenances would be protected within the cogeneration facility site by being contained withinbuildings or within fenced areas, (4) steel posts would be erected to ensure that onsite vehiclesare not able to reach critical areas, and (5) access to critical areas would be limited to authorizedpersonnel.
3.16.6 Significant Unavoidable Adverse Impacts
With implementation of the Applicant’s proposed project design and mitigation measures, nosignificant unavoidable adverse impacts to workers or to the general public’s health and safety

BP Cherry Point Cogeneration Project 3.16 Health and SafetyDraft EIS 3.16-31 September 2003
resulting from construction, operation, and maintenance of the proposed project and ancillaryinfrastructure have been identified.

BP Cherry Point Cogeneration Project 3.17 Relationship between Uses and ProductivityDraft EIS 3.17-1 September 2003
3.17 RELATIONSHIP BETWEEN SHORT-TERM USES OF THEENVIRONMENT AND THE MAINTENANCE AND ENHANCEMENT OFLONG-TERM PRODUCTIVITY
The proposed cogeneration facility would be located on land within Whatcom County zoned forHeavy Impact Industrial Use. The facility site is also located within the Cherry Point MajorIndustrial Urban Growth Area/Port Industrial Zone defined in the Whatcom CountyComprehensive Plan. Construction and operation of the facility and ancillary infrastructurewould be consistent and compatible with existing zoning, land uses, plans, and ordinances withinthe Cherry Point Major Industrial Urban Growth Area. Although the land within the projectvicinity was historically used for agricultural purposes, much of it has been used for industrialpurposes for the past 30 years. The proposed short-term use of the area’s natural resources wouldbe in accordance with state and federal resource agencies’ permit conditions.
Construction of the entire project would result in short-term impacts and uses of naturalresources to produce 720 MW of long-term electrical power to the Pacific Northwest, andelectrical power and steam to the BP Cherry Point Refinery. Short-term construction effectswould potentially include the generation of construction jobs, noise, particulate air pollution, andlocal inconvenient traffic conditions. Short-term soil erosion and water quality impacts also mayresult during and shortly after construction, although mitigation measures would be carried out tominimize these impacts. In the long term, the use of water from the Nooksack River would notrepresent a change in the quantity of water withdrawn from the river. Water that was piped to theAlcoa Intalco Works would now be piped to the cogeneration facility. In addition, the expectedretirement of three older steam boilers within the refinery would result in a net reduction of airpollutants released from the refinery.
The cogeneration facility site would be committed for the life of the proposed project, but wouldbe restored as described in a site restoration plan to be prepared by the Applicant and approvedby EFSEC.
To the extent the short-term (30 years) operation of the proposed project would contribute to thepossibility of a long-term increase in global warming from the release of greenhouse gases, theproject would have a potential effect on long-term productivity. As long as the Applicant ownsand operates the cogeneration facility, greenhouse gas emissions from the cogeneration facilitywould be offset by the reduction of greenhouse gas emissions from other Applicant-ownedoperations worldwide. If, at some time in the future, the Applicant sold the cogeneration facility,mitigation for the greenhouse gas emissions would be as follows:
• The proposed CO2 emission standard would be 0.675 pounds CO2/kWh calculated on thebasis of cogeneration fuel charged to power in Btu/kWh.
• Emissions in excess of the emission standard would be mitigated either by: (1) an annualpayment to a qualifying organization such as the Climate Trust of $0.57/ton CO2, or (2)greenhouse gas reductions obtained by the cogeneration owner, or (3) a combination of thetwo.
• Mitigation would be satisfied annually for 30 years, which is the assumed economic life ofthe proposed project. Mitigation would be reported to EFSEC on an annual basis.

BP Cherry Point Cogeneration Project 3.17 Relationship between Uses and ProductivityDraft EIS 3.17-2 September 2003
The emission of greenhouse gases from the cogeneration facility is discussed in Section 3.2 AirQuality.
The use of natural and other resources would result in the generation of electrical energy, whichcould enhance the petroleum industry’s productivity in the Pacific Northwest and the local andregional economy. With the exception of wetland impacts, the short-term use of environmentalresources is projected to have minor adverse impact on the long-term viability of theenvironmental resources in the project vicinity.

BP Cherry Point Cogeneration Project 3.18 Irreversible or Irretrievable Commitment of ResourcesDraft EIS 3.18-1 September 2003
3.18 IRREVERSIBLE OR IRRETRIEVABLE COMMITMENT OF RESOURCES
The proposed project would require a commitment of natural, physical, and human resources. Inall of these categories, an irreversible and irretrievable commitment of resources would occur.
Construction of the proposed project would consume energy and building materials. In general,natural and propane gas and diesel fuel would be consumed directly by construction equipmentand to generate electrical power and heat. Construction materials such as steel, cement, andaggregate would also be expended (see Section 3.8). These physical resources are generally insufficient supply, and their commitment to the project would not have an adverse effect on theiravailability.
Operation of the proposed project would consume approximately 42.5 MMBtu natural gasannually for the life of the project (projected at 30 years) (see Section 3.8, Energy and NaturalResources). This is an irretrievable commitment of nonrenewable natural gas resources.Electrical energy would be consumed during the startup of the proposed project. Bonnevillewould provide approximately 21 MW during startup and testing, with a projected annualconsumption or power demand of approximately 146,300 MWh/yr during operation (see Section3.8). Electrical energy generated during operation would be supplied to the BP Cherry PointRefinery and power generated in excess of the refinery’s needs would be exported toBonneville’s FCRTS under an interconnection agreement with Bonneville. Interconnection withthe FCRTS is essential to deliver power from generation facilities to loads both within andoutside the Pacific Northwest. Finally, petroleum products would continue to be consumedduring operation; however, quantities would be significantly less than during construction.
Some biological resources would be irreversibly and irretrievably lost with the construction ofthe proposed project. Approximately 35 acres of wetlands would be filled with approximately 5acres restored as part of a restoration effort. The permanent loss of approximately 30 acres wouldbe mitigated with the establishment of a 110-acre wetland mitigation area north of thecogeneration facility. In addition, wildlife habitat would be lost within the project area. However,mitigation measures are proposed to minimize the loss wildlife resources.
In terms of human resources, trade and non-skilled laborers would be used in the preparation,fabrication, and construction of the project. During the beginning phase of construction,approximately 45 skilled and non-skilled laborers would be required. That number wouldincrease during the second year of construction up to 670 laborers. During the latter half of thesecond year of construction, approximately 460 laborers would be needed to completeconstruction activities. Approximately 30 new and permanent job positions would be needed tohelp run the proposed project. Labor is generally not considered to be a resource in short supply,and commitment to the project would not have an adverse effect on the continued availability ofthese resources.
The local and regional economic and employment benefits are factors counterbalancing thecommitment of the above-described resources.

BP Cherry Point Cogeneration Project Chapter 4: ReferencesDraft EIS 4-1 September 2003
CHAPTER 4: REFERENCES
American Industrial Hygiene Association (AIHA). 1988. Emergency Response PlanningGuidelines. Fairfax, VA 22031.
American National Standards Institute (ANSI). 1989. Gas Turbine Installation Sound Emissions.Appendix B ANSI B133.8.
Arco Products Company. 1999. Wetland Compensatory Mitigation Plan for BPA/PUDTransmission Line Project: JARPA Application and SEPA Checklist.
Armstrong, J. E., Crandell, D. R., Easterbrook, D. J., Noble, J. B. 1965. “Late PleistoceneStratigraphy and Chronology in Southwestern British Columbia and NorthwesternWashington.” Geological Society of America Bulletin. Volume 76, No. 3. pp. 321-330.Quoted in BP West Coast Products LLC. June 2002 (including April 2003 revisions). BPCherry Point Cogeneration Project, Application for Site Certification. Prepared byGolder Associates, Inc. for the Energy Facility Site Evaluation Council (EFSEC).Olympia, Wash.
Bailey, J. 1970. Site form for 45WH30. Manuscript on file, Washington State Office ofArchaeology and Historic Preservation, Olympia, Wash. Quoted in Stone, Robert. 2002.Cultural resources investigation of the east and west access roads to the proposedXwechi’exen, Cherry Point, BP cogeneration facility project, Whatcom County,Washington. Submitted to the Lummi Indian Nation.
BC Hydro. February 12, 2003. Greenhouse Gases. URL: http://www.bchydro.com/policies/ghg/ghg798.html (visited July 24, 2003).
Bechtel. August 29, 2001. Edge Analytical Test Report. Reference # 01-4184.
Berger/ABAM Engineers, Inc. 2000. Arco Products Company Cherry Point Refinery MarineTerminal Pier Addition. Quoted in BP West Coast Products LLC. June 2002 (includingApril 2003 revisions). BP Cherry Point Cogeneration Project, Application for SiteCertification. Part I, Compliance Summary; Part II, Environmental Report; and Part III,Technical Appendices. Prepared by Golder Associates, Inc. for the Energy Facility SiteEvaluation Council (EFSEC). Olympia, Wash.
Billington, Lynn. July 22, 2003. Manager of Technical Services, Northwest Air PollutionAuthority. Personal communication.
Bonneville Power Administration. August 1, 2001a. Phase I Results, Regional Air QualityModeling Study. Quoted in Washington Energy Facilities Site Evaluation Council(EFSEC). 2002. Wallula Power Project EIS. Prepared by Jones and Stokes.

BP Cherry Point Cogeneration Project Chapter 4: ReferencesDraft EIS 4-2 September 2003
Bonneville Power Administration. 2001b. Newport Wallula Power Project contribution toregional haze. Quoted in Washington Energy Facilities Site Evaluation Council (EFSEC).2002. Wallula Power Project EIS. Prepared by Jones and Stokes.
Bonneville Power Administration. 2001c. 7,000 MW baseline source group contribution toregional haze. Quoted in Washington Energy Facilities Site Evaluation Council (EFSEC).2002. Wallula Power Project EIS. Prepared by Jones and Stokes.
Bonneville Power Administration. August 30, 2001d. Upgrading the Capacity and Reliability ofthe BPA Transmission System, Report of the Infrastructure Technical Review Committee.
Bonneville Power Administration. September 25, 2002. Draft Interconnection FeasibilityEvaluation for Cherry Point Generation Addition BP Refinery, Whatcom County,Washington.
BP West Coast Products LLC. June 2002 (including April 2003 revisions). BP Cherry PointCogeneration Project, Application for Site Certification. Application No. 2002-01. Part I,Compliance Summary; Part II, Environmental Report, and Part III, TechnicalAppendices. Prepared by Golder Associates, Inc. for the Energy Facility Site EvaluationCouncil (EFSEC). Olympia, Wash.
Brown, E. R. 1985. Management of Wildlife Habitats in Forests of Western Oregon andWashington, Vols. 1 and 2. U.S. Forest Service Pacific Northwest Region Publication.
Canadian Federal Government. December 17, 2002. Ecosystem Info – Smog: An Indicator ofPotential Air Quality Health Risk in the Fraser Valley. Environment Canada-The GreenLine. URL: http://www.ecoinfo.ec.gc.ca/env ind/region/smog/smog e.cfm (visited July24, 2003).
Carlson, Roy L. 1990. “Cultural Antecedents.” In Handbook of North American Indians. Vol. 7.Northwest Coast. pp.60-69. Ed. Wayne Suttles. Smithsonian Institution, WashingtonD.C.
CH2M Hill. 1985. Hydrogeologic Investigations Cherry Point Refinery. Submitted to ArcoPetroleum Products Company, Cherry Point Refinery Ferndale, Washington. Quoted inBP West Coast Products LLC. June 2002 (including April 2003 revisions). BP CherryPoint Cogeneration Project, Application for Site Certification. Part I, ComplianceSummary; Part II, Environmental Report, and Part III, Technical Appendices. Preparedby Golder Associates, Inc. for the Energy Facility Site Evaluation Council (EFSEC).Olympia, Wash.
Clayton, G. D. and F. E. Clayton, editors. 1993. Patty’s Industrial Hygiene and Toxicology.
Cole, Douglas and David Darling. 1990. “History of the early period.” In Handbook of NorthAmerican Indians. Vol. 7. Northwest Coast. pp.119-134. Ed. Wayne Suttles. SmithsonianInstitution, Washington D.C.
BP Cherry Point Cogeneration Project Chapter 4: ReferencesDraft EIS 4-3 September 2003
Cowardin, L. M., V. Carter, F. C. Golet, and E. T. LaRoe. 1979. Classification of Wetlands andDeepwater Habitats of the United States. U.S. Fish and Wildlife Service, Pub. No.FWS/OBS-79/31.
Duke/Fluor Daniel. 2001. Engineering Contractor for the Cherry Point Cogeneration Project.Quoted in BP West Coast Products LLC. June 2002 (including April 2003 revisions). BPCherry Point Cogeneration Project, Application for Site Certification. Part I, ComplianceSummary; Part II, Environmental Report, and Part III, Technical Appendices. Preparedby Golder Associates, Inc. for the Energy Facility Site Evaluation Council (EFSEC).Olympia, Wash.
Easterbrook, D. J. 1973. Environmental Geology of Western Whatcom County, Washington.Western Washington State College Press. Quoted in BP West Coast Products LLC. June2002 (including April 2003 revisions). BP Cherry Point Cogeneration Project,Application for Site Certification. Part I, Compliance Summary; Part II, EnvironmentalReport, and Part III, Technical Appendices. Prepared by Golder Associates, Inc. for theEnergy Facility Site Evaluation Council (EFSEC). Olympia, Wash.
Easterbrook, D. J. 1976. Geologic Map of Western Whatcom County, Washington. Map I-854-B.U.S. Geological Survey. Quoted in BP West Coast Products LLC. June 2002 (includingApril 2003 revisions). BP Cherry Point Cogeneration Project, Application for SiteCertification. Part I, Compliance Summary; Part II, Environmental Report, and Part III,Technical Appendices. Prepared by Golder Associates, Inc. for the Energy Facility SiteEvaluation Council (EFSEC). Olympia, Wash.
Ecology. See Washington Department of Ecology.
Energy Facility Site Evaluation Council (EFSEC). September 28, 2001. Potential Site Study, BPCherry Point Cogeneration Project. Prepared by Shapiro and Associates, Inc. Seattle,Washington.
Energy Facility Site Evaluation Council (EFSEC). 2002. Sumas Energy 2 Generation Facility,Volume 1 of 2, Section 3.1. Prepared by Jones and Stokes.
Energy Facility Site Evaluation Council (EFSEC). June 19, 2003. Draft Fact Sheet BP CherryPoint Cogeneration Project. State Waste Discharge Permit WA-ST-7441.
England, Glenn and Stephanie Wien. October 23, 2002. Development of Fine ParticulateEmission Factors and Specification Profiles for Oil- and Gas-Fired Combustion Systems.GE Energy and Environmental Research Corporation.
EPA. See U.S. Environmental Protection Agency.

BP Cherry Point Cogeneration Project Chapter 4: ReferencesDraft EIS 4-4 September 2003
Everitt, R. D., C. H. Fiscus, and R. L. DeLong. 1980. Northern Puget Sound Marine Mammals.Interagency Energy/Environment R&D Program Report. U.S. Environmental ProtectionAgency, EPA-600/7-80-139. U.S. Department of Commerce, Seattle, Wash.
Federal Energy Regulatory Commission (FERC). July 2002. Final Environmental ImpactStatement, Georgia Strait Crossing Project, Georgia Strait Crossing Pipeline LP, DocketNos. CP01-176-000 and CP01-179-000, FERC/EIS - 0140. Office of Energy Projects.Washington, DC.
Federal Energy Regulatory Commission (FERC). June 10, 2003. Order Amending Section 3Authorization and Presidential Permit. Docket No. CP03-30-000.
Federal Register. 1999. Endangered and Threatened Wildlife and Plants: Proposed Rule toRemove the Bald Eagle in the Lower 48 States from the List of Endangered andThreatened Wildlife. 50 CFR Part 17, Vol. 64, No. 128. 36454-36463.
Franklin, J. F. and C. T. Dyrness. 1988. Natural Vegetation of Oregon and Washington. 452 pp.
Frey, A. H. 1993. “Electromagnetic Field Interactions with Biological Systems,” Federation ofAmerican Societies for Experimental Biology Journal (FASEB) 7: pgs.272-281.
Gardner, C. A., Scott, K. M., Miller, C. D., Myers, B., Hildreth, W., and Pringle, P. T. 1995.Potential Volcanic Hazards from Future Activity of Mount Baker, Washington. U.S.Geological Survey Open-File Report 95-498.
Gauger. 1985. “Household appliance magnetic field survey,” IEEE Trans. on Power Apparatusand Systems, PAS – 104 (9). Pages 2436-2444.
General Land Office (GLO). 1859. Survey plat of Township 39 North, Range 1 East. Microfilmon file at the Suzzallo Library, University of Washington, Seattle, Wash.
Goldin, Alan. 1992. Soil Survey of Whatcom County Area, Washington. U.S. Department ofAgriculture, Soil Conservation Service.
Grabert, G. F. and M. Hall. 1978. An Archaeological Reconnaissance at Cherry Point,Washington. Reports in Archaeology No. 7. Western Washington State College,Bellingham, Wash. Quoted in Stone, Robert. 2002. Cultural resources investigation of theeast and west access roads to the proposed Xwechi’exen, Cherry Point, BP cogenerationfacility project, Whatcom County, Washington. Submitted to the Lummi Indian Nation.
Greater Vancouver Regional District (GVRD). October 2002. Lower Fraser Valley Ambient AirQuality Report, 2001. URL: http://www.gvrd.bc.ca/air/monitoring.htm (visited July 24,2003).
Greater Vancouver Regional District (GVRD). 2003. Air Quality-Air Quality Index. URL:http://www.gvrd.bc.ca/air/aqi.htm (visited July 29, 2003).

BP Cherry Point Cogeneration Project Chapter 4: ReferencesDraft EIS 4-5 September 2003
Hessler Associates, Inc. April 2003. Summary of Noise Modeling Methodology and Result. BPCherry Point Cogeneration. Prepared for Bechtel.
Huddle, D. January 14, 2002. Scientific technician assigned to stock assessment. WashingtonDepartment of Fish and Wildlife, LaConner. Personal communication. Quoted in BPWest Coast Products LLC. June 2002 (including April 2003 revisions). BP Cherry PointCogeneration Project, Application for Site Certification. Part I, Compliance Summary;Part II, Environmental Report; and Part III, Technical Appendices. Prepared by GolderAssociates, Inc. for the Energy Facility Site Evaluation Council (EFSEC). Olympia,Wash.
Institute of Transportation Engineers (ITE). 1997. Trip Generation Manual. 6th Edition.
Intergovernmental Panel on Climate Change (IPCC). 2001. Technical Summary, Climate Change2001; Scientific Basis. Technical Summary of the Working Group I Report. URL:http://www.ipcc.ch/ (visited July 2003).
Johnsgard, Paul. 1990. Hawks, Eagles, & Falcons of North America. Smithsonian InstitutionPress, Washington and London.
Kidd, Robert S. 1964. “A Synthesis of Western Washington Prehistory from the Perspective ofThree Occupational Sites.” M.A. thesis, Department of Anthropology, University ofWashington, Seattle, Wash.
King, J. S. 1990. Relocation and Assessment of a Prehistoric Archaeological Site at the ArcoCherry Point Refinery, Whatcom County, Washington. Letter report submitted to SophieSawyer, ENSR Consulting and Engineering by Historical Research Associates, Inc.,Seattle, Wash. Quoted in Stone, Robert. 2002. Cultural resources investigation of the eastand west access roads to the proposed Xwechi’exen, Cherry Point, BP cogenerationfacility project, Whatcom County, Washington. Submitted to the Lummi Indian Nation.
Kirk, Ruth and Carmela Alexander. 1990. Exploring Washington’s Past: A Road Guide toHistory. University of Washington Press, Seattle, Wash.
Krebs, Charles. 1994. Ecology: The Experimental Analysis of Distribution and Abundance.HarperCollins College Publishers, New York, N.Y.
Kusmer, K. and A. R. Blukis Onat. 1989. Ferndale Pipeline Class III Intensive Field Inventory,Sumas to Cherry Point, Whatcom County, Washington. BOAS Research Report No.8917, BOAS Inc., Seattle, Wash. Quoted in Stone, Robert. 2002. Cultural resourcesinvestigation of the east and west access roads to the proposed Xwechi’exen, CherryPoint, BP cogeneration facility project, Whatcom County, Washington. Submitted to theLummi Indian Nation.

BP Cherry Point Cogeneration Project Chapter 4: ReferencesDraft EIS 4-6 September 2003
Larsen, C. 1969. Site form for 45WH22. Manuscript on file, Washington State Office ofArchaeology and Historic Preservation, Olympia, Wash. Quoted in Stone, Robert. 2002.Cultural resources investigation of the east and west access roads to the proposedXwechi’exen, Cherry Point, BP cogeneration facility project, Whatcom County,Washington. Submitted to the Lummi Indian Nation.
Larsen, C. and L. Osier. 1969. Site form for 45WH23. Manuscript on file, Washington StateOffice of Archaeology and Historic Preservation, Olympia, Wash. Quoted in Stone,Robert. 2002. Cultural resources investigation of the east and west access roads to theproposed Xwechi’exen, Cherry Point, BP cogeneration facility project, WhatcomCounty, Washington. Submitted to the Lummi Indian Nation.
Leigh, Curt. October 19, 2001. Habitat Biologist with WDFW. Personal communication. Quotedin BP West Coast Products LLC. June 2002 (including April 2003 revisions). BP CherryPoint Cogeneration Project, Application for Site Certification. Part I, ComplianceSummary; Part II, Environmental Report; and Part III, Technical Appendices. Preparedby Golder Associates, Inc. for the Energy Facility Site Evaluation Council (EFSEC).Olympia, Wash.
Luttrell, C. T. 1995. A Cultural Resources Survey of the Bonneville Power Administration’sCherry Point Project, Whatcom County, Washington. Report submitted to the BonnevillePower Administration by Archaeological and Historical Services, Cheney, Wash. Quotedin Stone, Robert. 2002. Cultural resources investigation of the east and west access roadsto the proposed Xwechi’exen, Cherry Point, BP cogeneration facility project, WhatcomCounty, Washington. Submitted to the Lummi Indian Nation.
Makarow, Irina. August 2, 2003. Siting Manager, Energy Facilities Site Evaluation Council.Personal communication.
Marino, Cesare. 1990. “History of Western Washington since 1846.” In Handbook of NorthAmerican Indians. Vol. 7. Northwest Coast. pp.169-179. Ed. Wayne Suttles. SmithsonianInstitution, Washington D.C.
McKinney, Thomas. July 3, 2003. NEPA Compliance Officer, Bonneville Power Administration.Personal communication.
MFG, Inc. December 16, 2002. BP Cherry Point Refinery Isomerization Project, NOC/PSDPermit Application, Second Revision. Atmospheric Sciences Group. Lynnwood,Washington.
Middleton, Roland. November 2001. Land Use Services Division Manager, Whatcom County.Personal communication. Quoted in BP West Coast Products LLC. June 2002 (includingApril 2003 revisions). BP Cherry Point Cogeneration Project, Application for SiteCertification. Part I, Compliance Summary; Part II, Environmental Report, and Part III,Technical Appendices. Prepared by Golder Associates, Inc. for the Energy Facility SiteEvaluation Council (EFSEC). Olympia, Wash.

BP Cherry Point Cogeneration Project Chapter 4: ReferencesDraft EIS 4-7 September 2003
Miller, H. A. 1975. “Practical Wiring,” Oxford: Pergamon Press. 2d. 2 vols. Call number; TK3271.M.5.
Miller, T. 1990. Living in the Environment: An Introduction to Environmental Science.Wadsworth Publishing Company, Belmont, California.
Miss, C. J. 1992. New Investigations at the Cherry Point Industrial Park, Whatcom County, WA.Report prepared for Norelco, Inc. by Northwest Archaeological Associates, Inc., Seattle,Wash. Quoted in Stone, Robert. 2002. Cultural resources investigation of the east andwest access roads to the proposed Xwechi’exen, Cherry Point, BP cogeneration facilityproject, Whatcom County, Washington. Submitted to the Lummi Indian Nation.
Moerman, Daniel E. 1999. Native American Ethnobotany. Timber Press, Portland, Ore.
Morrison, M., B. Marcot, and W. Mannan. 1992. Wildlife-Habitat Relationships: Concepts &Applications. The University of Wisconsin Press, Madison, Wisconsin.
Myers, J. M., R. G. Kope, G. J. Bryant, D. Teel, L. J. Lierheimer, T. C. Wainwright, W. S.Grand, F. W. Waknitz, K. Neely, S. T. Lindley, and R. S. Waples. 1998. Status review ofchinook salmon from Washington, Idaho, Oregon, and California. U.S. Department ofCommerce, NOAA Tech. Memo. NMFS-NWFSC-35, 443 p. Quoted in BP West CoastProducts LLC. June 2002 (including April 2003 revisions). BP Cherry PointCogeneration Project, Application for Site Certification. Part I, Compliance Summary;Part II, Environmental Report; and Part III, Technical Appendices. Prepared by GolderAssociates, Inc. for the Energy Facility Site Evaluation Council (EFSEC). Olympia,Wash.
National Academy of Sciences. 2001. Climate Change Science: An Analysis of Some KeyQuestions. National Academy Press. Quoted in Washington Energy Facilities SiteEvaluation Council (EFSEC). 2002. Wallula Power Project EIS. Prepared by Jones andStokes.
National Oceanic and Atmospheric Administration (NOAA) Fisheries. 2003. Threatened andendangered species data search. URL: http://www.nwr.noaa.gov/1salmon/salmesa/chinpug.htm (visited July 18, 2003).
Natural Resource Conservation Service (NRCS). 2003. Frequently Asked Questions. URL:http://www.info.usda.gov/nrcs/fpcp/faq.htm#7 (visited July 22, 2003).
Nelson, Charles M. 1990. “Prehistory of the Puget Sound Region.” In Handbook of NorthAmerican Indians. Vol. 7. Northwest Coast. pp.481-484. Ed. Wayne Suttles. SmithsonianInstitution, Washington D.C.
Newcomb, R. C., Sceva, J. E., and Stromme, O. 1949. Ground-Water Resources of WesternWhatcom County. U.S. Geologic Survey. Quoted in BP West Coast Products LLC. June

BP Cherry Point Cogeneration Project Chapter 4: ReferencesDraft EIS 4-8 September 2003
2002 (including April 2003 revisions). BP Cherry Point Cogeneration Project,Application for Site Certification. Part I, Compliance Summary; Part II, EnvironmentalReport, and Part III, Technical Appendices. Prepared by Golder Associates, Inc. for theEnergy Facility Site Evaluation Council (EFSEC). Olympia, Wash.
Norberg, Brent. March 6, 2000. National Marine Fisheries Service, marine mammal specialist.Personal communication with Michael Kyte, BERGER/ABAM Engineers Inc. Quoted inBP West Coast Products LLC. June 2002 (including April 2003 revisions). BP CherryPoint Cogeneration Project, Application for Site Certification. Part I, ComplianceSummary; Part II, Environmental Report; and Part III, Technical Appendices. Preparedby Golder Associates, Inc. for the Energy Facility Site Evaluation Council (EFSEC).Olympia, Wash.
Northwest Air Pollution Authority (NWAPA). 2003. NWAPA Regulations. URL:http://www.nwair.org (visited April 22, 2003). NWAPA 550.
Northwest Gas Association. n.d. Natural Gas and the Pacific Northwest. URL:http://www.nwga.org/ng pnw.htm. (visited August 3, 2003).
Northwest Power and Conservation Council (NWPCC). May 13, 2003. Revised Draft Forecastof Electricity Demand for the 5th Pacific Northwest Conservation and Electric PowerPlan, p. 11.).
Northwest Power Planning Pool (NWPP). October 4, 2002. Northwest Power Pool AreaAssessment of Reliability and Adequacy, 2002-2003 Winter Operating Conditions.
OFM. See Washington State Office of Financial Management.
OTED. See Washington State Office of Trade and Economic Development.
Pacific Northwest River Basin Commission. 1968. Climatological Handbook: Columbia BasinStates. 3, part A, Meteorology Committee.
Pringle, P. T. 1994. “Volcanic Hazards in Washington – A Growth Management Perspective.”Washington Geology. Volume 22, No. 2. pp. 25-32. Quoted in BP West Coast ProductsLLC. June 2002 (including April 2003 revisions). BP Cherry Point Cogeneration Project,Application for Site Certification. Part I, Compliance Summary; Part II, EnvironmentalReport, and Part III, Technical Appendices. Prepared by Golder Associates, Inc. for theEnergy Facility Site Evaluation Council (EFSEC). Olympia, Wash.
Puget Sound Energy (PSE). April 2003. Least Cost Plan, Appendix A - Regional GenerationProject Development. URL: www.pse.com/account/pdfs/lcp 2003 04 30 a appendix regional generation project development.pdf (visited August 4, 2003).
Radian International and Dames and Moore. 1999. Wetland Report for Arco Products Company.Proposed Arco Cherry Point Refinery Distribution Lines, ROW, Towers and Substation.

BP Cherry Point Cogeneration Project Chapter 4: ReferencesDraft EIS 4-9 September 2003
Reed, Tom. October 23, 2001. Resident Wildlife Manager, Lake Terrell, Personalcommunication. Quoted in BP West Coast Products LLC. June 2002 (including April2003 revisions). BP Cherry Point Cogeneration Project, Application for SiteCertification. Part I, Compliance Summary; Part II, Environmental Report; and Part III,Technical Appendices. Prepared by Golder Associates, Inc. for the Energy Facility SiteEvaluation Council (EFSEC). Olympia, Wash.
Remediation Technologies, Inc. 1993. Environmental Data Summary Prepared for ArcoProducts Company. Cherry Point Refinery. Ferndale, Washington. Quoted in BP WestCoast Products LLC. June 2002 (including April 2003 revisions). BP Cherry PointCogeneration Project, Application for Site Certification. Part I, Compliance Summary;Part II, Environmental Report, and Part III, Technical Appendices. Prepared by GolderAssociates, Inc. for the Energy Facility Site Evaluation Council (EFSEC). Olympia,Wash.
Rice, D. G. 1992. Archaeological Reconnaissance of Cleared Uplands for Cherry PointIndustrial Park, Whatcom County, Washington. Army Corps of Engineers Memorandumfor Record, Seattle District Office, Seattle, Wash. Quoted in Stone, Robert. 2002.Cultural resources investigation of the east and west access roads to the proposedXwechi’exen, Cherry Point, BP cogeneration facility project, Whatcom County,Washington. Submitted to the Lummi Indian Nation.
Robinson, W. and E. Bolen. 1989. Wildlife Ecology and Management. Macmillan PublishingCompany, New York, N.Y.
Ruby, Robert H. and John A. Brown. 1986. A Guide to the Indian Tribes of the PacificNorthwest. University of Oklahoma Press, Norman, Okla.
Seattle City Light. July 23, 2001. Resolution Number 30359. “A resolution outlining Seattle CityLight’s strategy for meeting the goal of zero net greenhouse gas emissions andestablishing specific greenhouse gas mitigation targets and timelines.” Quoted inWashington Energy Facilities Site Evaluation Council (EFSEC). 2002. Wallula PowerProject EIS. Prepared by Jones and Stokes.
Stockwell, William R. 2000. “The Ammonium Nitrate Particle Equivalent of NOx emissions forWintertime Conditions in Central California’s San Joaquin Valley.” AtmosphericEnvironment. 34:4711-4717. Quoted in Washington Energy Facilities Site EvaluationCouncil (EFSEC). 2002. Wallula Power Project EIS. Prepared by Jones and Stokes.
Stone, Robert. 2002. Cultural Resources Investigation of the East and West Access Roads to theProposed Xwechi’exen, Cherry Point, BP Cogeneration Facility Project, WhatcomCounty, Washington. Submitted to the Lummi Indian Nation.
Suttles, Wayne. 1990. “Central Coast Salish.” In Handbook of North American Indians. Vol. 7.Northwest Coast. pp.453-475. Ed. Wayne Suttles. Smithsonian Institution, WashingtonD.C.

BP Cherry Point Cogeneration Project Chapter 4: ReferencesDraft EIS 4-10 September 2003
Swanton, John Reed. 1978. Indian Tribes of Washington, Oregon, and Idaho. Ye Galleon Press,Fairfield Wash.
Thompson, Laurence C. and M. Dale Kinkade. 1990. “Languages.” In Handbook of NorthAmerican Indians. Vol. 7. Northwest Coast. pp.30-51. Ed. Wayne Suttles. SmithsonianInstitution, Washington D.C.
Tipler, P. A. 1976. Physics. Warth Publishers, New York, N.Y.
Torpey, Michael. October 2 and September 29, 2002. Cogeneration Facility Manager, BP WestCoast Products, LLC. Personal communication.
Torpey, Michael. June 2, July 9, July 17, July 23, July 24, and July 31, 2003. CogenerationFacility Manager, BP West Coast Products, LLC. Personal communication.
Transportation Research Board. 2000. Highway Capacity Manual. National Research Council.
U.S. Department of Agriculture (USDA). 1997. Census of Agriculture (AC97S-3r), RankingStates and Counties, Volume 2, Subject Series Part II. Quoted in BP West Coast ProductsLLC. June 2002 (including April 2003 revisions). BP Cherry Point Cogeneration Project,Application for Site Certification. Part I, Compliance Summary; Part II, EnvironmentalReport, and Part III, Technical Appendices. Prepared by Golder Associates, Inc. for theEnergy Facility Site Evaluation Council (EFSEC). Olympia, Wash.
U.S. Department of Agriculture (USDA). 2000. 1997 Agricultural Census for Whatcom County,Washington. URL: http:www.nass.usda.gov/census (visited July 21, 2003).
U.S. Department of Energy. October 15, 1999. Carbon Dioxide Emission from Generation ofElectrical Power in the United States.
U.S. Department of Energy. September 2000. Life Cycle Assessment of a Natural Gas CombinedCycle Power Generation System. U.S. Department of Energy, National RenewableEnergy Laboratory. Report No. NREL/TP-570-27715.
U.S. Energy Information Administration. January 9, 2003. Annual Energy Outlook 2003 withProjections to 2025. DOE/EIA-0383(2003). URL: http://www.eia.doe.gov/oiaf/aeo/gas.html (visited August 3, 2003).
U.S. Environmental Protection Agency (EPA). 1971. Noise from Construction Equipment andOperations, Building Equipment, and Home Appliances. Washington, D.C.
U.S. Environmental Protection Agency (EPA). 1974. Information on levels of environmentalnoise requisite to protect public health and welfare with an adequate margin of safety.Report No. 550/9-74-004.

BP Cherry Point Cogeneration Project Chapter 4: ReferencesDraft EIS 4-11 September 2003
U.S. Fish and Wildlife Service (USFWS). 1987a. National Wetland Inventory Blaine, Wash.Quadrangle.
U.S. Fish and Wildlife Service (USFWS). 1987b. National Wetland Inventory Lummi Bay, WashQuadrangle.
U.S. Fish and Wildlife Service (USFWS). July 2001. Listed and Proposed Endangered andThreatened Species, Critical Habitat, Candidate Species and Species of Concern thatMay Occur within the Vicinity of the Proposed Cogeneration Facility Project inWhatcom County, Washington. FWS REF: 1-3-01-SP-1788.
Wallace, Robert. 1987. Biology: The World of Life. Scott, Foresman, and Company, Glenview,Illinois.
Warinner, R. January 4, 2002. Regional freshwater fisheries habitat biologist. WashingtonDepartment of Fish and Wildlife, LaConner. Personal communication. Quoted in BPWest Coast Products LLC. June 2002 (including April 2003 revisions). BP Cherry PointCogeneration Project, Application for Site Certification. Part I, Compliance Summary;Part II, Environmental Report; and Part III, Technical Appendices. Prepared by GolderAssociates, Inc. for the Energy Facility Site Evaluation Council (EFSEC). Olympia,Wash.
Washington Department of Ecology. 1993. Washington State Wetlands Rating System: WesternWashington. Second Edition. Publication #93-74. Olympia, Washington.
Washington Department of Ecology. 1999. Methods for Assessing Wetland Functions. Olympia,Washington.
Washington Department of Ecology. August 2001a. Water Rights Application Tracking(WRAT) Database. Conducted by BP West Coast Products, LLC.
Washington Department of Ecology. 2001b. Stormwater Management Manual for WesternWashington.
Washington Department of Fish and Wildlife (WDFW). 2001. Priority Habitats and SpeciesDatabase Search. Washington Department of Fish and Wildlife, Natural HeritageProgram.
Washington Department of Fish and Wildlife (WDFW). 2003. Species of concern data search.URL: http://www.wa.gov/wdfw/wlm/diversty/soc/concern.htm (visited July 21, 2003).
Washington Department of Natural Resources (WDNR). 2001. Washington Natural HeritageProgram List of Endangered, Threatened and Sensitive Species of Vascular Plants withinProposed Project Site.

BP Cherry Point Cogeneration Project Chapter 4: ReferencesDraft EIS 4-12 September 2003
Washington Department of Water Resources (WDNR). 1960. Water Resources of the NooksackRiver Basin. Quoted in BP West Coast Products LLC. June 2002 (including April 2003revisions). BP Cherry Point Cogeneration Project, Application for Site Certification. PartI, Compliance Summary; Part II, Environmental Report, and Part III, TechnicalAppendices. Prepared by Golder Associates, Inc. for the Energy Facility Site EvaluationCouncil (EFSEC). Olympia, Wash.
Washington State Office of Financial Management (OFM). 2002. Washington State CountyGrowth Management Projections 2000 to 2025. Olympia, Wash.
Washington State Office of Trade and Economic Development (OTED). January 2001a. 2001Biennial Energy Report, Issues and Analyses for the Washington State Legislature.
Washington State Office of Trade and Economic Development (OTED). May 2001b.Convergence: Natural Gas and Electricity in Washington, A Survey of the PacificNorthwest Natural Gas Industry on the Eve of a New Era in Electric Generation.
Western Electricity Coordinating Council (WECC). September 2002. 10-Year Coordinated PlanSummary 2002-2011. Planning and Operation for Electric System Reliability, pg.16.
Western Systems Coordinating Council (WSCC). October 2000. 10-Year Coordinated PlanSummary, 2000-2009: Planning and Operation for Electric System Reliability. Salt LakeCity, Utah.
Whatcom County. 1991. Preserving a Way of Life: A Natural Heritage Plan for WhatcomCounty. Park and Open Space Plan and the Natural Heritage Plan for Whatcom County,Washington.
Whatcom County. May 20, 1997. Whatcom County Comprehensive Plan. Adopted May 20,1997, revised November 23, 1999. Whatcom County Planning and Development ServicesDepartment, Planning Division. Bellingham, Washington.
Whatcom County. 1998. Shoreline Management Program. Whatcom County Planning andDevelopment Services Department, Planning Division. Bellingham, Washington.
Whatcom County. February 26, 2003a. Birch Bay Community Plan (Draft). Not adopted.Whatcom County Planning and Development Services Department, Planning Division.Bellingham, Washington. URL: http://www.smartgrowthbirchbay.org (visited June 21,2003).
Whatcom County. 2003b. Solid Waste Division, Disposal of Solid Waste. Public WorksDepartment, Solid Waste Division. URL: http://www.co.whatcom.wa.us/publicworks/solidwaste/index.jsp (visited August 15, 2003).
Whatcom County. January 1, 2003c. 2003 Final Budget. Bellingham, Wash.

BP Cherry Point Cogeneration Project Chapter 4: ReferencesDraft EIS 4-13 September 2003
Whiteman, Erik A, Sts’aStelQuyd, and Al Scott Johnnie. 2002. Cultural Resources Investigationof the proposed Xwechi’exen, Cherry Point, BP Cogeneration Facility Project, WhatcomCounty, Washington. Submitted to the Lummi Indian Nation.
Wigfield, Kim. July 22, 2003. Washington Department of Ecology. Personal communication.
Williams Gas Pipeline West. April 2001. Environmental Report. Exhibit F-1 in the Certificate ofPublic Convenience and Necessity. Georgia Strait Crossing Pipeline Project. DocketNumber CP01-176-000. Salt Lake City, Utah.
Williams, R. W., R. M. Laramie, and J. J. Ames. November 1975. A Catalog of WashingtonStreams and Salmon Utilization. Volume 1. Washington Department of Fisheries.Olympia, Wash.
Woodman, J. C. and L. Mighetto. 1992. A Cultural Resources Survey of the Cascade NaturalGas Pipeline Project, Whatcom County, Washington. Report prepared for ENSRConsulting and Engineering by Historical Research Associates, Inc., Seattle, Wash.Quoted in Stone, Robert. 2002. Cultural resources investigation of the east and westaccess roads to the proposed Xwechi’exen, Cherry Point, BP cogeneration facilityproject, Whatcom County, Washington. Submitted to the Lummi Indian Nation.

BP Cherry Point Cogeneration Project Chapter 5: Acronyms and AbbreviationsDraft EIS 5-1 September 2003
CHAPTER 5: ACRONYMS AND ABBREVIATIONS
µg/m3 micrograms per cubic meterAASHTO American Association of State Highway Transportation OfficialsACC air-cooled condensingADT average daily trafficAHPA Archaeological and Historic Preservation ActAIHA American Industrial Hygiene AssociationANSI American National Standards InstituteAPE Area of Potential EffectApplicant BP West Coast Products, LLCAQI air quality indexAQRV air quality related valuesASC Application for Site CertificationASILs Acceptable Source Impact LevelsB&O business and occupationBACT Best Available Control TechnologyBE Biological EvaluationBFW boiler feedwaterBMPs Best Management PracticesBNSF Burlington Northern Santa FeBOD Biochemical Oxygen DemandBonneville Bonneville Power AdministrationBP BP West Coast Products, LLCBtu/kWh British thermal units per kilowatt hourCAA Clean Air ActCB citizens bandCEQ Council on Environmental QualityCERCLIS Comprehensive Environmental Response, Compensation, and
Liability Information SystemCFR Code of Federal Regulationscfs cubic feet per secondCGTs combustion gas turbine generatorsCMA Compensatory Mitigation AreaCO carbon monoxideCOD Chemical Oxygen DemandCorps U.S. Army Corps of EngineersCPR cardiopulmonary resuscitationCRGNSA Columbia River Gorge National Scenic AreadB decibelsdbh diameter at breast heightDOT U.S. Department of TransportationDth/d decatherms per dayEcology Washington Department of EcologyEFSEC Washington State Energy Facility Site Evaluation CouncilEHSP Environmental, Health, and Safety Program

BP Cherry Point Cogeneration Project Chapter 5: Acronyms and AbbreviationsDraft EIS 5-2 September 2003
EIS Environmental Impact StatementEMF electromagnetic fieldsEMI electromagnetic interferenceEOs Executive OrdersEPA U.S. Environmental Protection AgencyEPC Engineering, Procurement and ConstructionEPP Emergency Preparedness PlanERPG Emergency Response Planning GuidelinesESA Endangered Species ActESU Evolutionarily Significant UnitFAA Federal Aviation AdministrationFCRTS Federal Columbia River Transmission SystemFEMA Federal Emergency Management AgencyFerndale pipeline Arco Western Natural Gas PipelineFERO Fire Emergency Response OperationsFM frequency modulatedFPPA Farmland Protection Policies ActGLO General Land Officegpm gallons per minuteGPT Gateway Pacific TerminalGSX Georgia Strait CrossingGTN Gas Transmission, NorthwestGVRD Greater Vancouver Regional DistrictH2SO4 sulfuric acid mistHAP hazardous air pollutantsHHV Higher Heat ValueHII Heavy Impact Industrialhorsepower hpHRSGs heat recovery steam generatorsIPCC Intergovernmental Panel on Climate ChangeISC Industrial Source ComplexkHz kilohertzkpph thousand pounds per hourkV kilovoltkV/m kilovolts per meterkW kilowattL&I Washington Department of Labor and Industrieslbs/kWhr pounds per kilowatt-hourLII Light Impact IndustrialLOS level-of-serviceMACT Maximum Available Control TechnologyMDth/day million decatherms per daymG milligaussMMBtu million British thermal unitsMMlb million poundsMMTCE million metric tons of carbon equivalents

BP Cherry Point Cogeneration Project Chapter 5: Acronyms and AbbreviationsDraft EIS 5-3 September 2003
MP milepostMSDS Material Safety Data SheetsMSL mean sea levelMVA million volt ampMW megawattNAAQS National Ambient Air Quality StandardsNAGPRA Native American Graves Protection and Repatriation ActNEPA National Environmental Policy ActNESHAPS National Emission Standards for Hazardous Air PollutantsNHPA National Historic Preservation ActNO2 nitrogen dioxideNOAA National Oceanic and Atmospheric AdministrationNOx nitrogen oxidesNPDES National Pollutant Discharge Elimination SystemNRCS Natural Resources Conservation ServiceNSPS New Source Performance StandardsNSR New Source ReviewNWAPA Northwest Air Pollution AuthorityNWPCC Northwest Power and Conservation CouncilO3 ozoneOAHP Office of Archaeology and Historic PreservationOSHA Occupational Safety and Health AdministrationOTED Washington State Office of Trade and Economic DevelopmentPb leadPEM palustrine emergentPFO palustrine forestedPFOC seasonally flooded palustrine forestedPG&E PG&E National Energy GroupPGA peak ground accelerationPM10, PM2.5, particulate matterppb parts per billionppm parts per millionppmdv parts per million volume dryPSD Prevention of Significant DeteriorationPSE Puget Sound Energypsi pounds per square inchpsia pounds per square inch absolutepsig pounds per square inch gaugePSS Potential Site StudyPSS palustrine scrub-shrubPSSA temporarily flooded palustrine scrub-scrubPUD Whatcom County Public Utility District No. 1RAS Remedial Action SchemeRCW Revised Code of WashingtonRI Radio InterferenceRMP Risk Management Plan

BP Cherry Point Cogeneration Project Chapter 5: Acronyms and AbbreviationsDraft EIS 5-4 September 2003
ROD Record of DecisionROW right-of-waySCR selective catalytic reductionSE2 Sumas Energy 2 Generation FacilitySEPA State Environmental Policy ActSILs Significant Impact LevelsSO2 sulfur dioxideSPCC Spill Prevention Control and CountermeasuresSQER Small Quantity Emissions RateSTG steam turbine generatorSWPP Stormwater Pollution Preventiontcf trillion cubic feetTESC Temporary Erosion and Sedimentation ControlTMDL Total Maximum Daily Loadtpy tons per yearTransCanada Alberta Natural Gas PipelineTSP total suspended particulateTSS total suspended solidsTVI television interferenceUGA Urban Growth AreaUSDA U.S. Department of AgricultureUSFWS U.S. Fish and Wildlife ServiceUSGS U.S. Geological SurveyVOC volatile organic compoundsWAAQS Washington Ambient Air Quality StandardsWAC Washington Administrative CodeWDFW Washington Department of Fish and WildlifeWDNR Washington Department of Natural ResourcesWECC Western Electricity Coordinating CouncilWRIA Water Resource Inventory AreaWRAT Water Right Application TrackingWSCC Western System Coordinating CouncilWSDOT Washington State Department of TransportationWUTC Washington Utilities and Transportation CommissionWWTP Birch Bay Wastewater Treatment Plant

BP Cherry Point Cogeneration Project Chapter 6: List of PreparersDraft EIS 6-1 September2003
CHAPTER 6: LIST OF PREPARERS
The lead agencies for the BP Cherry Point Cogeneration Project Draft EIS are Bonneville andEFSEC. The Draft EIS was written with the technical assistance of Shapiro and Associates, Inc.Individuals responsible for preparing the EIS are listed below.
6.1 BONNEVILLE STAFF
Thomas C. McKinney – Bonneville Power Administration, NEPA Compliance Officer.Contributed to underlying need for action section. Education: B.A. Geography. Experience: 23years of environmental analysis experience.
Patrick R. Rochelle – Bonneville Power Administration, Network Planning, Electrical Engineer.Performed technical evaluation of the integration of the project into the Bonneville PowerAdministration system. Education: B.S. Electrical Engineering, M.S. Electrical Engineering.Experience: 15 years of electrical engineering in maintenance and utility engineering.
6.2 CONSULTING STAFF
Christopher J. Andersen – Senior Environmental Planner, Shapiro and Associates, Inc. Primaryauthor or contributor to agricultural land, crops, and livestock, energy and natural resources, landuse, visual resources, light and glare, population housing and economics, and public services andutilities. Education: B.S. Environmental Science and Public Policy. Experience: 11 years.
Mark Adams – CDM. Author for water/water resources section. Education: B.S. Geology,University of Oregon; M.S. Geology. Experience: 25 years.
Monica Beckman – CDM. Responsible for Health and Safety Section. Education: B.S.E.Industrial and Operations Engineering. Experience: 15 years.
Marc E. Boulé – Senior Vice President, Shapiro and Associates, Inc. Responsible for the analysisof water resources, water quality, wetlands and wetland mitigation, and vegetation. Education:B.S. Geology, M.S. Marine Science. Experience: 33 years.
Jason Detamore – Acoustic and Air Quality Specialist, Shapiro and Associates, Inc. Primaryauthor of the air quality section. Education: B.S. Environmental Science, certification in FHWAFundamentals and Abatement of Highway Traffic Noise, and Modeling of Mobile Source AirQuality Impacts. Experience: 3 years.
Calvin Douglas – Senior Ecologist, Shapiro and Associates, Inc. Responsible for the analysis ofwetlands, agricultural land, crops, and livestock, vegetation, wildlife, habitat, fisheries, and T&Especies. Education: B.S. Wildlife Biology. Experience: 18 years.
Linda Goetz – Senior Archaeologist, Shapiro and Associates, Inc. Responsible for the analysis ofcultural resources. Education: B.A. Anthropology and Archaeology. Experience: 18 years.
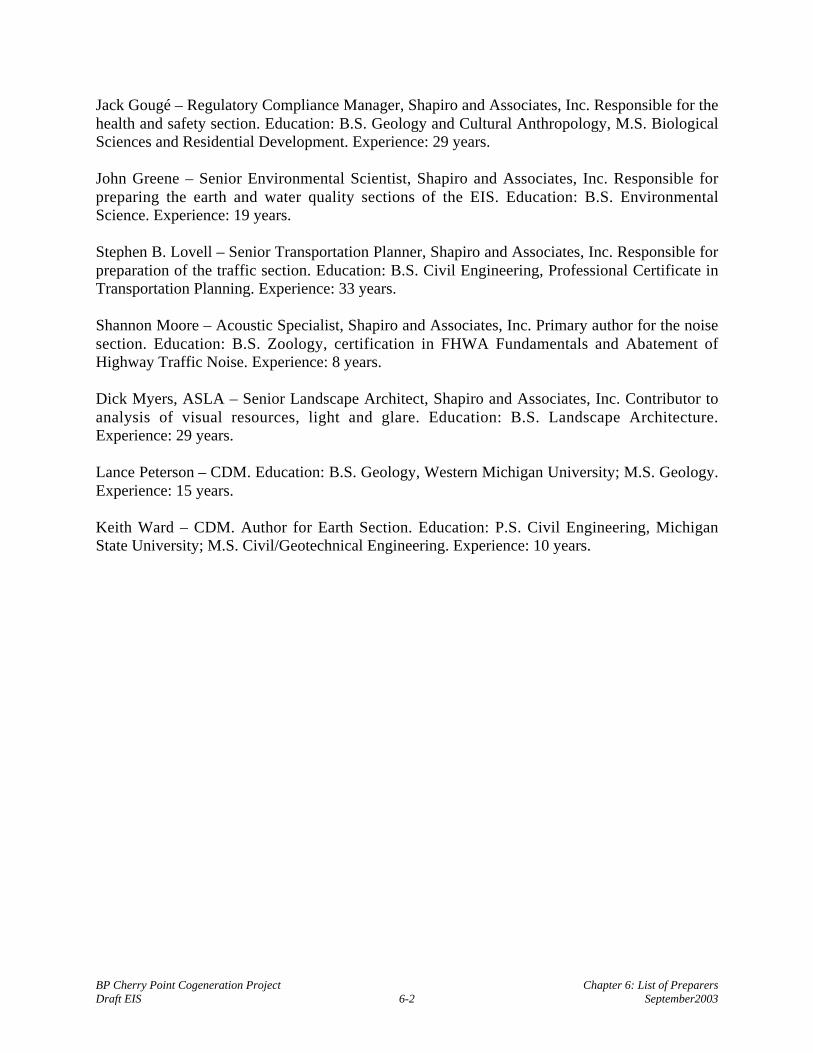
BP Cherry Point Cogeneration Project Chapter 6: List of PreparersDraft EIS 6-2 September2003
Jack Gougé – Regulatory Compliance Manager, Shapiro and Associates, Inc. Responsible for thehealth and safety section. Education: B.S. Geology and Cultural Anthropology, M.S. BiologicalSciences and Residential Development. Experience: 29 years.
John Greene – Senior Environmental Scientist, Shapiro and Associates, Inc. Responsible forpreparing the earth and water quality sections of the EIS. Education: B.S. EnvironmentalScience. Experience: 19 years.
Stephen B. Lovell – Senior Transportation Planner, Shapiro and Associates, Inc. Responsible forpreparation of the traffic section. Education: B.S. Civil Engineering, Professional Certificate inTransportation Planning. Experience: 33 years.
Shannon Moore – Acoustic Specialist, Shapiro and Associates, Inc. Primary author for the noisesection. Education: B.S. Zoology, certification in FHWA Fundamentals and Abatement ofHighway Traffic Noise. Experience: 8 years.
Dick Myers, ASLA – Senior Landscape Architect, Shapiro and Associates, Inc. Contributor toanalysis of visual resources, light and glare. Education: B.S. Landscape Architecture.Experience: 29 years.
Lance Peterson – CDM. Education: B.S. Geology, Western Michigan University; M.S. Geology.Experience: 15 years.
Keith Ward – CDM. Author for Earth Section. Education: P.S. Civil Engineering, MichiganState University; M.S. Civil/Geotechnical Engineering. Experience: 10 years.

BP Cherry Point Cogeneration Project Chapter 7: Distribution ListDraft EIS 7-1 September 2003
CHAPTER 7: DISTRIBUTION LIST
Federal Agencies
Dale Bambrick National Marine Fisheries ServiceRichard Clark US EPA, Aquatic Resources UnitDan Meyer US EPA Region 10 Air Operating Permits OAQ 107Olivia H. Romano US Army Corps of Engineers, Seattle DistrictDr. Tom Sibley National Marine Fisheries ServiceDee Morse NPS - Air Resources DivisionBob Bachman USDA FS NR U.S. Forest ServiceBill Jolly Parks and Recreation CommissionThomas McKinney, Kec-4 Bonneville Power AdministrationJohn Notar National Park System, Air Resources DivisionThomas M. Noguchi Bonneville Power AdministrationPatrick R. Rochelle Bonneville Power AdministrationHerbert V. Adams Bonneville Power Administration
Tribal Government
Bob Kelly Jr. Nooksack Tribe - Natural ResourcesDaryl Williams Tulalip TribesMerle Jefferson Lummi Nation - Natural ResourcesHonorable Herbert A. Williams Jr. Tulalip TribesHonorable Art George Nooksack TribeHonorable Darrel Hillaire Lummi Nation
Canadian Governments and Agencies
Nancy Knight Greater Vancouver Regional DistrictAli Ergudenler Greater Vancouver Regional DistrictHu Wallis BC Ministry of Water Land and Air ProtectionAdrian Duncan Environment Canada Pacific and Yukon RegionRay Robb BC Ministry of Water Land and Air ProtectionCarl Alleyne, Ph.D. Health Canada - BC/Yukon RegionDavid A. Bricklin Bricklin Newman Dold, LLPHu Wallis BC Ministry of Water Land and Air ProtectionSteve Sakiyama BC Ministry of Water Land and Air ProtectionStephany Meyn BC Ministry of Water Land and Air ProtectionPaul Jarman BC Ministry of Attorney GeneralHugh Sloan Fraser Valley Regional DistrictBob Smith Fraser Valley Regional DistrictAdam Larusic Environment CanadaColin Di Cenzo Environment Canada

BP Cherry Point Cogeneration Project Chapter 7: Distribution ListDraft EIS 7-2 September 2003
State Agencies
Doug Brown Department of Ecology NWROMichael Lufkin Counsel for the EnvironmentCurt Leigh Department of Fish and WildlifeDick Grout Department of EcologyRich Siffert Department of HealthAnn Kenny Ecology, Northwest Regional OfficeKim Wigfield Department of Ecology Industrial SectionTony Usibelli Community, Trade and Economic DevelopmentAlan Newman Department of Ecology Air Quality ProgramDoug Kilpatrick Utilities and Transportation CommissionJim Luce EFSECDavid Mudd Department of Fish and WildlifeSusan Meyer Department of Ecology, Northwest Regional OfficeBob Burmark EcologyJohn Thielemann WA Dept of HealthTodd Harrison Department of TransportationBarry Wenger WA Dept of EcologyLee Conrad WSDOT - Mt Baker Area HQHugo Flores Department of Natural ResourcesBarbara Ritchie Dept of Ecology – SEPA UnitSondra Walsh WUTC
Local Government
Gary Russell Whatcom County Fire District No. 7John Guenther Whatcom County Planning and Develop ServicesTerry Galvin City of Blaine Planning DepartmentJamie Randles Northwest Air Pollution AuthorityTom Anderson Whatcom Public Utility District No 1Neil Clement Whatcom County Department of Emergency ManagementPete Kremen Whatcom County ExecutiveJames S. Darling Port of BellinghamDavid M. Grant Whatcom County Prosecutors Office
Librarires and Educational Institutions
Barb Hynek White Rock Public LibraryIsabelle Hay Ocean Park LibraryJoel M. Pritchard Library WA State LibraryGayle Helgoe Bellingham Library Reference DeskDave Menard Whatcom County Library SystemKathy Richardson Whatcom County Library

BP Cherry Point Cogeneration Project Chapter 7: Distribution ListDraft EIS 7-3 September 2003
Businesses and Individuals
Brian Steele, P.E.G. Materials Testing and Consulting, Inc.Doug Caldwell ISCA Management Ltd.Rose LathropAndy FoleyPat FrenchCraig NoordmansMike Torpey BP West Coast Products LLCKaren McGaffey Perkins Coie LLPMark Moore BP Cherry Point RefineryKaren Payne BP Cherry Point RefineryRick Porter BP Cherry Point RefineryBill Kidd BP Cherry Point RefineryMike Abendhoff BP Cherry Point RefineryCynthia Weston BP LegalDarryl Thorson BP EnergyKevin Casey BP EnergyLiz McDougall Perkins CoieWolfgang Neuhoff TransCanadaHoward Brad TransCanadaSteeve Terri TransCanadaSteve DeMinco Bechtel

C A N A D AU N I T E D S T A T E S
97
5
5
5
97
542
539
539
548
548 544
BELL INGHAM
Lynden
Ferndale
BELL INGHAM
Lynden
Blaine
Ferndale
Grandview Road
Blai
neRo
ad
ST
RA
IT
OF
GE
OR
GI A
B E L L I N G H A MB A Y
L U M M IB A Y
B I R C HB A Y
LakeTerrell
CherryPoint
PointWhitehorn
BirchPoint
DR A
Y T ON
HA
R B OR
P O R T A G EI S L A N D
P O R T A G EI S L A N D
L U M M II S L A N DL U M M II S L A N D
NO
OK
SAC
K
RI
VER
B UR L I N
GT O
N N
OR T H
E R N R A
I L R OA
D
B UR L I N
GT O
N N
OR T H
E R N R A
I L R OA
D
PROJECT SITE
BP MARINE TERMINALALCOA INTALCO WORKS
CUSTERSUBSTATION
Source: De Lorme Washington Atlas & Gazetteer 1998
BP CHERRY POINT COGENERATION EIS
FIGURE 1-1
PROJECT VICINITY MAP
1014003T
NNApproximate Scale in Miles
0 3
Grap
hics S
erver/
Grap
hics/B
illable
/BP C
herry
Point
/EIS/F
ig 1-1 V
icinity
Map
7.29
.03
0 xxxx
0 xxxx
0 xxxx
0 xxxx
0 xxxx
transmission line
SEATTLE
BELLINGHAM
SUMAS
ANACORTES
EVERETT
AREAOFDETAIL
W A S H I N G T O N

NOT TO SCALE
Grap
hics S
erver/
Grap
hics/B
illable
/BP C
herry
Point
/EIS/F
ig 1-2
Latti
ce To
wers
7.30
.03
0 xxxx
0 xxxx
0 xxxx
0 xxxx
0 xxxx
FIGURE 1-2
TYPICAL TRANSMISSION TOWER DESIGNS
Source: Bonneville Power Administration 2003
1014003T
BP CHERRY POINT COGENERATION EIS
97
97
97

electrical power
process steam
condensate return water
industrial wastewater
potable water
sanitary waste
oily sump wastewater
industrial watersupply
natural gas
electrical power
BP CHERRY POINT REFINERYFERNDALE PIPELINE/CASCADE PIPELINE
PUD
BONNEVILLETRANSMISSION SYSTEM
PROPOSEDCOGENERATION
FACILITY
Grap
hics S
erver/
Grap
hics/B
illable
/BP C
herry
Point
/EIS/F
ig 1-3
Infras
tructu
re 8
.11.03
0 xxxx
0 xxxx
0 xxxx
0 xxxx
0 xxxx
FIGURE 1-3
COGENERATION FACILITY INFRASTRUCTUREAND REFINERY INTERCONNECTIONS
Source: BP 2002
1014003T
BP CHERRY POINT COGENERATION EIS
97
97
97

97
97
97
COGENERATIONFACILITY
BP CHERRY POINT REFINERY
EXISTINGCONTRACTORSPARKING LOT
LAYDOWNAREA 3
LAYDOWNAREA 1
LAYDOWNAREA 2
COGENERATIONFACILITY
BP CHERRY POINT REFINERY
COMPENSATORYMITIGATION
AREA 1
COMPENSATORYMITIGATION
AREA 1
COMPENSATORYMITIGATION
AREA 2
COMPENSATORYMITIGATION
AREA 2
LAYDOWNAREA 3
LAYDOWNAREA 1
LAYDOWNAREA 2
LAYDOWNAREA 4
EXISTINGCONTRACTORSPARKING LOT
LAYDOWNAREA 4
Brown Road 1st S
treet
4th
Stre
et
Avenue D
Avenue E
AccessRoad 2
Acc
ess
Road
1
Blai
ne R
oad
ELEVATED PIPE RACK
continues to Custer substation
AccessRoad 2
Acc
ess
Road
1
AccessRoad 2
Acc
ess
Road
3A
cces
sRo
ad1
CUSTER/INTALCOTRANSMISSION LINE NO. 2
CUSTER/INTALCOTRANSMISSION LINE NO. 1
Grandview Road
Kick
ervi
lle R
oad
BU
RL
ING
TO
N N
OR
TH
ER
N I
NT
AL
CO
/
CH
ER
RY
PO
INT
BR
AN
CH
LIN
E
Terrell Creek
Terrell Creek
NN
1014003T
PROJECT ELEMENTS
BP CHERRY POINT COGENERATION EIS
FIGURE 2-1
Source: BP 2002
0 xxxx
0 xxxx
0 xxxx
0 xxxx
0 xxxx
Grap
hics S
erver/
Grap
hics/B
illable
/BP C
herry
Point
/EIS/F
ig 2-1 P
roject
Site
8.11.
03
cogeneration project boundary
BP Cherry Point Refinery boundary
cogeneration facility
refinery interface
transmission system
Custer/Intalco transmission line No. 2
other project components
Approximate Scale in Feet
0 1000'

97
97
97
Lonseth Road
Kick
ervi
lle R
oad
Pow
der P
lant
Roa
d
Jack
son
Road
Blai
ne R
oad
Hewleg Road
Koeh
n Ro
ad
Aldergrove RoadNor
thsta
r Roa
d
Valle
y Vi
ew R
oad
Elk
Road
Fox Road
Brown Road
Grandview Road
Vista Drive
Bay Road
Henry Road
B I R C H B A Y
Point Whitehorn
Cherry Point
Lake Terrell
Terrell Creek
Fingalson Creek
B I R C H B A YS T A T E P A R K
L A K E T E R R E L LS T A T E W I L D L I F E A R E A
B I R C H B A YS T A T E P A R K
B E A C H W O O D P A R K
B E A C H W O O D R E S O R T
B E A C H W O O D R E S O R T
L A K E T E R R E L LS T A T E W I L D L I F E A R E A
BU
RL
ING
TO
N N
OR
TH
ER
N I
NT
AL
CO
/
CH
ER
RY
PO
INT
BR
AN
CH
LIN
EB
UR
LIN
GT
ON
NO
RT
HE
RN
IN
TA
LC
O/
CH
ER
RY
PO
INT
BR
AN
CH
LIN
E
BP MARINE TERMINAL
5
ST
RA
I T O
F G
EO
RG
I A
PUGET SOUND ENERGYPOWER PLANT
CUSTERSUBSTATION
PRAXAIR INDUSTRIAL
WHITEHORN FIRE HALL
PROJECT SITE
CHEMCO
BP CHERRY POINTREFINERY
CUSTER/INTALCOTRANSMISSION LINE NO. 2
CUSTER/INTALCOTRANSMISSION LINE NO. 1
NN
1014003T
BP CHERRY POINT COGENERATION EIS
0 xxxx
0 xxxx
0 xxxx
0 xxxx
0 xxxx
Grap
hics S
erver/
Grap
hics/B
illable
/BP C
herry
Point
/EIS/F
ig 2-2
Site a
nd Su
rroun
d 8.1
1.03
Approximate Scale in Feet
0 3000'
Source: ARCO 1996, BP 2002
PROJECT SITE AND SURROUNDING AREA
FIGURE 2-2

.
Map Projection: UTM, NAD27, Zone 10, Meters
Scale 1'' = 2 Miles
Source: Whatcom County GIS, WSDOT,WSDOE, Golder Associates Inc.
0 2
Date: Jun 06, 2002
CHERRY POINT COGENERATION PROJECTEXISTING UTILITY INFRASTRUCTURE
Figure: App'd: Drawn: ATB 2.1-2
ProposedProject Site
Infrastructure
FERNDALE
CASCADE
GAS / OIL PIPELINES
BPA
Whatcom County PUD Point WhitehornWater Transmission Pipeline
Birch Bay Water Pipeline
WATER LINES
Birch Bay Sewer Pipeline
BP Treated Wastewater DischargePipeline
TRANSMISSION LINES
BP Cherry Point Refinery
BP CHERRY POINT COGENERATION PROJECT
B I R C HB A Y
PointWhitehorn
CherryPoint
Terrell Lake
DR A
Y T ON
HA
R B OR
PROJECT SITE
ALCOA INTALCO WORKS
CUSTERSUBSTATION
BP MARINE TERMINAL
BIRCH BAY WASTEWATERTREATMENT PLANT
NO
OKSA
CK
RIV
ER
Kick
ervi
lle R
oad
Jack
son
Road
Aldergrove Road
Brown Road
Grandview Road
Kick
ervi
lle R
oad
Jack
son
Road
Aldergrove Road
Brown Road
Grandview Road
5
5
BP CHERRY POINT REFINERY
CUSTER/INTALCOTRANSMISSION LINE NO. 2
CUSTER/INTALCOTRANSMISSION LINE NO. 1
ST
R
AI T
OF G
E OR G
I A
NNApproximate Scale in Miles
0 1
Grap
hics S
erver/
Grap
hics/B
illable
/BP C
herry
Point
/EIS/F
ig 2-2
Exist
ing Ut
ility
8.14.0
3
0 xxxx
0 xxxx
0 xxxx
0 xxxx
0 xxxx
FIGURE 2-3
EXISTING UTILITY INFRASTRUCTURE
Source: BP 2002
1014003T
BP CHERRY POINT COGENERATION EIS
97
97
97
Ferndale natural gas pipeline
Cascade natural gas pipeline
BPA transmission line
Birch Bay sewer pipeline
Birch Bay water pipeline
Whatcom County PUD Point Whitehornwater transmission pipeline
BP treated wastewater discharge pipeline

97
97
97
BP CHERRY POINT REFINERY
Brown Road
Aldergrove Road
Blai
ne R
oad
CUSTER/INTALCOTRANSMISSION LINE NO. 2
CUSTER/INTALCOTRANSMISSION LINE NO. 1
Grandview Road
Kick
ervi
lle R
oad
BU
RL
ING
TO
N N
OR
TH
ER
N I
NT
AL
CO
/
CH
ER
RY
PO
INT
BR
AN
CH
LIN
E
Terrell Creek
SITE 1
ALTERNATESITE 4
SITE 5
SITE 2
SITE 3PREFERRED SITE
SITE 1
ALTERNATIVESITE 4
General area for other alternatesites evaluated (primarily
forested/herbaceous wetlands)
General area for other alternate sitesevaluated (~90% forested wetlands
based on reconaissance)
SITE 5
SITE 2
SITE 3PREFERRED SITE
NN
1014003T
ALTERNATIVE COGENERATION SITE LOCATIONS
BP CHERRY POINT COGENERATION EIS
FIGURE 2-4
Source: BP 2002
0 xxxx
0 xxxx
0 xxxx
0 xxxx
0 xxxx
Grap
hics S
erver/
Grap
hics/B
illable
/BP C
herry
Point
/EIS/F
ig 2-4
Altern
atives
8.1.0
3
cogeneration project boundary
BP Cherry Point Refinery boundary
Approximate Scale in Feet
0 1400'

Blai
ne R
oad
Grandview Road
Terrell Creek
CMA 1CMA 2 CMA 1CMA 2
NN
1014003T
PROJECT SITE TOPOGRAPHYNORTH OF GRANDVIEW ROAD
BP CHERRY POINT COGENERATION EIS
FIGURE 3.1-1
Source: BP 2002
0 xxxx
0 xxxx
0 xxxx
0 xxxx
0 xxxx
Grap
hics S
erver/
Grap
hics/B
illable
/BP C
herry
Point
/EIS/F
ig 3.1-1
site T
opo
8.1.03
map area (caption font: Futura book, 7pt.)
Approximate Scale in Feet
0 400'project site boundary

COGENERATIONFACILITY
LAYDOWNAREA 3
LAYDOWNAREA 1
LAYDOWNAREA 2
COGENERATIONFACILITY
LAYDOWNAREA 3
LAYDOWNAREA 1
LAYDOWNAREA 2
LAYDOWNAREA 4
Brown Road
Grandview Road
Blai
ne R
oad
Brown Road
Grandview Road
Blai
ne R
oad
NN
1014003T
PROJECT SITE TOPOGRAPHYSOUTH OF GRANDVIEW ROAD
BP CHERRY POINT COGENERATION EIS
FIGURE 3.1-2
Source: BP 2002
0 xxxx
0 xxxx
0 xxxx
0 xxxx
0 xxxx
Grap
hics S
erver/
Grap
hics/B
illable
/BP C
herry
Point
/EIS/F
ig 3.1-2
S sit
e Top
o 8.1
.03
map area (caption font: Futura book, 7pt.)
Approximate Scale in Feet
0 400'project site boundary
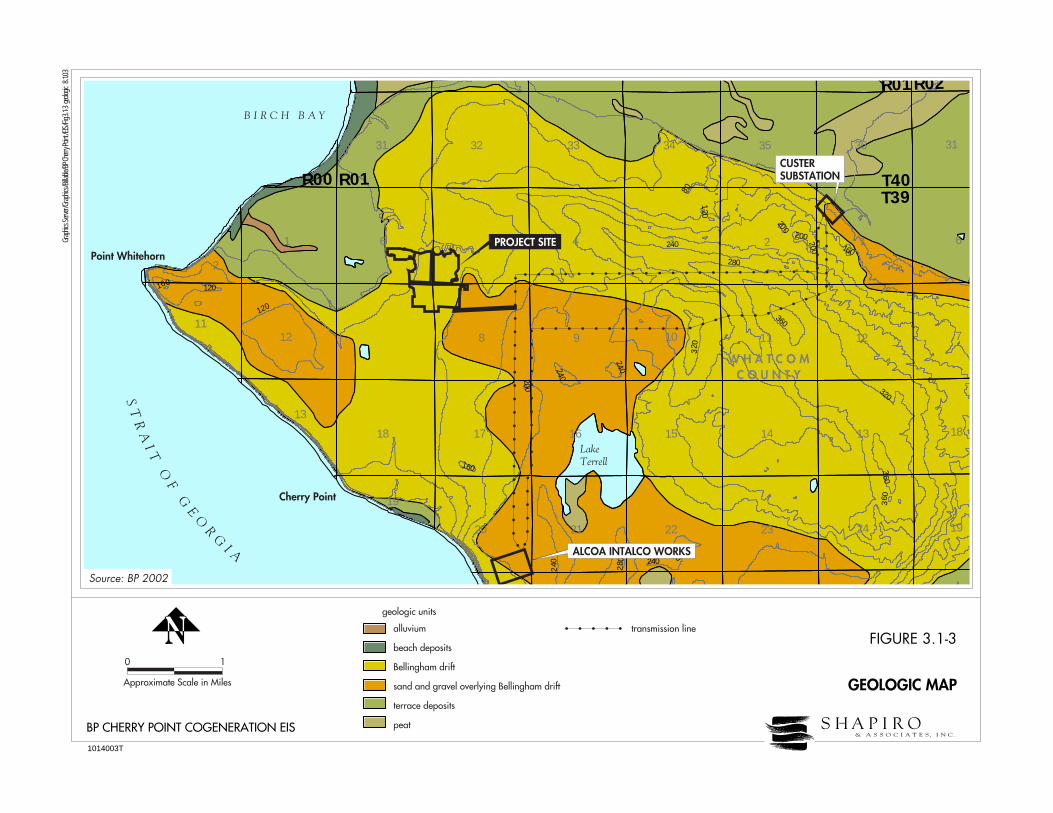
40
280
120
36 0
240
320
80
280
200
240
200
80
160
200
280
200
32 0
160
120
200
160
360
120
240
240
160
360
240
28 0
240
6 12
98
4 3 6
7
1
18
33
15
10
13
32 34
17
27
22
35
12
36
21
11
16 14
28
24
26
23
12
25
18
31
30
19
31
20
2
11
13
29
19
36
R02
T40R01R00T39
R01
PROJECT SITE
W H A T C O MC O U N T Y
LakeTerrell
B I R C H B A Y
Point Whitehorn
Cherry Point
ALCOA INTALCO WORKS
CUSTERSUBSTATION
ST
RA
I T O
F G
EO
R
GI A
NNApproximate Scale in Miles
0 1
Grap
hics S
erver/
Grap
hics/B
illable
/BP C
herry
Point
/EIS/F
ig 3.1-3
geolo
gic 8
.1.03
0 xxxx
0 xxxx
0 xxxx
0 xxxx
0 xxxx
FIGURE 3.1-3
GEOLOGIC MAP
Source: BP 2002
1014003T
BP CHERRY POINT COGENERATION EIS
97
97
97
geologic units
alluvium
beach deposits
Bellingham drift
sand and gravel overlying Bellingham drift
terrace deposits
peat
transmission line

PROJECT SITE
Source: BP 2002
BP CHERRY POINT COGENERATION EIS
FIGURE 3.1-4
SOIL TYPES
1014003T
NNNOT TO SCALE
Grap
hics S
erver/
Grap
hics/B
illable
/BP C
herry
Point
/EIS/F
ig 3.1-4
soil s
urvey
8.1.0
3
0 xxxx
0 xxxx
0 xxxx
0 xxxx
0 xxxx
12809394
171184
Birch Bay KickervilleLabountyLabounty, drainedurban landWhitehorn

PU
GE
T S
OU
ND
S T R A I T O F G E O R G I A
?
?
?
SEATTLE FAULT
SOUTHERN WHIDBEYISLAND FAULT ZONE
PROJECT SITE
DEVIL'S MOUNTAINFAULT ZONE
100-MILEPROJECT SITE RADIUS
VEDDER MOUNTAIN FAULT
SUMAS FAULT
SEATTLE
VANCOUVER
BELL INGHAM
Victoria
Newhalem
Port Angeles
P A C I F I C
O C E A N
B R I T I S H C O L U M B I AW A S H I N G T O N
VANCOUVERISLAND
48°00'
49°00'
50°00'
48°00'
49°00'
50°00'
126°00' 125°00' 124°00' 123°00' 122°00' 121°00' 120°00' 119°00'
NN
1014003T
SEISMOTECTONIC MAP OF NORTHWESTWASHINGTON AND SOUTHWEST BRITISH COLUMBIA
BP CHERRY POINT COGENERATION EIS
FIGURE 3.1-5
Source: BP 2002
0 xxxx
0 xxxx
0 xxxx
0 xxxx
0 xxxx
Grap
hics S
erver/
Grap
hics/B
illable
/BP C
herry
Point
/EIS/F
ig 3.1-5
seism
otecto
nic 8
.1.03
Approximate Scale in Miles
0 30
earthquake magnitude
3.0-3.4
3.5-3.9
4.0-4.4
4.5-4.9
5.0-5.5
5.5-6.0
extent of fault not known?

97
5
5
5
97
542
539
548
548
BELL INGHAM
Lynden
Ferndale
BELL INGHAM
Lynden
Blaine
Ferndale
Grandview Road
Blai
neRo
ad
ST
RA
IT
OF
GE
OR
GI A
B E L L I N G H A MB A Y
L U M M IB A Y
B I R C HB A Y
LakeTerrell
CherryPoint
PointWhitehorn
BirchPoint
DR A
Y T ON
HA
R B OR
P O R T A G EI S L A N D
P O R T A G EI S L A N D
L U M M II S L A N DL U M M II S L A N D
NO
OK
SAC
K
RIV
ER
PROJECT SITE
ALCOA INTALCO WORKS
CUSTERSUBSTATION
NN
1014003T
BP CHERRY POINT COGENERATION EIS
0 xxxx
0 xxxx
0 xxxx
0 xxxx
0 xxxx
Grap
hics S
erver/
Grap
hics/B
illable
/BP C
herry
Point
/EIS/F
ig 3.1-6
Surfa
ce Mi
nes 8.
11.03
Approximate Scale in Miles
0 3
Source: Washington Department of Natural Resources 2003
PERMITTED, ACTIVE SURFACE MINESIN WHATCOM COUNTY
FIGURE 3.1-6
mine
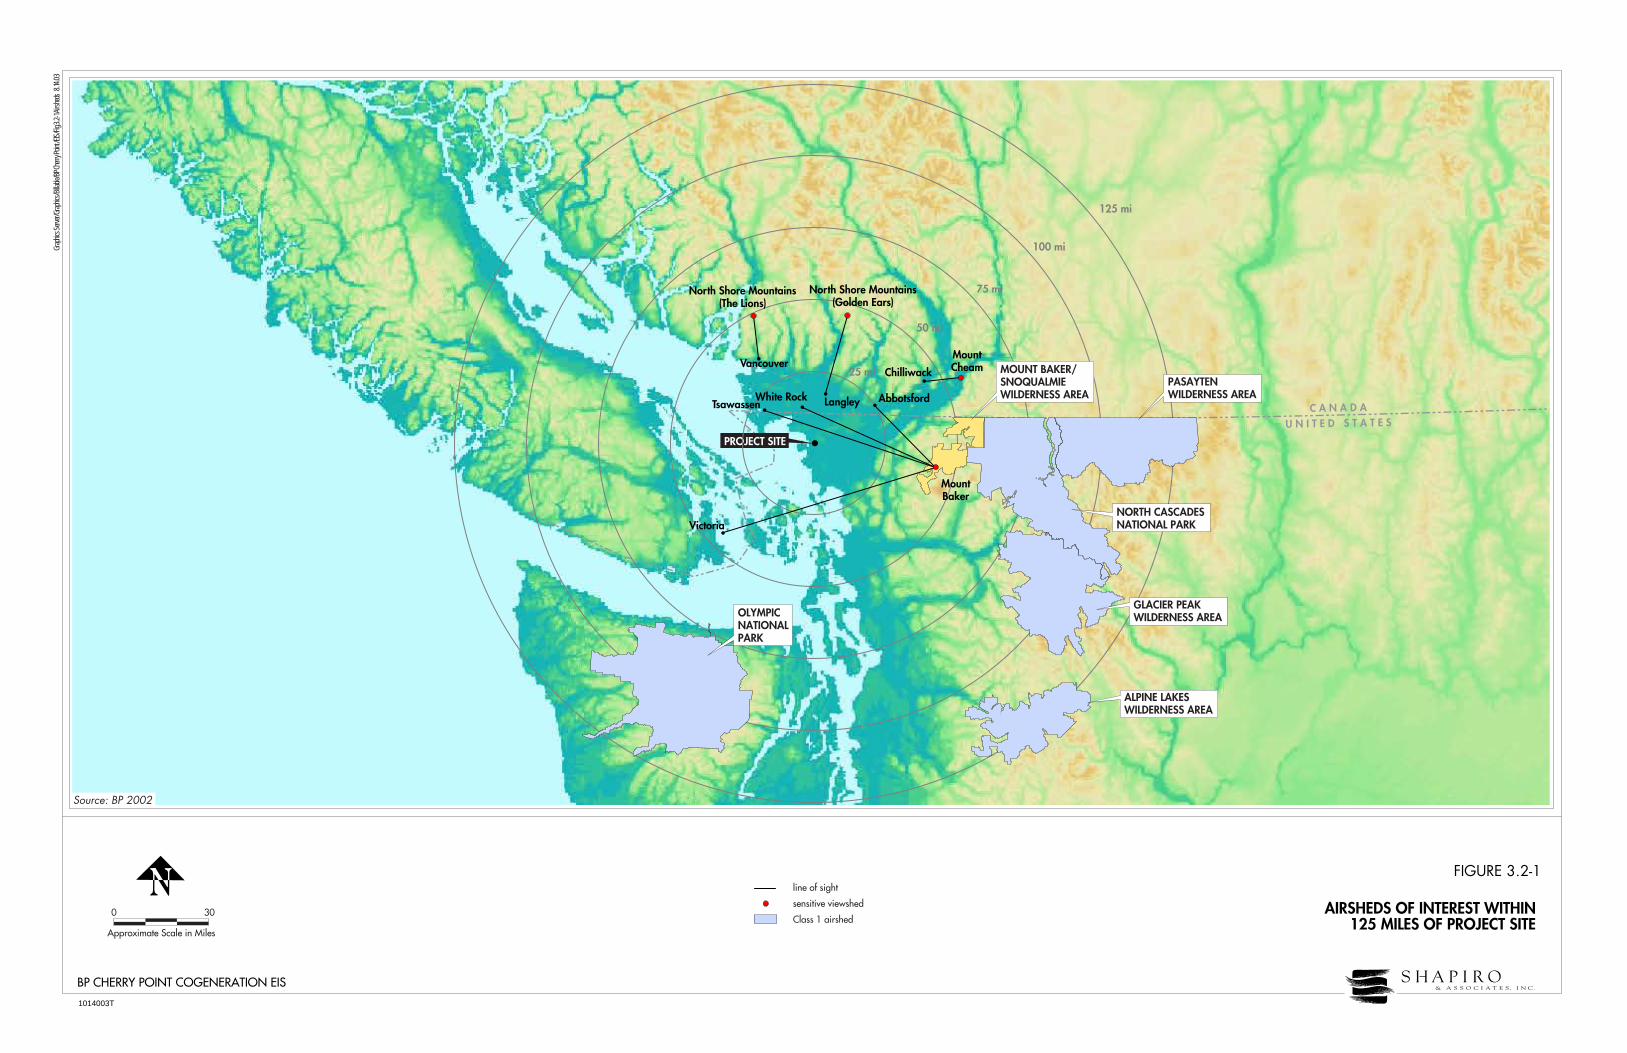
KitsapCountyGrays Harbor
County
SnohomishCounty
DouglasCounty
JeffersonCounty
SkagitCounty
ClallamCounty
ChelanCounty
OkanoganCounty
KingCounty
FerryCounty
LincolnCounty
StevensCounty
Whatcom County
BRITISH COLUMBIA
WASHINGTON
ThurstonCounty
MasonCounty
PierceCounty
KittitasCounty
GrantCounty Adams
County
120
109
159
80.5
75
68.4
99.3
50
KilometersMiles
Distance to BoundaryClass 1 Airsheds
North Cascades NP
Glacier Peak
Alpine Lakes
Pasayten Wilderness Area
Olympic National Park 64.3 102.9
C A N A D AU N I T E D S T A T E S
PROJECT SITE
25 mi
50 mi
75 mi
100 mi
125 mi
OLYMPICNATIONALPARK
MOUNT BAKER/SNOQUALMIEWILDERNESS AREA
NORTH CASCADESNATIONAL PARK
PASAYTENWILDERNESS AREA
GLACIER PEAKWILDERNESS AREA
ALPINE LAKESWILDERNESS AREA
Tsawassen
Victoria
White Rock
Vancouver
North Shore Mountains(The Lions)
North Shore Mountains(Golden Ears)
MountCheam
MountBaker
Langley Abbotsford
Chilliwack
NN
1014003T
AIRSHEDS OF INTEREST WITHIN125 MILES OF PROJECT SITE
BP CHERRY POINT COGENERATION EIS
FIGURE 3.2-1
Source: BP 2002
0 xxxx
0 xxxx
0 xxxx
0 xxxx
0 xxxx
Grap
hics S
erver/
Grap
hics/B
illable
/BP C
herry
Point
/EIS/F
ig 3.2-
1 Airs
heds
8.14.0
3
Approximate Scale in Miles
line of sight
sensitive viewshed
Class 1 airshed0 30


COGENERATIONFACILITY
LAYDOWNAREA 3
LAYDOWNAREA 1
LAYDOWNAREA 2
COGENERATIONFACILITY
LAYDOWNAREA 3
LAYDOWNAREA 1
LAYDOWNAREA 2
LAYDOWNAREA 4
Brown Road
Grandview Road
Blai
ne R
oad
Brown Road
Grandview Road
Blai
ne R
oad
NN
1014003T
PROJECT SITE DRAINAGE
BP CHERRY POINT COGENERATION EIS
FIGURE 3.3-2
Source: BP 2002
0 xxxx
0 xxxx
0 xxxx
0 xxxx
0 xxxx
Grap
hics S
erver/
Grap
hics/B
illable
/BP C
herry
Point
/EIS/F
ig 3.3-
2 site
drain
age
8.1.03
map area (caption font: Futura book, 7pt.)
Approximate Scale in Feet
0 400'project site boundary
local drainage

(~1.25 cfs*)(~1.25 cfs*)(~1.25 cfs*)(~1 cfs*)(~1 cfs*)(~1 cfs*)
(1.5 cfs*)(1.5 cfs*)(1.5 cfs*)
(0.25 cfs*)(0.25 cfs*)(0.25 cfs*)
Connects to the stormwater collection system in the BP Cherry Point Refinery
(9.5 cfs*)(9.5 cfs*)(9.5 cfs*)
Terrell CreekTerrell CreekTerrell Creek
NN
1014003T
BP CHERRY POINT COGENERATION EIS
0 xxxx
0 xxxx
0 xxxx
0 xxxx
0 xxxx
Grap
hics S
erver/
Grap
hics/B
illable
/BP C
herry
Point
/EIS/F
ig 3.3-
3 esxi
sting
hydro
paths
8.1.0
3
Approximate Scale in Feet
0 500'
Source: URS 2003
ESTIMATED EXISTING SURFACE ANDSUBSURFACE FLOW NEAR CMA 2
FIGURE 3.3-3CMA 2 site boundary
direction of shallow groundwater flow
direction of semi-concentrated flow that becomes pooled
direction of shallow, semi-concentrated flow
direction of concentrated flow
direction of sheet flow
culvert
bridge
Estimated peak flow during a 6-month, 24-hour storm event. These estimates are based on runoff calculations using the SCS method and observations made during various site visits.

B I R C HB A Y
D R A Y T O NH A R B O R
PointWhitehorn
CherryPoint
Lake Terrell
Kick
ervi
lle R
oad
Jack
son
Road
Aldergrove Road
Brown Road
Grandview RoadST
RA
I T O
F G
EO
RG
I A
PROJECT SITE
NNApproximate Scale in Miles
0 5
Grap
hics S
erver/
Grap
hics/B
illable
/BP C
herry
Point
/EIS/F
ig 3.3-
4 Floo
d Haza
rds 8
.1.03
0 xxxx
0 xxxx
0 xxxx
0 xxxx
0 xxxx
FIGURE 3.3-4
FLOODPLAINS
Source: BP 2002
1014003T
BP CHERRY POINT COGENERATION EIS
97
97
97
100-year floodplain
Zone C: areas outside 500-year floodplain

CMA 1
PROPOSED COGENERATIONPROJECT SITE
1014003T
CROSS SECTION A-A'
BP CHERRY POINT COGENERATION EIS
FIGURE 3.3-5
Source: BP 2002
Grap
hics S
erver/
Grap
hics/B
illable
/BP C
herry
Point
/EIS/F
ig 3.3-
5 8.
1.03
Approximate Horizontal Scale in Feet
0 2000'
Approximate Vertical Scale in Feet
0 200'
contact line
sand and gravel overlying Bellingham drift
Bellingham drift
Deming sand
Kulshan drift
undifferentiated sedimentary deposits
undifferentiated sedimentary rock (bedrock)
Qbg
Qb
Qd
Qk
Qu
TMu
STRATIGRAPHY
QUATERNARY
TERTIARY/MESOZOIC

BLAINEROAD
LAYDOWNAREAS
PROPOSED COGENERATIONPROJECT SITE
1014003T
CROSS SECTION B-B'
BP CHERRY POINT COGENERATION EIS
FIGURE 3.3-6
Source: BP 2002
Grap
hics S
erver/
Grap
hics/B
illable
/BP C
herry
Point
/EIS/F
ig 3.3-
6 8.
1.03
Approximate Horizontal Scale in Feet
0 2000'
Approximate Vertical Scale in Feet
0 200'
contact line
groundwater
sand and gravel overlying Bellingham drift
Bellingham drift
Deming sand
Kulshan drift
undifferentiated sedimentary deposits
undifferentiated sedimentary rock (bedrock)
Qbg
Qb
Qd
Qk
Qu
TMu
STRATIGRAPHYQUATERNARY
TERTIARY/MESOZOIC

CALIFORNIA CREEK BASIN
T39NR1E
T40NR1E
California Creek
CHERRY POINT BASIN
T39NR1E
T40NR1E
T39NR2E
T40NR2E
T39NR1W
T40NR1W
T39NR1E
T38N R1E
T39NR1E
T38N R2E
NO
OK
SAC
K R
IVER
Bert
rand
Cre
ek
Dakota Creek
39/01-05E
40/1-22F
40/01-28C
ACN-266
40/1E-34R
40/01-31Hb
40/01-31Ha
39/01-4F
39/01-4A
ACB 982
40/01-31Hb
ACF 699
ACK 609
39/01E/02-R 39W/01E/01
39/1E/11Ab
39/1E/11Aa
ABW 517
ABD 477
39/01-11K
39/01-11F
39/01/11QACK 620
39/1E/11N 39/1E/11N?
39/1E/11L39/1E/11M
ABD 48539/1E/1OK
ACP 140
39/01/10R
39/1E/10P
AC13 969
ABP 576
39/01/10Fa
Transmountain (#?)
40/01-34C
40/1E-28A
40/1E-21P
40/1/28R
40/01-34D
40/1E/34Nb
40/1E/34Na
40/1E-33G
ACF 69439/01/9Da
39/01-03M
ACK 610
ABW 535
NO #
39/1E/11-G
ACK 632
ACP 111ACP 112
39/01/09JWELL #1
39/01/09Jb39/01/09Ja
ABW 114
39/01/09La39/01/09Lb
39/01/09M
39/01/9Db39/01/9C
39/01/10Fb
39/1E/10
39/1W-13R
B2
B1
MW12
MW13 MW7
MW15
80
90100
120
120
110
10080
90
PROJECT SITE
B6
B5 B4
MW1
B7 B3
TERRELL CREEK BASIN
NN
1014003T
GENERALIZED WATER TABLE SURFACE ELEVATIONAND GROUNDWATER FLOW
BP CHERRY POINT COGENERATION EIS
FIGURE 3.3-7
Source: BP 2002
0 xxxx
0 xxxx
0 xxxx
0 xxxx
0 xxxx
Grap
hics S
erver/
Grap
hics/B
illable
/BP C
herry
Point
/EIS/F
ig 3.3-
7 surf
ace w
ater 8
.1.03
Approximate Scale in Miles
0 .5
BP soil boring
BP monitoring well depth = < 100 feet (approximate location)
well depth = 0-250 feet
well depth = 251-500 feet
well depth = 501-750 feet
well depth = > 750 feet
water wells
B I R C H
B A Y
T39NR1E
T40NR1E
T39NR1W
T40NR1W
90
range/township boundary and designation
groundwater flow direction
water table elevation contour(feet above mean sea level)
surface water drainage basin boundary
CALIFORNIA CREEK BASIN

1014003T
DESIGN BASIS FOR OPERATIONALSTORMWATER CONTROL SYSTEM
BP CHERRY POINT COGENERATION EIS
FIGURE 3.3-8
Source: BP 2002
Grap
hics S
erver/
Grap
hics/B
illable
/BP C
herry
Point
/EIS/F
ig 3.3-
x Stor
m con
st 8
.1.03
NNApproximate Scale in Feet
0 400'
existing ditch
new ditch
diverted runoff
collected runoff
flow measurement pointA
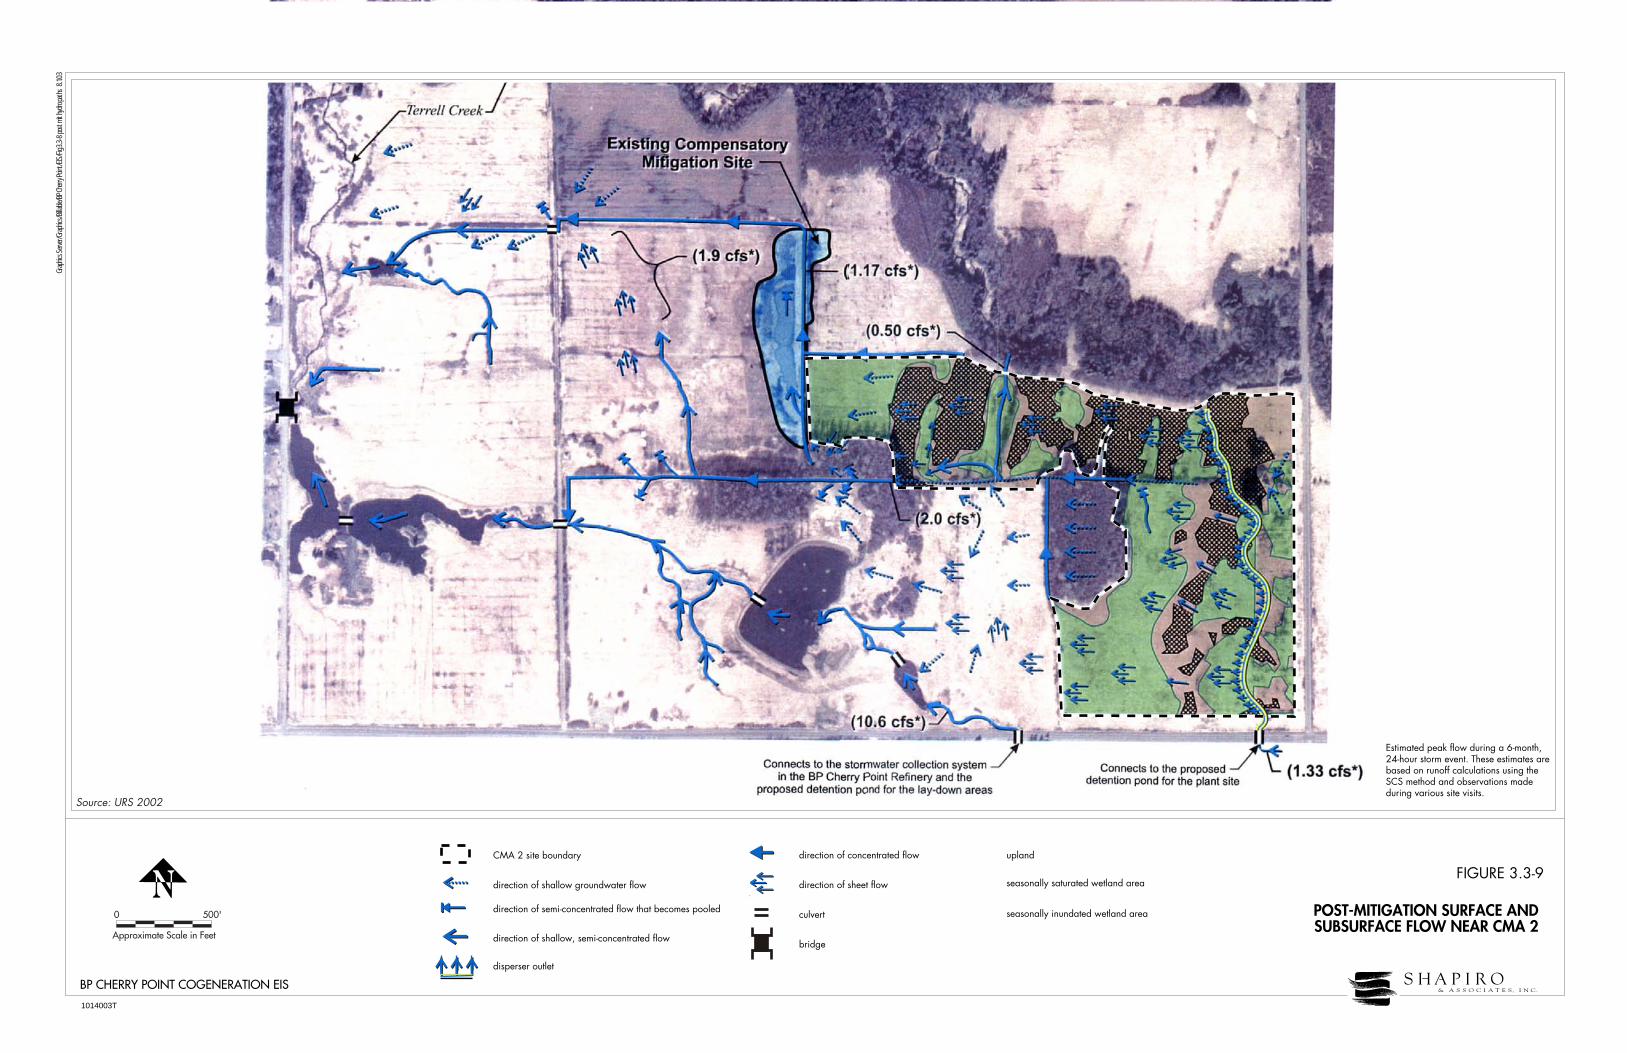
NN
1014003T
BP CHERRY POINT COGENERATION EIS
0 xxxx
0 xxxx
0 xxxx
0 xxxx
0 xxxx
Grap
hics S
erver/
Grap
hics/B
illable
/BP C
herry
Point
/EIS/F
ig 3.3-
8 pos
t mit h
ydro
paths
8.1.0
3
Approximate Scale in Feet
0 500'
Source: URS 2002
POST-MITIGATION SURFACE ANDSUBSURFACE FLOW NEAR CMA 2
FIGURE 3.3-9CMA 2 site boundary
direction of shallow groundwater flow
direction of semi-concentrated flow that becomes pooled
direction of shallow, semi-concentrated flow
disperser outlet
direction of concentrated flow upland
seasonally saturated wetland area
seasonally inundated wetland area
direction of sheet flow
culvert
bridge
Estimated peak flow during a 6-month, 24-hour storm event. These estimates are based on runoff calculations using the SCS method and observations made during various site visits.

1
3
EXISTINGCONTRACTORSPARKING LOT
NN
1014003T
DELINEATED AND AFFECTED WETLANDS
BP CHERRY POINT COGENERATION EIS
FIGURE 3.5-1
Source: BP 2002
0 xxxx
0 xxxx
0 xxxx
0 xxxx
0 xxxx
Grap
hics S
erver/
Grap
hics/B
illable
/BP C
herry
Point
/EIS/F
ig 3.5-
1 delin
eated
wetla
nds
7.31.0
3
Approximate Scale in Feet
0 350'
delineated wetland area
permanently affected wetland area
restored wetland area

MF/DF
MF
DF
W
W
W
W
G
W
W
DF
DF
DFCF
LAYDOWNAREA 4
COGENERATION FACILITY FOOTPRINT
MF
W
DF
DF
MF
MF
S
S
MF
MF
W/G
W/G
W/G
W/G
DF/S
W/G
Grandview Road
Brown Road
Aldergrove Road
PRAXAIR INDUSTRIAL COMPLEX
W
Source: BP 2002
BP CHERRY POINT COGENERATION EIS
FIGURE 3.5-2
SITE VEGETATION
1014003T
NNApproximate Scale in Feet
0 400'
Grap
hics S
erver/
Grap
hics/B
illable
/BP C
herry
Point
/EIS/F
ig 3.5-
2 8.
1.03
mixed coniferous/deciduous forest
coniferous forest
deciduous forest
shrubland
grassland
wetland
MF
CF
DF
S
G
W

97
97
97
COGENERATIONFACILITY
BP CHERRY POINT REFINERY
EXISTINGCONTRACTORSPARKING LOT
LAYDOWNAREA 3
LAYDOWNAREA 1
LAYDOWNAREA 2
LAYDOWNAREA 4
EXISTINGCONTRACTORSPARKING LOT
LAYDOWNAREA 4
Brown Road
Acc
ess
Road
3
Blai
ne R
oad
BPA TRANSMISSION LINE
BPA TRANSMISSION LINEELEVATED PIPE RACK
CMA 1CMA 2 CMA 1CMA 2
AccessRoad 2
Acc
ess
Road
1AccessRoad 2
Acc
ess
Road
1AccessRoad 2
Acc
ess
Road
1
Grandview Road
Kick
ervi
lle R
oad
BU
RL
ING
TO
N N
OR
TH
ER
N I
NT
AL
CO
/
CH
ER
RY
PO
INT
BR
AN
CH
LIN
E
BU
RL
ING
TO
N N
OR
TH
ER
N I
NT
AL
CO
/
CH
ER
RY
PO
INT
BR
AN
CH
LIN
E
Terrell Creek
Terrell Creek
NN
1014003T
BP CHERRY POINT COGENERATION EIS
Source: Duke/Fluor Daniel 2001
0 xxxx
0 xxxx
0 xxxx
0 xxxx
0 xxxx
Grap
hics S
erver/
Grap
hics/B
illable
/BP C
herry
Point
/EIS/F
ig 3.5-
3 Prop
osed
Wetl
and
8.11.0
3
Approximate Scale in Feet
0 1000' PROPOSED WETLANDMITIGATION AREAS
FIGURE 3.5-3cogeneration project boundary
BP Cherry Point Refinery boundary
compensatory mitigation area (CMA)
restoration area

Brown Road
Brown Road
Blaine Road
Alde
rgro
ve R
oad
Jackson Road
Grandview Road
Blaine Road
Alde
rgro
ve R
oad
Jackson Road
Point WhitehornPoint Whitehorn
Grandview Road
S T R A I T O F
G E O R G I AS T R A I T O F
G E O R G I A B I R C HB A Y
PROPOSEDCONSTRUCTIONLAYDOWNAREAS
WASTEWATERTREATMENT
BP PRODUCTPIPELINE
PROPOSED COGENERATION SITE
NEW ACCESS ROADS
Terrell CreekTerrell Creek
B I R C HB A Y
NNNOT TO SCALE
Grap
hics S
erver/
Grap
hics/B
illable
/Proje
ct/EIS
/Fig 3
.7-1 c
ogen
site p
hoto
8.11
.03
0 xxxx
0 xxxx
0 xxxx
0 xxxx
0 xxxx
FIGURE 3.7-1
COGENERATION SITE ANDSURROUNDING AREA
Source: BP 2002
1014003T
BP CHERRY POINT COGENERATION EIS
97
97
97

97
97
97
Lonseth Road
Kick
ervi
lle R
oad
Pow
der P
lant
Roa
d
Jack
son
Road
Blai
ne R
oad
Hewleg Road
Koeh
n Ro
ad
Aldergrove RoadNor
thsta
r Roa
d
Valle
y Vi
ew R
oad
Elk
Road
Fox Road
Brown Road
Grandview Road
Bay Road
Henry Road
B I R C H B A Y
Point Whitehorn
Cherry Point
Lake Terrell
Terrell Creek
Fingalson Creek
B I R C H B A YS T A T E P A R K
L A K E T E R R E L LS T A T E W I L D L I F E A R E A
B I R C H B A YS T A T E P A R K
L A K E T E R R E L LS T A T E W I L D L I F E A R E A
BU
RL
ING
TO
N N
OR
TH
ER
N I
NT
AL
CO
/
CH
ER
RY
PO
INT
BR
AN
CH
LIN
EB
UR
LIN
GT
ON
NO
RT
HE
RN
IN
TA
LC
O/
CH
ER
RY
PO
INT
BR
AN
CH
LIN
E
BP MARINE TERMINAL
5
ST
RA
I T O
F G
EO
RG
I A
Vista Drive
B E A C H W O O D P A R K
B E A C H W O O D R E S O R T
B E A C H W O O D R E S O R T
PUGET SOUND ENERGYPOWER PLANT
CUSTERSUBSTATION
PRAXAIR INDUSTRIAL
WHITEHORN FIRE HALL
PROJECT SITE
CHEMCO
BP CHERRY POINTREFINERY
CUSTER/INTALCOTRANSMISSION LINE NO. 2
CUSTER/INTALCOTRANSMISSION LINE NO. 1
1
23
4
5
6
7 13
12
10 11
14
8
915
NN
1014003T
BP CHERRY POINT COGENERATION EIS
0 xxxx
0 xxxx
0 xxxx
0 xxxx
0 xxxx
Grap
hics S
erver/
Grap
hics/B
illable
/BP C
herry
Point
/EIS/F
ig 3.9-
1 nois
e 8.1
1.03
Approximate Scale in Feet
0 3000'
Source: ARCO 1996, BP 2002
NOISE MONITORING LOCATIONS
FIGURE 3.9-1
noise monitoring location1

.
UR4
UR4
LII LII
HII
UR4
AG
GC
GC
GCRC
RC
RC
AG
AG
GI
RR2
STC
R10A
AG
ROS
UR3
UR3UR3
UR3
ROS
AG
RR1
RR1
RR3 RR3
NCNC
NCUR4
UR4
LII LII
HII
UR4
AG
GC
GC
GCRC
RC
RC
URM6
URM6
AG
AG
GI
RR2
STC
R10A
R5A
R5A
R5A
R5A
R5A
AGROS
UR3
UR3UR3
UR3
ROS
AG
RR1
RR1
RR3 RR3
NC NC
NC
URM6
URM6
B I R C HB A Y
PointWhitehorn
CherryPoint Ferndale
Lake TerrellLake Terrell
D R A Y T O NH A R B O R
PROJECT SITE
NO
OKSA
CK
RIV
ER
NO
OKSA
CK
RIV
ER
Kick
ervi
lle R
oad
Jack
son
Road
Aldergrove Road
Brown Road
Grandview Road
Kick
ervi
lle R
oad
Jack
son
Road
Aldergrove Road
Brown Road
Grandview Road
5
BP CHERRY POINT REFINERY
ST
RA
IT
OF
GE
OR
G
I A
ALCOA INTALCO WORKS
CUSTERSUBSTATION
NNApproximate Scale in Miles
0 2
Grap
hics S
erver/
Grap
hics/B
illable
/BP C
herry
Point
/EIS/F
ig 3.10
-1 Zon
ing 8
.1.03
0 xxxx
0 xxxx
0 xxxx
0 xxxx
0 xxxx
FIGURE 3.10-1
ZONING
Source: BP 2002
1014003T
BP CHERRY POINT COGENERATION EIS
97
97
97
agriculturegeneral commercialgateway industrialheavy impact industriallight impact industrialneighborhood commercialrural 1 - 10 units/10 acre
AGGCGIHIILII
NCR10A
rural 1 unit/5 acresresort commercialrecreation open spacerural residential 1 unit/acrerural residential 2 units/acrerural residential 3 units/acresmall town commercialurban residential 3 units/acreurban residential 4 units/acreurban residential medium density 6 units/acre
R5ARC
ROSRR1RR2RR3STCUR3UR4
URM6
Cherry Point MajorIndustrial UGA
Birch Bay UGA

97
97
97
Lonseth Road
Kick
ervi
lle R
oad
Pow
der P
lant
Roa
d
Jack
son
Road
Blai
ne R
oad
Hewleg Road
Koeh
n Ro
ad
Aldergrove RoadNor
thsta
r Roa
d
Valle
y Vi
ew R
oad
Elk
Road
Fox Road
Brown Road
Grandview Road
Bay Road
Henry Road
B I R C H B A Y
Point Whitehorn
Cherry Point
Lake Terrell
Terrell Creek
Fingalson Creek
B I R C H B A YS T A T E P A R K
L A K E T E R R E L LS T A T E W I L D L I F E A R E A
B I R C H B A YS T A T E P A R K
L A K E T E R R E L LS T A T E W I L D L I F E A R E A
BU
RL
ING
TO
N N
OR
TH
ER
N I
NT
AL
CO
/
CH
ER
RY
PO
INT
BR
AN
CH
LIN
EB
UR
LIN
GT
ON
NO
RT
HE
RN
IN
TA
LC
O/
CH
ER
RY
PO
INT
BR
AN
CH
LIN
E
BP MARINE TERMINAL
5
ST
RA
I T O
F G
EO
RG
I A
Vista Drive
B E A C H W O O D P A R K
B E A C H W O O D R E S O R T
B E A C H W O O D R E S O R T
PUGET SOUND ENERGYPOWER PLANT
CUSTERSUBSTATION
PRAXAIR INDUSTRIAL
WHITEHORN FIRE HALL
PROJECT SITE
CHEMCO
BP CHERRY POINTREFINERY
CUSTER/INTALCOTRANSMISSION LINE NO. 2
CUSTER/INTALCOTRANSMISSION LINE NO. 1
VP6
VP18
VP16
VP17
VP5
VP1
VP15
VP14 VP19
VP13VP12
VP11
VP2
VP9VP3
VP8
VP7
VP10
VP4
NN
1014003T
BP CHERRY POINT COGENERATION EIS
0 xxxx
0 xxxx
0 xxxx
0 xxxx
0 xxxx
Grap
hics S
erver/
Grap
hics/B
illable
/BP C
herry
Point
/EIS/F
ig 3.11
-1 visu
al view
point
s 8.11
.03
Approximate Scale in Feet
0 3000'
Source: ARCO 1996, BP 2002
VISUAL RESOURCE VIEWPOINT LOCATIONS
FIGURE 3.11-1
viewpoint locationVP1

1014003T
BP CHERRY POINT REFINERY COGENERATION EIS
graph
ics st
orage/
graph
ics/bi
llable/
BP Ch
erry P
oint/p
hoto
1-2 5
.06.03
Existing view of the project site from viewpoint 2.
Simulated view of the project site from viewpoint 2.
PROJECT SITE
1014003T
EXISTING AND SIMULATED VIEWSVIEWPOINT 2
BP CHERRY POINT COGENERATION EIS
FIGURE 3.11-2
Source: BP 2002
Grap
hics S
erver/
Grap
hics/B
illable
/BP C
herry
Point
/EIS/F
ig 3.11
-2 ph
oto 6
.20.03

1014003T
BP CHERRY POINT REFINERY COGENERATION EIS
graph
ics st
orage/
graph
ics/bi
llable/
BP Ch
erry P
oint/p
hoto
1-2 5
.06.03
Existing view of the project site from viewpoint 3.
Simulated view of the project site from viewpoint 3.
PROJECT SITE
1014003T
EXISTING AND SIMULATED VIEWSVIEWPOINT 3
BP CHERRY POINT COGENERATION EIS
FIGURE 3.11-3
Source: BP 2002
Grap
hics S
erver/
Grap
hics/B
illable
/BP C
herry
Point
/EIS/F
ig 3.11
-3 ph
oto 6
.20.03
PROJECT SITE

1014003T
BP CHERRY POINT REFINERY COGENERATION EIS
graph
ics st
orage/
graph
ics/bi
llable/
BP Ch
erry P
oint/p
hoto
1-2 5
.06.03
Existing view of the proposed cogeneration facility site from viewpoint 4.
Simulated view of the proposed cogeneration facility site from viewpoint 4 (no vegetative buffer).
PROJECT SITE
1014003T
EXISTING AND SIMULATED VIEWSVIEWPOINT 4
BP CHERRY POINT COGENERATION EIS
FIGURE 3.11-4
Source: BP 2002
Grap
hics S
erver/
Grap
hics/B
illable
/BP C
herry
Point
/EIS/F
ig 3.11
-4 ph
oto 7
.31.03

1014003T
BP CHERRY POINT REFINERY COGENERATION EIS
graph
ics st
orage/
graph
ics/bi
llable/
BP Ch
erry P
oint/p
hoto
1-2 5
.06.03
Existing view of the project site from viewpoint 15.
Simulated view of the project site from viewpoint 15.
PROJECT SITE
1014003T
EXISTING AND SIMULATED VIEWSVIEWPOINT 15
BP CHERRY POINT COGENERATION EIS
FIGURE 3.11-5
Source: BP 2002
Grap
hics S
erver/
Grap
hics/B
illable
/BP C
herry
Point
/EIS/F
ig 3.11
-5 ph
oto 8
.11.03

BLAINEAIRPORT
BPMARINE
TERMINAL
S T R A I TO F
G E O R G I A
B I R C HB A Y
D R A Y T O NH A R B O R
CherryPoint
Poin
t Whi
teho
rn R
oad
B UR L I N
GT O
N N
OR T H
E R N R A
I L R OA
D
C A N A D A
U N I T E D S T A T E S
Lonseth Road
Jack
son
Road
Blai
ne R
oad
Blai
ne R
oad
BellRoad
Peace Portal Drive
Kick
ervi
lle R
oad
Aldergrove Road
Grandview Road
Portal Way
Brown Road
Birch Bay – Lynden Road
Bay Road
Henry Road
LakeTerrell
Terrell Creek
Dakota Creek
Portal Way
Vista DriveVista Drive
5
5
548
548
B UR L I N
GT O
N N
OR T H
E R N R A
I L R OA
D
Blaine
Ferndale
RI V
ER
NO
OK
SA
CK
Drayton Harbor Road
PROJECT SITE
ALCOA INTALCO WORKS
CUSTERSUBSTATION
BP CHERRY POINT COGENERATION EIS
FIGURE 3.15-1
TRANSPORTATION NETWORKIN THE PROJECT VICINITY
1014003T
NNApproximate Scale in Miles
0 1
Grap
hics S
erver/
Grap
hics/B
illable
/BP C
herry
Point
/EIS/F
ig 3.15
-1 traf
fic 7
.30.03
Source: BP 2002
transmission line
SEATTLE
BELLINGHAM
ANACORTES
EVERETT
AREAOFDETAIL
W A S H I N G T O N

BLAINEAIRPORT
BPMARINE
TERMINAL
S T R A I TO F
G E O R G I A
B I R C HB A Y
D R A Y T O NH A R B O R
CherryPoint
Poin
t Whi
teho
rn R
oad
B UR L I N
GT O
N N
OR T H
E R N R A
I L R OA
D
C A N A D A
U N I T E D S T A T E S
Lonseth Road
Jack
son
Road
Blai
ne R
oad
Blai
ne R
oad
BellRoad
Peace Portal Drive
Kick
ervi
lle R
oad
Aldergrove Road
Grandview Road
Brown Road
Birch Bay – Lynden Road
Bay Road
Henry Road
LakeTerrell
Terrell Creek
Dakota Creek
Portal Way
Vista Drive
Vista Drive
5
5
548
548
B UR L I N
GT O
N N
OR T H
E R N R A
I L R OA
D
Blaine
Ferndale
RI V
ER
NO
OK
SA
CK
Drayton Harbor Road
PROJECT SITE
CUSTERSUBSTATION
2L50 mph
2L50 mph
2L50 mph
2L40 mph
2L45
mph
2L45 mph
Source: BP 2002
BP CHERRY POINT COGENERATION EIS
FIGURE 3.15-2
EXISTING ROADWAY CHARACTERISTICS
1014003T
NNApproximate Scale in Miles
0 1
Grap
hics S
erver/
Grap
hics/B
illable
/BP C
herry
Point
/EIS/F
ig 3.15
-2 tra
ffic 7
.30.03
all-way stop-controlled flashing signal
stop sign
approach lane and direction
number of roadway lanes
posted speed limit
2L
45 mphtransmission line

BLAINEAIRPORT
BPMARINE
TERMINAL
S T R A I TO F
G E O R G I A
B I R C HB A Y
D R A Y T O NH A R B O R
CherryPoint
Poin
t Whi
teho
rn R
oad
B UR L I N
GT O
N N
OR T H
E R N R A
I L R OA
D
C A N A D A
U N I T E D S T A T E S
Lonseth Road
Jack
son
Road
Blai
ne R
oad
Blai
ne R
oad
BellRoad
Peace Portal Drive
Kick
ervi
lle R
oad
Aldergrove Road
Grandview Road
Brown Road
Birch Bay – Lynden Road
Bay Road
Henry Road
LakeTerrell
Terrell Creek
Dakota Creek
Portal Way
Vista Drive
Vista Drive
5
5
548
548
B UR L I N
GT O
N N
OR T H
E R N R A
I L R OA
D
Blaine
Ferndale
RI V
ER
NO
OK
SA
CK
Drayton HarborRoad
4000(8/00)6100*
760036002900*3200*
2400(8/00)
MP 5.93 MP 4.93
MP 6.96
MP 8.96
MP 10.85
MP 11.80
MP 0.97
2400(8/00)
1550(8/00)
1550(8/00)
1800(9/99)
1250
(9/0
0)
750
(9/0
0)
2000
2100
2200
2700
6700
59005900
6000
1400(8/95)
7500(7/96)
7600(7/96)
5250
(7/00)5250
(7/00)
1200(8/95)
2500(8/95)
6000
PROJECT SITE
ALCOA INTALCO WORKS
CUSTERSUBSTATION
BP CHERRY POINT COGENERATION EIS
FIGURE 3.15-3
HISTORICAL DAILY TRAFFIC COUNTS
1014003T
NNApproximate Scale in Miles
0 1
Grap
hics S
erver/
Grap
hics/B
illable
/BP C
herry
Point
/EIS/F
ig 3.15
-3 tr
affic
7.31
.03
Source: BP 2002
milepost
countdate of count
1200(8/95)
MP 5.93
1. Month and year of counts shown forcounts conducted by Whatcom County.
2.WSDOT 1999 counts shown with an asterisk (*)
3. Other volumes shown are WSDOT 1999projections based on earlier counts.
notes:
transmission line

BLAINEAIRPORT
BPMARINE
TERMINAL
S T R A I TO F
G E O R G I A
B I R C HB A Y
D R A Y T O NH A R B O R
CherryPoint
Poin
t Whi
teho
rn R
oad
B UR L I N
GT O
N N
OR T H
E R N R A
I L R OA
D
C A N A D A
U N I T E D S T A T E S
Lonseth Road
Jack
son
Road
Blai
ne R
oad
Blai
ne R
oad
BellRoad
Peace Portal Drive
Kick
ervi
lle R
oad
Aldergrove Road
Grandview Road
Brown Road
Birch Bay – Lynden Road
Bay Road
Henry Road
LakeTerrell
Terrell Creek
Dakota Creek
Portal Way
Vista Drive
Vista Drive
5
5
548
548
B UR L I N
GT O
N N
OR T H
E R N R A
I L R OA
D
Blaine
Ferndale
RI V
ER
NO
OK
SA
CK
Drayton HarborRoad
42406860405032603600
2540
1640
2020
1325
795
2250
2360
2470
3035
7530
59006300
6000
1990
1005010180
5250
(7/00)5570
1700
3550
6745
PROJECT SITE
ALCOA INTALCO WORKS
CUSTERSUBSTATION
BP CHERRY POINT COGENERATION EIS
FIGURE 3.15-4
2001 AVERAGE DAILY TRAFFIC VOLUMES
1014003T
NNApproximate Scale in Miles
0 1
Grap
hics S
erver/
Grap
hics/B
illable
/BP C
herry
Point
/EIS/F
ig 3.15
-4 tr
affic
7.30.0
3
Source: BP 2002
average daily traffic volume1200
note: Projections based on available countsand calculated 6.0% annual growth rate.
transmission line

BLAINEAIRPORT
S T R A I TO F
G E O R G I A
B I R C HB A Y
D R A Y T O NH A R B O R
CherryPoint
Poin
t Whi
teho
rn R
oad
B UR L I N
GT O
N N
OR T H
E R N R A
I L R OA
D
C A N A D A
U N I T E D S T A T E S
Lonseth Road
Jack
son
Road
Blai
ne R
oad
Blai
ne R
oad
BellRoad
Peace Portal Drive
Kick
ervi
lle R
oad
Aldergrove Road
Grandview Road
Brown Road
Birch Bay – Lynden Road
Bay Road
Henry Road
LakeTerrell
Terrell Creek
Dakota Creek
Portal Way
Vista Drive
Vista Drive
5
5
548
548
B UR L I N
GT O
N N
OR T H
E R N R A
I L R OA
D
Blaine
Ferndale
RI V
ER
NO
OK
SA
CK
Drayton Harbor Road
PROJECT SITE
CUSTERSUBSTATION
0 110 26
4
45
74
115
184
46
135 111 36
940
49
21 76443 306
37 9
2154
18
6 15 4
15 8301 103
81 6
29 39 622 24
61 33375 133
246 1112 43
16 193
021
45
2 70295 159
36 70
2426
42
50 75 53
27 57200 273
25 68
38 68 64
34 12114 156
297 2 126
141 352346 99
48 0 7
REFINERYMAINGATE
Wednesday8/29/01
1645-1745Thursday8/30/01
1700-1800
Wednesday8/29/01
1630-1730
Thursday8/30/01
1630-1730
Monday4/02/01
1630-1730
**
Wednesday8/29/01
1645-1745
*
BP CHERRY POINT COGENERATION EIS
FIGURE 3.15-5
2001 WEEKDAYPM PEAK-HOUR TRAFFIC VOLUMES
1014003T
NNApproximate Scale in Miles
0 1
Grap
hics S
erver/
Grap
hics/B
illable
/BP C
herry
Point
/EIS/F
ig 3.15
-5 tr
affic
7.31.0
3
Source: BP 2002*based on 6% annual growth rate and 2001 PM peak hour traffic volumes available historical count data
295 peak construction trafficvolume and direction
transmission line

BLAINEAIRPORT
S T R A I TO F
G E O R G I A
B I R C HB A Y
D R A Y T O NH A R B O R
CherryPoint
Poin
t Whi
teho
rn R
oad
B UR L I N
GT O
N N
OR T H
E R N R A
I L R OA
D
C A N A D A
U N I T E D S T A T E S
Lonseth Road
Jack
son
Road
Blai
ne R
oad
Blai
ne R
oad
BellRoad
Peace Portal Drive
Kick
ervi
lle R
oad
Aldergrove Road
Grandview Road
Brown Road
Birch Bay – Lynden Road
Bay Road
Henry Road
LakeTerrell
Terrell Creek
Dakota Creek
Portal Way
Vista Drive
Vista Drive
5
5
548
548
B UR L I N
GT O
N N
OR T H
E R N R A
I L R OA
D
Blaine
Ferndale
RI V
ER
NO
OK
SA
CK
Drayton Harbor Road
PROJECT SITE
CUSTERSUBSTATION
3
1
21 2
142 2413
2
2
10167 30
13
2
8 2
162
2 24
8 45 153
272 7
18 38
155 2713
2
1 3
5 25 21
58 1
21
13 22116
2
SITEGATE
BP CHERRY POINT COGENERATION EIS
FIGURE 3.15-6
PROJECT-GENERATED TRIPSFOR PEAK CONSTRUCTION CONDITIONS
1014003T
NNApproximate Scale in Miles
0 1
Grap
hics S
erver/
Grap
hics/B
illable
/BP C
herry
Point
/EIS/F
ig 3.15
-6 tr
affric
8.1.0
3
Source: BP 2002
295 peak construction trafficvolume and direction
transmission line
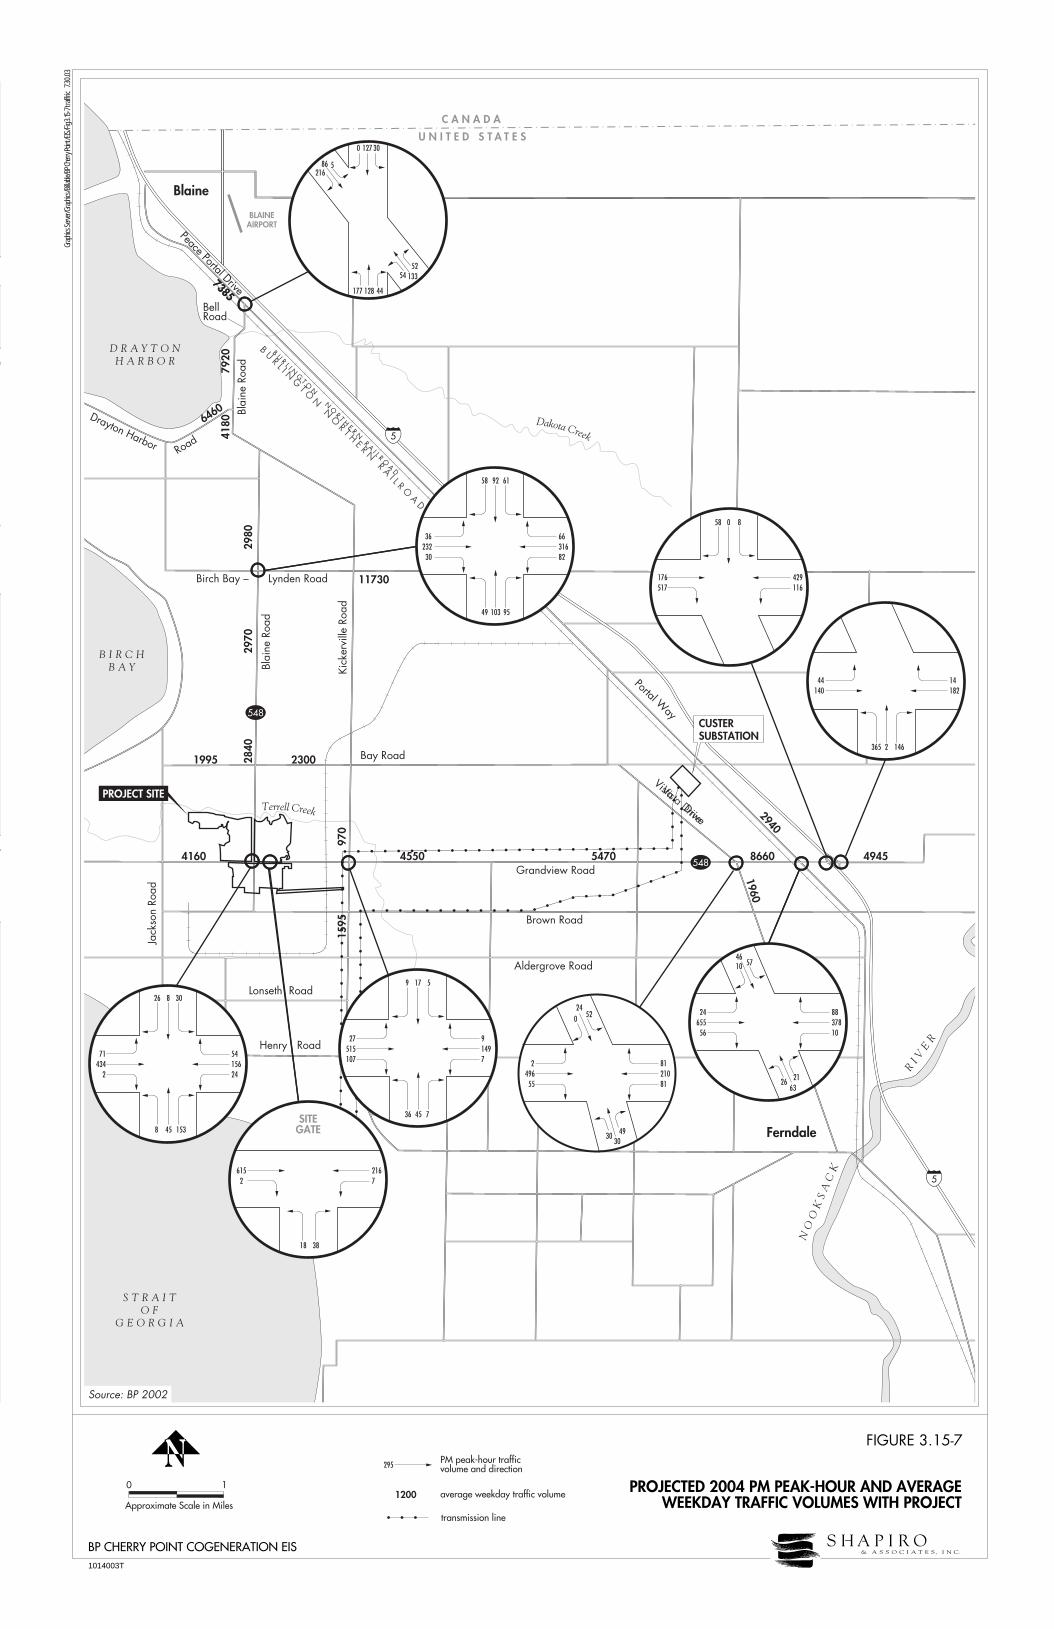
BLAINEAIRPORT
S T R A I TO F
G E O R G I A
B I R C HB A Y
D R A Y T O NH A R B O R
CherryPoint
Poin
t Whi
teho
rn R
oad
B UR L I N
GT O
N N
OR T H
E R N R A
I L R OA
D
C A N A D A
U N I T E D S T A T E S
Lonseth Road
Jack
son
Road
Blai
ne R
oad
Blai
ne R
oad
BellRoad
Peace Portal Drive
Kick
ervi
lle R
oad
Aldergrove Road
Grandview Road
Brown Road
Birch Bay – Lynden Road
Bay Road
Henry Road
LakeTerrell
Terrell Creek
Dakota Creek
Portal Way
Vista Drive
Vista Drive
5
5
548
548
B UR L I N
GT O
N N
OR T H
E R N R A
I L R OA
D
Blaine
Ferndale
RI V
ER
NO
OK
SA
CK
Drayton Harbor Road
PROJECT SITE
CUSTERSUBSTATION
0 127 30
5
52
86
133
216
54
177 128 44
1046
57
24 88655 378
56 10
2663
21
9 17 5
27 9515 149107 7
36 45 7
26 8 30
71 54434 156
2 24
8 45 153
615 2162 7
18 38
024
52
2 81496 210
55 81
3030
49
58 92 61
36 66232 31630 82
49 103 95
44 14140 182
365 2 146
176 429517 116
58 0 8
SITEGATE
49458660
2940
1960
54704550
11730
1595
2840
1995 2300
2970
2980
4180
7920
6460
73857385
970
4160
BP CHERRY POINT COGENERATION EIS
FIGURE 3.15-7
PROJECTED 2004 PM PEAK-HOUR AND AVERAGEWEEKDAY TRAFFIC VOLUMES WITH PROJECT
1014003T
NNApproximate Scale in Miles
0 1
Grap
hics S
erver/
Grap
hics/B
illable
/BP C
herry
Point
/EIS/F
ig 3.15
-7 tra
ffric
7.30
.03
Source: BP 2002
295 PM peak-hour trafficvolume and direction
average weekday traffic volume1200
transmission line
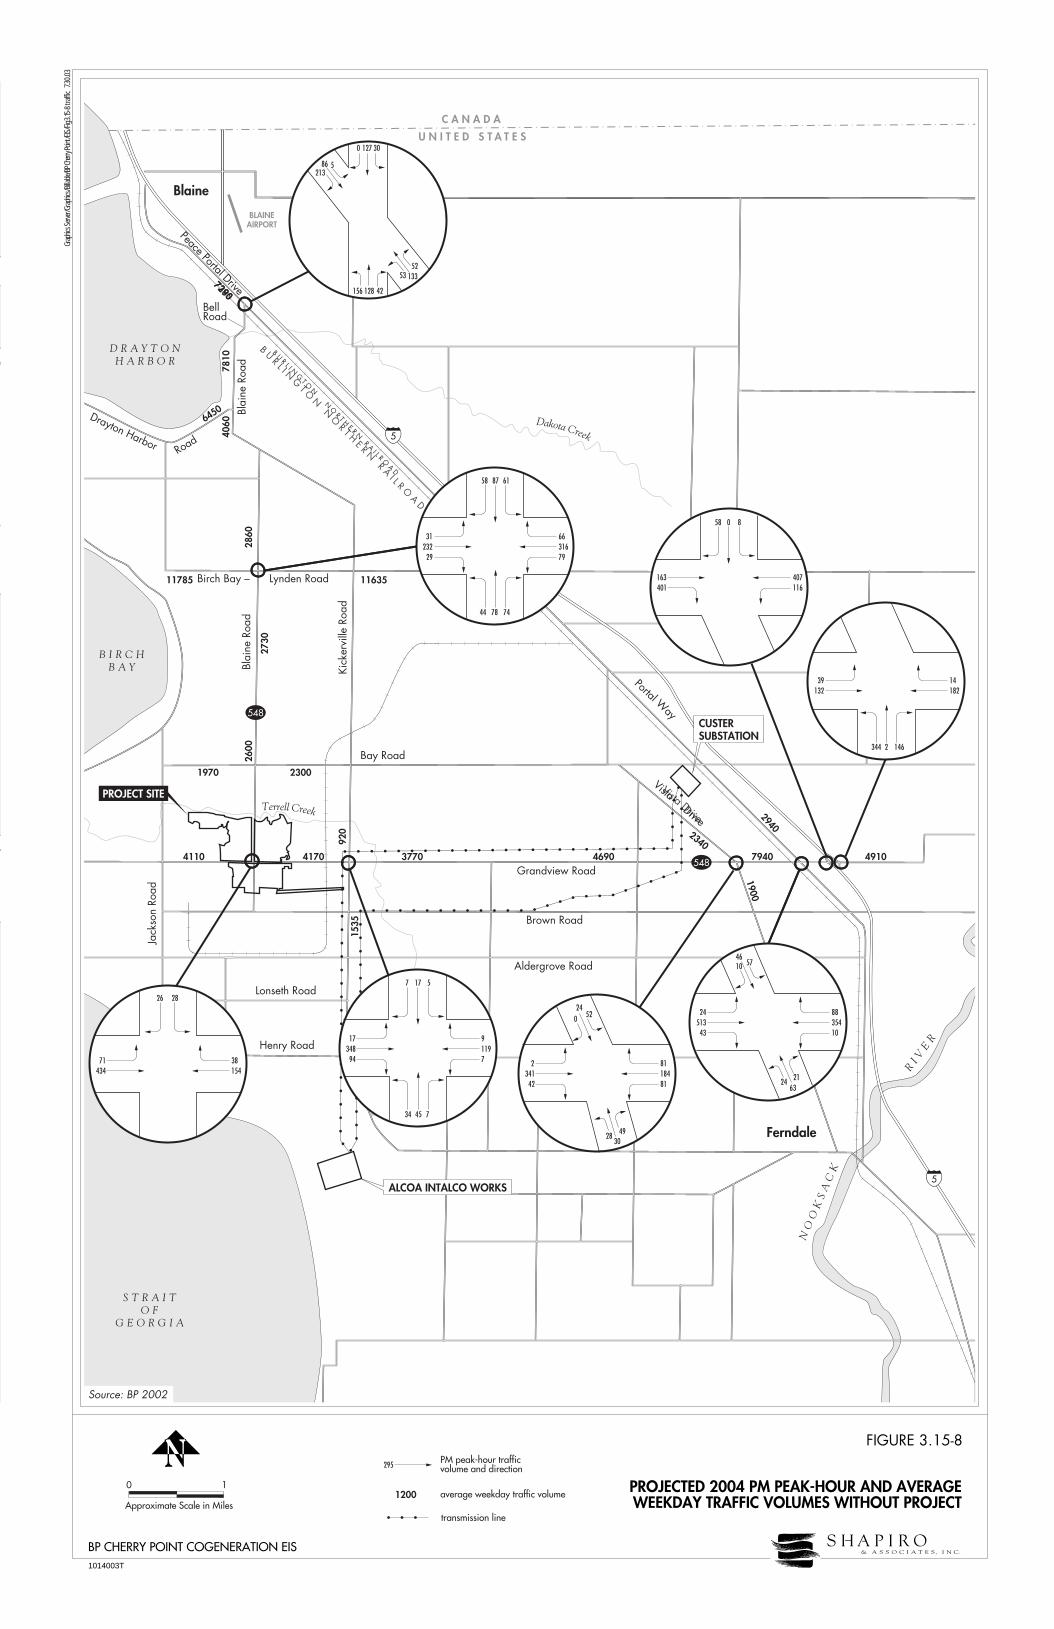
BLAINEAIRPORT
S T R A I TO F
G E O R G I A
B I R C HB A Y
D R A Y T O NH A R B O R
CherryPoint
Poin
t Whi
teho
rn R
oad
B UR L I N
GT O
N N
OR T H
E R N R A
I L R OA
D
C A N A D A
U N I T E D S T A T E S
Lonseth Road
Jack
son
Road
Blai
ne R
oad
Blai
ne R
oad
BellRoad
Peace Portal Drive
Kick
ervi
lle R
oad
Aldergrove Road
Grandview Road
Brown Road
Birch Bay – Lynden Road
Bay Road
Henry Road
LakeTerrell
Terrell Creek
Dakota Creek
Portal Way
Vista Drive
Vista Drive
5
5
548
548
B UR L I N
GT O
N N
OR T H
E R N R A
I L R OA
D
Blaine
Ferndale
RI V
ER
NO
OK
SA
CK
Drayton Harbor Road
PROJECT SITE
ALCOA INTALCO WORKS
CUSTERSUBSTATION
0 127 30
5
52
86
133
213
53
156 128 42
1046
57
24 88513 354
43 10
2463
21
7 17 5
17 9348 11994 7
34 45 7
26 28
71 38434 154
024
52
2 81341 184
42 81
2830
49
58 87 61
31 66232 316
29 79
44 78 74
39 14132 182
344 2 146
163 407401 116
58 0 8
49107940
2940
2340
1900
46903770
1163511785
1535
2600
2730
2860
4060
7810
6450
73857290
920
4110 4170
1970 2300
BP CHERRY POINT COGENERATION EIS
FIGURE 3.15-8
PROJECTED 2004 PM PEAK-HOUR AND AVERAGEWEEKDAY TRAFFIC VOLUMES WITHOUT PROJECT
1014003T
NNApproximate Scale in Miles
0 1
Grap
hics S
erver/
Grap
hics/B
illable
/BP C
herry
Point
/EIS/F
ig 3.15
-8 tr
affic
7.30
.03
Source: BP 2002
295 PM peak-hour trafficvolume and direction
average weekday traffic volume1200
transmission line
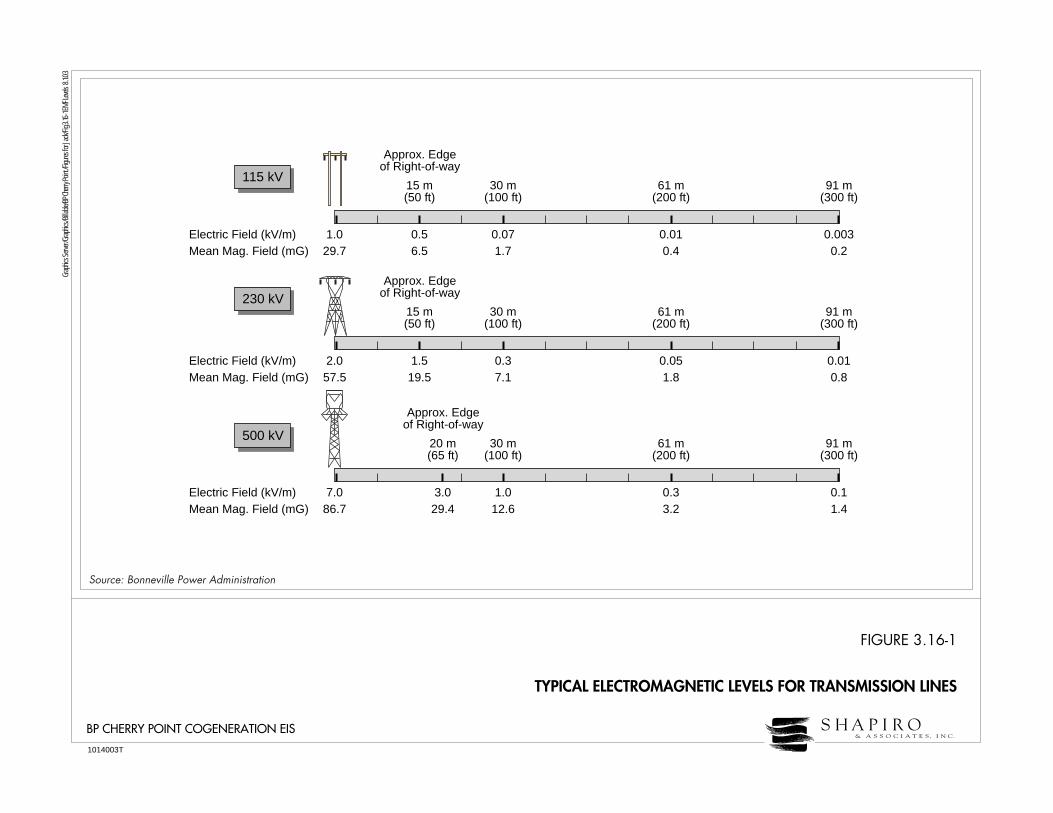
115 kV
230 kV
500 kV
Electric Field (kV/m)Mean Mag. Field (mG)
1.029.7
0.56.5
0.071.7
0.010.4
0.0030.2
30 m(100 ft)
61 m(200 ft)
91 m(300 ft)
15 m(50 ft)
Approx. Edgeof Right-of-way
Electric Field (kV/m)Mean Mag. Field (mG)
2.057.5
1.519.5
0.37.1
0.051.8
0.010.8
30 m(100 ft)
61 m(200 ft)
91 m(300 ft)
15 m(50 ft)
Approx. Edgeof Right-of-way
Electric Field (kV/m)Mean Mag. Field (mG)
7.086.7
3.029.4
1.012.6
0.33.2
0.11.4
30 m(100 ft)
61 m(200 ft)
91 m(300 ft)
20 m(65 ft)
Approx. Edgeof Right-of-way
Grap
hics S
erver/
Grap
hics/B
illable
/BP C
herry
Point
/Figu
res fo
r Jac
k/Fig 3
.16-1 E
MF Le
vels 8
.1.03
0 xxxx
0 xxxx
0 xxxx
0 xxxx
0 xxxx
FIGURE 3.16-1
TYPICAL ELECTROMAGNETIC LEVELS FOR TRANSMISSION LINES
Source: Bonneville Power Administration
1014003T
BP CHERRY POINT COGENERATION EIS
97
97
97