bp 1q 2016 results presentation
TRANSCRIPT

1

Hello and welcome.This is BP’s first-quarter 2016 results webcast and conference call.
I’m Jess Mitchell, BP’s Head of Investor Relations and I’m here with our Chief FinancialOfficer, Brian Gilvary.
Before we start, I need to draw your attention to our cautionary statement.
2

During today’s presentation, we will make forward-looking statements that refer to ourestimates, plans and expectations. Actual results and outcomes could differ materially dueto factors we note on this slide and in our UK and SEC filings. Please refer to our AnnualReport, Stock Exchange Announcement and SEC filings for more details. These documentsare available on our website.
Thank you, and now over to Brian.
3

4
Thanks Jess.

Welcome everybody and thank you for joining us.
It’s been a challenging start to the year for our industry. It is also a quarter in which we haveseen considerable progress in our own business as we work to reposition the Group.
We continue to see real momentum in resetting the cost base. This is working to lower thepoint at which we expect to rebalance organic cash flows in 2017, and supports ourcontinued commitment to sustaining the dividend as you have seen in this morning’srelease.
Our focus on costs, together with sound operations, has also supported the solidunderlying earnings and cash flow delivery you have seen today, despite the much weakermarket conditions.
So I’ll start today by looking at the business environment, before covering our first-quarternumbers in detail. I’ll then update you on our medium-term financial frame, where wecontinue to demonstrate both flexibility and resilience in our approach to resetting thecompany. I’ll finish with a brief look at the first-quarter progress in our businesses beforeJess and I take your questions.
5

Starting with an update on the macro-economics, where the market is responding to lowoil prices and progressing broadly along the path we laid out to you earlier in the year.
Global oil demand looks set to increase strongly again this year, supported by low oil prices.We expect demand growth to be around 1.4 million barrels per day this year - a little weakerthan last year - but still comfortably above the historical average.
At the same time, global supply growth is likely to be flat-to-falling, with US tight oil supplyfalling in particular, only partially offset by increases in Iranian production.
So our view hasn’t changed materially over the past six to nine months. We continue toexpect the combination of robust demand and weak supply growth to move the marketcloser into balance by the end of this year. This will still leave record high oil inventories tobe worked down, before a more settled position emerges.
6

7
Looking more specifically at the price environment so far this year.
With continued over-supply, Brent crude oil fell to an average of $34 per barrel in the firstquarter, compared to $44 per barrel in the fourth quarter and $54 per barrel a year ago.
Henry Hub gas prices continued to decline in the first quarter, with spot prices averagingjust below $2 per million British Thermal Units. The mild winter in the United Statescontinued to supress demand while supply remained ample, including gas in storage atunseasonably high levels.
The global refining marker margin averaged $10.50 per barrel in the first quarter, thelowest since the third quarter of 2010, weighed down by weak diesel demand and highgasoline stocks in the United States. Refining margins have recovered, averaging $12.70so far in the second quarter.
This weaker environment is consistent with the assumptions we built into our plans forthe first part of the year. While it has had a significant impact on our results in the firstquarter, this was also a period of strong operational delivery and visible progress on ourcost and efficiency agenda.

8
Turning to the results for the Group.
BP’s first-quarter underlying replacement cost profit was $530 million, down 79% on thesame period a year ago, and 170% higher than the fourth quarter of 2015.
Compared to a year ago, the result reflects:
– Lower Upstream realisations;
– A weaker refining environment; and
– The absence of a one-off tax benefit arising from changes to UK supplementarytaxation.
Partly offset by:
– Lower cash costs across the Group.
Compared to the previous quarter, the result reflects:
– Lower costs across the Group; and
– A higher contribution from supply and trading.
Partly offset by:
– Lower Upstream realisations; and
– A weaker refining environment.
First-quarter underlying operating cash flow, which excludes Gulf of Mexico oil spillpayments, was $3.0 billion.
The first-quarter dividend, payable in the second quarter of 2016, remains unchanged at 10cents per ordinary share.

9
In Upstream, the underlying first-quarter replacement cost loss before interest and tax of$750 million compares with a profit of $600 million a year ago and a loss of $730 million inthe fourth quarter of 2015.
Compared to the first quarter of 2015 the result reflects:
– Significantly lower liquids and gas realisations.
Partly offset by:
– Lower costs from simplification and efficiency activities;
– Lower rig cancellation costs; and
– Lower DD&A.
Excluding Rosneft, first quarter reported production versus a year ago was 5.2% higher.After adjusting for entitlement and divestment impacts, underlying production decreased by1.1%.
Compared to the fourth quarter, the result reflects:
– Lower realisations.
Largely offset by:
– Significantly lower costs, including lower exploration write-offs.
Looking ahead, we expect second-quarter 2016 reported production to be lower than thefirst quarter, reflecting PSA entitlement impacts and seasonal turnaround maintenanceactivity.
10
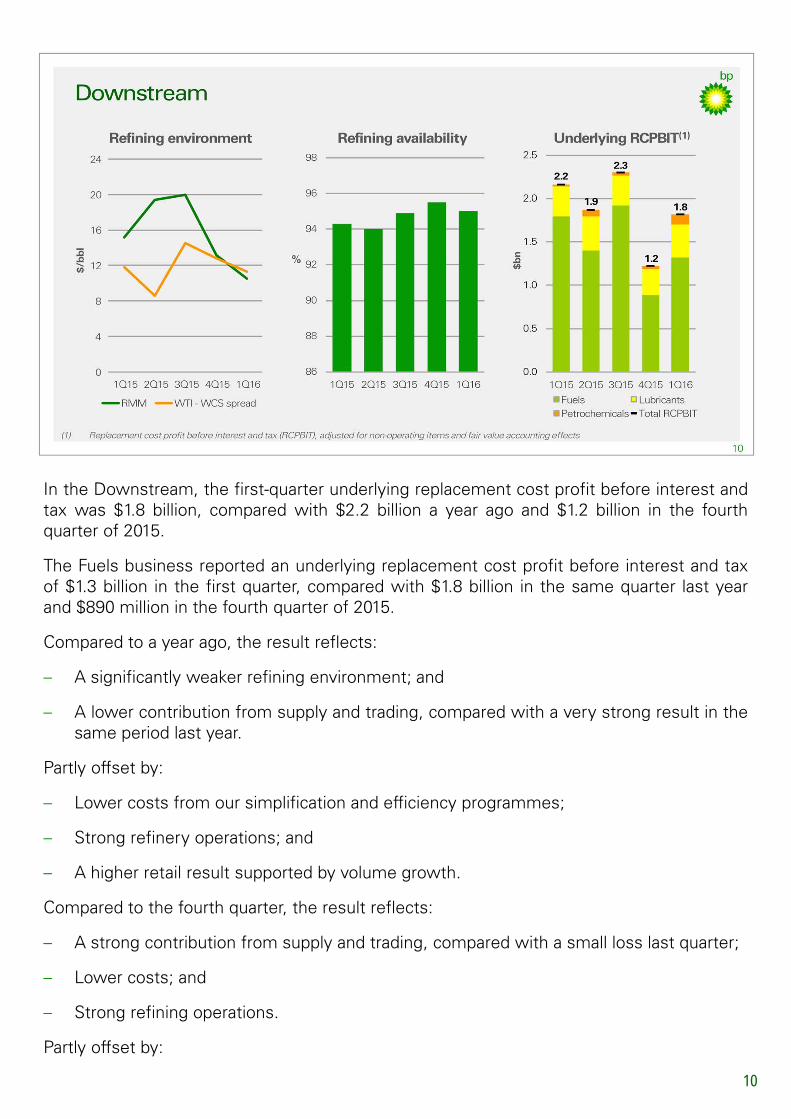
In the Downstream, the first-quarter underlying replacement cost profit before interest andtax was $1.8 billion, compared with $2.2 billion a year ago and $1.2 billion in the fourthquarter of 2015.
The Fuels business reported an underlying replacement cost profit before interest and taxof $1.3 billion in the first quarter, compared with $1.8 billion in the same quarter last yearand $890 million in the fourth quarter of 2015.
Compared to a year ago, the result reflects:
– A significantly weaker refining environment; and
– A lower contribution from supply and trading, compared with a very strong result in thesame period last year.
Partly offset by:
– Lower costs from our simplification and efficiency programmes;
– Strong refinery operations; and
– A higher retail result supported by volume growth.
Compared to the fourth quarter, the result reflects:
– A strong contribution from supply and trading, compared with a small loss last quarter;
– Lower costs; and
– Strong refining operations.
Partly offset by:

– A weaker refining environment; and
– Seasonally lower fuels marketing margin capture.
The Lubricants business delivered an underlying replacement cost profit of$380 million in the first quarter compared with $350 million in the samequarter last year, reflecting strong premium brand performance and margingrowth despite adverse foreign exchange impacts.
The Petrochemicals business reported an underlying replacement costprofit of $110 million, compared to $20 million a year ago, reflectingimproved operations, lower costs and a slightly improved marginenvironment.
In the second quarter, we expect a significantly higher level of turnaroundactivity, particularly in the United States and some seasonal improvementin industry refining margins.
10

11
Turning to Rosneft. Based on preliminary information, we have recognised around $70million as our estimate of BP’s share of Rosneft’s underlying net income for the firstquarter, compared to around $180 million a year ago and $235 million in the fourth quarterof 2015.
Our estimate of BP’s share of Rosneft’s production for the first quarter is just over 1 millionbarrels of oil equivalent per day, similar to both a year ago and the fourth quarter.
Additional details will be made available by Rosneft with their results.
On the 22nd of April, the Rosneft board indicated an intention to increase its dividend payoutto 35% of IFRS earnings. At current exchange rates, this would imply a dividend payable toBP of around $330 million after tax for 2015, payable in the third quarter of 2016. The finaldecision regarding the payout will be taken at Rosneft’s Annual General ShareholdersMeeting in June.

12
In Other Businesses and Corporate, we reported a pre-tax underlying replacement costcharge of $180 million for the first quarter, $110 million lower than same period a year ago.This reflects lower corporate and functional costs and foreign exchange benefits. Wecontinue to expect the average underlying quarterly charge for the year to be around $300million, although this may fluctuate between individual quarters.
The underlying tax rate in the first quarter was 18% and reflects tax credits from thereported Upstream loss offsetting tax charges elsewhere in the business, together with adeferred tax benefit from the weaker US dollar. This compares to a rate of 21% in the sameperiod a year ago, after adjusting for the UK North Sea supplementary charge in 2015.
In the current environment, and with our existing portfolio of assets, we continue to expectthe effective tax rate for the full year to be lower than the adjusted 2015 rate of 31%, whichexcludes the previously mentioned North Sea tax credit.

13
Turning to the Gulf of Mexico oil spill costs and provisions.
Earlier this month, the court entered final judgment on the Consent Decree relating to the2015 agreement to settle all federal and state claims arising from the Deepwater Horizonincident. As a result, the Consent Decree and settlement agreement are now effective.
The total cumulative pre-tax charge for the incident to date is $56.4 billion – or $40.7 billionafter tax. The charge for the first quarter was $917 million which includes:
– $593 million related to business economic loss claims not provided for;
– $201 million of costs relating to the settlement of certain civil claims outside of the2012 class action settlement and other administration costs; and
– Financing costs of $123 million.
It is still not possible to reliably estimate the remaining liability for business economic lossclaims and we continue to review this each quarter. We have, however, now agreedsimplified and accelerated procedures for processing claims which you see reflected intoday’s higher charge.
Of the $20 billion paid into the Trust fund, $19.8 billion has now been paid out with theremainder allocated to amounts already provided for.
The pre-tax cash outflow on costs related to the oil spill for the first quarter was $1.1 billion,including $530 million relating to the 2012 criminal settlement with the United StatesDepartment of Justice. We also expect a further $1.1 billion of payments in respect of the2015 settlement, as well as further payments relating to business economic loss claims andother costs not yet provided for. We will continue to update you on a quarterly basis,including any further developments with the private securities litigation under MDL 2185.
14
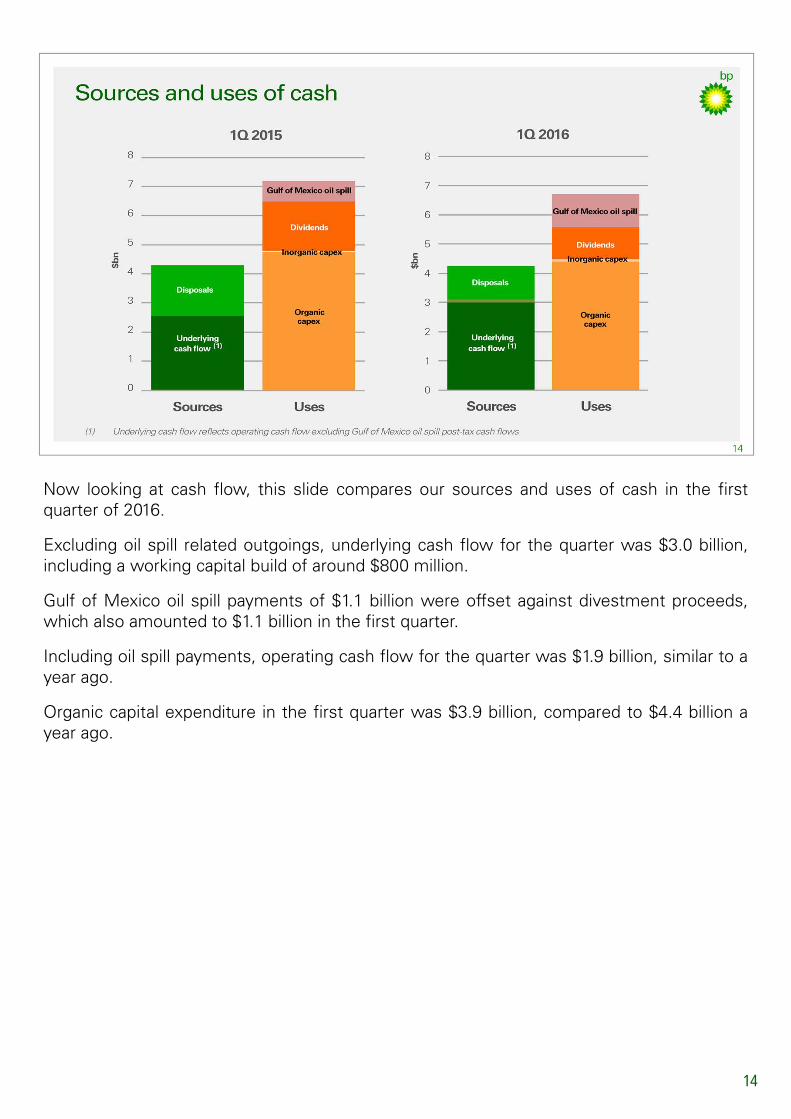
Now looking at cash flow, this slide compares our sources and uses of cash in the firstquarter of 2016.
Excluding oil spill related outgoings, underlying cash flow for the quarter was $3.0 billion,including a working capital build of around $800 million.
Gulf of Mexico oil spill payments of $1.1 billion were offset against divestment proceeds,which also amounted to $1.1 billion in the first quarter.
Including oil spill payments, operating cash flow for the quarter was $1.9 billion, similar to ayear ago.
Organic capital expenditure in the first quarter was $3.9 billion, compared to $4.4 billion ayear ago.

Turning now to our financial frame and starting with some context.
Our financial framework is designed to grow long-term value for shareholders whilemaintaining the financial health and liquidity of the Group. This requires us to determine theright level of re-investment to continue to grow value while ensuring we distributesustainable returns to shareholders.
We believe getting this right is strongly linked to making the right decisions about ourportfolio.
At its simplest we have prioritised value over volume – and will continue to do so on anongoing basis. We look to divest assets which no longer fit with our strategy and deepen inassets which add the most value. At the same time we drive returns through disciplinedinvestment into the best projects. In the current environment all this still applies, but wehave an added imperative to make very careful judgements about how we use our scarcecapital. We have to balance the pace of investment to capture maximum deflation whileensuring we maintain safe operations and preserve future growth. We also wish to retainflexibility to add to the portfolio at the lowest point of the cycle if the right opportunitiespresent themselves.
So there are a lot of moving parts that we need to continue to manage while theenvironment remains unsettled. We entered this down-cycle with a strong balance sheetand we have a strong portfolio, with a resilient Downstream and a new wave of materialUpstream project start-ups in sight. We have also moved very quickly to reset the cost baseof the company for a lower price environment. Consistent with many others, we anticipatea modestly more favourable oil price environment in 2017 than we see today, but believewe have the flexibility to withstand a range of outcomes. If oil prices remain lower forlonger than anticipated, there will inevitably be trade-offs that we need to take, but we willcontinue to be governed in these decisions by what we consider to be in the best long-term interests of shareholders.
15

16
Looking at the specifics of our financial frame.
We continue to make strong progress on resetting both the capital and cash cost base ofthe Group.
We now expect capital expenditure in relation to the current portfolio to be around $17billion this year. We see room to reduce this to between $15-17 billion per annum for 2017in the event of a continued low oil price. This compares to our guidance in February of $17-19 billion per annum for the same period, while at that time 2016 spend was expected tobe at the lower end of that range.
Today’s guidance suggests a 30-40% drop in capital expenditure by 2017 compared toaround $25 billion of spend at the peak in 2013, when Brent oil prices averaged $109 perbarrel.
The reduction has come through:
– Paring back exploration spend;
– Prioritisation of marginal activity; and
– The capture of accelerating deflation in the supply chain as we time our investmentdecisions.
Significantly, it also reflects a strong drive towards capital efficiency in our developmentplans which is allowing us to deliver the same activity for less spend. In areas where westill see flexibility to optimise activity we will judge very carefully the implications to thebusiness, retaining the ability to increase activity if prices strengthen. We will continue torealise deepening deflation and balance the overall best use of funds to the prevailing oilprice. Our intention remains to stay very focused on both safety and our growth plans for

the future.
We also continue to move quickly to lower controllable cash costs acrossthe Group. The Group’s cash costs over the last four quarters were $4.6billion lower than 2014. This demonstrates the ongoing momentum behindour efforts to reduce costs and puts us about two-thirds of the waythrough to delivering $7 billion of cash cost reduction by 2017, compared to2014.
As we continue to lock-in capital efficiencies and embed structuralsimplification along with a more controlled organisation, we expect a largepart of the cost savings to be sustainable for the future.
Non-operating restructuring charges are expected to approach $2.5 billionin total by the end of 2016, with around $1.9 billion incurred so far since thefourth quarter of 2014. Of this, around $350 million was incurred in the firstquarter.
16

17
Our principal aim is to re-establish a balance where operating cash flow covers capitalexpenditure and the dividend over time. In this way we look to ensure that levels of re-investment and distributions are consistent with the long-term growth of our underlyingbusiness.
We have been working towards a goal of rebalancing by 2017 at the prevailing oil pricewhich back in October 2015 we pegged at $60 per barrel, consistent with the forwardcurve at that time. As we steadily take more costs out, the Brent oil price at which wewould expect to break-even continues to move lower. We now anticipate re-balancingorganic sources and uses of cash by 2017 at oil prices in the range of $50-55 per barrel.
This currently defines the basis for our ongoing commitment to sustaining the dividend asthe first priority within our financial framework. Actual inflows and outflows will be subjectto ongoing recalibration to the environment, including the judgements we make aroundlevels of capital expenditure and any changes to the portfolio.
Once rebalancing is achieved, organic free cash flow is expected to start to grow atconstant prices supported by the stronger cash flows expected from our Upstream projectstart-ups over the medium term. This will, in turn, support distributions to shareholders.
With divestments having reached $10 billion over 2014 and 2015, we continue to expect $3-5 billion of divestments in 2016 and around $2-3 billion per annum thereafter, in line withour historical norms. The proceeds from these divestments provide additional flexibility tomanage oil price volatility and capacity to meet our Deepwater Horizon paymentcommitments in the United States.

18
Turning to gearing.
At the end of the first quarter net debt was $30 billion with gearing at 23.6%.
This includes the impact that the Consent Decree and settlement agreement with the GulfStates had on our balance sheet during 2015, and the scheduling of payments over anextended period.
As a reminder, during 2010 we lowered our gearing band from a historical range of 20-30%down to 10-20% to manage uncertainties, mainly in relation to the Deepwater Horizonincident. Having finalised these agreements, we are re-establishing a 20-30% gearing bandgoing forward.

Now turning briefly to the highlights for the quarter from our businesses.
Starting with the Upstream, we have seen continued strong operational performance. Plantreliability was 95% across our operated producing assets and we saw strong drillingperformance, particularly in the United States Lower 48 and Azerbaijan, delivering both costand efficiency benefits.
The first quarter saw the start-up of the In Salah Southern Fields major project in Algeriaand we also recently saw the start-up of the Point Thomson project in Alaska. We also havetwo projects in the commissioning stage and two further projects continue to progress wellfor start-up later in the year, with facilities work nearing completion. For example we sawthe safe arrival of the new FPSO for Quad 204 in Norway ahead of its installation to theWest of Shetland this summer, ready for start-up around the end of the year.
Overall we continue to have momentum on our Upstream major projects portfolio as welook beyond this year. Our 2017 start-ups are on-track, and together with our six 2016 start-ups, we expect to put in place 500 thousand oil equivalent barrels per day of new net BPcapacity by the end of 2017 versus 2015.
For example our Khazzan project facilities are now 69% complete with 46 well padscompleted and start-up expected to be a little ahead of schedule. Juniper, which will back-fill production into our Trinidad LNG trains, is progressing well with over 55% facilitiescompletion. In Egypt facilities for the Taurus-Libra phase of our West Nile Delta project arealso on schedule and around 50% complete, while the topsides modules for Clair Ridge inthe North Sea are en route from South Korea and are expected to arrive later this quarter.
Beyond these 2017 start-ups, the production facilities for our Shah Deniz Phase 2 projectare ahead of plan at around 70% completion, with first gas scheduled for 2018.
All of this means we remain on track for the delivery of over 800 thousand barrels of oil
19
equivalent per day of production from new major projects by 2020.
In February, our first exploration discovery of the year was announced onthe Nooros East prospect in Egypt by the operator Eni, who have now tiedit back for production. Meanwhile we have completed evaluation of the BP-operated Kepler-3 discovery, drilled in late 2015, and are in the process oftying this well into our Na Kika platform with the aim of starting productionlater this year. These are great examples of the opportunity for rapidmonetisation of near-field discoveries, or what we call infrastructure-ledexploration.
The first quarter was a strong quarter for new access including farm-insand licences awarded for new acreage in Norway and NewfoundlandCanada, with an aggregate total of around 12,000 square kilometres.
In Oman, we signed a major agreement to extend the Khazzan license toaccess a further 1,000 square kilometres, estimated to contain around 3.5trillion cubic feet of gas. Combined plateau production from Phases 1 and 2is expected to total approximately 1.5 billion cubic feet of gas a day,equivalent to around 40% of Oman’s current total domestic gas production.
Additionally in the first quarter, the Government of India announced a seriesof policy initiatives, including marketing and pricing freedom for natural gasproduced from deepwater discoveries, which we believe is a positivedevelopment and are evaluating for future projects.
We also signed two new agreements – one with the Kuwait PetroleumCorporation to enhance recovery of existing oil and gas resources andpursue future oil and gas exploration opportunities; and a ProductionSharing Agreement in China to develop shale gas resources.
19

20
In the Downstream, the first quarter saw strong year-on-year underlying performanceimprovement mitigating the impact of a weaker refining environment.
At the same time, our refineries saw a 4% increase in utilisation, while we increased theamount of advantaged heavy crude processed by more than 20%. And in Petrochemicalswe are improving the cash breakeven of the business, making it more robust to a bottom-of-cycle environment.
Our marketing growth strategy continues to deliver results. The global roll-out of ourUltimate fuels with ACTIVE technology represents our biggest fuel launch in over a decade.We also expanded our convenience retail partnerships in Germany and the Netherlands;and we became the world’s first supplier for commercial jet biofuel using existing airportinfrastructure.
In Lubricants we continue to see double-digit earnings growth supported by strongpremium brand performance and growth market positions.
And simplification and efficiency has progressed across the Downstream into 2016,keeping the business on track to deliver $2.5 billion of cost efficiencies by the end of 2017.
Taken together, this momentum in underlying performance improvement continues tosupport the increased resilience of the Downstream business.

21
In summary.
The environment is very challenging but we are seeing the benefit of having moved quicklyto respond.
We have considerable momentum around resetting our cost base. This is driven by both thepace at which we are capturing deflation and our own simplification efforts. You have seenmore evidence of this across all our businesses in today’s results.
We are steadily lowering the oil price at which we expect to balance organic sources anduses of cash by 2017, while retaining sufficient flexibility to make the right choices aboutour portfolio to sustain growth.
I believe we are making strong progress. We are executing our projects safely and moreefficiently, driving down costs and making careful judgements about the best use of scarcecapital.
And all our decisions continue to be guided by our ultimate aim to grow sustainable freecash flow and distributions to shareholders over the long term.
On that note, thank you for listening, and I’ll now open up for questions.

22