boundary waters canoe area wilderness and adjacent lands
TRANSCRIPT

FUELS RISK ASSESSMENT OF BLOWDOWN
FUELS RISK ASSESSMENT OF BLOWDOWN
In
Boundary Waters Canoe Area Wilderness
And Adjacent LandsFebruary 4, 2000
Team Leader – Tom Leuschen, Fire Vision, Okanogan National Forest, Region 6
RERAP Analyst – Tom Wordell, Walla Walla Ranger District, Umatilla National Forest
Region 6
http://www.superiornationalforest.org/july4thstorm1999/bwcara/bwcawra.html (1 of 128) [7/7/2004 1:37:39 PM]

FUELS RISK ASSESSMENT OF BLOWDOWN
FARSITE Analyst – Dr. Mark Finney, Systems for Environmental Management
Missoula, Montana
Canadian Fire Index Analyst – Doug Anderson, Minnesota State Department of Natural
Resources – Division of Forestry
GIS Specialist – Tim Aunan, Minnesota State Department of Natural Resources
Superior NF Fuels/Fire Consultant - Paul Tine’, Fuels Specialist Superior National Forest
Table of Contents
Vicinity and Project Map *
OBJECTIVES *
ACKNOWLEDGEMENTS *
ANALYSIS PROCESS *
ANALYSIS TOOLS *
RERAP *
FARSITE *
FlamMap *
Fire Family Plus *
NDVI *
Executive Summary *
Figure 1 Spring Fire Behavior Thresholds (May – June) *http://www.superiornationalforest.org/july4thstorm1999/bwcara/bwcawra.html (2 of 128) [7/7/2004 1:37:39 PM]

FUELS RISK ASSESSMENT OF BLOWDOWN
Figure 2 Fall Fire Behavior Thresholds (July – October) *
Recommendations *
Suppression Tactics *
Wildland Fire Use *
Urban Interface *
Treatment Opportunities *
Data Needs *
Planning Need: *
Training Needs *
Further Study Needed *
Description of Situation *
Boundary Waters Canoe Area Wilderness *
Derecho *
Figure 3A 1247 CDT Reflectivity Figure 3B 1317 CDT Reflectivity *
Figure 4A 1247 CDT Velocity Figure 4B 1322 CDT Velocity *
Damage *
Blowdown History *
Fire Season *
Fuel Profiles *
http://www.superiornationalforest.org/july4thstorm1999/bwcara/bwcawra.html (3 of 128) [7/7/2004 1:37:39 PM]

FUELS RISK ASSESSMENT OF BLOWDOWN
Fire Behavior *
NVDI *
Figure 5 NVDI Departure From Average Greenness *
Fire Occurrence *
Figure 6 Fire Occurrence Areas *
Suppression *
Decision Criteria *
Figure 7 Local Large Fire History *
Figure 8a Spring Fire Behavior Thresholds (May – June) *
Figure 8b Fall Fire Behavior Thresholds (July – October) *
Energy Release Component (ERC) *
Haines Index *
Thresholds for Implementation of Public and Employee Safety Restrictions *
Figure 9a NFDRS Indices *
Figure 9b Monthly Mean Ignition Component *
Figure 9c Ignition Component *
Figure 9d Burning Index *
Pocket Cards *
Figure 10a Pocket Card (May & June) *
Figure 10b Pocket Card (July thru Oct) *
http://www.superiornationalforest.org/july4thstorm1999/bwcara/bwcawra.html (4 of 128) [7/7/2004 1:37:39 PM]

FUELS RISK ASSESSMENT OF BLOWDOWN
Figure 11 Rainfall for 1976 *
Rainfall *
Figure 12 Departure from Normal Rainfall 1976 *
Figure 13 Rainfall for 1995 *
Figure 14 Rainfall for 1988 *
Findings *
Climatology *
Figure 15 Wind Direction *
Spatial Analysis *
Figure 16 FlamMap Flame Length Analysis *
FARSITE calibration *
Figure 17 FARSITE calibrations using the Little Gabbro Lake fire (1995). *
Figure 18 FARSITE calibrations using the White Feather Lake fire (1996). *
Figure 19 Blowdown Fire Growth *
Fuel treatment locations *
Figure 20 Patchwork Treatment Pattern *
Figure 21 Patchwork Treatment Fire Simulation *
Conclusions *
Recommendations *
http://www.superiornationalforest.org/july4thstorm1999/bwcara/bwcawra.html (5 of 128) [7/7/2004 1:37:39 PM]

FUELS RISK ASSESSMENT OF BLOWDOWN
Suppression Tactics *
Wildland Fire Use *
Urban Interface *
Treatment Opportunities *
Data Needs *
Planning Need: *
Training Needs *
Further Study Needed *
References *
Glossary *
Appendix A *
Project Maps *
Appendix B *
RERAP Assessment *
INTRODUCTION *
RERAP TRANSECT LINES *
WINDS *
TERM DATA (Fire ending event data) *
Rates of Spread *
http://www.superiornationalforest.org/july4thstorm1999/bwcara/bwcawra.html (6 of 128) [7/7/2004 1:37:39 PM]

FUELS RISK ASSESSMENT OF BLOWDOWN
RERAP OUTCOMES AND RESULTS *
Risk Displayed Based on W, SW, & S Wind Directions *
BOW LAKE MMA – TRANSECT LINE 1B / SW TO NE SPREAD DIRECTION / FUEL MODELS 5, 8, 9, 10, WATER *
Risk Displayed Based on W, SW, & S Wind Directions *
BOW LAKE MMA – TRANSECT LINE 1B / SW TO NE SPREAD DIRECTION / FUEL MODELS 5, 8, 9, 10, WATER *
Risk Displayed Based on W, SW, & S Wind Directions *
BOW LAKE MMA – TRANSECT LINE 03 / SW TO NE SPREAD DIRECTION *
Risk Displayed Based on W, SW, & S Wind Directions *
BOW LAKE MMA – TRANSECT LINE 03 / SW TO NE SPREAD DIRECTION *
FIRE BEHAVIOR THRESHOLDS *
Spring Fire Behavior Thresholds *
Fall Fire Behavior Thresholds *
SUMMARY *
RECOMMENDATIONS *
Appendix C *
Spatial Analysis of Fire Behavior *
Appendix D *
Canadian Indices *
Canadian Fire behavior Index Thresholds *
http://www.superiornationalforest.org/july4thstorm1999/bwcara/bwcawra.html (7 of 128) [7/7/2004 1:37:39 PM]

FUELS RISK ASSESSMENT OF BLOWDOWN
Spring Fire Behavior Thresholds *
Fall Fire Behavior Thresholds *
Appendix E *
Climatology *
Large Fire Data *
Appendix F *
Fire Management Tools *
Risk Displayed Based on N, NE, & E Wind Directions *
BOW LAKE MMA – TRANSECT LINE 01A / NE TO SW SPREAD DIRECTION *
Risk Displayed Based on W, SW, & S Wind Directions *
BOW LAKE MMA – TRANSECT LINE 1 / SW TO NE SPREAD DIRECTION / FUEL MODELS 5, 8, 9, 10, WATER *
Risk Displayed Based on W, SW, & S Wind Directions *
BOW LAKE MMA – TRANSECT LINE 1B / SW TO NE SPREAD DIRECTION / FUEL MODELS 5, 8, 9, 10, WATER *
Risk Displayed Based on N, NW and W Wind Directions *
BOW LAKE MMA – TRANSECT LINE 2A / NW TO SE SPREAD DIRECTION / FUEL MODELS 13, 10, WATER *
Risk Displayed Based on S, SE and E Wind Directions *
BOW LAKE MMA – TRANSECT LINE 2A / SE TO NW SPREAD DIRECTION / FUEL MODELS 13, 10, WATER *
Risk Displayed Based on S, SE & E Wind Directions *
BOW LAKE MMA – TRANSECT LINE 2B / SE TO NW SPREAD DIRECTION / FUEL MODELS 5, 8, 9, 10, WATER *
http://www.superiornationalforest.org/july4thstorm1999/bwcara/bwcawra.html (8 of 128) [7/7/2004 1:37:39 PM]

FUELS RISK ASSESSMENT OF BLOWDOWN
Risk Displayed Based on N, NW, & W Wind Directions *
BOW LAKE MMA – TRANSECT LINE 02B / NW TO SE SPREAD DIRECTION / FUEL MODELS 5, 8, 9, 10, WATER *
Risk Displayed Based on W, SW, & S Wind Directions *
BOW LAKE MMA – TRANSECT LINE 03 / SW TO NE SPREAD DIRECTION *
Risk Displayed Based on N, NE, & E Wind Directions *
BOW LAKE MMA – TRANSECT LINE 03 / NE TO SW SPREAD DIRECTION *
Risk Displayed Based on N, NE, & E Wind Directions *
BOW LAKE MMA – TRANSECT LINE 04A / NE TO SW SPREAD DIRECTION *
FUEL MODEL 10, 13, WATER *
Risk Displayed Based on W, SW, & S Wind Directions *
TRANSECT LINE 05 / SW TO NE SPREAD DIRECTION / FUEL MODELS 5, 8, 9, 10, WATER *
Pocket Card (July – October) *
Pocket Card (July – October) *
Risk Assessment Flow Chart *
http://www.superiornationalforest.org/july4thstorm1999/bwcara/bwcawra.html (9 of 128) [7/7/2004 1:37:39 PM]

FUELS RISK ASSESSMENT OF BLOWDOWN
Vicinity and Project Map
http://www.superiornationalforest.org/july4thstorm1999/bwcara/bwcawra.html (10 of 128) [7/7/2004 1:37:39 PM]

FUELS RISK ASSESSMENT OF BLOWDOWN
OBJECTIVES
Provide an assessment of the fuel hazard created by the July 4th, 1999 windstorm. This windstorm resulted in widespread blowdown and heavy fuel loading across 478,000 acres (193,447 hectares) of the forest, most of which fell within the Boundary Waters Canoe Area Wilderness. This situation has created the potential for extreme fire danger conditions throughout the blowdown area with the potential to threaten lives and property both within the BWCAW as well as adjacent urban interface areas along Gunflint Trail Corridor, and other areas of development and high visitor use.
ACKNOWLEDGEMENTS
The authors would like to thank the following individuals for their valuable assistance in this analysis and development of this document: Terry Curran, Matt Myers, Jay Leather and Grahme Gordon of the Ontario Ministry of Natural Resources for their gracious sharing of Canadian experiences with, and responses to blowdown events; Dave Tomalak and Craig Sanders of the Duluth Office of the National Weather Servie for the imagery and meteorological information about the July 4th derecho event; Tom McCann and Terry Gokee of the Superior National Forest for additional GIS support; Frank Knowles and Tom Kaase of the Minnesota Interagency Fire Center for computer support; John Stivers, R-8 Fuels Specialist, for his initial fuels assessment and photographs; Marc Wittala and Don Carlton for their advice and support in the use of the Rare Event Risk Assessment Process; Warren Heilman for Haines Index values and climatological data, and finally Dan Olsen and Andi Koonce from R-9 and Mike Hilbruner and David Bunnell from the Washington Office for their overall guidance, suggestions. Without their help we could not have properly addressed many of the issues contained in this report.
ANALYSIS PROCESS
The process used in this analysis required lengthy study and discussions with Paul Tine’ to examine past assessments he had done to develop and complete the Superior National Forest Fire Management Plan. Weather patterns are unique in this area, and understanding how they contributed to fire spread in the project area is critical. Our thanks to Paul Tine’ for his patience in explaining these processes. All of the previous work he did in fuel modeling and risk assessments laid a foundation for us to work from. He also has an extremely valuable library of the local ecosystem function and fire history that was a great help to us in understanding how fire occurs and spreads in this area. Studying these references gave us additional information on previous blowdown and subsequent fires. Fire occurrence is examined to establish any trends that may exist in fire cause and location. A study of weather conditions occurring during past large fires is conducted to determine weather parameters needed to support rapid fire spread. These parameters are then examined in Fire Family Plus to find critical thresholds.
Monthly weather data is analyzed to find different trends and lead to the verification of local opinion that two distinct fire seasons normally occur through the summer. This is critical information needed in development of fire ending events to be used in the analysis process.
ANALYSIS TOOLS
RERAP
Rare Event Risk Assessment Process is used to compare fire growth with fire ending events to determine the risk associated with management decisions. In this analysis RERAP is used to determine the changes in risk associated with the blowdown. The results obtained from this analysis are displayed in matrix tables to assist with Wildland Fire Use and suppression decisions. Complete matrix tables, graphs and documentation of all of the RERAP transect lines is included in Appendix B.
FARSITE
Fire Area Simulator is a model for spatially and temporally simulating the spread and behavior of fires under conditions of heterogeneous terrain, fuels and weather. Fire growth and behavior scenarios can be developed relatively quickly. Effects of ignition locations, fire weather patterns, and fuel or prescribed fire treatments are examined
http://www.superiornationalforest.org/july4thstorm1999/bwcara/bwcawra.html (11 of 128) [7/7/2004 1:37:39 PM]

FUELS RISK ASSESSMENT OF BLOWDOWN
for comparing different fire management alternatives. Fire spread patterns and behavior under historic weather are determined. Comparisons are made of the effectiveness of different suppression strategies for containing fires under varying weather conditions. Suppression efforts are compared for areas with and without fuel treatment programs. The model creates maps that display the perimeter of the fire after a given period of time, rate of spread, fireline intensity, flame length, and heat per unit area. In addition, severe fire behavior, such as torching, spotting, and crowning can be displayed.
The assessment for the BWCAW blowdown utilizes FARSITE in several ways. Simulations are done which display fire spread, perimeters, and characteristics for both Pre-blowdown and current conditions. Changes that would occur to fuel profiles as a result of recommended treatments are also modeled to reflect how effective the treatments will be. Runs are made to reflect the different weather parameters used in the RERAP scenarios.
Calibration of FARSITE is done by comparing runs to known fire perimeters and associated times on historic fires in the area.
Complete results of the FARSITE simulations are in Appendix C.
FlamMap
A model, recently developed to make fire behavior calculations for all locations on a landscape using GIS data inputs for terrain and fuels. GIS data required for FlamMap are the same as for FARSITE. The purpose of FlamMap is to generate fire behavior data that are comparable across the landscape for a given set of weather and/or fuel moisture data inputs. The fire behavior models in FlamMap are used to make calculations for all cells of a raster landscape, independently of one another. That is, there is no contagious process that accounts for fire movement across the landscape or among adjacent cells. FlamMap only calculates the instantaneous behavior of a fire occurring at each location given local weather inputs and allow comparisons of fire behavior across a landscape and are useful for distinguishing hazardous fuel and topographic combinations.
Complete results of the FlamMap analysis are in Appendix C.
Fire Family Plus
Fire Family Plus is a software program used to analyze fire weather parameters associated with fire occurrence data. In this analysis it is used to determine fire behavior thresholds.
NDVI
A method of assessing fire danger by utilizing Normalized Difference Vegetation Index (NDVI) data. This information is obtained from NOAA polar-orbiting weather satellites that use Advanced Very High Resolution Radiometers (AVHRR) to analyze infrared reflected light. This information is then used to determine the condition or greenness of vegetation and how it dynamically varies throughout the fire season. This information can be visually displayed to show Relative Greenness (RG) and Departure from Average (DA) greenness. Relative Greenness portrays how green each one-kilometer square pixel is compared to that pixel’s historic range of greenness. Departure from Average portrays how green each pixel is compared to the average greenness value for the same period.
Based on the results from these analysis tools current conditions are discussed in terms of risk and potential fire behavior. Recommendations are made for proposed plans and activities to reduce the risk of large fire impacts.
http://www.superiornationalforest.org/july4thstorm1999/bwcara/bwcawra.html (12 of 128) [7/7/2004 1:37:39 PM]

FUELS RISK ASSESSMENT OF BLOWDOWN
Executive Summary
FUELS RISK ASSESSMENT OF
BLOWDOWN
In
Boundary Waters Canoe Area Wilderness
And Adjacent Lands
On the afternoon of July 4, 1999 the Forest experienced a rare "derecho" event that left significant blowdown damage in the BWCAW and adjacent lands.
Damage was classified into three distinct categories, heavy, moderate, and light.
The worst damage occurred within the BWCAW area where a swath approximately 30 miles (48 kilometers) long and 4-12 miles (6-19 kilometers) wide lying in a WSW to ENE direction occurred, and now poses a significant threat to the Gun Flint Trail corridor, Canadian border, and other areas of concern.
It’s not a matter of IF, but WHEN a large significant wildland fire will become a threat to the Gunflint Corridor.
Fire season in the BWCAW tends to have two distinct periods. One beginning in May and continuing through June. Then, early July rains, combined with full green-up, interrupt fire season and normally provide enough moisture to stop most fires allowing fire resources an opportunity to contain large fires if necessary. The second Period begins in July and continues through October.
Spring fires still occur because the spring green-up has not yet begun, especially with humidities lower than 30 percent, and winds exceeding 15 to 20 miles per hour (24 to 32 kilometers per hour)(Sando and Haines 1972).
Late summer and early fall fires come when soil moisture reserves are often much lower. Summer and early fall are normally the heaviest rainfall periods of the year, so it is only in years of exceptional drought such as 1910, 1936, 1961, 1974, and 1976 that major summer or early fall fires can occur.
http://www.superiornationalforest.org/july4thstorm1999/bwcara/bwcawra.html (13 of 128) [7/7/2004 1:37:39 PM]

FUELS RISK ASSESSMENT OF BLOWDOWN
Fuel profiles have been changed dramatically as a result of the blowdown. Before the wind event a Fire Behavior Prediction System model 10 best represented the fuels where Jack pine (assumed to be older stands), aspen, birch stands with conifer component, and some white/red pine stands with high stand densities occur.
Post blowdown FBPS slash fuel model 13 is used to represent the heavy and moderate blowdown areas.
Fire cause records from 1981 – 1995 list 91 lightning fire starts from a total of 159 fires in the BWCAW. The result is 57 % of fires were started by lightning and 43% started from human causes. The highest occurrence of fires is in the west half of the BWCAW and south of Ely. The occurrence of human caused fires needs to be closely analyzed and the results used to modify prevention strategies within the Wilderness to reduce the number of human caused fire starts.
Lightning strikes in the blowdown areas may be more successful in initiating wildland fires than in past conditions. Lightning that strikes outside of the precipitation zone will create ignitions. Fire intensities in these heavy fuels will be considerably higher than in previous surface fuels and will exceed the capabilities of hand crews. Multiple lightning starts will occur more often and tend to burn together more frequently creating larger fire occurrences, which will move easily to plume-dominated fires.
Most significant fire events in the past have occurred in boreal mix consisting of spruce, balsam fir, aspen, birch, and jack pine, with dead balsam contributing to flammability. These fires maintained relatively low rates of spread until a wind event of at least 10-15 mph (16-24 kph), accompanied by relative humidities below 30% occurred. These conditions accelerated rates of spread and intensity and moved the fire into the crowns. This crown fire would then spread at rates of 1 ½ to 7 miles (2-11 km) a day. Most of the lakes and waterways were not wide enough to prevent spotting across them and they failed to slow spread significantly. Spotting occurred frequently ¼ to ½ mile (.4 to .8 km) ahead of the fires. Spotting on islands assisted the fires in crossing wider lakes and waterways.. Fire shapes took on the elongated elliptical characteristics of wind driven fires. The winds driving these fires seem to occur the majority of the time out of the SW.
Resistance to control is very high due to the amount of handwork required to separate the abundance of large fuels. Fires that are in the blowdown under these very high to extreme conditions can also be expected to rapidly become plume dominated and will be driven by extreme fire behavior. This could include smoke columns reaching heights of 30,000 to 50,000 feet (9,144 to 15,240 meters); strong indrafts on the fire perimeter which could quickly change to downdrafts up to 40 miles an hour (64 kph); fire whirls along the fire perimeter; long range spotting up to three miles (4.8 k) or more; and high rates of spread.
Spotting is expected to reach the same distance of ¼ to ½ mile that was achieved prior to the blowdown wind event. However, the increased fuel loading will also increase the potential for plume dominated fire characteristics, lofting firebrands high into the atmosphere. This, in turn, increases the likelihood of longer range spotting. How this fuel profile will affect the likelihood of firebrands crossing waterways is unknown. Current fire spread and fire behavior models do not model plume-dominated fires. Fires in the blowdown will have a tendency to move to plume dominated conditions rapidly. Observed fire behavior on the Dryden #18 fire in Canada in similar fuels, and moderate weather conditions, is described as slow, but steady, with spread rates on the afternoon of July 1 and 5, 1974 at 37 chains per hour (12.4 m/min).
The only safe suppression option on many fires will be the use of aircraft for water and retardant drops. This could be an effective tool to slow spread, especially with the abundance of water available in short turn-around times. The most effective strategy may be to treat fuels ahead of the fire front with retardant and water to slow the start and spread of spot fires, and support ground and aerial burnout operations. Seldom will these tactics stop spread, but could buy time for the burn out operations to commence from a location that would offer adequate escape routes and safety zones for firefighters and burning crews.
In the future, initial attack efforts can expect to need more water application capabilities. Experience in similar fuels has demonstrated that fifteen minutes without water support from either aircraft or portable pumps can make a dramatic difference in suppression efforts.
Fire Family Plus, a software program used to analyze fire weather parameters associated with fire occurrence data, was used to determine fire behavior thresholds. The thresholds for significant fire growth are listed below. Fire occurrence is examined to establish any trends that may exist in fire cause and location. A study of weather conditions occurring during past large fires is conducted to determine weather parameters needed to support rapid fire spread. Fires occurring with weather parameters or
http://www.superiornationalforest.org/july4thstorm1999/bwcara/bwcawra.html (14 of 128) [7/7/2004 1:37:39 PM]

FUELS RISK ASSESSMENT OF BLOWDOWN
fire indices above the thresholds listed have the potential to burn intensely or spread rapidly. These thresholds correlate well with the local fire history, and the potential for large, rapidly spreading fires. These thresholds can be used as general guidelines to help warn emergency services managers, fire managers and firefighters of impending fire danger. The 90% threshold relates to "very high" fire danger while the 97% threshold relates to "extreme" fire danger.
Figure 1 Spring Fire Behavior Thresholds (May – June)
Energy Release Component (ERC) 90% = 36 97% = 46
Burning Index (BI) 90% = 46 97% = 56
Relative Humidity (RH) 90% = 20% 97% = 16%
Temperature 90% = 83 degrees 97% = 85 degrees
100 Hour Fuels 90% = 12% 97% = 10%
1000 Hour Fuels 90% = 16% 97% = 14%
20 Foot Wind Speeds 90% = 12 mph 97% = 15 mph
Figure 2 Fall Fire Behavior Thresholds (July – October)
Energy Release Component (ERC) 90% = 32 97% = 37
Burning Index (BI) 90% = 36 97% = 44
Relative Humidity (RH) 90% = 30% 97% = 25%
Temperature 90% = 80 degrees 97% = 84 degrees
100 Hour Fuels 90% = 14% 97% = 12%
1000 Hour Fuels 90% = 18% 97% = 16%
20 Foot Wind Speeds 90% = 12 mph 97% = 15 mph
All weather elements, NFDRS and Canadian fire danger / behavior indices, at the 90th percentile level and above, serve as good indicators or thresholds for potential of extreme fire behavior and spread (Figures 1 & 2). These conditions will cause all containment and suppression actions to be unsuccessful in the blowdown areas at the head and flanks of the fire. It may be possible to establish anchor points to the rear of the fire.
http://www.superiornationalforest.org/july4thstorm1999/bwcara/bwcawra.html (15 of 128) [7/7/2004 1:37:39 PM]

FUELS RISK ASSESSMENT OF BLOWDOWN
The ERC listed in figures 1 & 2 are based on using National Fire Danger Rating System fuel model G. By changing to NFDRS fuel model I to represent the blowdown, the ERC is changed in spring to 229 at the 90th percentile and 271 at the 97th percentile. In fall the 90th percentile is 206 and the 97th percentile is 236. These new ERC values are close to 6 six times higher than they were prior to the blowdown. This is a good indicator of the change in fire intensity that can be expected as a result of the blowdown.
As soon as the IC for NFDRS Fuel model I reaches the 15th percentile weather, or an IC of 1, fires will start to spread and require Initial attack activities. Time and experience will show how effective these efforts will be. Initiation of restrictions should be considered at this time.
Containment difficulty will steadily increase as the IC approaches the monthly average. The 40th percentile IC value is 8. This would present a good threshold opportunity to again determine if additional restrictions need to be invoked. The 70th percentile IC (16) and above show an increase in the rate of fire spread, and intensity and should be considered a point at which restrictions are mandatory. At the 90th percentile weather restrictions should be in place in all areas, including areas outside the blow down.
Haines index at 5 or 6, or KBDI equal to or greater than 150 any time in the fire season is a good indicator of rapid spread and large fire potential.
The most striking factor in the climatic conditions preceding seven historic fires in the north-central region is the decreased precipitation over a three to eight month period. Precipitation amount was a consistently good climatic indicator (Haines, Sando 1969).
Short-term temperature fluctuations do appear to be highly significant. Temperatures were well above normal during the ten days before the great historic fires. Lowered relative humidity in most cases also appears to have contributed to the drought conditions.
Winds blowing 13-18 MPH (21-29 km/h) develop a definite wind direction pattern. The majority of these winds are incoming from the south to the northwest
Below normal precipitation for three to eight months, below normal relative humidity for ten days or more, or above normal temperatures for ten days or more are all indicators that fuels are becoming very dry and available for consumption, and are therefore also good indicators of potential problem fire behavior. (See Appendix E)
If two or more of these elements occur at the same time, any new fire starts in the blowdown can be expected to create fire behavior that will defy all containment actions. If blowdown fires under these conditions are accompanied by winds in excess of ten miles per hour they will move at rapid rates of spread (36 chains per hour up to seven miles a day or more).
Fires in the blowdown can be expected to quickly move to plume dominated fire behavior, even in moderate fire weather conditions.
Fires in the blowdown will burn at a higher, prolonged intensity, with an increased daily spread rate at lower fire danger levels, compared to the rapid spread crown fires that are associated with high winds at high fire danger levels in past fires, prior to the blowdown. However, it is not expected to reach the same rapid spread rates that were achieved by previous standing timber with crowning and spotting associated with winds exceeding 10 MPH. RERAP predicts a dramatic increase in risk for future fires burning within the blowdown areas. It predicts these fires will have a common daily spread that is ten to twenty times greater than fires burning in Fuel Model 10. That means that large fire growth will occur under moderate weather conditions and will not be dependent on wind events. Fires occurring in the blowdown fuels will tend to grow slower than wind driven crown fires in Fuel Model 10, but will continue to increase in size under a broader range of weather conditions, and have the potential over time to cover more distance and acres. A steady fire growth can be expected during the majority of the fire season. Fire perimeters should be more circular and may tend to out-flank natural barriers. The most critical element to be alert for is the tendency to move to a plume dominated fire and the associated extreme fire behavior.
Recommendations
http://www.superiornationalforest.org/july4thstorm1999/bwcara/bwcawra.html (16 of 128) [7/7/2004 1:37:39 PM]

FUELS RISK ASSESSMENT OF BLOWDOWN
Suppression Tactics
● Suppression tactics will need to be re-analyzed with an eye on firefighter safety in all areas where access and egress is an issue.
● Traditional suppression tactics need to be re-evaluated to determine if they still apply in blowdown areas.
● New suppression tactics need to be developed which rely heavily on the use of water delivery aircraft in conjunction with aerial ignition burnout devices and ground sprinkler systems.
● The most effective strategy may be to treat fuels ahead of the fire front with retardant and water to slow the start and spread of spot fires.● Take advantage of any locations that have had fuel reduction treatments or recent wildland fires.
Wildland Fire Use
● In multiple fire situations, fire managers should take advantage of the situation by choosing fires where they have the best chance of being effective with their suppression response, and consider managing other, more difficult situations that may be unsafe for firefighters, as wildland fire use.
● Utilize a new flow chart in the decision-making stages for Wildland Fire Use. An example is in Appendix F.
Urban Interface
● All fire and emergency services personnel, on a daily basis, should use Pocket Cards during fire season to track the daily fire severity. This is a good indicator of many weather parameter thresholds. Full size pocket cards, available for copying, can be found in Appendix F.
● Information Officers should post fire severity daily on a designated Internet Web site and in designated areas in communities threatened by the blowdown fuel conditions. They should include the following information:
Fact sheets on present fire and fuels conditions
Indicators of extreme fire behavior
High-risk areas by time of year
NVDI values
Post picture of timber & slash fires
● Handouts should also be made available to communities surrounding the BWCAW including:
Brochures
Pocket cards
http://www.superiornationalforest.org/july4thstorm1999/bwcara/bwcawra.html (17 of 128) [7/7/2004 1:37:39 PM]

FUELS RISK ASSESSMENT OF BLOWDOWN
NVDI values
Treatment Opportunities
● Opportunities for fuels treatment inside and outside the BWCAW, including harvest and Wildland Fire Use, should be pursued to help break up the continuity of the blowdown fuels.
● Opportunities for fuels treatment inside the BWCAW, including Wildland Fire Use and manage ignited prescribed fire, should be pursued to help break up the continuity of the blowdown fuels.
● Opportunities for fuels treatment outside the BWCAW, should include the same options, and also include harvest and.● Each landowner needs to take whatever actions they are capable of to remove the hazardous fuels conditions around their structures to offer some protection from
fast moving, high intensity fires. ● The U. S. Forest Service needs to continue to develop and implement fuel removal activities on their lands, with special attention to the areas west and south of the
Gunflint Trail road. This should include management ignited prescribed fire and mechanical removal. Fire approaching this and similar areas through the blowdown will not offer much time for all residents and visitors to evacuate down the sixty-mile highway.
● Prescribed fire treatments within the BWCAW need to begin as soon as possible in large blocks designed to treat 8,000 – 10,000 acres (3,238 – 4,047 ha) a year.
● Fuel treatments in the BWCAW need to focus on strategic placement of prescribed fire to affect fuel model change, and slow fire spread. The relationships between all of these treatment areas needs to be carefully considered so that the most efficient mix of treatment areas is selected which will provide improved resistance to control with each project implementation
● A patchwork of fuel treatment units can be designed for slowing progress throughout the blowdown fuels. The pattern is more efficient if the treatment units are strategically located next to lakes.
Data Needs
● Fuel inventory work is needed to better characterize the fuel profile in the blowdown areas. Roger Ottmar from the Pacific Northwest Research Laboratory, Seattle, has been tasked to inventory the fuels and his team should be able to provide much needed information on fuel loading. Preliminary results indicate fuel loadings between 9 tons/acre in areas of sparse blow down, to 66 tons/acre in heavy blow down areas. Custom fuel models should be considered, however without actual fire behavior observations, predictions will still be academic.
● NDVI images from June through August 1999 were reviewed and clearly showed the difference in greenness between the blowdown fuels and surrounding vegetation. These images should be downloaded and monitored weekly during the fire season to assess fire danger in this area. Departure from Average images should provide a good idea for how much different the fuels are from historic averages. Relative Greenness images will help managers determine how the blowdown fuel moistures compares to surrounding vegetation and when they might expect fire activity in the blowdown areas.
● Acquire recent satellite vegetation classification data at 30 meter resolution for fuels classification.
● Acquire digital ortho quarter quads from Minnesota Department of Natural Resources for use as a planning reference tool.● The Forest has good hard-copy records of wildland fires and in some cases individual fire progression maps. These should all be digitized into the GIS library before
they are lost. These are valuable maps which can be used in the future for other planning efforts.
Planning Need:
http://www.superiornationalforest.org/july4thstorm1999/bwcara/bwcawra.html (18 of 128) [7/7/2004 1:37:39 PM]

FUELS RISK ASSESSMENT OF BLOWDOWN
● Close coordination with local agencies and homeowners needs to be stressed to ensure evacuation plans are prepared and practiced in advance and implemented in a timely manner if the need arises.
● The hiking trails through the BWCAW should be closed during periods of high fire danger, until adequate fuel reduction treatments have occurred to provide areas that will slow an oncoming fire to allow escapement of wilderness trail users.
● The communication links in the Gunflint Corridor need to be assessed and improvements recommended in order to establish reliable radio, telephone and television links.
● Acquire increased capability for water delivery aircraft for use in both wildland fire suppression and prescribed fire use, primarily to assist in reducing spotting. This capability needs to be available on site during high fire danger to reduce response times to the fire.
● Acquire Necessary equipment, including aircraft, to provide the capability to use aerial ignition devices for burnout operations. This capability needs to be available on site during high fire danger to reduce response times to the fire.
● Campfire restrictions need to be initiated in areas of moderate to heavy blowdown. Use of backpacking camp stoves should be encouraged. The public needs to understand that conditions have dramatically changed in the blowdown areas and "special regulations" are needed to protect them and those recreating around them.
● Redo the BWCAW videos to include an explanation of the conditions that now exist, what special regulations are in place, and briefly, how they can protect themselves in case of a fire.
Training Needs
● Training should be provided to Fire Use practitioners in the aerial application of fire in slash (model 12 & 13) models on landscape size burns. This should be done by recruiting a burning cadre experienced in large burns in these types of fuels.
● Train Information Officers on the unique fire potential situation that presents itself as a result of the blowdown event. These personnel need to be available all fire season to develop and implement strategies to keep emergency services, neighboring communities, outfitters, BWCAW visitors, and the general public informed on a daily basis of the fire danger and status of any fires in, or adjacent to the blowdown areas. This needs to be coordinated with the fire prevention effort and Wilderness permitting system.
● Wilderness recreationists need to be well informed of the risks they are assuming by choosing to venture into this high fire risk area. They need to be trained on how to conduct themselves to prevent fires, and how to protect themselves if they come upon a fire.
● Recreationists, private landowners, and area visitors should be trained to identify potentially hazardous fire situations and have plans in place to evacuate to safe areas such as the lakes. Keep in mind the watercraft that may be needed to withstand the high wind conditions that would likely be associated with a fire event of this magnitude.
● Training on how to protect yourself should focus on the following target groups
In-house/outfitters
Home associations
Recreationists
http://www.superiornationalforest.org/july4thstorm1999/bwcara/bwcawra.html (19 of 128) [7/7/2004 1:37:39 PM]

FUELS RISK ASSESSMENT OF BLOWDOWN
Forest Service employees
Emergency services personnel
Further Study Needed
● Additional fire growth modeling is needed to better predict fire movement under a variety of conditions. Dr. Mark Finney has been tasked to utilize FARSITE, a fire growth program he developed, to gain some understanding of how fires will spread and spot in the blowdown fuels. This information should prove very helpful to calibrate rates of spread under various weather conditions. Once this task has been completed, RERAP runs should be reviewed and updated, if necessary.
● Check weather data sets for accuracy, especially prior to 1973.
● Check NFDRS indices for accuracy, especially prior to 1973.
● Careful fire monitoring will need to occur whenever fires burn in the blowdown areas. Well-documented fire growth perimeters, hourly weather observations, crowning and spotting characteristics will greatly enhance fire behavior predictions. It is recommended that RERAP analyses be reviewed and updated, if needed, after accurate information becomes available on fire growth in the blowdown fuels.
●
Description of Situation
Boundary Waters Canoe Area Wilderness
The BWCAW is comprised of approximately 1,000,000 acres (404,700 ha) within the Forest. The Forest is principally composed of stands of jack, eastern white and red pine, white spruce, birch, aspen and balsam fir. This "boreal forest" is typically considered a high severity-lethal, long return interval fire regime, except for the mixed red and white pine stands, which occupy about five percent of the area BWCAW. Before European settlement these stands on drier sites were subject to repeated surface fires of light to moderate intensity at intervals ranging from 10 to 50 years. Most of the vegetation has adaptations to these fire regimes such as the ability to resprout from roots, light seeds able to blow in, or serotinous cones.
Derecho
On the afternoon of July 4, 1999 the Forest experienced a rare "derecho" event that left significant blowdown damage in the BWCAW and adjacent lands. This meteorological term is defined as a widespread convective windstorm consisting of a complex of thunderstorms that develop into a long-lived squall line with straight-line winds, which may extend for hundreds of kilometers along the path of the system. Wind speeds over 90 M.P.H. (145 km/h) in the early afternoon coupled with heavy rains (approximately 4" or 10.2 cm) later that evening was the result of this rare event.
Figure 3A is a reflectivity image of the line of storms taken at 12:47 PM (Central Time) on July 4, 1999, as they were moving into the blowdown area. In addition to the high reflectivities, note the bow like structure of the line. This bow like structure is a good indicator of strong straight-line winds. Figure 3B is the same image type at 1:17 PM as the storm was moving away from the blowdown area. The bow like structure is now more prevalent.
Figure 3A 1247 CDT Reflectivity Figure 3B 1317 CDT Reflectivity
http://www.superiornationalforest.org/july4thstorm1999/bwcara/bwcawra.html (20 of 128) [7/7/2004 1:37:39 PM]

FUELS RISK ASSESSMENT OF BLOWDOWN
Figure 4 A is a storm velocity image of the line of storms as they entered the blowdown area at 12:47 PM. Notice the bright red wind colors, denoting wind speeds in excess of 75mph. Red colors represent winds blowing away from the radar, while green and blue represent winds blowing towards the radar. Figure 4B is a storm velocity image taken at 1:22 PM as the line of storms were passing through Cook County. Notice that again, the storm intensified between 12:47 PM and 1:22 PM.
Figure 4A 1247 CDT Velocity Figure 4B 1322 CDT Velocity
Damage
Damage was classified into three distinct categories, heavy, moderate, and light. Numerous aerial reconnaissance flights with both fixed and rotor wing aircraft were made for early assessments of damage.
http://www.superiornationalforest.org/july4thstorm1999/bwcara/bwcawra.html (21 of 128) [7/7/2004 1:37:39 PM]
FUELS RISK ASSESSMENT OF BLOWDOWN
Light damage (33% or less of overstory damaged) affected approximately 52,894 acres (21406 ha) outside the Boundary Water Canoe Area Wilderness and 114,546 acres (46,357 ha) in the BWCAW. Despite receiving the "light damage" label it is important to recognize and consider the dead balsam component that exists already under many of these conditions.
Moderate damage (33-67% damage to the overstory) affected approximately 39,201 acres (15,865 ha) outside the Boundary Water Canoe Area Wilderness and 88,492 acres (35,813 ha) in the BWCAW. Much of this damage category is aspen-mixed conifer impacted areas. Patch sizes range from a few acres up to hundreds of acres in size.
Heavy damage (67% or more canopy damage) impacted 20,056 acres (8,117 ha) outside the Boundary Water Canoe Area Wilderness and 172,757 acres (69,915 ha) in the BWCAW. Patch sizes range from several acres to over 80,000 acres (32,376 ha).
The worst damage occurred within the BWCAW area where a swath approximately 30 miles (48 km) long and 4-12 miles (6-19 km) wide lying in a WSW to ENE direction occurred, and now poses a significant threat to the Gun Flint Trail corridor, Canadian border, and other areas of concern. What the Forest Service is able to do in terms of a meaningful fuel treatment strategy will affect the obvious evacuation considerations. It’s not a matter of IF, but WHEN a large significant wildland fire will become a threat to the Gunflint Corridor.
The damage is heavy in both conifer and hardwood types and much of the standing timber was "snapped off" at 20-30 feet (6-9 m) above ground. There are millions of standing "snaps" and standing "hinged" trees. In many areas, significant dead balsam material is lying under this recent "added accumulation" creating a fuel bed estimated between (0-100+ tons per acre (0-224 t/ha) that is arranged anywhere from 3-20 feet (1-6 m) deep. With the storm occurring in July during full leaf condition, the curing needles and hardwood leaves are arranged in a manner they will not be readily packed but remain somewhat suspended.
There is mixed ownership affected in the storm area both in and outside of the BWCAW. It is unknown to what extent of treatment, if any, will be done on these tracts. Opportunities exist for NF treatment to "tie into" mixed ownership operations and provide meaningful fuel treatments across the damaged landscape (Stivers 1999).
Blowdown History
Blowdown events are not unusual in this area. The regional downburst storm of July 15, 1988, caused vast blowdown in the Boundary Waters. The down timber from such storms is often suspended above the ground for several years, where it significantly adds to existing local fuels. Windstorms of this type do not generally flatten whole forests. Instead they tend to blowdown erratic swaths a few hundred feet wide of the oldest, tallest, or most exposed trees (Heinselman 1996).
The Independence Day storm of 1999, however, did flatten whole forests over significant acreage. Additionally there are many areas that fit the description offered by Heinselman.
Fire Season
Fire season in the BWCAW tends to have two fairly distinct periods. One beginning in May and continuing through June. Then, early July rains, combined with full green-up, interrupt fire season and normally provide enough moisture to stop most fires allowing fire resources an opportunity to contain large fires if necessary. The second Period begins in July and continues through October.
A common springtime phenomenon is the persistence of Hudson Bay weather. Especially in April and May, a vast area of cool, dry air may build up over the regions west and southwest of Hudson Bay, including the Boundary Waters. If the air mass is stable enough, it may block the invasion of the Gulf or Pacific air masses for many days, resulting in long periods of clear, dry weather. At first the Hudson Bay air is cold, especially at night, but as the high persists, the days may become warmer, until the high finally breaks down. Humidities may be very low. Such episodes often set the stage for forest fires in May or early June.
http://www.superiornationalforest.org/july4thstorm1999/bwcara/bwcawra.html (22 of 128) [7/7/2004 1:37:39 PM]

FUELS RISK ASSESSMENT OF BLOWDOWN
Snowmelt recharges soil moistures in April. Spring fires still occur because the spring green-up has not yet begun. Needles of living conifers are very dry until growth begins. The dead needles, leaves, and grasses from the previous summer dry quickly on the long, warm sunny days that often come with spring dry spells, especially with humidities lower than 30 percent, and the winds exceeding 15 to 20 miles per hour (Sando and Haines 1972). Given spring drought and the right burning day, crown fires are possible, and some of the largest fires of the late twentieth century in Minnesota have occurred in May and June (Heinselman 1996).
Summer fires in most vegetation types require a longer drought buildup and more severe fire weather than spring or fall fires. Late summer and early fall fires come when soil moisture reserves are often much lower. The surface litter and humus layers may be almost totally dried in major droughts and are much more likely to be consumed then. Summer and early fall are normally the heaviest rainfall periods of the year, so it is only in years of exceptional drought such as 1910, 1936, 1961, 1974, and 1976 that major summer or early fall fires can occur. Forest vegetation consisting of herbs, grasses, brush and deciduous trees are actively growing from mid-June through August and serve as a heat sink, except in drought conditions. These stands provide fuel breaks in most summers, but in drought conditions these same forest will readily burn. By mid-August most trees, shrubs, and herbs have completed growth for the season and are beginning to go into dormancy. These seasonal changes will make forests we normally think of as fireproof explosive by late summer. In a very dry year, fall fires after about October 1 are less likely to burn vigorously except in extreme drought, because the daily burning period is shorter due to decreasing day length. (Heinselman 1996).
An exception to this occurred in 1974 and makes this year questionable as one that fits the description by Heinselman. B.J. Stocks documents the weather and fire behavior of "The 1974 Wildfire Situation in Northwestern Ontario" in September 1975. Stocks describes the fire situation based on Red Lake fire No. 31 and Dryden fire No. 18, occurring in the first two weeks of July. Red Lake fire No. 31 burned 147, 615 acres (59,740 ha) in primarily jack pine and black spruce. Dryden fire No. 18 burned 79,864 acres (32,321 ha) primarily in 100,000 acres (40,470 ha) of blowdown which resulted from a July 7, 1973 wind storm. The first half of 1974 was much wetter and cooler than is normal in this part of the province. (Stocks 1975) This leads us to believe that slash fires will occur in wetter weather and fuel conditions than previous crown fires.
Fuel Profiles
Fuel profiles have been changed dramatically as a result of the blowdown. Before the wind event a Fire Behavior Prediction System model 10 best represented the fuels where Jack pine (assumed to be older stands), aspen, birch stands with conifer component, and some white/red pine stands with high stand densities occur. This covers approximately 55% of the area. This model is used to describe an over mature short needle conifer stand that is beginning to accumulate large diameter dead and down fuels as a result of trees dying from overcrowding and insect and disease disturbance. The fires burn in the surface and ground fuels with greater fire intensity than the other timber litter models. Dead-down fuels include greater quantities of 3-inch (7.6 cm) or larger limb wood resulting from over maturity or natural events that create a large load of dead material on the forest floor. Crowning, spotting and torching of individual trees are more frequent in this fuel situation, leading to potential fire control difficulties. Any forest type may be considered if heavy down material is present, including wind thrown stands. (Anderson 1982) Canadian Fuel Models M-2, mixed wood/green, and C-3, mature Jack Pine, are similar in 50% or more conifer stands.
FBPS model 10 is used to represent post blowdown stands classified as "light" damage.
Crown fires were the primary cause of rapid fire spread in these stands. This developed when the surface fuels generated enough intensity to climb the ladder fuels in the stand and transfer convective heat to the base of the crowns of the overstory to ignite the crowns. Local fire history indicates that twenty-foot wind speeds of fifteen miles an hour will drive a fire through the crowns and create spotting ¼ to ½ mile downwind. These distances are adequate to spot across many of the waterways in the BWCAW. The new spot fires generate similar fire behavior characteristics and repeat the spread and spotting process.
Stands modeled as FBPS model # 8 consist primarily of hardwoods. This model describes stands where closed canopy stands of hardwoods have leafed out and support fire in a compact litter layer. Slow-burning ground fires with low flame lengths are generally the case, although the fire may encounter occasional heavy fuel concentrations that can flare up. Twenty percent of the area is represented by model 8. Canadian Fire Behavior Model M-2 is similar, with 25% or less conifer component.
FBPS model # 9 occupies approximately one percent of the area. This describes areas of loosely arranged long needle and conifer leaf timber litter. Canadian Fuel Model C-
http://www.superiornationalforest.org/july4thstorm1999/bwcara/bwcawra.html (23 of 128) [7/7/2004 1:37:39 PM]

FUELS RISK ASSESSMENT OF BLOWDOWN
5 represents mature red and white pine.
FBPS model # 5 is a non-volatile brush model and occupies about three percent of the area. Canadian Fuel Model O-1a grass model with 51-60% cured component
The remaining 21% of the area is made up of water and miscellaneous other fuel models.
Post blowdown FBPS slash fuel model 13 is used to represent the heavy and moderate blowdown areas. We suspect this model probably underestimates the total fuel loading and associated fire behavior. It will be adequate to provide comparisons in the short-term assessment. When better information about the blowdown fuel profile becomes available a new model should be developed and applied. In model 13, fire is generally carried across the area by a continuous layer of slash. Large quantities of material larger than 3 inches are present. Fires spread quickly through the fine fuels and intensity builds up more slowly as the large fuels start burning. Active flaming is sustained for long periods and a wide variety of firebrands can be generated. These contribute to spotting problems, as the weather conditions become more severe. Total fuel loads may exceed 200 tons per acre (448 t/ha), but less than three inches diameter material is generally only ten percent of the total load. (Anderson, 1982). The equivalent Canadian Model is S-1, Jack pine slash.
Fire Behavior
Fires in the blowdown now can be expected to burn at a higher, prolonged intensity, with an increased daily spread rate at lower fire danger levels, compared to the rapid crown fires that are associated with high winds at high fire danger levels in past fires, prior to the blowdown. However, it is not expected to reach the same rapid spread rates that were achieved by previous standing timber with crowning and spotting associated with winds exceeding 10 MPH (16 km/h). RERAP predicts a dramatic increase in risk for future fires burning within the blowdown areas. It predicts these fires will have a common daily spread that is ten to twenty times greater than fires burning in Fuel Model 10. That means that large fire growth will occur under moderate weather conditions and will not be dependent on wind events. In fact, while these "rare" wind events still present a significant opportunity for rapid fire growth in the blowdown areas, RERAP indicates they only increase the common daily spread by 120% to 130% overall. In comparison, RERAP shows that rare events in Fuel Model 10 increase the common daily spread by 200% to 800% overall (depending on time of year). Fires occurring in the blowdown fuels will tend to grow slower than wind driven fires in Fuel Model 10, but will continue to increase in size under a broader range of weather conditions, and have the potential over time to cover more distance and acres. Moderate weather conditions occur 75% of the time, whereas the "very high" (90th percentile) conditions which previously drove rapid fire spread, only occurred 10% of the time. A steady fire growth can be expected during the majority of the fire season. Fire perimeters should be more circular and may tend to out-flank natural barriers.
There are a few unknowns that are worth mentioning. We are not sure what spotting distance will occur with fires in the blowdown. Spotting is expected to reach the same distances of ¼ to ½ mile that was achieved prior to the blowdown wind event. In the past, most of the spotting across waterways was associated with strong wind events. The remnant standing and hinged trees in the blowdown areas, along with paper birch bark, will provide ample firebrand sources for spotting. Since fires occurring in the blowdown areas will burn under a broad range of weather conditions, including low and moderate fire danger days, the majority of the spotting on moderate days could be short range. However, the increased fuel loading will also increase the potential for plume dominated fire characteristics, lofting firebrands high into the atmosphere. This, in turn, could increase the likelihood of longer range spotting. How this fuel profile will affect the likelihood of firebrands crossing waterways is unknown. Current fire spread and fire behavior models do not model plume-dominated fires. Fires in the blowdown will have a tendency to move to plume dominated conditions rapidly. What a fire will do in these fuels when the 90 - 97th percentile weather conditions are reached is unknown. We are not aware of documentation of any fires occurring in a fuel bed profile of this size in these very high to extreme weather conditions. Historic accounts of large plume dominated fires in the Northwestern United States occurring in 1910 indicate that spotting up to ten miles occurred. Spotting distances of one to three miles (1.6-4.8 km) is not unusual in these types of fires.
There are some clues to expected fire behavior provided by a fire that occurred in Northwestern Ontario Canada in 1974 in moderate weather and fuel moisture conditions. The previously mentioned Dryden # 18 fire burned 79,864 acres, primarily in blowdown resulting from a wind event on July 7, 1973. Observed fire behavior is described as slow, but steady, with spread rates on the afternoon of July 1 and 5, 1974 at 37 chains per hour. The most striking feature of the 1974 fire season in the Northwest Region of Ontario was the total absence of the over winter drought conditions normally associated with a severe fire year. The very wet and cool winter and spring period
http://www.superiornationalforest.org/july4thstorm1999/bwcara/bwcawra.html (24 of 128) [7/7/2004 1:37:39 PM]

FUELS RISK ASSESSMENT OF BLOWDOWN
gave no indication of the extreme fire situation that developed in late June and July. In shallow soils and thin organic mantles, two weeks of extreme fire weather would seem to have the same impact on the dryness of forest fuel as a much more prolonged drought. Fire intensity figures indicate completely uncontrollable phases of the fire (Stocks, 1975). We can assume that fire behavior will exceed these rates of spread in very high to extreme weather conditions and active long-range spotting will also contribute to increased spread rates.
NVDI
Another method of assessing fire danger is to utilize Normalized Difference Vegetation Index (NDVI) data. This information is obtained from NOAA polar-orbiting weather satellites that use Advanced Very High Resolution Radiometers (AVHRR) to analyze infrared reflected light. This information is then used to determine the condition or greenness of vegetation and how it dynamically varies throughout the fire season. This information can be visually displayed to show Relative Greenness (RG) and Departure from Average (DA) greenness. Relative Greenness portrays how green each one-kilometer square pixel is compared to that pixel’s historic range of greenness. Departure from Average portrays how green each pixel is compared to the average greenness value for the same period.
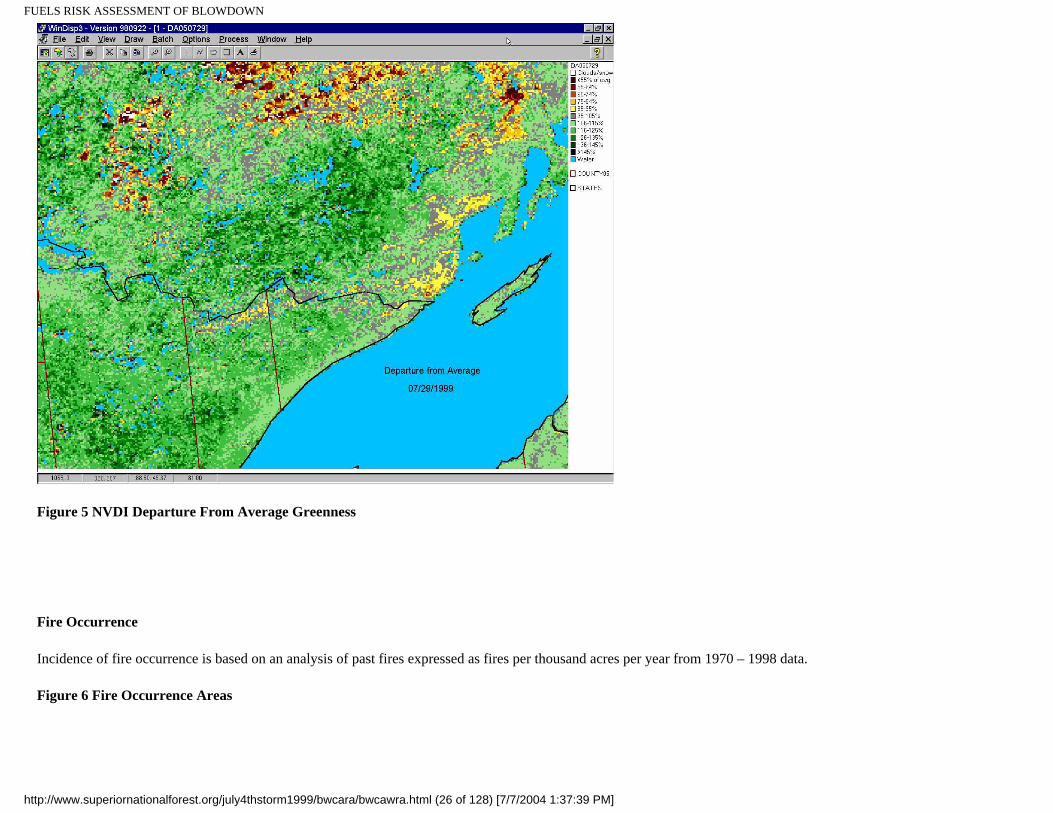
This imagery provided a means to visually display the process of how the blowdown fuels dried and cured throughout the 1999 summer season. Below (Figure 5) is a Departure from Average image taken the week of July 29, 1999. Only a few weeks after the blowdown, this image clearly displays the difference in greenness between the blown down fuels and the vegetation surrounding them. With many of the trees slowly dying during this phase, the difference in moisture levels may be even more pronounced next year after the blowdown fuels are fully cured. This information indicates the fuels in the blowdown area will remain receptive to fire ignition and spread over a periods of time when green-up historically reduced fire danger (e.g. Mid-June through July).
http://www.superiornationalforest.org/july4thstorm1999/bwcara/bwcawra.html (25 of 128) [7/7/2004 1:37:39 PM]
FUELS RISK ASSESSMENT OF BLOWDOWN
Figure 5 NVDI Departure From Average Greenness
Fire Occurrence
Incidence of fire occurrence is based on an analysis of past fires expressed as fires per thousand acres per year from 1970 – 1998 data.
Figure 6 Fire Occurrence Areas
http://www.superiornationalforest.org/july4thstorm1999/bwcara/bwcawra.html (26 of 128) [7/7/2004 1:37:39 PM]

FUELS RISK ASSESSMENT OF BLOWDOWN
This data indicates most of the more frequent fire occurrence areas are toward the west side of the blowdown and south of Ely. This raises concerns for the potential for fire starts on the west side of the blowdown since the prevailing winds are from the west also. High human caused fire occurrence areas indicate areas where prevention efforts should be focused, along with fire restrictions in high fire danger weather conditions.
Fire cause records from 1970 – 1998 list 91 lightning fire starts from a total of 797 fires in the BWCAW. The result is 48 % of fires were started by lightning and 52% started from human causes. The occurrence of human caused fires needs to be closely analyzed and the results used to modify prevention strategies within the Wilderness to reduce the number of human caused fire starts.
Lightning strikes in the blowdown areas may be more successful in initiating wildland fires than in past conditions. This is due to an increase in surface fuels in the 0-3 inch (0-7.6 cm) loading and a significant decrease in shading from the forest canopy. This "lost" shading effect increases the amount of solar radiation that also increases the average temperatures and decreases the average relative humidities. This will increase the average fuel bed temperatures and reduce fuel moistures. Wind reduction factors are also decreased, allowing more wind induced drying. All of these factors combined will increase the number of days per fire season that these fuels are receptive to initiating wildland fires. For the same reasons these fuels are also more exposed to rain, and when rain accompanies lightning storms it may be sufficient to prevent many ignitions. Lightning that strikes outside of the precipitation zone will create ignitions. Fire intensities in these heavy fuels will be considerably higher than in previous surface fuels and will exceed the capabilities of hand crews. Multiple lightning starts will occur more often and tend to burn together more frequently creating larger fire occurrences, which will move easily to plume-dominated fires.
Suppression
http://www.superiornationalforest.org/july4thstorm1999/bwcara/bwcawra.html (27 of 128) [7/7/2004 1:37:39 PM]

FUELS RISK ASSESSMENT OF BLOWDOWN
The only safe suppression option on many fires will be the use of aircraft for water and retardant drops. This could be an effective tool to slow spread, especially with the abundance of water available in short turn-around times. The most effective strategy may be to treat fuels ahead of the fire front with retardant and water to slow the start and spread of spot fires, and support ground and aerial burnout operations. Seldom will these tactics stop spread, but could buy time for the burn out operations to commence from a location that would offer adequate escape routes and safety zones for firefighters and burning crews.
Fires are presently fought by deploying two or more firefighters by aircraft or canoe with pumps and/or hand tools to contain and mop up all new starts in the wilderness. Outside the wilderness, near roads, initial attack efforts are likely to include bulldozers to construct line and engines to provide water. In both cases 125-gallon (473 liter) water drops from the three beaver aircraft owned by the Forest may support the operations. Retardant can be flown out of the base at Ely with a one-hour maximum flight time.
In the future, initial attack efforts can expect to need more water application capabilities. Northwest Region experience in similar fuels has demonstrated that fifteen minutes without water support from either aircraft or portable pumps can make a dramatic difference in suppression efforts. Type 1 or 2 helicopters can also assist very effectively in initial attack.
Decision Criteria
Decision criteria are measurable conditions that can be monitored on a daily basis to help fire and emergency services managers plan for staffing levels and to develop action plans to respond to wildland fire conditions that provide the opportunity for extreme fire behavior to occur. It is important to build flexibility into the decision process to be able to be responsive to time of season and current staffing levels, recreational impacts, and other issues that may not have been considered in depth in this programmatic assessment.
To develop these criteria past large fire history was examined. Large
http://www.superiornationalforest.org/july4thstorm1999/bwcara/bwcawra.html (28 of 128) [7/7/2004 1:37:39 PM]

FUELS RISK ASSESSMENT OF BLOWDOWN
local fires were examined from 1971 to 1998. These local fire dates and acreage were recorded and the associated weather conditions and National Fire Danger Rating System and Canadian Fire Behavior Prediction System indices examined. Weather, Energy Release Component, Haines Index, and Keech Byram Drought Index are listed in Figure 7. Canadian Indices are displayed in Appendix D.
Figure 7 Local Large Fire History
This data was then used to verify the thresholds selected in Figures 8a and 8b.
Fire Family Plus, a software program used to analyze fire weather parameters associated with fire occurrence data, was used to determine fire behavior thresholds. The thresholds for significant fire growth are listed below. Fires occurring with weather parameters or fire indices above the thresholds listed have the potential to burn intensely or spread rapidly. These thresholds correlate well with the local fire history listed in Figure 7, and the potential for large, rapidly spreading fires. These thresholds can be used as general guidelines to help warn emergency services managers, fire managers and firefighters of impending fire danger. The 90% threshold relates to "very high" fire danger while the 97% threshold relates to "extreme" fire danger.
Figure 8a Spring Fire Behavior Thresholds (May – June)
Energy Release Component (ERC) 90% = 36 97% = 46
Burning Index (BI) 90% = 46 97% = 56
Relative Humidity (RH) 90% = 20% 97% = 16%
Temperature 90% = 83 degrees 97% = 85 degrees
100 Hour Fuels 90% = 12% 97% = 10%
1000 Hour Fuels 90% = 16% 97% = 14%
20 Foot Wind Speeds 90% = 12 mph 97% = 15 mph
Figure 8b Fall Fire Behavior Thresholds (July – October)
Energy Release Component (ERC) 90% = 32 97% = 37
http://www.superiornationalforest.org/july4thstorm1999/bwcara/bwcawra.html (29 of 128) [7/7/2004 1:37:39 PM]

FUELS RISK ASSESSMENT OF BLOWDOWN
Burning Index (BI) 90% = 36 97% = 44
Relative Humidity (RH) 90% = 30% 97% = 25%
Temperature 90% = 80 degrees 97% = 84 degrees
100 Hour Fuels 90% = 14% 97% = 12%
1000 Hour Fuels 90% = 18% 97% = 16%
20 Foot Wind Speeds 90% = 12 mph 97% = 15 mph
Energy Release Component (ERC)
The ERC is based on the estimated potential available energy released per unit area in the flaming zone of the fire. The day-to-day variations of the ERC are caused by changes in the moisture contents of the various fuel classes, including the 1,000-h TL class (Deeming et al. 1977). The ERC listed in figures 8 and 9 are based on using National Fire Danger Rating System fuel model G. By changing to NFDRS fuel model I to represent the blowdown, the ERC is changed in spring to 229 at the 90th percentile and 271 at the 97th percentile. In fall the 90th percentile is 206 and the 97th percentile is 236. These new ERC values are close to 6 six times higher than they were prior to the blowdown. This is a good indicator of the change in fire intensity that can be expected as a result of the blowdown.
Haines Index
Haines Index is a measure of dryness, instability and potential for large fire growth. Haines Indices were generated for twenty-one large historic fires in the Boundary Water Canoe Area. 53% of the fires occurred with a Haines value of five or six while 14% of the fires occurred on days with a Haines Index of three. However, 72% of the fires over 1,000 acres (405 ha) occurred on Haines Index of five or six, and two of these fires exceeded 10,000 acres (4,047 ha) with Haines Index five and six days.
Haines index at 5 or 6, or KBDI equal to or greater than 150 any time in the fire season is a good indicator of rapid spread and large fire potential.
Thresholds for Implementation of Public and Employee Safety Restrictions
Full use of the BWCAW by visitors and Government employees became an issue as this Assessment Team determined the difficulty in containing fires in the new fuel conditions created by the blowdown. A decision point threshold is needed for the management team and line officers of the Superior National Forest to consider when to implement wilderness use restrictions such as campfire restrictions, or closure of long portions of trails and portages where human escapement from an oncoming wildland fire is unlikely due to the distance to a "Safe Area" and the potential fire rate of the fire spread. Implementation of a restriction program will be difficult due to the time it takes to get new information to the remote areas of the BWCAW. By the time the users are informed of the changes, the restrictions may have been removed or changed again. To address this problem a system for imposing and implementing restrictions must include the flexibility to review weather and National Fire Danger Rating System predictions to assure the fire behavior danger will be sustained long enough to make implementation of the restrictions reasonable and effective.
Fireline intensity, or flame length, determined by dividing the NFDRS Burning Index (BI) by 10, was initially considered the appropriate indicator of fire behavior thresholds that would be useful in determining when to impose restrictions. This describes the level at which direct attack becomes difficult for the initial attack resources.
http://www.superiornationalforest.org/july4thstorm1999/bwcara/bwcawra.html (30 of 128) [7/7/2004 1:37:39 PM]

FUELS RISK ASSESSMENT OF BLOWDOWN
However, the real problem with the new fuels from the blowdown is the resistance to control (relative difficulty of constructing and holding a control line as determined by fuel, topography, and soil) the firefighters will encounter. There are weather conditions at which fires will not start and spread as a result of high fuel moisture content. When this occurs there is no need for any restrictions. As fuels begin to dry out and fires have an opportunity to ignite and burn, management should begin to invoke restrictions. The point at which management should begin to be concerned about visitor safety is when fires will successfully ignite and spread enough to require suppression action. By definition, this is the NFDRS Ignition Component (IC). IC is expressed as a probability that, given a firebrand, a fire will ignite requiring suppression action. Once initial attack suppression actions begin there will be a very narrow window of opportunity for successful containment before this effort grows to an extended attack. It will take considerable time to mobilize initial attack resources and successfully contain a fire in the blowdown fuels. As this effort continues the risk of a high wind event increases which will increase the fire rate of spread and reduce the escape time for any Wilderness users. Therefore, the threshold for BWCAW use restrictions may best be identified by use of the IC. To verify this a comparison was made between IC, ERC, BI, and Spread Component (SC). All of these indices reflected similar patterns of change as the fire weather became more conducive to large fire growth (Figure 9a). They were essentially benign until the 15th percentile weather was reached. Then all indices made a steady increase until they hit the 70th percentile weather where the curve begins to steepen. This means that fires are starting readily and fire intensity and growth will increase rapidly.
Figure 9a NFDRS Indices
One interesting observation is that both the SC and the IC tend to decrease from April to November. These are both dependent on fine fuel moisture. Monthly mean relative humidity slowly increases for each month during this period. As relative humidity increases the fine fuel moisture will increase and create the observed trends in IC and SC.
Figure 9b Monthly Mean Ignition Component
http://www.superiornationalforest.org/july4thstorm1999/bwcara/bwcawra.html (31 of 128) [7/7/2004 1:37:39 PM]

FUELS RISK ASSESSMENT OF BLOWDOWN
Average IC for each month is 17 for April and May; 13 for June and July; 12 for August; 10 for September; 8 for October; and 6 for November (Figure 9b).
As soon as the IC for NFDRS Fuel model I reaches the 15th percentile weather, or an IC of 1, fires will start to spread and require Initial attack activities (Figure 9c). Time and experience will show how effective these efforts will be. Initiation of restrictions should be considered at this time.
Figure 9c Ignition Component
Containment difficulty will steadily increase as the IC approaches the monthly average. The 40th percentile IC value is 8. This would present a good threshold opportunity to again determine if additional restrictions need to be invoked. The 70th percentile IC (16) and above show an increase in the rate of fire spread, and intensity and should be considered a point at which restrictions are mandatory.
http://www.superiornationalforest.org/july4thstorm1999/bwcara/bwcawra.html (32 of 128) [7/7/2004 1:37:39 PM]

FUELS RISK ASSESSMENT OF BLOWDOWN
Figure 9d Burning Index
The NFDRS fuel model I Burning Index could be referenced on a daily basis to provide an indicator of fireline intensity, or flame length (Figure 9d). To determine the flame length simply divide the BI by ten. A flame length of 4 is the upper limits for hand crews to be successful with direct attack. This is reached at the 16th percentile weather and an IC of 1. A flame length greater than eight feet in the BWCAW will be very difficult to contain in the blow down fuels and is reached at the 40th percentile weather and corresponding IC of 8. Eleven-foot flame lengths are reached at the 70th percentile weather.
All of the previous data applies to blow down fuel conditions. It is important to remember that the historic large fires have occurred in the existing fuels at the 90th percentile weather. When these occur they will exceed the rates of spread occurring in the blow down fuel fires. Therefore, it is prudent to make sure that by the time the 90th percentile weather is reached, or 15 mph or greater winds are predicted, that restrictions are invoked in all fuels.
While we have been able to determine thresholds to consider for restrictions, we have avoided defining what those restrictions might be at each level. Local managers better understand the impacts of imposing restrictions of any kind and how effective they might be. They are in the best position to determine what restrictions should be invoked at any threshold. Each manager will also have to consider what risks they are willing to take in not restricting use of the Wilderness as potential for fast moving fires increases, and reduces the opportunity for the Agency to provide for public and employee safety.
Pocket Cards
Pocket Cards were developed using the Fire Family Plus program for both the spring and fall seasons. These cards can be distributed to field going personnel and are useful to quickly compare current conditions to historic fire danger thresholds. The two cards shown below discuss and illustrate through graphs the thresholds for very high to extreme fire danger.
http://www.superiornationalforest.org/july4thstorm1999/bwcara/bwcawra.html (33 of 128) [7/7/2004 1:37:39 PM]

FUELS RISK ASSESSMENT OF BLOWDOWN
Figure 10a Pocket Card (May & June)
http://www.superiornationalforest.org/july4thstorm1999/bwcara/bwcawra.html (34 of 128) [7/7/2004 1:37:39 PM]

FUELS RISK ASSESSMENT OF BLOWDOWN
Figure 10b Pocket Card (July thru Oct)
http://www.superiornationalforest.org/july4thstorm1999/bwcara/bwcawra.html (35 of 128) [7/7/2004 1:37:39 PM]

FUELS RISK ASSESSMENT OF BLOWDOWN
Figure 11 Rainfall for 1976
Rainfall
Haines and Sando examined seven historically great fires from the period 1870 to 1920. The most striking factor in the climatic conditions preceding seven historic fires in the north-central region is the decreased precipitation over a three to eight month period. Precipitation amount was a consistently good climatic indicator
Figure 12 Departure from Normal Rainfall 1976
(Haines, Sando 1969). In examining precipitation amount in recent local fire history we find that 1976 was a "drought year" based on departure from normal precipitation (Figures 11 & 12). In the analysis area three fires over 1,000 acres (405 ha) occurred in 1976. The rainfall for the year was 11.23 inches (28.5 cm) below normal. April through October was deficit 12.51 inches (31.8 cm).
Figure 13 Rainfall for 1995
http://www.superiornationalforest.org/july4thstorm1999/bwcara/bwcawra.html (36 of 128) [7/7/2004 1:37:39 PM]

FUELS RISK ASSESSMENT OF BLOWDOWN
January, March and June were all above normal.
January through July was below normal precipitation amounts in 1988 and 1995 also (Figures 13 & 14). These were very active fire years with the Sag Corridor fire ignition on 8/10/95, reaching 12,600 acres (5,099 ha).
Figure 14 Rainfall for 1988
The historically great fire data indicate that abnormally hot weather for the season is not a prerequisite to large fires in the north-central region. Although records show above normal temperatures at some time during the fire year in all instances, most of the departures occurred early in the year. Short-term temperature fluctuations do appear to be highly significant. Temperatures were well above normal during the ten days before the great historic fires. Lowered relative humidity in most cases also appears to have contributed to the drought conditions. Most of the historic fire years examined had below to well-below-normal relative humidity for most of the season or the month preceding the fire.
Findings
Climatology
The blowdown resulting from the derecho wind event created a massive area of change in fuel conditions. Most significant fire events in the past have occurred in boreal mix consisting of spruce, balsam fir, aspen, birch, and jack pine, with dead balsam contributing to flammability. These fires maintained relatively low rates of spread until a wind event of at least 10-15 MPH, accompanied by relative humidities below 30% occurred. These conditions accelerated rates of spread and intensity and moved the fire into the crowns. This crown fire would then spread at rates of 1 ½ to 7 miles a day. Most of the lakes and waterways were not wide enough to prevent spotting across them and they failed to slow spread significantly. Spotting occurred frequently ¼ to ½ mile ahead of the fires. Spotting on islands assisted the fires in crossing wider lakes and waterways.. Fire shapes took on the elongated elliptical characteristics of wind driven fires. The winds driving these fires seem to occur the majority of the time out of the SW. When the climatological records were examined it was determined that there are almost equal probabilities for the wind to blow from other directions when
http://www.superiornationalforest.org/july4thstorm1999/bwcara/bwcawra.html (37 of 128) [7/7/2004 1:37:39 PM]

FUELS RISK ASSESSMENT OF BLOWDOWN
considering average winds for all directions and wind speeds. However, when just considering winds blowing 13-18 MPH a definite pattern develops (Figure 15). The majority of these winds are incoming from the south through the northwest. In some cases fires such as the Little Sioux in 1971 are documented as being associated with frontal systems.
Figure 15 Wind Direction
All weather elements, NFDRS and Canadian fire danger / behavior indices, at the 90th percentile level and above, serve as good indicators or thresholds for potential of extreme fire behavior and spread (Figures 8 & 9). These conditions will cause all containment and suppression actions to be unsuccessful in the blowdown areas at the head and flanks of the fire. It may be possible to establish anchor points to the rear of the fire. Most fires in non-blowdown areas will also defy containment actions at these thresholds as has been demonstrated by local recent fires. Heat transfer through radiation will play a large part in increasing containment difficulties for suppression resources. Resistance to control is very high due to the amount of handwork required to separate the abundance of large fuels. Fires that are in the blowdown under these very high to extreme conditions can also be expected to rapidly become plume dominated and will be driven by extreme fire behavior. This could include smoke columns reaching heights of 30,000 to 50,000 feet; strong indrafts on the fire perimeter which could quickly change to downdrafts up to 40 miles an hour; fire whirls along the fire perimeter; long range spotting (up to three miles); and high rates of spread.
Keech Byram Drought Index greater than or equal to 150 or Haines Index of 5 or 6 is also a good indicator of the potential for extreme fire behavior.
Below normal precipitation for three to eight months, below normal relative humidity for ten days or more, or above normal temperatures for ten days or more are all indicators that fuels are becoming very dry and available for consumption, and are therefore also good indicators of potential problem fire behavior. (Appendix E)
http://www.superiornationalforest.org/july4thstorm1999/bwcara/bwcawra.html (38 of 128) [7/7/2004 1:37:39 PM]

FUELS RISK ASSESSMENT OF BLOWDOWN
If two or more of these elements occur at the same time, any new fire starts in the blowdown can be expected to create fire behavior that will defy all containment actions. If blowdown fires under these conditions are accompanied by winds in excess of ten miles per hour they will move at very rapid rates of spread (36 chains per hour up to seven miles a day or more).
If winds are ten miles an hour or more, even in moderate fire weather conditions, the fires in the blowdown can be expected to quickly move to plume dominated fire behavior.
Spatial Analysis
The FlamMap analysis supported intuitive assessments of how fire behavior would change in the blowdown fuels. Assuming fuel moistures were constant for all fuel models, the fire weather at the lowest percentile (15%) would likely produce moderately faster and more intense fire behavior within the blowdown fuels than in the undisturbed fuel types (Figure 16A). The high fuel moistures and low windspeeds are not conducive to producing large fires regardless of how much fuel is present. As the fire weather becomes drier with higher windspeeds (75th and 90th percentile), the blowdown fuels produce substantially greater spread rates and intensities (Figure16B, C). This results not only from the higher loading and depth of the slash-like fuel complex but also because of the relatively greater windspeeds affecting fire in those fuels. The lack of canopy cover greatly increases the midflame windspeed for fires burning in the blowdown fuels compared to the understory fuels in the intact forest. Only under extreme conditions (97th percentile) does crown fire spread rate and intensity exceed that in the blowdown fuels (Figure 16D).
Figure 16 FlamMap Flame Length Analysis
This analysis has some assumptions, however, that must be considered for interpreting the results. First, the fuel moistures were the same for all fuel models for each run. This is useful for comparison of the fire behavior but is not particularly realistic for any given day. The fuel moistures at each site would be affected by their local topography, shading, wind exposure, and wetting and drying. In the early part of the fire season, the fuels in the blowdown would likely dry at a faster rate than fuels in the
understory because of their increased exposure to sunlight and wind. Thus, the FlamMap analysis described here might be expected to under predict fire behavior under the more moderate or low conditions on exposed slopes or ridges (because of increased wind and sun). However, in the late season, faster wetting of the finer fuels in the blowdown area would likely occur from rains or snow because of their greater exposure. Also, the spread rate maps that can be generated from FlamMap do not reflect the contribution by spotting to the effective spread rate of the fire. Spotting is an important means of producing faster fire spread when crown fires occur. The increased intensities associated with crown fires (because of crown fuel involvement) are represented by FlamMap output, but if actual crown fire spread is not occurring (active crown fire) then the spread rate will remain unaffected by the presence of torching trees (passive crown fire).
FARSITE calibration
The FARSITE simulations showed reasonable results during calibration with the Little Gabbro Lake Fire (1995) and the White Feather Lake Fire (1996) after some adjustment of the input data.
Figure 17 FARSITE calibrations using the Little Gabbro Lake fire (1995).
Yellow lines are observed perimeters and shaded areas are results of the simulation for the same time period.
http://www.superiornationalforest.org/july4thstorm1999/bwcara/bwcawra.html (39 of 128) [7/7/2004 1:37:39 PM]

FUELS RISK ASSESSMENT OF BLOWDOWN
The fire simulation performed better on the Little Gabbro Lake fire (Figure 17A, &B) than the White Feather Lake Fire (Figure 18A, &B). Adjustment factors for all surface fuel models were set to 0.35 to account for fine-scale discontinuities in fuels and wind fluctuations. A reduced crown base height in the jack pine types (to 1.0 meter) was needed to generate crown fire for both fires. However, the White Feather Lake fire required a conversion to a surface fuel model 11 or 12 to generate enough intensity to produce fire growth consistent with that recorded for the last 2-3 days.
Figure 18 FARSITE calibrations using the White Feather Lake fire (1996).
Yellow lines are observed perimeters and shaded areas are results of the simulation for the same time period.
The gust windspeed was used for all simulations and seems consistently to be a better indicator of fire behavior than the 10-minute average. This is particularly important to generate crown fire coincident with the observed episodes of crown fire behavior and faster spread on days with higher winds. The utility of the gust speed might be related to 1) the way that winds are averaged or sampled by the instruments at the weather stations, or 2) the effect of gusts or short-term increases in speed on dramatic changes in fire behavior as recorded in the fire progression pattern. The average windspeed is often calculated as a 10-minute average for a specific portion of each hour. This can easily exclude many higher windspeeds that occur over short periods (several minutes) during the remainder of the hour; the average can also dilute these winds with much slower windspeeds that occur during the sampling period. Without the gust speeds, the average windspeeds tend to be so damped by lulls that little fire behavior occurs. Gust speeds are often twice the average and sometimes five times higher than the average (for lower windspeeds).
There were several problems with using the RAWS weather data in the calibration. First, the precision of the wind direction appears to be limited to 45 degrees (8 total directions). The true wind direction is probably obtained by rounding-off to the nearest of 8 directions, thereby producing an artificially constant wind direction in the simulation that will suddenly shift by no less than 45 degrees. Second, the weather station at Ely does not appear to be wholly representative of the fire locations at the time of the fires. Wind directions and speeds are sometimes not consistent with the observed fire growth patterns. For example, the fire growth pattern might suggest that large spread due do high winds that do not occur on the RAWS data stream.
Figure 19 Blowdown Fire Growth
The limitations of the fire behavior models in FARSITE (and FlamMap) make these models suitable only for wind-driven fires, not for fire behavior that is dependent on strong feedbacks with the atmosphere (plume dominated fires, fire whirls etc.). Plume dominated fire activity (Rothermel 1991) may be expected to occur in the BWCA, both in blowdown fuels and elsewhere, but cannot be modeled with any tools presently available. The likely consequences of having plume-dominated behavior will be large growth pulses and spotting in multiple directions, which will likely exceed the predictions of FARSITE.
Simulated fire growth in blowdown fuels showed a large increase in spread in all directions that was more susceptible to wind direction changes than fuels not affected by blowdown (Figure 19A, B). The fire simulated in the blowdown was ~24,000 acres (9,713 ha) compared to 2,000 acres (809 ha) in the previous fuel types. The loss of sheltering by a forest canopy leaves the slash-like blowdown fuels more exposed to winds and changes in those winds. Much larger and more consistent spread was observed in the blowdown fuels, even during moderate periods. This is consequences of 1) the increased wind exposure, 2) faster spread in slash fuels than in understory fuels, and 3) decreased fuel moistures resulting from the loss of overstory shading. These results are consistent with the fire growth patterns in blowdown fuels reported by Stocks (1975). Furthermore, much larger rapid growth resulted from spotting when stronger winds occurred.
The simulation results may somewhat over-represent fire growth in the blowdown fuels. Fuels as represented in current data are probably homogenized by the crude methods used by mapping their extent and by the simplistic assignment of a single fuel model to those areas. In reality, there will be some variation, if not in the structure of the blowdown fuels, then in the fine-scale continuity of the damage. For example, a 1-square-mile section may appear to an observer in an aircraft to have been completely flattened, because it is easy to ignore the small patches within the blowdown that have little damage. However, if these patches are numerous or oriented normal to the direction of fire travel, they might have a significant effect on fire growth, by slowing the fire along a particular flank under some weather conditions. However, the
http://www.superiornationalforest.org/july4thstorm1999/bwcara/bwcawra.html (40 of 128) [7/7/2004 1:37:39 PM]

FUELS RISK ASSESSMENT OF BLOWDOWN
blowdown clearly has homogenized fuels in the damaged areas compared to conditions prior to the wind event. A variety of fuel types, vegetation types, and canopy conditions occurred prior to the blowdown, which would have had a marked effect on fire growth. These variations have been largely eliminated by the flattening of the forest overstory and replaced by a slash-like fuel complex with little sheltering from overstory trees.
Fuel treatment locations
An attempt was made to locate areas that would be practical for treating by prescribed fire, and effective in creating, a disruptive spatial pattern across a sample area of the BWCA. Prescribed fire is a practical means of reducing fuels over large and inaccessible areas within the BWCAW. Locating treatments next to water or moist vegetation (bogs) will limit the growth on at least one side of the treatment patch. The locations were chosen with several criteria as described by a theoretical model of treatment patterns (Finney in press):
1. to fortify natural barriers as much as possible (i.e. lakes and bogs).2. to minimize the area treated. 3. to overlap with nearby patches and lakes in the primary direction of spread (west-east).4. to influence potential fire growth over as much of the landscape as possible.5. to separate the treatment patches only by short distances relative to the expected fire sizes.
To satisfy the first criterion, treatment units were located 1) next to the smaller lakes to expand their width as impediments to spotting, and 2) to include islands in lakes to decrease the overall continuity of the lake and take away "stepping-stones" for spot fires (fires often spot from island to island, eventually arriving on the other side of the lake). The second criterion was implemented by orienting the treatment units as narrow strips (1/4 to 1/2 mile wide) running in predominantly a north-south orientation. This orientation is most efficient for disrupting fires commonly spreading from the directions associated with cold fronts and large fire runs (from the west, southwest or northwest). Treatment units need to be wide enough to stop spotting observed for most fires but will not be sufficient for "worst-case"
Figure 20 Patchwork Treatment Pattern
conditions. The third criterion ensured that there was no clear pathway across the landscape because a series of treatment units forced the fire to flank around them in order to move forward. The fourth criterion was addressed by locating a number of treatment units around the blowdown area to provide some disruption of fire growth regardless of the ignition location. The last criterion was met by placing new treatment patches at least every 1 to 2 miles, especially in the east-west direction of expected fire travel (this increases the number of times that a fire will be interrupted in its progress. (Figure 20A, B).
Treated fuels were assumed to spread slowly and were assigned a standard fuel model 8. This would probably require that a wildfire occur within several years after the treatment pattern is established. The prescriptions used for burning areas within the delineated unit would need to specify consumption of primarily finer fuel components of the blowdown complex. Removing fuels smaller than 3-4 inches would probably greatly restrict the spread potential across these areas even if the larger woody material remains. The treatment pattern that resulted from applying the spatial selection criteria required about 15% of the area to be treated. The exact fraction of the landscape is difficult to calculate precisely because the amount of surrounding area included is subjective.
The effectiveness of the pattern was tested by repeating the same fire as simulated above for comparing fuel changes in the blowdown area (Figure 21). The simulation showed reduced fire growth (~12,000 acres or 4,856 ha) because the fire was forced to circumvent the lakes and treatment patches. The treatment locations disrupted the simulated fire growth and behavior in all directions. High wind events eventually did carry the fire off of the landscape to the east.
Figure 21 Patchwork Treatment Fire Simulation
This reinforces the common experience that extreme fire events will produce large fires regardless of fuel types or suppression efforts. The simulation suggested changes
http://www.superiornationalforest.org/july4thstorm1999/bwcara/bwcawra.html (41 of 128) [7/7/2004 1:37:39 PM]

FUELS RISK ASSESSMENT OF BLOWDOWN
that could be made to the treatment pattern that would have reduced the fire size even further. Through trial and error, such a pattern might be developed that would be generally effective in slowing the overall fire growth across the entire landscape. Specifically, it would be better if the treatments were smaller in size but more numerous and closer together. This would ensure that fires would be disrupted more frequently by the pattern, with fewer large expanses allowed to burn without encountering some mitigation. Reduced fire growth rate can "buy time" for acquiring suppression reinforcements for suppression activities or evacuations. By forcing a wildfire to squeeze through the gaps in the treatment units, suppression activities might be more effective when concentrating on these areas.
More detailed maps (e.g. 30 m resolution) on blowdown damage would improve the ability of the models to simulate fire growth. Accurate mapping of the blowdown fuels would also assist with efforts to locate effective treatment units.
Conclusions
The spatial analyses support the following conclusions:
● Blowdown fuels can be expected to produce more consistent fire growth under a wider range of weather conditions than in the undamaged forest. This means that fires can be expected to become larger more frequently under weather conditions that in intact forest would only allow small fires.
● The larger fires occurring in the blowdown areas can be expected to threaten the edges of the Wilderness area, and probably values outside the Wilderness. The extent of these larger fires in any direction means that the Wilderness is probably not large enough to reliably contain fires if blowdown fuels are involved.
● Extreme fire weather conditions that typically produce crown fires and long-range spotting in the coniferous forest types of the BWCA will effectively produce greater spread rates than the blowdown fuels.
● A patchwork of fuel treatment units collectively occupying about 15% of the blowdown area can probably be designed for slowing fire progress through the blowdown fuels. The pattern is more efficient (less area treated and easier control) if the treatment units are strategically located next to lakes and bogs.
Recommendations
The enormity of the potential for a major conflagration as a result of the blowdown makes it difficult to determine where enough fuel reduction treatment can be applied to have any effect on a fire in these heavy fuels, particularly in a very high to extreme fire danger season. Research previously done by Heinselman has provided very good understanding of the functioning of ecosystems, including fire disturbance in the BWCA. It is necessary for us to once again rely on Heinselman’s research and advice. Much of this section will be devoted to his findings and recommendations for fire management activities that could bring fire disturbance closer to historic levels in these ecosystems. The findings of this risk assessment will be considered along with Heinselman’s observations and recommendations to develop potential treatments that could be effective in reducing the fire spread and intensity potential of the existing blowdown. The intention is to incorporate into these recommendations the latest fire behavior prediction models and science, along with the extensive ecological research done by Heinselman, in an effort to produce a treatment plan that supports the ecosystem function and effectively reduces fire potential and therefore risk of threat to life and property.
Since fire control became effective in 1911 the fire rotation for the total virgin forest area of the present BWCAW up to 1987 was about 2,000 years. This compares with a rotation of 100 years or less before European settlement. If continued, such a drastic reduction in fire would make it impossible to perpetuate even a semblance of the natural vegetation age-class mosaic. Vast areas of the BWCAW have reached senescent conditions, which has created a homogeneous fuel condition promoting large stand replacing fires. Most of the older white and red pine groves lack the younger age-class components they must soon have if they are to persist into the future. The Superior
http://www.superiornationalforest.org/july4thstorm1999/bwcara/bwcawra.html (42 of 128) [7/7/2004 1:37:39 PM]

FUELS RISK ASSESSMENT OF BLOWDOWN
National Forest’s Fire Management Plan for the BWCAW (1991) allows lightning ignited fires that meet preplanned prescriptions to be managed as Prescribed Natural Fire. With the arrival of the Federal Wildland Fire Management Policy the term PNF has been changed to Wildland Fire Use and new funding policies allow more liberal application of fire to meet resource management objectives. The beginning goal of the 1991 BWCAW fire plan was to burn 1,500 acres (607 ha) a year or 15,000 acres (6071 ha) a decade. This calculates to a fire rotation of 590 years, which is nowhere near the fire rotation or natural fuels conditions that existed before European settlement.
Forest fires in fire-dependant ecosystems can be an awesome, destructive and potentially deadly force. The basic objective, then, must be to restore fire to its natural role in the ecosystem to the maximum extent feasible, consistent with protection of human life, property, and commercial resources outside the wilderness (Heinselman 1996).
Heinselman recommends focusing the Wildland Fire Use fires on the virgin forests first since they are the most effected by fire exclusion. His recommendation obviously came before the blowdown event complicated the situation. Also, the few remaining old white and red pine stands are in danger of being destroyed by stand replacing fires that are likely to occur due to in growth of understory ladder fuels.
In the years 1727 to 1910 Heinselman only mapped eight large fires, exceeding 64,000 acres (25,901 ha). The average burn size was 23,000 acres (9,308 ha). Several of these large fires crossed in and out of both the Canadian border and the BWCA Wilderness boundary. Suppressing all lightning ignited fires outside the wilderness will contribute to a reduction of the fire rotation. Consideration should be given to WFU outside the wilderness and across the border in Canada.
Would lightning ignited, stand replacing fires as large as those in 1863-64 be ecologically acceptable today, even if they could be accommodated safely? The problem is that what we have to work with is a somewhat damaged fragment of the original natural ecosystem of a vastly larger region. The possibility exists that vast fires in a single drought year might eliminate many of the red and white pine communities because of excessive fuel loads. Would it be good ecosystem preservation to convert a third of the remaining forest ecosystem reserves to a single age class? If we are to restore fire to something approaching the natural regime and natural rotation without such vast burns, then we must burn approximately the same average area per century with more, but smaller stand replacing fires. Perhaps a maximum patch size limit of 25,000 to 50,000 acres (10,118 – 20,235 ha) should be incorporated into future plans (Heinselman 1996).
Management ignited underburns should occur in any white or red pine stands that do not have heavy amounts of blowdown in them and could survive an underburn. This will help provide additional areas where high intensity fires will encounter a change in fuel model that will reduce the fireline intensity and offer an opportunity to contain wildland fires.
Treatments need to occur outside the wilderness to reduce high-risk fuels. If successful treatments can be carried out then the chance that a wilderness fire will endanger lives, or destroy developed property along the wilderness perimeter will be reduced (Arno & Brown 1989).
Critical areas of concern such as the Gunflint Trail area should receive special attention. This area is lined up directly with the elongated blowdown damage in the wilderness and many of the spread patterns of historic large fires. This is an especially serious condition that should not be taken lightly. There are few lakes and natural barriers between the BWCAW and the Gunflint Trail recreation area. The blowdown is arranged continuously into the Gunflint Trail area and the windstorm inflicted significant damage there.
An additional strategy is to allow more crown fire and high-intensity surface fires in the blowdown to occur utilizing both natural ignitions and management ignited fires. Deliberate ignitions would occur at points west or south of large lakes where reasonably good natural fire barriers also exist to the northeast and southeast. We have made a systematic study of the areas affected by the blowdown and within the BWCAW to develop a map (Finney work in Progress) of feasible burning areas that have the most potential for offering fuel changes which will reduce the projected rates of spread over a broad area. These burns should begin with the smallest, most defensible areas to gain experience with the new fuel profile. Islands may be the best opportunities for beginning. Lightning ignitions would be allowed to play their role as disturbance agent when the threat identified through RERAP is determined to be acceptable.
http://www.superiornationalforest.org/july4thstorm1999/bwcara/bwcawra.html (43 of 128) [7/7/2004 1:37:39 PM]

FUELS RISK ASSESSMENT OF BLOWDOWN
The goal is to safely restore stand-replacing fires to the ecosystem, and reduce the blowdown fire potential under burning conditions of less than maximum drought and extreme fire severity weather. Heinselman offered the following criteria to be used in selecting areas:
● The site must permit burning at least a few hundred acres. This team encourages approaching at least 1,000 acres (405 ha) as often as possible.● It must be feasible to burn the area with a west, southwest, or northwest wind (that is, the site must be on the west or southwest side of a good sized lake). This team
also considers portages, which could be supported with water from hose lays and sprinklers as opportunities that should not be overlooked.● There must be an expanse of open water downwind at least a quarter mile wide. This is a good rule to use for starters. However, it is unlikely enough acres can be
treated to be effective if this is followed in all cases. Utilize new burns and old fire scars as reduced fire risk areas also. As more experience is gained burning in these conditions, this can be modified to reflect the increased knowledge of spotting conditions.
● The forest must be primarily mature or senescent stands of upland boreal conifer-broadleaf species. This condition has obviously changed from Heinselman’s recommendation to include blowdown areas.
● The site must not be near enough to any wilderness boundaries or structures to pose a threat to Forest Service or private structures inside or outside of the BWCAW. This is modified to putting high priority in areas that are an immediate threat to fires burning from the BWCAW, which put developments in harm’s way. Areas outside the wilderness that receive immediate mechanical or other fuel reduction treatments may present themselves as less risky areas to begin these prescribed fire treatments.
Heinselman made specific recommendations of areas that he determined met these criteria. We have taken his recommendations into consideration and added our own recommendations based on FARSITE, FlamMap modeling, and professional judgment.
These activities need to be planned well in advance of ignition and highly trained, skilled, and qualified practitioners must be available to implement the program. If they are not designated well in advance they will be committed to other wildland fires or projects.
Heinselman suggests that to predict fire rotations for the BWCAW under an enlarged fire-management program, it would be prudent to make a liberal allowance for wildfires burning outside prescriptions at 10,000 acres (4,047 ha) per decade. Add to this 30,000 acres (12,141 ha) a decade of WFU fires, both natural and management ignited, for a total of 40,000 acres (16,188 ha) a decade. This translates to a fire rotation of about 112 years for the virgin areas. This assumes that most of the burning is confined to virgin forests. With additional acreage, outside virgin forests affected by blowdown, it is more realistic to look at the entire BWCAW acreage and work towards 100-year rotation. This requires 80,000 acres (32,376 ha) of WFU with an additional 10,000 acres (4047 ha) of wildland fire out of prescription, every decade. This still doesn’t begin to approach Van Wagner’s 50-year rotation estimate, but certainly moves fire disturbance in the right direction and offers opportunities to reduce the present critical fire potential.
Suppression Tactics
● Suppression tactics will need to be re-analyzed with an eye on firefighter safety in all areas where access and egress is an issue.
● Traditional suppression tactics need to be re-evaluated to determine if they still apply in blowdown areas.
● New suppression tactics need to be developed which rely heavily on the use of water delivery aircraft in conjunction with aerial ignition burnout devices and ground sprinkler systems.
● The most effective strategy may be to treat fuels ahead of the fire front with retardant and water to slow the start and spread of spot fires.● Take advantage of any locations that have had fuel reduction treatments or recent wildland fires.
Wildland Fire Use
http://www.superiornationalforest.org/july4thstorm1999/bwcara/bwcawra.html (44 of 128) [7/7/2004 1:37:39 PM]

FUELS RISK ASSESSMENT OF BLOWDOWN
● In multiple fire situations, fire managers should take advantage of the situation by choosing fires where they have the best chance of being effective with their suppression response, and consider managing other, more difficult situations that may be unsafe for firefighters, as wildland fire use.
● Utilize a new flow chart in the decision-making stages for Wildland Fire Use. An example is in Appendix F.
Urban Interface
● All fire and emergency services personnel, on a daily basis, should use Pocket Cards during fire season to track the daily fire severity. This is a good indicator of many weather parameter thresholds. Full size pocket cards, available for copying, can be found in Appendix F.
● Information Officers should post fire severity daily on a designated Internet Web site and in designated areas in communities threatened by the blowdown fuel conditions. They should include the following information:
Fact sheets on present fire and fuels conditions
Indicators of extreme fire behavior
High-risk areas by time of year
NVDI values
Post picture of timber & slash fires
● Handouts should also be made available to communities surrounding the BWCAW including:
Brochures
Pocket cards
NVDI values
Treatment Opportunities
● Opportunities for fuels treatment inside and outside the BWCAW, including harvest and Wildland Fire Use, should be pursued to help break up the continuity of the blowdown fuels.
● Opportunities for fuels treatment inside the BWCAW, including Wildland Fire Use and manage ignited prescribed fire, should be pursued to help break up the continuity of the blowdown fuels.
● Opportunities for fuels treatment outside the BWCAW, should include the same options, and also include harvest and.● Each landowner needs to take whatever actions they are capable of to remove the hazardous fuels conditions around their structures to offer some protection from
fast moving, high intensity fires. ● The U. S. Forest Service needs to continue to develop and implement fuel removal activities on their lands, with special attention to the areas west and south of the
Gunflint Trail road. This should include management ignited prescribed fire and mechanical removal. Fire approaching this and similar areas through the blowdown
http://www.superiornationalforest.org/july4thstorm1999/bwcara/bwcawra.html (45 of 128) [7/7/2004 1:37:39 PM]

FUELS RISK ASSESSMENT OF BLOWDOWN
will not offer much time for all residents and visitors to evacuate down the sixty-mile highway. ● Prescribed fire treatments within the BWCAW need to begin as soon as possible in large blocks designed to treat 8,000 – 10,000 acres (3,238 – 4,047 ha) a year.
● Fuel treatments in the BWCAW need to focus on strategic placement of prescribed fire to affect fuel model change, and slow fire spread. The relationships between all of these treatment areas needs to be carefully considered so that the most efficient mix of treatment areas is selected which will provide improved resistance to control with each project implementation
● A patchwork of fuel treatment units can be designed for slowing progress throughout the blowdown fuels. The pattern is more efficient if the treatment units are strategically located next to lakes.
Data Needs
● Fuel inventory work is needed to better characterize the fuel profile in the blowdown areas. Roger Ottmar from the Pacific Northwest Research Laboratory, Seattle, has been tasked to inventory the fuels and his team should be able to provide much needed information on fuel loading. Preliminary results indicate fuel loadings between 9 tons/acre in areas of sparse blow down, to 66 tons/acre in heavy blow down areas. Custom fuel models should be considered, however without actual fire behavior observations, predictions will still be academic.
● NDVI images from June through August 1999 were reviewed and clearly showed the difference in greenness between the blowdown fuels and surrounding vegetation. These images should be downloaded and monitored weekly during the fire season to assess fire danger in this area. Departure from Average images should provide a good idea for how much different the fuels are from historic averages. Relative Greenness images will help managers determine how the blowdown fuel moistures compare to surrounding vegetation and when they might expect fire activity in the blowdown areas.
● Acquire recent satellite vegetation classification data at 30-meter resolution for fuels classification.
● Acquire digital ortho quarter quads from Minnesota Department of Natural Resources for use as a planning reference tool.● The Forest has good hard-copy records of wildland fires and in some cases individual fire progression maps. These should all be digitized into the GIS library before
they are lost. These are valuable maps that can be used in the future for other planning efforts.
Planning Need:
● Close coordination with local agencies and homeowners needs to be stressed to ensure evacuation plans are prepared and practiced in advance and implemented in a timely manner if the need arises.
● The hiking trails through the BWCAW should be closed during periods of high fire danger, until adequate fuel reduction treatments have occurred to provide areas that will slow an oncoming fire to allow escapement of wilderness trail users.
● The communication links in the Gunflint Corridor need to be assessed and improvements recommended in order to establish reliable radio, telephone and television links.
● Acquire increased capability for water delivery aircraft for use in both wildland fire suppression and prescribed fire use, primarily to assist in reducing spotting. This capability needs to be available on site during high fire danger to reduce response times to the fire.
● Acquire Necessary equipment, including aircraft, to provide the capability to use aerial ignition devices for burnout operations. This capability needs to be available on site during high fire danger to reduce response times to the fire.
http://www.superiornationalforest.org/july4thstorm1999/bwcara/bwcawra.html (46 of 128) [7/7/2004 1:37:39 PM]

FUELS RISK ASSESSMENT OF BLOWDOWN
● Campfire restrictions need to be initiated in areas of moderate to heavy blowdown. Use of backpacking camp stoves should be encouraged. The public needs to understand that conditions have dramatically changed in the blowdown areas and "special regulations" are needed to protect them and those recreating around them.
● Redo the BWCAW videos to include an explanation of the conditions that now exist, what special regulations are in place, and briefly, how they can protect themselves in case of a fire.
Training Needs
● Training should be provided to Fire Use practitioners in the aerial application of fire in slash (model 12 & 13) models on landscape size burns. This should be done by recruiting a burning cadre experienced in large burns in these types of fuels.
● Train Information Officers on the unique fire potential situation that presents itself as a result of the blowdown event. These personnel need to be available all fire season to develop and implement strategies to keep emergency services, neighboring communities, outfitters, BWCAW visitors, and the general public informed on a daily basis of the fire danger and status of any fires in, or adjacent to the blowdown areas. This needs to be coordinated with the fire prevention effort and Wilderness permitting system.
● Wilderness recreationists need to be well informed of the risks they are assuming by choosing to venture into this high fire risk area. They need to be trained on how to conduct themselves to prevent fires, and how to protect themselves if they come upon a fire.
● Recreationists, private landowners, and area visitors should be trained to identify potentially hazardous fire situations and have plans in place to evacuate to safe areas such as the lakes. Keep in mind the watercraft that may be needed to withstand the high wind conditions that would likely be associated with a fire event of this magnitude.
● Training on how to protect yourself should focus on the following target groups
In-house/outfitters
Home associations
Recreationists
Forest Service employees
Emergency services personnel
Further Study Needed
● Additional fire growth modeling is needed to better predict fire movement under a variety of conditions. Dr. Mark Finney has been tasked to utilize FARSITE, a fire growth program he developed, to gain some understanding of how fires will spread and spot in the blowdown fuels. This information should prove very helpful to calibrate rates of spread under various weather conditions. Once this task has been completed, RERAP runs should be reviewed and updated, if necessary.
● Check weather data sets for accuracy, especially prior to 1973.
http://www.superiornationalforest.org/july4thstorm1999/bwcara/bwcawra.html (47 of 128) [7/7/2004 1:37:39 PM]

FUELS RISK ASSESSMENT OF BLOWDOWN
● Check NFDRS indices for accuracy, especially prior to 1973.
● Careful fire monitoring will need to occur whenever fires burn in the blowdown areas. Well-documented fire growth perimeters, hourly weather observations, crowning and spotting characteristics will greatly enhance fire behavior predictions. It is recommended that RERAP analyses be reviewed and updated, if needed, after accurate information becomes available on fire growth in the blowdown fuels.
References
Anderson, H.E. 1982. Aids to Determining Fuel Models for Estimating Fire Behavior. USDA Forest Service General Technical Report INT-122, Intermountain Forest and Range Experiment Station, Ogden, Utah. 22p.
Arno, S. F., and J. K. Brown. 1989. Managing fire in our forests: Time for a new initiative. J. Forestry 87(12):44-46.
Deeming, John E., Robert E. Burgan, and jack D. Cohen. 1977. The National Fire Danger Rating System—1978. Usda Forest Service Gen. Tech. Rep. INT-39, 63 p. Intermt. For. And Range Exp. Stn., Ogden, Utah 84401.
Haines, D.A., Sando, R.W. 1969. Climatic Conditions Preceding Historically Great Fires in the North Central Region. North Central Forest Experiment Station, St. Paul Minn. USDA Forest Service Research paper NC-34. 19 p., illus.
Haines, D.A., Sando, R.W. 1972. Fire Weather and Behavior of the Little Sioux Fire. North Central Forest Experiment Station, St. Paul Minn. USDA Forest Service Research paper NC-76. 6p., illus.
Heinselman, M. 1996. The Boundary Waters Wilderness Ecosystem. University of Minnesota Press.
Stivers, J 1999. Fuels Assessment, Independence Day Blowdown, Superior NF, Gunflint RD.
Stocks, B.J. 1975. The 1974 Wildfire Situation in Northwestern Ontario. Great Lakes Forest Research Center, Sault Ste. Marie, Ontario. Report 0-X-232.
Glossary
90th percentile weather – The threshold of weather parameters where ninety percent of the weather observations are less than this amount.
97th percentile weather - The threshold of weather parameters where ninety-seven percent of the weather observations are less than this amount.
Energy Release Component (ERC) – The ERC is based on the estimated potential available energy released per unit area n the flaming zone of the fire. The ERC is dependent on the same fuel characteristics as the Spread Component; loading, compaction, particle size, heat of combustion, and mineral content. The day-to-day variations
http://www.superiornationalforest.org/july4thstorm1999/bwcara/bwcawra.html (48 of 128) [7/7/2004 1:37:39 PM]

FUELS RISK ASSESSMENT OF BLOWDOWN
of the ERC are caused by changes in the moisture contents of the various fuel classes, including the 1,000-h TL class. The ERC is derived from predictions of (1) the rate of heat release per unit area during flaming combustion, and (2) the duration of flaming.
FARSITE – Developed by Dr. Mark Finney, this model spatially and temporally simulates the spread and behavior of fires under conditions of heterogeneous terrain, fuels, and weather.
Fire Family Plus – A software program used to analyze fire weather parameters associated with fire occurrence data.
FlamMap
NVDI - Normalized Difference Vegetation Index (NDVI) data. This information is obtained from NOAA polar-orbiting weather satellites that use Advanced Very High Resolution Radiometers (AVHRR) to analyze infrared reflected light. This information is then used to determine the condition or greenness of vegetation and how it dynamically varies throughout the fire season. This information can be visually displayed to show Relative Greenness (RG) and Departure from Average (DA) greenness. Relative Greenness portrays how green each one-kilometer square pixel is compared to that pixel’s historic range of greenness. Departure from Average portrays how green each pixel is compared to the average greenness value for the same period.
Plume dominated fire – A fire where the power of the fire as a result of high fire intensity is greater than the power of the wind.
RERAP - Rare Event Risk Assessment Process, a model developed by Marc Wiitala, Don Carlton, and Nora Holmquist. This program compares fire growth under various weather and fuel conditions to "fire ending" events in order to dynamically calculate the risk of undesired fire movement prior to weather stopping or ending fire growth.
Wind driven fire – A fire where the power of the wind is greater than the power of the fire.
APPENDIX
http://www.superiornationalforest.org/july4thstorm1999/bwcara/bwcawra.html (49 of 128) [7/7/2004 1:37:39 PM]

FUELS RISK ASSESSMENT OF BLOWDOWN
Appendix A
Project Maps
http://www.superiornationalforest.org/july4thstorm1999/bwcara/bwcawra.html (50 of 128) [7/7/2004 1:37:39 PM]

FUELS RISK ASSESSMENT OF BLOWDOWN
http://www.superiornationalforest.org/july4thstorm1999/bwcara/bwcawra.html (51 of 128) [7/7/2004 1:37:39 PM]

FUELS RISK ASSESSMENT OF BLOWDOWN
http://www.superiornationalforest.org/july4thstorm1999/bwcara/bwcawra.html (52 of 128) [7/7/2004 1:37:39 PM]

FUELS RISK ASSESSMENT OF BLOWDOWN
http://www.superiornationalforest.org/july4thstorm1999/bwcara/bwcawra.html (53 of 128) [7/7/2004 1:37:39 PM]

FUELS RISK ASSESSMENT OF BLOWDOWN
Appendix B
RERAP Assessment
Superior National Forest
http://www.superiornationalforest.org/july4thstorm1999/bwcara/bwcawra.html (54 of 128) [7/7/2004 1:37:39 PM]

FUELS RISK ASSESSMENT OF BLOWDOWN
Boundary Water Canoe Area Wilderness
Rare Event Risk Assessment Process and
Fuels Information
http://www.superiornationalforest.org/july4thstorm1999/bwcara/bwcawra.html (55 of 128) [7/7/2004 1:37:39 PM]
FUELS RISK ASSESSMENT OF BLOWDOWN
Prepared by:
/s/ Thomas A. Wordell
District Fire Management Officer, Walla Walla Ranger District
Umatilla National Forest, Pacific Northwest Region
September 4, 1999
INTRODUCTION
Fuels in the Boundary Water Canoe Area Wilderness (BWCAW) were assessed using past data, satellite imagery and GIS interpretation of vegetation data. This information was used as input to model fire risk using the Rare Event Risk Assessment Process (RERAP) developed by Marc Wiitala, Don Carlton and Nora Holmquist. This program compares fire growth under various weather and fuel conditions to "fire ending" events in order to dynamically calculate the risk of undesired fire movement prior to weather stopping or ending fire growth.
RERAP TRANSECT LINES
A number of transect lines were established prior to running the Rare Event Risk Assessment Process. These transects are the actual directions of fire movement that were calculated using RERAP to determine risk probabilities for fire movement. The transects were selected to capture the similarities and differences in the fuel profiles across the landscape and oriented based on fire history records which indicate large fire growth in this area is typically oriented southwest to northeast or northwest to southeast. Each transect was run with respective fuels and weather information depending on the direction of fire spread selected for analysis. The map below shows transects that were run in the Bow Lake MMA. The fuel models are depicted by color with the magenta representing the blowdown areas.
The map below shows RERAP transects that were run in the western portion of the BWCAW. All documentation for the RERAP analysis references the transect lines as shown on the maps included in this write-up.
http://www.superiornationalforest.org/july4thstorm1999/bwcara/bwcawra.html (56 of 128) [7/7/2004 1:37:39 PM]

FUELS RISK ASSESSMENT OF BLOWDOWN
FUEL PROPORTION INFORMATION
The fuel models used for this analysis were derived from satellite interpreted vegetation data. The crosswalk between vegetation values and fuel models was established by Paul Tine, Zone Fuels Specialist for the Superior National Forest. For this analysis, the summer fuel model values were utilized (see documentation files). Previous RERAP runs made prior to the satellite data were used to help guide Wildland Fire Use decisions. The following table shows the percent of land area occupied by each fuel model for both the satellite data and the previous RERAP run (prior to the "dercho" wind event that caused the blowdown). This information was based on total land area within the BWCAW.
FBPS Fuel Model Previous RERAP Analysis Landsat Fuels Map (Summer %)
10 51% 55%
8 20% 20%
9 10% 1%
5 0 3%
Water 19% 20%
Other 1%
Total 100% 100%
Satellite imagery and an aerial flight map (one-mile square grids) were used to assess the blowdown damage in order to map the blowdown areas. Blowdown areas were broken down into three categories, light damage (0%-33% blowdown), moderate damage (34%-67% blowdown) and heavy damage (68&-100% blowdown). Areas having either moderate or heavy damage were re-classified as FBPS Fuel Model 13. Areas of light damage were re-classified as FBPS Fuel Model 10.
Fuel proportions were determined for each RERAP transect line that was analyzed based on a GIS query of the fuel model data. Specific information on fuel proportions is included in the documentation package for the RERAP analysis.
http://www.superiornationalforest.org/july4thstorm1999/bwcara/bwcawra.html (57 of 128) [7/7/2004 1:37:39 PM]

FUELS RISK ASSESSMENT OF BLOWDOWN
For the blowdown areas, FPBS Fuel Model 13 was used to represent the fuel profile (see photo to the right). Rates of spread in fuel model 13 are discussed below.
http://www.superiornationalforest.org/july4thstorm1999/bwcara/bwcawra.html (58 of 128) [7/7/2004 1:37:39 PM]

FUELS RISK ASSESSMENT OF BLOWDOWN
In most cases, the blown down fuels are fairly continuous as shown in the photo below. Individual pockets of non-blowdown fuels within the areas classified as Fuel Model 13 were not separated out for the RERAP analysis. Water was represented by a FBPS Fuel Model 1 and given an adjusted rate of spread as discussed below.
WINDS
Four wind quadrants were used to analyze fire spread; North to West, West to South, South to East, and East to North. These wind quadrants were used as categories to
http://www.superiornationalforest.org/july4thstorm1999/bwcara/bwcawra.html (59 of 128) [7/7/2004 1:37:39 PM]

FUELS RISK ASSESSMENT OF BLOWDOWN
parse climatological data in order to arrive at fuel moistures and wind speeds for low, moderate, high and extreme weather conditions. These weather parameters for each of the four wind quadrants were then used to model fire behavior for the various fuel models within the Boundary Water Canoe Area Wilderness.
TERM DATA (Fire ending event data)
Weather events that end fire spread are used to define the term data file in RERAP. Two term files were established to represent the spring and fall (bimodal) fire seasons this part of the country typically experiences. Marc Wiitala, one of the developers of RERAP, was contacted by phone and validated our approach using statistical inference from two term files in this situation.
Term data was obtained from the Ely, Minnesota RAWS station from 1973-1998. These twenty-six years were selected because they included both warm, dry and cool, moist annual data plus dependable NFDRS indices and fire occurrence data.
The first term period start date was set to May 1st. This decision was based on the fact that fires typically don’t begin in the BWCA until 5/1 or later.
The second term period start date was set to July 1st. This was based on the fact that precipitation and fire occurrence records support a trend that significant rain events typically end fires burning prior to that date.
Term criteria was initially based on 2 inches of rain over a 5-day period. This amount of precipitation was felt to be sufficient to "end" a fire burning prior this type of event. Previous analysis conducted by Paul Tine, Zone Fuels Specialist for this area, indicates that 0.75 inches of rain over 5 days proved sufficient to stop fire growth in non-blowdown conditions. This gave managers time to consider climatological conditions to determine if further suppression action was required. The current blowdown situation has significantly changed past conditions. Dramatically more downed fuel is present and much of the area is inaccessible for fire suppression efforts due to firefighter safety concerns. Paul suggested two inches of rain should be sufficient to actually "end" the fire event without requiring ground forces. However, it was noted that in many cases, rain events that met the term criteria of 2 inches occurred over very short durations (less than 3-4 hours). Therefore a check of ERC values and fire occurrence data for the same period was conducted to determine if the rain event truly represented a "fire ending" event. If the term date selected by the rain criteria preceded a period of high ERCs and continuing fire occurrence, a later date was selected based on a combination of precipitation data, low ERC values and a marked decrease in fire activity. If term conditions were not met, November 15th was used as the end of the season date. In years where multiple term events met the conditions, the first qualifying term date was used if not followed by significant fire activity or ERC values far in excess of average.
Rates of Spread
RERAP was allowed to generate surface rates of spread for most of the conditions using the internal BEHAVE calculations with the following exceptions:
Fuel Model 1 - This model was used to represent water. It was given a ROS of 0 for all categories except extreme where it was felt the fire could "jump" water barriers. In the extreme category it was assigned an ROS of 20 chains/hour to represent the fire slowing down to make "attempts" of spotting across these barriers.
Fuel Model 8 Extreme category, shaded and sheltered fuels: 20 chains/hour
Fuel Model 9 Extreme category, shaded and sheltered fuels: 26 chains/hour
Fuel Model 10 Extreme category, partially sheltered, un-shaded fuels: 80 chains/hour
Extreme category, sheltered, shaded fuels: 51 chains/hour
http://www.superiornationalforest.org/july4thstorm1999/bwcara/bwcawra.html (60 of 128) [7/7/2004 1:37:39 PM]

FUELS RISK ASSESSMENT OF BLOWDOWN
High category, partially sheltered, un-shaded fuels: 20 chains/hour
High category, sheltered, shaded fuels: 10 chains/hour
** The entries for Fuel Models 8, 9 and 10 were based on past fire growth observations and documentation from local fire management personnel.
Fuel Model 13 - A manual ROS of 37 chains/hour was assigned to the extreme category for all time periods. This rate is documented from past fire growth observations in blowdown fuels from the Dryden #18 Fire in the 1975 publication "The 1974 Wildfire Situation in Northwestern Ontario" by B.J. Stocks.
RERAP OUTCOMES AND RESULTS
Using the inputs discussed above, each transect line was analyzed using RERAP to determine the probability of fire growth prior to a fire ending event. A matrix table was generated for each transect line to show the risk of fire growth if the fire initiated at various times during the fire season at various distances from a point of concern. Two example tables and corresponding graphs are included below which displays the risk of fire growth in the Bow Lake MMA (a pre-determined prescription area within the BWCAW) if the fire were to spread from the Southwest to the Northeast. The first matrix table and graph shows the risk in the east half of Bow Lake MMA where FBPS Fuel Model 8 occupies approximately 50% of the land area. The second matrix table and graph displays the risk in the same MMA where the fire is modeled to burn in FBPS Fuel Model 13 (e.g. Blowdown). Note the difference in risk between the two scenarios. The white area of the tables show the distance and periods of high risk (>10%), dark gray shows moderate risk (01% - 09%) and light gray is low risk (<01%).
RARE EVENT RISK ANALYSIS – BOUNDARY WATER CANOE AREA WILDERNESS
BASED ON WEATHER DATA FROM 1973 –1998
Risk Displayed Based on W, SW, & S Wind Directions
BOW LAKE MMA – TRANSECT LINE 1B / SW TO NE SPREAD DIRECTION / FUEL MODELS 5, 8, 9, 10, WATER
(East half of MMA where Fuel Model 8 is predominant)
Miles From
Boundary
May 1 May 15 June 1 June 15 July 1 July 15 August 15 September 15 October 15
1 54% 49% 46% 43% 39% 58% 46% 37% 32%
2 45% 31% 20% 18% 15% 28% 19% 13% 09%
http://www.superiornationalforest.org/july4thstorm1999/bwcara/bwcawra.html (61 of 128) [7/7/2004 1:37:39 PM]

FUELS RISK ASSESSMENT OF BLOWDOWN
3 26% 22% 13% 14% 15% 28% 19% 05% 03%
4 16% 09% 08% 07% 05% 12% 07% 04% 03%
5 11% 09% 04% 05% 05% 12% 04% 01% <01%
6 05% 04% 03% 02% 02% 05% 02% <01% <01%
7 05% 02% 01% 01% 02% 03% <01% <01% <01%
8 02% 01% <01% <01% <01% 02% <01% <01% <01%
9 01% <01% <01% <01% <01% <01% <01% <01% <01%
10 <01% <01% <01% <01% <01% <01% <01% <01% <01%
11 <01% <01% <01% <01% <01% <01% <01% <01% <01%
12 <01% <01% <01% <01% <01% <01% <01% <01% <01%
13 <01% <01% <01% <01% <01% <01% <01% <01% <01%
14 <01% <01% <01% <01% <01% <01% <01% <01% <01%
15 <01% <01% <01% <01% <01% <01% <01% <01% <01%
16 <01% <01% <01% <01% <01% <01% <01% <01% <01%
Chart displays the risk of a fire exiting the MMA boundary line before a "fire ending" event (~2.0 inches of rain over 5 day period - see RERAP documentation) with spring and fall term files.
100% to 10% = HIGH RISK
9% to 01 % = MODERATE RISK
<01% = LOW RISK
RARE EVENT RISK ANALYSIS – BOUNDARY WATER CANOE AREA WILDERNESS
BASED ON WEATHER DATA FROM 1973 –1998
Risk Displayed Based on W, SW, & S Wind Directionshttp://www.superiornationalforest.org/july4thstorm1999/bwcara/bwcawra.html (62 of 128) [7/7/2004 1:37:39 PM]

FUELS RISK ASSESSMENT OF BLOWDOWN
BOW LAKE MMA – TRANSECT LINE 1B / SW TO NE SPREAD DIRECTION / FUEL MODELS 5, 8, 9, 10, WATER
(East half of MMA where Fuel Model 8 is predominant)
RARE EVENT RISK ANALYSIS – BOUNDARY WATER CANOE AREA WILDERNESS
BASED ON WEATHER DATA FROM 1973 –1998
Risk Displayed Based on W, SW, & S Wind Directions
BOW LAKE MMA – TRANSECT LINE 03 / SW TO NE SPREAD DIRECTION
http://www.superiornationalforest.org/july4thstorm1999/bwcara/bwcawra.html (63 of 128) [7/7/2004 1:37:39 PM]

FUELS RISK ASSESSMENT OF BLOWDOWN
FUEL MODEL 13, WATER (Blowdown Conditions)
Miles From
Boundary
May 1 May 15 June 1 June 15 July 1 July 15 August 15 September 15 October 15
1 100% 100% 94% 93% 92% 98% 94% 90% 86%
2 96% 91% 89% 87% 85% 96% 88% 81% 76%
3 93% 87% 84% 82% 79% 94% 83% 72% 65%
4 90% 83% 78% 76% 72% 91% 77% 64% 55%
5 86% 78% 73% 70% 65% 87% 71% 57% 47%
6 82% 74% 69% 65% 60% 85% 65% 50% 40%
7 78% 70% 64% 60% 55% 82% 60% 44% 34%
8 75% 66% 59% 55% 51% 77% 55% 38% 29%
9 71% 62% 55% 50% 46% 74% 50% 33% 24%
10 67% 58% 50% 46% 42% 70% 45% 29% 20%
11 64% 54% 47% 43% 38% 66% 40% 25% 17%
12 60% 51% 44% 39% 34% 62% 36% 22% 14%
13 56% 47% 40% 36% 31% 58% 32% 18% 12%
14 53% 44% 37% 33% 28% 54% 28% 16% 10%
Chart displays the risk of a fire exiting the MMA boundary line before a "fire ending" event (~2.0 inches of rain over 5 day period - see RERAP documentation) with spring and fall term files..
100% to 10% = HIGH RISK
9% to 01 % = MODERATE RISK
<01% = LOW RISK
http://www.superiornationalforest.org/july4thstorm1999/bwcara/bwcawra.html (64 of 128) [7/7/2004 1:37:39 PM]

FUELS RISK ASSESSMENT OF BLOWDOWN
RARE EVENT RISK ANALYSIS – BOUNDARY WATER CANOE AREA WILDERNESS
BASED ON WEATHER DATA FROM 1973 –1998
Risk Displayed Based on W, SW, & S Wind Directions
BOW LAKE MMA – TRANSECT LINE 03 / SW TO NE SPREAD DIRECTION
FUEL MODEL 13, WATER (Blowdown Conditions)
FIRE BEHAVIOR THRESHOLDS
Fire Family Plus, a software program used to analyze fire weather parameters associated with fire occurrence data, was used to determine fire behavior thresholds. The
http://www.superiornationalforest.org/july4thstorm1999/bwcara/bwcawra.html (65 of 128) [7/7/2004 1:37:39 PM]

FUELS RISK ASSESSMENT OF BLOWDOWN
thresholds for significant fire growth are listed below. Fires occurring with weather parameters or fire indices above the thresholds listed have the potential to burn intensely or spread rapidly. These thresholds can be used as general guidelines to help warn fire managers and firefighters of impending fire danger. The 90% threshold relates to "very high" fire danger while the 97% threshold relates to "extreme" fire danger.
Spring Fire Behavior Thresholds
Energy Release Component (ERC) 90% = 36 97% = 46
Burning Index (BI) 90% = 46 97% = 56
Relative Humidity (RH) 90% = 20% 97% = 16%
Temperature 90% = 83 degrees 97% = 85 degrees
100 Hour Fuels 90% = 12% 97% = 10%
1000 Hour Fuels 90% = 16% 97% = 14%
20 Foot Wind Speeds 90% = 12 mph 97% = 15 mph
Fall Fire Behavior Thresholds
Energy Release Component (ERC) 90% = 32 97% = 37
Burning Index (BI) 90% = 36 97% = 44
Relative Humidity (RH) 90% = 30% 97% = 25%
Temperature 90% = 80 degrees 97% = 84 degrees
100 Hour Fuels 90% = 14% 97% = 12%
1000 Hour Fuels 90% = 18% 97% = 16%
20 Foot Wind Speeds 90% = 12 mph 97% = 15 mph
http://www.superiornationalforest.org/july4thstorm1999/bwcara/bwcawra.html (66 of 128) [7/7/2004 1:37:39 PM]

FUELS RISK ASSESSMENT OF BLOWDOWN
SUMMARY
The Rare Event Risk Assessment Process serves as a good tool to compare fire growth with fire ending events to determine the risk associated with management decisions. The results obtained from this analysis have been displayed in matrix tables to assist with Wildland Fire Use and suppression decisions. Complete matrix tables, graphs and documentation on all of the RERAP transect lines is included in the analysis file and electronically on disk.
RERAP predicts a dramatic increase in risk for future fires burning within the blowdown areas. It predicts these fires will have a common daily spread that is ten to twenty times greater than fires burning in Fuel Model 10. That means that large fire growth will occur under moderate weather conditions and will not be dependent on wind events. In fact, while these "rare" wind events still present a significant opportunity for rapid fire growth in the blowdown areas, RERAP indicates they only increase the common daily spread by 120% to 130% overall. By comparison, RERAP shows that rare events in Fuel Model 10 increase the common daily spread by 200% to 800% overall (depending on time of year). In summary, fires occurring in the blowdown fuels will tend to grow slower than wind driven fires in Fuel Model 10, but will continue to increase in size under a broader range of weather conditions. A steady fire growth can be expected during the majority of the fire season between rain events. Fire perimeters should be more circular and may tend to out-flank natural barriers.
Spotting potential was discussed at length. In the past, most of the spotting across waterways was associated with strong wind events. The remnant standing and hinged trees in the blowdown areas will provide ample firebrand sources for spotting. Since fires occurring in the blowdown areas will burn under a broad range of weather conditions, the majority of the spotting on moderate days could be short range. However, the increased fuel loading will also increase the potential for plume dominated fire characteristics, lofting firebrands high into the atmosphere. This, in turn, could increase the likelihood of longer range spotting. Profuse short range spotting is expected. How this fuel profile will affect the likelihood long-range spotting or chance firebrands crossing waterways is unknown.
RECOMMENDATIONS
Fuel inventory work is needed to better characterize the fuel profile in the blowdown areas. Roger Ottmar from the Pacific Northwest Research Laboratory, Seattle, has been tasked to inventory the fuels and his team should be able to provide much needed information on fuel loading. Custom fuel models should be considered, however without actual fire behavior observations, predictions will still be academic.
Additional fire growth modeling is needed to better predict fire movement under a variety of conditions. Mark Finney has been tasked to utilize FARSITE, a fire growth program he developed, to gain some understanding of how fires will spread and spot in the blowdown fuels. This information should prove very helpful to calibrate rates of spread under various weather conditions. Once this task has been completed, RERAP runs should be reviewed and updated, if necessary.
Careful fire monitoring will need to occur whenever fires burn in the blowdown areas. Well-documented fire growth perimeters, hourly weather observations, crowning and spotting characteristics will greatly enhance fire behavior predictions. It is recommended that RERAP analyses be reviewed and updated, if needed, after accurate information becomes available on fire growth in the blowdown fuels.
NDVI images from June through August 1999 were reviewed and clearly showed the difference in greenness between the blowdown fuels and surrounding vegetation. I recommend these images continue to be downloaded and monitored weekly during the fire season to assess fire danger in this area. Departure from Average images should provide a good idea for how much different the fuels are from historic averages. Relative Greenness images will help managers determine how the blowdown fuel moisture compare to surrounding vegetation and when they might expect fire activity in the blowdown areas.
Opportunities for fuels treatment inside and outside the BWCAW, including harvest and Wildland Fire Use, should be aggressively pursued to help break up the continuity of the blowdown fuels. Mark Finney will use FARSITE to analyze the effect of various spatial patterns of treatment on fire growth. His findings should be applied to gain the most benefit from the acres treated.
http://www.superiornationalforest.org/july4thstorm1999/bwcara/bwcawra.html (67 of 128) [7/7/2004 1:37:39 PM]
FUELS RISK ASSESSMENT OF BLOWDOWN
Suppression tactics will need to be re-analyzed with an eye on firefighter safety in areas where access and egress is an issue. Fires occurring in the blowdown areas will burn intensely, hold heat in the larger diameter fuels and will be difficult or impossible to extinguish using ground or aerial resources once they become established.
Public use restrictions need to be well planned and implemented to mitigate the occurrence of human caused ignitions. Wilderness travelers will need to be warned of the hazardous conditions they are entering. Clear guidelines need to be established on how they can protect themselves in case they are threatened by wildfire. A professionally scripted video is probably the best method to instruct wilderness travelers about hazards they face in the blowdown areas.
Close coordination with local agencies is mandatory to ensure evacuation plans are prepared in advance and implemented in a timely manner if the need arises. The communication links in the Gunflint Corridor need to be assessed and improvements made in order to establish reliable radio, telephone and television links.
Good Luck!
Thomas A. Wordell
Appendix C
Spatial Analysis of Fire Behavior
A Spatial Analysis of Fire Behavior Associated with
Forest Blowdown in the Boundary Waters Canoe Area, Minnesota
1/31/2000
http://www.superiornationalforest.org/july4thstorm1999/bwcara/bwcawra.html (68 of 128) [7/7/2004 1:37:39 PM]

FUELS RISK ASSESSMENT OF BLOWDOWN
Mark A. Finney
Research Scientist
Systems for Environmental Management
7735 Groom's Rd. Missoula MT 59808-8505
[email protected] (406) 726-2017
Summary
On the afternoon of July 4th, 1999, a rare "derecho" wind event struck the northeastern edge of Minnesota and continued east into southern Ontario Canada. Winds flattened forests to an unprecedented extent (approximately 478,000 ac) within the Boundary Waters Canoe Area Wilderness (BWCAW) and adjacent lands to the east. The damaged forest lies within several linear swaths 4-15 miles wide and oriented in an east-west direction. Available data suggest that the affected forests have had almost all overstory trees toppled or broken, although the damage may only affect some portions of the local landscape. Wind speeds of 76 mph were recorded by the weather station by the Seagull before being destroyed in the storm; this station was located along the Gunflint Trail on the eastern edge of the largest swath of damaged forest.
The spatial consequences of the blowdown to fire behavior were analyzed using existing GIS and weather data. These data have recognized inaccuracies and limitations but were nonetheless used for this assessment to generate some immediate information and to help identify future data needs. The following analyses were performed:
● Maps were produced of potential fire behavior using the FlamMap computer program for fuel conditions before and after the blowdown based on historic percentile weather summaries.● Two historic fires in the BWCA (Little Gabbro Lake 1995 and White Feather Lake 1996) were simulated using FARSITE (Finney 1998) with the Remote Automated Weather Station (RAWS)
data at Ely, Minnesota so that the utility of the fuel/vegetation data for simulating fire behavior in pre-blowdown conditions could be assessed. It was also used to suggest modifications required to make these data as useful as possible.
● Example simulations were then performed within the heart of the blowdown areas in the BWCA to illustrate the spatial consequences to fire growth and behavior patterns resulting from the change in fuel and forest structure. Fire sizes, spread characteristics, and responses to changes in the environmental conditions were illustrated.
● The potential for using fuel treatments to disrupt the continuous blowdown fuels was explored in terms of locations for treatments and their pattern across the BWCAW landscape. Ideas were based on theoretical modeling of fire growth across fragmented fuel patterns (Finney in press).
The blowdown fuels, represented as a "slash" fuel model (US Fire Behavior Fuel Model 13, Anderson 1982), were well known before this analysis to cause greater fire intensities and spread rates under all but the extreme crown fire conditions (Stocks 1975). Flattening of the forest canopy increases windspeed at the fuel level and the exposure to sunlight for drying of surface fuels. Only under extreme fire weather and fuel moisture conditions that instigate crown fires in standing conifer forests be consistently expected to produce greater spread rates, intensities, and prolific spotting. These fire behavior differences were well depicted spatially from the FlamMap output. They were also borne out by comparisons of fire growth patterns from the pre- and post-blowdown landscapes. Here, fire patterns in the blowdown fuels were broader and approximately ten times larger under moderate conditions that the same fire simulated for pre-blowdown fuel structure (these areas exclude the area of lakes encompassed within the fire perimeter however). The spatial locations and patterns used for disrupting fire growth across the entire blowdown area suggests that many treatments can probably be juxtaposed with lakes and bogs to afford an efficient delay of fire growth and spread out of the BWCA wilderness to developed lands. To achieve uniform level of fire disruption across the blowdown areas, however, some treatments must be placed in areas that do not have the benefit of a lake as a boundary. More detailed spatial data, such as satellite imagery, on vegetation and fuels would help refine simulations of fire behavior and be useful for planning any landscape-level treatment strategy.
Introduction
Spatial modeling of fire behavior requires spatial data from a geographic information system (GIS) as input. It also requires local weather data to drive fire behavior at the specific fire site. A computer simulation model (FARSITE: Fire Area Simulator, Finney 1998) can be used to model how individual fires grow and behave as they expand across the landscape under varying weather conditions. FARSITE is used in the U.S. for predictions on active fires, for planning of fuel management programs, and for reconstructing past fire behavior patterns and mechanisms.
Another model, FlamMap has recently been developed to make fire behavior calculations for all locations on a landscape using GIS data inputs for terrain and fuels. GIS data required for FlamMap are
http://www.superiornationalforest.org/july4thstorm1999/bwcara/bwcawra.html (69 of 128) [7/7/2004 1:37:39 PM]

FUELS RISK ASSESSMENT OF BLOWDOWN
the same as for FARSITE. The purpose of FlamMap is to generate fire behavior data that are comparable across the landscape for a given set of weather and/or fuel moisture data inputs. The fire behavior models in FlamMap are used to make calculations for all cells of a raster landscape, independently of one another. That is, there is no contagious process that accounts for fire movement across the landscape or among adjacent cells. FlamMap only calculates the instantaneous behavior of a fire occurring at each location given local weather inputs and allows comparisons of fire behavior across a landscape and is useful for distinguishing hazardous fuel and topographic combinations.
FARSITE and FlamMap incorporate models for individual fire behaviors that are currently in use in the U.S. and Canada as part of their respective fire behavior prediction systems. The models for surface fire, crown fire initiation and spread, fire acceleration, fuel moisture and spotting from torching trees each have their own limitations and assumptions that need to be considered when interpreting results of fire behavior calculations. Specifically, the accuracy of the input data needs to be verified, but also the data must be made useful for producing fire behavior output that is consistent with observations. This process of data checking, modification, and comparison with known fires, is referred to as calibration. Calibration gives some confidence that fire behavior calculations and FARSITE simulations can be used to explore the consequences of changes in fuel types or weather conditions on fire growth patterns and behavior.
Analysis Procedures
The source of the spatial data for this analysis was a series of layers interpreted from a basic vegetation map (Appendix 1) and the USGS digital elevation model. All layers had a resolution of 30 meters. The vegetation map was developed by the Natural Resources Research Institute (a branch of the University of Minnesota in Duluth) based on satellite imagery. The vegetation map primarily distinguished differences in forest overstory composition. As the only source of data, this vegetation map was used to infer fuel-specific properties of those types based on local expertise in fire behavior and fuels. The following attributes were assigned for use in the fire behavior models (FARSITE and FlamMap):
● Surface fuel model (1-13, standard U.S. FBPS models)● Canopy Cover (percentage, or percentage class)● Stand Height (meters)● Effective Crown Base Height (meters)● Effective Crown Bulk Density (kg/m3)
The original vegetation classification was not specifically developed to represent fuel or forest structural characteristics. Interpretations of fuel characteristics would thus be assumed to contain considerable absolute error that could not, within the scope of this assessment, be verified by fieldwork. Data inaccuracies however, don't necessarily prevent modeling from producing useful results. The relative accuracy of the data themselves and the fire behavior produced by them still provide meaningful results for comparison purposes. All spatial data sets suffer from error and much of this is compensated by adjustments to the fuel types during the calibration process to make the fire behavior models perform similar to observed fire behavior.
A map of the areas affected by blowdown was acquired from the Minnesota Interagency Fire Center. The extent of the blowdown was mapped by a combination of aerial reconnaissance and satellite imagery. These methods probably overestimate the continuity of blowdown (at least at a resolution of 30-100 m), given that the aerial reconnaissance mapped only to the nearest one square-mile section. Little was known about the quantitative structural attributes of the blowdown fuels or their variation across the area at the time of this analysis. Areas affected by blowdown were thus characterized by a uniform slash fuel condition (surface fuel model 13, canopy cover of 1%, with the same values for stand height and crown base height).
Calibration of FARSITE was done by comparing simulation output to known fire perimeters and associated times on historic fires in the area. The Ely RAWS station was used as the source of weather and wind data. Two fires were used for calibration: Little Gabbro Lake fire (June 1995), White Feather Lake Fire (June 1996). The process of calibration indicates what is needed to generate realistic results from FARSITE under the specific weather conditions and fuel types for these fires.
Simulations were performed in a sample area affected by the blowdown. Comparisons were made for fire growth and behavior simulated for 10 days using the pre-blowdown fuels as well as those resulting from the blowdown. The weather and wind conditions used for comparison were the same as for the White Feather Lake fire because they contained a range of fire weather conditions, including periods of relatively moderate weather and periods of higher winds and lower humidity. This permitted some interpretation of how fire behavior would be affected by realistic fluctuations in burning conditions.
FlamMap was used here to illustrate to fire behavior across the BWCA resulting from the blowdown. FlamMap was used to generate maps of fire behavior for percentile weather conditions (15, 75, 90, and 97th) generalized from those used for RERAP analysis. These are based on climatology derived from a weather station at Ely, Minnesota, and processed to correlate with fire activity percentiles. The windspeeds are somewhat higher than the average windspeeds obtained from the climatological summary. Experience has shown that the average windspeeds from a single daily observation at a given weather station are not well correlated with fire activity. Gusts or periods of high winds before or after the 1400hr observation time cause spotting and crown fire runs that produce most of the fire activity, fire behavior, and acres burned. Sando and Haines (1972) describe increases in fire behavior because of cold front winds (20-30 mph) that was not reflected in the daily average windspeed (16 mph) from a single observation.
http://www.superiornationalforest.org/july4thstorm1999/bwcara/bwcawra.html (70 of 128) [7/7/2004 1:37:39 PM]

FUELS RISK ASSESSMENT OF BLOWDOWN
Low (15%) Moderate (75%) High (90%) Extreme (75%)
1hr 18 10 8 6
10hr 20 13 10 7
100hr 34 17 15 14
Live 130 110 85 75
Wind speed (mph) 5 10 15 20
Wind direction Uphill Uphill Uphill Uphill
Possible locations for fuel treatments were explored across the heart of the largest blowdown area. The strategy was to pattern these treatments in an overlapping "brick" type pattern that would effectively break up the continuous coverage of blow down fuels were explored. By spatially fragmenting the fuel complex, fire growth would be repeatedly disrupted or locally blocked by the treatments. This would obviously not stop large fires. An effective arrangement of fuel treatments however, could delay fire progress across the landscape, increasing the likelihood that the weather would change or suppression would be effective before fire would threaten properties outside the wilderness area. In the short-term (say 2-5 years), the task of treating the entire blowdown landscape is not possible. The strategic placement of treatment patches in relation to existing barriers (lakes, bogs etc.) is one approach to mitigating the hazard presented by the change in fuels structure. Its effectiveness and practicality will need to be further assessed.
Results and Discussion
FlamMap Analysis
The FlamMap analysis supported intuitive assessments of how fire behavior would change in the blowdown fuels. Assuming fuel moistures were constant for all fuel models, the fire weather at the lowest percentile (15%) would likely produce moderately faster and more intense fire behavior within the blowdown fuels than in the undisturbed fuel types (Figure 1a). The high fuel moistures and low windspeeds are not conducive to producing large fires regardless of how much fuel is present. As the fire weather becomes drier with higher windspeeds (75th and 90th percentile), the blowdown fuels produce substantially greater spread rates and intensities (Figure 1b, c). This results not only from the higher loading and depth of the slash-like fuel complex but also because of the relatively greater windspeeds affecting fire in those fuels. The lack of canopy cover greatly increases the midflame windspeed for fires burning in the blowdown fuels compared to the understory fuels in the intact forest. Only under extreme conditions (97th percentile) does crown fire spread rate and intensity exceed that in the blowdown fuels (Figure 1d).
This analysis has some assumptions, however, that must be considered for interpreting the results. First, the fuel moistures were the same for all fuel models for each run. This is useful for comparison of the fire behavior but is not particularly realistic for any given day. The fuel moistures at each site would be affected by their local topography, shading, wind exposure, and wetting and drying. In the early part of the fire season, the fuels in the blowdown would likely dry at a faster rate than fuels in the understory because of their increased exposure to sunlight and wind. Thus, the FlamMap analysis described here might be expected to underpredict fire behavior under the more moderate or low conditions on exposed slopes or ridges (because of increased wind and sun). However, in the late season, faster wetting of the finer fuels in the blowdown area would likely occur from rains or snow because of their greater exposure. Also, the spread rate maps that can be generated from FlamMap do not reflect the contribution by spotting to the effective spread rate of the fire. Spotting is an important means of producing faster fire spread when crown fires occur. The increased intensities associated with crown fires (because of crown fuel involvement) are represented by FlamMap output, but if actual crown fire spread is not occurring (active crown fire) then the spread rate will remain unaffected by the presence of torching trees (passive crown fire).
FARSITE calibration
http://www.superiornationalforest.org/july4thstorm1999/bwcara/bwcawra.html (71 of 128) [7/7/2004 1:37:39 PM]

FUELS RISK ASSESSMENT OF BLOWDOWN
The FARSITE simulations showed reasonable results during calibration with the Little Gabbro Lake Fire (1995) and the White Feather Lake Fire (1996) after some adjustment of the input data.
The fire simulation performed better on the Little Gabbro Lake fire (Figure 2) than the White Feather Lake Fire (Figure 3). Adjustment factors for all surface fuel models were set to 0.35 to account for fine-scale discontinuities in fuels and wind fluctuations. A reduced crown base height in the jack pine types (to 1.0 meter) was needed to generate crown fire for both fires. However, the White Feather Lake fire required a conversion to a surface fuel model 11 or 12 to generate enough intensity to produce fire growth consistent with that recorded for the last 2-3 days.
The gust windspeed was used for all simulations and seems consistently to be a better indicator of fire behavior than the 10-minute average. This is particularly important to generate crown fire coincident with the observed episodes of crown fire behavior and faster spread on days with higher winds. The utility of the gust speed might be related to 1) the way that winds are averaged or sampled by the instruments at the weather stations, or 2) the effect of gusts or short-term increases in speed on dramatic changes in fire behavior as recorded in the fire progression pattern. The average windspeed is often calculated as a 10-minute average for a specific portion of each hour. This can easily exclude many higher windspeeds that occur over short periods (several minutes) during the remainder of the hour; the average can also dilute these winds with much slower windspeeds that occur during the sampling period. Without the gust speeds, the average windspeeds tend to be so damped by lulls that little fire behavior occurs. Gust speeds are often twice the average and sometimes five times higher than the average (for lower windspeeds).
There were several problems with using the RAWS weather data in the calibration. First, the precision of the wind direction appears to be limited to 45 degrees (8 total directions). The true wind direction is probably obtained by rounding-off to the nearest of 8 directions, thereby producing an artificially constant wind direction in the simulation that will suddenly shift by no less than 45 degrees. Second, the weather station at Ely does not appear to be wholly representative of the fire locations at the time of the fires. Wind directions and speeds are sometimes not consistent with the observed fire growth patterns. For example, the fire growth pattern might suggest that large spread due do high winds that do not occur on the RAWS data stream.
The limitations of the fire behavior models in FARSITE (and FlamMap) make these models suitable only for wind-driven fires, not for fire behavior that is dependent on strong feedbacks with the atmosphere (plume dominated fires, fire whirls etc.). Plume dominated fire activity (Rothermel 1991) may be expected to occur in the BWCA, both in blowdown fuels and elsewhere, but cannot be modeled with any tools presently available. The likely consequences of having plume-dominated behavior will be large growth pulses and spotting in multiple directions, which will likely exceed the predictions of FARSITE.
Blowdown effects on fire growth
Simulated fire growth in blowdown fuels showed a large increase in spread in all directions that was more susceptible to wind direction changes than fuels not affected by blowdown (Figure 4). The fire simulated in the blowdown was ~24,000 acres compared to 2,000 acres in the previous fuel types. The loss of sheltering by a forest canopy leaves the slash-like blowdown fuels more exposed to winds and changes in those winds. Much larger and more consistent spread was observed in the blowdown fuels, even during moderate periods. This is consequences of 1) the increased wind exposure, 2) faster spread in slash fuels than in understory fuels, and 3) decreased fuel moistures resulting from the loss of overstory shading. These results are consistent with the fire growth patterns in blowdown fuels reported by Stocks (1975). Furthermore, much larger rapid growth resulted from spotting when stronger winds occurred.
The simulation results may somewhat over-represent fire growth in the blowdown fuels. Fuels as represented in current data are probably homogenized by the crude methods used by mapping their extent and by the simplistic assignment of a single fuel model to those areas. In reality, there will be some variation, if not in the structure of the blowdown fuels, then in the fine-scale continuity of the damage. For example, a 1-square-mile section may appear to an observer in an aircraft to have been completely flattened, because it is easy to ignore the small patches within the blowdown that have little damage. However, if these patches are numerous or oriented normal to the direction of fire travel, they might have a significant effect on fire growth, by slowing the fire along a particular flank under some weather conditions. However, the blowdown clearly has homogenized fuels in the damaged areas compared to conditions prior to the wind event. A variety of fuel types, vegetation types, and canopy conditions occurred prior to the blowdown, which would have had a marked effect on fire growth. These variations have been largely eliminated by the flattening of the forest overstory and replaced by a slash-like fuel complex with little sheltering from overstory trees.
Fuel treatment locations
An attempt was made to locate areas that would be practical for treating by prescribed fire, and effective in creating, a disruptive spatial pattern across a sample area of the BWCA. Prescribed fire is a practical means of reducing fuels over large and inaccessible areas within the BWCAW. Locating treatments next to water or moist vegetation (bogs) will limit the growth on at least one side of the treatment patch. The locations were chosen with several criteria as described by a theoretical model of treatment patterns (Finney in press):
1. to fortify natural barriers as much as possible (i.e. lakes and bogs).2. to minimize the area treated. 3. to overlap with nearby patches and lakes in the primary direction of spread (west-east).
http://www.superiornationalforest.org/july4thstorm1999/bwcara/bwcawra.html (72 of 128) [7/7/2004 1:37:39 PM]

FUELS RISK ASSESSMENT OF BLOWDOWN
4. to influence potential fire growth over as much of the landscape as possible.5. to separate the treatment patches only by short distances relative to the expected fire sizes.
To satisfy the first criterion, treatment units were located 1) next to the smaller lakes to expand their width as impediments to spotting, and 2) to include islands in lakes to decrease the overall continuity of the lake and take away "stepping-stones" for spot fires (fires often spot from island to island, eventually arriving on the other side of the lake). The second criterion was implemented by orienting the treatment units as narrow strips (1/4 to 1/2 mile wide) running in predominantly a north-south orientation. This orientation is most efficient for disrupting fires commonly spreading from the directions associated with cold fronts and large fire runs (from the west, southwest or northwest). Treatment units need to be wide enough to stop spotting observed for most fires but will not be sufficient for "worst-case" conditions. The third criterion ensured that there was no clear pathway across the landscape because a series of treatment units forced the fire to flank around them in order to move forward. The fourth criterion was addressed by locating a number of treatment units around the blowdown area to provide some disruption of fire growth regardless of the ignition location. The last criterion was met by placing new treatment patches at least every 1 to 2 miles, especially in the east-west direction of expected fire travel (this increases the number of times that a fire will be interrupted in its progress, see Figure 5 and Figure 6).
Treated fuels were assumed to spread slowly and were assigned a standard fuel model 8. This would probably require that a wildfire occur within several years after the treatment pattern is established. The prescriptions used for burning areas within the delineated unit would need to specify consumption of primarily finer fuel components of the blowdown complex. Removing fuels smaller than 3-4 inches would probably greatly restrict the spread potential across these areas even if the larger woody material remains. The treatment pattern that resulted from applying the spatial selection criteria required about 15% of the area to be treated. The exact fraction of the landscape is difficult to calculate precisely because the amount of surrounding area included is subjective.
The effectiveness of the pattern was tested by repeating the same fire as simulated above for comparing fuel changes in the blowdown area (Figure 5). The simulation showed reduced fire growth (~12,000 acres) because the fire was forced to circumvent the lakes and treatment patches. The treatment locations disrupted the simulated fire growth and behavior in all directions. High wind events eventually did carry the fire off of the landscape to the east. This reinforces the common experience that extreme fire events will produce large fires regardless of fuel types or suppression efforts. The simulation suggested changes that could be made to the treatment pattern that would have reduced the fire size even further. Through trial and error, such a pattern might be developed that would be generally effective in slowing the overall fire growth across the entire landscape. Specifically, it would be better if the treatments were smaller in size but more numerous and closer together. This would ensure that fires would be disrupted more frequently by the pattern, with fewer large expanses allowed to burn without encountering some mitigation. Reduced fire growth rate can "buy time" for acquiring suppression reinforcements for suppression activities or evacuations. By forcing a wildfire to squeeze through the gaps in the treatment units, suppression activities might be more effective when concentrating on these areas.
More detailed maps (e.g. 30 m resolution) on blowdown damage would improve the ability of the models to simulate fire growth. Accurate mapping of the blowdown fuels would also assist with efforts to locate effective treatment units.
Conclusions
The spatial analyses support the following conclusions:
● Blowdown fuels can be expected to produce more consistent fire growth under a wider range of weather conditions than in the undamaged forest. This means that fires can be expected to become larger more frequently under weather conditions that in intact forest would only allow small fires.
● The larger fires occurring in the blowdown areas can be expected to threaten the edges of the Wilderness area, and probably values outside the Wilderness. The extent of these larger fires in any direction means that the Wilderness is probably not large enough to reliably contain fires if blowdown fuels are involved.
● Extreme fire weather conditions that typically produce crown fires and long-range spotting in the coniferous forest types of the BWCA will effectively produce greater spread rates than the blowdown fuels.
● A patchwork of fuel treatment units collectively occupying about 15% of the blowdown area can probably be designed for slowing fire progress through the blowdown fuels. The pattern is more efficient (less area treated and easier control) if the treatment units are strategically located next to lakes and bogs.
Literature Cited
http://www.superiornationalforest.org/july4thstorm1999/bwcara/bwcawra.html (73 of 128) [7/7/2004 1:37:39 PM]
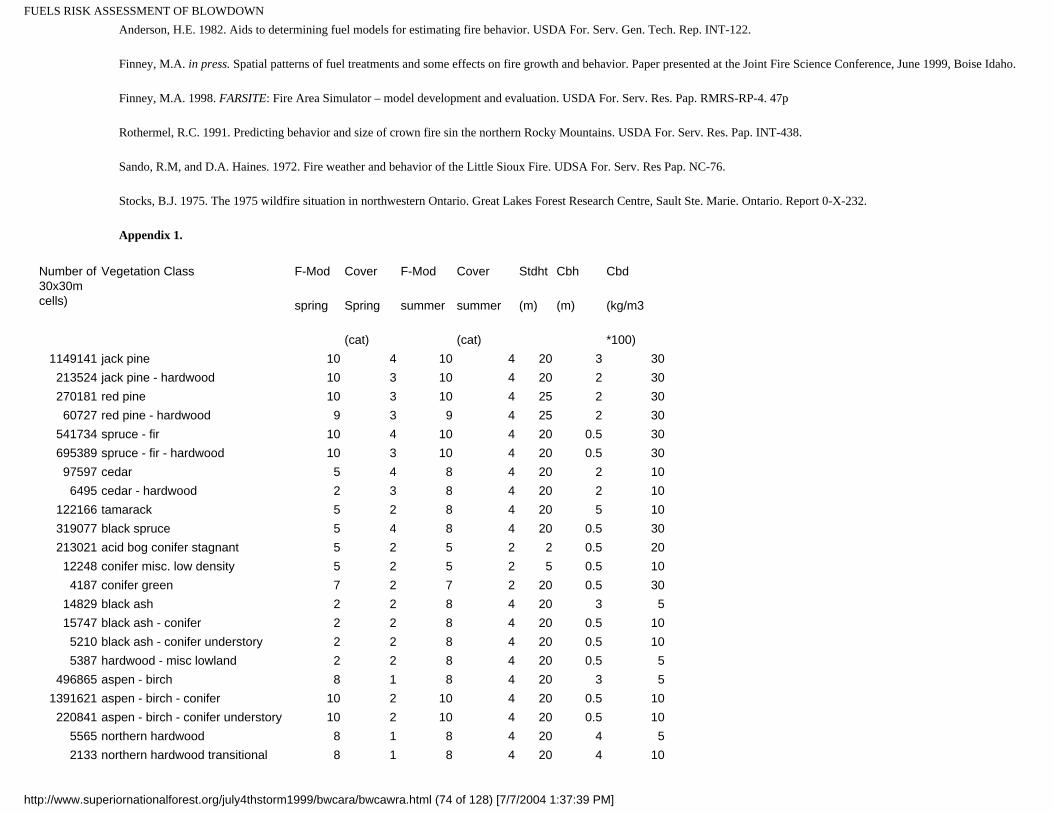
FUELS RISK ASSESSMENT OF BLOWDOWN
Anderson, H.E. 1982. Aids to determining fuel models for estimating fire behavior. USDA For. Serv. Gen. Tech. Rep. INT-122.
Finney, M.A. in press. Spatial patterns of fuel treatments and some effects on fire growth and behavior. Paper presented at the Joint Fire Science Conference, June 1999, Boise Idaho.
Finney, M.A. 1998. FARSITE: Fire Area Simulator – model development and evaluation. USDA For. Serv. Res. Pap. RMRS-RP-4. 47p
Rothermel, R.C. 1991. Predicting behavior and size of crown fire sin the northern Rocky Mountains. USDA For. Serv. Res. Pap. INT-438.
Sando, R.M, and D.A. Haines. 1972. Fire weather and behavior of the Little Sioux Fire. UDSA For. Serv. Res Pap. NC-76.
Stocks, B.J. 1975. The 1975 wildfire situation in northwestern Ontario. Great Lakes Forest Research Centre, Sault Ste. Marie. Ontario. Report 0-X-232.
Appendix 1.
Number of 30x30m cells)
Vegetation Class F-Mod
spring
Cover
Spring
(cat)
F-Mod
summer
Cover
summer
(cat)
Stdht
(m)
Cbh
(m)
Cbd
(kg/m3
*100)1149141 jack pine 10 4 10 4 20 3 30213524 jack pine - hardwood 10 3 10 4 20 2 30270181 red pine 10 3 10 4 25 2 3060727 red pine - hardwood 9 3 9 4 25 2 30
541734 spruce - fir 10 4 10 4 20 0.5 30695389 spruce - fir - hardwood 10 3 10 4 20 0.5 3097597 cedar 5 4 8 4 20 2 106495 cedar - hardwood 2 3 8 4 20 2 10
122166 tamarack 5 2 8 4 20 5 10319077 black spruce 5 4 8 4 20 0.5 30213021 acid bog conifer stagnant 5 2 5 2 2 0.5 2012248 conifer misc. low density 5 2 5 2 5 0.5 104187 conifer green 7 2 7 2 20 0.5 30
14829 black ash 2 2 8 4 20 3 515747 black ash - conifer 2 2 8 4 20 0.5 105210 black ash - conifer understory 2 2 8 4 20 0.5 105387 hardwood - misc lowland 2 2 8 4 20 0.5 5
496865 aspen - birch 8 1 8 4 20 3 51391621 aspen - birch - conifer 10 2 10 4 20 0.5 10220841 aspen - birch - conifer understory 10 2 10 4 20 0.5 10
5565 northern hardwood 8 1 8 4 20 4 52133 northern hardwood transitional 8 1 8 4 20 4 10
http://www.superiornationalforest.org/july4thstorm1999/bwcara/bwcawra.html (74 of 128) [7/7/2004 1:37:39 PM]

FUELS RISK ASSESSMENT OF BLOWDOWN
1307 northern hardwood conifer understory
8 2 8 4 20 0.5 10
4744 hardwood tranisitional 8 1 8 4 20 4 572290 hardwood regeneration- (mostly
aspen)2 1 8 4 5 4 5
32291 bare ground 8 0 8 0 0 0 01693129 water 98 0 98 0 0 0 0
41567 emergent - aquatic 99 0 99 0 0 0 033819 emergent 8 0 8 0 0 0 02473 sphagnum spp. 2 0 8 0 0 0 0
89243 grass - native 2 0 8 0 0 0 084057 grass - native lowland 2 0 8 0 0 0 023027 grass- cool season 2 0 8 0 0 0 0
98 grass- domestic 2 0 8 0 2 0 016535 brush- alder 8 0 8 0 2 0 017944 brush- alder lowland 2 0 8 0 2 0 042729 brush- willow 8 0 8 0 2 0 038429 brush- willow lowland 2 0 8 0 2 0 0
193359 brush- misc. 8 0 8 0 2 0 0121544 brush- misc. lowland 2 0 8 0 2 0 042273 brush- ericaceous 99 0 5 0 2 0 03517 developed 99 0 99 0 0 0 0
27158 roads 99 0 99 0 0 0 023 cloud and cloud shadow 99 0 99 0 0 0 0
Figure 1. FlamMap flamelength output illustrating changes in potential fire behavior under different weather and fuel moisture conditions (a) 15th percentile, (b) 75th percentile, (c) 90th percentile, and (d) 97th percentile (see text).
Figure 2. FARSITE calibration using the Little Gabbro Lake fire (1995). Yellow lines are observed perimeters and shaded areas are results of the simulation for the same time period.
http://www.superiornationalforest.org/july4thstorm1999/bwcara/bwcawra.html (75 of 128) [7/7/2004 1:37:39 PM]

FUELS RISK ASSESSMENT OF BLOWDOWN
Figure 3. . FARSITE calibration using the White Feather Lake fire (1996). Yellow lines are observed perimeters and shaded areas are results of the simulation for the same time period.
http://www.superiornationalforest.org/july4thstorm1999/bwcara/bwcawra.html (76 of 128) [7/7/2004 1:37:39 PM]

FUELS RISK ASSESSMENT OF BLOWDOWN
Figure 4. Simulation results used to compare effects of the blowdown fuel on potential fire behavior. An example area was selected from the north central portion of the BWCAW that contained the widest swath of forest damage. Simulation of fire growth for 10 days using weather and wind data from the Ely RAWS station for mid-June 1996 in (A) fuels prior to the blowdown (~2000 acres) and (B) after the blowdown (~24,000 acres). See text for details.
http://www.superiornationalforest.org/july4thstorm1999/bwcara/bwcawra.html (77 of 128) [7/7/2004 1:37:39 PM]

FUELS RISK ASSESSMENT OF BLOWDOWN
http://www.superiornationalforest.org/july4thstorm1999/bwcara/bwcawra.html (78 of 128) [7/7/2004 1:37:39 PM]

FUELS RISK ASSESSMENT OF BLOWDOWN
Figure 5. Example pattern of discrete treatment units (14,100 acres total) arranged to overlap in the east-west direction and to buffer existing barriers to fire spread (e.g. lakes and bogs). Treatments were assigned a fuel model 8 to illustrate dramatic slowing of fire spread rate. The pattern limited fire growth from that in Figure 4b to about 12000 acres under the same simulation conditions.
http://www.superiornationalforest.org/july4thstorm1999/bwcara/bwcawra.html (79 of 128) [7/7/2004 1:37:39 PM]

FUELS RISK ASSESSMENT OF BLOWDOWN
http://www.superiornationalforest.org/july4thstorm1999/bwcara/bwcawra.html (80 of 128) [7/7/2004 1:37:39 PM]

FUELS RISK ASSESSMENT OF BLOWDOWN
Figure 5. Expanded view of pattern of treatment pattern within the largest swath of blowdown damage.
http://www.superiornationalforest.org/july4thstorm1999/bwcara/bwcawra.html (81 of 128) [7/7/2004 1:37:40 PM]

FUELS RISK ASSESSMENT OF BLOWDOWN
http://www.superiornationalforest.org/july4thstorm1999/bwcara/bwcawra.html (82 of 128) [7/7/2004 1:37:40 PM]

FUELS RISK ASSESSMENT OF BLOWDOWN
Appendix D
Canadian Indices
Canadian Fire behavior Index Thresholds
Spring Fire Behavior Thresholds
Fire Weather Index (FWI) 90% = 25 97% = 38
Buildup Index (BUI) 90% = 54 97% = 85
Initial Spread Index (ISI) 90% = 13 97% = 20
Drought Code (DC) 90% = 177 97% = 227
Duff Moisture Code 90% = 49 97% = 79
Fine Fuel Moisture Code (FFMC) 90% = 92.6 97% = 94.3
Fall Fire Behavior Thresholds
http://www.superiornationalforest.org/july4thstorm1999/bwcara/bwcawra.html (83 of 128) [7/7/2004 1:37:40 PM]

FUELS RISK ASSESSMENT OF BLOWDOWN
Fire Weather Index (FWI) 90% = 19 97% = 29
Buildup Index (BUI) 90% = 55 97% = 77
Initial Spread Index (ISI) 90% = 9 97% = 14
Drought Code (DC) 90% = 320 97% = 405
Duff Moisture Code 90% = 38 97% = 56
Fine Fuel Moisture Code (FFMC) 90% = 89.8 97% = 91.4
http://www.superiornationalforest.org/july4thstorm1999/bwcara/bwcawra.html (84 of 128) [7/7/2004 1:37:40 PM]

FUELS RISK ASSESSMENT OF BLOWDOWN
http://www.superiornationalforest.org/july4thstorm1999/bwcara/bwcawra.html (85 of 128) [7/7/2004 1:37:40 PM]

FUELS RISK ASSESSMENT OF BLOWDOWN
http://www.superiornationalforest.org/july4thstorm1999/bwcara/bwcawra.html (86 of 128) [7/7/2004 1:37:40 PM]

FUELS RISK ASSESSMENT OF BLOWDOWN
http://www.superiornationalforest.org/july4thstorm1999/bwcara/bwcawra.html (87 of 128) [7/7/2004 1:37:40 PM]

FUELS RISK ASSESSMENT OF BLOWDOWN
http://www.superiornationalforest.org/july4thstorm1999/bwcara/bwcawra.html (88 of 128) [7/7/2004 1:37:40 PM]

FUELS RISK ASSESSMENT OF BLOWDOWN
http://www.superiornationalforest.org/july4thstorm1999/bwcara/bwcawra.html (89 of 128) [7/7/2004 1:37:40 PM]

FUELS RISK ASSESSMENT OF BLOWDOWN
Appendix E
http://www.superiornationalforest.org/july4thstorm1999/bwcara/bwcawra.html (90 of 128) [7/7/2004 1:37:40 PM]

FUELS RISK ASSESSMENT OF BLOWDOWN
Climatology
http://www.superiornationalforest.org/july4thstorm1999/bwcara/bwcawra.html (91 of 128) [7/7/2004 1:37:40 PM]

FUELS RISK ASSESSMENT OF BLOWDOWN
http://www.superiornationalforest.org/july4thstorm1999/bwcara/bwcawra.html (92 of 128) [7/7/2004 1:37:40 PM]

FUELS RISK ASSESSMENT OF BLOWDOWN
Large Fire Data
http://www.superiornationalforest.org/july4thstorm1999/bwcara/bwcawra.html (93 of 128) [7/7/2004 1:37:40 PM]

FUELS RISK ASSESSMENT OF BLOWDOWN
http://www.superiornationalforest.org/july4thstorm1999/bwcara/bwcawra.html (94 of 128) [7/7/2004 1:37:40 PM]

FUELS RISK ASSESSMENT OF BLOWDOWN
http://www.superiornationalforest.org/july4thstorm1999/bwcara/bwcawra.html (95 of 128) [7/7/2004 1:37:40 PM]

FUELS RISK ASSESSMENT OF BLOWDOWN
http://www.superiornationalforest.org/july4thstorm1999/bwcara/bwcawra.html (96 of 128) [7/7/2004 1:37:40 PM]

FUELS RISK ASSESSMENT OF BLOWDOWN
http://www.superiornationalforest.org/july4thstorm1999/bwcara/bwcawra.html (97 of 128) [7/7/2004 1:37:40 PM]
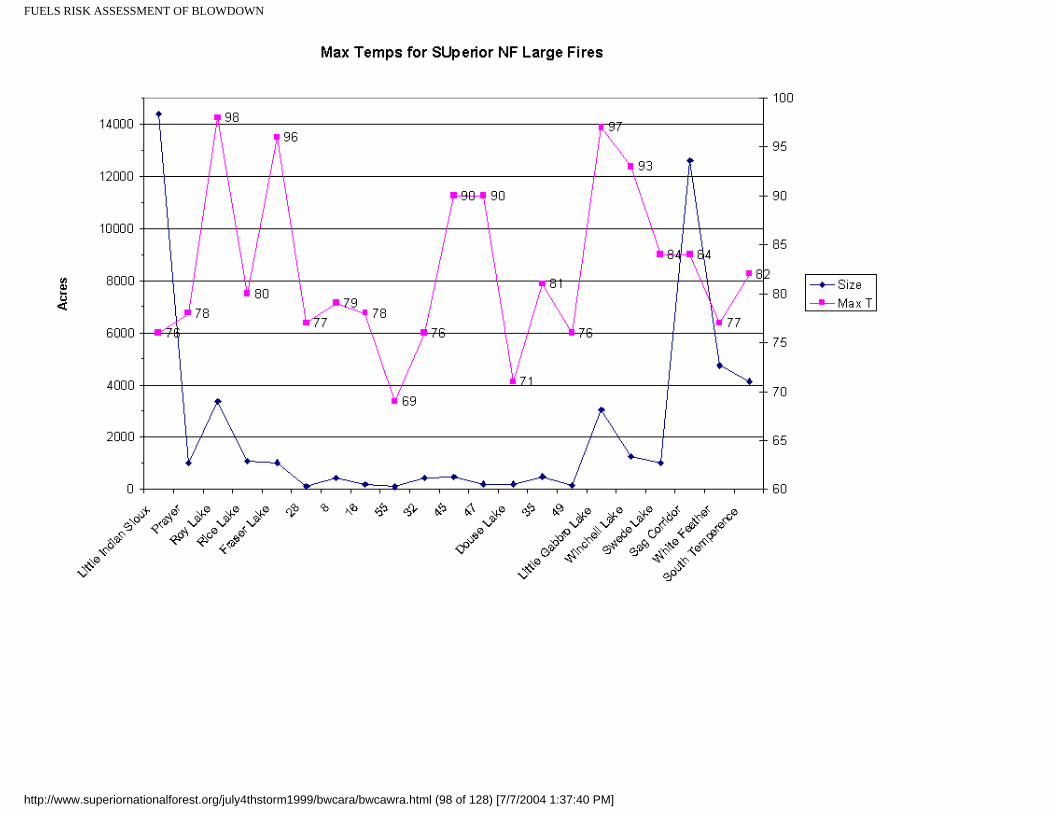
FUELS RISK ASSESSMENT OF BLOWDOWN
http://www.superiornationalforest.org/july4thstorm1999/bwcara/bwcawra.html (98 of 128) [7/7/2004 1:37:40 PM]

FUELS RISK ASSESSMENT OF BLOWDOWN
Appendix F
Fire Management Tools
http://www.superiornationalforest.org/july4thstorm1999/bwcara/bwcawra.html (99 of 128) [7/7/2004 1:37:40 PM]

FUELS RISK ASSESSMENT OF BLOWDOWN
RERAP Transects 01A, 01B, 02A, 02B, 03
RERAP Transects 04A, 04B, 05
RARE EVENT RISK ANALYSIS – BOUNDARY WATER CANOE AREA WILDERNESS
BASED ON WEATHER DATA FROM 1973 –1998
Risk Displayed Based on N, NE, & E Wind Directions
BOW LAKE MMA – TRANSECT LINE 01A / NE TO SW SPREAD DIRECTION
(West half of MMA where FM10 is predominant)
FUEL MODELS 5, 8, 9, 10, WATER
Miles From
Boundary
May 1 May 15 June 1 June 15 July 1 July 15 August 15 September 15 October 15
1 69% 61% 50% 46% 42% 65% 58% 57% 49%
2 69% 61% 25% 21% 18% 38% 34% 33% 25%
3 41% 32% 23% 20% 17% 32% 23% 18% 13%
4 41% 32% 10% 08% 07% 18% 14% 10% 07%
5 22% 15% 09% 08% 05% 14% 09% 06% 04%
http://www.superiornationalforest.org/july4thstorm1999/bwcara/bwcawra.html (100 of 128) [7/7/2004 1:37:40 PM]
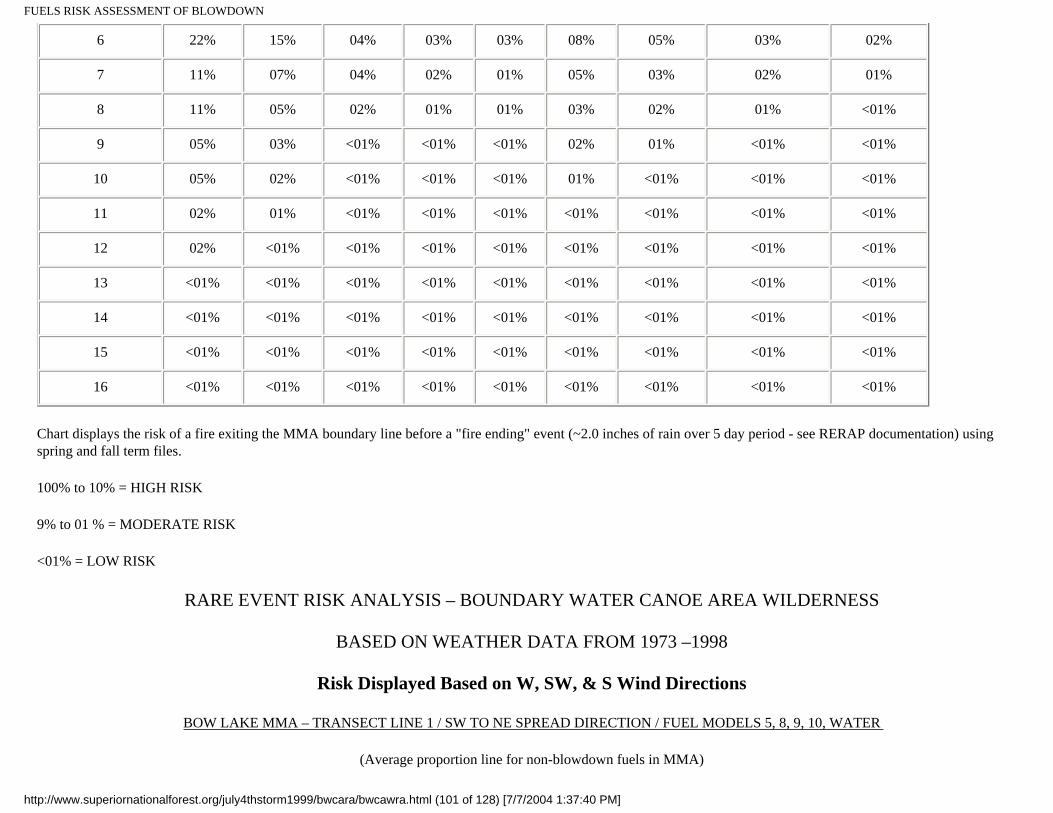
FUELS RISK ASSESSMENT OF BLOWDOWN
6 22% 15% 04% 03% 03% 08% 05% 03% 02%
7 11% 07% 04% 02% 01% 05% 03% 02% 01%
8 11% 05% 02% 01% 01% 03% 02% 01% <01%
9 05% 03% <01% <01% <01% 02% 01% <01% <01%
10 05% 02% <01% <01% <01% 01% <01% <01% <01%
11 02% 01% <01% <01% <01% <01% <01% <01% <01%
12 02% <01% <01% <01% <01% <01% <01% <01% <01%
13 <01% <01% <01% <01% <01% <01% <01% <01% <01%
14 <01% <01% <01% <01% <01% <01% <01% <01% <01%
15 <01% <01% <01% <01% <01% <01% <01% <01% <01%
16 <01% <01% <01% <01% <01% <01% <01% <01% <01%
Chart displays the risk of a fire exiting the MMA boundary line before a "fire ending" event (~2.0 inches of rain over 5 day period - see RERAP documentation) using spring and fall term files.
100% to 10% = HIGH RISK
9% to 01 % = MODERATE RISK
<01% = LOW RISK
RARE EVENT RISK ANALYSIS – BOUNDARY WATER CANOE AREA WILDERNESS
BASED ON WEATHER DATA FROM 1973 –1998
Risk Displayed Based on W, SW, & S Wind Directions
BOW LAKE MMA – TRANSECT LINE 1 / SW TO NE SPREAD DIRECTION / FUEL MODELS 5, 8, 9, 10, WATER
(Average proportion line for non-blowdown fuels in MMA)
http://www.superiornationalforest.org/july4thstorm1999/bwcara/bwcawra.html (101 of 128) [7/7/2004 1:37:40 PM]

FUELS RISK ASSESSMENT OF BLOWDOWN
Miles From
Boundary
May 1 May 15 June 1 June 15 July 1 July 15 August 15 September 15 October 15
1 57% 49% 39% 37% 37% 55% 43% 35% 30%
2 57% 49% 39% 37% 37% 55% 43% 35% 30%
3 29% 22% 16% 14% 13% 25% 16% 11% 8%
4 27% 20% 14% 13% 13% 25% 16% 11% 8%
5 17% 15% 14% 13% 08% 20% 07% 03% 02%
6 11% 07% 05% 05% 04% 10% 06% 03% 02%
7 11% 08% 05% 05% 04% 10% 03% <01% <01%
8 05% 04% 05% 02% 01% 04% 02% <01% <01%
9 04% 03% 02% 02% 01% 04% 01% <01% <01%
10 03% 02% 02% 01% <01% 01% <01% <01% <01%
11 01% <01% <01% <01% <01% 01% <01% <01% <01%
12 01% <01% <01% <01% <01% <01% <01% <01% <01%
13 01% <01% <01% <01% <01% <01% <01% <01% <01%
14 <01% <01% <01% <01% <01% <01% <01% <01% <01%
15 <01% <01% <01% <01% <01% <01% <01% <01% <01%
16 <01% <01% <01% <01% <01% <01% <01% <01% <01%
Chart displays the risk of a fire exiting the MMA boundary line before a "fire ending" event (~2.0 inches of rain over 5 day period - see RERAP documentation) with spring and fall term files..
100% to 10% = HIGH RISK
9% to 01 % = MODERATE RISK
http://www.superiornationalforest.org/july4thstorm1999/bwcara/bwcawra.html (102 of 128) [7/7/2004 1:37:40 PM]

FUELS RISK ASSESSMENT OF BLOWDOWN
<01% = LOW RISK
RARE EVENT RISK ANALYSIS – BOUNDARY WATER CANOE AREA WILDERNESS
BASED ON WEATHER DATA FROM 1973 –1998
Risk Displayed Based on W, SW, & S Wind Directions
BOW LAKE MMA – TRANSECT LINE 1B / SW TO NE SPREAD DIRECTION / FUEL MODELS 5, 8, 9, 10, WATER
(East half of MMA where Fuel Model 8 is predominant)
Miles From
Boundary
May 1 May 15 June 1 June 15 July 1 July 15 August 15 September 15 October 15
1 54% 49% 46% 43% 39% 58% 46% 37% 32%
2 45% 31% 20% 18% 15% 28% 19% 13% 09%
3 26% 22% 13% 14% 15% 28% 19% 05% 03%
4 16% 09% 08% 07% 05% 12% 07% 04% 03%
5 11% 09% 04% 05% 05% 12% 04% 01% <01%
6 05% 04% 03% 02% 02% 05% 02% <01% <01%
7 05% 02% 01% 01% 02% 03% <01% <01% <01%
8 02% 01% <01% <01% <01% 02% <01% <01% <01%
9 01% <01% <01% <01% <01% <01% <01% <01% <01%
10 <01% <01% <01% <01% <01% <01% <01% <01% <01%
11 <01% <01% <01% <01% <01% <01% <01% <01% <01%
12 <01% <01% <01% <01% <01% <01% <01% <01% <01%
http://www.superiornationalforest.org/july4thstorm1999/bwcara/bwcawra.html (103 of 128) [7/7/2004 1:37:40 PM]

FUELS RISK ASSESSMENT OF BLOWDOWN
13 <01% <01% <01% <01% <01% <01% <01% <01% <01%
14 <01% <01% <01% <01% <01% <01% <01% <01% <01%
15 <01% <01% <01% <01% <01% <01% <01% <01% <01%
16 <01% <01% <01% <01% <01% <01% <01% <01% <01%
Chart displays the risk of a fire exiting the MMA boundary line before a "fire ending" event (~2.0 inches of rain over 5 day period - see RERAP documentation) with spring and fall term files.
100% to 10% = HIGH RISK
9% to 01 % = MODERATE RISK
<01% = LOW RISK
RARE EVENT RISK ANALYSIS – BOUNDARY WATER CANOE AREA WILDERNESS
BASED ON WEATHER DATA FROM 1973 –1998
Risk Displayed Based on N, NW and W Wind Directions
BOW LAKE MMA – TRANSECT LINE 2A / NW TO SE SPREAD DIRECTION / FUEL MODELS 13, 10, WATER
(Blowdown Conditions)
Miles From
Boundary
May 1 May 15 June 1 June 15 July 1 July 15 August 15 September 15 October 15
1 97% 93% 91% 90% 88% 97% 92% 84% 79%
2 94% 88% 84% 82% 79% 94% 85% 73% 65%
3 90% 83% 76% 73% 69% 90% 77% 59% 50%
4 85% 77% 69% 65% 60% 85% 69% 48% 39%
http://www.superiornationalforest.org/july4thstorm1999/bwcara/bwcawra.html (104 of 128) [7/7/2004 1:37:40 PM]

FUELS RISK ASSESSMENT OF BLOWDOWN
5 80% 71% 62% 58% 53% 80% 61% 40% 30%
6 75% 65% 55% 51% 46% 75% 53% 32% 23%
7 70% 59% 50% 45% 41% 70% 46% 26% 18%
8 64% 54% 44% 40% 36% 65% 39% 21% 14%
9 59% 49% 39% 35% 31% 60% 33% 17% 10%
10 55% 44% 35% 31% 27% 54% 28% 13% 08%
11 50% 40% 30% 27% 23% 49% 23% 10% 06%
12 46% 36% 27% 23% 20% 43% 19% 08% 05%
Chart displays the risk of a fire exiting the MMA boundary line before a "fire ending" event (~2.0 inches of rain over 5 day period - see RERAP documentation) with spring and fall term files.
100% to 10% = HIGH RISK
9% to 01 % = MODERATE RISK
<01% = LOW RISK
RARE EVENT RISK ANALYSIS – BOUNDARY WATER CANOE AREA WILDERNESS
BASED ON WEATHER DATA FROM 1973 –1998
Risk Displayed Based on S, SE and E Wind Directions
BOW LAKE MMA – TRANSECT LINE 2A / SE TO NW SPREAD DIRECTION / FUEL MODELS 13, 10, WATER
(Blowdown Conditions)
Miles From
Boundary
May 1 May 15 June 1 June 15 July 1 July 15 August 15 September 15 October 15
http://www.superiornationalforest.org/july4thstorm1999/bwcara/bwcawra.html (105 of 128) [7/7/2004 1:37:40 PM]

FUELS RISK ASSESSMENT OF BLOWDOWN
1 97% 95% 91% 90% 88% 97% 92% 85% 80%
2 95% 90% 84% 82% 79% 94% 85% 74% 67%
3 91% 85% 76% 73% 70% 90% 77% 61% 52%
4 87% 80% 68% 65% 61% 86% 69% 51% 41%
5 83% 74% 62% 58% 54% 81% 61% 43% 33%
6 78% 68% 55% 51% 47% 76% 54% 35% 26%
7 74% 63% 50% 45% 41% 70% 47% 29% 20%
8 69% 57% 44% 40% 36% 65% 41% 23% 16%
9 65% 52% 39% 35% 31% 60% 35% 19% 12%
10 60% 47% 35% 31% 27% 55% 30% 15% 09%
11 55% 43% 30% 27% 23% 49% 25% 12% 07%
12 51% 38% 30% 23% 20% 44% 21% 10% 06%
Chart displays the risk of a fire exiting the MMA boundary line before a "fire ending" event (~2.0 inches of rain over 5 day period - see RERAP documentation) with spring and fall term files.
100% to 10% = HIGH RISK
9% to 01 % = MODERATE RISK
<01% = LOW RISK
RARE EVENT RISK ANALYSIS – BOUNDARY WATER CANOE AREA WILDERNESS
BASED ON WEATHER DATA FROM 1973 –1998
Risk Displayed Based on S, SE & E Wind Directions
BOW LAKE MMA – TRANSECT LINE 2B / SE TO NW SPREAD DIRECTION / FUEL MODELS 5, 8, 9, 10, WATER
http://www.superiornationalforest.org/july4thstorm1999/bwcara/bwcawra.html (106 of 128) [7/7/2004 1:37:40 PM]

FUELS RISK ASSESSMENT OF BLOWDOWN
Miles From
Boundary
May 1 May 15 June 1 June 15 July 1 July 15 August 15 September 15 October 15
1 68% 60% 50% 47% 43% 63% 52% 44% 38%
2 67% 58% 26% 24% 22% 44% 24% 18% 13%
3 40% 31% 23% 20% 18% 35% 24% 18% 13%
4 40% 31% 11% 10% 08% 17% 11% 07% 04%
5 21% 15% 10% 09% 07% 17% 11% 02% 01%
6 21% 10% 04% 04% 03% 08% 04% 02% 01%
7 10% 07% 04% 04% 03% 08% 02% <01% <01%
8 10% 03% 02% 01% 01% 03% 02% <01% <01%
9 05% 03% 02% 01% 01% 02% <01% <01% <01%
10 03% 01% <01% <01% <01% 01% <01% <01% <01%
11 02% 01% <01% <01% <01% <01% <01% <01% <01%
12 01% <01% <01% <01% <01% <01% <01% <01% <01%
13 <01% <01% <01% <01% <01% <01% <01% <01% <01%
14 <01% <01% <01% <01% <01% <01% <01% <01% <01%
15 <01% <01% <01% <01% <01% <01% <01% <01% <01%
16 <01% <01% <01% <01% <01% <01% <01% <01% <01%
Chart displays the risk of a fire exiting the MMA boundary line before a "fire ending" event (~2.0 inches of rain over 5 day period - see RERAP documentation) with spring and fall term files..
100% to 10% = HIGH RISK
9% to 01 % = MODERATE RISK
http://www.superiornationalforest.org/july4thstorm1999/bwcara/bwcawra.html (107 of 128) [7/7/2004 1:37:40 PM]

FUELS RISK ASSESSMENT OF BLOWDOWN
<01% = LOW RISK
RARE EVENT RISK ANALYSIS – BOUNDARY WATER CANOE AREA WILDERNESS
BASED ON WEATHER DATA FROM 1973 –1998
Risk Displayed Based on N, NW, & W Wind Directions
BOW LAKE MMA – TRANSECT LINE 02B / NW TO SE SPREAD DIRECTION / FUEL MODELS 5, 8, 9, 10, WATER
Miles From
Boundary
May 1 May 15 June 1 June 15 July 1 July 15 August 15 September 15 October 15
1 66% 59% 52% 50% 49% 67% 53% 44% 38%
2 64% 56% 31% 29% 27% 49% 25% 18% 13%
3 39% 32% 26% 24% 23% 39% 25% 09% 06%
4 38% 31% 14% 12% 11% 20% 11% 07% 04%
5 21% 16% 12% 11% 10% 20% 09% 02% 01%
6 21% 11% 06% 05% 04% 10% 05% 01% <01%
7 11% 08% 06% 05% 04% 09% 02% <01% <01%
8 10% 04% 02% 02% 02% 04% 01% <01% <01%
9 05% 03% 02% 02% 02% 03% <01% <01% <01%
10 03% 02% 01% <01% <01% 02% <01% <01% <01%
11 02% 02% 01% <01% <01% <01% <01% <01% <01%
12 01% <01% <01% <01% <01% <01% <01% <01% <01%
13 01% <01% <01% <01% <01% <01% <01% <01% <01%
http://www.superiornationalforest.org/july4thstorm1999/bwcara/bwcawra.html (108 of 128) [7/7/2004 1:37:40 PM]

FUELS RISK ASSESSMENT OF BLOWDOWN
14 <01% <01% <01% <01% <01% <01% <01% <01% <01%
15 <01% <01% <01% <01% <01% <01% <01% <01% <01%
16 <01% <01% <01% <01% <01% <01% <01% <01% <01%
Chart displays the risk of a fire exiting the MMA boundary line before a "fire ending" event (~2.0 inches of rain over 5 day period - see RERAP documentation) with spring and fall term files..
100% to 10% = HIGH RISK
9% to 01 % = MODERATE RISK
<01% = LOW RISK
RARE EVENT RISK ANALYSIS – BOUNDARY WATER CANOE AREA WILDERNESS
BASED ON WEATHER DATA FROM 1973 –1998
Risk Displayed Based on W, SW, & S Wind Directions
BOW LAKE MMA – TRANSECT LINE 03 / SW TO NE SPREAD DIRECTION
FUEL MODEL 13, WATER (Blowdown Conditions)
Miles From
Boundary
May 1 May 15 June 1 June 15 July 1 July 15 August 15 September 15 October 15
1 100% 100% 94% 93% 92% 98% 94% 90% 86%
2 96% 91% 89% 87% 85% 96% 88% 81% 76%
3 93% 87% 84% 82% 79% 94% 83% 72% 65%
4 90% 83% 78% 76% 72% 91% 77% 64% 55%
5 86% 78% 73% 70% 65% 87% 71% 57% 47%
http://www.superiornationalforest.org/july4thstorm1999/bwcara/bwcawra.html (109 of 128) [7/7/2004 1:37:40 PM]

FUELS RISK ASSESSMENT OF BLOWDOWN
6 82% 74% 69% 65% 60% 85% 65% 50% 40%
7 78% 70% 64% 60% 55% 82% 60% 44% 34%
8 75% 66% 59% 55% 51% 77% 55% 38% 29%
9 71% 62% 55% 50% 46% 74% 50% 33% 24%
10 67% 58% 50% 46% 42% 70% 45% 29% 20%
11 64% 54% 47% 43% 38% 66% 40% 25% 17%
12 60% 51% 44% 39% 34% 62% 36% 22% 14%
13 56% 47% 40% 36% 31% 58% 32% 18% 12%
14 53% 44% 37% 33% 28% 54% 28% 16% 10%
Chart displays the risk of a fire exiting the MMA boundary line before a "fire ending" event (~2.0 inches of rain over 5 day period - see RERAP documentation) with spring and fall term files..
100% to 10% = HIGH RISK
9% to 01 % = MODERATE RISK
<01% = LOW RISK
RARE EVENT RISK ANALYSIS – BOUNDARY WATER CANOE AREA WILDERNESS
BASED ON WEATHER DATA FROM 1973 –1998
Risk Displayed Based on N, NE, & E Wind Directions
BOW LAKE MMA – TRANSECT LINE 03 / NE TO SW SPREAD DIRECTION
FUEL MODEL 13, WATER (Blowdown Conditions)
http://www.superiornationalforest.org/july4thstorm1999/bwcara/bwcawra.html (110 of 128) [7/7/2004 1:37:40 PM]

FUELS RISK ASSESSMENT OF BLOWDOWN
Miles From
Boundary
May 1 May 15 June 1 June 15 July 1 July 15 August 15 September 15 October 15
1 98% 95% 92% 91% 90% 97% 92% 88% 84%
2 95% 90% 86% 84% 81% 95% 85% 77% 71%
3 91% 85% 77% 77% 72% 91% 77% 67% 59%
4 87% 80% 73% 70% 64% 88% 69% 58% 48%
5 83% 75% 67% 63% 57% 83% 62% 50% 39%
6 80% 70% 61% 57% 51% 78% 56% 42% 32%
7 74% 64% 56% 51% 45% 73% 49% 36% 26%
8 70% 59% 51% 45% 39% 67% 43% 30% 21%
9 66% 55% 46% 41% 34% 62% 38% 25% 17%
10 61% 50% 41% 36% 30% 56% 33% 21% 13%
11 57% 46% 37% 32% 25% 51% 29% 17% 10%
12 53% 42% 33% 28% 22% 46% 24% 14% 08%
13 49% 38% 30% 25% 19% 41% 21% 11% 06%
14 45% 35% 26% 21% 16% 37% 18% 09% 05%
Chart displays the risk of a fire exiting the MMA boundary line before a "fire ending" event (~2.0 inches of rain over 5 day period - see RERAP documentation) with spring and fall term files..
100% to 10% = HIGH RISK
9% to 01 % = MODERATE RISK
<01% = LOW RISK
http://www.superiornationalforest.org/july4thstorm1999/bwcara/bwcawra.html (111 of 128) [7/7/2004 1:37:40 PM]

FUELS RISK ASSESSMENT OF BLOWDOWN
RARE EVENT RISK ANALYSIS – BOUNDARY WATER CANOE AREA WILDERNESS
BASED ON WEATHER DATA FROM 1973 –1998
Risk Displayed Based on N, NE, & E Wind Directions
BOW LAKE MMA – TRANSECT LINE 04A / NE TO SW SPREAD DIRECTION
FUEL MODEL 10, 13, WATER
Miles From
Boundary
May 1 May 15 June 1 June 15 July 1 July 15 August 15 September 15 October 15
1 95% 90% 85% 83% 79% 94% 85% 76% 69%
2 89% 82% 74% 71% 66% 88% 73% 61% 52%
3 84% 76% 67% 63% 55% 80% 63% 43% 34%
4 76% 66% 55% 50% 42% 70% 50% 32% 23%
5 68% 57% 45% 41% 34% 61% 39% 23% 16%
6 61% 50% 39% 34% 28% 53% 32% 16% 11%
7 55% 44% 33% 28% 22% 45% 26% 12% 07%
8 48% 38% 27% 23% 18% 38% 19% 08% 05%
9 42% 32% 23% 18% 14% 31% 14% 06% 03%
10 37% 27% 19% 15% 11% 26% 12% 04% 02%
11 33% 24% 16% 13% 09% 21% 08% 03% 01%
12 28% 20% 13% 10% 07% 17% 06% 02% 01%
13 25% 17% 11% 08% 06% 14% 03% 01% <01%
http://www.superiornationalforest.org/july4thstorm1999/bwcara/bwcawra.html (112 of 128) [7/7/2004 1:37:40 PM]

FUELS RISK ASSESSMENT OF BLOWDOWN
14 21% 14% 09% 07% 05% 11% 01% <01% <01%
Chart displays the risk of a fire exiting the MMA boundary line before a "fire ending" event (~2.0 inches of rain over 5 day period - see RERAP documentation) with spring and fall term files..
100% to 10% = HIGH RISK
9% to 01 % = MODERATE RISK
<01% = LOW RISK
RARE EVENT RISK ANALYSIS – BOUNDARY WATER CANOE AREA WILDERNESS
BASED ON WEATHER DATA FROM 1973 –1998
Risk Displayed Based on W, SW, & S Wind Directions
TRANSECT LINE 05 / SW TO NE SPREAD DIRECTION / FUEL MODELS 5, 8, 9, 10, WATER
Miles From
Boundary
May 1 May 15 June 1 June 15 July 1 July 15 August 15 September 15 October 15
1 66% 58% 51% 50% 50% 70% 57% 47% 41%
2 66% 58% 41% 39% 33% 57% 54% 21% 16%
3 38% 31% 25% 24% 24% 43% 30% 21% 16%
4 38% 31% 21% 18% 15% 35% 21% 09% 06%
5 20% 16% 12% 12% 11% 24% 14% 05% 03%
6 20% 16% 10% 08% 08% 19% 08% 03% 02%
7 10% 08% 06% 05% 05% 12% 06% 01% <01%
8 10% 08% 04% 04% 03% 08% 03% 01% <01%
http://www.superiornationalforest.org/july4thstorm1999/bwcara/bwcawra.html (113 of 128) [7/7/2004 1:37:40 PM]

FUELS RISK ASSESSMENT OF BLOWDOWN
9 05% 04% 03% 02% 02% 06% 02% <01% <01%
10 05% 04% 02% 02% 01% 03% 01% <01% <01%
11 02% 02% 01% 01% 01% 03% <01% <01% <01%
12 02% 02% <01% <01% <01% 01% <01% <01% <01%
13 01% <01% <01% <01% <01% <01% <01% <01% <01%
14 01% <01% <01% <01% <01% <01% <01% <01% <01%
15 <01% <01% <01% <01% <01% <01% <01% <01% <01%
16 <01% <01% <01% <01% <01% <01% <01% <01% <01%
Chart displays the risk of a fire exiting the MMA boundary line before a "fire ending" event (~2.0 inches of rain over 5 day period - see RERAP documentation) with spring and fall term files..
100% to 10% = HIGH RISK
9% to 01 % = MODERATE RISK
<01% = LOW RISK
http://www.superiornationalforest.org/july4thstorm1999/bwcara/bwcawra.html (114 of 128) [7/7/2004 1:37:40 PM]

FUELS RISK ASSESSMENT OF BLOWDOWN
http://www.superiornationalforest.org/july4thstorm1999/bwcara/bwcawra.html (115 of 128) [7/7/2004 1:37:40 PM]

FUELS RISK ASSESSMENT OF BLOWDOWN
http://www.superiornationalforest.org/july4thstorm1999/bwcara/bwcawra.html (116 of 128) [7/7/2004 1:37:40 PM]

FUELS RISK ASSESSMENT OF BLOWDOWN
http://www.superiornationalforest.org/july4thstorm1999/bwcara/bwcawra.html (117 of 128) [7/7/2004 1:37:40 PM]
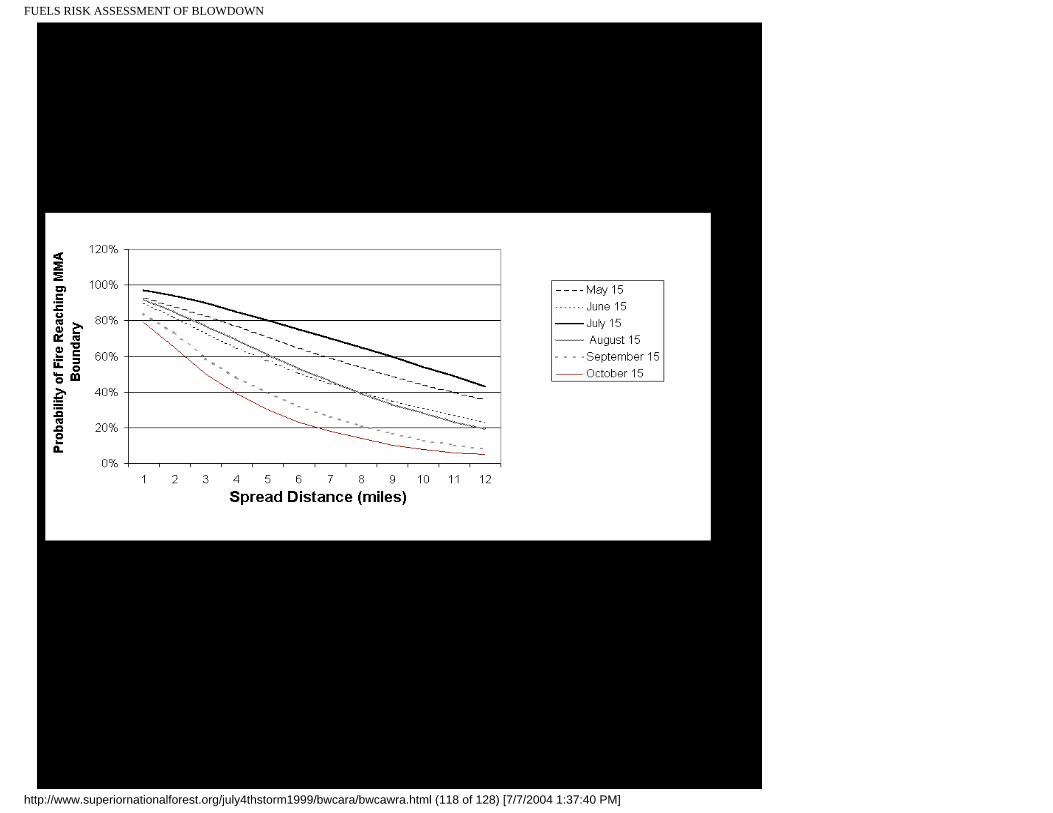
FUELS RISK ASSESSMENT OF BLOWDOWN
http://www.superiornationalforest.org/july4thstorm1999/bwcara/bwcawra.html (118 of 128) [7/7/2004 1:37:40 PM]
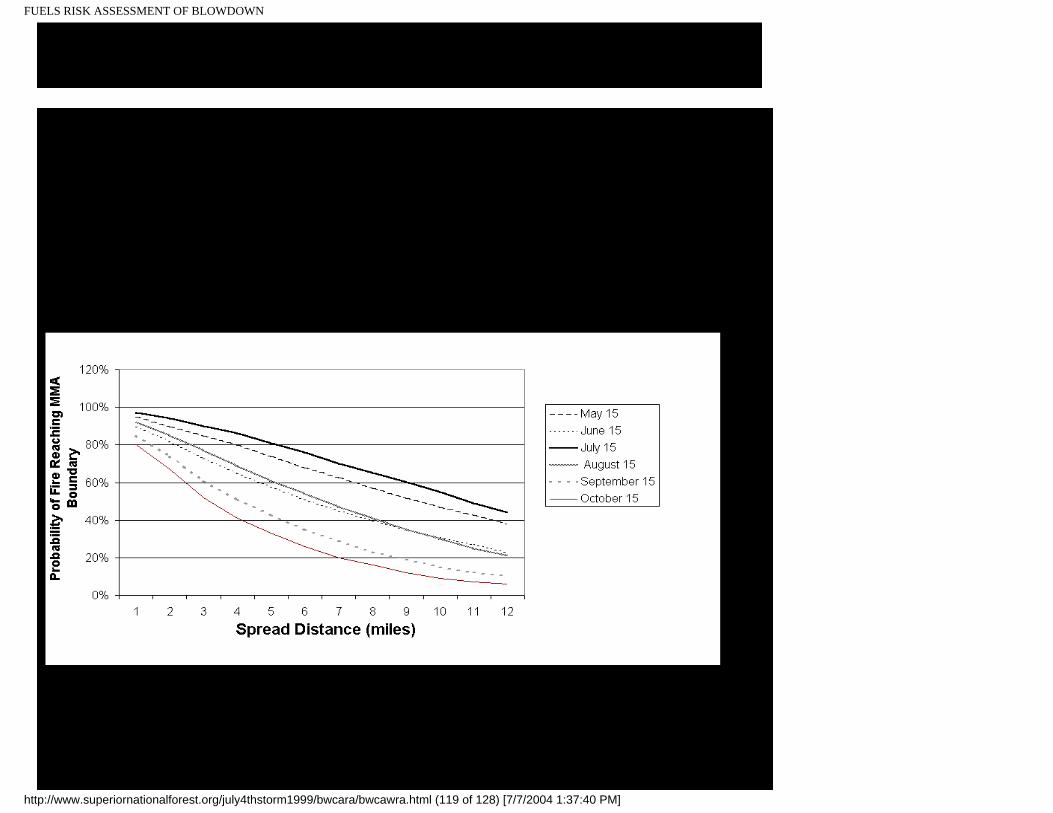
FUELS RISK ASSESSMENT OF BLOWDOWN
http://www.superiornationalforest.org/july4thstorm1999/bwcara/bwcawra.html (119 of 128) [7/7/2004 1:37:40 PM]

FUELS RISK ASSESSMENT OF BLOWDOWN
http://www.superiornationalforest.org/july4thstorm1999/bwcara/bwcawra.html (120 of 128) [7/7/2004 1:37:40 PM]
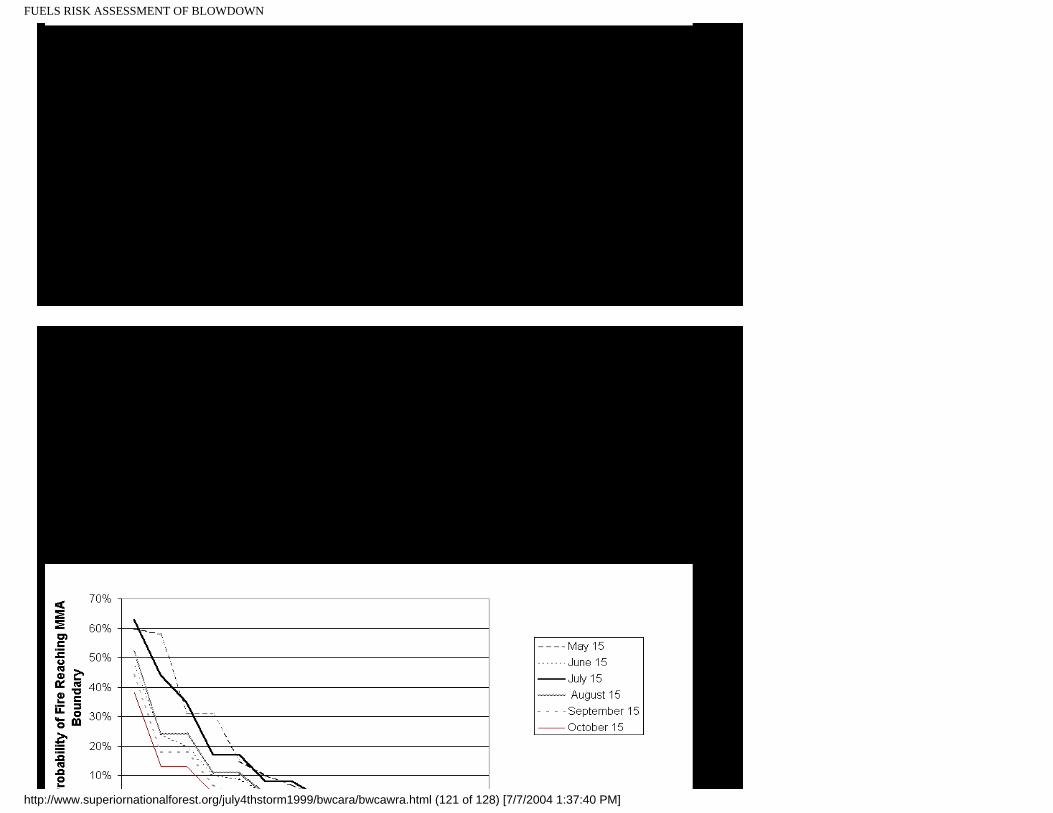
FUELS RISK ASSESSMENT OF BLOWDOWN
http://www.superiornationalforest.org/july4thstorm1999/bwcara/bwcawra.html (121 of 128) [7/7/2004 1:37:40 PM]

FUELS RISK ASSESSMENT OF BLOWDOWN
http://www.superiornationalforest.org/july4thstorm1999/bwcara/bwcawra.html (122 of 128) [7/7/2004 1:37:40 PM]

FUELS RISK ASSESSMENT OF BLOWDOWN
http://www.superiornationalforest.org/july4thstorm1999/bwcara/bwcawra.html (123 of 128) [7/7/2004 1:37:40 PM]

FUELS RISK ASSESSMENT OF BLOWDOWN
http://www.superiornationalforest.org/july4thstorm1999/bwcara/bwcawra.html (124 of 128) [7/7/2004 1:37:40 PM]

FUELS RISK ASSESSMENT OF BLOWDOWN
Pocket Card (May & June)
http://www.superiornationalforest.org/july4thstorm1999/bwcara/bwcawra.html (125 of 128) [7/7/2004 1:37:40 PM]

FUELS RISK ASSESSMENT OF BLOWDOWN
Pocket Card (July – October)
http://www.superiornationalforest.org/july4thstorm1999/bwcara/bwcawra.html (126 of 128) [7/7/2004 1:37:40 PM]

FUELS RISK ASSESSMENT OF BLOWDOWN
http://www.superiornationalforest.org/july4thstorm1999/bwcara/bwcawra.html (127 of 128) [7/7/2004 1:37:40 PM]

FUELS RISK ASSESSMENT OF BLOWDOWN
Risk Assessment Flow Chart
http://www.superiornationalforest.org/july4thstorm1999/bwcara/bwcawra.html (128 of 128) [7/7/2004 1:37:40 PM]