boundary updates independent october 2016 school district · campestre elementary 828 745 594 598...
TRANSCRIPT

Learn from Yesterday…Understand Today…Study for Tomorrow
SocorroIndependentSchoolDistrict
Boundary Updates
October 2016
Special Board MeetingOctober 27, 2016

Enrollment Projection Review
• Totals above represent enrollment as of the October PEIMS snapshot
GRADELEVELENROLLMENTHISTORYANDPROJECTIONS
Year(Oct.) EE/PK K 1st 2nd 3rd 4th 5th 6th 7th 8th 9th 10th 11th 12th Total Growth %Growth2012/13 1,752 2,939 3,071 3,179 3,202 3,181 3,120 3,363 3,366 3,388 3,954 3,375 3,348 3,021 44,2592013/14 1,760 2,961 3,169 3,103 3,188 3,207 3,265 3,181 3,488 3,401 3,867 3,510 3,186 3,231 44,517 258 0.58%2014/15 1,699 2,903 3,168 3,164 3,137 3,178 3,244 3,289 3,298 3,516 3,870 3,560 3,399 3,136 44,561 44 0.10%2015/16 1,830 2,790 3,148 3,243 3,271 3,188 3,268 3,397 3,408 3,388 3,953 3,700 3,386 3,299 45,269 708 1.59%2016/17 2,019 2,837 2,912 3,283 3,322 3,332 3,318 3,372 3,490 3,468 3,910 3,799 3,509 3,414 45,985 716 1.58%
EE/PK K 1st 2nd 3rd 4th 5th 6th 7th 8th 9th 10th 11th 12th TotalK-12Proj. NowK-12
Projected 1,830 2,932 3,007 3,194 3,304 3,315 3,254 3,348 3,534 3,474 3,821 3,657 3,541 3,288 45,499 43,669 43,966189 -95 -95 89 18 17 64 24 -44 -6 89 142 -32 126 486 29710.3% -3.2% -3.2% 2.8% 0.5% 0.5% 2.0% 0.7% -1.2% -0.2% 2.3% 3.9% -0.9% 3.8% 1.1% 0.7% 0.7%
BYear(SYear) ZipBirths (KG) ZipShare2006(2011/12) 4,379 2,826 0.6452007(2012/13) 4,607 2,939 0.6382008(2013/14) 4,461 2,961 0.6642009(2014/15) 4,574 2,903 0.6352010(2015/16) 4,407 2,790 0.6332011(2016/17) 4,542 2,837 0.625

Enrollment Projection Review - Elementary
Maximum Functional Current Projected
Campus Capacity Capacity 2015/16 2016/17 2016/17 Difference Pct.DifEscontriasEarlyChildhoodCenter 616 554 391 396 377 19 4.9%CampestreElementary 828 745 594 598 599 -1 -0.2%JordanElementary 761 685 1,048 1,046 1,063 -17 -1.6%ShookElementary 900 810 708 775 722 53 7.5%ElfidaChavezElementary 1,035 931 766 706 733 -27 -3.5%EscontriasElementary 773 696 606 604 621 -17 -2.8%MartinezElementary 967 870 589 574 590 -16 -2.7%HilleyElementary 806 728 696 661 657 4 0.6%HelenBallElementary 1,057 951 794 839 781 58 7.3%HorizonHeightsElementary 1,030 927 925 889 960 -71 -7.7%HuecoElementary 896 806 560 569 556 13 2.3%HurshelAntwineSchool 873 786 1,057 1,115 1,059 56 5.3%ButlerElementary 990 897 960 983 1,015 -32 -3.3%KeysElementary 0 0 5 4 5 -1 -20.0%LomaVerdeElementary 922 830 668 684 650 34 5.1%LujanChavezElementary 968 870 1,144 1,109 1,196 -87 -7.6%MissionRidgeElementary 851 766 709 828 701 127 17.9%CooperElementary 963 866 735 714 744 -30 -4.1%KeleherElementary 985 887 851 879 861 18 2.1%PurpleHeartElementary 945 850 652 869 705 164 25.2%RojasElementary 761 685 541 546 537 9 1.7%ItuarteElementary 765 688 926 904 927 -23 -2.5%SierraVistaElementary 1,012 911 712 719 695 24 3.4%VistaDelSolElementary 877 789 620 550 602 -52 -8.4%SybertSchool(PK-8th) 1,223 1,070 1,145 1,100 1,164 -64 -5.6%DesertWindElementary(PK-8th) 932 838 797 896 877 19 2.4%SernaSchool(PK-8th) 1,148 1,004 762 743 776 -33 -4.3%DruganSchool(PK-8th) 1,118 978 1,162 1,192 1,201 -9 -0.8%HambricSchool(PK-8th) 1,273 1,113 1,240 1,189 1,185 4 0.3%PasoDelNorteSchool(PK-8th) 1,048 917 1,139 1,140 1,134 6 0.5%ELEMENTARYSCHOOLTOTAL 27,323 24,448 23,502 23,821 23,693 128 0.5%
CAMPUSLEVELENROLLMENTHISTORYANDPROJECTIONS

Enrollment Projection Review – Secondary
Maximum Functional Current Projected
Campus Capacity Capacity 2015/16 2016/17 2016/17 Difference Pct.DifClarkeMiddleSchool 825 721 963 906 934 -28 -2.9%EnsorMiddleSchool 946 827 1,065 1,064 994 70 6.6%MontwoodMiddleSchool 1,321 1,155 644 653 640 13 2.0%SanchezMiddleSchool 850 743 709 708 739 -31 -4.4%SocorroMiddleSchool 850 743 596 644 651 -7 -1.2%HernandoMiddleSchool 1,050 918 897 958 938 20 2.2%PuentesMiddleSchool 1,351 1,182 849 951 971 -20 -2.4%SunRidgeMiddleSchool 1,321 1,155 980 973 974 -1 -0.1%SliderMiddleSchool 950 831 716 667 648 19 2.7%MIDDLESCHOOLTOTAL 9,464 8,275 7,419 7,524 7,489 35 0.5%MiddleSchoolAbsoluteGrowth 86 105MiddleSchoolPercentGrowth 1.17% 1.42%AmericasHighSchool 2,940 2,572 2,355 2,427 2,335 92 3.9%EastlakeHighSchool 3,428 3,000 1,964 2,084 2,015 69 3.5%ElDorado9thGradeAcademy 0 0 0 0 0 0 0.0%ElDoradoHighSchool 3,463 3,030 2,977 2,464 2,477 -13 -0.4%MissionEarlyCollegeHighSchool n/a n/a 464 459 474 -15 -3.2%MontwoodHighSchool 3,115 2,492 2,617 2,539 2,531 8 0.3%PebbleHillsHighSchool 3,432 3,003 1,311 1,988 1,879 109 8.3%SocorroHighSchool 3,534 3,092 2,535 2,542 2,481 61 2.4%HIGHSCHOOLTOTAL 19,912 17,189 14,223 14,503 14,192 311 2.2%HighSchoolAbsoluteGrowth 479 280HighSchoolPercentGrowth 3.49% 1.97%OptionsHighSchool 72 85 72 -13 -18.1%KeysAcademy 50 50 50 0 0.0%JJAEP 3 2 3 1 33.3%ALTERNATIVESCHOOLTOTAL 0 0 125 137 125 -12 -9.6%DISTRICTTOTALS 56,699 49,912 45,269 45,985 45,499 -486 -1.1%
CAMPUSLEVELENROLLMENTHISTORYANDPROJECTIONS

2017/18 Enrollment Projections (Attend)
Year(Oct.) EE/PK K 1st 2nd 3rd 4th 5th 6th 7th 8th 9th 10th 11th 12th Total Growth%
Growth2012/13 1,752 2,939 3,071 3,179 3,202 3,181 3,120 3,363 3,366 3,388 3,954 3,375 3,348 3,021 44,2592013/14 1,760 2,961 3,169 3,103 3,188 3,207 3,265 3,181 3,488 3,401 3,867 3,510 3,186 3,231 44,517 258 0.58%2014/15 1,699 2,903 3,168 3,164 3,137 3,178 3,244 3,289 3,298 3,516 3,870 3,560 3,399 3,136 44,561 44 0.10%2015/16 1,830 2,790 3,148 3,243 3,271 3,188 3,268 3,397 3,408 3,388 3,953 3,700 3,386 3,299 45,269 708 1.59%2016/17 2,019 2,837 2,912 3,283 3,322 3,332 3,318 3,372 3,490 3,468 3,910 3,799 3,509 3,414 45,985 716 1.58%2017/18 2,019 2,888 3,007 2,987 3,358 3,391 3,468 3,474 3,464 3,553 4,000 3,731 3,624 3,444 46,408 423 0.92%
BYear(SYear) Cnty Births (KG) CntyShare2008(2013/14) 14,054 2,961 0.2112009(2014/15) 13,968 2,903 0.2082010(2015/16) 13,792 2,790 0.2022011(2016/17) 13,891 2,837 0.2042012(2017/18) 13,871 2,888 0.208
cohort K 1st 2nd 3rd 4th 5th 6th 7th 8th 9th 10th 11th 12th Elem MS HS3-year Avg 0.986 1.066 1.022 1.023 1.011 1.027 1.029 1.033 1.018 1.139 0.946 0.956 0.988 1.022 1.027 1.007
2013/14 1.007 1.078 1.010 1.003 1.002 1.026 1.020 1.037 1.010 1.141 0.888 0.944 0.965 1.021 1.022 0.9852014/15 0.980 1.070 0.998 1.011 0.997 1.012 1.007 1.037 1.008 1.138 0.921 0.968 0.984 1.011 1.017 1.0032015/16 0.961 1.084 1.024 1.034 1.016 1.028 1.047 1.036 1.027 1.124 0.956 0.951 0.971 1.025 1.037 1.0012016/17 1.017 1.044 1.043 1.024 1.019 1.041 1.032 1.027 1.018 1.154 0.961 0.948 1.008 1.031 1.026 1.0182017/18 1.018 1.060 1.026 1.023 1.021 1.041 1.047 1.027 1.018 1.153 0.954 0.954 0.981 1.031 1.031 1.011
YEAR Total 1st 2nd 3rd 4th 5th 6th 7th 8th 9th 10th 11th 12th2012/132013/14 332 230 32 9 5 84 61 125 35 479 -444 -189 -1172014/15 375 207 -5 34 -10 37 24 117 28 469 -307 -111 -502015/16 810 245 75 107 51 90 153 119 90 437 -170 -174 -1002016/17 1,036 122 135 79 61 130 104 93 60 522 -154 -191 282017/18 1,000 170 75 75 69 136 156 92 63 532 -179 -175 -65

2017/18 Enrollment Projection by Feeder (Attend)Maximum Functional Current 10/1/2016
Campus Capacity Capacity 2015/16 2016/17 2017/182026/27
AmericasHighSchool 2,940 2,572 2,355 2,427 2,408ClarkeMiddleSchool 825 721 963 906 867DruganSchool(PK-8th) 1,118 978 1,162 1,192 1,240CooperElementary 963 866 735 714 721LomaVerdeElementary 922 830 668 684 690SierraVistaElementary 1,012 911 712 719 727VistaDelSolElementary 877 789 620 550 544FEEDERTOTAL 8,657 7,667 7,215 7,192 7,197
EastlakeHighSchool 3,428 3,000 1,964 2,084 2,149EnsorMiddleSchool 946 827 1,065 1,064 1,023DesertWindElementary(PK-8th) 932 838 797 896 978HorizonHeightsElementary 1,030 927 925 889 890MissionRidgeElementary 851 766 709 828 796ShookElementary 900 810 708 775 827FEEDERTOTAL 8,087 7,168 6,168 6,536 6,663
ElDoradoHighSchool 3,463 3,030 2,977 2,464 1,958HernandoMiddleSchool 1,050 918 897 958 993HambricSchool(PK-8th) 1,273 1,113 1,240 1,189 1,177PasoDelNorteSchool(PK-8th) 1,048 917 1,139 1,140 1,129HurshelAntwineSchool 873 786 1,057 1,115 1,155PurpleHeartElementary 945 850 652 869 932ItuarteElementary 765 688 926 904 883FEEDERTOTAL 9,417 8,302 8,888 8,639 8,227
Projection
AMERICASFEEDER
EASTLAKEFEEDER
ELDORADOFEEDER

2017/18 Enrollment Projection by Feeder (Attend)Maximum Functional Current 10/1/2016
Campus Capacity Capacity 2015/16 2016/17 2017/182026/27
MontwoodHighSchool 3,115 2,492 2,617 2,539 2,522MontwoodMiddleSchool 1,321 1,155 644 653 639SliderMiddleSchool 950 831 716 667 642SybertSchool(PK-8th) 1,223 1,070 1,145 1,100 1,073HelenBallElementary 1,057 951 794 839 846ElfidaChavezElementary 1,035 931 766 706 681KeleherElementary 985 887 851 879 876MartinezElementary 967 870 589 574 556FEEDERTOTAL 10,653 9,187 8,122 7,957 7,835
PebbleHillsHighSchool 3,432 3,003 1,311 1,988 2,629PuentesMiddleSchool 1,351 1,182 849 951 1,007SunRidgeMiddleSchool 1,321 1,155 980 973 1,066ButlerElementary 990 897 960 983 1,012JordanElementary 761 685 1,048 1,046 1,094LujanChavezElementary 968 870 1,144 1,109 1,065FEEDERTOTAL 8,823 7,792 6,292 7,050 7,873
SocorroHighSchool 3,534 3,092 2,535 2,542 2,545SanchezMiddleSchool 850 743 709 708 668SocorroMiddleSchool 850 743 596 644 656SernaSchool(PK-8th) 1,148 1,004 762 743 748CampestreElementary 828 745 594 598 603EscontriasElementary 773 696 606 604 599HilleyElementary 806 728 696 661 667HuecoElementary 896 806 560 569 556RojasElementary 761 685 541 546 563EscontriasEarlyChildhoodCenter 616 554 391 396 408FEEDERTOTAL 11,062 9,796 7,990 8,011 8,013
PEBBLEHILLSFEEDER
SOCORROFEEDER
Projection
MONTWOODFEEDER

8
District Improvement Study
For purposes of long range facility planning students have been returned to their home campus

Americas Feeder – Dist. StudyElementary: Vista Del Sol and Cooper draw from Sierra to create capacity so Sierra Vista can relieve Drugan. Loma Verde also relieves Drugan
LegendCurrent High Boundaries
Current Middle Boundaries
Current Elementary Boundaries
GatewayEstates….994homesstartingin2017.Couldresultin600students(300elem,150MS,150HS
+/- 128+/- 57
+/- 26
0
MesquiteTrails
WestTexasEstatesandSkyviewEstatescouldaddabout150elemstudentsinthenext5yrs
0
0

Americas Feeder – Dist. StudyMiddle School: Clark MS relieves Drugan with a portion of Loma Verde. Remainder of Loma Verde all in Drugan. Creates a pure feeder to Americas HS with Drugan and Clark. (ie portion of Loma Verde no longer in Ensor MS or the Eastlake Feeder
LegendCurrent High Boundaries
Current Middle Boundaries
Current Elementary Boundaries
GatewayEstates….994homesstartingin2017.Couldresultin600students
0
+/- 157
+53
AmericasEstatesandGardenParkatMissionRidgefeedingDrugan
+/- 26
0

Americas Feeder – Dist. StudyHigh School: Clark MS and Drugan K8 now pure feeders.
LegendCurrent High Boundaries
Current Middle Boundaries
Current Elementary Boundaries
+62
AmericasEstatesandGardenParkatMissionRidge.
0

Americas Feeder – Dist. StudyBefore
Result: Drugan gets better as most of the growth is moved to Clark MS and Sierra Vista and Vista Del Sol Elementary schools.
AfterMaximum Functional Res ide Attend Res ide
Campus Capacity Capacity 2015/16 2016/17 2016/17 2017/18 2018/19 2019/20 2020/21 2021/22 2022/23 2023/24 2024/25 2025/26 2026/27
Americas HighSchool 2,940 2,572 2,232 2,427 2,294 2,300 2,287 2,311 2,299 2,309 2,338 2,395 2,315 2,301 2,302ClarkeMiddleSchool 825 721 965 906 897 920 953 1,065 1,061 1,060 1,035 1,028 1,068 1,084 1,098DruganSchool (PK-8th) 1,118 978 1,222 1,192 1,269 1,207 1,141 1,037 986 889 859 819 890 914 939CooperElementary 963 866 517 714 449 477 520 552 579 595 615 611 602 602 608LomaVerdeElementary 922 830 698 684 734 760 775 813 837 871 893 902 905 902 894Sierra Vis ta Elementary 1,012 911 670 719 667 709 724 726 743 760 753 775 773 781 785Vista Del Sol Elementary 877 789 675 550 615 609 610 614 651 689 747 785 785 789 780FEEDERTOTAL 8,657 7,667 6,979 7,192 6,925 6,982 7,010 7,118 7,156 7,173 7,240 7,315 7,338 7,373 7,406
AMERICASFEEDER
ENROLLMENTPROJECTIONSBASEDONRESIDEENROLLMENT
Maximum Functional Res ide Attend Res ide
Campus Capacity Capacity 2015/16 2016/17 2016/17 2017/18 2018/19 2019/20 2020/21 2021/22 2022/23 2023/24 2024/25 2025/26 2026/27
Americas HighSchool 2,940 2,572 2,232 2,427 2,294 2,275 2,237 2,236 2,197 2,197 2,226 2,283 2,203 2,189 2,190ClarkeMiddleSchool 825 721 965 906 897 858 829 877 858 842 802 775 805 811 815DruganSchool (PK-8th) 1,118 978 1,222 1,192 1,269 1,317 1,397 1,443 1,492 1,490 1,545 1,585 1,666 1,700 1,735CooperElementary 963 866 517 714 449 456 478 489 495 490 487 483 474 474 480LomaVerdeElementary 922 830 698 684 734 740 709 727 731 745 747 736 739 736 728Sierra Vis ta Elementary 1,012 911 670 719 667 675 646 599 597 615 611 623 621 629 633Vista Del Sol Elementary 877 789 675 550 615 609 610 589 591 589 617 625 625 629 620FEEDERTOTAL 8,657 7,667 6,979 7,192 6,925 6,930 6,906 6,960 6,961 6,968 7,035 7,110 7,133 7,168 7,201
ENROLLMENTPROJECTIONSBASEDONRESIDEENROLLMENT
AMERICASFEEDER

Eastlake – Dist. Study
Elementary: No actual changes to the elementary campuses in the feeder.

Eastlake Feeder – Dist. StudyMiddle School: Loma Verde ES no longer feeds Ensor MS
LegendCurrent High Boundaries
Current Middle Boundaries
Current Elementary Boundaries
- 53
AmericasEstatesandGardenParkatMissionRidge

High School: Removed section of Loma Verde ES from the Ensor/Eastlake Feeder
Eastlake Feeder – Dist. Study
LegendCurrent High Boundaries
Current Middle Boundaries
Current Elementary Boundaries
- 62
AmericasEstatesandGardenParkatMissionRidge.

Eastlake Feeder – Dist. StudyBefore
Result: Loma Verde no longer impacts but does not have immediate concerns anyway.
AfterMaximum Functional Res ide Attend Res ide
Campus Capacity Capacity 2015/16 2016/17 2016/17 2017/18 2018/19 2019/20 2020/21 2021/22 2022/23 2023/24 2024/25 2025/26 2026/27
EastlakeHighSchool 3,428 3,000 1,915 2,084 2,042 2,082 2,108 2,133 2,170 2,214 2,300 2,344 2,394 2,462 2,514EnsorMiddleSchool 1,351 1,182 894 1,064 961 893 835 830 898 960 1,015 1,070 1,102 1,115 1,132DesertWindElementary(PK-8th) 932 838 1,085 896 1,085 1,167 1,193 1,175 1,149 1,138 1,104 1,092 1,088 1,110 1,135HorizonHeights Elementary 1,030 927 944 889 877 878 888 895 897 915 926 946 964 996 1,032Miss ionRidgeElementary 851 766 808 828 810 778 757 733 720 735 769 798 843 890 933ShookElementary 900 810 672 775 764 816 848 893 927 959 993 1,019 1,074 1,131 1,209FEEDERTOTAL 9,292 8,423 6,318 6,536 6,539 6,614 6,629 6,659 6,761 6,921 7,107 7,269 7,465 7,704 7,955
ENROLLMENTPROJECTIONSBASEDONRESIDEENROLLMENT
EASTLAKEFEEDER
Maximum Functional Reside Attend Reside
Campus Capacity Capacity 2015/16 2016/17 2016/17 2017/18 2018/19 2019/20 2020/21 2021/22 2022/23 2023/24 2024/25 2025/26 2026/27
EastlakeHighSchool 3,428 3,000 1,915 2,084 2,042 2,107 2,158 2,208 2,272 2,326 2,412 2,456 2,506 2,574 2,626EnsorMiddleSchool 750 675 894 1,064 961 920 889 913 991 1,053 1,108 1,163 1,195 1,208 1,225DesertWindElementary(PK-8th) 932 838 1,085 896 1,085 1,167 1,193 1,175 1,149 1,138 1,104 1,092 1,088 1,110 1,135HorizonHeightsElementary 1,030 927 944 889 877 878 888 895 897 915 926 946 964 996 1,032MissionRidgeElementary 851 766 808 828 810 778 757 733 720 735 769 798 843 890 933ShookElementary 900 810 672 775 764 816 848 893 927 959 993 1,019 1,074 1,131 1,209FEEDERTOTAL 8,836 7,866 6,318 6,536 6,539 6,666 6,733 6,817 6,956 7,126 7,312 7,474 7,670 7,909 8,160
ENROLLMENTPROJECTIONSBASEDONRESIDEENROLLMENT
EASTLAKEFEEDER

Montwood Feeder – Dist. StudyElementary: The Martinez zone is extended north into Sybert. Elfida Chavez is adjusted to encompass the section of Ball that runs just west of Loop 375 as well as the northern section of the area east of Loop 375 which feeds Sun Ridge and Pebble Hills. This entire area east of Loop 375 will move to the Montwood MS & HS feeder. The Ball ES zone is extended across Loop 375 to pick up a section of Lujan Chavez, this section will now be in the Montwood feeder.
LegendCurrent High Boundaries
Current Middle Boundaries
Current Elementary Boundaries
+/- 225
303
114
0

Montwood Feeder – Dist. StudyMiddle School: Montwood is extended north into Sybert to encompass the entire new Martinez zone. Montwood and Slider extend across Lp 375 to take in the area of Ball Elementary currently assigned to Sun Ridge. Slider also extends across Loop 375 to take in the section of Sun Ridge previously assigned to Lujan Chavez.
LegendCurrent High Boundaries
Current Middle Boundaries
Current Elementary Boundaries
93
169
153
85
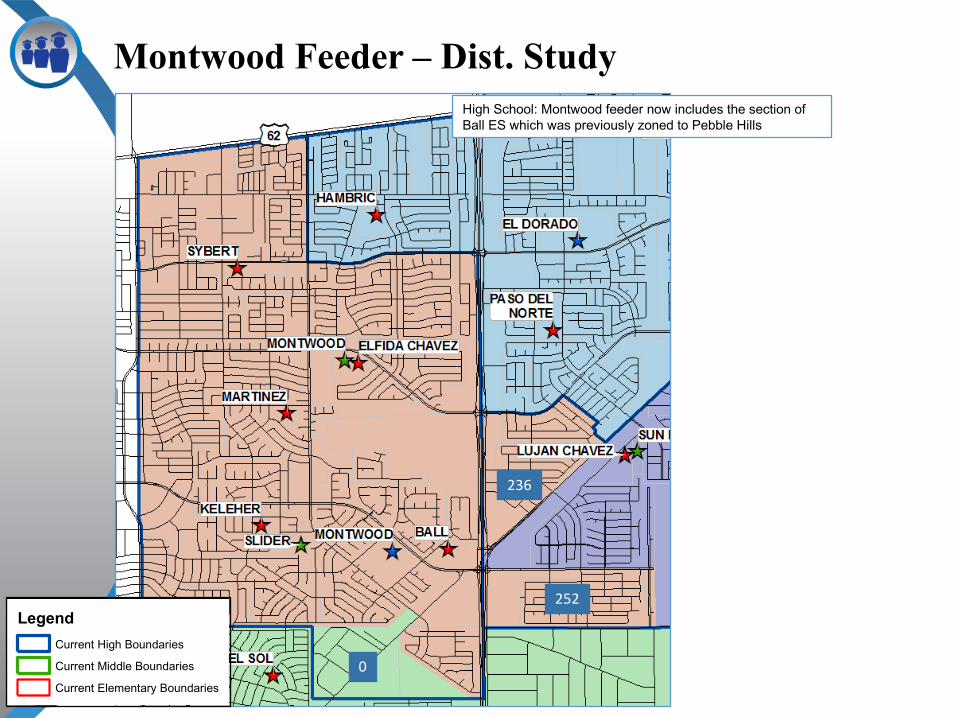
High School: Montwood feeder now includes the section of Ball ES which was previously zoned to Pebble Hills
Montwood Feeder – Dist. Study
LegendCurrent High Boundaries
Current Middle Boundaries
Current Elementary Boundaries
236
252
0

Montwood Feeder – Dist. StudyBefore
Result: Ball and Elfida Chavez retain a good balance as do Slider and Montwood MS.
After
Maximum Functional Res ide Attend Res ide
Campus Capacity Capacity 2015/16 2016/17 2016/17 2017/18 2018/19 2019/20 2020/21 2021/22 2022/23 2023/24 2024/25 2025/26 2026/27
MontwoodHighSchool 3,115 2,804 2,468 2,539 2,560 2,543 2,455 2,331 2,276 2,212 2,190 2,259 2,153 2,086 2,000MontwoodMiddleSchool 1,321 1,155 594 653 615 601 605 573 604 564 518 453 443 454 491Sl iderMiddleSchool 950 831 656 667 620 595 591 618 642 583 603 540 565 559 581SybertSchool (PK-8th) 1,223 1,070 1,147 1,100 1,156 1,129 1,107 1,117 1,083 1,088 1,064 1,062 1,064 1,062 1,051HelenBal l Elementary 1,057 951 823 839 883 890 845 868 840 830 833 836 826 815 825El fidaChavezElementary 1,035 931 740 706 749 724 683 636 620 635 654 687 707 725 739O'SheaKeleherElementary 985 887 507 879 521 518 512 525 494 524 525 517 519 512 501BenitoMartinezElementary 967 870 605 574 630 612 614 595 573 602 608 624 643 668 670FEEDERTOTAL 10,653 9,499 7,540 7,957 7,734 7,612 7,412 7,263 7,132 7,038 6,995 6,978 6,920 6,881 6,858
ENROLLMENTPROJECTIONSBASEDONRESIDEENROLLMENT
MONTWOODFEEDER
Maximum Functional Res ide Attend Res ide
Campus Capacity Capacity 2015/16 2016/17 2016/17 2017/18 2018/19 2019/20 2020/21 2021/22 2022/23 2023/24 2024/25 2025/26 2026/27
MontwoodHighSchool 3,115 2,804 2,468 2,539 2,560 2,670 2,699 2,697 2,764 2,700 2,678 2,747 2,641 2,574 2,488MontwoodMiddleSchool 1,321 1,155 594 653 615 660 723 750 781 741 695 630 620 631 668Sl iderMiddleSchool 950 831 656 667 620 680 761 872 896 837 857 794 819 813 835SybertSchool (PK-8th) 1,223 1,070 1,147 1,100 1,156 987 937 919 885 890 866 864 866 864 853HelenBal l Elementary 1,057 951 823 839 883 968 923 946 918 908 911 914 904 893 903El fidaChavezElementary 1,035 931 740 706 749 949 908 861 845 860 879 912 932 950 964O'SheaKeleherElementary 985 887 507 879 521 518 512 525 494 524 525 517 519 512 501BenitoMartinezElementary 967 870 605 574 630 726 728 709 687 716 722 738 757 782 784FEEDERTOTAL 10,653 9,499 7,540 7,957 7,734 8,158 8,191 8,279 8,270 8,176 8,133 8,116 8,058 8,019 7,996
MONTWOODFEEDER
ENROLLMENTPROJECTIONSBASEDONRESIDEENROLLMENT

El Dorado – Dist. Study
Elementary: No actual changes to the elementary campuses in the feeder.

El Dorado Feeder – Dist. StudyMiddle School: One section of Jordan Elementary zone is moved from Puentes into Hernando zone and El Dorado HS feeder.
LegendCurrent High Boundaries
Current Middle Boundaries
Current Elementary Boundaries
186

High School: One section of Jordan ES is moved to the El Dorado MS & HS feeder.
El Dorado Feeder – Dist. Study
LegendCurrent High Boundaries
Current Middle Boundaries
Current Elementary Boundaries
236
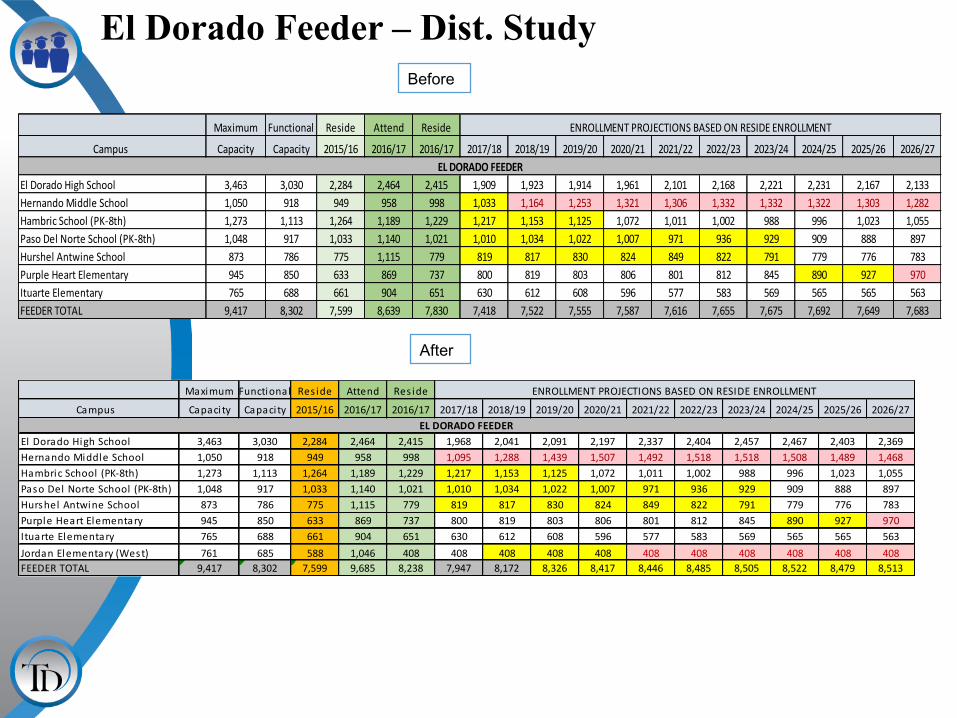
El Dorado Feeder – Dist. StudyBefore
After
Maximum Functional Res ide Attend Res ide
Campus Capacity Capacity 2015/16 2016/17 2016/17 2017/18 2018/19 2019/20 2020/21 2021/22 2022/23 2023/24 2024/25 2025/26 2026/27
El DoradoHighSchool 3,463 3,030 2,284 2,464 2,415 1,968 2,041 2,091 2,197 2,337 2,404 2,457 2,467 2,403 2,369HernandoMiddleSchool 1,050 918 949 958 998 1,095 1,288 1,439 1,507 1,492 1,518 1,518 1,508 1,489 1,468HambricSchool (PK-8th) 1,273 1,113 1,264 1,189 1,229 1,217 1,153 1,125 1,072 1,011 1,002 988 996 1,023 1,055PasoDel NorteSchool (PK-8th) 1,048 917 1,033 1,140 1,021 1,010 1,034 1,022 1,007 971 936 929 909 888 897Hurshel AntwineSchool 873 786 775 1,115 779 819 817 830 824 849 822 791 779 776 783PurpleHeartElementary 945 850 633 869 737 800 819 803 806 801 812 845 890 927 970ItuarteElementary 765 688 661 904 651 630 612 608 596 577 583 569 565 565 563JordanElementary(West) 761 685 588 1,046 408 408 408 408 408 408 408 408 408 408 408FEEDERTOTAL 9,417 8,302 7,599 9,685 8,238 7,947 8,172 8,326 8,417 8,446 8,485 8,505 8,522 8,479 8,513
ELDORADOFEEDER
ENROLLMENTPROJECTIONSBASEDONRESIDEENROLLMENT
Maximum Functional Reside Attend Reside
Campus Capacity Capacity 2015/16 2016/17 2016/17 2017/18 2018/19 2019/20 2020/21 2021/22 2022/23 2023/24 2024/25 2025/26 2026/27
ElDoradoHighSchool 3,463 3,030 2,284 2,464 2,415 1,909 1,923 1,914 1,961 2,101 2,168 2,221 2,231 2,167 2,133HernandoMiddleSchool 1,050 918 949 958 998 1,033 1,164 1,253 1,321 1,306 1,332 1,332 1,322 1,303 1,282HambricSchool(PK-8th) 1,273 1,113 1,264 1,189 1,229 1,217 1,153 1,125 1,072 1,011 1,002 988 996 1,023 1,055PasoDelNorteSchool(PK-8th) 1,048 917 1,033 1,140 1,021 1,010 1,034 1,022 1,007 971 936 929 909 888 897HurshelAntwineSchool 873 786 775 1,115 779 819 817 830 824 849 822 791 779 776 783PurpleHeartElementary 945 850 633 869 737 800 819 803 806 801 812 845 890 927 970ItuarteElementary 765 688 661 904 651 630 612 608 596 577 583 569 565 565 563FEEDERTOTAL 9,417 8,302 7,599 8,639 7,830 7,418 7,522 7,555 7,587 7,616 7,655 7,675 7,692 7,649 7,683
ENROLLMENTPROJECTIONSBASEDONRESIDEENROLLMENT
ELDORADOFEEDER

Pebble Hills – Dist. StudyElementary: Southern section of Lujan Chavez moves to Ball Elementary and the Montwood feeder.
LegendCurrent High Boundaries
Current Middle Boundaries
Current Elementary Boundaries
- 303

Pebble Hills – Dist. StudyMiddle School: Sun Ridge relieved as sections of current Lujan Chavez and Ball Elementary’s are moved into Montwood and Slider and remain in the Montwood feeder. Jordan ES is moved into Hernando MS and the El Dorado feeder
LegendCurrent High Boundaries
Current Middle Boundaries
Current Elementary Boundaries
- 93
-169
-186
- 85
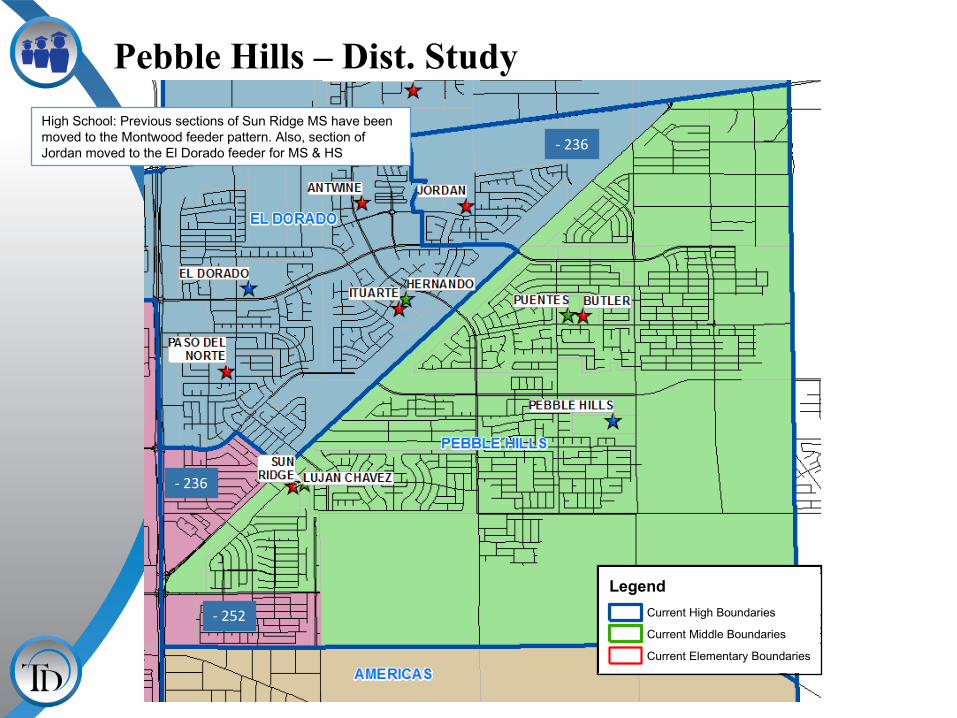
Pebble Hills – Dist. StudyHigh School: Previous sections of Sun Ridge MS have been moved to the Montwood feeder pattern. Also, section of Jordan moved to the El Dorado feeder for MS & HS
LegendCurrent High Boundaries
Current Middle Boundaries
Current Elementary Boundaries
- 236
- 252
- 236

Pebble Hills Feeder – Dist. Study
After
Before
Maximum Functional Res ide Attend Res ide
Campus Capaci ty Capaci ty 2015/16 2016/17 2016/17 2017/18 2018/19 2019/20 2020/21 2021/22 2022/23 2023/24 2024/25 2025/26 2026/27
PebbleHi l l s HighSchool 3,432 3,003 1,982 1,988 2,377 2,837 2,753 2,697 2,702 2,809 2,848 2,951 2,867 2,870 2,894Puentes MiddleSchool 1,351 1,182 769 951 901 895 861 745 757 728 764 844 922 948 941SunRidgeMiddleSchool 1,321 1,155 1,005 973 1,063 1,041 917 904 951 977 887 778 770 827 868ButlerElementary 990 897 1,308 983 1,464 1,493 1,527 1,549 1,580 985 989 968 973 946 938LujanChavezElementary 968 870 1,863 1,109 2,110 1,763 1,052 987 930 842 895 948 1,030 1,144 1,266JordanElementary(East) 761 685 212 260 301 330 359 413 445 470 489 510 532Elementary28 800 720 0 0 720 750 780 800 800 800 800 800 800Elementary29 800 720 0 0 0 0 0 720 750 780 800 800 800ELEMENTARYTOTALS 4,319 3,892 3,171 2,092 3,786 3,516 3,600 3,616 3,649 3,760 3,879 3,966 4,092 4,200 4,336MIDDLESCHOOLTOTALS 2,672 2,337 1,774 1,924 1,964 1,936 1,778 1,649 1,708 1,705 1,651 1,622 1,692 1,775 1,809FEEDERTOTAL 10,423 9,232 6,927 6,004 7,915 8,289 8,131 7,962 8,059 8,274 8,378 8,539 8,651 8,845 9,039
PEBBLEHILLSFEEDER
ENROLLMENTPROJECTIONSBASEDONRESIDEENROLLMENT
Maximum Functional Reside Attend Reside
Campus Capacity Capacity 2015/16 2016/17 2016/17 2017/18 2018/19 2019/20 2020/21 2021/22 2022/23 2023/24 2024/25 2025/26 2026/27
PebbleHillsHighSchool 3,432 3,003 1,982 1,988 2,377 3,018 3,115 3,240 3,426 3,533 3,572 3,675 3,591 3,594 3,618PuentesMiddleSchool 1,351 1,182 769 951 901 957 985 931 943 914 950 1,030 1,108 1,134 1,127SunRidgeMiddleSchool 1,321 1,155 1,005 973 1,063 1,156 1,147 1,251 1,298 1,324 1,234 1,125 1,117 1,174 1,215ButlerElementary 990 897 1,308 983 1,464 1,493 1,527 1,549 1,580 1,605 1,609 1,588 1,593 1,566 1,558JordanElementary 761 685 588 1,046 620 668 709 738 767 821 853 878 897 918 940LujanChavezElementary 968 870 1,863 1,109 2,110 2,066 2,075 2,040 2,013 2,045 2,128 2,211 2,313 2,427 2,549Elementary28 945 850 0 0 0 0 0 0 0 0 0 0 0Elementary29 945 850 0 0 0 0 0 0 0 0 0 0 0ELEMENTARYTOTALS 4,609 4,152 3,759 3,138 4,194 4,227 4,311 4,327 4,360 4,471 4,590 4,677 4,803 4,911 5,047MIDDLESCHOOLTOTALS 2,672 2,337 1,774 1,924 1,964 2,113 2,132 2,182 2,241 2,238 2,184 2,155 2,225 2,308 2,342FEEDERTOTAL 10,713 9,492 7,515 7,050 8,535 9,358 9,558 9,749 10,027 10,242 10,346 10,507 10,619 10,813 11,007
PEBBLEHILLSFEEDER
ENROLLMENTPROJECTIONSBASEDONRESIDEENROLLMENT

29
Socorro Feeder – No Change
Maximum Functional Reside Attend Reside
Campus Capacity Capacity 2015/16 2016/17 2016/17 2017/18 2018/19 2019/20 2020/21 2021/22 2022/23 2023/24 2024/25 2025/26 2026/27
SocorroHighSchool 3,534 3,092 2,324 2,542 2,411 2,414 2,463 2,453 2,438 2,424 2,445 2,412 2,382 2,361 2,297SanchezMiddleSchool 850 743 659 708 700 660 645 625 632 659 619 613 599 622 644SocorroMiddleSchool 850 743 646 644 651 663 663 663 665 620 625 630 634 640 629SernaSchool(PK-8th) 1,148 1,004 740 743 709 714 733 741 738 718 702 697 696 686 714CampestreElementary 828 745 615 598 642 647 631 634 622 625 620 610 608 600 590EscontriasElementary 773 696 553 604 551 546 555 546 510 532 543 529 526 518 521HilleyElementary 806 728 710 661 657 663 681 675 690 702 732 737 741 745 737HuecoElementary 896 806 620 569 621 608 604 605 608 598 607 609 616 614 613RojasElementary 761 685 561 546 591 608 602 602 597 600 583 582 583 578 570EscontriasEarlyChildhoodCenter 616 554 357 396 332 344 336 333 336 331 325 326 328 334 337FEEDERTOTAL 11,062 9,796 7,785 8,011 7,865 7,867 7,913 7,877 7,836 7,809 7,801 7,745 7,713 7,698 7,652
SOCORROFEEDER
ENROLLMENTPROJECTIONSBASEDONRESIDEENROLLMENT