boundary layer trips for low reynolds number wind tunnel tests · boundary layer trips for low...
TRANSCRIPT
Boundary Layer Trips for Low Reynolds Number
Wind Tunnel Tests
A. Rona∗
University of Leicester, Leicester LE1 7RH, United Kingdom
H. Soueid†
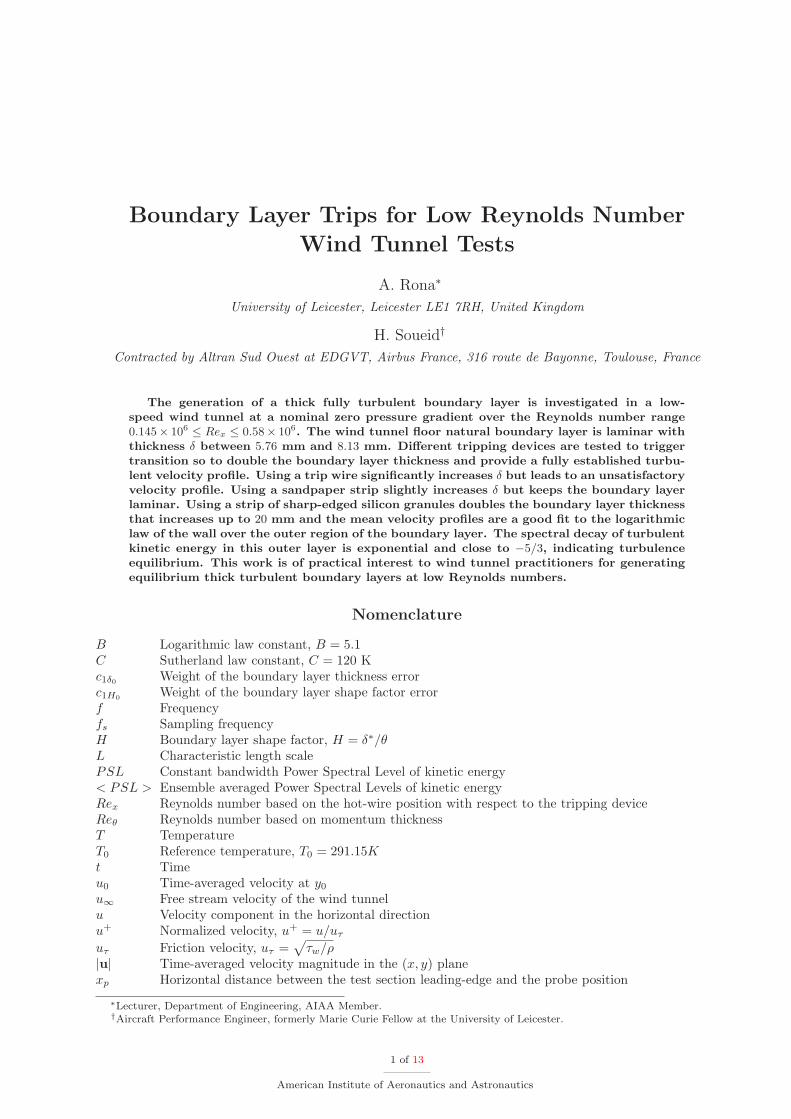
Contracted by Altran Sud Ouest at EDGVT, Airbus France, 316 route de Bayonne, Toulouse, France
The generation of a thick fully turbulent boundary layer is investigated in a low-
speed wind tunnel at a nominal zero pressure gradient over the Reynolds number range
0.145× 10⁶≤ Rex ≤ 0.58× 10
6. The wind tunnel floor natural boundary layer is laminar with
thickness δ between 5.76 mm and 8.13 mm. Different tripping devices are tested to trigger
transition so to double the boundary layer thickness and provide a fully established turbu-
lent velocity profile. Using a trip wire significantly increases δ but leads to an unsatisfactory
velocity profile. Using a sandpaper strip slightly increases δ but keeps the boundary layer
laminar. Using a strip of sharp-edged silicon granules doubles the boundary layer thickness
that increases up to 20 mm and the mean velocity profiles are a good fit to the logarithmic
law of the wall over the outer region of the boundary layer. The spectral decay of turbulent
kinetic energy in this outer layer is exponential and close to −5/3, indicating turbulence
equilibrium. This work is of practical interest to wind tunnel practitioners for generating
equilibrium thick turbulent boundary layers at low Reynolds numbers.
Nomenclature
B Logarithmic law constant, B = 5.1C Sutherland law constant, C = 120 Kc1δ0
Weight of the boundary layer thickness errorc1H0
Weight of the boundary layer shape factor errorf Frequencyfs Sampling frequencyH Boundary layer shape factor, H = δ∗/θL Characteristic length scalePSL Constant bandwidth Power Spectral Level of kinetic energy< PSL > Ensemble averaged Power Spectral Levels of kinetic energyRex Reynolds number based on the hot-wire position with respect to the tripping deviceReθ Reynolds number based on momentum thicknessT TemperatureT0 Reference temperature, T0 = 291.15Kt Timeu0 Time-averaged velocity at y0
u∞ Free stream velocity of the wind tunnelu Velocity component in the horizontal directionu+ Normalized velocity, u+ = u/uτ
uτ Friction velocity, uτ =√
τw/ρ|u| Time-averaged velocity magnitude in the (x, y) planexp Horizontal distance between the test section leading-edge and the probe position
∗Lecturer, Department of Engineering, AIAA Member.†Aircraft Performance Engineer, formerly Marie Curie Fellow at the University of Leicester.
1 of 13
American Institute of Aeronautics and Astronautics

xt Horizontal distance between the test section leading-edge and tripping device positiony Vertical distance with reference to the wind tunnel floory0 Vertical position of the probe closest to the floory+ Normalized vertical coordinate, y+ = yuτ/νδ Boundary layer thickness
δ∗ Boundary layer displacement thickness, δ∗ =∫ δ
0(1 − u/u∞) dy
θ Boundary layer momentum thickness, θ =∫ δ
0(u/u∞) (1 − u/u∞) dy
κ Von Karman constant, κ = 0.41ν Air kinematic viscosityρ Density
I. Introduction
Scaled up models are commonly used in wind tunnels to obtain spatially resolved measurements fromgeometries that are difficult to access, such as that of an automobile door seal cavity.1,2 To match the inflowReynolds number at full-scale, these tests often require the generation of a fully turbulent inflow boundarylayer at low speeds, the thickness of which is of the order of 20 mm.
In a cavity flow, the momentum thickness of the boundary layer has a direct influence on the acousticmodes generated by the cavity and governs the growth of the shear layer across the cavity opening.3,4
Therefore, the ratio L/θ, where L is the cavity length and θ the incoming boundary layer momentumthickness, is one of the non-dimensional parameters to be matched in order to have a dynamic and geometricsimilarity between a real configuration and its equivalent wind-tunnel model.
It is difficult to generate a boundary layer inflow of prescribed thickness that is fully turbulent by simplyrelying on natural transition over a smooth flat plate. The thickness of a turbulent boundary layer δ isinversely proportional to the Reynolds number Rex, for instance, in a 1/7th power law velocity profile, δ/x =0.37Re−0.2
x . Whilst the generation of a fully turbulent boundary layer drives towards a high Reynolds number,thickening a boundary layer points towards reducing Rex. To overcome these conflicting requirements, itis common experimental practice to use a boundary layer leading edge trip. This allows to trigger theboundary layer transition to turbulence at a relatively low Reynolds number while increasing the boundarylayer thickness by the thickness of the wake downstream of the trip. The practice of tripping boundary layersis well-established and relatively well documented in high Reynolds number flows. This paper contributesto the literature by investigating by experiment boundary layer tripping at low Reynolds numbers, with thedual objective of achieving a fully turbulent boundary layer, with well-developed turbulent statistics, and apre-defined thickness, at a given location downstream of the trip.
This work tested three types of boundary layer trips: a wire, sand-paper at three different roughnessgrades, and polycarbonate granules, over the Reynolds number range 0.14 × 10⁶ ≤ Rex ≤ 0.58 × 10⁶, whereRex = u∞ (xp − xt) /ν∞ and (xp − xt) is the streamwise distance between the trip and the boundary layertraverse. Section II details the wind tunnel test section and the instrumentation. Section III lists thematrix of running conditions. Section IV presents a summary of the boundary layer integral parameters5
(δ, δ∗, θ,H, uτ , Reθ) from all the configurations tested, to give the reader the overview of the working rangesof each tripping device. Section V examines in more detail the measurements from the 18 configurationstested, commenting on their repeatability, on the measured statistical uncertainties, and on the physical stateand the statistics of the boundary layer that were obtained, against the ones of a fully developed turbulentboundary layer.
This paper wishes to be a useful aid to experimental aerodynamicists for selecting a boundary layer tripdevice in an application that requires a low velocity thick turbulent boundary layer inflow.
II. Description of the experimental setup
II.A. Wind tunnel
The experiments of sections IV and V have been carried out in the blow-down open-loop subsonic wind tunnelof fig. 1(a). The DRA tunnel maximum free stream velocity is approximately 40 m/s. A centrifugal fan drivenby a variable speed three-phase motor pressurizes the upstream settling chamber, which is 0.65 m× 1.1 m×1.45 m long. The settling chamber is in three parts. The inlet to the first part from the fan is 0.6 m× 0.6 m
2 of 13
American Institute of Aeronautics and Astronautics

in cross-section. It remains the same height and widens to 1.1 m over a length of 0.96 m where it joins thesecond part. The inlet to the second part is 1.1 m wide × 0.6 m high and increases in height to 1.45 m overa length of 1.05 m where it joins the third part. The third part has parallel sides and could be termed theproper settling chamber. It has a cross-section 1.1 m wide × 1.45 m high. Its length is 0.65 m before it joinsthe contraction. Honeycomb panels in the settling chamber reduce the free-stream turbulence level to about0.35% of the free-stream velocity at u∞ = 15.6 m/s. A 7.88 : 1 contraction connects the settling chamberto the test section. The contraction is 1.1 m wide ×1.45 m high at the inlet and 0.458 m square at the exit.The DRA tunnel test section is 1.18 m long and 0.458 m wide. The test section height increases from 0.458m to 0.470 m along its length to compensate for the boundary layer displacement thickness growth on itswalls, as sketched in figure 1. This geometry gives a quasi-vanishing streamwise pressure gradient. The testsection terminates with a diffuser of area ratio 1 : 2.25 that discharges in the laboratory ambient air. Thediffuser inlet is 0.458 m × 0.470 m in cross-section and 0.675 m square at the exit. The diffuser is 2.49 mlong, giving it an included diffusion angle of 5.2 degrees.
Fan ChamberSettling
Plan view
Side view
DiffuserSectionTest
Contraction
(a) Wind tunnel geometry.
y
x
Hot wire
0.5xw0.5xw
Trip
u
1.18 mxp
xt
0.458 m
edgeLeading
0.47 m
(b) Test section.
Figure 1. Sketch of the wind tunnel geometry.
II.B. Flat plate model
Measurements are performed on the wind tunnel test section floor under four configurations: (a) A naturalboundary layer without any tripping device, (b) a trip wire of 3.5 mm diameter, (c) sandpaper strips ofgrades from P80 to P40, and (d) silicon granule strips with a characteristic granule size of 1.5 mm.
In configuration d, the silicon granules are synthetic sand commonly used in fish tanks. They are sharpedged and their size was verified by sieving them through a coarse and then a fine sieve, to threshold theirsize about the nominal size of 1.5 mm. The strip is made of double-sided tape on which the granules are
3 of 13
American Institute of Aeronautics and Astronautics

in-laid.The tripping devices are located at a distance xt from the test section leading edge, where xt identifies
the streamwise centre of their planform area, as sketched in figure 1. The distance between the strips andthe probe, xp − xt, in configurations c and d was modified to study its effect on the attainment of turbulentstatistics that are characteristics of a fully turbulent boundary layer. The main reason for varying xp −xt isthat, at low Reynolds numbers, a surface perturbation of a laminar boundary layer induced by a roughnesselement, which is small compared to the boundary layer thickness, may be damped, maintaining a laminarflow over some distance downstream.
II.C. Instrumentation
The velocity in the boundary layer on the floor of the wind tunnel test section is measured using a hot-wireanemometer. A single 5µm diameter 1.25 mm wide 55P15 Dantec hot-wire probe is located at a distance xp
from the leading edge of the test section. A traverse mechanism driven by a stepper motor is used to vary thevertical position of the probe, y, above the test section floor. 88 vertical positions are traversed between y = y0
and y = y0+30 mm with an initial increment of 0.1 mm. A Dantec constant temperature anemometer, modelDantec Streamline with a 90N10 frame and 90C10 constant temperature anemometer bridge, serial number216, connects to the probe. The anemometer measures the voltage required to maintain the temperature ofthe hot-wire constant. At each vertical position y, the output voltage from the anemometer is recorded fort = 32 seconds at a sampling frequency fs = 512 Hz. The record is then converted into velocity data usingthe voltage-velocity calibration curve of the probe. The calibration curve was obtained using a DISA type55D41 calibration unit, by DISA Elektronik, DK, code 9058D0411, serial number 136. The mean velocityat each location y is the average from the 32 seconds data. The initial position y0 is estimated by achievingthe contact between an identical broken probe and a conducting plate of a known thickness, placed on thewind tunnel floor. With this technique, the first measurement location was in the range 0 < y0 ≤ 0.5 mm.The post-processing of the velocity profiles in the near-wall region presented in subsection V.D confirms thisrange.
III. Test conditions
The experiments were carried out at three nominal velocities of 3.9 m/s, 7.8 m/s, and 15.6 m/s. Thesecorrespond to nominal Reynolds numbers Rex = 0.145× 10⁶, 0.29× 10⁶, and 0.58× 10⁶. During the tests, atemperature excursion of 18 K was recorded, leading to a variation of 5% in the molecular viscosity and thusin Rex. By varying both Rex and the tripping devices, 18 configurations were tested, covering the range0.14×106 ≤ Rex ≤ 0.51×10⁶, as detailed in table 1. In table 1, the actual test Reynolds numbers are statedand ∆xw is the streamwise width of each tripping device.
IV. Effect of the tripping devices
IV.A. Integral boundary layer parameters
The data acquired from each of the 18 configurations of table 1 are post-processed using in-house softwarewritten in Matlab. Starting from the set of the temporal voltage data, the average is computed and themean voltage is transformed into the correspondent mean velocity based on the calibration curve of thehot-wire probe. This gives the mean streamwise velocity at each vertical position y. These vertical positionsare determined from the stepper motor count record of the hot wire traverse, the lead screw pitch andthe traverse starting position y0. A 0.5 mm uncertainty in y0 leads to a vertical shift of the velocityprofile that is compensated for by the post-processing. Specifically, an iterative technique is adopted tocompute accurately y0 that also determines the wall friction velocity uτ . Starting from approximate initialvalues of these two quantities, a least squares method is used to improve the estimates of y0 and uτ ,by minimizing the least squares difference between the experimental profile and u+ = y+, over the range0 ≤ y+ < 20, and u+ = κ−1 ln y++B, at y+ > 35. This procedure assumes that the horizontal mean velocitycomponent u is much greater than the mean vertical velocity component v in the measured streamwisevelocity |u| =
√u2 + v2.
In each profile, the value of y0 from the least squares fit is compared to the one measured using thestepper motor count. Over the 18 traverses, the difference between the two quantities was always less than
4 of 13
American Institute of Aeronautics and Astronautics

Configuration Category Tripping device xt (mm) ∆xw (mm) Rex
1 a No 0 0 144256.6
2 a No 0 0 288493.2
3 a No 0 0 576986.3
4 b Wire 400+1.25 3.5 144256.6
5 b Wire 400+1.25 3.5 288493.2
6 b Wire 400+1.25 3.5 576986.3
7 c P40 228+10 20 128219.4
8 c P40 228+10 20 256438.3
9 c P60 228+140 280 106849.3
10 c P80 400+57.5 115 128219.4
11 c P80 400+57.5 115 256438.3
12 d Granules 400+24 48 137835.6
13 d Granules 400+24 48 275671.2
14 d Granules 400+24 48 551342.5
15 d Granules 400+12 24 141041.1
16 d Granules 400+12 24 282082.2
17 d Granules 400+48 96 131424.6
18 d Granules 400+48 96 262849.3
Table 1. Test cases.
0.5 mm, as stated in subsection II.C.Having determined y0, each experimental velocity profile is extended to the wall by adding the da-
tum (y, u) = (0, 0) to the readings. The estimate for uτ from the least squares method is then checked
against its definition uτ =√
ν |∂u/∂y|y=0 by determining the wall-normal gradient from (y = 0, u = 0) and
(y = y0, u = u0). This check enhances the robustness of the data fit. In all traverses, the two uτ estimateswere found to be within an acceptable range from each other.
The experimental velocity profiles adjusted for y0 are then examined to determine the boundary layerintegral parameters5 δ, δ∗, θ,H, uτ , and Reθ. The boundary layer thickness δ is taken as the wall-normalposition at which u (y) = 0.99u∞. The displacement thickness δ∗ and the momentum thickness θ areestimated by integrating the discrete experimental profile using Simpson’s trapezoidal rule. δ∗ and θ arethen used to determine the shape factor H = δ∗/θ and the momentum thickness based Reynolds numberReθ = u∞θ/ν∞.
Table 2 summarizes the boundary layer parameters (δ, δ∗, θ,H, uτ , Reθ) from all 18 test cases of table 1.Configurations 1 to 3 are those from the wind tunnel floor natural boundary layer without any trippingdevice. In these three configurations, the boundary layer thickness δ is less than half of the target 20 mmthickness and the shape factor H > 2.5 indicates that the boundary layer is essentially laminar. With aboundary layer trip, configurations 4 to 6 and 12 to 18 achieve a δ close to the 20 mm target. For theseconfigurations, the shape factor H ∼ 1.5 indicates a turbulent mean velocity profile.
V. Flow analysis
V.A. Natural boundary layer
Figure 2(a) shows the velocity profiles measured in the absence of any tripping device. These results cor-respond to configurations 1 to 3 in tables 1 and 2. At all three Rex, the profile displays a near-constantvelocity gradient close to the wall, which is characteristic of a laminar profile. The shape factor H ≥ 2.56is close to the Blasius solution for a laminar boundary layer of H = 2.59.5 The ratio δ/δ∗ is in the range2.75 ≤ δ/δ∗ ≤ 3.16, which is also close to the Blasius analytical result of δ/δ∗ = 2.8.
5 of 13
American Institute of Aeronautics and Astronautics

Configuration δ (mm) δ∗ (mm) θ (mm) H uτ (m/s) Reθ
1 8.13 2.91 0.99 2.94 0.24 264.4
2 6.53 2.20 0.77 2.85 0.32 411.4
3 5.76 1.82 0.71 2.56 0.44 758.6
4 18.85 2.9 2.1 1.38 0.18 560.9
5 18.85 2.62 1.81 1.45 0.36 967.0
6 18.85 2.48 1.43 1.73 0.72 1527.9
7 8.76 3.01 1.14 2.64 0.21 304.5
8 7.51 2.45 0.95 2.57 0.28 507.5
10 8.25 3.10 1.00 3.10 0.22 267.1
11 7.00 2.58 0.83 3.08 0.29 443.4
12 19.36 3.09 1.92 1.60 0.23 512.9
13 19.14 3.38 2.22 1.56 0.41 1186.0
14 18.56 3.08 2.08 1.48 0.76 2222.5
15 18.73 3.03 1.97 1.54 0.22 526.2
16 19.10 3.11 2.13 1.46 0.39 1137.9
17 22.37 3.88 2.46 1.57 0.22 657.1
18 23.16 4.01 2.69 1.50 0.40 1437.1
Table 2. Measured boundary layer integral parameters from the test cases.
0 5 10 150
5
10
15
| u | (m/s)
y(m
m)
Config. 1Config. 2Config. 3
(a) Dimensional.
101
102
0
10
20
30
40
50
u+
y+
Config. 1Config. 3Linear law
(b) Non-dimensional.
Figure 2. Velocity profiles on the wind tunnel floor without any boundary layer trip.
6 of 13
American Institute of Aeronautics and Astronautics

Figure 2(b) shows the time-averaged velocity profiles normalized by the friction velocity uτ . A logarithmicscale is used on the abscissa to identify any portion of the velocity profile that displays a logarithmic velocitygrowth that would identify a transitional or turbulent boundary layer, resulting in a straight line on thelogarithmic plot. No such trend is found in configurations 1 nor 3. Near the wall, the experimental data fitswell the laminar sub-layer profile u+ = y+, confirming that the time-averaged velocity near the wall grows ata constant gradient as in a fully laminar boundary layer. The velocity profiles from configurations 1, 2 and3 are therefore that of a laminar boundary layer with a maximum thickness of 8.13 mm, as shown in table 2.This differs from the target of developing a 20 mm thick turbulent boundary layer on the wind tunnel floor.
V.B. Trip wire
The results from configurations 4 to 6 in table 2 show that introducing a trip wire at the leading edge ofthe wind tunnel test section increases the boundary layer thickness to δ = 18.85 mm, close to the target ofδ = 20 mm. This value is shown in table 2 to be independent from the free stream velocity. This implies thatthe boundary layer thickness is imposed by the wire wake and then increases very slowly in the downstreamdirection. The turbulent nature of the boundary layer, in this case, may be inferred from the values of Hbetween 1.38 ad 1.73, despite H not decreasing at increasing Reynolds numbers, as it would be expected in aturbulent boundary layer. One possible justification for this is that, at a higher free-stream velocity u∞, thewire wake has less time to relax back into an equilibrium boundary layer before it reaches the measurementlocation xp.
In a turbulent boundary layer, such as in a 1/7th power law profile, δ/δ∗ = 8.04. With the trip wire,6.5 ≤ δ/δ∗ ≤ 7.6, which is closer to the turbulent δ/δ∗ than the value reported in subsection V.A for thenatural boundary layer.
V.C. Sandpaper
An alternative method to the trip wire to promote boundary layer transition is to use a sandpaper strip.The principle is to replace the confined vorticity shedding behind the wire by a uniform surface roughnessdistribution. The rationale is that, while a trip wire generates mainly spanwise vorticity, a roughnessstrip introduces also streamwise and flow-normal vorticity perturbations, aiding the development of a fullyturbulent boundary layer downstream of it. The streamwise extent of the strip ∆xw and its roughness heightinfluence transition in the boundary layer, therefore sandpaper strips of different ∆xw and grade were tested,with the objective of achieving a fully turbulent boundary layer.
Figure 3(a) shows the streamwise velocity profiles obtained at Rex ∼ 0.128 × 10⁶ using different strips.Configuration 1 in fig. 3(a) is the untripped boundary layer velocity profile from configuration 1 of table 1that is re-plotted for reference. Figure 3(a) shows that the velocity profiles from configurations 7 and 10overlap the untripped boundary layer profile of configuration 1. These velocity traverses display the samenear-wall constant gradient velocity profile featured in fig. 2(a). The effect of sandpapers in configurations 7and 10 is to increase the boundary layer thickness by between 2% and 15% with respect to the wind tunnelnatural boundary layer, as reported in table 2. The shape factor with a boundary layer trip lies in the range2.57 ≤ H ≤ 3.10 and 2.66 ≤ δ/δ∗ ≤ 3.10. These ranges overlap those of the wind tunnel natural boundarylayer and suggest that the 20 mm and 115 mm ∆xw sandpaper strips may have failed to induce transition.
The velocity measurements from the largest ∆xw from configuration 9 give a profile that is different fromall other configurations, as shown in figure 3(a). The ∆xw = 280 mm sandpaper strip gives a fuller profileclose to the wall, followed by a near-constant velocity gradient that persists at y = 20 mm. This streamwisevelocity distribution could not be regressed on either a laminar nor a turbulent boundary layer, indicatingthat the ∆xw = 280 mm strip was too close to the measurement location xp for the flow to develop a profilewith boundary layer type characteristics.
Figure 3(b) shows the velocity profiles from configurations 7 and 8 downsteam of the sandpaper tripin non-dimensional coordinates. The scale on the abscissa is logarithmic as in figure 2(b), to ease theidentification of any portion of the velocity profile that features the logarithmic growth of a turbulentboundary layer, u+ = κ−1 ln y+ + B. No such trend is clearly discernible in figure 3(b). Close to the wall,the laminar sub-layer analytical profile u+ = y+ is fitted to the normalized velocity measurements. This isshown to be a good fit to the experimental data, as in figure 2(b). This confirms the observations in figure 3(a)of a constant gradient velocity profile close to the wall, extending approximately to 60% of the boundarylayer thickness, which is a distinctive characteristic of a laminar boundary layer. This confirms that, over
7 of 13
American Institute of Aeronautics and Astronautics

0 1 2 3 4 50
5
10
15
20
| u | (m/s)
y(m
m)
Config. 1Config. 7Config. 9Config. 10
(a) Dimensional.
101
102
0
5
10
15
20
25
30
u+
y+
Config. 7Config. 8Linear law
(b) Non-dimensional.
Figure 3. Velocity profiles for tripped boundary layer using a sandpaper strip at different Reynolds numbers.
the Reynolds number tested, 0.128 × 10⁶ ≤ Rex ≤ 0.256 × 10⁶, the ∆xw = 20 mm and the ∆xw = 115 mmsandpaper strips are unable to induce transition and produce the desired turbulent boundary layer.
It is interesting to consider that although the ∆xw = 20 mm and the ∆xw = 115 mm sandpaper stripsfailed to develop a turbulent boundary layer of the required thickness, they were effective in altering thelaminar boundary layer thickness. The use of tripping devices to control the thickness of laminar boundarylayers is counter-intuitive and may have its use in applications where a thick laminar profile is desirable, forinstance, to reduce the rate of heat transfer around thermally insulating panels.
V.D. Silicon granules
The third boundary layer trip technique tested is a strip of silicon granules. The principle is to create astrip of uniform roughness with a roughness height higher than that of the P40 coarsest sandpaper. Theresults in table 2 for configurations 12 to 18 show that this technique achieves more than a 200% increase inboundary layers thickness compared to the wind tunnel natural boundary layer. This can also be seen fromfigure 4(a), where the profiles from configurations 12 and 17 are plotted together with the reference profileof configuration 1. In figure 4(a), the boundary layer generated by the silicon granules appears fuller thanthe reference configuration 1 profile, featuring a more rapid increase in |u| velocity near the wall. Theseare characteristics typical of post-transition boundary layers. The shape factor obtained with the silicongranules strip lies in the range 1.48 ≤ H ≤ 1.60 and δ/δ∗ is in the range 5.66 ≤ δ/δ∗ ≤ 6.26, confirming thata significant change in the velocity profile has taken place with respect to the wind tunnel natural boundarylayer profile of fig. 2(a). With this boundary layer trip, H and δ/δ∗ are closest to their reference values for a1/7th power law of a turbulent boundary layer, H = 1.29 and δ/δ∗ = 8.04, among the configurations tested.Configurations 12 to 14 in table 2 show that, by increasing Rex, H decreases towards the reference analyticalvalue of H = 1.29, suggesting that increasing Rex promotes the completion of the boundary layer transitionover the wind tunnel floor, which is a desirable outcome towards achieving a fully turbulent 20 mm thickboundary layer. The effect of the inflow speed on the wall friction velocity is that doubling u∞ doubles uτ ,as reported in table 2. This trend is closer to that for a turbulent boundary layer, for which a 1/7th powerlaw profile gives uτ ∝ u0.9
∞, than that from a Blasius laminar profile, in which uτ ∝ u0.75
∞.
Figures 4(b) and 4(c) show respectively the velocity profiles obtained with ∆xw = 48 mm and ∆xw = 96mm wide silicon granule strips, in non-dimensional coordinates. The same logarithmic scale on the abscissais used in figures 4(b) and 4(c) as in figures 2(b) and 3(b). In figures 4(b) and 4(c), the velocity profiles growlogarithmically over the range 30 ≤ y+ ≤ 70, following the logarithmic law of the wall for turbulent boundarylayers, u+ = κ−1 ln y+ + B, which is shown in figures 4(b) and 4(c) by a solid line. This trend supports theobservations in figure 4(a) on the velocity profile shape being representative of a post-transitional boundarylayer.
Figure 5(a) shows the Fourier analysis of the 32 seconds hot-wire velocity record taken at y+ = 65 with the∆xw = 48 mm narrow strip. 0.03 Hz narrow-band Power Spectral Levels of velocity are obtained by discreteFourier transform of the discretized |u| velocity history with no anti-aliasing filter and no windowing. On the
8 of 13
American Institute of Aeronautics and Astronautics

0 1 2 3 4 50
5
10
15
20
25
30
| u | (m/s)
y(m
m)
Config. 1Config. 12Config. 17
(a) Dimensional.
101
102
5
10
15
20
25
u+
y+
Config. 12Log lawLinear law
(b) Non-dimensional.
101
102
5
10
15
20
25
u+
y+
Config. 17Log lawLinear law
(c) Non-dimensional.
Figure 4. Velocity profiles for tripped boundary layer using a silicon granule strip at different Reynolds numbers.
9 of 13
American Institute of Aeronautics and Astronautics

abscissa, the frequency range is 0 ≤ f ≤ 256 Hz, 256 Hz being the Nyquist frequency. The 0.03 Hz frequencyresolution in figure 5(a) highlights a full broadband spectrum, the decay rate of which is comparable tothe −5/3 exponential roll-of from fully developed isotropic turbulence spectra. This exponential decay isreported in the graph by a continuous line for reference.
The narrow-band Power Spectral Level distribution of figure 5(a) is rather noisy over the frequency range50 Hz to 256 Hz. To improve the signal to noise ratio in the results, the 32 seconds data was divided into16 records of 2.28 seconds each with a 28% optimal overlap between contiguous segments, from which 0.44Hz constant bandwidth Power Spectral Levels were obtained. Assuming the velocity fluctuations in thehigh frequency range are ergodic, as in fully developed turbulence, allowed to ensemble average the PowerSpectral Levels over the 16 records. Figure 5(b) shows that this averaging has reduced considerably thescatter across the spectrum. The average of the first order upstream gradient of the Power Spectral Levelsover the range 50 Hz ≤ f ≤ 256 Hz is −1.5535. This gradient is shown by the dash-dot line in figure 5(a).This compares reasonably well to the −3/5 gradient from fully developed turbulence spectra. This gradientis shown by the continuous line in figure 5(b).
Reducing the strip width to ∆xw = 24 while maintaining approximately the same free-stream velocitygives similar results, as shown in figures 5(c) and 5(d). In this configuration, the gradient of the decay ofturbulent velocity fluctuations is −1.8144.
Figure 5(e) shows the narrow-band Power Spectral Level of velocity obtained from the ∆xw = 96 mmwider strip, taken at y+ = 68. The sampling time and the acquisition frequency are the same as thoseof figure 5(a), leading to the same 0 Hz ≤ f ≤ 256 Hz frequency range and 0.03 Hz frequency resolution.Whereas a full broadband spectrum is obtained like in figure 5(a), its decay rate over the frequency range50 Hz to 256 Hz is about −1.4, as indicated by the dash-dot line in the graph. This gradient is further awayfrom the −3/5 decay rate from fully developed turbulence, shown by the solid line in figure 5(e), than inconfigurations 12 and 15.
To reduce the scatter in the Sound Pressure Level data, the 32 seconds dataset is divided in 16 segmentsof 2.396 seconds each, with an optimal overlap of 39% between contiguous segments. This overlap is largerthan the one used for figure 5(b), giving 16 0.42 Hz constant bandwidth Power Spectral Density records thatare ensemble averaged to give figure 5(f). In figure 5(f), the average of the first order upstream gradient ofthe Power Spectral Levels over the range 50 Hz ≤ f ≤ 256 Hz is −1.3738 . Similar results were obtainedat the higher free-stream velocity of configuration 18, where the decay rate was found to be −1.1217. Thisis further away from the theoretical decay rate of −3/5 of isotropic turbulence, indicating that using the∆xw = 96 mm wider strip gives a boundary layer in which turbulence is further away from equilibrium thanwith the narrower strips, over the Reynolds number range 0.13 × 10⁶ ≤ Rex ≤ 0.26 × 10⁶.
The configurations in which the decay rate of the velocity Power Spectral Level approximates better tothat of a fully turbulent flow, −5/3, are configurations 12 and 15, where the narrower ∆xw = 24 mm and∆xw = 48 mm strips are used.
The highest Reynolds number at which the silicon granules trip was tested was Rex = 0.55 × 10⁶ ofconfiguration 14. At this higher free-stream speed, the decay rate is further away from −5/3 than atRex = 0.276 × 10⁶, indicating a boundary layer with turbulence further from being fully developed thanat the lower speeds tested, probably due to the generation and shedding of more energetic structures thatpropagate downstream and decay more slowly as compared to the lower free stream velocity configurations.
VI. Boundary layer trip device selection
A two-step ranking system is used to guide the selection of the boundary layer trip device that generatesa flow closest to the target of a 20 mm thick fully turbulent boundary layer. In the first step, the performanceof each device is computed as a compound non-dimensional error ǫ1 with respect to the integral boundarylayer parameters (δ0,H0) of the target flow.
ǫ21 = cδ0
(
δ
δ0
− 1
)2
+ cH0
(
H
H0
− 1
)2
(1)
In equation 1, δ0 = 20 mm is the target boundary layer thickness and H0 = 1.4 is the target shape factorfor a fully developed turbulent boundary layer. The non-dimensional coefficients cδ0
and cH0in equation 1
are such that cδ0+ cH0
= 1. cδ0= 2/3 and cH0
= 1/3 are specified to give a higher weight to achievingthe target boundary layer thickness of 20 mm with respect to matching the target shape factor H0. While
10 of 13
American Institute of Aeronautics and Astronautics

10−2
100
102
104
10−1
100
101
102
103
f
PSL
Config. 12−1.67 exponential decay−1.55 exponential decay
(a) Constant bandwidth Power Spectral Levels of velocityat y
+ = 65, Configuration 12.
102
101
f
<P
SL
>
Config. 12−1.67 exponential decay−1.55 exponential decay
(b) Ensemble averaged Power Spectral Levels of velocityat y
+ = 65, Configuration 12.
10−2
100
102
104
10−1
100
101
102
103
f
PSL
Config. 15−1.67 exponential decay−1.81 exponential decay
(c) Constant bandwidth Power Spectral Levels of velocityat y
+ = 55.5, Configuration 15.
102
100
101
102
f
<P
SL
>
Config. 15−1.67 exponential decay−1.81 exponential decay
(d) Ensemble averaged Power Spectral Levels of velocityat y
+ = 55.5, Configuration 15.
10−2
100
102
104
10−1
100
101
102
103
PSL
Config. 17−1.67 exponential decay−1.37 exponential decay
(e) Constant bandwidth Power Spectral Levels of velocityat y
+ = 68, Configuration 17.
102
101
f
<P
SL
>
Config. 17−1.67 exponential decay−1.37 exponential decay
(f) Ensemble averaged Power Spectral Levels of velocityat y
+ = 68, Configuration 17.
Figure 5. Velocity spectra from turbulent boundary layers tripped by silicon granules.
11 of 13
American Institute of Aeronautics and Astronautics

δ0 = 20 mm is a firm target, H0 = 1.4 is used only as an indication of the turbulent state of the boundarylayer. The turbulent state of the boundary layer will be re-checked in the second step of this two-stepselection procedure. Therefore H0 = 1.4 is taken as a soft target.
Computing ǫ21 generates a short-list from all configurations tested. This step is designed on purpose tobe rather crude, so to involve the least amount of data processing that makes it scalable to an ensembleof trip device variants broader than the 18 configurations considered in table 1. This step requires onlytime-averaged flow measurements as input, obtainable from simpler instrumentation, like a flattened headPitot probe, than time-resolved data. Table 3 shows ǫ21 obtained from the 18 configurations tested.
Configuration δ−δ0
δ0
H−H0
H0ǫ21
1 -59.35 % +110.0% 63.82%
2 -67.35 % +103.6 % 66.02%
3 -71.20 % +82.86 % 56.68%
4 -5.750% -1.428% 0.227%
5 -5.750% +3.574% 0.263%
6 -5.750% +23.57% 2.072%
7 -56.20% +88.57% 47.20%
8 -62.45% +83.57% 49.28%
10 -58.75% +121.4% 72.14%
11 -65.00% +120.0% 76.17%
12 -3.200% +14.29% 0.749%
13 -4.300% +11.43% 0.559%
14 -7.200% +5.714% 0.454%
15 -6.350% +10.00% 0.602%
16 -4.500% +4.286% 0.196%
17 +11.85% +12.14% 1.427%
18 +15.80% +7.143% 1.834%
Table 3. Compound non-dimensional difference from the target flow with different boundary layer trip devices.
The trip devices are short-listed such to minimize the compound error ǫ21. The short-list of the betterperforming trip devices is obtained by imposing ǫ21 < 2.5%. This threshold points towards configurationsin which the profiles are either transitional or post-transitional. This is a pre-requisite to implement thesecond step in the two-step ranking system. From table 3, the configurations short-listed are the trip wireconfigurations (4, 5, 6) and the granule strip configurations (12, 13, 14, 15, 16, 17, 18).
The second step is designed to estimate the difference between the measured velocity profile and thatfrom a zero pressure gradient fully turbulent boundary layer in the log-layer regions for the short-listedconfigurations. Hence, a second non-dimensional error ǫ2 is defined as:
ǫ22 =1
N
N∑
i=1
(
u+(
y+i
)
− Ulog
(
y+i
)
Ulog
(
y+i
)
)2
y+
i>35
(2)
where u+(
y+i
)
=∣
∣u(
y+i
)∣
∣ /uτ , Ulog
(
y+i
)
= κ−1 ln y+i − B, N is the number of measured points at y+ > 35
and y+i is the normalized wall-normal distance of the ith measurement point at y+ > 35.
The ǫ22 percentage errors obtained from the 18 configurations tested are shown in table 4. The bestconfiguration with the lowest ǫ22 is configuration 12, where a ∆xw = 48 mm wide granule strip is used atRex = 137835.6.
VII. Concluding remarks
The generation of a thick fully turbulent boundary layer at low velocity using different tripping deviceshas been addressed experimentally. For the present wind-tunnel, and in absence of a tripping device, the
12 of 13
American Institute of Aeronautics and Astronautics

Configuration ǫ21 ǫ22 Ranking
4 0.227% % 8
5 0.263% % 9
6 2.072% % 10
12 0.749% 0.076% 1
13 0.559% 0.210% 4
14 0.454% 0.286% 7
15 0.602% 0.093% 2
16 0.196% 0.247% 6
17 1.427% 0.132% 3
18 1.834% 0.245% 5
Table 4. Mean square percentage error of the logarithmic velocity profile for the short-listed configurations.
natural boundary layer is laminar over the test Reynolds number range. The maximum value of δ, in thisconfiguration, is equal to 8.13 mm leading to Reθ = 264.4. The laminar state of the boundary layer isconfirmed by the shape factor H > 2.5 and the absence of a logarithmic growth in the normalized velocityprofile.
Three different trip devices were tested. Applying a trip wire gives a significant growth in boundarylayer thickness. However, the variation of u+ versus y+ in the resulting velocity profiles does not fit thelogarithmic law of the wall. Furthermore, the variations of δ and θ with u∞ are very limited, making itdifficult to adjust the set-up to obtain different boundary layer heights. Using a sandpaper strip allowedto improve the velocity profiles but the flow remained mainly laminar and the increase in boundary layerthickness was modest. With a sandpaper strip, the largest δ observed is equal to 8.76 mm, leading toReθ = 304.5.
The idea of combining the effects of a high obstacle in the flow and that of a uniformly distributedroughness led to testing strips of silicon granules. With this trip device, δ ∼ 20 mm and H ∼ 1.40. Theinvestigation of the normalized velocity and the statistical data has shown a good agreement with thelogarithmic law for u+ and the exponential decay law for < PSL >.
It has been shown that, even though wider silicon granule strips increase δ, they cause a departure fromequilibrium turbulence in the outer layer at the highest speed tested.
These results are of interest to the wind tunnel practitioner in the selection of an effective boundary layertrip for a low-speed wind tunnel test.
Acknowledgements
This research project has been supported by a Marie Curie Research Training Fellowship of the EuropeanCommunity’s Sixth Framework Programme under contract MEST CT 2005 020301. The contributions ofMr. Paul Williams, Dr Yahya Akansu and Mr. Marco Grottaduarea are gratefully acknowledged.
References
1Casella, M., Castelluccio, V., and Marchese, P., “Measurements of the pressure fluctuations within an idealized door sealcavity in presence of flow,” Technical report, Centro Ricerche Fiat, Orbassano, Italy, 2000.
2Ribaldone, E., Castelluccio, V., and Marchese, P., “Experimental and numerical study of flow excited cavities,” Third
International Congress in Sound and Vibration, Garmish, 2000.3Grottadaurea, M. and Rona, A., “The role of the inflow momentum thickness in subsonic cylindrical cavity noise genera-
tion,” 14th International Congress on Sound and Vibration, No. 165, Cairns, Australia, July 2007.4Rowley, C., Colonius, T., and Basu, A., “On Self-sustained Oscillations in Two-dimensional Compressible Flow Over
Rectangular Cavities,” J. Fluid Mechanics, Vol. 455, 2002, pp. 315–46.5Calvert, J. R. and Farrar, R. A., An engineering data book , MacMillan Press Ltd, Houndmills, Basingstoke, Hampshire,
UK, 1999.
13 of 13
American Institute of Aeronautics and Astronautics