bottom wash assessment using a full mission ship
TRANSCRIPT
8/12/2019 Bottom Wash Assessment Using a Full Mission Ship
http://slidepdf.com/reader/full/bottom-wash-assessment-using-a-full-mission-ship 1/10
Bottom Wash Assessment Using a Full Mission Ship
Handling Simulator
Marko Perkovic1, Milan Batista
1, Vlado Malacic
2, Dusan Zagar
3, Stefan Jankowski
4, Lucjan Gucma
4,
Maciej Gucma4, Dmitry Rostopshin
5
1 University of Ljubljana, Faculty of Maritime Studies and Transport, Slovenia
2 National Institute of Biology, Marine Biology Station, Slovenia
3University of Ljubljana, Faculty of Civil and Geodetic Engineering, Slovenia
4 Maritime University of Szczecin, Institute of Maritime Traffic Engineering, Poland
5 Transas Technologies, St.Petersburg, Russia
ABSTRACT:
The urgency with which researchers must engage in responding to current and predictable
environmental harm caused by mercantile shipping arguably increases at a far greater rate
than the inevitable increase in shipping, when one considers lasting effects potential, likely,
and unknown. To this end, this paper will describe a case study of a scientific and industrial
work in progress that has been necessitated by a port’s desire to rapidly and markedly
expand its capacity where berthing of large »powerful« vessels is foreseen. It is well known
that maritime traffic is the anthropogenic factor most responsible for the uplift of sediments in
shallow water areas like Trieste Bay. While vessels manouvere the propeller rotates, draws
in water and discharges it in the form of a high velocity jet. The understanding of theformation and diffusion characteristics of these jets has become of increasing importance in
recent years. This paper will demonstrate how a full mission ship handling simulator
(together with the engine room simulator) forms a valuable tools for assessing bottom wash
circumstances within the shallow water area of Trieste Bay where sediments contain high
concentrations of mercury.
Key words; Ship handling simulator, Maneuvering, Propeller thrust, Bottom wash, Mercury
re-sedimentation
1. Introduction
Among the many environmental issues concerning transport, one that is seldom studiedor even discussed is that of re-sedimentation, the effect of maritime vessels on the seabottom, particularly, of course, in and near ports. The most recent OECD 2011 studyregarding the environmental impacts of maritime transport has clearly indicated that portactivities can have significant negative impacts, both in ports and in the immediate vicinity ofthe ports. Examples of these are noise from ship engines and machinery used for loadingand unloading, the emission of particles – e.g., CO2, NOx and SO2 from the ship’s main andauxiliary engines, and dust from the handling of substances such as grain, sand and coal.Road and rail traffic to and from the port area cause additional environmental problems. Theenvironmental impact of ports may thus be divided into three subcategories: i) problemscaused by port activity itself; ii) problems caused at sea by ships calling at the port; and iii)
emissions from inter-modal transport networks serving the port.
8/12/2019 Bottom Wash Assessment Using a Full Mission Ship
http://slidepdf.com/reader/full/bottom-wash-assessment-using-a-full-mission-ship 2/10
Aside from the known pollution drivers, related to the Gulf of Trieste, which issubjected to high anthropic pressure due to coastal and marine activities and infrastructures,we have been studying the effects of vessels on the sea bottom. In the area there are twolarge multipurpose ports - Koper and Triese - and two smaller ports - Monfalcone and Grado – as well as the well known shipyard located in Monfalcone. More than 6000 vessels call inthese ports yearly.
The Gulf of Trieste is a semi-enclosed gulf in the north-eastern part of the AdriaticSea (Malacic & Petelin, 2009). It is a shallow water area with an average depth of 16 m anda maximum depth of 25 m (Sirca et al., 1999). Thus this shallow area is subject to the specialpollution consideration related to bottom wash phenomena. There is a high mercuryconcentration in the subaquatic sediment which rises into the sea column while ships aremanouevering. This sediment cloud (smaller particles) is then moved by currents for severalhours and before re-sedimenting, which ineluctably affects the aquatic food chain.
In the town of Idrija, Slovenia, the world's second largest mercury mine was active for500 years and an estimated 37,000 tons of mercury has in consequence dispersedthroughout the environment. Mercury is still drained from soil, riverbed and floodplains andtransported with the Idrijca and Soca Rivers to the Gulf of Trieste. The Soca River averages
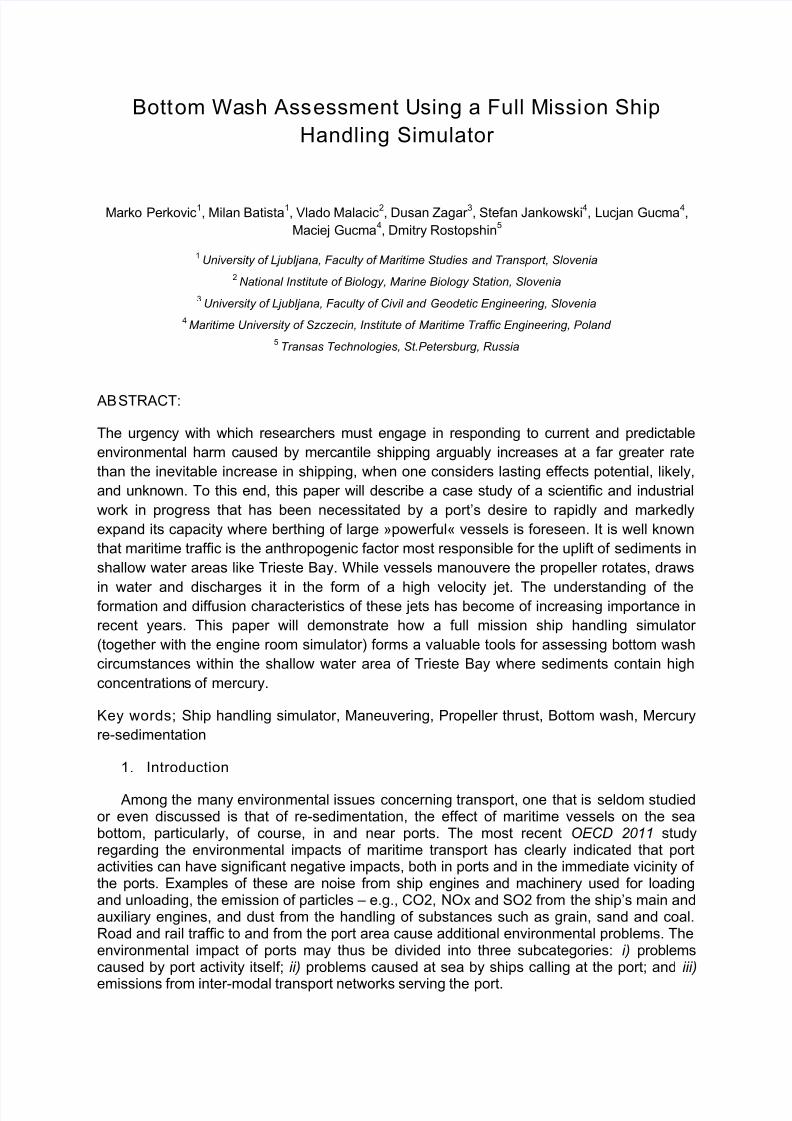
a discharge of 150 m3/s, a suspended matter concentration of 50 mg/l dry weight and amercury content of 7.5 mg/g dry weight in suspended matter. This results in a load of 1773.9kg of mercury per year. The Hg contents in the gulf sediments fit the exponential spatialdistribution function (Covelli et al., 2001). Figure 1 shows that mercury contamination isextensive in the near shore areas of the northern sector. The highest Hg values are locatedat the river mouth and south-westwards from the source. Due to the sharp metal decreasewith distance, 14 μg g−1 is used as the maximum contour to avoid clutter, and to bestillustrate the distribution. This should theoretically show a radial and almost symmetricaldiffusion if the river mouth is considered as a single source point of contaminants usuallybound to finer particles according to the grain-size distribution of the sea-bottom sediments inthe gulf (Brambati et al., 1983). Only a small amount of Hg reaches the south-eastern(Slovenian) sector of the gulf, where metal concentrations in sediments average about 0.5 μg
g−1, which is significantly lower but still ten times higher than the estimated world naturalsedimental composition.
Figure 1: Mercury, bathymetry and TSS Figure 2: Traffic density (Jun-September 2011)
Figure 2 shows the traffic density in the area of the Port of Koper (south) and the Portof Trieste (north and a little east). AIS based tracks clearly identify anchorage positions,where characteristic ellipses show movement of the ships as affected by tides. In suchconditions – shallow waters, shipping intensive, high mercury content - the Port of Koper hasadopted a berthing enlargement plan which will both increase traffic in the area and enablelarger container vessels and bulk carriers. Italian experts are concerned that the increase ofmore and more intrusive vessels (higher draft – more powerful vessels) sailing in this shallow
8/12/2019 Bottom Wash Assessment Using a Full Mission Ship
http://slidepdf.com/reader/full/bottom-wash-assessment-using-a-full-mission-ship 3/10
contaminated area will have the specific cross-border influence of increasing mercurymovements and re-sedimentation in Italian waters, exacerbating an already disturbingcircumstance.
2. Materials
This paper does not investigate subaquatic cloud transport, only bottom wash modeling.For that purpose a propeller wash model is coupled to the parameters obtained using a shiphandling simulator (Perkovic et al., 2008). Chosen intrusive vessels were boarded by realcaptains and pilots while complete berthing and departure maneuvers were performed byusing two simulated tugs commanded by real tug masters. All manoeuvers were monitoredby port state inspectors.
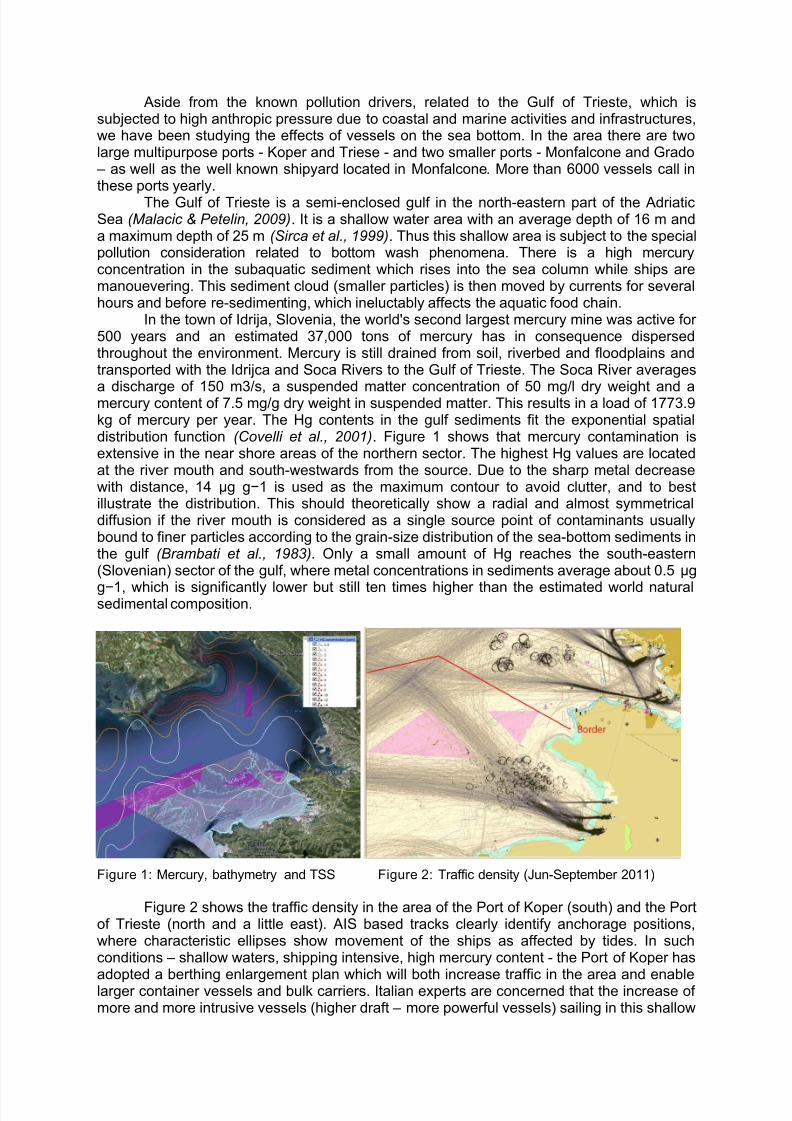
First it was necessary to build the planned, enlarged port area based on precisebathymetry. The sailing area was created by using Transas application ModelWizzard [8].Highly precise bathymetry (Figure 3) (spatial resolution 1m x 1m) was inserted and theprojected sailing area with entrance channels was quickly created. Figure 4 is a screen shotfrom the ship handling simulator NTPro5000 [9] showing a highly precise 18 m depth
sounding line - isobath.
Figure 3: DEM data Figure 4: Enhanced sailing area (18m isobaths)
The process of bottom wash is basically a function of the size, type and speed ofpropeller, vessel speed, sub-propeller clearance and sediment conditions. It is obvious thatthe process is dynamic; continuously changing vessel position results in variable bathymetryand vessel/tug propulsion. This process can be simulated and compared with actualmaneuvering results where telegraph recording data is collected together with vesseldynamics. An example of an intrusive manoeuver is visible in figure 5. The pilot ordering fullastern, which equaled -72 RPM, while the ship was at rest, resulted in maximum slip and
thrust creating extensive propeller wash.Figure 6 (the left part) shows the real AIS based approaching dynamics of a postpanamax container vessel. The berthing procedure is assisted by three tugs. The vesselberthed at the container terminal with minimum actual tug assistance and the main enginewas just slightly reversed alongside the pier to stop the vessel. The right side of figure 6shows the vessel astern departing procedure and turning with the help of three tugs.
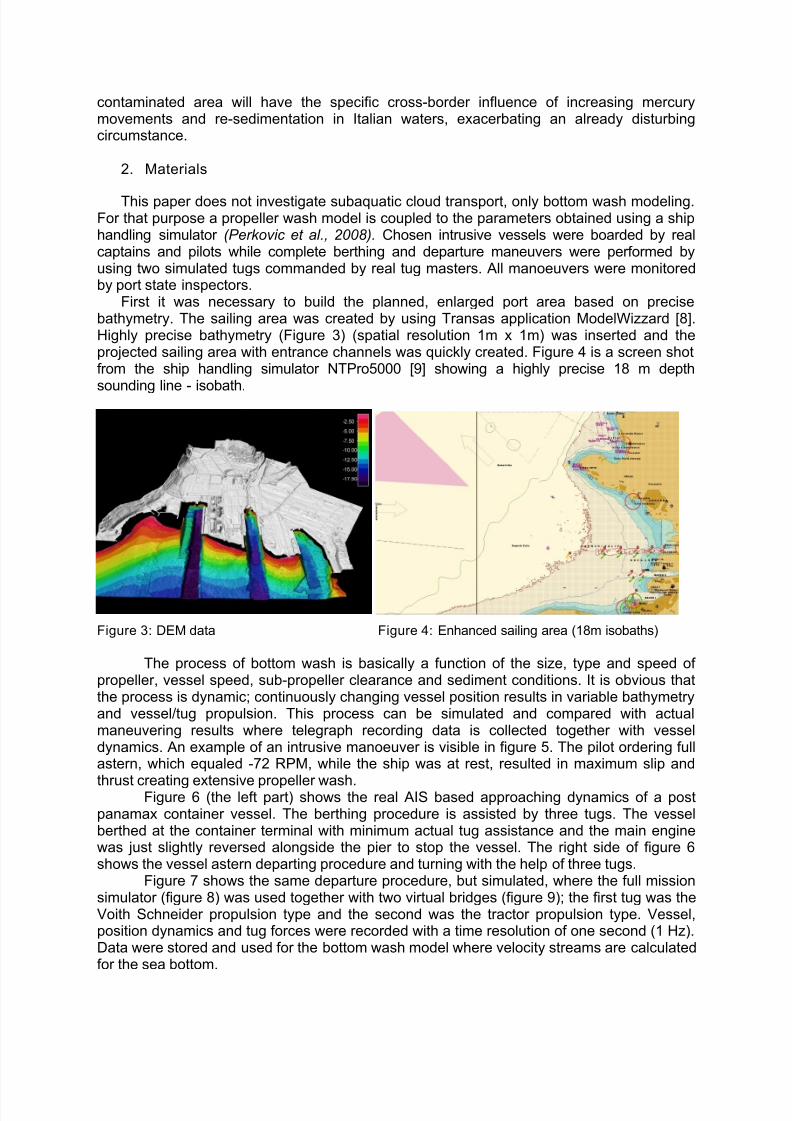
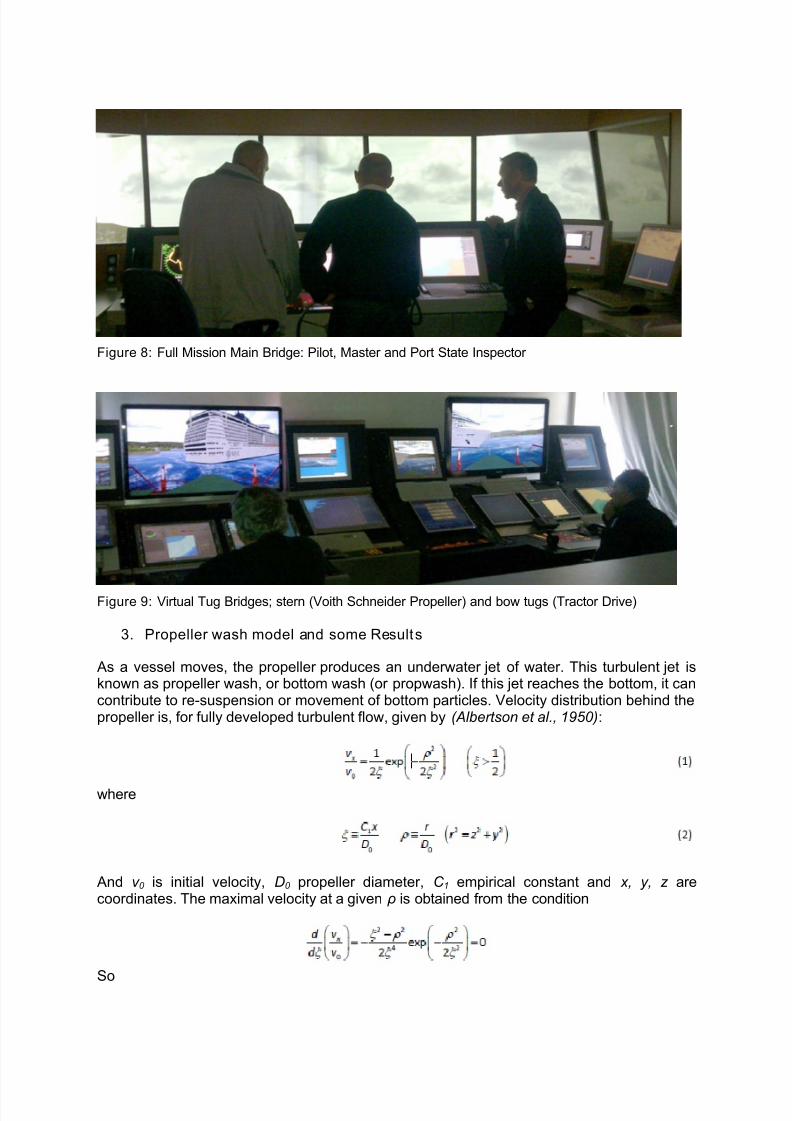
Figure 7 shows the same departure procedure, but simulated, where the full missionsimulator (figure 8) was used together with two virtual bridges (figure 9); the first tug was theVoith Schneider propulsion type and the second was the tractor propulsion type. Vessel,position dynamics and tug forces were recorded with a time resolution of one second (1 Hz).Data were stored and used for the bottom wash model where velocity streams are calculatedfor the sea bottom.

8/12/2019 Bottom Wash Assessment Using a Full Mission Ship
http://slidepdf.com/reader/full/bottom-wash-assessment-using-a-full-mission-ship 4/10
Figure 5: Intrusive manoeuver “full astern” resulting in extensive propeller wash
Figure 6: AIS based Container carrier approach (left) and departure (right)
Figure 7: Simulated based Container departure, ship resistance and tugs forces
8/12/2019 Bottom Wash Assessment Using a Full Mission Ship
http://slidepdf.com/reader/full/bottom-wash-assessment-using-a-full-mission-ship 5/10
Figure 8: Full Mission Main Bridge: Pilot, Master and Port State Inspector
Figure 9: Virtual Tug Bridges; stern (Voith Schneider Propeller) and bow tugs (Tractor Drive)
3. Propeller wash model and some Results
As a vessel moves, the propeller produces an underwater jet of water. This turbulent jet isknown as propeller wash, or bottom wash (or propwash). If this jet reaches the bottom, it cancontribute to re-suspension or movement of bottom particles. Velocity distribution behind thepropeller is, for fully developed turbulent flow, given by (Albertson et al., 1950):
where
And v 0 is initial velocity, D0 propeller diameter, C 1 empirical constant and x, y, z arecoordinates. The maximal velocity at a given ρ is obtained from the condition
So

8/12/2019 Bottom Wash Assessment Using a Full Mission Ship
http://slidepdf.com/reader/full/bottom-wash-assessment-using-a-full-mission-ship 6/10
and maximal velocity is
At the bottom we have therefore
In Propeller Wash Study (Moffatt & Nichol, 2005) the maximal bottom velocity is given by
Where α is 0.22 for open propellers and 0.3 for ducted propellers.
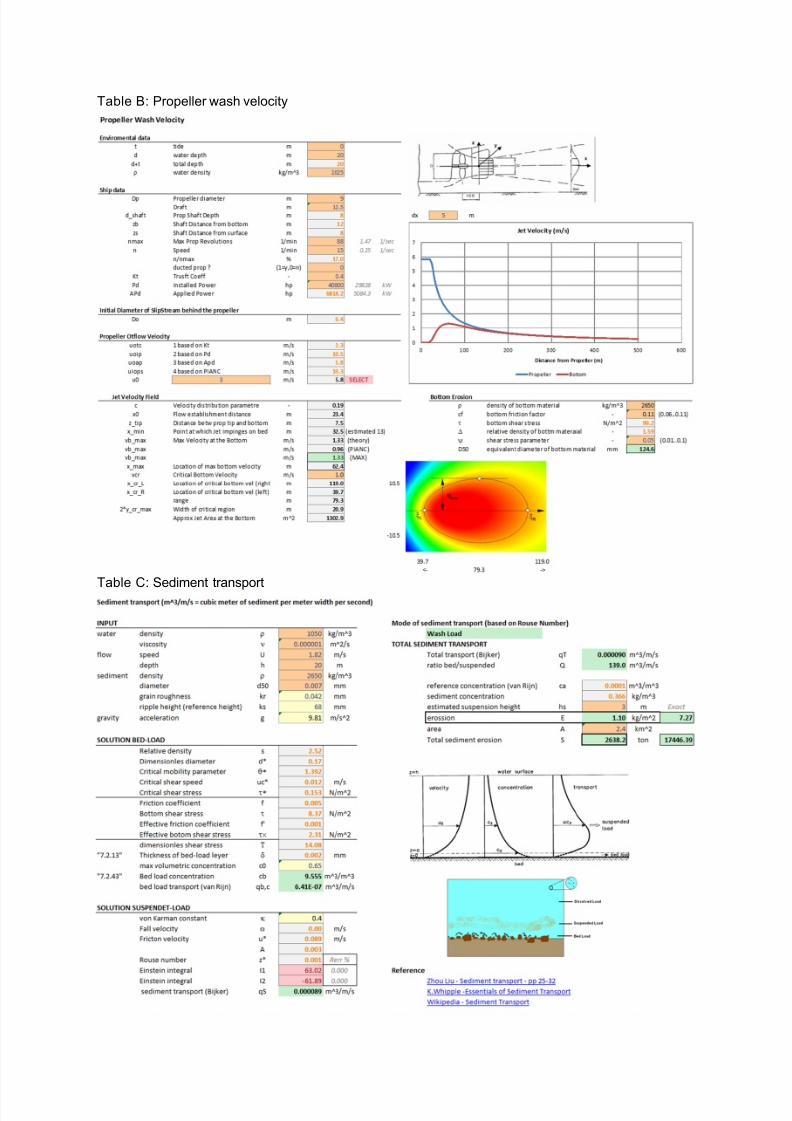
The following table shows, at the left, data obtained from the NTP5000 simulator duringmanouvers. The right part shows areas for certain critical bottom stream velocity. Thoseparameters are calculated according to the setup described with table B. Table C shows thetotal amount of sediment transport divided further to bed-load, suspended-load and washload.
Table A: Data from ship handling simulator NTPro5000
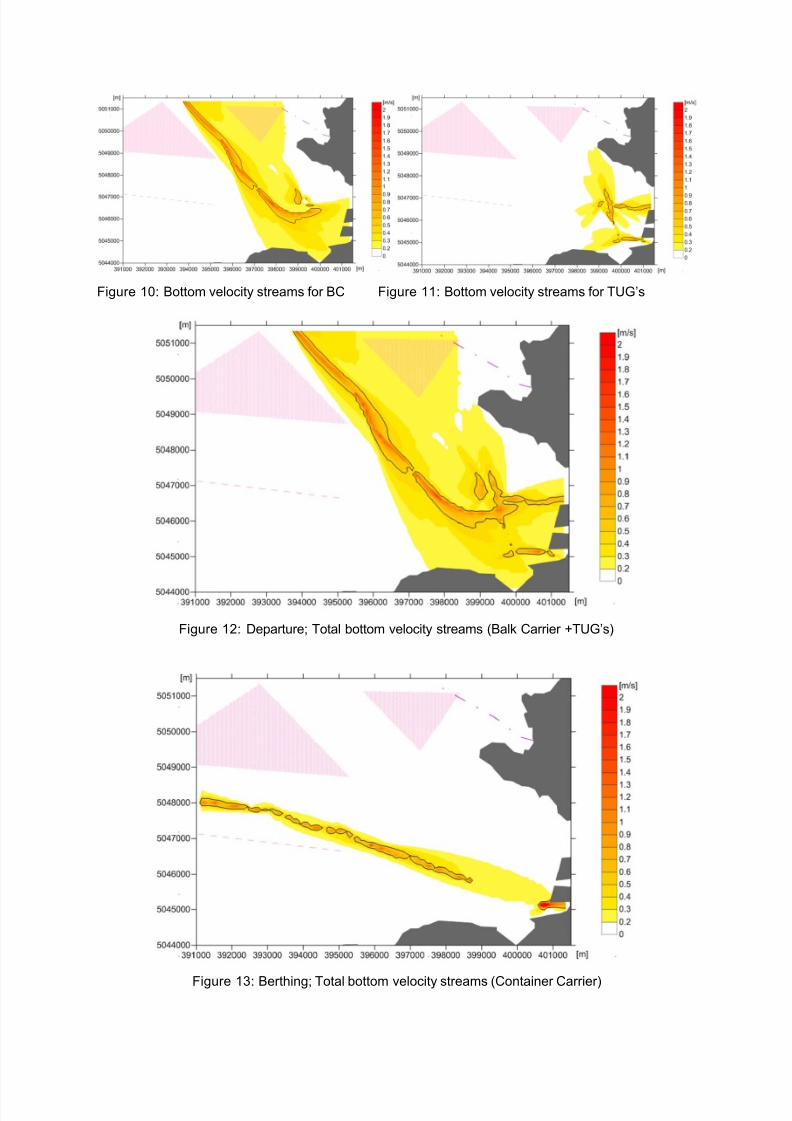
Figure 10 shows propeller jet streams at the sea bottom for the departure maneuver of a postpanamx bulk vessel in ballast condition. Figure 11 corresponds to streams associated to twotugs assisting the bulk carrier. Figure 12 is the cumulative composition for a departing bulkcarrier and tugs together. Figure 13 shows propeller velocity streams for a post panamaxcontainer vessel approaching a container terminal. Even though the installed engine is muchgreater, the applied power during berthing is much less compared to the bulk carrierdeparture condition.
8/12/2019 Bottom Wash Assessment Using a Full Mission Ship
http://slidepdf.com/reader/full/bottom-wash-assessment-using-a-full-mission-ship 7/10
Table B: Propeller wash velocity
Table C: Sediment transport
8/12/2019 Bottom Wash Assessment Using a Full Mission Ship
http://slidepdf.com/reader/full/bottom-wash-assessment-using-a-full-mission-ship 8/10
Figure 10: Bottom velocity streams for BC Figure 11: Bottom velocity streams for TUG’s
Figure 12: Departure; Total bottom velocity streams (Balk Carrier +TUG’s)
Figure 13: Berthing; Total bottom velocity streams (Container Carrier)
8/12/2019 Bottom Wash Assessment Using a Full Mission Ship
http://slidepdf.com/reader/full/bottom-wash-assessment-using-a-full-mission-ship 9/10
4. Conclusion
Maritime traffic is an anthropogenic factor that is much more responsible for the uplift ofsediments in the Bay of Trieste than natural phenomena such as currents and waves instormy weather. The silt sediment are lifted by the ship's propeller at a typical rotation ratewhile manoeuvering inside the bay around the maritime traffic channels and piers, where the
depth of the seafloor is between 12 and 25 meters and the maximum vessel draft up to 17.5meters. When large vessels start moving, the rotation rate of propellers is high and theimpact of the vessel on the sediments inside a shallow bay is high.
The Port of Koper intends to increase their cargo operations from the current 16-18million tons to 30-40 million tons in five to ten years, doubling the cargo capacity, so more orless doubling the number of vessels calling. Containers continue to increase their share ofshipping visits; Ro-Ro’s, another intrusive vessel type, continue to accommodate anincreasing traffic in automobiles; and passenger vessels are growing in size while ports striveto expand to accommodate the increase in passenger traffic. The effects of current shippingtrends on the sea bed must be understood with a long term view to eliminating environmentaldamage, in this case especially as it may affect cross border sedimentation.
As an initial step towards alleviating the environmental impact of maritime commerce inport areas, this paper demonstrated, most importantly, that the effects are measurable usingsimulation. It was demonstrated that ship handling simulators can help reconstruct realdomain thrust conditions in a variety of circumstances. The results will be used to estimatemaximum applied power related to vessel speed for different intrusive vessels for departurefrom anchorage or port. Further steps are clearly necessary, especially as the problem ofbottom wash is at this point relatively obscure as an issue in a transport system alreadychallenged by increasing attention paid to various other environmental issues, especially oilspills and ballast water discharge effects. At some point we expect that the issue will be metwith politically and legally, at which point monitoring will be yet another task for researchscientists using integrated simulation as well as on sight sampling.
Note:This paper is the result of work performed with national ARRS project titled “Influence ofcirculation and maritime traffic on sediment transport in wide open bays” number L2-4147 (D)
5. References
[1] OECD (2011). Environmental Impacts of International Shipping: The Role of Ports, OECDPublishing. http://dx.doi.org/10.1787/9789264097339-en
[2] Malacič Vlado and Petelin Boris (2009). Climatic circulation in the Gulf of Trieste (northern Adriatic). J Geophys Res. 114(C07002):1-15.doi: 10.1029/2008JC004904
[3] Andrej Sirca, Rudi Rajar, Reed C. Harris, Milena Horvat (1999). Mercury transport and fate inthe Gulf of Trieste (Northern Adriatic) - a two dimensional modelling approach EnvironmentalModelling & Software 14, pp. 645–655
[4] Dusan Zagar, Ana Knap, John Warwick, Rudi Rajar, Milena Horvat and Matjaz Cetina (2006).Total Environ 368(1):149-63 PMID
[5] Stefano Covelli, Jadran Faganeli, Milena Horvat, Antonio Brambati (2001). Mercurycontamination of coastal sediments as the result of long-term cinnabar mining activity (Gulf ofTrieste, northern Adriatic sea), Applied Geochemistry, Volume 16, Issue 5, pp. 541–558
[6] Brambati, M. Ciabatti, G.P. Fanzutti, F. Marabini, R. Marocco (1983). A new sedimentological
textural map of the northern and central Adriatic Sea, Boll. Oceanol. Teor. Appl., 1, pp. 267–271

8/12/2019 Bottom Wash Assessment Using a Full Mission Ship
http://slidepdf.com/reader/full/bottom-wash-assessment-using-a-full-mission-ship 10/10
[7] Perkovic, M., Harsch, R., Suban, V., Vidmar, P., Nemec, D., Muellenhoff, O., Delgado, L.(2008), The Use of Integrated Maritime Simulation for Education in Real Time, InternationalMaritime Lecturers’ Association, 16th Conference on MET, IMLA 2008, 14-18 October, Izmir,Turkey, pp.461-478
[8] Model Wizard technical manual, Database Editing Tools, Transas ltd,
http://www.transas.com/products/simulators/sim_products/navigational/components/tools/
[9] NTPro 5000 technical manual, NTPRO – Navigational simulator, Transas ltdhttp://www.transas.com/products/simulators/sim_products/navigational/
[10] Albertson, N., Dal Y., Jensen, R., Rouse, H. (1950). Diffusion of Submerged Jets ASCE PaperNo. 2409
[11] Moffatt & Nichols (2005). Propeller Wash Study. Kitimat LNG Import Terminal, MN Project No.5499.