boston!university!school!of!management!research!paper ... · juliana sutanto, eth zurich...
TRANSCRIPT

Electronic copy available at: http://ssrn.com/abstract=2225359
Boston University School of Management Research Paper Series
No. 2013-‐4
“Attention Allocation in Information-‐Rich Environments: The Case of News Aggregators”
Mihai Calin
Chris Dellarocas
Elia Palme
Juliana Sutanto
Electronic copy available at: http://ssrn.com/abstract=2225359Electronic copy available at: http://ssrn.com/abstract=2225359
Attention Allocation in Information-Rich
Environments: The Case of News Aggregators
Mihai Calin, ETH Zurich ([email protected])
Chris Dellarocas, Boston University ([email protected])
Elia Palme, ETH Zurich ([email protected])
Juliana Sutanto, ETH Zurich ([email protected])
February 16, 2013
Abstract
News aggregators have emerged as an important component of digital content
ecosystems, attracting tra�c by hosting curated collections of links to third party con-
tent, but also inciting con�ict with content producers. Aggregators provide titles and
short summaries (snippets) of articles they link to. Content producers claim that their
presence deprives them of tra�c that would otherwise �ow to their sites. In light of
this controversy, we conduct a series of �eld experiments whose objective is to provide
insight with respect to how readers allocate their attention between a news aggregator
and the original articles it links to. Our experiments are based on manipulating ele-
ments of the user interface of a Swiss mobile news aggregator. We examine how key
design parameters, such as the length of the text snippet that an aggregator provides
about articles, the presence of associated images, and the number of related articles on
the same story, a�ect a reader's propensity to visit the content producer's site and read
the full article. Our �ndings suggest the presence of a substitution relationship between
the amount of information that aggregators o�er about articles and the probability that
readers will opt to read the full articles at the content producer sites. Interestingly, how-
ever, when several related article outlines compete for user attention, a longer snippet
and the inclusion of an image increases the probability that an article will be chosen
over its competitors.
Keywords: digital content, media curation, media economics, news aggregator, click-through
rate
1
Electronic copy available at: http://ssrn.com/abstract=2225359Electronic copy available at: http://ssrn.com/abstract=2225359
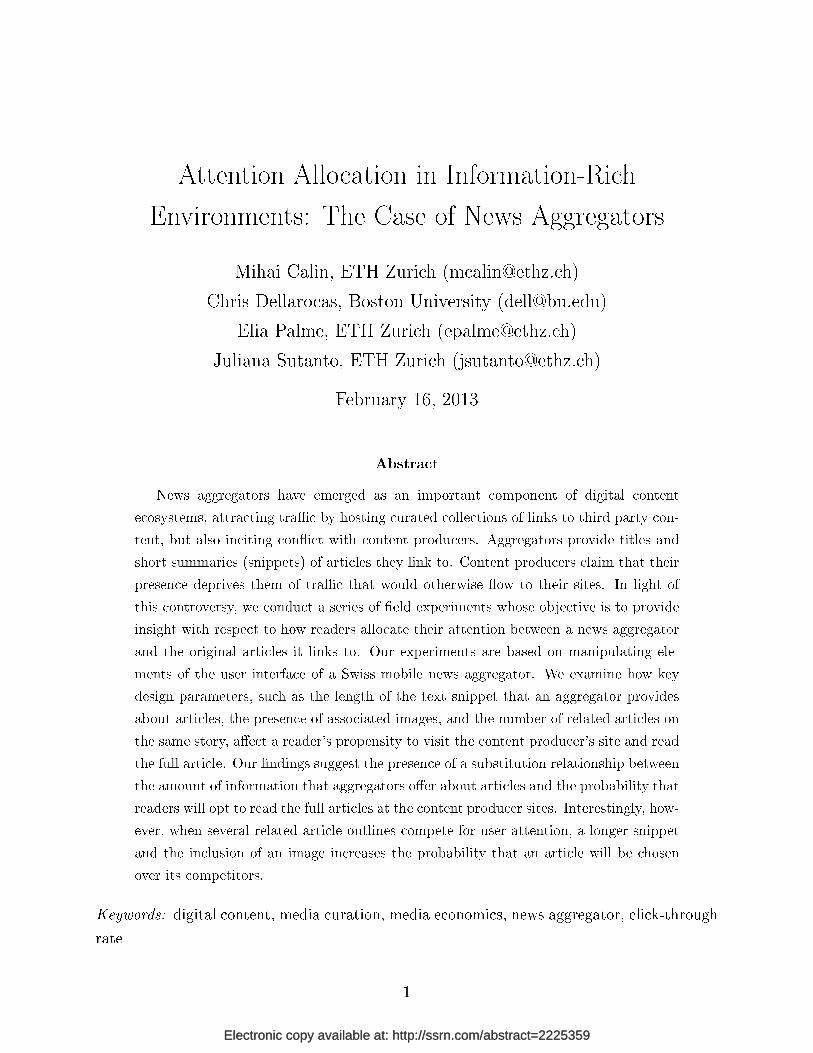
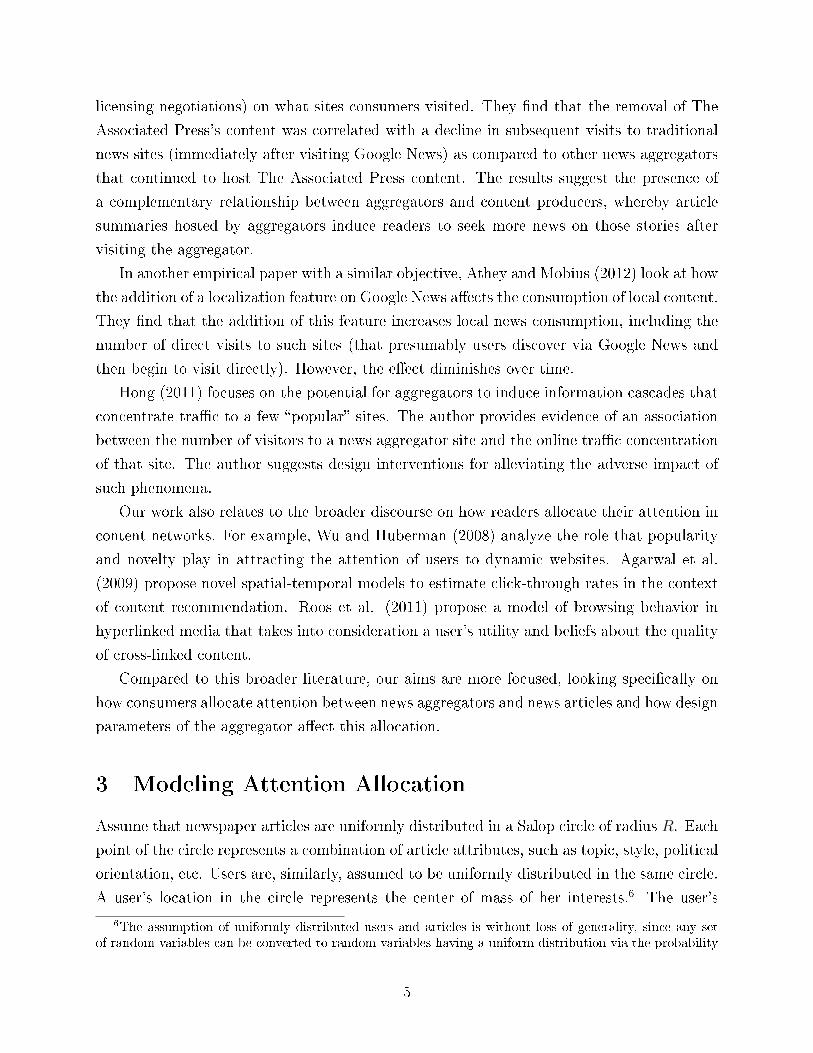
Figure 1: Example of a news aggregator article entry
1 Introduction
The overwhelming amount of news content available online has increased the importance of
curation and aggregation, that is, of interfaces and services that help readers �lter and make
sense of the subset of content that is important to them. Historically such functions used
to be the realm of professional editors. Editors not only commissioned the production of
content but also decided what content would be included in a newspaper and how it would
be organized.
Web technologies allow this important function to be unbundled from content production.
Speci�cally, the web's ability to place hyperlinks across content has enabled new types of
players, commonly referred to as content aggregators, to successfully enter professional con-
tent ecosystems, attracting tra�c and revenue by hosting collections of links to the content
of others (Dellarocas et al. 2013; Dewan et al. 2004). Content aggregators produce little
or no original content; they usually provide titles and excerpts (hereafter called snippets)
of the articles they link to (Figure 1). Examples of well known aggregators include Google
News, the Drudge Report, and the Hu�ngton Post. Google News (news.google.com) is a
search engine of many of the world's news sources; it algorithmically aggregates headlines
and groups similar articles together. The Drudge Report (www.drudgereport.com) aggre-
gates selected hyperlinks to news websites all over the world; each link carries a headline
written by the site's editors. The Hu�ngton Post (www.hu�ngtonpost.com) is a hybrid of
news aggregator and original content creator.
Facing severe �nancial pressures, some content creators have turned against content ag-
gregators, accusing them of stealing their revenues by free riding on their content.1 Media
tycoon Rupert Murdoch has been particularly outspoken on this issue, referring to aggre-
gators as �parasites� and selectively blocking some from indexing the content of media sites
he owns.2 In late 2012 some countries were considering imposing a tax on news aggregators
1The 2009 dispute between the Associated Press and News Corporation with Google is a representativeexample. See http://www.forbes.com/2009/04/06/google-ap-newspapers-business-media-copyright.html
2http://www.mediaite.com/online/rupert-murdoch-begins-blocking-new-aggregators-search-engines/
2
and distributing the revenue to content producers.3 Other market actors point out that, in
today's link economy, links bring valuable additional tra�c to their target nodes. There-
fore content creators should be happy that aggregators exist and direct consumers to their
sites (Jarvis 2008; Karp 2007). Key aggregator executives, such as Google's Eric Schmidt,
assert that it is to their interest to see content creators thrive, since the value of links (and
aggregators) is directly related to the quality of content that these point to.4
A central aspect of the debate focuses on the complex economic implications of the process
of placing (for the most part) free hyperlinks across content nodes. The main argument in
favor of aggregators is that, if links are chosen well, then they point to good quality content;
as a result, they reduce the search costs of the consumers, which may lead to more tra�c
for higher quality sites. The main argument against aggregators is that some consumers
satisfy their curiosity by reading an aggregator's short snippet of a linked-to article and
never click through to the article itself. In fact, the question of whether aggregators are
legally permitted to reproduce an article's title and snippet without obtaining permission
from (and possibly paying) the content producer, is still unresolved.5
The question of whether the current generation of news aggregators is bene�cial or harm-
ful to content ecosystems remains open (Athey and Mobius 2012; Chiou and Tucker 2011).
Nevertheless, we believe that the ever-increasing volume of available content makes some
form of aggregation an inevitable, and valuable, component of every content ecosystem. The
key question, therefore, is not whether aggregators should exist, but rather how the, partly
symbiotic and partly competitive, relationship between aggregators and content creators,
can be optimized for the bene�t of both parties.
To provide insights to these questions, we examine the distribution of readers' attention
between a news aggregator and the original articles it links to. The focus of our interest is
a user's decision to follow the provided link towards the content producer's site and read
the full text of an aggregated article. Our objective is to understand how key aggregator
design parameters, such as the length of the text snippet that an aggregator provides about
an article, the presence of associated images, and the presence of other related articles on
the same topic, a�ect a reader's propensity to click on an article. We o�er both theoretical
modeling of these relationships, as well as a set of �eld experiments with smartphone and
tablet versions of a Swiss news aggregator application.
3The Economist magazine, Newspapers versus Google: Taxing times, November 10, 2012.4�CEO Eric Schmidt wishes he could rescue newspapers�, Fortune January 7, 2009.5Aggregators claim that the reproduction of titles and short snippets of text falls under the �fair use�
provisions of copyright law. However, as stated by Isbell (2010), �for all of the attention that news aggregatorshave received, no case in the United States has yet de�nitively addressed the question of whether theiractivities are legal.�
3
We �nd evidence for the presence of a substitution relationship between the amount of
information that aggregators display about an article and the probability that readers will
opt to read its full text at the content producer sites. Our results suggest that an article's
headline provides all the information users need to decide if an article is close enough to their
interests. Any additional information provided by aggregators, in the form of text snippets
or images, apparently satiates the appetite of some readers and can only serve to decrease
click-through rates. Interestingly, however, when several related articles compete for user
attention, a longer snippet and the inclusion of an image increases the probability that an
article will be chosen over its competitors.
Besides contributing to research, the �ndings of this study are valuable for aggregators
seeking to optimize their tra�c patterns, as well as in terms of informing the public discourse
between aggregators and content creators on the need for equitable business agreements
between the two parties.
2 Related Work
The relationship between news aggregators and content producers is the subject of a small,
but growing, body of scholarly work. Dellarocas et al. (2013) model how the ability to
place costless hyperlinks to third party content a�ects the behavior of competing content
producers, who can now choose between spending e�ort to write an original article on a
story and simply linking to an article that someone else has written. They view aggrega-
tors as a limiting case of content nodes who are ine�cient in original content production
and, therefore, can only attract readers by placing links to interesting third-party content.
The paper shows that the impact of an aggregator on the content ecosystems is the sum
of two opposite e�ects. On one hand, a search cost reduction e�ect arises from the fact
that aggregators generally place links to well-chosen content and provide some information
(snippet) about this content that helps users decide whether it matches their interests. This
e�ect is positive; it increases the overall consumption of content in the entire ecosystem and
primarily bene�ts high quality content producers. On the other hand, a free riding e�ect is
due to readers who browse aggregator headlines and snippets, and never click through to the
original articles. The free riding e�ect is at the core of the controversy between aggregators
and original content producers. It reduces the content producers' pro�ts and incentives to
produce quality content.
Chiou and Tucker (2011) o�er an empirical contribution to the discourse about the net
impact of aggregators. They empirically examine the e�ect of the removal of all hosted
articles by The Associated Press from Google News at the end of 2009 (due to a dispute in
4
licensing negotiations) on what sites consumers visited. They �nd that the removal of The
Associated Press's content was correlated with a decline in subsequent visits to traditional
news sites (immediately after visiting Google News) as compared to other news aggregators
that continued to host The Associated Press content. The results suggest the presence of
a complementary relationship between aggregators and content producers, whereby article
summaries hosted by aggregators induce readers to seek more news on those stories after
visiting the aggregator.
In another empirical paper with a similar objective, Athey and Mobius (2012) look at how
the addition of a localization feature on Google News a�ects the consumption of local content.
They �nd that the addition of this feature increases local news consumption, including the
number of direct visits to such sites (that presumably users discover via Google News and
then begin to visit directly). However, the e�ect diminishes over time.
Hong (2011) focuses on the potential for aggregators to induce information cascades that
concentrate tra�c to a few �popular� sites. The author provides evidence of an association
between the number of visitors to a news aggregator site and the online tra�c concentration
of that site. The author suggests design interventions for alleviating the adverse impact of
such phenomena.
Our work also relates to the broader discourse on how readers allocate their attention in
content networks. For example, Wu and Huberman (2008) analyze the role that popularity
and novelty play in attracting the attention of users to dynamic websites. Agarwal et al.
(2009) propose novel spatial-temporal models to estimate click-through rates in the context
of content recommendation. Roos et al. (2011) propose a model of browsing behavior in
hyperlinked media that takes into consideration a user's utility and beliefs about the quality
of cross-linked content.
Compared to this broader literature, our aims are more focused, looking speci�cally on
how consumers allocate attention between news aggregators and news articles and how design
parameters of the aggregator a�ect this allocation.
3 Modeling Attention Allocation
Assume that newspaper articles are uniformly distributed in a Salop circle of radius R. Each
point of the circle represents a combination of article attributes, such as topic, style, political
orientation, etc. Users are, similarly, assumed to be uniformly distributed in the same circle.
A user's location in the circle represents the center of mass of her interests.6 The user's
6The assumption of uniformly distributed users and articles is without loss of generality, since any setof random variables can be converted to random variables having a uniform distribution via the probability
5
utility from reading an entire article is u = U − d, where d represents the distance between
the user's and the article's locations and U is the ex-ante expected utility that a user can
receive from reading an article that exactly matches her interests. This utility includes the
variable cost of reading the article. To limit the complexity of the subsequent analysis, we
assume that all articles o�er the same ex-ante expected maximum utility U and focus our
attention on a user's uncertainty regarding an article's �t with her interests.
Clicking on a news aggregator link incurs a �xed cost c < U . This cost is associated with
waiting for the new page to load and reorienting oneself to a di�erent screen layout.
Because of symmetry, we can simplify the analysis by considering the perspective of a
single user. In that case, we can collapse the circle into a line segment [−D,D], D = πR.
We assume that our user is located at 0 and that articles are located on either side of the
user.7
If aggregators o�er no information about an article, our user expects d to be equal to the
average distance d0 between her and a randomly chosen article. She, thus, expects utility
U − d0 from clicking on the aggregator link and will do so if and only if U − d0 > c.
3.1 Impact of snippet length on click-through rates
The presence of snippets (headlines plus article text excerpts) on news aggregators has
two e�ects on the expected utility from reading an article. First, snippets provide some
information about an article's true location. Second, snippets give away some of the content
contained in the full article. We will consider each e�ect individually and will then examine
their combined impact on click-through probabilities.
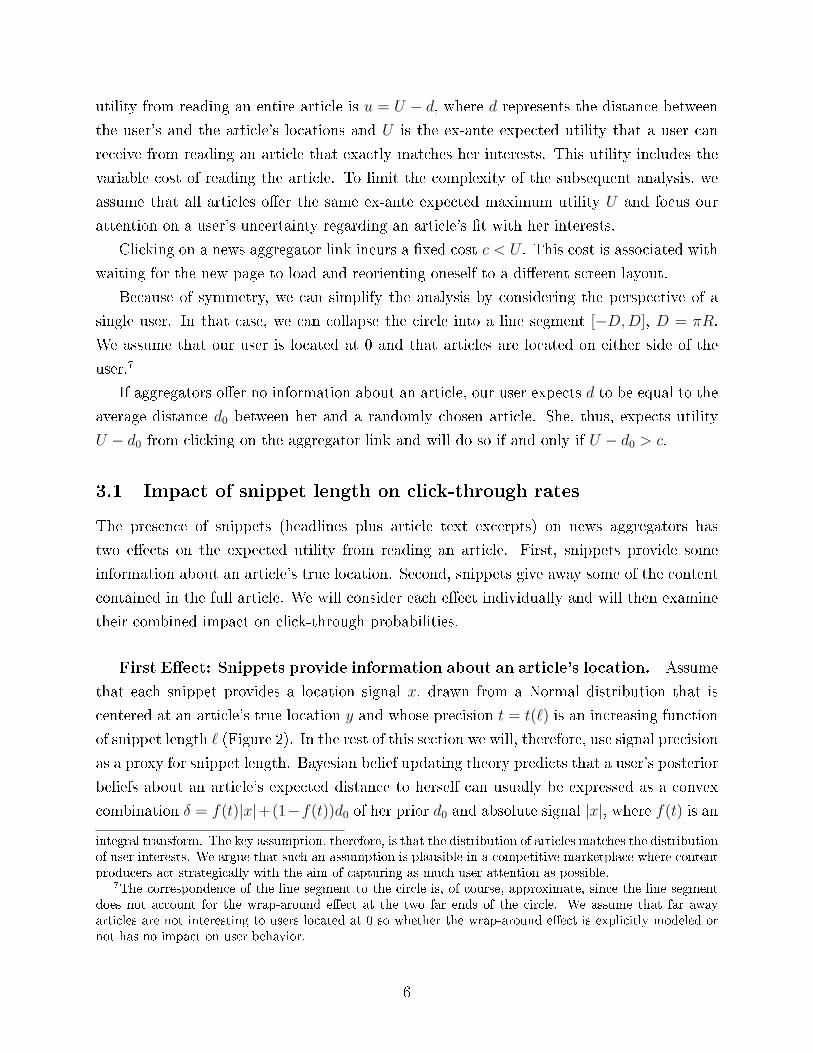
First E�ect: Snippets provide information about an article's location. Assume
that each snippet provides a location signal x, drawn from a Normal distribution that is
centered at an article's true location y and whose precision t = t(`) is an increasing function
of snippet length ` (Figure 2). In the rest of this section we will, therefore, use signal precision
as a proxy for snippet length. Bayesian belief updating theory predicts that a user's posterior
beliefs about an article's expected distance to herself can usually be expressed as a convex
combination δ = f(t)|x|+(1−f(t))d0 of her prior d0 and absolute signal |x|, where f(t) is an
integral transform. The key assumption, therefore, is that the distribution of articles matches the distributionof user interests. We argue that such an assumption is plausible in a competitive marketplace where contentproducers act strategically with the aim of capturing as much user attention as possible.
7The correspondence of the line segment to the circle is, of course, approximate, since the line segmentdoes not account for the wrap-around e�ect at the two far ends of the circle. We assume that far awayarticles are not interesting to users located at 0 so whether the wrap-around e�ect is explicitly modeled ornot has no impact on user behavior.
6
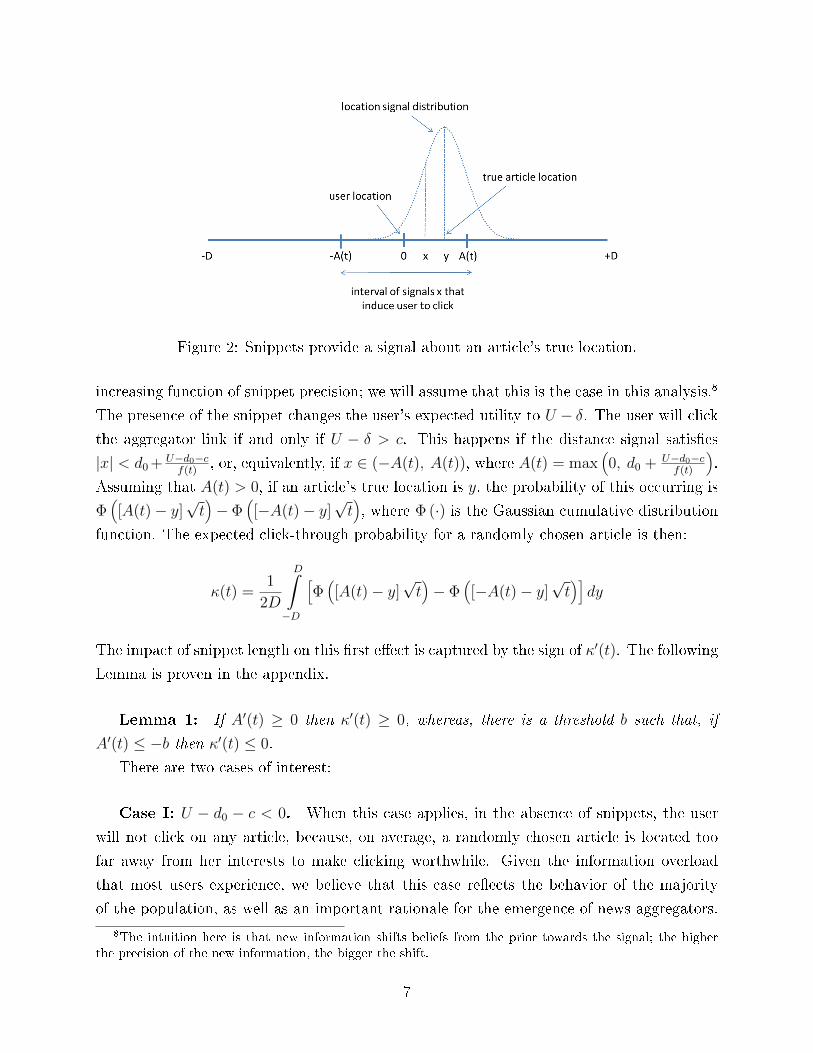
Figure 2: Snippets provide a signal about an article's true location.
increasing function of snippet precision; we will assume that this is the case in this analysis.8
The presence of the snippet changes the user's expected utility to U − δ. The user will clickthe aggregator link if and only if U − δ > c. This happens if the distance signal satis�es
|x| < d0+ U−d0−cf(t)
, or, equivalently, if x ∈ (−A(t), A(t)), where A(t) = max(0, d0 + U−d0−c
f(t)
).
Assuming that A(t) > 0, if an article's true location is y, the probability of this occurring is
Φ([A(t)− y]
√t)−Φ
([−A(t)− y]
√t), where Φ (·) is the Gaussian cumulative distribution
function. The expected click-through probability for a randomly chosen article is then:
κ(t) =1
2D
D̂
−D
[Φ([A(t)− y]
√t)− Φ
([−A(t)− y]
√t)]dy
The impact of snippet length on this �rst e�ect is captured by the sign of κ′(t). The following
Lemma is proven in the appendix.
Lemma 1: If A′(t) ≥ 0 then κ′(t) ≥ 0, whereas, there is a threshold b such that, if
A′(t) ≤ −b then κ′(t) ≤ 0.
There are two cases of interest:
Case I: U − d0 − c < 0. When this case applies, in the absence of snippets, the user
will not click on any article, because, on average, a randomly chosen article is located too
far away from her interests to make clicking worthwhile. Given the information overload
that most users experience, we believe that this case re�ects the behavior of the majority
of the population, as well as an important rationale for the emergence of news aggregators.
8The intuition here is that new information shifts beliefs from the prior towards the signal; the higherthe precision of the new information, the bigger the shift.
7
It is then A(t) = max(0, d0 − |U−d0−c|f(t)
)and the presence of a snippet of precision t, where
f(t) > |U−d0−c|d0
, is required in order for any user to click on the article. For snippets longer
than this threshold, it is A′(t) = |U−d0−c|(f(t))2
f ′(t) ≥ 0. Intuitively, as snippets provide more
precise information about the article, the interval (−A(t), A(t)) of signals that make the
user con�dent enough to click on the link, gets wider. By Lemma 1, this implies κ′(t) ≥ 0,
that is, as the snippet length increases, the click-through probability for a randomly chosen
article also increases.
Case II: U−d0−c > 0. When this case applies, in the absence of snippets, the user will
click on every article. We consider this case to be less common in practice, but include it for
completeness. In this case A(t) = d0 + |U−d0−c|f(t)
and A′(t) = − |U−d0−c|(f(t))2
f ′(t) ≤ 0. Additionally,
it is limt→0A′(t) = −∞. From Lemma 1 this implies that, at least when t is not very large, it
is κ′(t) ≤ 0. Intuitively, as snippets get more informative, there is an increasing probability
that the user, who, in the absence of any information is willing to give every article a try,
will realize that some articles are not interesting to her and will choose not to read them.
Second e�ect: Snippets give away part of an article's content. In most practical
cases, snippets are excerpts of actual full articles and give away part of the content that is
available in the full article. By doing so, they decrease a user's residual utility from reading
the full article. Assume that the utility of reading the �rst ` words of an article is given by
g(t(`))u, where u = U − d is the expected utility of reading the entire article, t(`) is the
corresponding information precision, and 0 ≤ g(t) ≤ 1, g(0) = 0, g′(t) > 0, limt→∞ g(t) = 1.
The residual utility of reading the full article, after having read the snippet, is (1 − g(t))u.
This second e�ect reduces the expected utility of clicking the aggregator link.
To combine the two e�ects, we set u = U − δ, where δ = f(t)|x| + (1 − f(t))d0. Users
will click if and only if (1− g(t))(U − δ) > c. Substituting and rearranging, we �nd that this
happens when |x| < d0 + 1f(t)
(U − d0 − c− g(t)
1−g(t)c)
= A(t). The following result holds:
Lemma 2: If U − d0 − c < 0 then there are thresholds 0 < t0 ≤ t1, such that A′(t) ≥ 0
for t ≤ t0 and A′(t) ≤ 0 for t ≥ t1. If U − d0 − c > 0 then it is A′(t) ≤ 0 for all t.
In all our hypotheses we will assume that the majority of the user population satis�es
U −d0− c < 0. Lemma 2, in conjunction with Lemma 1, lead to our �rst pair of hypotheses.
Hypothesis 1a: There exists a threshold snippet length `0 such that, as long as ` < `0,
news aggregator article click-through rates are increasing with snippet length `.
8
Hypothesis 1b: There exists a threshold snippet length `1 such that, as long as ` > `1,
news aggregator article click-through rates are decreasing with snippet length `.
3.2 Impact of the presence of multiple snippets on group click-
through rates
Popular stories typically have multiple newspaper articles written about them. News aggre-
gators collect such articles together and display their snippets next to each other. This is an
interesting aspect of aggregator behavior, whose implications have not yet received su�cient
attention. We denote group click-through rate the probability that a user will click at least
one article from among a group of related articles. Of particular interest is to explore how
the number of article snippets related to the same story a�ects group click-through rates.
We assume that users read all snippets and then decide whether the story is interesting
enough for them to click at least one article and �nd out more about it. Each story has a
location z and each article about that story has a location yi = z + ei, where ei is a zero
mean Normal error term re�ecting an individual article's political orientation, writing style,
etc. As before, snippets provide signals xi = yi + ηi about each article's location as well
as some information about the article/story itself; ηi represents another zero mean Normal
error term. Observe that it is xi = z+ei+ηi, that is, snippets simultaneously provide signals
about the story's location. The display of multiple snippets modi�es the analysis of Section
3.1 in the following ways:
1. In terms of belief updating, receiving multiple (independently drawn) signals about
the same quantity is approximately equivalent to receiving a single signal of higher
precision. Therefore, the impact of increasing the number of displayed snippets on a
user's posterior beliefs about the story's location, is mathematically (approximately)
equivalent to providing a signal of higher precision t.
2. Because of complementarities among the content of snippets, the presence of multiple
snippets is likely to give away more details of the story than what is contained in
any single snippet. Therefore, the residual utility from clicking and reading any single
article is likely to be lower, relative to settings where only one snippet is displayed.
In summary, the mathematics of Section 3.1 also apply to a setting with multiple snippets
if we simply assume that the precision t = t(`, n) is a function of both snippet length and
number of snippets, and that it is ∂∂`t(`, n) ≥ 0 and ∂
∂nt(`, n) ≥ 0. Therefore, the e�ect
of displaying more snippets is mathematically equivalent to the e�ect of displaying a single
9
longer snippet. This allows us to modify Hypotheses 1a/1b and generate the following
hypotheses:
Hypothesis 2a: When their total number n is below a threshold n0, the presence of
additional articles about the same story increases the group click-through rate.
Hypothesis 2b: When their total number n exceeds a threshold n1, the presence of
additional articles about the same story decreases the group click-through rate.
3.3 Impact of snippet length on an article's choice probability
For stories that have multiple articles competing for user attention, another important ques-
tion is what factors make users choose among the competing articles. It is well documented
here that position matters a lot. The higher the article is on the list, the higher the proba-
bility that it will be chosen (see, for example, Ghose and Yang 2009). What has not been
researched is the impact of an article's snippet length on the choice probability. To construct
hypotheses around this, we build on the analysis of the previous section as follows:
Assume that, after reading all available snippets, a user has decided that a story is worth
reading more about. If we ignore position e�ects, a rational user will click on the article
that o�ers the highest expected residual utility (1 − g(t1, .., tn))(U − δi), where g(t1, .., tn)
represents the utility gained from reading all the available snippets and δi denotes the user's
posterior beliefs about article i's expected distance to herself. Since the term (1−g(t1, .., tn))
is common to all choices, the user will simply choose the article that is associated with the
highest U − δi or, equivalently, the smallest δi. Recall that δi can be expressed as a convex
combination δi = f(ti)|xi|+ (1− f(ti))d0 of the prior d0 and absolute signal |xi|, where theweight f(ti) is an increasing function of snippet precision. For a given story, say, located at
z, the expected value E(|xi|) across all articles will be a constant (close to, but not equal
to, z). If we assume that U − d0 − c < 0, stories that induce the user to click must have
E(|xi|) < d0, that is, they must be located closer to her interests than the average story that
is available online. In such cases, E(δi) = f(ti)E(|xi|) + (1− f(ti))d0 is a declining function
of f(ti) and, therefore, of ti. This implies that, for stories that are indeed close to the user's
interests, articles with longer, more informative, snippets are, on average, more likely to be
perceived as being closest to the user's interests and, therefore, chosen. The above line of
reasoning leads to the following hypothesis:
Hypothesis 3: When several articles about the same story compete for user attention,
controlling for position, readers are, on average, more likely to click on articles whose snippet
10
Name Website Language Circulation* Free/Paid* Log frequency**
Blick blick.ch German 275,000 Paid 1,492 (5%)
Neue Zürcher Zeitung nzz.ch German 330,000 Paid 2,729 (10%)
20 Minuten 20min.ch German 329,000 Free 5,034 (18%)
Tages Anzeiger tagesanzeiger.ch German 216,000 Paid 3,400 (12%)
Basler Zeitung bazonline.ch German 165,000 Paid 1,546 (5%)
Berner Zeitung bernerzeitun.ch German 165,000 Paid 2,064 (7%)
24 Heures 24heures.ch French 86,000 Paid 1,266 (4%)
Le Matin lematin.ch French 69,000 Paid 802 (3%)
20 minutes 20min.ch/ro/ French 221,000 Free 1,208 (4%)
Tribune de Genève tdg.ch French 67,000 Paid 665 (2%)
TIO (Ticino Online) tio.ch Italian N/A Free 2,591 (9%)
Corriere del Ticino cdt.ch Italian 40,000 Paid 3,002 (10%)
Ticino News ticinonews.ch Italian N/A Free 2,807 (10%)
* Circulation and Free/Paid refer to print edition; N/A implies no print edition.** Instances and percentage of article access sessions in the iPhone data set.
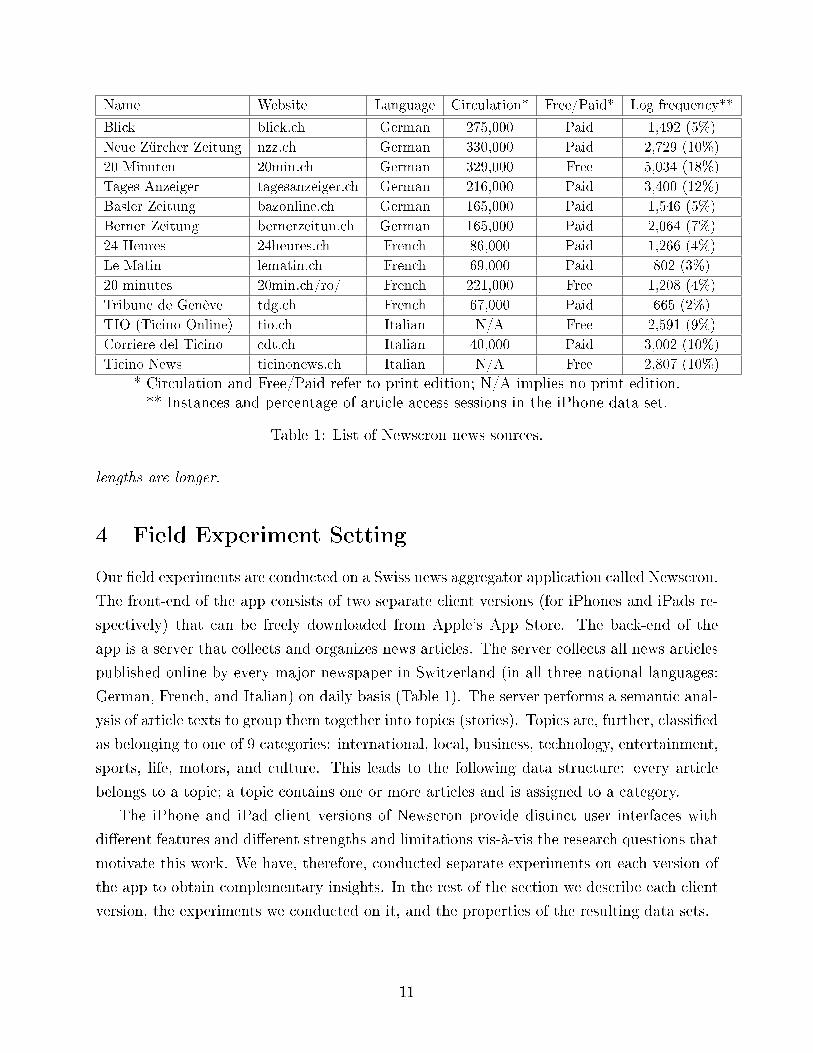
Table 1: List of Newscron news sources.
lengths are longer.
4 Field Experiment Setting
Our �eld experiments are conducted on a Swiss news aggregator application called Newscron.
The front-end of the app consists of two separate client versions (for iPhones and iPads re-
spectively) that can be freely downloaded from Apple's App Store. The back-end of the
app is a server that collects and organizes news articles. The server collects all news articles
published online by every major newspaper in Switzerland (in all three national languages:
German, French, and Italian) on daily basis (Table 1). The server performs a semantic anal-
ysis of article texts to group them together into topics (stories). Topics are, further, classi�ed
as belonging to one of 9 categories: international, local, business, technology, entertainment,
sports, life, motors, and culture. This leads to the following data structure: every article
belongs to a topic; a topic contains one or more articles and is assigned to a category.
The iPhone and iPad client versions of Newscron provide distinct user interfaces with
di�erent features and di�erent strengths and limitations vis-à-vis the research questions that
motivate this work. We have, therefore, conducted separate experiments on each version of
the app to obtain complementary insights. In the rest of the section we describe each client
version, the experiments we conducted on it, and the properties of the resulting data sets.
11
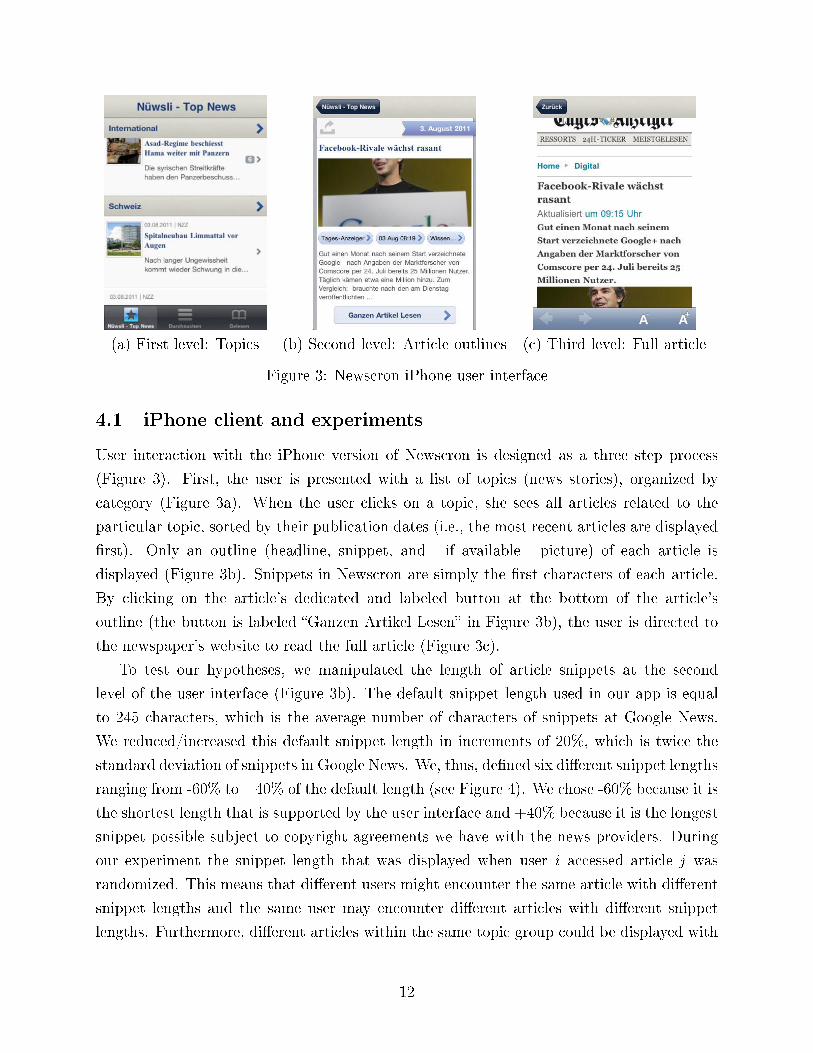
(a) First level: Topics (b) Second level: Article outlines (c) Third level: Full article
Figure 3: Newscron iPhone user interface
4.1 iPhone client and experiments
User interaction with the iPhone version of Newscron is designed as a three step process
(Figure 3). First, the user is presented with a list of topics (news stories), organized by
category (Figure 3a). When the user clicks on a topic, she sees all articles related to the
particular topic, sorted by their publication dates (i.e., the most recent articles are displayed
�rst). Only an outline (headline, snippet, and - if available - picture) of each article is
displayed (Figure 3b). Snippets in Newscron are simply the �rst characters of each article.
By clicking on the article's dedicated and labeled button at the bottom of the article's
outline (the button is labeled �Ganzen Artikel Lesen� in Figure 3b), the user is directed to
the newspaper's website to read the full article (Figure 3c).
To test our hypotheses, we manipulated the length of article snippets at the second
level of the user interface (Figure 3b). The default snippet length used in our app is equal
to 245 characters, which is the average number of characters of snippets at Google News.
We reduced/increased this default snippet length in increments of 20%, which is twice the
standard deviation of snippets in Google News. We, thus, de�ned six di�erent snippet lengths
ranging from -60% to +40% of the default length (see Figure 4). We chose -60% because it is
the shortest length that is supported by the user interface and +40% because it is the longest
snippet possible subject to copyright agreements we have with the news providers. During
our experiment the snippet length that was displayed when user i accessed article j was
randomized. This means that di�erent users might encounter the same article with di�erent
snippet lengths and the same user may encounter di�erent articles with di�erent snippet
lengths. Furthermore, di�erent articles within the same topic group could be displayed with
12
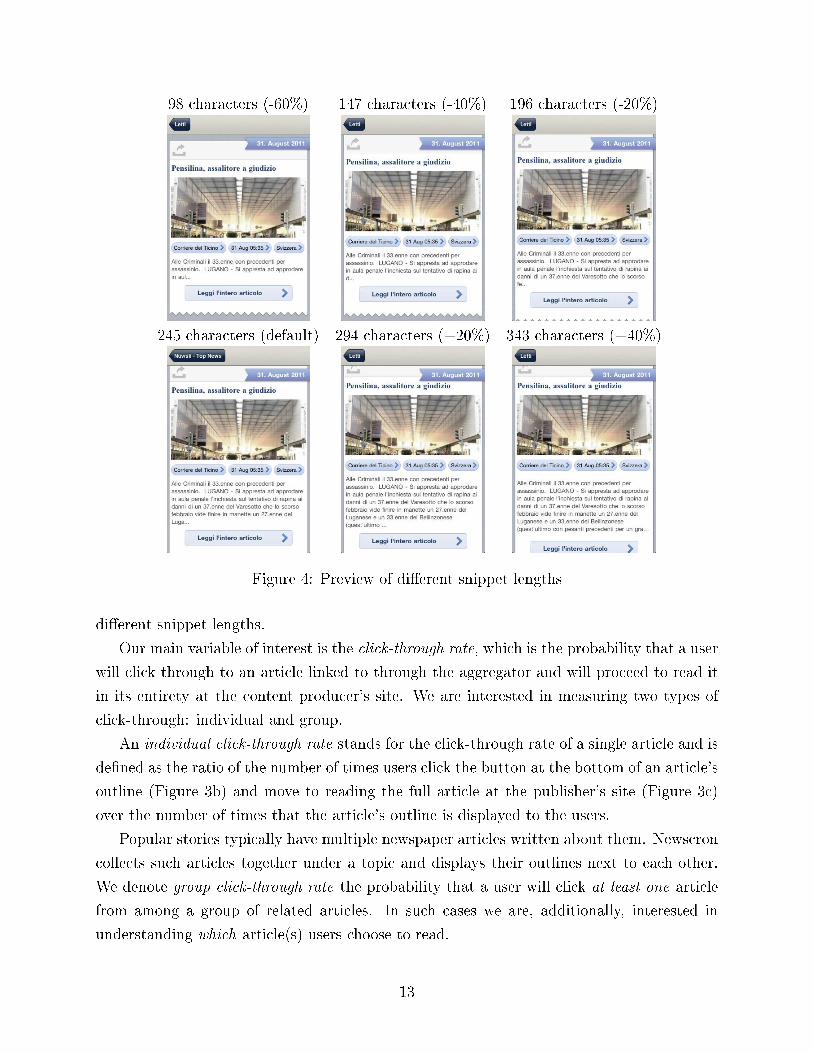
98 characters (-60%) 147 characters (-40%) 196 characters (-20%)
245 characters (default) 294 characters (+20%) 343 characters (+40%)
Figure 4: Preview of di�erent snippet lengths
di�erent snippet lengths.
Our main variable of interest is the click-through rate, which is the probability that a user
will click through to an article linked to through the aggregator and will proceed to read it
in its entirety at the content producer's site. We are interested in measuring two types of
click-through: individual and group.
An individual click-through rate stands for the click-through rate of a single article and is
de�ned as the ratio of the number of times users click the button at the bottom of an article's
outline (Figure 3b) and move to reading the full article at the publisher's site (Figure 3c)
over the number of times that the article's outline is displayed to the users.
Popular stories typically have multiple newspaper articles written about them. Newscron
collects such articles together under a topic and displays their outlines next to each other.
We denote group click-through rate the probability that a user will click at least one article
from among a group of related articles. In such cases we are, additionally, interested in
understanding which article(s) users choose to read.
13
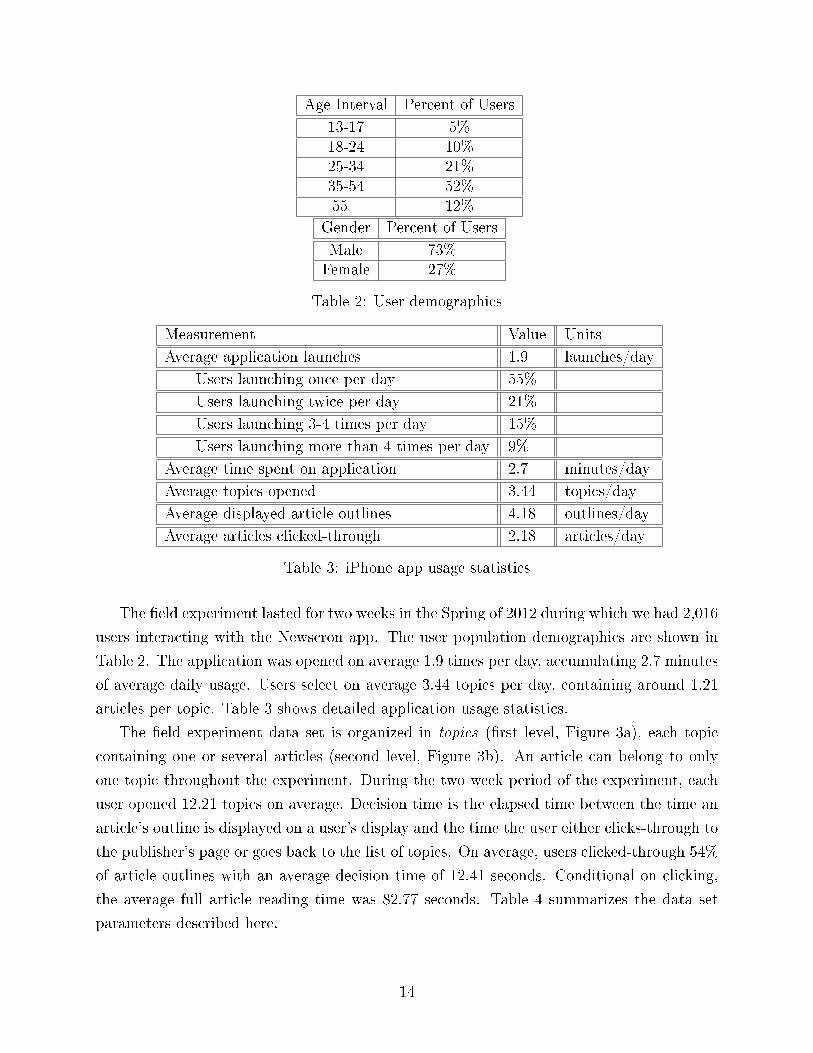
Age Interval Percent of Users
13-17 5%18-24 10%25-34 21%35-54 52%55+ 12%
Gender Percent of Users
Male 73%Female 27%
Table 2: User demographics
Measurement Value Units
Average application launches 1.9 launches/day
Users launching once per day 55%
Users launching twice per day 21%
Users launching 3-4 times per day 15%
Users launching more than 4 times per day 9%
Average time spent on application 2.7 minutes/day
Average topics opened 3.44 topics/day
Average displayed article outlines 4.18 outlines/day
Average articles clicked-through 2.18 articles/day
Table 3: iPhone app usage statistics
The �eld experiment lasted for two weeks in the Spring of 2012 during which we had 2,016
users interacting with the Newscron app. The user population demographics are shown in
Table 2. The application was opened on average 1.9 times per day, accumulating 2.7 minutes
of average daily usage. Users select on average 3.44 topics per day, containing around 1.21
articles per topic. Table 3 shows detailed application usage statistics.
The �eld experiment data set is organized in topics (�rst level, Figure 3a), each topic
containing one or several articles (second level, Figure 3b). An article can belong to only
one topic throughout the experiment. During the two week period of the experiment, each
user opened 12.21 topics on average. Decision time is the elapsed time between the time an
article's outline is displayed on a user's display and the time the user either clicks-through to
the publisher's page or goes back to the list of topics. On average, users clicked-through 54%
of article outlines with an average decision time of 12.41 seconds. Conditional on clicking,
the average full article reading time was 82.77 seconds. Table 4 summarizes the data set
parameters described here.
14
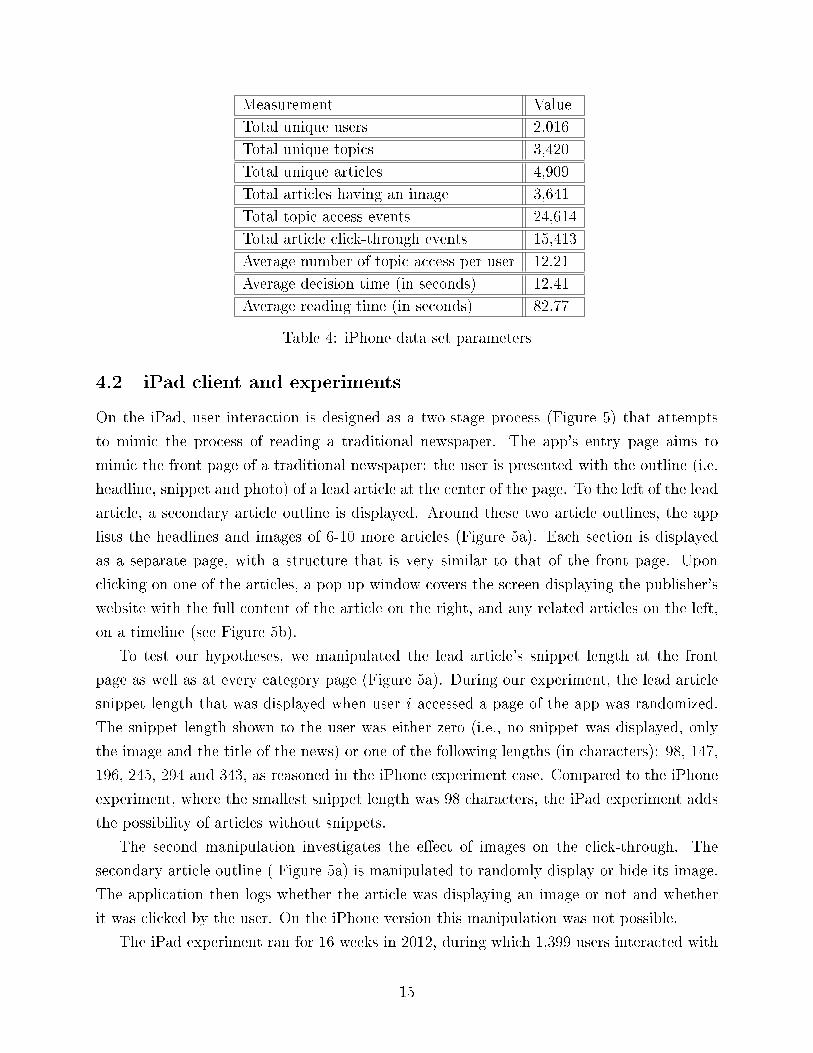
Measurement Value
Total unique users 2,016
Total unique topics 3,420
Total unique articles 4,909
Total articles having an image 3,641
Total topic access events 24,614
Total article click-through events 15,413
Average number of topic access per user 12.21
Average decision time (in seconds) 12.41
Average reading time (in seconds) 82.77
Table 4: iPhone data set parameters
4.2 iPad client and experiments
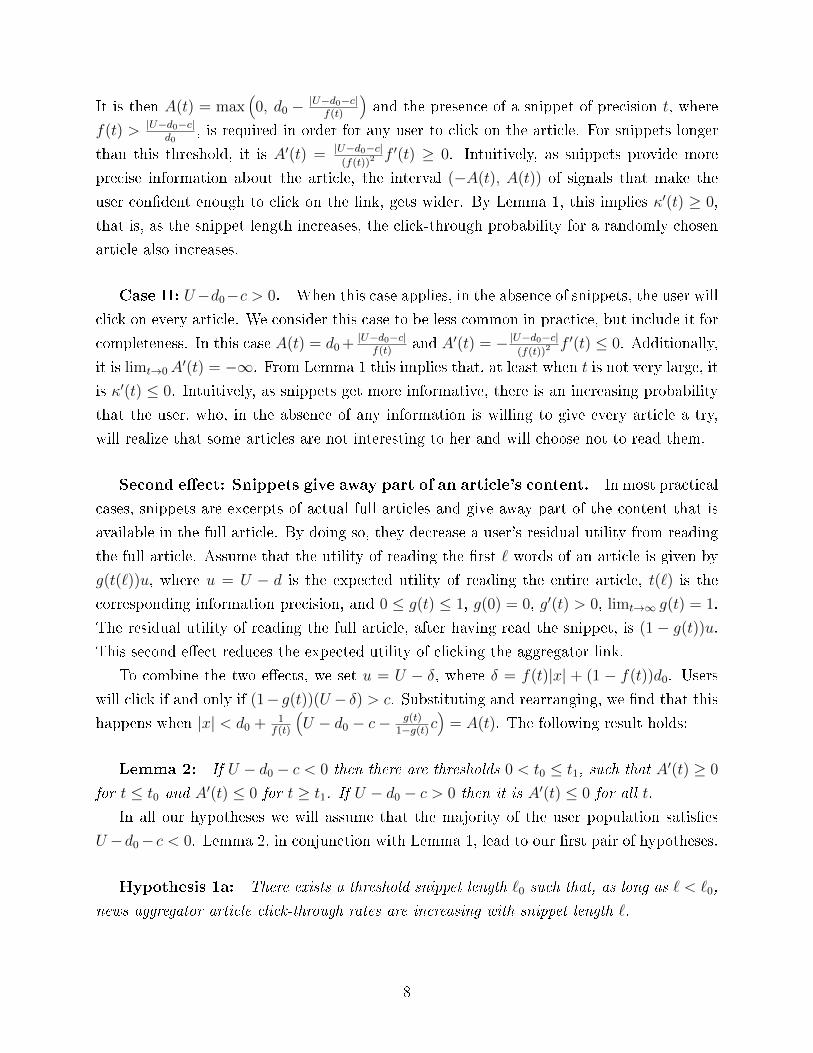
On the iPad, user interaction is designed as a two-stage process (Figure 5) that attempts
to mimic the process of reading a traditional newspaper. The app's entry page aims to
mimic the front page of a traditional newspaper: the user is presented with the outline (i.e.
headline, snippet and photo) of a lead article at the center of the page. To the left of the lead
article, a secondary article outline is displayed. Around these two article outlines, the app
lists the headlines and images of 6-10 more articles (Figure 5a). Each section is displayed
as a separate page, with a structure that is very similar to that of the front page. Upon
clicking on one of the articles, a pop up window covers the screen displaying the publisher's
website with the full content of the article on the right, and any related articles on the left,
on a timeline (see Figure 5b).
To test our hypotheses, we manipulated the lead article's snippet length at the front
page as well as at every category page (Figure 5a). During our experiment, the lead article
snippet length that was displayed when user i accessed a page of the app was randomized.
The snippet length shown to the user was either zero (i.e., no snippet was displayed, only
the image and the title of the news) or one of the following lengths (in characters): 98, 147,
196, 245, 294 and 343, as reasoned in the iPhone experiment case. Compared to the iPhone
experiment, where the smallest snippet length was 98 characters, the iPad experiment adds
the possibility of articles without snippets.
The second manipulation investigates the e�ect of images on the click-through. The
secondary article outline ( Figure 5a) is manipulated to randomly display or hide its image.
The application then logs whether the article was displaying an image or not and whether
it was clicked by the user. On the iPhone version this manipulation was not possible.
The iPad experiment ran for 16 weeks in 2012, during which 1,399 users interacted with
15

(a) First stage - Article outlines
(b) Second stage - Full article text and timeline of related articles
Figure 5: Newscron iPad user interface and manipulations
16
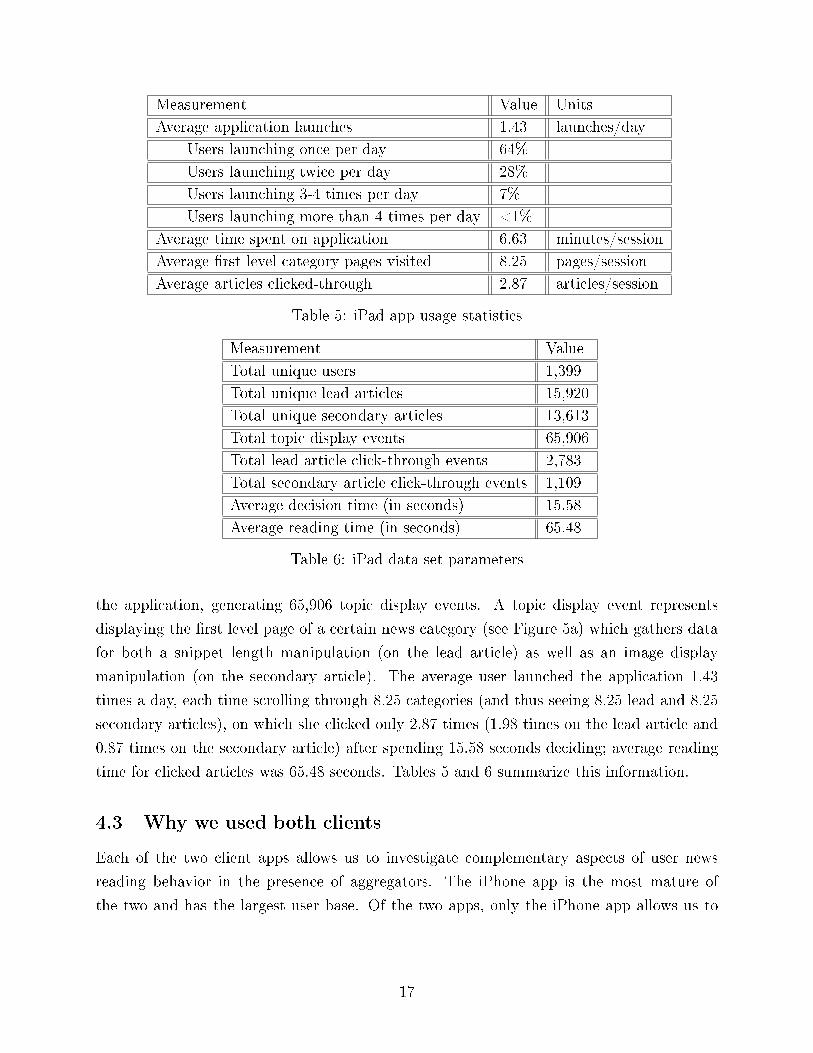
Measurement Value Units
Average application launches 1.43 launches/day
Users launching once per day 64%
Users launching twice per day 28%
Users launching 3-4 times per day 7%
Users launching more than 4 times per day <1%
Average time spent on application 6.63 minutes/session
Average �rst level category pages visited 8.25 pages/session
Average articles clicked-through 2.87 articles/session
Table 5: iPad app usage statistics
Measurement Value
Total unique users 1,399
Total unique lead articles 15,920
Total unique secondary articles 13,613
Total topic display events 65,906
Total lead article click-through events 2,783
Total secondary article click-through events 1,109
Average decision time (in seconds) 15.58
Average reading time (in seconds) 65.48
Table 6: iPad data set parameters
the application, generating 65,906 topic display events. A topic display event represents
displaying the �rst level page of a certain news category (see Figure 5a) which gathers data
for both a snippet length manipulation (on the lead article) as well as an image display
manipulation (on the secondary article). The average user launched the application 1.43
times a day, each time scrolling through 8.25 categories (and thus seeing 8.25 lead and 8.25
secondary articles), on which she clicked only 2.87 times (1.98 times on the lead article and
0.87 times on the secondary article) after spending 15.58 seconds deciding; average reading
time for clicked articles was 65.48 seconds. Tables 5 and 6 summarize this information.
4.3 Why we used both clients
Each of the two client apps allows us to investigate complementary aspects of user news
reading behavior in the presence of aggregators. The iPhone app is the most mature of
the two and has the largest user base. Of the two apps, only the iPhone app allows us to
17
investigate how aggregating snippets of related articles a�ects user choice.9 On the other
hand, technical limitations on the iPhone app's architecture do not allow us to reduce snippet
lengths below 98 characters or to manipulate the presence of images.
The iPad app allows us to reduce snippet length to zero and to manipulate the pres-
ence/absence of an image associated with an article headline. It also o�ers a richer interface
that is closer to that of a web browser, and can, therefore be used as a robustness check
to make sure that the e�ects observed on the iPhone app are not due to idiosyncrasies or
limitations of mobile interfaces.
Overall, performing similar experiments on two substantially di�erent user interfaces
and �nding similar results increases our con�dence that our �ndings represent fundamental
aspects of online news consumption behavior.
5 Results
5.1 Impact of snippet length on click-through rate
We used logistic regression to analyze how individual click-through rates on the iPhone
data set are a�ected by snippet length and by the presence of photos. To �lter out any
side e�ects from other articles on the same topic, we restricted this analysis to topics that
contain a single article. We used random e�ects to account for any systematic di�erences in
the click-through rates of individual users and articles.
The regression results are summarized in Table 7. Our key independent variables (snippet-
nnn) are dummy variables that are equal to 1 if the article outline that corresponds to an
access record was displayed using a snippet of nnn characters (nnn=98, 147, 196, 245, 294,
343). Has-image speci�es whether the article outline had an associated image. We include
control variables for article language, article category, topic age (time elapsed between the
publication of the earliest article on a topic and the timestamp of an access record) and time
of day when an article was accessed (morning=5-8am, lunch=11am-1pm, afterwork=3pm-
6pm, afterdinner=8pm-11pm).
Our key �nding is that click-through rates monotonically decrease with snippet length,
i.e. longer snippets are associated with lower click-through rates. The e�ect appears to be
concave: the di�erence of adjacent coe�cients of variables snippet-nnn shrinks as snippet
lengths increase. The presence of an accompanying image further reduces the click-through
9On the iPad app, when a user clicks on an story outline at the top level, even when there are multiplearticles associated with the story, the app automatically displays the full text of the topmost (most recent,at the time of access) article.
18

Estimate Std. Error z value Pr(>|z|)
(Intercept) 1.030208 0.061986 16.620 < 2e-16 ***
snippet-98 (baseline)
snippet-147 -0.249254 0.052386 -4.758 1.96e-06 ***
snippet-196 -0.444536 0.051574 -8.619 < 2e-16 ***
snippet-245 -0.578196 0.050783 -11.386 < 2e-16 ***
snippet-294 -0.726413 0.050767 -14.309 < 2e-16 ***
snippet-343 -0.744078 0.050221 -14.816 < 2e-16 ***
has-image -0.241077 0.037197 -6.481 9.11e-11 ***
category-international (baseline)
category-local 0.077055 0.040390 1.908 0.056421
category-business -0.059181 0.053064 -1.115 0.264730
category-technology 0.374787 0.055426 6.762 1.36e-11 ***
category-entertainment 0.370899 0.050919 7.284 3.24e-13 ***
category-sports 0.263547 0.063824 4.129 3.64e-05 ***
category-life 0.497000 0.073357 6.775 1.24e-11 ***
category-motors 0.028857 0.115271 0.250 0.802325
category-culture 0.262356 0.077894 3.368 0.000757 ***
language-german (baseline)
language-french -0.208344 0.043546 -4.785 1.71e-06 ***
language-italian -0.126199 0.033507 -3.766 0.000166 ***
time-other (baseline)
time-morning 0.131129 0.043539 3.012 0.002597 **
time-lunch 0.067304 0.046317 1.453 0.146189
time-afterwork -0.098537 0.046658 -2.112 0.034696 *
time-afterdinner 0.001074 0.044570 0.024 0.980774
topic-age -0.008143 0.003427 -2.376 0.017485 *
--- Significance codes: *** = 0.001, ** = 0.01, * = 0.05
Null deviance: 28529 on 21395 degrees of freedom
Residual deviance: 27973 on 21374 degrees of freedom
AIC: 28017
Table 7: iPhone individual click-through rate regression
rate by an amount that is roughly equivalent to increasing the snippet length by 50-100
characters.
The above results are consistent with Hypothesis 1b. Speci�cally, it appears that a snip-
pet length of 98 characters is already longer than the threshold snippet length `1 mentioned
in Hypothesis 1b. In that case, any additional information provided to users via longer snip-
pets, or through the inclusion of an image, only serves to satiate the appetite of some users
for the full story, resulting in lower population-level click-through rates.10
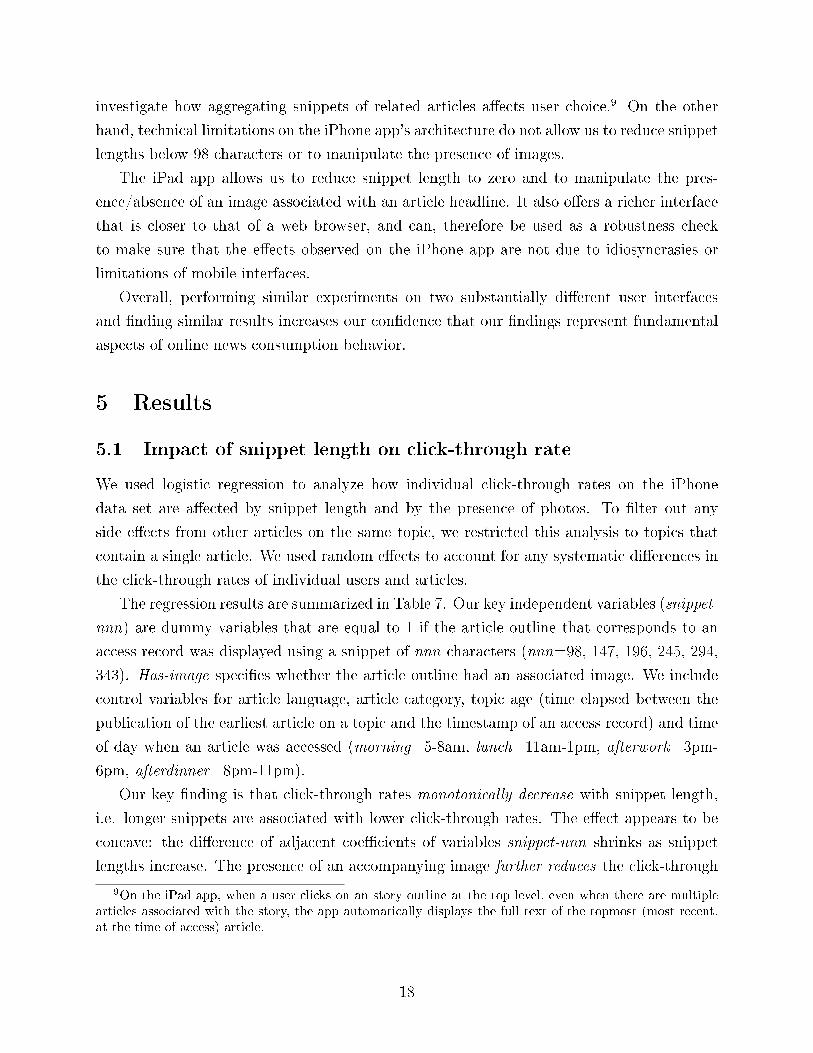
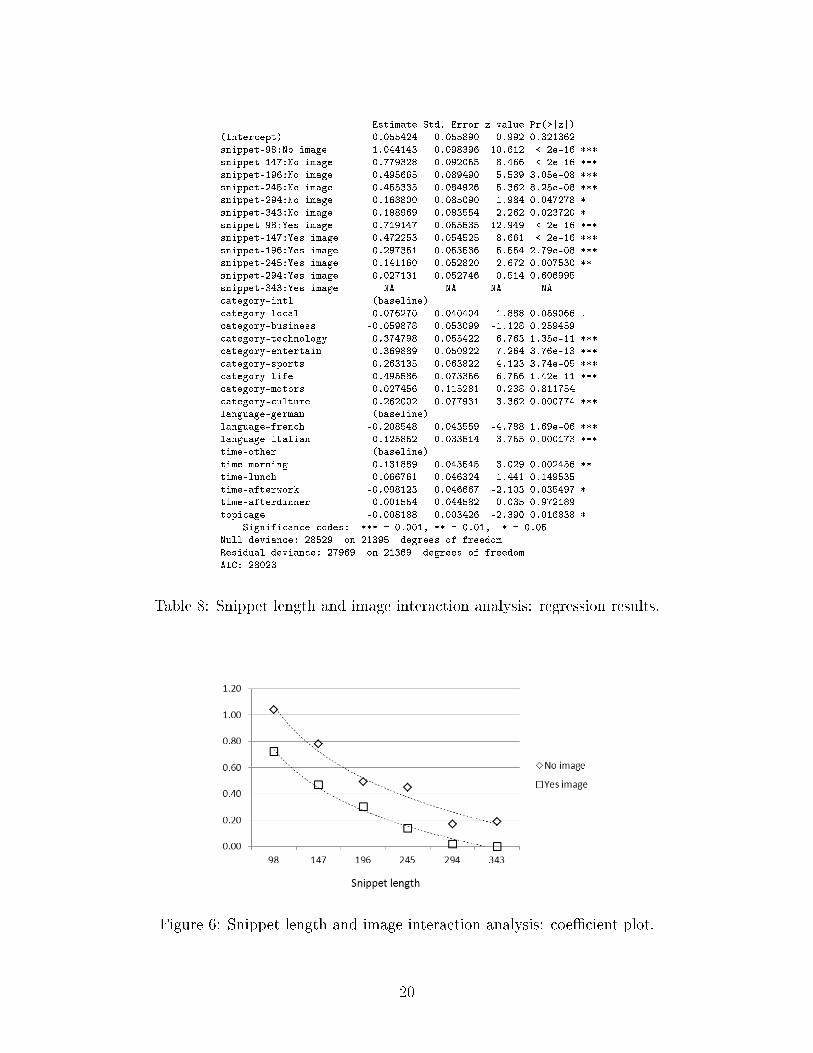
Examining the interaction between snippet length and inclusion of an image suggests
that these two e�ects are independent of each other (Table 8). Speci�cally, the curves of the
interaction term coe�cients for di�erent snippet lengths with and without images have very
similar shape (Figure 6). The coe�cients are uniformly higher when no image is displayed.
Repeating the above analysis on the iPad data set provides the bene�t of examining what
happens when snippet size goes down to zero. In addition, recall that the iPhone snippet
length manipulation takes place at the second level of the user interface (Figure 3b), when
users have already expressed an interest for the topic (by clicking through the top level,
10An examination of our control variables o�ers additional insights into online news reading behavior. Inthe Appendix we comment on these relationships and present some additional analyses.
19
Estimate Std. Error z value Pr(>|z|)
(Intercept) 0.055424 0.055890 0.992 0.321362
snippet-98:No image 1.044143 0.098396 10.612 < 2e-16 ***
snippet-147:No image 0.779328 0.092055 8.466 < 2e-16 ***
snippet-196:No image 0.495665 0.089490 5.539 3.05e-08 ***
snippet-245:No image 0.455335 0.084926 5.362 8.25e-08 ***
snippet-294:No image 0.168800 0.085090 1.984 0.047278 *
snippet-343:No image 0.188969 0.083554 2.262 0.023720 *
snippet-98:Yes image 0.719147 0.055535 12.949 < 2e-16 ***
snippet-147:Yes image 0.472253 0.054525 8.661 < 2e-16 ***
snippet-196:Yes image 0.297351 0.053536 5.554 2.79e-08 ***
snippet-245:Yes image 0.141160 0.052820 2.672 0.007530 **
snippet-294:Yes image 0.027131 0.052746 0.514 0.606995
snippet-343:Yes image NA NA NA NA
category-intl (baseline)
category-local 0.076270 0.040404 1.888 0.059066 .
category-business -0.059878 0.053099 -1.128 0.259459
category-technology 0.374798 0.055422 6.763 1.35e-11 ***
category-entertain 0.369889 0.050922 7.264 3.76e-13 ***
category-sports 0.263135 0.063822 4.123 3.74e-05 ***
category-life 0.495586 0.073356 6.756 1.42e-11 ***
category-motors 0.027456 0.115281 0.238 0.811754
category-culture 0.262002 0.077931 3.362 0.000774 ***
language-german (baseline)
language-french -0.208548 0.043559 -4.788 1.69e-06 ***
language-italian -0.125852 0.033514 -3.755 0.000173 ***
time-other (baseline)
time-morning 0.131889 0.043545 3.029 0.002456 **
time-lunch 0.066761 0.046324 1.441 0.149535
time-afterwork -0.098123 0.046667 -2.103 0.035497 *
time-afterdinner 0.001554 0.044582 0.035 0.972189
topicage -0.008188 0.003426 -2.390 0.016838 *
--- Significance codes: *** = 0.001, ** = 0.01, * = 0.05
Null deviance: 28529 on 21395 degrees of freedom
Residual deviance: 27969 on 21369 degrees of freedom
AIC: 28023
Table 8: Snippet length and image interaction analysis: regression results.
Figure 6: Snippet length and image interaction analysis: coe�cient plot.
20
Estimate Std. Error z value Pr(>|z|)
(Intercept) -3.4029375 0.0774879 -43.916 < 2e-16 ***
snippet-0 (baseline)
snippet-98 -0.0405066 0.0698282 -0.580 0.561854
snippet-147 -0.0716769 0.0700058 -1.024 0.305896
snippet-196 -0.1309776 0.0712253 -1.839 0.065927
snippet-245 -0.1713780 0.0725527 -2.362 0.018171 *
snippet-294 -0.2193421 0.0729460 -3.007 0.002639 **
snippet-343 -0.2551973 0.0732455 -3.484 0.000494 ***
category-intl (baseline)
category-local 0.7576408 0.0596889 12.693 < 2e-16 ***
category-business 0.3392168 0.0811333 4.181 2.90e-05 ***
category-technology 0.6164478 0.0722908 8.527 < 2e-16 ***
category-entertain 0.8242345 0.0705485 11.683 < 2e-16 ***
category-sports 0.4552858 0.0797088 5.712 1.12e-08 ***
category-life 0.6261332 0.0788313 7.943 1.98e-15 ***
category-motors 0.2027030 0.0985593 2.057 0.039719 *
category-culture -0.2057773 0.0986723 -2.085 0.037027 *
language-german (baseline)
language-french 0.0247296 0.0544382 0.454 0.649636
language-italian 0.1168826 0.0446224 2.619 0.008809 **
time-other (baseline)
time-morning 0.1598024 0.0591375 2.702 0.006888 **
time-lunch -0.0004208 0.0663752 -0.006 0.994942
time-afterwork -0.2309352 0.0659358 -3.502 0.000461 ***
time-afterdinner -0.1219484 0.0595255 -2.049 0.040494 *
--- Significance codes: *** = 0.001, ** = 0.01, * = 0.05
Null deviance: 22959 on 65509 degrees of freedom
Residual deviance: 22600 on 65489 degrees of freedom
AIC: 22642
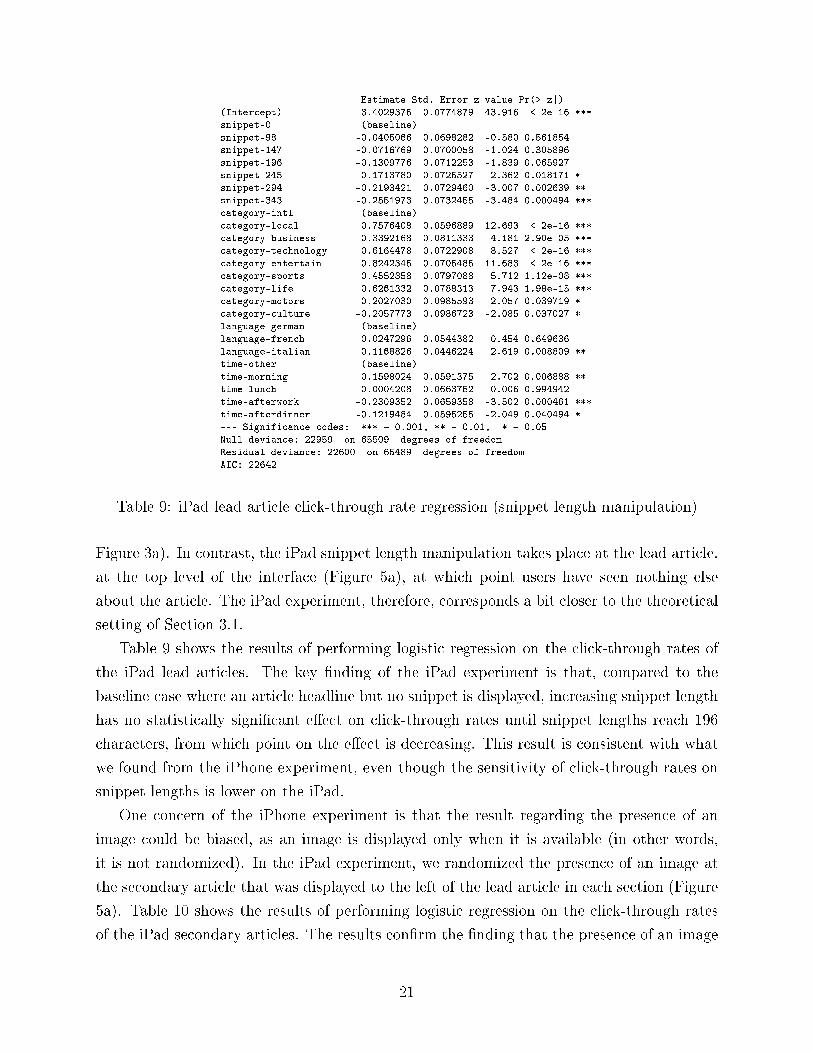
Table 9: iPad lead article click-through rate regression (snippet length manipulation)
Figure 3a). In contrast, the iPad snippet length manipulation takes place at the lead article.
at the top level of the interface (Figure 5a), at which point users have seen nothing else
about the article. The iPad experiment, therefore, corresponds a bit closer to the theoretical
setting of Section 3.1.
Table 9 shows the results of performing logistic regression on the click-through rates of
the iPad lead articles. The key �nding of the iPad experiment is that, compared to the
baseline case where an article headline but no snippet is displayed, increasing snippet length
has no statistically signi�cant e�ect on click-through rates until snippet lengths reach 196
characters, from which point on the e�ect is decreasing. This result is consistent with what
we found from the iPhone experiment, even though the sensitivity of click-through rates on
snippet lengths is lower on the iPad.
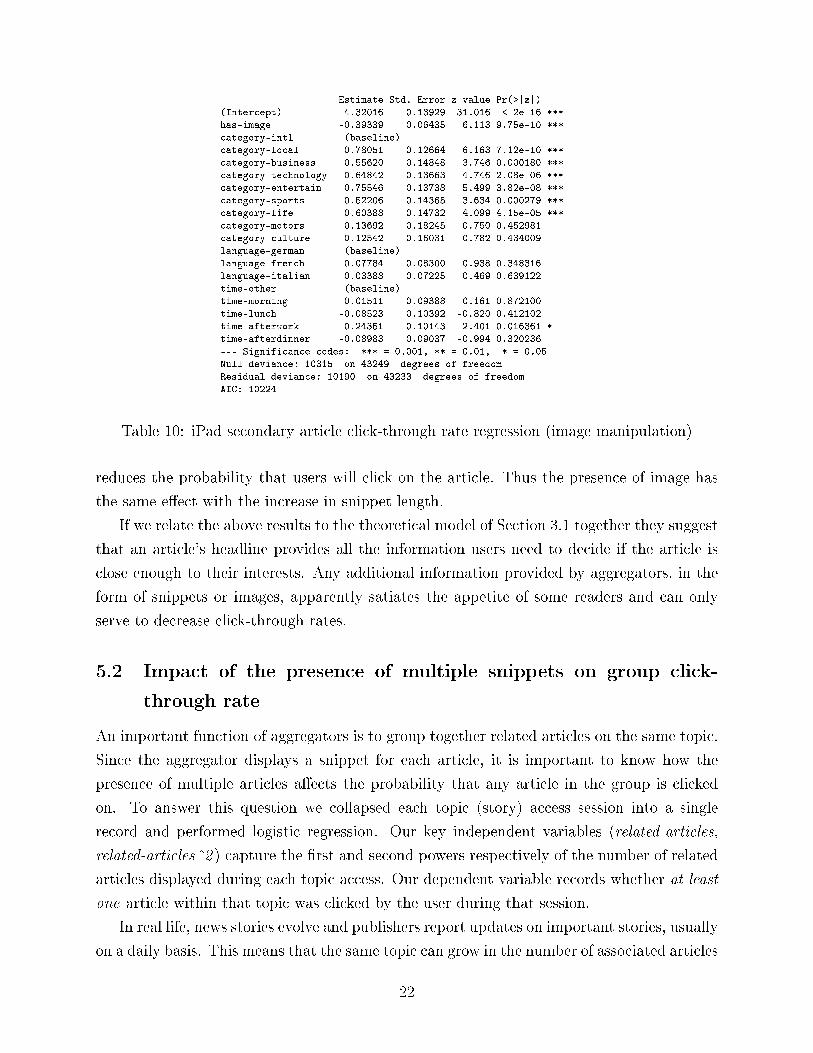
One concern of the iPhone experiment is that the result regarding the presence of an
image could be biased, as an image is displayed only when it is available (in other words,
it is not randomized). In the iPad experiment, we randomized the presence of an image at
the secondary article that was displayed to the left of the lead article in each section (Figure
5a). Table 10 shows the results of performing logistic regression on the click-through rates
of the iPad secondary articles. The results con�rm the �nding that the presence of an image
21
Estimate Std. Error z value Pr(>|z|)
(Intercept) -4.32016 0.13929 -31.016 < 2e-16 ***
has-image -0.39339 0.06435 6.113 9.75e-10 ***
category-intl (baseline)
category-local 0.78051 0.12664 6.163 7.12e-10 ***
category-business 0.55620 0.14848 3.746 0.000180 ***
category-technology 0.64842 0.13663 4.746 2.08e-06 ***
category-entertain 0.75546 0.13738 5.499 3.82e-08 ***
category-sports 0.52206 0.14365 3.634 0.000279 ***
category-life 0.60388 0.14732 4.099 4.15e-05 ***
category-motors 0.13692 0.18245 0.750 0.452981
category-culture 0.12542 0.16031 0.782 0.434009
language-german (baseline)
language-french -0.07784 0.08300 -0.938 0.348316
language-italian 0.03388 0.07225 0.469 0.639122
time-other (baseline)
time-morning 0.01511 0.09388 0.161 0.872100
time-lunch -0.08523 0.10392 -0.820 0.412102
time-afterwork -0.24351 0.10143 -2.401 0.016361 *
time-afterdinner -0.08983 0.09037 -0.994 0.320236
--- Significance codes: *** = 0.001, ** = 0.01, * = 0.05
Null deviance: 10315 on 43249 degrees of freedom
Residual deviance: 10190 on 43233 degrees of freedom
AIC: 10224
Table 10: iPad secondary article click-through rate regression (image manipulation)
reduces the probability that users will click on the article. Thus the presence of image has
the same e�ect with the increase in snippet length.
If we relate the above results to the theoretical model of Section 3.1 together they suggest
that an article's headline provides all the information users need to decide if the article is
close enough to their interests. Any additional information provided by aggregators, in the
form of snippets or images, apparently satiates the appetite of some readers and can only
serve to decrease click-through rates.
5.2 Impact of the presence of multiple snippets on group click-
through rate
An important function of aggregators is to group together related articles on the same topic.
Since the aggregator displays a snippet for each article, it is important to know how the
presence of multiple articles a�ects the probability that any article in the group is clicked
on. To answer this question we collapsed each topic (story) access session into a single
record and performed logistic regression. Our key independent variables (related-articles,
related-articles^2 ) capture the �rst and second powers respectively of the number of related
articles displayed during each topic access. Our dependent variable records whether at least
one article within that topic was clicked by the user during that session.
In real life, news stories evolve and publishers report updates on important stories, usually
on a daily basis. This means that the same topic can grow in the number of associated articles
22
Estimate Std. Error z value Pr(>|z|)
(Intercept) -0.562992 0.093168 -6.043 1.52e-09 ***
related-articles 0.789094 0.058075 13.588 < 2e-16 ***
related-articles^2 -0.088047 0.008527 -10.326 < 2e-16 ***
topicage -0.054185 0.009658 -5.610 2.02e-08 ***
category-intl (baseline)
category-local 0.087998 0.058496 1.504 0.132494
category-business 0.045385 0.069022 0.658 0.510828
category-technology 0.366267 0.089880 4.075 4.60e-05 ***
category-entertain 0.417372 0.087755 4.756 1.97e-06 ***
category-sports 0.304854 0.082667 3.688 0.000226 ***
category-life 0.496969 0.188897 2.631 0.008516 **
category-culture 0.366240 0.144492 2.535 0.011255 *
time-other (baseline)
time-morning 0.193964 0.066802 2.904 0.003689 **
time-lunch 0.054098 0.069278 0.781 0.434877
time-afterwork -0.034349 0.069624 -0.493 0.621763
time-afterdinner -0.057925 0.066991 -0.865 0.387217
language-german (baseline)
language-french -0.204459 0.064962 -3.147 0.001647 **
language-italian -0.058165 0.052597 -1.106 0.268790
--- Significance codes: *** = 0.001, ** = 0.01, * = 0.05
Null deviance: 12758 on 9503 degrees of freedom
Residual deviance: 12427 on 9487 degrees of freedom
AIC: 12461
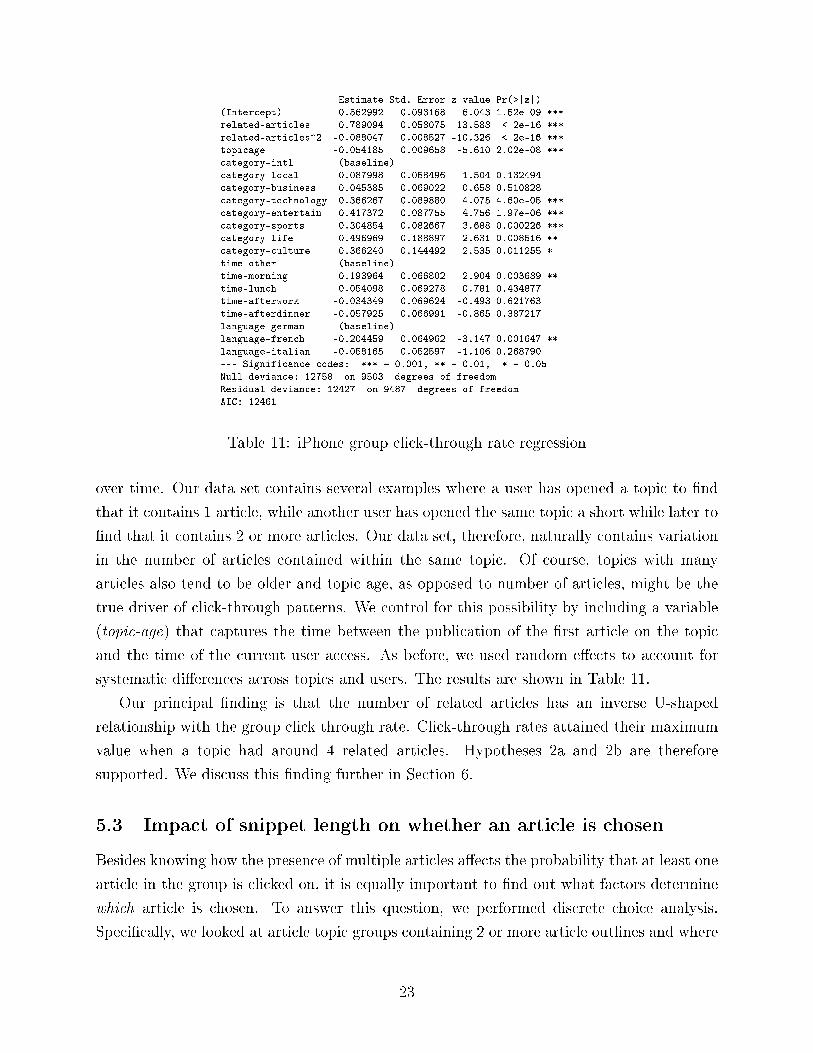
Table 11: iPhone group click-through rate regression
over time. Our data set contains several examples where a user has opened a topic to �nd
that it contains 1 article, while another user has opened the same topic a short while later to
�nd that it contains 2 or more articles. Our data set, therefore, naturally contains variation
in the number of articles contained within the same topic. Of course, topics with many
articles also tend to be older and topic age, as opposed to number of articles, might be the
true driver of click-through patterns. We control for this possibility by including a variable
(topic-age) that captures the time between the publication of the �rst article on the topic
and the time of the current user access. As before, we used random e�ects to account for
systematic di�erences across topics and users. The results are shown in Table 11.
Our principal �nding is that the number of related articles has an inverse U-shaped
relationship with the group click through rate. Click-through rates attained their maximum
value when a topic had around 4 related articles. Hypotheses 2a and 2b are therefore
supported. We discuss this �nding further in Section 6.
5.3 Impact of snippet length on whether an article is chosen
Besides knowing how the presence of multiple articles a�ects the probability that at least one
article in the group is clicked on, it is equally important to �nd out what factors determine
which article is chosen. To answer this question, we performed discrete choice analysis.
Speci�cally, we looked at article topic groups containing 2 or more article outlines and where
23
Estimate Std. Error t-value Pr(>|t|)
snippet-shorter (baseline)
snippet-average -0.18513 0.48055 -0.3852 0.70005
snippet-longer 0.26561 0.11250 2.3609 0.01823 *
position-top (baseline)
position-second -2.07819 0.11189 -18.5743 < 2.2e-16 ***
position-low -2.02229 0.17956 -11.2626 < 2.2e-16 ***
has-image 2.07634 0.25813 8.0437 8.882e-16 ***
--- Significance codes: *** = 0.001, ** = 0.01, * = 0.05
Log-Likelihood: -320.3
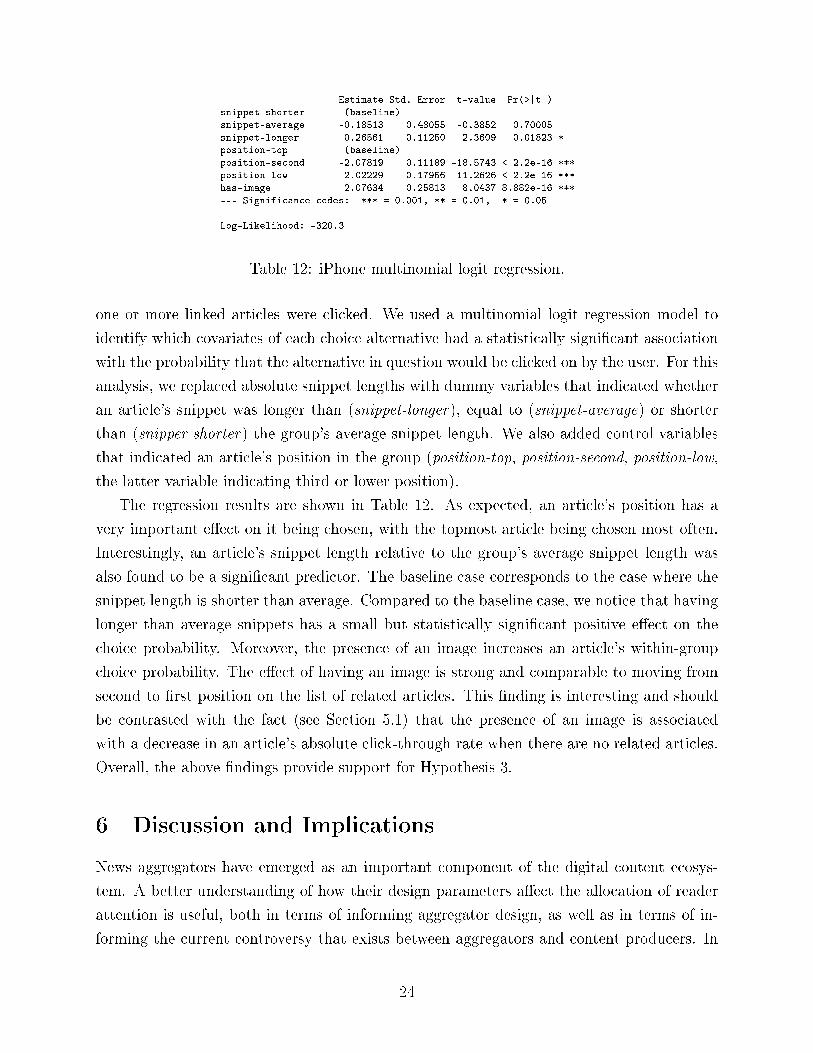
Table 12: iPhone multinomial logit regression.
one or more linked articles were clicked. We used a multinomial logit regression model to
identify which covariates of each choice alternative had a statistically signi�cant association
with the probability that the alternative in question would be clicked on by the user. For this
analysis, we replaced absolute snippet lengths with dummy variables that indicated whether
an article's snippet was longer than (snippet-longer), equal to (snippet-average) or shorter
than (snipper-shorter) the group's average snippet length. We also added control variables
that indicated an article's position in the group (position-top, position-second, position-low,
the latter variable indicating third or lower position).
The regression results are shown in Table 12. As expected, an article's position has a
very important e�ect on it being chosen, with the topmost article being chosen most often.
Interestingly, an article's snippet length relative to the group's average snippet length was
also found to be a signi�cant predictor. The baseline case corresponds to the case where the
snippet length is shorter than average. Compared to the baseline case, we notice that having
longer than average snippets has a small but statistically signi�cant positive e�ect on the
choice probability. Moreover, the presence of an image increases an article's within-group
choice probability. The e�ect of having an image is strong and comparable to moving from
second to �rst position on the list of related articles. This �nding is interesting and should
be contrasted with the fact (see Section 5.1) that the presence of an image is associated
with a decrease in an article's absolute click-through rate when there are no related articles.
Overall, the above �ndings provide support for Hypothesis 3.
6 Discussion and Implications
News aggregators have emerged as an important component of the digital content ecosys-
tem. A better understanding of how their design parameters a�ect the allocation of reader
attention is useful, both in terms of informing aggregator design, as well as in terms of in-
forming the current controversy that exists between aggregators and content producers. In
24
Estimate Std. Error z value Pr(>|z|)
(Intercept) 1.8386894 0.0075861 242.377 < 2e-16 ***
snippet-98 (baseline)
snippet-147 0.1526484 0.0062659 24.362 < 2e-16 ***
snippet-196 0.2426397 0.0061228 39.629 < 2e-16 ***
snippet-245 0.3386749 0.0059745 56.687 < 2e-16 ***
snippet-294 0.4337354 0.0058979 73.541 < 2e-16 ***
snippet-343 0.4815978 0.0057670 83.509 < 2e-16 ***
has-image 0.2112578 0.0043892 48.131 < 2e-16 ***
no-clicks 0.1538788 0.0033701 45.659 < 2e-16 ***
category-intl (baseline)
category-local -0.0398357 0.0044209 -9.011 < 2e-16 ***
category-business -0.1507134 0.0056415 -26.715 < 2e-16 ***
category-technology -0.0851998 0.0063192 -13.483 < 2e-16 ***
category-entertain -0.0806296 0.0060836 -13.254 < 2e-16 ***
category-sports -0.1704977 0.0066929 -25.474 < 2e-16 ***
category-life -0.1447068 0.0093500 -15.477 < 2e-16 ***
category-motors -0.2186243 0.0177057 -12.348 < 2e-16 ***
category-life -0.0746151 0.0096425 -7.738 1.01e-14 ***
language-german (baseline)
language-french 0.0035077 0.0047479 0.739 0.4600
language-italian 0.0068764 0.0038222 1.799 0.0720
time-other (baseline)
time-morning 0.0341617 0.0049091 6.959 3.43e-12 ***
time-lunch -0.0255825 0.0052240 -4.897 9.73e-07 ***
time-afterwork 0.0068274 0.0052735 1.295 0.1954
time-afterdinner 0.0213642 0.0049762 4.293 1.76e-05 ***
topic-age 0.0011026 0.0004426 2.491 0.0127 *
---
Significance codes: *** = 0.001, ** = 0.01, * = 0.05
Null deviance: 149938 on 21395 degrees of freedom
Residual deviance: 129988 on 21373 degrees of freedom
AIC: 214935
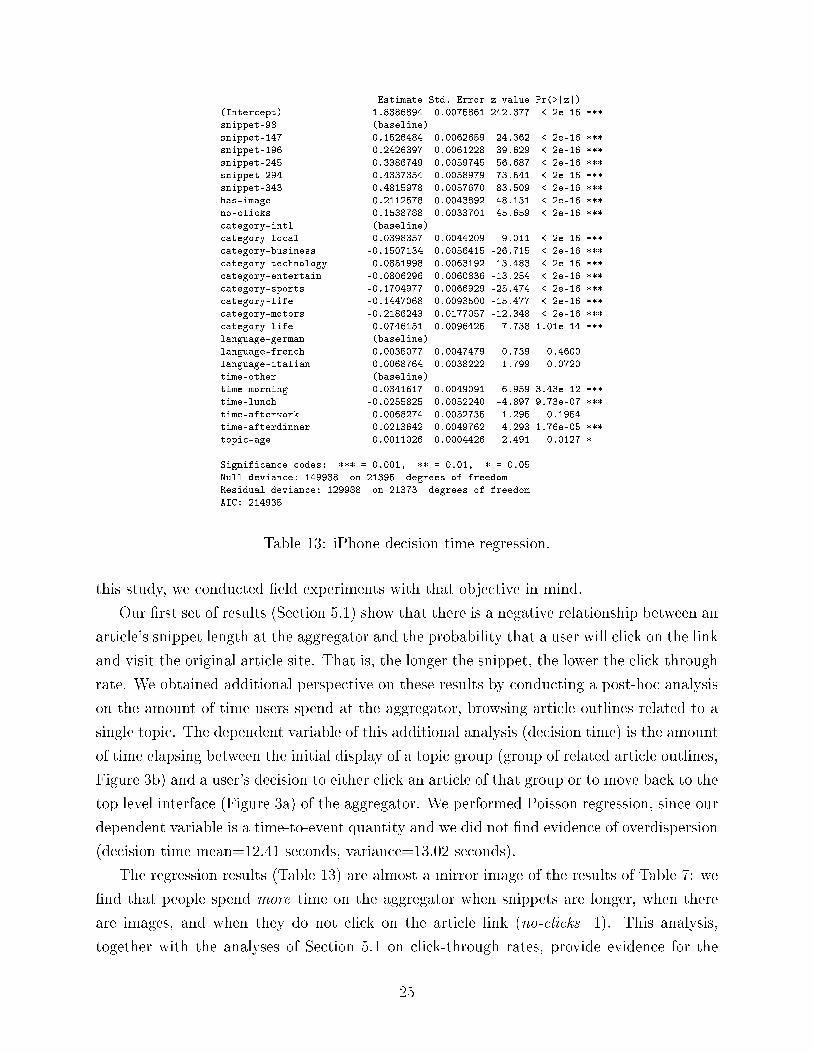
Table 13: iPhone decision time regression.
this study, we conducted �eld experiments with that objective in mind.
Our �rst set of results (Section 5.1) show that there is a negative relationship between an
article's snippet length at the aggregator and the probability that a user will click on the link
and visit the original article site. That is, the longer the snippet, the lower the click-through
rate. We obtained additional perspective on these results by conducting a post-hoc analysis
on the amount of time users spend at the aggregator, browsing article outlines related to a
single topic. The dependent variable of this additional analysis (decision time) is the amount
of time elapsing between the initial display of a topic group (group of related article outlines,
Figure 3b) and a user's decision to either click an article of that group or to move back to the
top level interface (Figure 3a) of the aggregator. We performed Poisson regression, since our
dependent variable is a time-to-event quantity and we did not �nd evidence of overdispersion
(decision time mean=12.41 seconds, variance=13.02 seconds).
The regression results (Table 13) are almost a mirror image of the results of Table 7: we
�nd that people spend more time on the aggregator when snippets are longer, when there
are images, and when they do not click on the article link (no-clicks=1). This analysis,
together with the analyses of Section 5.1 on click-through rates, provide evidence for the
25
substitution e�ect of news aggregators on the content ecosystem. Interestingly, the presence
of an image on an article outline has the same substitution e�ect to that of increasing the
snippet length: it is associated with a decrease in click-through rate and an increase in the
time spent at the aggregator.
Based on the above results, content producers have a point in terms of challenging the
currently prevailing view that the reproduction of headlines and article snippets by aggre-
gators falls under the �fair use� provisions of U.S. copyright laws (Copyright Act of 1976,
17 U.S.C. � 107).11 Speci�cally, one of the factors for fair use set forth by current law is
�the e�ect of the use upon the potential market for or value of the copyrighted work.� Our
study shows that such an e�ect, indeed, exists. Furthermore, this e�ect is very sensitive to
the amount of information that is reproduced by aggregators � practically every character
makes a di�erence to click-through rates.
Aggregators typically group together articles that refer to the same story, thus increasing
competition among related articles. In this study, we also examined how the aggregation of
articles into topic groups a�ects the allocation of readers' attention. We found an inverse
U-shaped relationship between the number of articles in a topic group and the probability
that readers will click on at least one article from that group. This is a previously unnoticed
side e�ect of news aggregators that deserves more attention.
One tentative explanation for this �nding (see Section 3.2) is that, the more articles are
available on a topic, the more likely it is that a user will �nd at least one of them appealing.
However, when there are many related articles, we speculate that the combined information
contained in their snippets might satisfy the readers' curiosity who then may not feel the need
to click on any of the linked articles. We proceeded to test this hypothesis by quantifying
the degree of content complementarity of snippets belonging to every one of the topics that
were displayed to users during our two-week iPhone experiment. We employed two student
coders for snippets in German, Italian, and French language respectively (six coders in
total). Coders were tasked with characterizing each snippet belonging to a topic as being
either a replica (containing identical or essentially the same information), an alternative
(containing complementary information about the same event), or an update (containing
new developments in the story) relative to the information contained in the snippet that was
displayed immediately before it. The average inter-coder reliability was 76%.
We consider the number of alternatives and updates contained in a topic group as proxies
of the degree to which the snippets of the group collectively reveal more information about the
story, relative to any single snippet. A correlation check attests that these variables contain
distinct information, not captured by other variables in our regression (Cor(related-articles,
11See http://en.wikipedia.org/wiki/Fair_use
26
Estimate Std. Error z value Pr(>|z|)
(Intercept) -0.417185 0.094955 -4.393 1.12e-05 ***
related-articles 0.611610 0.062762 9.745 < 2e-16 ***
related-articles^2 0.069399 0.008560 -8.108 5.17e-16 ***
topic-age -0.053540 0.009786 -5.471 4.47e-08 ***
alternatives 0.365729 0.079032 4.628 3.70e-06 ***
updates 0.248030 0.060859 4.075 4.59e-05 ***
category-intl (baseline)
category-local 0.086275 0.058656 1.471 0.141323
category-business 0.052379 0.069094 0.758 0.448397
category-technology 0.386705 0.089971 4.298 1.72e-05 ***
category-entertain 0.435848 0.087867 4.960 7.04e-07 ***
category-sports 0.312408 0.082842 3.771 0.000163 ***
category-life 0.521353 0.188912 2.760 0.005784 **
category-culture 0.334574 0.145478 2.300 0.021458 *
language-german (baseline)
language-french -0.210655 0.066026 -3.190 0.001420 **
language-italian -0.062373 0.052825 -1.181 0.237703
time-other (baseline)
time-morning 0.192996 0.066931 2.884 0.003933 **
time-lunch 0.053053 0.069401 0.764 0.444607
time-afterwork -0.038461 0.069764 -0.551 0.581433
time-afterdinner -0.060044 0.067122 -0.895 0.371027
--- Significance codes: *** = 0.001, ** = 0.01, * = 0.05
Null deviance: 12758 on 9503 degrees of freedom
Residual deviance: 12388 on 9485 degrees of freedom
AIC: 12426
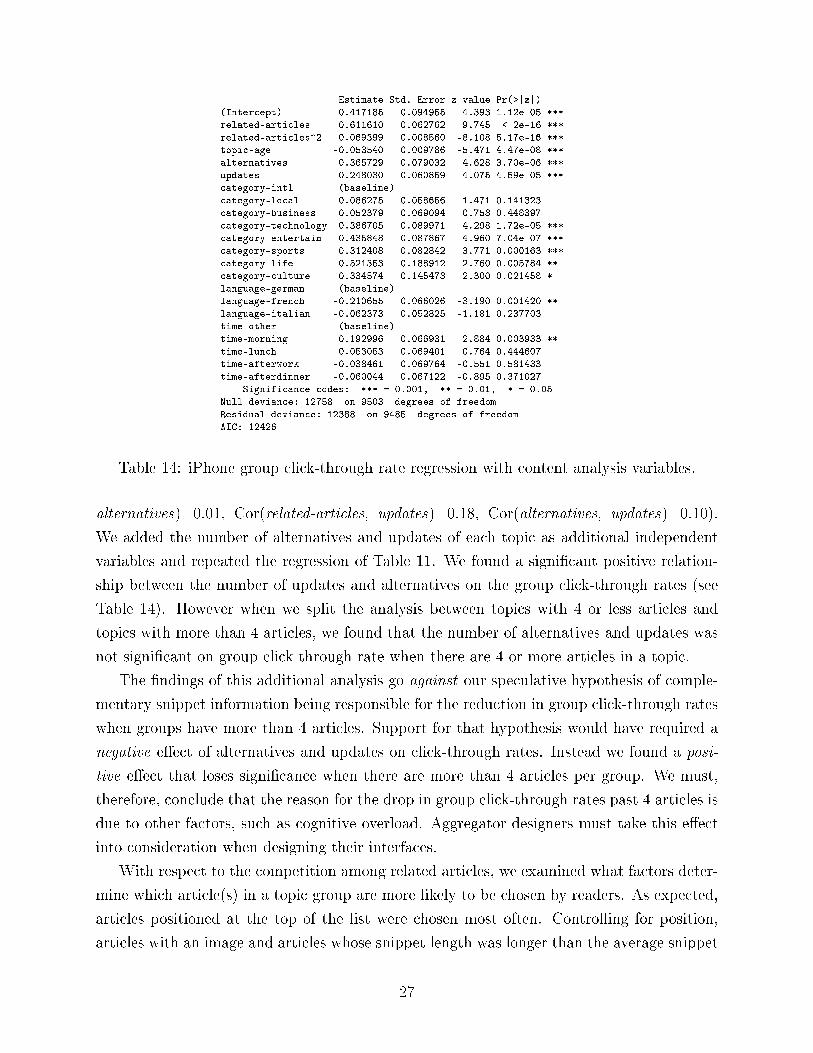
Table 14: iPhone group click-through rate regression with content analysis variables.
alternatives)=0.01, Cor(related-articles, updates)=0.18, Cor(alternatives, updates)=0.10).
We added the number of alternatives and updates of each topic as additional independent
variables and repeated the regression of Table 11. We found a signi�cant positive relation-
ship between the number of updates and alternatives on the group click-through rates (see
Table 14). However when we split the analysis between topics with 4 or less articles and
topics with more than 4 articles, we found that the number of alternatives and updates was
not signi�cant on group click-through rate when there are 4 or more articles in a topic.
The �ndings of this additional analysis go against our speculative hypothesis of comple-
mentary snippet information being responsible for the reduction in group click-through rates
when groups have more than 4 articles. Support for that hypothesis would have required a
negative e�ect of alternatives and updates on click-through rates. Instead we found a posi-
tive e�ect that loses signi�cance when there are more than 4 articles per group. We must,
therefore, conclude that the reason for the drop in group click-through rates past 4 articles is
due to other factors, such as cognitive overload. Aggregator designers must take this e�ect
into consideration when designing their interfaces.
With respect to the competition among related articles, we examined what factors deter-
mine which article(s) in a topic group are more likely to be chosen by readers. As expected,
articles positioned at the top of the list were chosen most often. Controlling for position,
articles with an image and articles whose snippet length was longer than the average snippet
27
length of related articles were more likely to be chosen. These �ndings are consistent with
our theoretical predictions (Section 3.3) but stand in contrast to the �ndings for individual
click-through rates, where longer snippets and presence of an image correlate with lower
rates. Taken together, they reinforce the di�cult position in which content producers are
placed by aggregators � on one hand, our �ndings on individual click-through rates suggest
that content producers might want to place limits on the amount of article text/graphics
that an aggregator is allowed to reproduce. On the other hand, our �ndings on compe-
tition click-through rates show that, doing so unilaterally may place a publisher's content
at a disadvantage vis-à-vis the content of competing publishers who choose to not impose
such limits. This argument is consistent with the theoretical predictions of Dellarocas et
al. (2013) regarding the prisoner's dilemma situation that competing content producers are
facing in their negotiations with aggregators. The above discussion suggests the need for
industry-wide (as opposed to one-on-one) negotiations between content producers and news
aggregators with respect to the terms of their relationship.
7 Concluding Remarks
As with any study, the �ndings of this paper should be viewed with regard to the study
limitations. Although this work o�ers novel insight into the relationship between news ag-
gregators and content producers, its objective is not to provide answers to the question of
whether aggregators are, on balance, bene�cial or harmful to content ecosystems. What the
current work establishes is that aggregators extract an �attention tax� from content produc-
ers, in the form of users who never click through to the original articles. We demonstrate
that the fraction of such users depends on the design parameters of the aggregator and that
there is a substitution relationship between the amount of information that aggregators o�er
about articles and the probability that readers will opt to read the full articles at the content
producer sites. We further show that competitive pressure might limit the extent to which
individual content producers might �nd it bene�cial to deviate from an aggregator's norms:
our multinomial logit results suggest that a publisher's unilateral decision to shorten the
snippet lengths of its articles and/or disallow the reproduction of images might put them at
disadvantage in situations where there are several related articles on the same topics.
What is outside the scope of the current research is the impact that aggregators have
on increasing the overall consumption of content (e.g. because they reduce search costs
by organizing content). Despite notable recent attempts to provide answers to the latter
question (Athey and Mobius 2012; Chiou and Tucker 2011), a balanced examination of
the cumulative impact of aggregators, that takes into consideration both the search cost
28
reduction and the attention tax e�ects, still remains an elusive and interesting empirical
question for future research.
From a methodological perspective, this work highlights the feasibility of conducting
�eld experiments using apps developed in research labs and then released to the public. Our
results suggest that experiments with even a few thousands of users can expose many of the
e�ects that are also present in much larger scale applications. There is, thus, an interesting
methodological discussion to be had on the merits of working with larger, but less �exible,
secondary data sets obtained from third-parties vs. with primary data sets obtained from
smaller scale apps developed for the purpose of conducting experimental studies.
References
Agarwal, D., B-C. Chen, P. Elango. 2009. Spatio-temporal models for estimating click-
through rate. Proc. of the 18th Int. Conf. on World Wide Web (WWW'09), Madrid, Spain,
21-30.
Athey, S., M. Mobius. 2012. The impact of news aggregators on internet news consump-
tion: The case of localization. Working Paper, Microsoft Research.
Chiou, L., C. Tucker. 2011. Copyright, digitization, and aggregation. NET Insti-
tute Working Paper No. 11-18. Available at SSRN: http://ssrn.com/abstract=1864203 or
doi:10.2139/ssrn.1864203
Dellarocas, C., Z. Katona, W. Rand. 2013. Media, aggregators and the link economy:
Strategic hyperlink formation in content networks. Management Sci. forthcoming.
Dewan, R. M., M. L. Freimer, A. Seidmann, J. Zhang. 2004. Web portals: Evidence and
analysis of media concentration. J. Management Info. Sys. 21(2) 181-199.
Ghose, A., S. Yang. 2009. An empirical analysis of search engine advertising: Sponsored
search in electronic markets. Management Sci. 55(10) 1605-1622.
Hong, S. 2011. A simple model of news aggregators, information cascades, and online
tra�c. Working Paper. Available at SSRN: http://ssrn.com/abstract=1927035
Isbell, K. 2010. The rise of the news aggregator: Legal implications and best practices.
Research Publication No. 2010-10, Berkman Center.
Jarvis, J. 2008. The link economy vs. the content economy. Buzzmachine blog, June 18,
2008. (http://www.buzzmachine.com)
Karp, S. 2007. The web's link-driven attention economy. Publishing 2.0, December 15,
2007. (http://publishing2.com/)
Roos, J., C. F. Mela, R. Shachar. 2011. Hyper-media search and consumption. Working
Paper, Duke University.
29
Wu, F., B. Huberman. 2008. Popularity, novelty and attention. Proc. of the 9th ACM
Conf. on Electronic Commerce (EC'08), Chicago, USA, 240-245.
Proof of Lemma 1
Substituting Φ(x) = 12
[1 + erf
(x√2
)], where erf(·) is the error function, we obtain
κ(t) =1
4D
D̂
−D
[erf
([A(t)− y]
√t√2
)− erf
([−A(t)− y]
√t√2
)]dy
Integration and di�erentiation with respect to t gives:
κ′(t) = 12DA′(t)
[erf([D − A(t)]
√t√2) + erf([D + A(t)]
√t√2))]
+√2
4Dt32√π
[e−
12t(D−A(t))2 − e− 1
2t(D+A(t))2
]The above expression is the sum of two terms. These terms capture the two e�ects of
changing signal precision in our model. First, as signal precision grows, the size of the interval
(−A(t), A(t)) of signals that induce click-throughs changes as well (grows or shrinks). The
�rst term captures the change in click-through rates because of the change in the size of that
interval (a broader interval results in higher rates, a narrower interval to lower). Second,
as precision grows, signals become more concentrated around their mean. Given an interval
(−A(t), A(t)), if a signal's true mean falls inside the interval, the probability that the signal
will also fall inside the interval grows. Conversely, if a signal's true mean falls outside the
interval, the probability that the signal will fall inside the interval shrinks. The second term
captures the net result of the second e�ect.
Because D > A(t) ≥ 0, the argument of both error functions in the above expression
is positive. Since it is erf(x) > 0 for all x > 0, this implies that the functions always
have a positive value. Hence, the term inside the �rst pair of square brackets is positive.
Furthermore, it is always D−A(t) < D+A(t), which implies that the di�erence of negative
exponential terms inside the second pair of square brackets is also positive. Overall, if
A′(t) ≥ 0 then it is also κ′(t) ≥ 0, whereas, if A′(t) < 0, the �rst term of the above
expression is negative and the second is positive (but very small, especially as t grows), so
for A′(t) su�ciently negative, κ′(t) also becomes negative.
30
Proof of Lemma 2
If U − d0 − c < 0 then A(t) = d0 − α(t)β(t), where
α(t) =1
f(t), α(0) =∞, α(∞) = 1, α′(t) ≤ 0
β(t) = |U − d0 − c|+g(t)
1− g(t)c, β(0) = |U − d0 − c|, β(∞) =∞, β′(t) ≥ 0
It is, therefore, A(0) = −∞, A(∞) = −∞ and A(t) �nite for all �nite t. By con-
tinuity this implies that there is a region t ∈ [0, t0] where A(t) monotonically grows and
a region t ∈ [t1,∞) where A(t) declines towards −∞. Furthermore, it is limt→∞ β′(t) =
limt→∞g′(t)
(1−g(t))2 c =∞, which also implies limt→∞A′(t) = −∞.
If U − d0 − c > 0 then A(t) = d0 + α(t)β(t), where
α(t) =1
f(t), α(0) =∞, α(∞) = 1, α′(t) ≤ 0
β(t) = |U − d0 − c| −g(t)
1− g(t)c, β(0) = |U − d0 − c|, β(∞) = −∞, β′(t) ≤ 0
Therefore, A(t) is the sum of a constant term plus the product of two monotonically declining
functions. So it is A′(t) ≤ 0 for all t. Furthermore, it is limt→∞ β′(t) = limt→∞− g′(t)
(1−g(t))2 c =
−∞, which also implies limt→∞A′(t) = −∞.
31
Appendix: Additional Insights into Online News Reading
Behavior
An examination of the control variables in Table 7 provides additional insight into online
news reading behavior. These �ndings are not directly related to our main research questions
but interesting enough to merit a brief discussion in this appendix. We observe the following:
1. Average click-through rates for technology, entertainment, sports, life and culture news
are higher than those for local, international, business and motor news. Our expla-
nation for this �nding is that the former group consists of stories that people tend to
personally identify and engage more with. Readers are, then, more likely to seek addi-
tional information (beyond what is listed in the article outline) for such stories. On the
other hand, local, international and business news tend to be more �impersonal� - most
people are interested in knowing that an event happened nationally or internationally
but not in �nding out more details about it.
2. Click-through rates generally decline as news topics get older. This is an intuitive
�nding and a useful control for some of our later analyses, but see some interesting
nuances below.
3. Average click-through rates are higher during the morning commute hours and lower
during the end of the work day/evening commute hours, relative to other times of the
day. It appears that the majority of our users are most focused on reading the news
during their morning commute and least engaged with news near the end of their work
day.
4. Average click-through rates were lower for French and Italian-speaking users, relative
to German-speaking users. We do not have an explanation for this �nding - it might
be due to idiosyncrasies of our user population or to some cultural factor yet to be
identi�ed. We note it here as an interesting opportunity for future research.
We obtained deeper insight into some of these �ndings by adding appropriate interaction
terms. The inclusion of interaction terms allows us to examine how the click-through rates
of di�erent news categories are impacted di�erently by (a) the length of the snippet, (b) the
presence of an image and (c) the age of the news topic. For this analysis, we replaced the six
dummy variables snippet-nnn that were used in all other regressions with a single numerical
variable snippet-length that contains the length of the snippet in characters.
The regression results are shown in Table 15. Our key insights are the following:
32
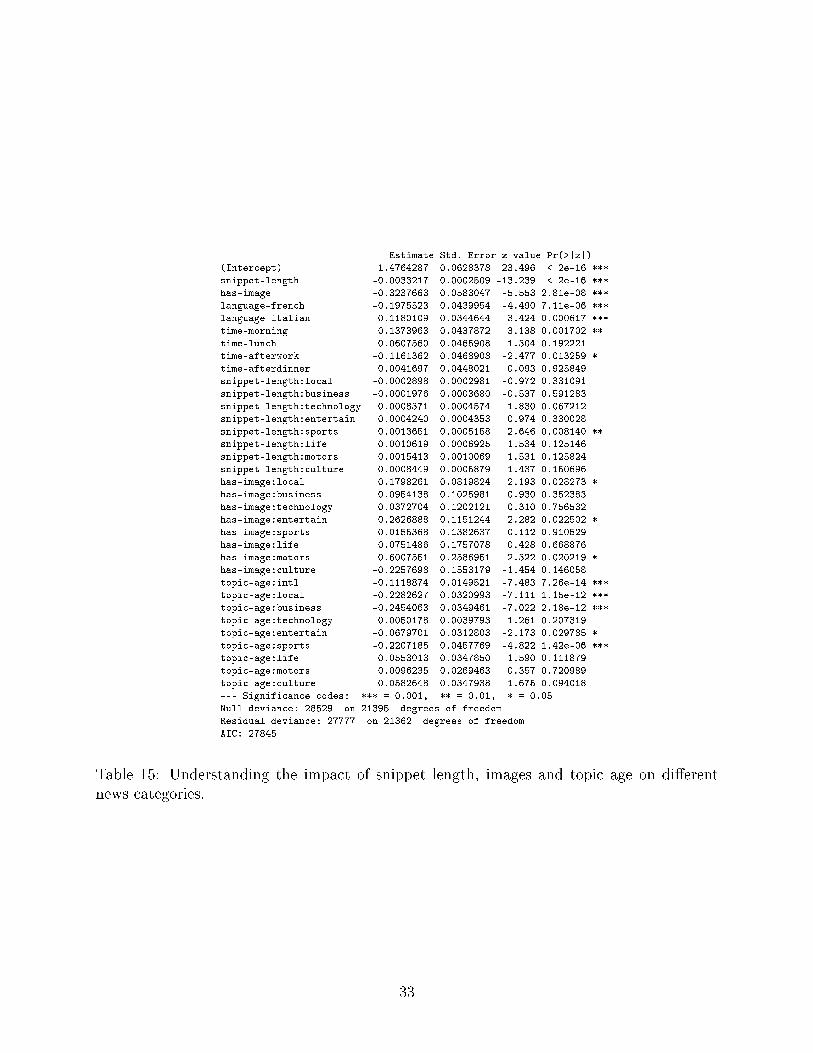
Estimate Std. Error z value Pr(>|z|)
(Intercept) 1.4764287 0.0628378 23.496 < 2e-16 ***
snippet-length -0.0033217 0.0002509 -13.239 < 2e-16 ***
has-image -0.3237663 0.0583047 -5.553 2.81e-08 ***
language-french -0.1975523 0.0439954 -4.490 7.11e-06 ***
language-italian -0.1180109 0.0344644 -3.424 0.000617 ***
time-morning 0.1373963 0.0437872 3.138 0.001702 **
time-lunch 0.0607560 0.0465908 1.304 0.192221
time-afterwork -0.1161362 0.0468908 -2.477 0.013259 *
time-afterdinner 0.0041697 0.0448021 0.093 0.925849
snippet-length:local -0.0002898 0.0002981 -0.972 0.331091
snippet-length:business -0.0001976 0.0003680 -0.537 0.591283
snippet-length:technology 0.0008371 0.0004574 1.830 0.067212
snippet-length:entertain 0.0004240 0.0004353 0.974 0.330028
snippet-length:sports 0.0013651 0.0005158 2.646 0.008140 **
snippet-length:life 0.0010619 0.0006925 1.534 0.125146
snippet-length:motors 0.0015413 0.0010069 1.531 0.125824
snippet-length:culture 0.0008449 0.0005879 1.437 0.150696
has-image:local 0.1798261 0.0819824 2.193 0.028273 *
has-image:business 0.0954138 0.1025981 0.930 0.352383
has-image:technology 0.0372704 0.1202121 0.310 0.756532
has-image:entertain 0.2626888 0.1151244 2.282 0.022502 *
has-image:sports 0.0155368 0.1382637 0.112 0.910529
has-image:life 0.0751486 0.1757078 0.428 0.668876
has-image:motors -0.6007551 0.2586951 -2.322 0.020219 *
has-image:culture -0.2257698 0.1553179 -1.454 0.146058
topic-age:intl -0.1118874 0.0149521 -7.483 7.26e-14 ***
topic-age:local -0.2282627 0.0320993 -7.111 1.15e-12 ***
topic-age:business -0.2454063 0.0349461 -7.022 2.18e-12 ***
topic-age:technology 0.0050178 0.0039793 1.261 0.207319
topic-age:entertain -0.0679701 0.0312803 -2.173 0.029785 *
topic-age:sports -0.2207185 0.0457769 -4.822 1.42e-06 ***
topic-age:life 0.0553013 0.0347850 1.590 0.111879
topic-age:motors 0.0096235 0.0269463 0.357 0.720989
topic-age:culture 0.0582648 0.0347938 1.675 0.094018
--- Significance codes: *** = 0.001, ** = 0.01, * = 0.05
Null deviance: 28529 on 21395 degrees of freedom
Residual deviance: 27777 on 21362 degrees of freedom
AIC: 27845
Table 15: Understanding the impact of snippet length, images and topic age on di�erentnews categories.
33
1. Snippet lengths have a negative impact on the click-through rates of all news categories
(the coe�cient of snippet-length is negative and of substantially higher magnitude
than any of the positive coe�cients of interaction terms snippet-length:{category}).
Interestingly, however, the click-through rates of sports news appear to be less severely
a�ected by increases in snippet length, relative to other types of news.
2. Displaying an image has a negative impact on the click-through rates of all news cat-
egories (the coe�cient of has-image is negative and of substantially higher magnitude
than any of the positive coe�cients of interaction terms has-image:{category}). This
impact is more severe than average for motor news (where, usually, the image pretty
much tells the whole story) and less severe than average for entertainment news (where
an image often engages people to �nd out more about the story) and for local news.
3. Topic age has a di�erent impact on di�erent news categories. The impact is negative
and more severe for local, business and sports news, negative and less severe for inter-
national and entertainment news. Topic age has no statistically signi�cant impact on
technology, life, motors and culture news. The latter group of news tends to be less
time sensitive and of more lasting interest.
34