boston logan international airport operational...
TRANSCRIPT
Boston Logan International Airport
Operational Overview
Presentation to the Massport Community Advisory Committee
June 8, 2017

Content
• Overview of Logan
• Runway Designations
• Runway Configurations and Community Overflights
• Appendix – background material
2

22R 22L
27
4L
4R 33L
15R 15L
33R
14
32
9
Based on wind/weather and other operational considerations, the
FAA uses Logan runways in combinations to safely and efficiently
coordinate aircraft landings and takeoffs
3
• The FAA is responsible
for choosing which
runways to use
• For safety, aircraft land
and depart into the wind
• Boston experiences
varied wind/weather
conditions
• Current and forecasted
weather is primary
• Other operational factors
include runway closures,
fleet mix, demand
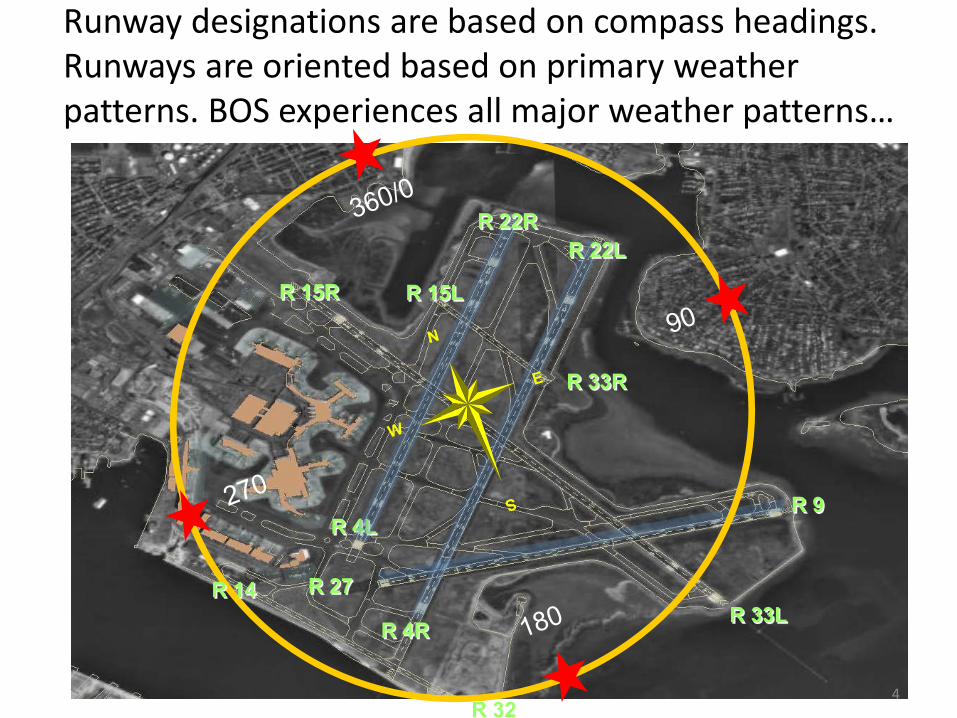
Runway designations are based on compass headings.
Runways are oriented based on primary weather
patterns. BOS experiences all major weather patterns…
R 4L
R 4R
R 9
R 27
R 15R R 15L
R 33L
R 33R
R 22R R 22L
R 14
R 32 4
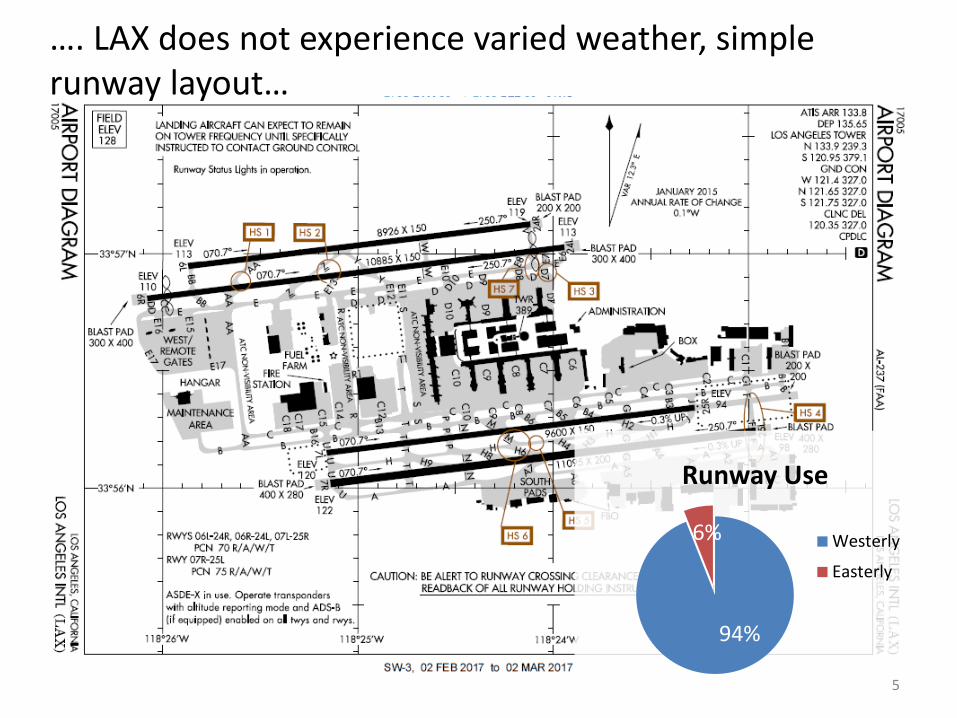
…. LAX does not experience varied weather, simple
runway layout…
94%
6%
Runway Use
Westerly
Easterly
5
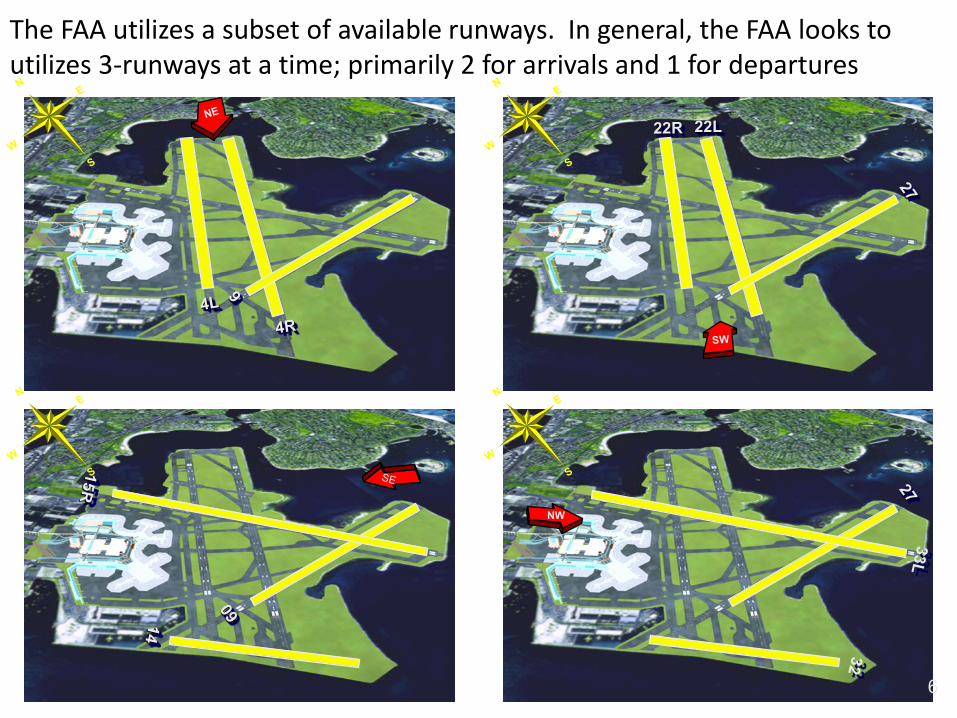
The FAA utilizes a subset of available runways. In general, the FAA looks to
utilizes 3-runways at a time; primarily 2 for arrivals and 1 for departures
NW
6
7
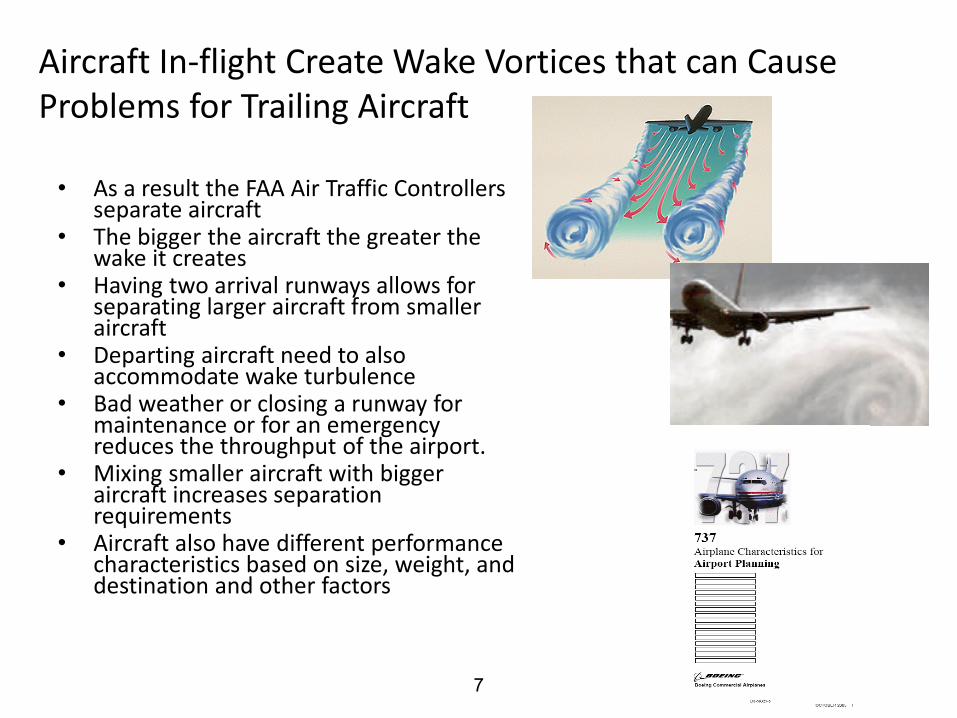
Aircraft In-flight Create Wake Vortices that can Cause
Problems for Trailing Aircraft
• As a result the FAA Air Traffic Controllers separate aircraft
• The bigger the aircraft the greater the wake it creates
• Having two arrival runways allows for separating larger aircraft from smaller aircraft
• Departing aircraft need to also accommodate wake turbulence
• Bad weather or closing a runway for maintenance or for an emergency reduces the throughput of the airport.
• Mixing smaller aircraft with bigger aircraft increases separation requirements
• Aircraft also have different performance characteristics based on size, weight, and destination and other factors
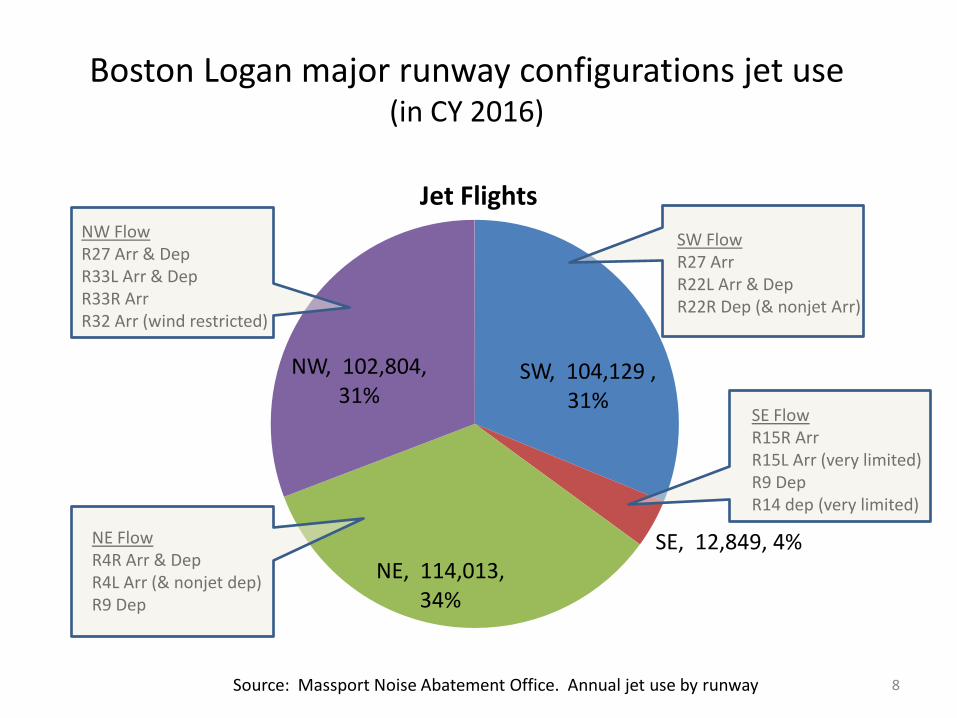
Boston Logan major runway configurations jet use
(in CY 2016)
SW, 104,129 ,
31%
SE, 12,849, 4%
NE, 114,013,
34%
NW, 102,804,
31%
Jet Flights SW Flow
R27 Arr
R22L Arr & Dep
R22R Dep (& nonjet Arr)
Source: Massport Noise Abatement Office. Annual jet use by runway 8
NW Flow
R27 Arr & Dep
R33L Arr & Dep
R33R Arr
R32 Arr (wind restricted)
SE Flow
R15R Arr
R15L Arr (very limited)
R9 Dep
R14 dep (very limited)
NE Flow
R4R Arr & Dep
R4L Arr (& nonjet dep)
R9 Dep

9
Based on which configuration the FAA selects, different communities
are impacted. Some communities are overflown by multiple
runways under varying operating conditions

Southwest Flow Operating
Configuration – 104,000 Jet Flights
in 2016 (31%)
Arrivals to R 22L and 27
Departures from R 22L and 22R
Runway 22R
Runway 22L
Runway 27
Non-Jet
Arrivals
Departures
10
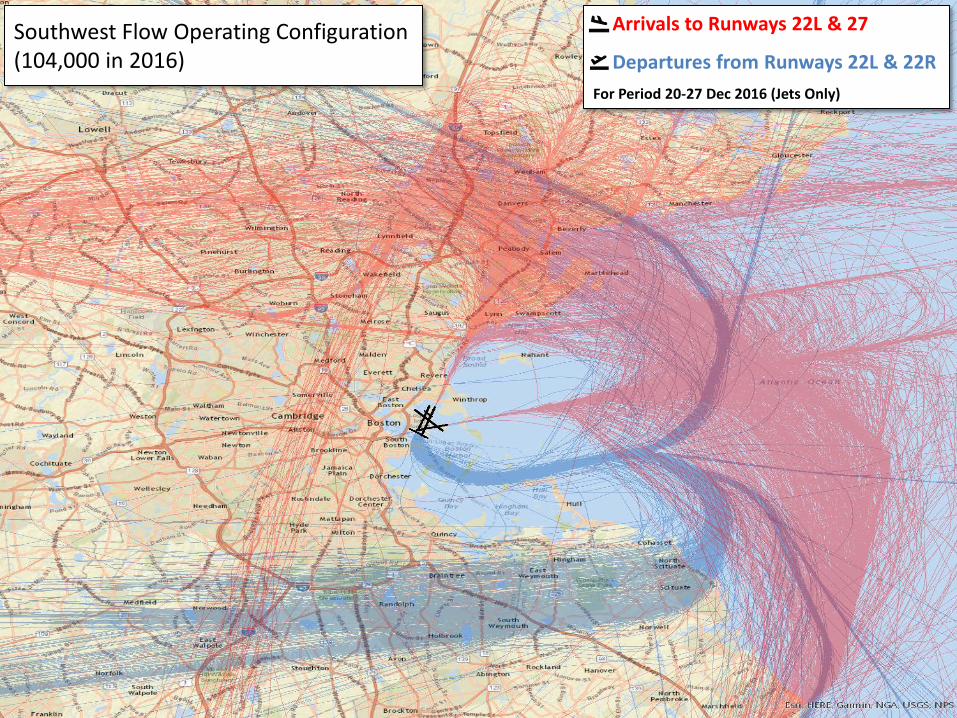
Southwest Flow Operating Configuration
(104,000 in 2016)
Arrivals to Runways 22L & 27
Departures from Runways 22L & 22R For Period 20-27 Dec 2016 (Jets Only)
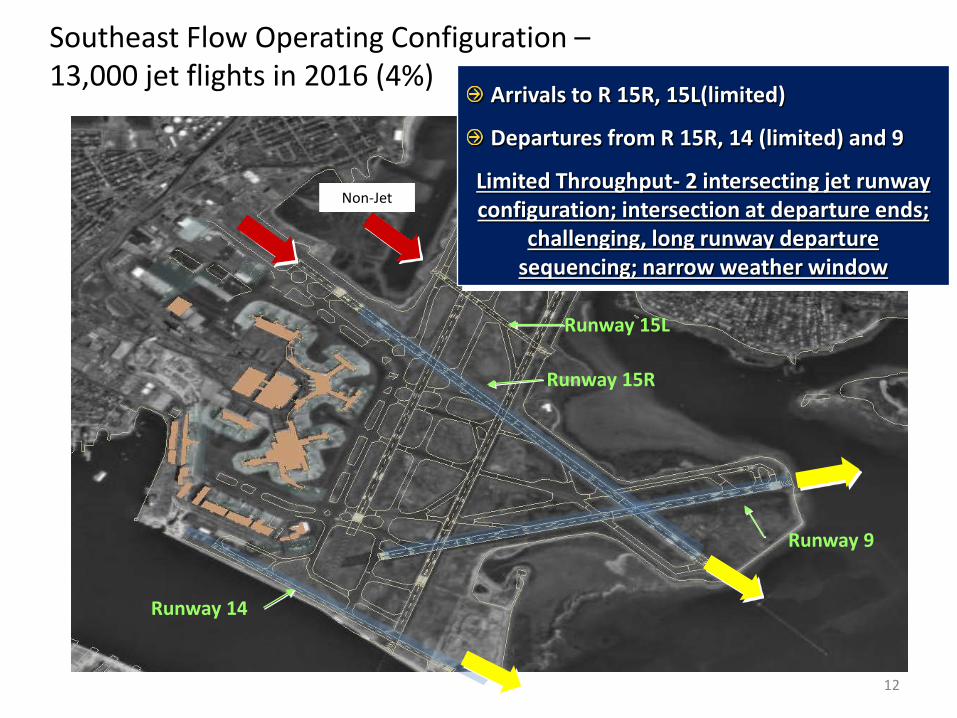
Southeast Flow Operating Configuration –
13,000 jet flights in 2016 (4%)
Runway 14
Runway 15R
Runway 9
Arrivals to R 15R, 15L(limited)
Departures from R 15R, 14 (limited) and 9
Limited Throughput- 2 intersecting jet runway configuration; intersection at departure ends;
challenging, long runway departure sequencing; narrow weather window
Non-Jet
Runway 15L
12
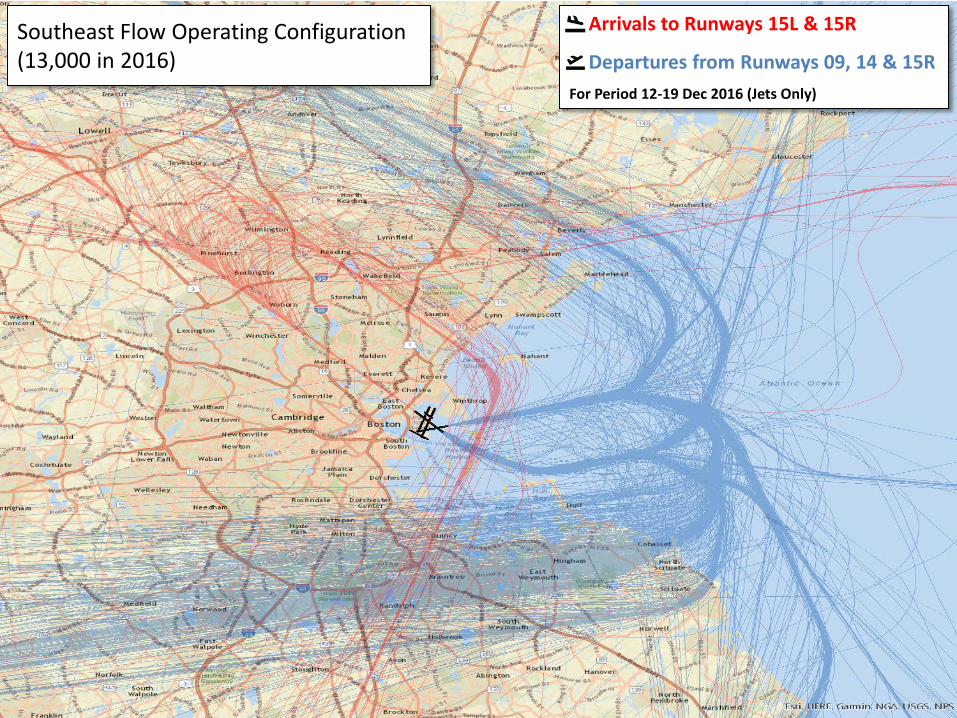
Southeast Flow Operating Configuration
(13,000 in 2016)
Arrivals to Runways 15L & 15R
Departures from Runways 09, 14 & 15R For Period 12-19 Dec 2016 (Jets Only)
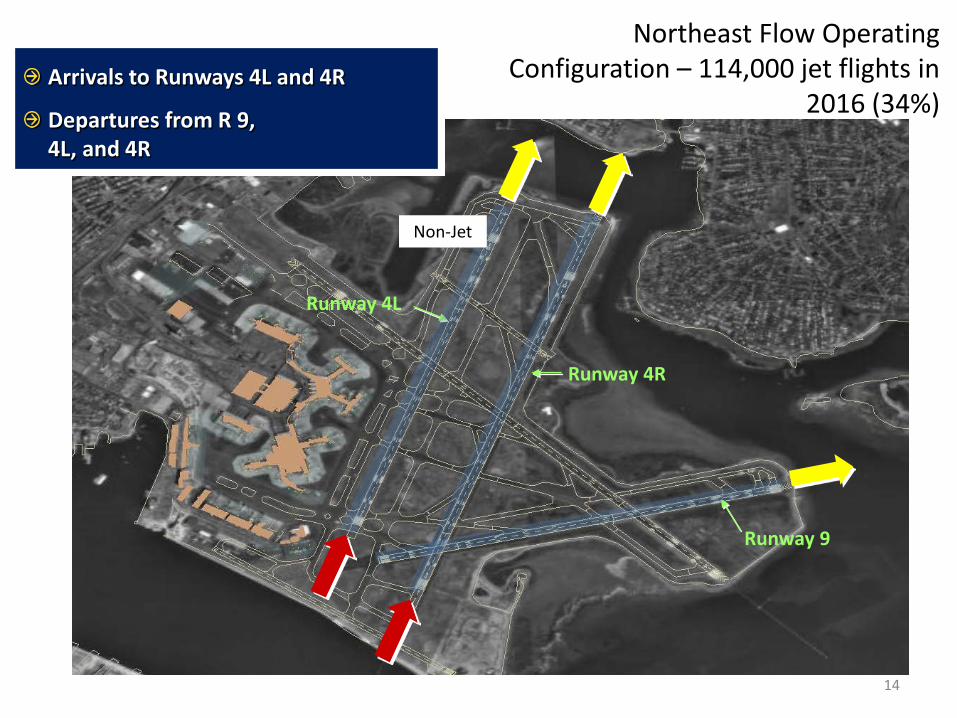
Northeast Flow Operating
Configuration – 114,000 jet flights in
2016 (34%)
Runway 4L
Runway 4R
Runway 9
Arrivals to Runways 4L and 4R
Departures from R 9, 4L, and 4R
Non-Jet
14

Northeast Flow Operating Configuration
(114,000 in 2016)
Arrivals to Runways 04L & 04R
Departures from Runways 09, 04L & 04R For Period 01-07 Dec 2016 (Jets Only)
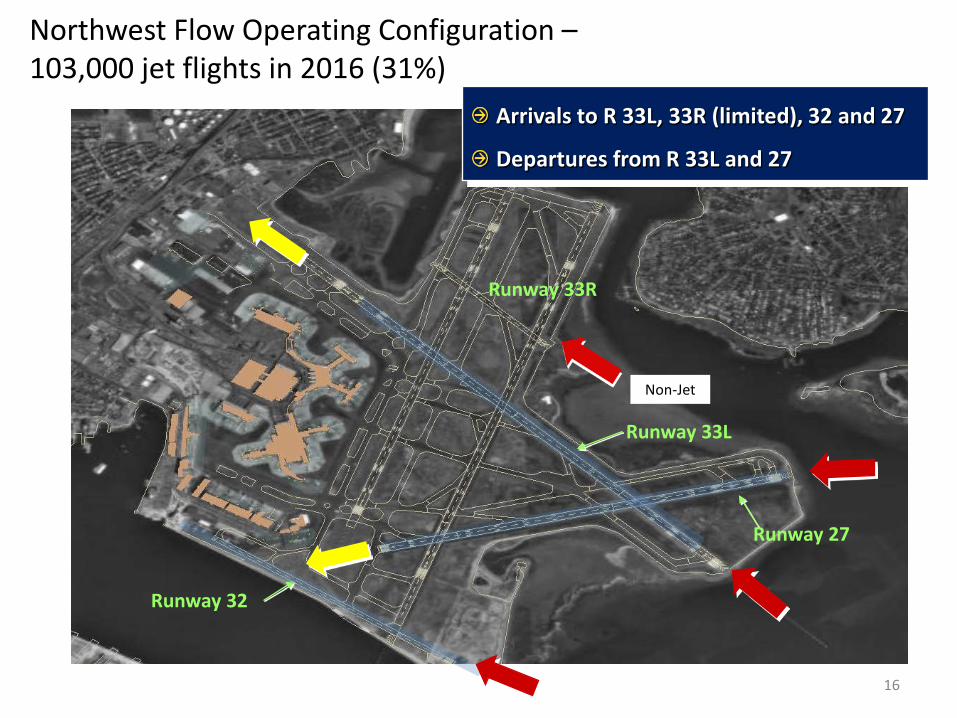
Northwest Flow Operating Configuration –
103,000 jet flights in 2016 (31%)
Runway 32
Runway 33L
Runway 27
Arrivals to R 33L, 33R (limited), 32 and 27
Departures from R 33L and 27
Non-Jet
Runway 33R
16
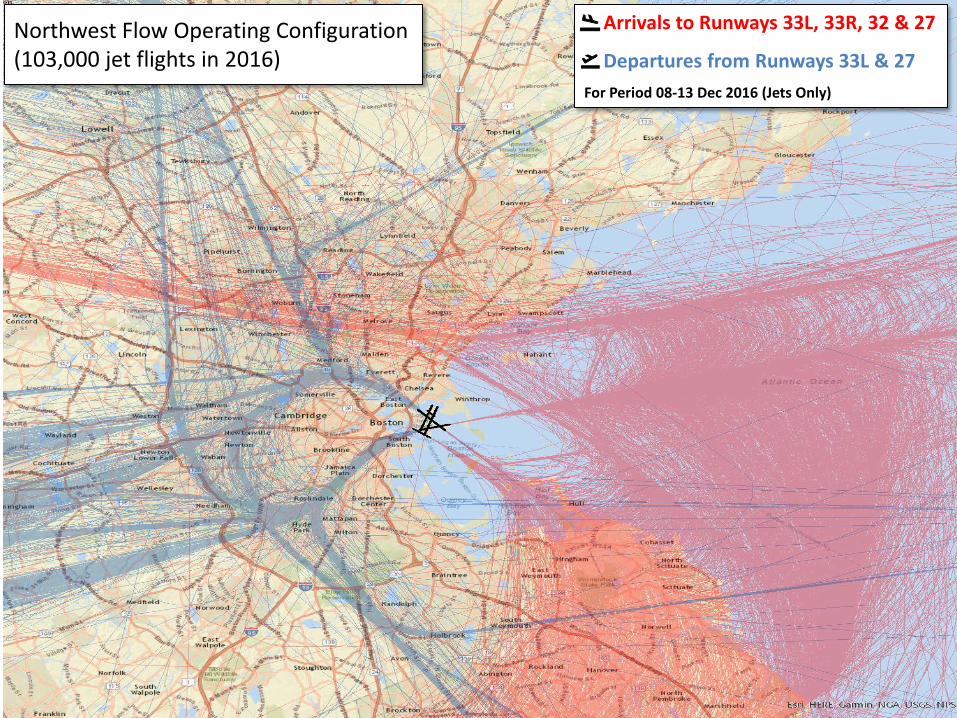
Northwest Flow Operating Configuration
(103,000 jet flights in 2016)
Arrivals to Runways 33L, 33R, 32 & 27
Departures from Runways 33L & 27 For Period 08-13 Dec 2016 (Jets Only)

Late Night, Opposite Direction Configuration
Runway 33L
Runway 15R
Arrivals to R 33L
Departures R 15R
18
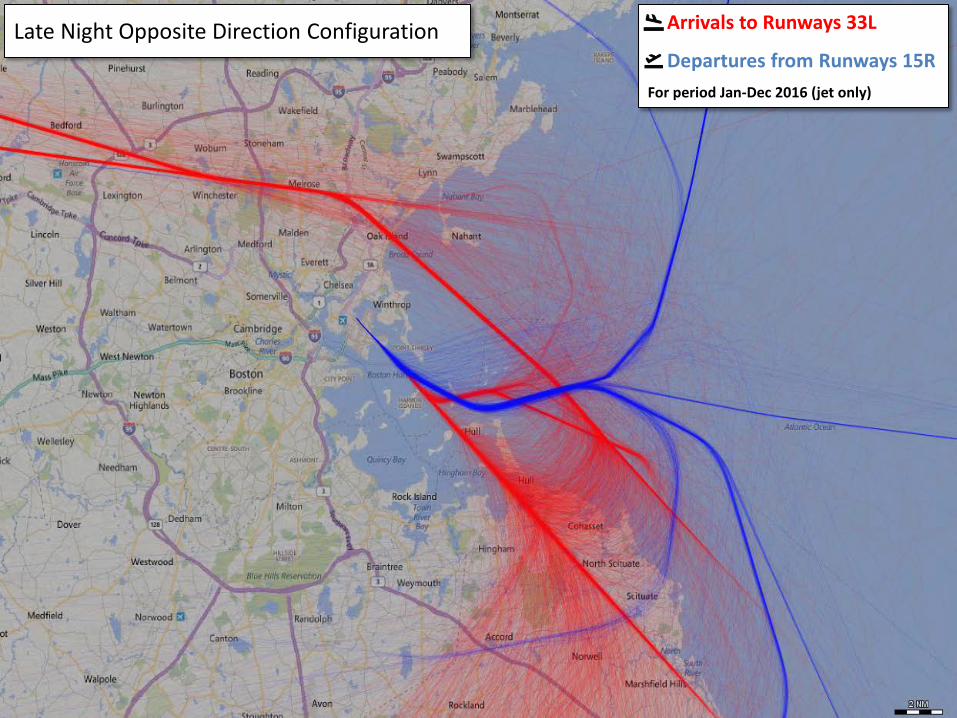
Late Night Opposite Direction Configuration Arrivals to Runways 33L
Departures from Runways 15R For period Jan-Dec 2016 (jet only)
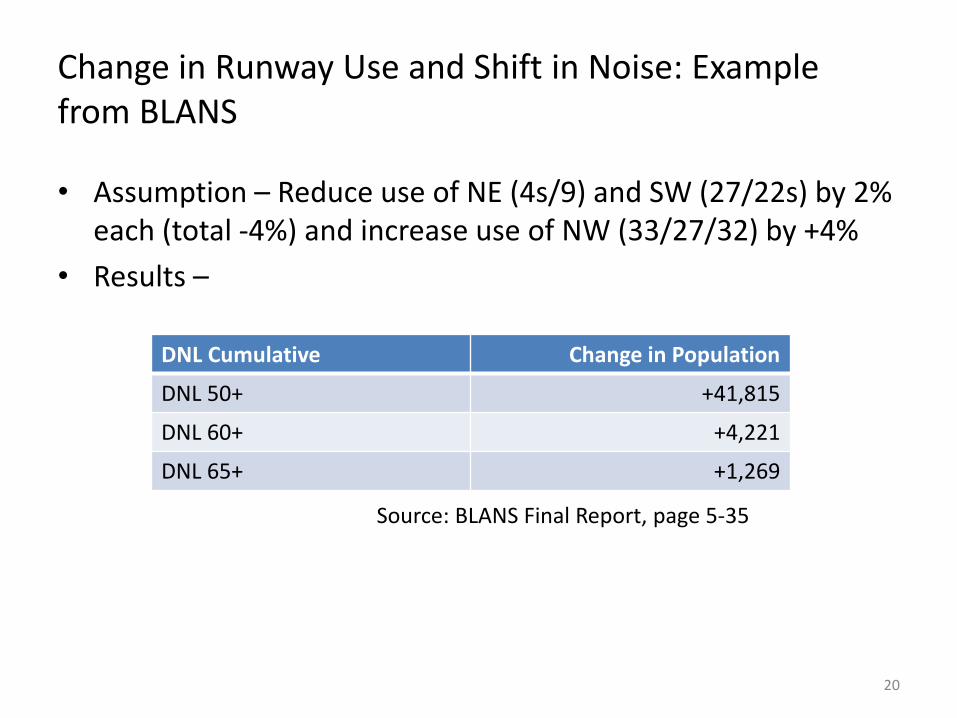
Change in Runway Use and Shift in Noise: Example
from BLANS
• Assumption – Reduce use of NE (4s/9) and SW (27/22s) by 2%
each (total -4%) and increase use of NW (33/27/32) by +4%
• Results –
20
DNL Cumulative Change in Population
DNL 50+ +41,815
DNL 60+ +4,221
DNL 65+ +1,269
Source: BLANS Final Report, page 5-35

Appendix Background Material
34
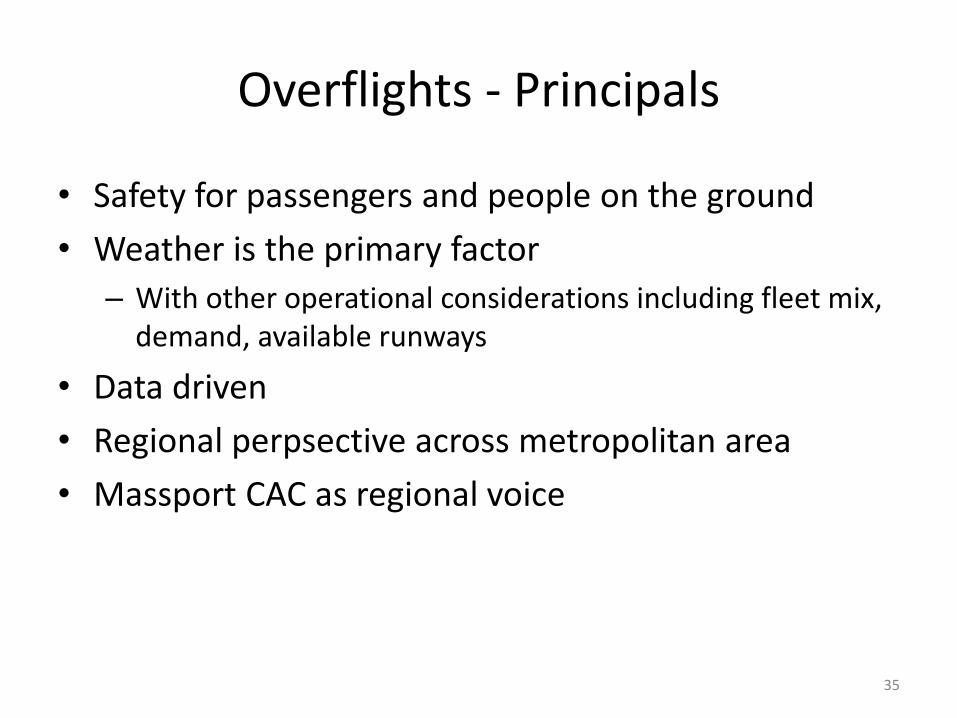
Overflights - Principals
• Safety for passengers and people on the ground
• Weather is the primary factor
– With other operational considerations including fleet mix,
demand, available runways
• Data driven
• Regional perpsective across metropolitan area
• Massport CAC as regional voice
35
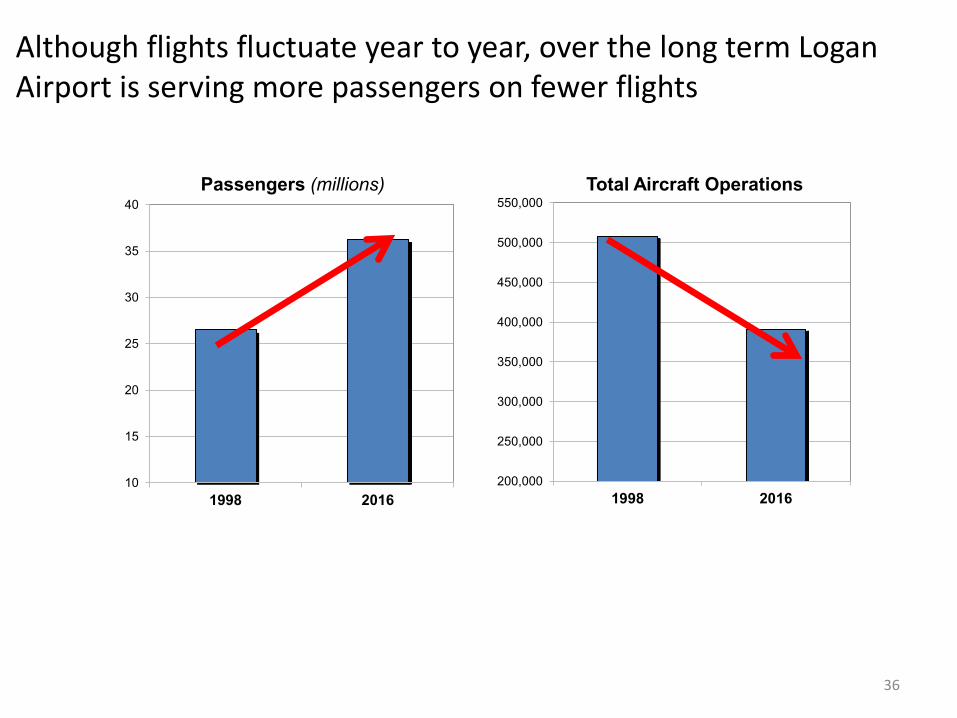
26.5
36.3
10
15
20
25
30
35
40
1998 2016
507,449
391,222
200,000
250,000
300,000
350,000
400,000
450,000
500,000
550,000
1998 2016
Passengers (millions) Total Aircraft Operations
Although flights fluctuate year to year, over the long term Logan
Airport is serving more passengers on fewer flights
36
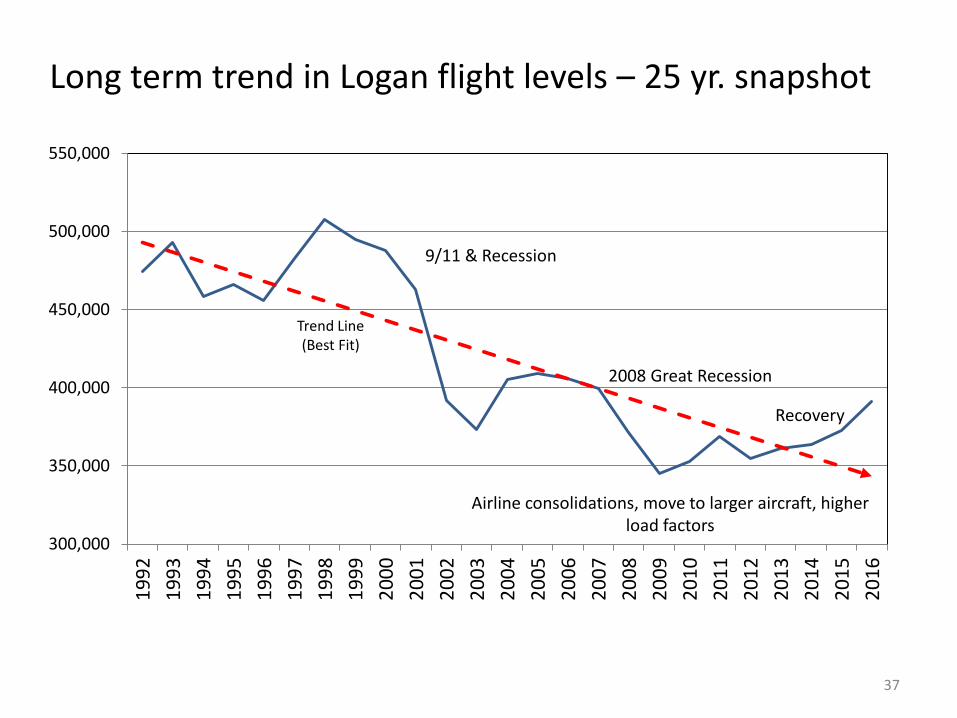
Long term trend in Logan flight levels – 25 yr. snapshot
300,000
350,000
400,000
450,000
500,000
550,0001
99
2
19
93
19
94
19
95
19
96
19
97
19
98
19
99
20
00
20
01
20
02
20
03
20
04
20
05
20
06
20
07
20
08
20
09
20
10
20
11
20
12
20
13
20
14
20
15
20
16
Recovery
Trend Line
(Best Fit)
9/11 & Recession
2008 Great Recession
Airline consolidations, move to larger aircraft, higher
load factors
37

Passenger demand is highly correlated to economic
conditions and other socio-economic factors
-18%
-9%
8%
9/11 & Recession 2008 Recession 2015 to 2016
-20%
-15%
-10%
-5%
0%
5%
10%
Change to Logan Passengers
38

Because of Logan’s urban location, Massport has
developed a comprehensive noise abatement program.
• Noise abatement departure
procedures
• Late night opposite direction
operations
• Decibel restriction on R4L
departures and 22R arrivals
• Unidirectional/Wind restriction use
R14/32
• Residential and School
Soundproofing Program
• Engine run-up restrictions
– Limited time
– Specific locations
• Encourage use of single engine
taxiing and reverse thrust
• 24/7 noise complaint line 617-561-
3333
• State of the art Noise Monitoring
System
• Near live flight tracking on website – http://www.massport.com/environment/environmental_re
porting/Noise%20Abatement/overview.aspx
39
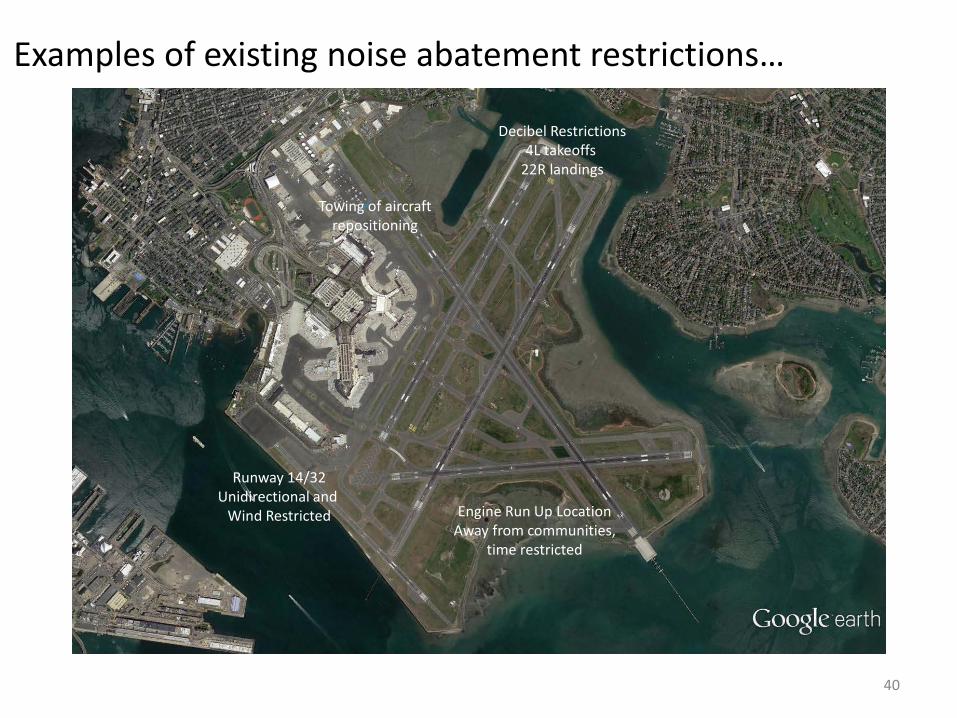
Examples of existing noise abatement restrictions…
Engine Run Up Location
Away from communities,
time restricted
Runway 14/32
Unidirectional and
Wind Restricted
Decibel Restrictions
4L takeoffs
22R landings
Towing of aircraft
repositioning
40

Examples of existing noise abatement procedures benefiting
communities. But these may impact other communities…
• R22R and R22L are primary SW
departure runways
• Peak use is during summer
periods
• 2nd busiest departure runway
flow in 2016, 29% of all
departures or about 48,000 jet
flights
• Implemented in the early 1980s
41
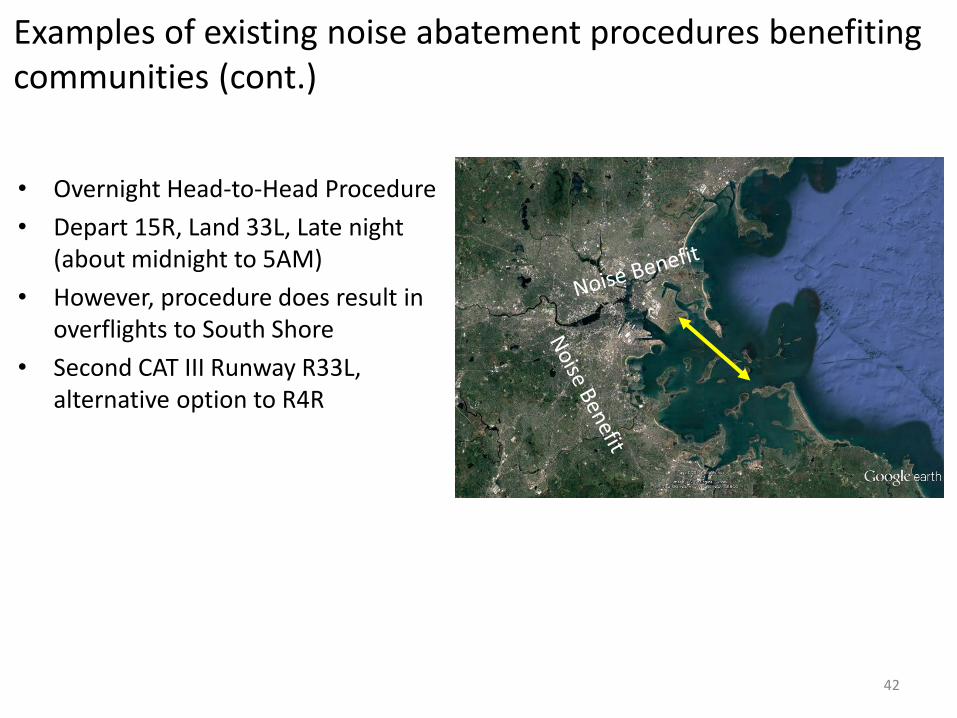
Examples of existing noise abatement procedures benefiting
communities (cont.)
• Overnight Head-to-Head Procedure
• Depart 15R, Land 33L, Late night
(about midnight to 5AM)
• However, procedure does result in
overflights to South Shore
• Second CAT III Runway R33L,
alternative option to R4R
42
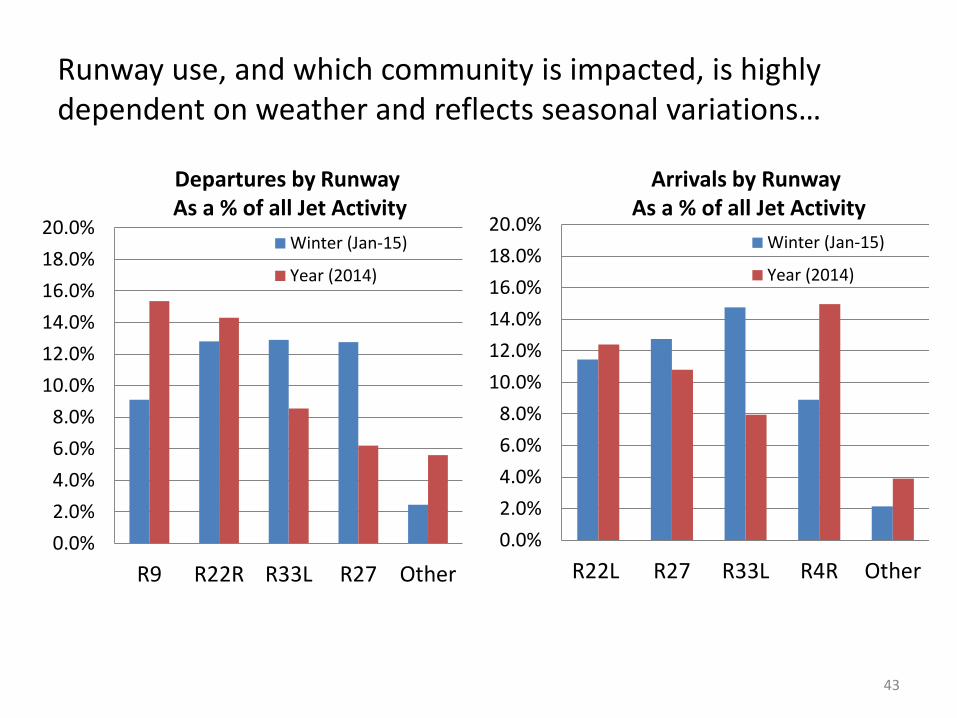
Runway use, and which community is impacted, is highly
dependent on weather and reflects seasonal variations…
0.0%
2.0%
4.0%
6.0%
8.0%
10.0%
12.0%
14.0%
16.0%
18.0%
20.0%
R9 R22R R33L R27 Other
Winter (Jan-15)
Year (2014)
Departures by Runway As a % of all Jet Activity
0.0%
2.0%
4.0%
6.0%
8.0%
10.0%
12.0%
14.0%
16.0%
18.0%
20.0%
R22L R27 R33L R4R Other
Winter (Jan-15)
Year (2014)
Arrivals by Runway As a % of all Jet Activity
43
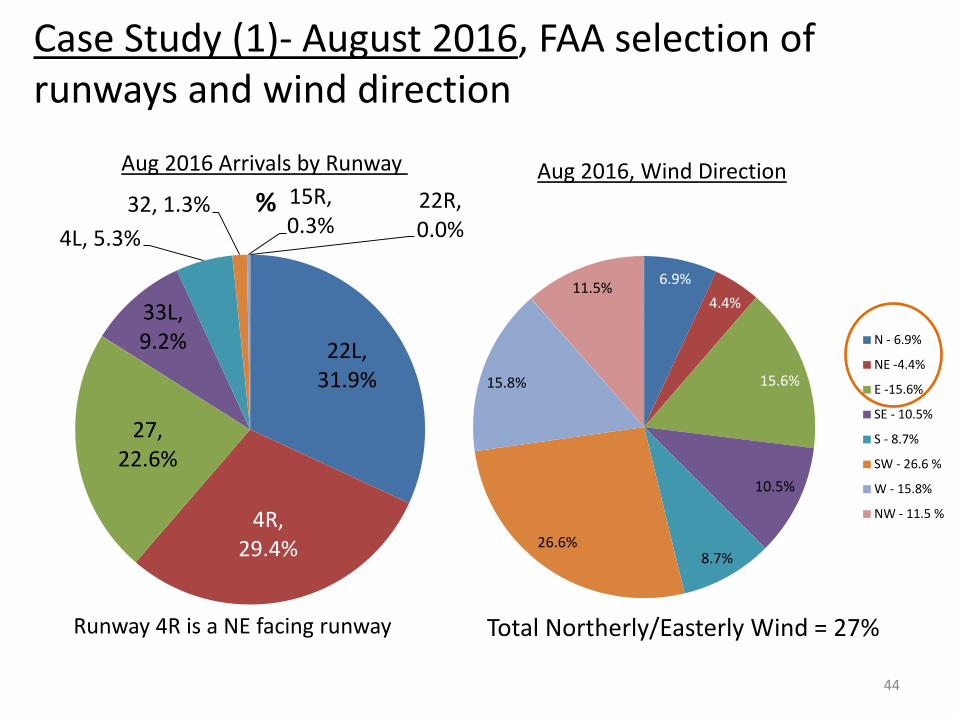
Case Study (1)- August 2016, FAA selection of
runways and wind direction
22L,
31.9%
4R,
29.4%
27,
22.6%
33L,
9.2%
4L, 5.3%
32, 1.3% 15R,
0.3%
22R,
0.0%
% Aug 2016 Arrivals by Runway
6.9%
4.4%
15.6%
10.5%
8.7% 26.6%
15.8%
11.5%
N - 6.9%
NE -4.4%
E -15.6%
SE - 10.5%
S - 8.7%
SW - 26.6 %
W - 15.8%
NW - 11.5 %
Total Northerly/Easterly Wind = 27%
Aug 2016, Wind Direction
Runway 4R is a NE facing runway
44
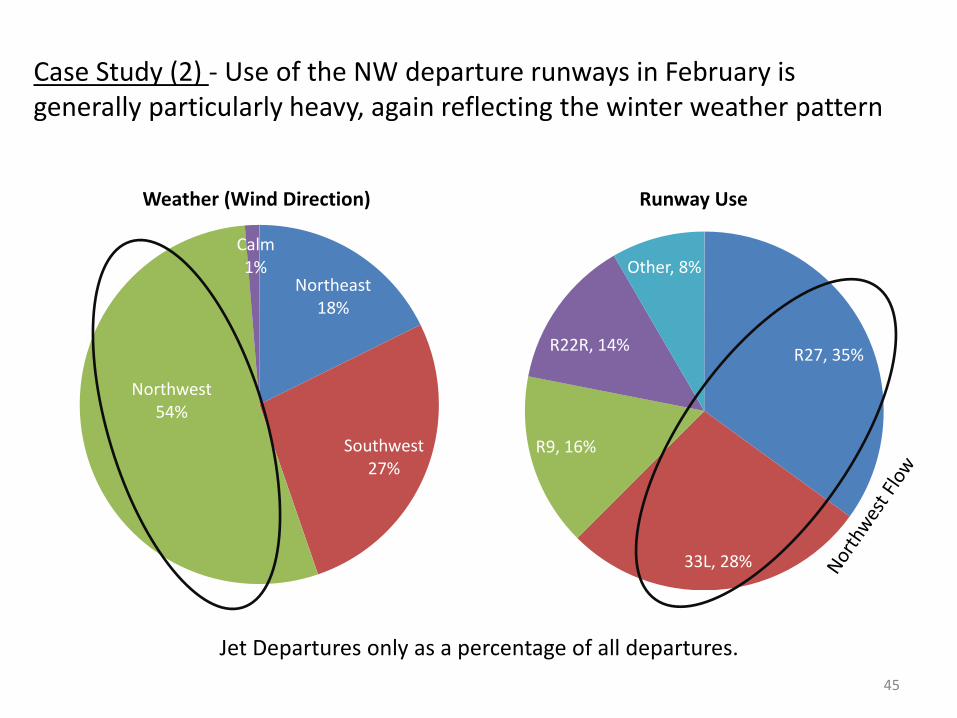
Case Study (2) - Use of the NW departure runways in February is
generally particularly heavy, again reflecting the winter weather pattern
R27, 35%
33L, 28%
R9, 16%
R22R, 14%
Other, 8%
Runway Use
Northeast
18%
Southwest
27%
Northwest
54%
Calm
1%
Weather (Wind Direction)
Jet Departures only as a percentage of all departures.
45
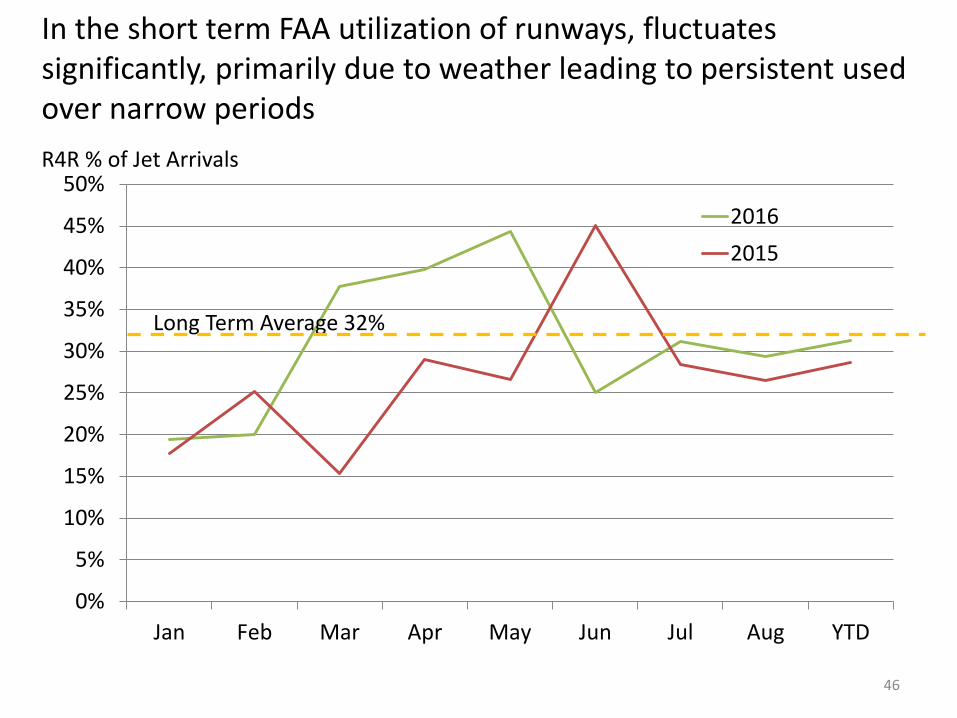
In the short term FAA utilization of runways, fluctuates
significantly, primarily due to weather leading to persistent used
over narrow periods
0%
5%
10%
15%
20%
25%
30%
35%
40%
45%
50%
Jan Feb Mar Apr May Jun Jul Aug YTD
2016
2015
R4R % of Jet Arrivals
Long Term Average 32%
46

Over the long term, FAA’s relative use of some runways has
not changed dramatically (example R4R arrivals)…
Source: Massport, jet activity. 2016
Boston Logan RW4R Arrivals Historical Usage Year Number of Arrivals Percentage of Arrivals
1998 58,996 41%
2006 44,874 30%
2007 47,917 30%
2008 44,876 30%
2009 43,142 31%
2010 40,698 28%
2011 54,395 36%
2012 48,838 34%
2013 42,838 29%
2014 45,072 30%
2015 45,461 29%
2016 51,858 31%
Long Term Average 47,413 32%
47
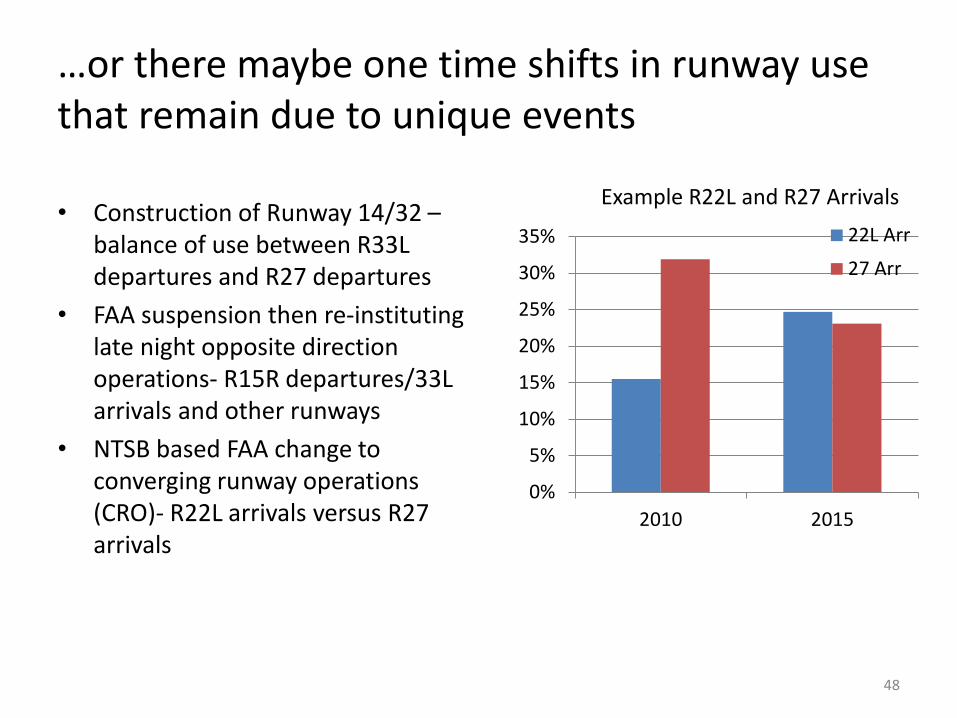
…or there maybe one time shifts in runway use
that remain due to unique events
• Construction of Runway 14/32 –
balance of use between R33L
departures and R27 departures
• FAA suspension then re-instituting
late night opposite direction
operations- R15R departures/33L
arrivals and other runways
• NTSB based FAA change to
converging runway operations
(CRO)- R22L arrivals versus R27
arrivals
0%
5%
10%
15%
20%
25%
30%
35%
2010 2015
22L Arr
27 Arr
Example R22L and R27 Arrivals
48
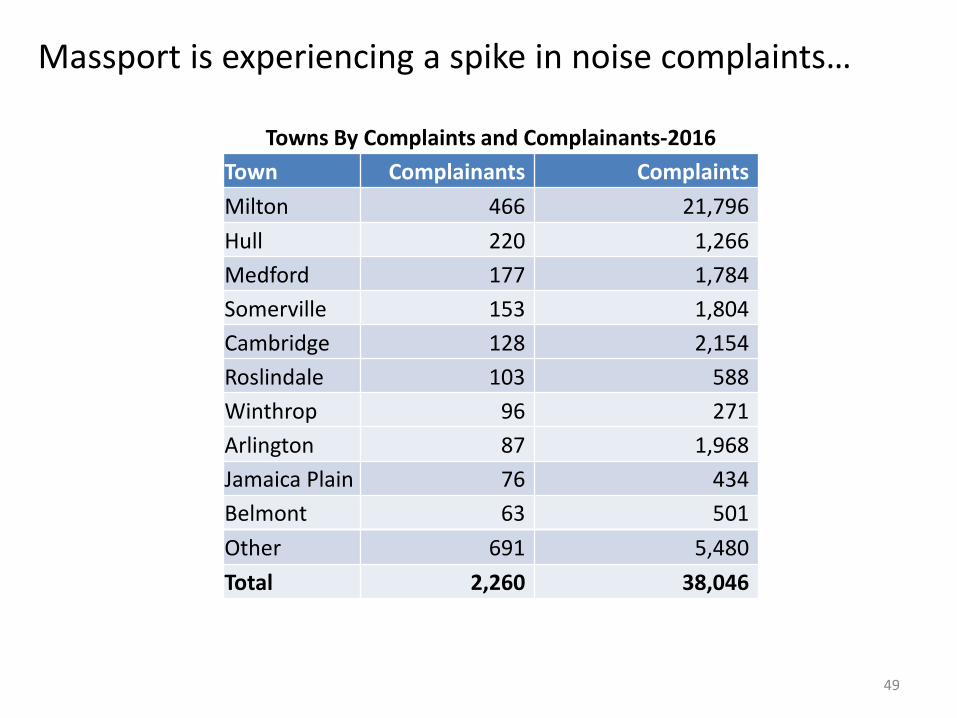
Towns By Complaints and Complainants-2016 Town Complainants Complaints Milton 466 21,796
Hull 220 1,266
Medford 177 1,784
Somerville 153 1,804
Cambridge 128 2,154
Roslindale 103 588
Winthrop 96 271
Arlington 87 1,968
Jamaica Plain 76 434
Belmont 63 501
Other 691 5,480
Total 2,260 38,046
Massport is experiencing a spike in noise complaints…
49
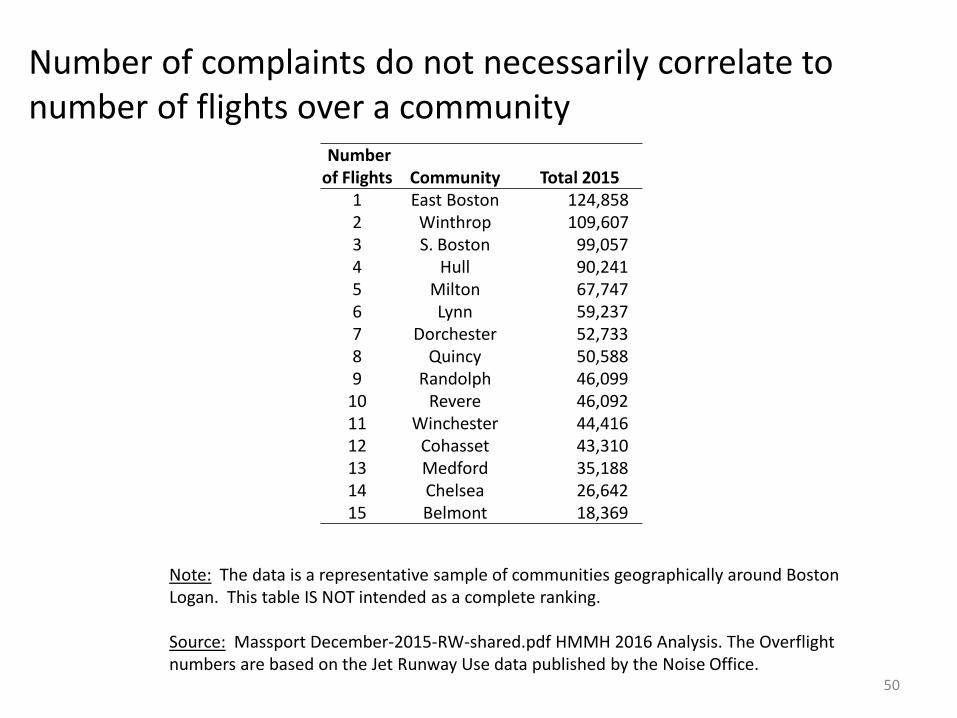
Number of complaints do not necessarily correlate to
number of flights over a community
Number of Flights Community Total 2015
1 East Boston 124,858
2 Winthrop 109,607
3 S. Boston 99,057
4 Hull 90,241
5 Milton 67,747
6 Lynn 59,237
7 Dorchester 52,733
8 Quincy 50,588
9 Randolph 46,099
10 Revere 46,092
11 Winchester 44,416
12 Cohasset 43,310
13 Medford 35,188
14 Chelsea 26,642
15 Belmont 18,369
Note: The data is a representative sample of communities geographically around Boston
Logan. This table IS NOT intended as a complete ranking.
Source: Massport December-2015-RW-shared.pdf HMMH 2016 Analysis. The Overflight
numbers are based on the Jet Runway Use data published by the Noise Office.
50

…or altitude…
Altitude Range Community Aircraft Altitude
Ranges (ft)
1 East Boston 250' - 1,000'
2 Winthrop 350' - 1,000'
3 S. Boston 400’-1,500’
4 Chelsea 450’-2,000’
5 Revere 500’-7,500’
6 Dorchester 700' - 4,000'
7 Quincy 800' - 3,000'
8 Hull 1,500’- 8,000’
8 Medford 1,500' - 9,000'
8 Lynn 1,500’-12,000’
8 Milton 1,500’-12,000’
9 Winchester 2,000' - 12,000'
11 Cohasset 2,500' - 12,000'
12 Randolph 2,500' - 12,000'
13 Belmont 3,500 - 11,000'
Note: The data is a representative sample of communities geographically around Boston
Logan. This table IS NOT intended as a complete ranking.
Source: October 2015 Radar Data HMMH 2016 Analysis. October 2015 radar data was
evaluated over each community to get the ranges. 51
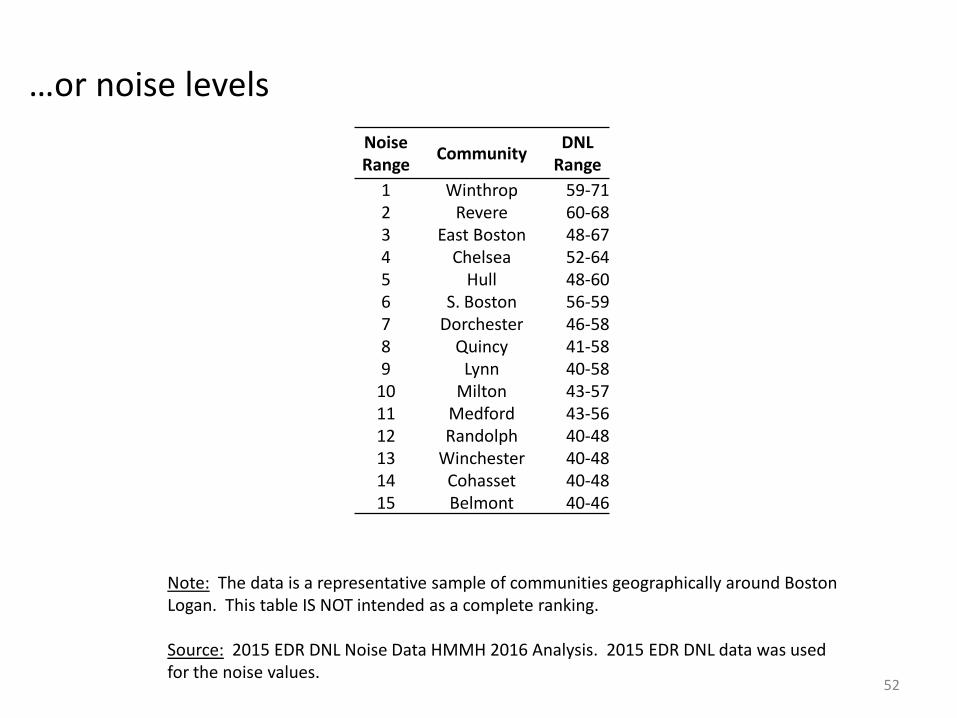
…or noise levels
Noise Range Community DNL
Range 1 Winthrop 59-71
2 Revere 60-68
3 East Boston 48-67
4 Chelsea 52-64
5 Hull 48-60
6 S. Boston 56-59
7 Dorchester 46-58
8 Quincy 41-58
9 Lynn 40-58
10 Milton 43-57
11 Medford 43-56
12 Randolph 40-48
13 Winchester 40-48
14 Cohasset 40-48
15 Belmont 40-46
Note: The data is a representative sample of communities geographically around Boston
Logan. This table IS NOT intended as a complete ranking.
Source: 2015 EDR DNL Noise Data HMMH 2016 Analysis. 2015 EDR DNL data was used
for the noise values. 52
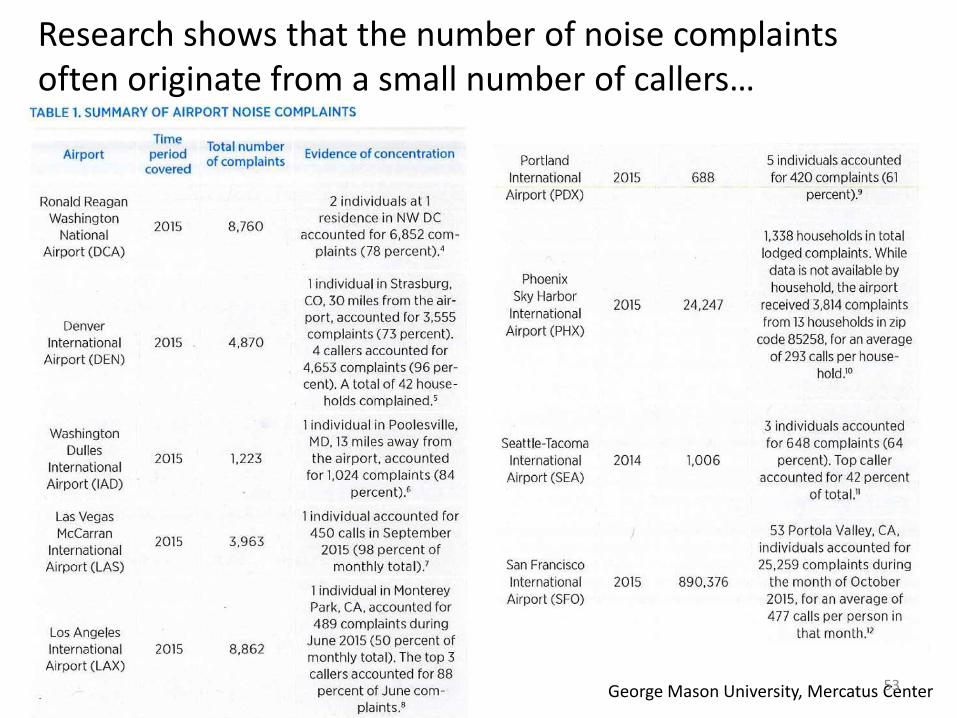
Research shows that the number of noise complaints
often originate from a small number of callers…
George Mason University, Mercatus Center 53
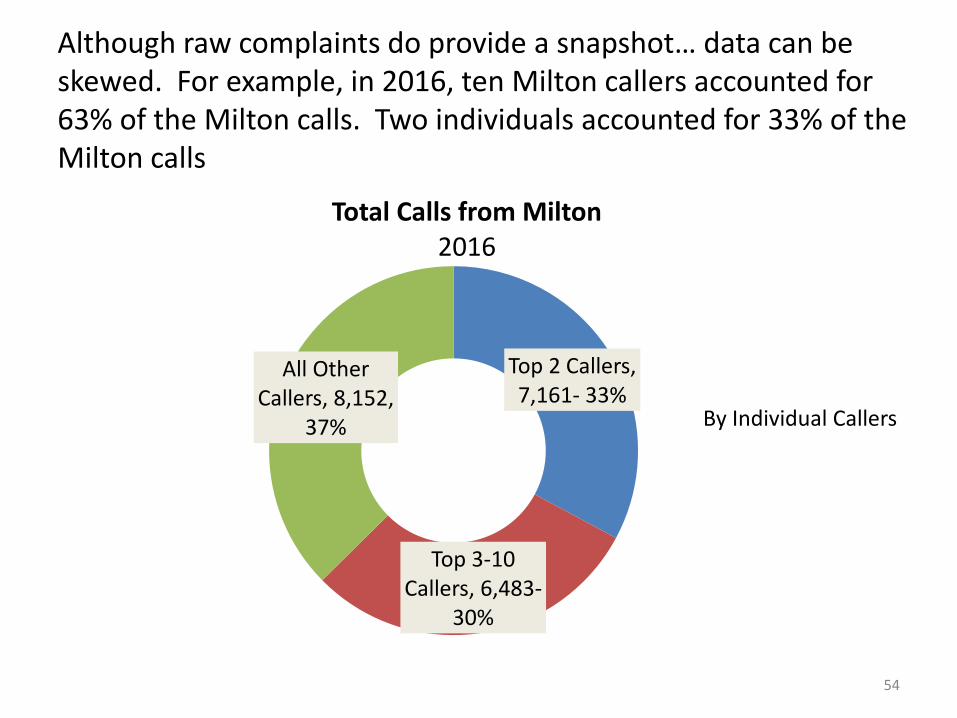
Although raw complaints do provide a snapshot… data can be
skewed. For example, in 2016, ten Milton callers accounted for
63% of the Milton calls. Two individuals accounted for 33% of the
Milton calls
Top 2 Callers,
7,161- 33%
Top 3-10
Callers, 6,483-
30%
All Other
Callers, 8,152,
37%
Total Calls from Milton 2016
By Individual Callers
54