boron in glass determination using wdxrf - icdd · boron in glass determination using wdxrf...
TRANSCRIPT
BORON IN GLASS DETERMINATION USING WDXRF
Alexander Seyfarth
Bruker AXS Inc., 5465 East Cheryl Parkway, Madison, Wisconsin 53711-5373
ABSTRACT
The application of wavelength-dispersive XRF to the analysis of boron in glass is reviewed with respect to physical, instrumental, calibration, and maintenance considerations. Advances in XRF instrumentation have enabled improvement in the analysis of boron. Reduced window thickness and high-current capabilities of X-ray tubes, as well as new analyzer crystals, produce a higher intensity boron signal. With correct determination of background and matrix interferences for successful quantification, only the sample itself limits the analysis. Observed boron migration in some glasses needs to be understood in order to establish stable, routine quantification in a process environment.
INTRODUCTION
Boron is an important component of glass. It exerts a strong influence on the viscosity of the melt, imparting a beneficial effect to the chemical resistance and lowering the expansion coefficient of the finished article. Boron is widely used in the production of “E” type glasses (7 wt%), neutral glass for pharmaceutical applications (7 to 11 wt%), and Pyrex®-type borosilicate glasses (13 wt%).
Because of the high volatility of boron in the melting furnace, a very accurate procedure is needed to meet the strict boron concentration specifications required for the finished product and to permit any necessary batch adjustment to be implemented almost in real time. XRF is well suited for glass analyses. Since the 1980s, XRF has been the method of choice because of its ease of sample preparation and rapid results. In the production control of soda-lime glass, the technique has already replaced wet chemical techniques because of its high precision and fast measurement time. Boron, being a very light element, poses challenges to the analyst as well as to the instrument. Demand for boron analysis in the glass industry prompted the development of new generation wavelength-dispersive X-ray fluorescence (WDXRF) spectrometers.
ASPECTS OF THE ANALYSIS OF BORON
To put the difficulty of the analysis of boron in glass into perspective, consider its physical and chemical properties [1–3]. Physical data for boron is given in Table I.
Table I. Physical data for boron.
Atomic number (Z) K shell absorption
edge (eV) Kα radiation (eV) Mass absorption
coefficient µλ (cm2/g) Fluorescence yield
(Ω) 5 192 183 3,350 1.25 × 10⁻⁴
Boron’s low atomic number and low K-shell energy cause various issues for XRF analysis which will be addressed further.
269Copyright ©JCPDS-International Centre for Diffraction Data 2008 ISSN 1097-0002Advances in X-ray Analysis, Volume 51

This document was presented at the Denver X-ray Conference (DXC) on Applications of X-ray Analysis. Sponsored by the International Centre for Diffraction Data (ICDD). This document is provided by ICDD in cooperation with the authors and presenters of the DXC for the express purpose of educating the scientific community. All copyrights for the document are retained by ICDD. Usage is restricted for the purposes of education and scientific research. DXC Website – www.dxcicdd.com
ICDD Website - www.icdd.com
Advances in X-ray Analysis, Volume 51

EXCITATION AND FLUORESCENCE YIELD The emitted intensity, IB-Kα, of the characteristic fluorescence radiation is governed by the overlap of the excitation spectrum and the absorption coefficient µλ of boron [4]. Absorption by the tube window cuts off the low energy (long wavelength) part of the excitation tube spectrum. Because of this, boron is excited with the primary X-ray continuum and the rhodium L lines. For optimum primary continuum, the tube window must be as thin as possible. Currently window thicknesses range from 150 to 30 µm; 75 µm has become the industry standard since it balances price, performance, and durability. Fluorescence yield is another important factor in the analysis of boron. Fluorescence yield is proportional to Z4 and is therefore close to zero for low atomic number elements. Using the highest available tube current at the lowest possible voltage, the emission of boron photons from the sample can be optimized. Starting in 1988, the possible settings for tube current have increased from 100 mA to today’s maximum of 170 mA [Siemens SRS 303 (1988) to Bruker S8 TIGER 4 kW (2006)].
Figure 1. Comparison of boron intensity in 3 kW and 4 kW WDXRF systems.
As can be seen in Figure 1, 40% greater boron intensity was obtained from a boronphosphosilicate glass (BPSG) sample (4 wt% B) analyzed on a 4 kW instrument in 1999 than a 3 kW instrument in 1988 [SRS 3000 with 75 µm end window X-ray tube and 3 and 4 kW generator (1999)].
270Copyright ©JCPDS-International Centre for Diffraction Data 2008 ISSN 1097-0002Advances in X-ray Analysis, Volume 51

ANALYZED LAYER, SAMPLE PREPARATION, AND X-RAY BEAM PATH Because the energy of boron Kα radiation is so low (183 eV), only a thin 0.6 µm (600 nm) surface layer of the sample can be analyzed. The density and composition of the glass can, in some cases, reduce this down to 200 nm. The glass samples to be analyzed must therefore be prepared with a good surface finish. Mellott compiled and investigated the surface roughnesses of commercial glasses using Atomic Force Microscopy (AFM) and found that many are in the range from 2 to 0.2 nm [5]. Quantitative boron analysis on non-polished glasses was much less accurate and repeatable than on the same polished material (private communication in 2004 with Brian Simpkins, Alcan Packaging, formerly Wheaton Glass, Millville, New Jersey). Reducing the path length of the X-ray beam (tube-to-sample and sample-to-detector) and using thin-window flow proportional detectors, combined with a controlled vacuum of better than 0.1 mbar, enables higher yield of detected boron radiation. Comparing the published sensitivities from a 1998 dual-turret spectrometer with those from a direct-loading S4-type system using the same X-ray tube, the type of generator shows a substantial effect, attributable to the optimized beam path and window design [6–8]. Changes in the vacuum during the measurement affect the count rate of the detected boron and needs to be taken into consideration for those systems that have large sample compartments (e.g., dual-turret systems). In contrast, direct-loading systems can usually achieve a stable vacuum without changeover during the whole measurement period. These direct-loading systems feature pressure-controlled sample introduction. Measurement is started only when the pressure in the sample compartment reaches a certain level, resulting in constant pressure and higher, more stable count rates for boron. ANALYZER CRYSTALS
Ricardo et al. showed in 2001 that with a new type of patented multilayer detector crystal, the boron signal can be raised by 28% [9]. The XS-B™ crystal depicted in Figure 2 is a LaB4C multilayer and is available from Incoatec GmbH (Gesthacht, Germany). Schuster et al. performed a feasibility study for the analysis of boron in a coating of BPSG, a common semiconductor material, in 1987 [10]. Using a WDXRF system equipped with a 125 µm end-window X-ray tube, 80 mA tube current, and early multilayer crystal (OVO 160), he
obtained a sensitivity of 2.7 counts/s per wt% B. The detection limit was reported to be 0.04 wt% for 600 s measurement time.
Figure 2. Comparison of boron intensity collected with a traditional crystal versus multilayer crystal.
271Copyright ©JCPDS-International Centre for Diffraction Data 2008 ISSN 1097-0002Advances in X-ray Analysis, Volume 51

Using a 200 Å Mo-B4C multilayer crystal (OVO-B) and an S4 Series WDXRF system optimized for beam path, Mauser achieved a detection limit of 0.02 wt % B in 100 s and a sensitivity of 330 counts/s per wt% B on the same type of material [7]. Using the XS-B multilayer crystal on the same S4 instrument further improved the sensitivity to 420 counts/s per wt% B as was shown by Behrens in 2004 [11]. CHOICE OF COLLIMATORS AND BACKGROUND POSITIONS Multilayer crystals produce wide peak profiles and should be used with coarse collimators. The rule of thumb in WDXRF is to use the coarsest collimator for the lightest element detection. Since achieving a high count rate is paramount for the analysis, peak resolution and interference corrections are not an issue. This holds true for BPSG, but in order to create a meaningful wider-range calibration for commercial borosilicate and E glass as well, count rate needs to be balanced against resolution [12].
Ca and K Ll lines, as well as Ca Ln and Zr M lines, should be separated as shown in Figure 3. The effect of higher order reflections of O cannot be reduced much by using pulse height discrimination and needs to be minimized by collimation. With Ca and Zr present in the analyzed material, the selection of background positions becomes difficult. The approach from Feather and Willis is particularly useful in this regard, as it can be used to perform interference correction on the background [13]. CALIBRATION APPROACH Obtaining a sufficient number of glass standards, as well as including enough samples to perform the interference corrections needed, pose the biggest challenge to the analyst.
The quality of the boron certification by Manitol-based volumetric means is very much dependent on the experience of the analyst with that methodology. Few commercial labs now offer Manitol-based boron analysis. Inductively coupled plasma (ICP) methods are increasingly being offered instead, but these methods are time- and cost-prohibitive because of the requirement for sample digestion. Few glass samples of defined boron composition are commercially available. Many borosilicate glass samples, such as those available from Breitlaender GmbH (Hamm, Germany), are just pre-melt batch and not chemically certified. Borosilicate glass suppliers are the best source of sample material. They can produce a range of experimental matrix for the calibration based on past batch-melt samples. A comparison and discussion of the quality of certification techniques for boron in glass is unfortunately absent from the literature.
<21.778 61.978>Y : 0 to 2.260 KCps
Si LB/ S Ll Ln Ca
O (3) Zr MzK Ll, Ca Ll
Cl Ll, B KA1
Figure 3. Interference on and around the boron K signal.
272Copyright ©JCPDS-International Centre for Diffraction Data 2008 ISSN 1097-0002Advances in X-ray Analysis, Volume 51
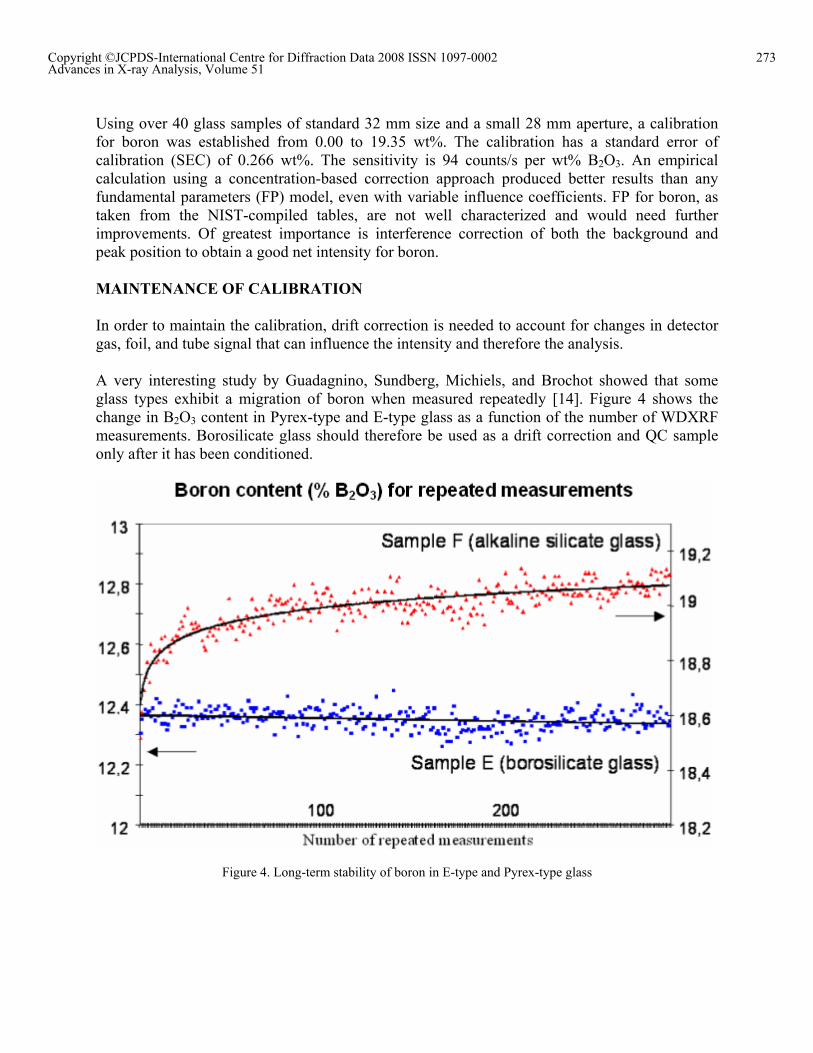
Using over 40 glass samples of standard 32 mm size and a small 28 mm aperture, a calibration for boron was established from 0.00 to 19.35 wt%. The calibration has a standard error of calibration (SEC) of 0.266 wt%. The sensitivity is 94 counts/s per wt% B2O3. An empirical calculation using a concentration-based correction approach produced better results than any fundamental parameters (FP) model, even with variable influence coefficients. FP for boron, as taken from the NIST-compiled tables, are not well characterized and would need further improvements. Of greatest importance is interference correction of both the background and peak position to obtain a good net intensity for boron. MAINTENANCE OF CALIBRATION In order to maintain the calibration, drift correction is needed to account for changes in detector gas, foil, and tube signal that can influence the intensity and therefore the analysis. A very interesting study by Guadagnino, Sundberg, Michiels, and Brochot showed that some glass types exhibit a migration of boron when measured repeatedly [14]. Figure 4 shows the change in B2O3 content in Pyrex-type and E-type glass as a function of the number of WDXRF measurements. Borosilicate glass should therefore be used as a drift correction and QC sample only after it has been conditioned.
Figure 4. Long-term stability of boron in E-type and Pyrex-type glass
273Copyright ©JCPDS-International Centre for Diffraction Data 2008 ISSN 1097-0002Advances in X-ray Analysis, Volume 51
CONCLUSION The analysis of boron in glass using WDXRF has dramatically improved since its first application as a process control tool in the late 1980s. Nevertheless, it is still one of the most challenging applications, since the analyst must gather enough reference material and optimize conditions to fit the spectrometer capabilities. The choice of the right collimator, background and peak counting positions, correct pulse height analysis settings, and interference correction method greatly influences the range and durability of the resulting calibration. Maintenance of the calibration and a daily check of the system and calibration need to take the stability of the glass standards into account. ACKNOWLEDGMENTS The author thanks Brian Simpkins (Alcan Packaging, formerly Wheaton Glass, Millville, New Jersey) for his time performing the scans and tests on the borosilicate glass samples, as well as for evaluating the XS-B and OVO-B crystals side-by-side in a process environment. Many thanks as well to my colleagues at Bruker AXS Larry Arias, Kai Behrens, Karl Mauser, and Karen Roscoe for contributing to the presentation and article. REFERENCES [1] Bearden, J. A. Rev. Mod. Phys. 1967, 39, 78–124. [2] Krause, M. O. J. Phys. Chem. Ref. Data 1979, 8, 307–327. [3] White, E. W.; Johnson Jr., G. G. X-ray Emission and Absorption Wavelengths and Two-
Theta Tables (ASTM Data Series DS 37A); American Society for Testing and Materials: Philadelphia, 1970.
[4] Shiraiwa, T.; Fujino, N. Jpn. J. Appl. Phys. 1966, 5, 886–899. [5] Mellott, N. P.; Brantley, S. L.; Hamilton, J. P.; Pantano, C. G. Surf. Interface Anal. 2001,
31, 362–368. [6] Mauser, K. E.; Uhlig, S. SRS 3400 Boron in BPSG. Bruker AXS GmbH Application Note,
1999. [7] Mauser, K. E. S4 PIONEER Boron in BPSG. Bruker AXS GmbH Application Note, 2002. [8] Buehler, A.; Seyfarth, A.; Schlotz, R. Introduction to XRF. Bruker AXS GmbH Training
Manual, 2000. [9] Ricardo, P.; Wiesmann, J.; Nowak, C.; Michaelsen, C.; Bormann, R. Appl. Opt. 2001, 40,
2747–2754. [10] Schuster, M.; Müller, L.; Mauser, K. E.; Straub, R. Thin Solid Films 1988, 157, 325–336. [11] Behrens, K. New Applications with the XS-B; S4 PIONEER. Bruker AXS GmbH
Application Note, 2004. [12] Uhlig, S.; Müller, L. Boron Analysis in Ceramic and Glass Industries using Wavelength
Dispersive X-ray Fluorescence Analysis. Siemens Analytical Application Notes 326, 1991. [13] Feather, C. E.; Willis, J. P. X-Ray Spectrom. 1976, 5, 41–48. [14] Guadagnino, E.; Sundberg, P.; Michiels, D.; Brochot, D. A collaborative study into the
determination of boron in glass using X-ray fluorescence (XRF) spectroscopy. ICG/TC2 report, 2006.
274Copyright ©JCPDS-International Centre for Diffraction Data 2008 ISSN 1097-0002Advances in X-ray Analysis, Volume 51