border to border – assessing the risks of an entire …
TRANSCRIPT

1
BORDER TO BORDER – ASSESSING THE RISKS OF AN ENTIRE COASTLINE
A Weir1, C Green1
1Australian CoastSafe, Surf Life Saving New South Wales, Belrose, NSW
Abstract An average of 92 people drown in Australian coastal waters every year. New South Wales (NSW) accounts for almost 50% of the national coastal drowning toll (Surf Life Saving Australia, 2013). There have been 340 coastal drowning deaths in NSW between July 2004 and June 2013 (Surf Life Saving NSW, 2013). Over 53% of these coastal drowning deaths can be attributed to swimming/wading (29.8%) and rock-fishing (23.4%), with almost all occurring at unpatrolled locations or outside of patrol operational times, where no expert assistance is immediately available (Surf Life Saving Australia, 2013). Australian CoastSafe is undertaking an ambitious project funded by the NSW Water Safety Black Spot Fund. ‘Project Blueprint’ is a coastal public safety risk assessment for every beach and rock platform in NSW. This project will play a key role in addressing the coastal drowning issue in NSW in the short, mid and long term. Over four years the project will cover 1,590 km of coastline, which includes 600km (38%) of rocky coastline and 990km of sandy coastline (62%). A total of 892 beaches will be assessed as part of the project. With the first year of the project completed and over 370 kilometres of coastline assessed there have been many lessons learned. This paper will detail the progress of the project and include summary findings, as well as discussing key issues that have had to be overcome, especially around community and stakeholder engagement. To date the Project Blueprint has assessed 270 locations, including 186 beaches and 96 rocky coast locations and in the process collected over 19,500 spatial data elements along the coast of NSW. All collected data is geocoded and can be analysed using Geographic Information Systems (GIS) and incorporated into mapping systems of land managers. The project is now entering its second year and will be covering the Local Government Areas of Pittwater, Warringah, Manly, Shoalhaven and Bega.
Introduction Over 85% of Australians live near the coast (ABS, 2004) and our tourist beaches alone receive an estimated 110 million visitations (Surf Safety & Rips Study, October 2009) every year. The vast coastline of Australia covers more than 35,877kms and when all islands are included the length increases to 59,736kms (Geoscience Australia, 2010). Most people living near the coast live in capital cities, as seven of these are situated on the coast. However, there has been rapid growth of coastal areas outside of Australia’s capital cities. The Australian Bureau of Statistics reported in the latest Year Book Australia (2012) that Australians are still heading to the coast, with many of Australia's coastal regions experiencing population gains.

Coastal regions are desirable places to live near and visit, yet these asupplemented by inherent, and up until recent years, unpredictable risk.years Surf Life Saving has saved over 500,000 lives at our beaches and continues to rescue more than 12,000 people every year. Since 1907, when a group of snetwork of services protecting our coastline has grown rapidly. Today, volunteer surf lifesavers, SLS and council employed lifeguards, rescue helicopters, rescue power craft, surveillance systems and radio control and coordination centres all work together to ensure that our beaches are the safest in the world. This collaborative approach to coastal safety is essential in preventing drowning along our coastline. Despite this extensive network of unacceptable levels. In 2012-Wales (Surf Life Saving NSW, 2013)coastal drowning deaths and the seventhere is significant work ahead of us Figure 1 NSW 2012 – 2013 Coastal Fatality Summ
Swimming (27%) and rock fishing drowning over the 2012 – 2013 seasonpeople who drowned over this season, 40 were male and 36 were Australian residents.
Of the 721 NSW beaches now identified by ABSAMP157 or 21.8% have a lifesaving service that is provided by the lifesaving clubs affiliated with SLSA and patrolled by lifeguard services provided by SLSA and local governments across Australia.
Coastal regions are desirable places to live near and visit, yet these asupplemented by inherent, and up until recent years, unpredictable risk. In the past 100 years Surf Life Saving has saved over 500,000 lives at our beaches and continues to rescue more than 12,000 people every year.
Since 1907, when a group of surf life saving clubs on Sydney’s beaches first emerged, the network of services protecting our coastline has grown rapidly. Today, volunteer surf lifesavers, SLS and council employed lifeguards, rescue helicopters, rescue power craft,
and radio control and coordination centres all work together to ensure that our beaches are the safest in the world. This collaborative approach to coastal safety is essential in preventing drowning along our coastline.
Despite this extensive network of services, coastal drowning deaths are still- 2013, there were 48 coastal drowning deaths in New South
(Surf Life Saving NSW, 2013), which is one higher than the previous yearand the seven-year average of 34. These statistics show
there is significant work ahead of us – every life lost is one life too many.
2013 Coastal Fatality Summary (n=48) (Surf Life Saving NSW, 2013)
and rock fishing (17%) were the leading activities resulting in coastal 2013 season, while the cause of 17% is unknown. Of the 48
people who drowned over this season, 40 were male and 36 were Australian residents.
beaches now identified by ABSAMP (Short, 2007), only approximately have a lifesaving service that is provided by the lifesaving clubs affiliated
with SLSA and patrolled by lifeguard services provided by SLSA and local governments
2
Coastal regions are desirable places to live near and visit, yet these areas are In the past 100
years Surf Life Saving has saved over 500,000 lives at our beaches and continues to
urf life saving clubs on Sydney’s beaches first emerged, the network of services protecting our coastline has grown rapidly. Today, volunteer surf lifesavers, SLS and council employed lifeguards, rescue helicopters, rescue power craft,
and radio control and coordination centres all work together to ensure that our beaches are the safest in the world. This collaborative approach to coastal
services, coastal drowning deaths are still at coastal drowning deaths in New South
higher than the previous year’s 47 34. These statistics show that
(Surf Life Saving NSW,
resulting in coastal , while the cause of 17% is unknown. Of the 48
people who drowned over this season, 40 were male and 36 were Australian residents.
, only approximately have a lifesaving service that is provided by the lifesaving clubs affiliated
with SLSA and patrolled by lifeguard services provided by SLSA and local governments

3
Surf Life Saving’s Australian CoastSafe continues to address the following issues:
• The risk of drowning (fatal and non-fatal) on the coast has many contributing factors.
• Risk management concepts of hazard, uncertainty and opportunity based risk collectively provide opportunities for drowning prevention
• Despite ongoing efforts, coastal drowning continues at unacceptable levels.
• SLS has many systems in place to collect, analyse and communicate information.
• Maintaining this information is very resource intensive. In order to address these issues, Surf Life Saving has developed a suite of innovative low cost, location based tools. These tools are used for a range of applications including, public education, data collection, event risk management and coastal public safety risk assessment.
Background ABSAMP Surf Life Saving Australia’s Coastal Public Safety Risk Assessment Program originated in 1986 following a meeting between Andrew May (SLSNSW), Angus Gordon (NSW PWD), Prof. Bruce Thom and Prof. Andrew Short. Surf Life Saving New South Wales (SLSNSW) initiated the meeting to establish the best approach for compiling a database of beaches in NSW and a means for assessing their safety (Short, 1993). Initially, this resulted in the formation of the NSW Beach Safety Program, a joint venture between the Coastal Studies Unit of the University of Sydney and SLSNSW. The success of this program eventually led to the formation of the Australian Beach Safety and Management Program (ABSAMP) and the expansion and development of a national database containing information on the geomorphology and safety of all Australian coastal beaches (Short, 1993). The main aims of the program are to:
• Develop a comprehensive, standardised and scientific information base on all Australian beaches with regard to their location, physical characteristics, access, facilities, usage, rescues, physical and biological hazards, and level of public risk under various wave, tide and weather conditions.
• Expand and improve the management and safety services of all Australian beaches, and to assist other countries to develop similar programs.
The ABSAMP database currently contains comprehensive data on over 11,500 beaches around Australia. ABSAMP integrates the science of beaches, their hazards and usage, together with the expertise in beach safety management and resources of SLSA, utilising the latest technology for data management and analysis. The program has already had wide application and impact on the management of Australian beach systems, and will play an increasing role in their management into the next century, particularly as growing coastal development, population and tourism all demand accessible, yet safe, beaches for public recreation and tourism.

4
The resulting database and beach models and classification system (Short, 2007) form the foundation of Surf Life Saving Australia’s Coastal Public Safety Risk Management Program. Used in conjunction with the international standard for risk management (ISO 31000:2009 - Risk Management: Principles and Guidelines) and other relevant industry compliance standards and guidelines, the program provides Surf Life Saving with an internationally recognised scientific core system for the management and understanding of risks to public safety and the management of these risks around the Australian coast. Australian CoastSafe Project Blueprint is being delivered by Australian CoastSafe as the leading coastal public safety risk management authority in Australia. Australian CoastSafe is the strategic and intelligence beach safety unit of Surf Life Saving Australia (SLSA). The unit was developed to gather data on all beaches around Australia and establish a framework to deliver a safer aquatic environment. CoastSafe provides support for surf lifesavers and lifeguards, but even more practically, offers cost-effective benefits to all levels of government, private developers and the tourism industry to reduce the risk of injury or death around the coast.
Project Blueprint Surf Life Saving NSW received funding through the NSW Ministry of Police and Emergency Services through its Water Safety Black Spot Fund to conduct a coastal public safety risk assessment for every beach and rock platform in NSW. Over four years the project will aim to cover 1,590 km of coastline, which includes 600km (38%) of rocky coastline and 990km of sandy coastline (62%). An estimated total of 892 locations will be assessed as part of the project. This statewide drowning prevention project, known as ‘Project Blueprint’, will be fundamental in addressing the coastal drowning issue in NSW in the short, mid and long term. The outcomes will include evidence based drowning prevention treatment options to stakeholders and government, both at a local, regional and state level. Ultimately, the project will provide a long-term, sustainable and effective drowning prevention strategy with the application of effective risk mitigation and drowning prevention initiatives to meet the National/State goal to reduce drowning deaths by 50% by 2020.

5
Figure 2: Project Blueprint - NSW local government areas scheduled for assessment
over the four year project period
6
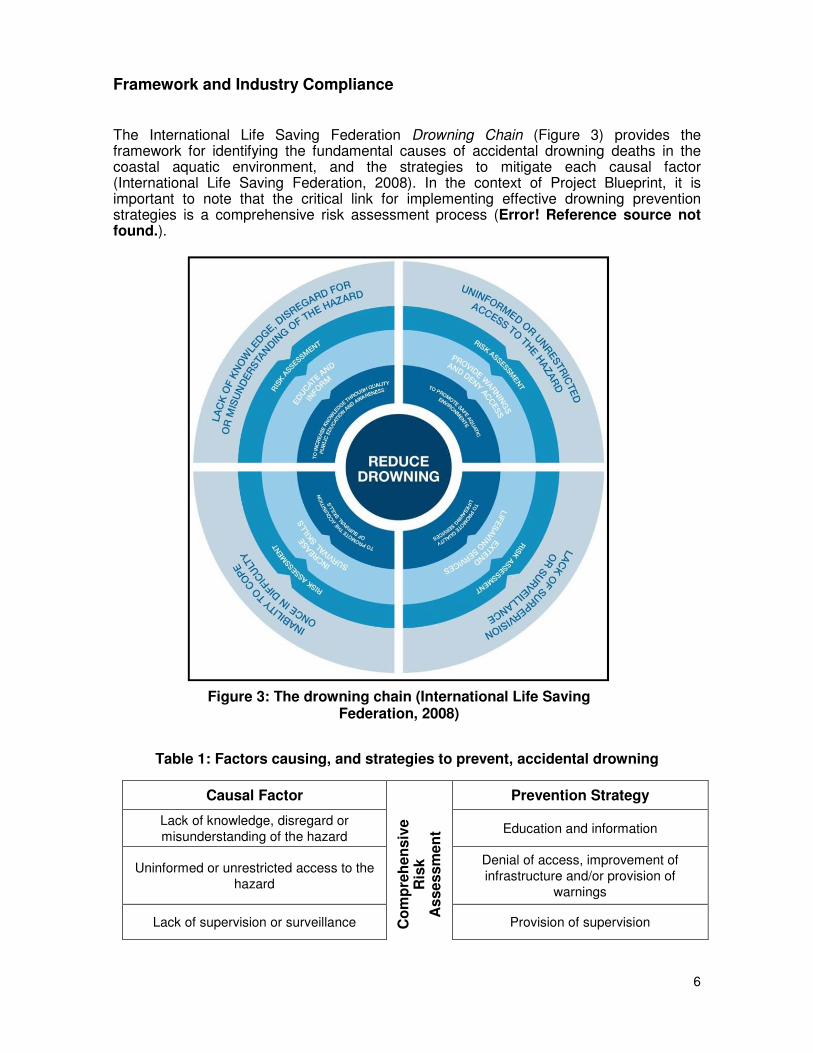
Framework and Industry Compliance The International Life Saving Federation Drowning Chain (Figure 3) provides the framework for identifying the fundamental causes of accidental drowning deaths in the coastal aquatic environment, and the strategies to mitigate each causal factor (International Life Saving Federation, 2008). In the context of Project Blueprint, it is important to note that the critical link for implementing effective drowning prevention strategies is a comprehensive risk assessment process (Error! Reference source not found.).
Table 1: Factors causing, and strategies to prevent, accidental drowning
Causal Factor Prevention Strategy
Lack of knowledge, disregard or
misunderstanding of the hazard
Co
mp
reh
en
siv
e
Ris
k
Assessm
en
t Education and information
Uninformed or unrestricted access to the
hazard
Denial of access, improvement of
infrastructure and/or provision of
warnings
Lack of supervision or surveillance Provision of supervision
Figure 3: The drowning chain (International Life Saving Federation, 2008)

An inability to cope once in difficulty
Project Blueprint utilises the SLSA CoastSafe Aquatic Public Safety Risk Assessment methodology, which is endorsed by the International Life Saving Federation conducted to the following standards:
• AS/NZS ISO 31000:2009
• AS2416:2010 Water Safety Signs and Beach Safety Flags
• AS2899:1986 Public Information Symbols Part 1 and 2
• AS2342:1992 Development, Testing and Implementing of Information and Safety Symbols and Symbolic Signs
• ISO9001:2000 Quality Management
All SLSA CoastSafe Assessors have attained the SLSA Certificate in Coastal Public Safety Risk Assessment. This qualification includes the following unitsthe Diploma of Quality Auditing:
• BSBOHS509A Ensure a Safe Workplace
• BSBOHS505B Manage Hazards in the Workplace
• BSBRSK501A Manage Risk
• BSBCOM501B Identify and interpret compliance requirements
Figure 4 The AS/NZS ISO 31000:2009
lity to cope once in difficulty
Acquisition of survival skills
Project Blueprint utilises the SLSA CoastSafe Aquatic Public Safety Risk Assessment methodology, which is endorsed by the International Life Saving Federation conducted to the following standards:
AS/NZS ISO 31000:2009 Risk management – Principles and Guidelines
Water Safety Signs and Beach Safety Flags
Public Information Symbols Part 1 and 2
Development, Testing and Implementing of Information and Safety Symbols and Symbolic Signs Quality Management Systems
All SLSA CoastSafe Assessors have attained the SLSA Certificate in Coastal Public Safety Risk Assessment. This qualification includes the following units of competency from the Diploma of Quality Auditing:
Ensure a Safe Workplace
Manage Hazards in the Workplace
Manage Risk
Identify and interpret compliance requirements
AS/NZS ISO 31000:2009 risk management process
7
Acquisition of survival skills
Project Blueprint utilises the SLSA CoastSafe Aquatic Public Safety Risk Assessment methodology, which is endorsed by the International Life Saving Federation and
Guidelines
Development, Testing and Implementing of Information and
All SLSA CoastSafe Assessors have attained the SLSA Certificate in Coastal Public of competency from
risk management process

8
Methodology The Project Blueprint risk assessment process consists of eight stages (Figure 5), which are repeated for each assessment area. A summary of the methodology is provided below.
Figure 5 Project blueprint risk assessment methodology
Pre assessment (Stage 1 and Stage 2) The preliminary stage of the assessment process involves a comprehensive review of the existing data and literature relevant to each assessment area. This information is used to establish a foundation from which the nature, extent and duration of each assessment can be determined and planned for. Key resources include, but are not limited to:
• ABSAMP database
• Surf Life Saving NSW Incident Reporting Database
• Lifeguard Statistics
• Geographical Information Systems (GIS) data
• Scientific literature
• Census (Australian Bureau of Statistics) data
• Documents published by the land manager/s
• Previous risk assessments • NSW Tourism Statistics
Stakeholder identification and community consultation planning is also conducted during the pre-assessment phase. This includes organising a time and location to host a public forum, of which key stakeholders are given 28 days’ notice. The forum is held during the on-site stage of the assessment, however communication with stakeholders and the public is ongoing throughout the entire assessment process.
1. Pre assessment planning
2. Communication & Consultation
3. On-site Data Collection
4. Round One Stakeholder
Consultation / Surveying
5. Data Collation and Draft Report
Production
6. Round Two Stakeholder Consultation
7. Final Report Production
8. Final Report Released to State
and Local Authorities

9
On site data collection (Stage 3 and Stage 4) Whilst on the coast, qualified CoastSafe Assessors use cutting edge tools, developed by Surf Life Saving Australia to collect and assess data on an unprecedented scale. All collected data is geocoded and can be analysed using Geographic Information Systems (GIS) and incorporated into mapping systems of land managers. Using advanced mobile technology CoastSafe Assessors audit and assess numerous aspects of the NSW coastline which have been identified as factors which contribute to the usage, hazardousness and risk. These include:
• Hazards – such as rips, dangerous currents, sand banks, rocks, reefs, manmade structures, litter and debris, erosion, predatory wildlife, etc.
• Access – identification of all methods of accessing the assessed location, both formal and informal
• Existing Signage – audit and recording of all signage laying within the assessed area, and where appropriate the level of compliance of existing signage with relevant Australian Standards and Guidelines
• Recommended Signage – positioning and placement of any recommended signage, including the removal or consolidation of existing signage
• Facilities – audit and recording of all facilities and structures in place within the assessment area that attract visitors and encourage use of a location
• Existing Rescue Equipment – audit and recording of all existing public and emergency rescue equipment within the assessment area
• Recommended Rescue Equipment - positioning and placement of any recommended public rescue equipment
• Supporting Services – audit and recording of external supporting emergency services and their ability to respond to emergency incidents at the assessed location
Communicating with stakeholders about risk perception and tolerance is a core component of the risk assessment and management process. Local knowledge such as observations, experiences and opinions, dovetails into the data collection process and often fills important gaps in the available physical and statistical data. The first round of public formal consultation is organised through a prearranged forum, held at a local venue in the assessment area within the data collection phase. This ensures land managers and other key stakeholders are given the opportunity to provide local input and knowledge i.e. validation of strategies in place, risk management issues and opportunities that may exist. Project Blueprint is also broadcast through various news and social media to reach the widest possible audience, and online surveys provide stakeholders and members of the community with the additional opportunity to provide their local knowledge.
Draft report production and stakeholder consultation (Stage 5 and Stage 6) Draft reports are usually produced within 28 days of completing the on-site component of each assessment. This involves checking and collating thousands of data points, as well as preparing a suite of risk treatment options tailored to the unique circumstances and characteristics of the coastal areas of each local government area.

10
Consultation with key stakeholders is particularly important during this phase. Draft reports are circulated for a four week period to all members of the NSW Water Safety Advisory Council, land managers, and other peak bodies and user groups. Risk treatment options identified through the risk assessment process are presented for the consideration of the land manager. Although they are not binding they are made with supporting evidence and alignment to appropriate standards. Council/Land-Managers are provided the opportunity to review and provide feedback on the draft documents before they are finalised.
Final report production and release (Stage 7 and Stage 8) Draft report comments and feedback provided by key stakeholders are carefully considered, and the report is subsequently amended where necessary. The final report is subsequently released to state and local authorities, including the NSW Water Safety Advisory Council and land managers. An annual state summary report, which combines the findings and treatment options for the assessed local government areas, is compiled and submitted to the NSW Mistier of Police and Emergency Services at the completion of each year of the Project.
Progress to date Project Blueprint officially commenced in June, 2012 and is now in its second phase. To date, Australian CoastSafe has covered approximately 412km of the NSW coastline. A summary of the extent and data collected during the first phase is provided in Table 2.
Table 2 Summary of data collected during year 1 of Project Blueprint
LGA Coastline kms
Assessed Locations
Data elements collected
Beaches Rocky Coast Locations
Tweed 35 10 2050 10 0*
Byron 39 18 1867 18 0*
Ballina 31 16 1269 12 4
Coffs 70 44 2828 41 14
Munmorah 16 16 525 6 10
Wyong 25 15 1636 15 0*
Gosford 37 29 2036 21 8
Waverley 9 16 1068 5 11
Randwick 21 33 2030 8 25
Sutherland 36 34 1447 17 17
Wollongong 59 39 2755 33 6
Year 1 Totals
378 270 19511 186 95
* Rocky coast locations included in beach assessments due to proximity

11
Although this is an ambitious project, Australian CoastSafe is pleased to report this project is on track to deliver the proposed outputs for year two. Data has been collected for the Pittwater and Warringah LGAs and the assessment reports are currently in production.
Recent Developments Emergency Marker Program Australian CoastSafe is currently working with key government departments and emergency services to develop a best practice emergency marker system which can be rolled out on a state-wide basis. The objective of the program is to assign geographical definition to high visitation and potentially hazardous areas with no street address or reference point, such as beaches and rock platforms, as well as open space parkland and walking trails. Spatial information collected by Australian CoastSafe, such as access points and existing marker signage, is being supplied to the Emergency Information Coordination Unit (EICU) (NSW Land and Property Information). Once the Emergency Marker Program is established, this information will be integrated into Police and other emergency service CAD systems and land management authority signage plans. A standardized statewide emergency marker system will enable triple zero call takers to immediately and accurately verify the location of an emergency triple zero call, and thus reduce emergency response time to ultimately save lives. Rocky coast hazard rating The ABSAMP beach hazard and classification system is one of the most successful models for quantifying hazards on beaches, yet no similar system currently exists for rocky coasts and platforms. Recent research has however demonstrated that quantifying the morphological exposure of platforms is relatively simple – this is a significant finding that will ultimately enable the hazard potential of any area of rocky coast to be measured (Kennedy, et al., 2013). Funding has also recently become available to expand on this research by incorporating the principles and dynamics of wave energy and human usage into the analyses. The outcomes of this research will substantially benefit the accuracy of the hazard analyses of rocky coasts as part of Project Blueprint. Community consultation The consultation process is vital within the risk management process. In regards to Project Blueprint, consultation with a number of stakeholders was formally undertaken to ensure land managers and other key stakeholders were given the opportunity to provide local input and knowledge i.e. validation of strategies in place, issues in regards to risk management and opportunities that may exist.
12
Methods for community engagement and stakeholder consultation have expanded since the first year of Project Blueprint. Initially consultation was only offered via online tools such as surveys and the project website. At the time it was thought that this would be the most effective way in reaching a large number of stakeholders in the short amount of time to deliver the reports. Initial consultation was not as effective as first planned. This was because not enough responses were coming through from the online surveys, project awareness within the community was limited and the fact that stakeholders prefer to have personal contact when providing their feedback. As a result Australian CoastSafe has reviewed means of stakeholder engagement, from initial notification to final feedback collection. The organizing of public forums has been a major development. These meetings provide people with a vested interest in the project with the opportunity to provide local feedback about coastal drowning issues, opportunities within their area, and receive face to face responses to any questions they may have. Additional improvements include an increase in social media and following up email notifications with phone calls to invite people to the public forums. Year 1 State Report Outcomes The summary state report has recently been submitted to the NSW Government for review and discussion. The treatment options outline in the report will be able to be used in providing further guidance and evidence on where future funds may be allocated to implement drowning prevention methods. Many local issues are also consistent on a state-wide basis and therefore these issues can be tackled from a state perspective instead of each local area implementing drowning prevention methods in slightly different ways. Treatment options are encouraged to be implemented using a staged/prioritised approach focusing firstly on high risk areas before medium and low risk areas are approached. This will ensure that the treatment options are achieved in a realistic way and are not a financial risk.
Next Steps On site assessment of the Manly, Shoalhaven, and Bega Valley LGAs are due to commence in November (2013), February (2014) and April (2014), respectively. This will conclude the second year of Project Blueprint. Table 3 and Table 4 list the LGAs to be assessed during the third and fourth years of the project, the extent of each, and the number of drownings recorded between July 2004 and June 2013.

13
Table 3 Summary of LGAs to be assessed during year 3
LGA No. Beaches/Rock
Platforms Estimated
KMs
Eurobodalla 116 130
Kiama 21 28
Shellharbour 23 17
Kempsey 34 74
Port Macqaurie 26 54
Port Stephens 22 52
Newcastle 14 12
Totals 256 367
Table 4 Summary of LGAs to be assessed during year 4
LGA No. Beaches/Rock
Platforms Estimated
KMs
Richmond 14 34
Clarence 44 80
Bellingen 7 13
Nambucca 11 21
Greater Taree 12 48
Great Lakes 36 90 Lake
Macquarie 17 25
Totals 141 311
Conclusion Drowning deaths continue along the NSW coast at an unacceptable level. NSW accounts for almost 50% of the national coastal drowning toll. There have been 340 coastal drowning deaths in NSW between July 2004 and June 2013 (Surf Life Saving NSW, 2013). The majority of these can be attributed to swimming/rip-currents and rock-fishing, with almost all occurring at unpatrolled locations/times, where no expert assistance is immediately available. Surf Life Saving NSW has received funding from the NSW Water Safety Black Spot Fund to conduct a Coastal Public Safety Risk Assessment for every beach and rock platform in NSW. Known as Project Blueprint, the outcomes of this undertaking will be fundamental in addressing the coastal drowning issue in NSW both in the short, mid and long term. The first year of Project Blueprint was successfully completed by Australian CoastSafe in June 2013. A total of 270 locations were assessed with 19511 data elements collected.

14
The second year is currently on schedule for completion in June 2014. Major developments during the second year of the project include advancement in a rocky coast classification model and hazard rating system, and improved methods for engaging key stakeholders. The Project Blueprint risk assessment process and subsequent findings provide vital supporting evidence needed for the proper implementation of risk treatments and mitigation strategies at state, regional and local levels. Several of the outcomes of the year 1 state report have been used to guide state funding allocation, which is a significant result. Project Blueprint risk assessment findings also assist in the identification of service gaps aligned to the drowning chain
Acknowledgements Project Blue Print has been funded through the NSW Ministry for Police and Emergency Services Water Safety Black Spot Fund.
References
ABS (2004), 1301.0 - Year Book Australia, [Online] Available at: http://www.abs.gov.au/Ausstats/[email protected]/Previousproducts/1301.0Feature%20Article32004, [Accessed 22 October 2013]. ABS (2012), 1301.0 - Year Book Australia, [Online] Available at: http://www.abs.gov.au/ausstats/[email protected]/Lookup/by%20Subject/1301.0~2012~Main%20Features~Home%20page~1 [Accessed 22 October 2013]. Geoscience Australia (2010), Coastline Lengths, [Online] Available at: http://www.ga.gov.au/education/geoscience-basics/dimensions/coastline-lengths.html [Accessed 22 October 2013]. International Life Saving Federation (2008), A framework to reduce drowning deaths in the aquatic environment for nations/regions engaged in lifesaving, The International Life Saving Federation, Belgium. Kennedy, D. M., Sherker, S., Brighton, B., Weir, A., Woodroffe, C. D. (2013), "Rocky coast hazards and public safety: Moving beyond the beach in coastal risk management", Ocean & Coastal Management, Volume 82, pp. 85-94. Short, A. D. (1993), Beaches of the New South Wales Coast, Sydney University Press Sydney. Short, A. D. (2007), Beaches of the New South Wales Coast, 2nd ed, Sydney University Press, Sydney. Surf Life Saving Australia (2013), National Coastal Safety Report, Surf Life Saving Australia, Sydney. Surf Life Saving NSW (2013), Incident Reporting Database, Surf Life Saving Australia, Sydney.