border corridors and trade report - research library · figure 62: el paso/santa teresa-chihuahua...
TRANSCRIPT

Border Corridors and Trade
Report
January 2015

Submitted to:
Texas Department of Transportation
International Relations Office
125 E. 11th Street
Austin, TX 78701
Prepared by:
Dan Seedah, Sarah Overmyer and Robert Harrison
Center for Transportation Research
The University of Texas at Austin
1616 Guadalupe St., Suite 4.202
Austin, TX 78701
Note: Trade and transportation data reported in this document are the most recently available
as of December 2014 and reflects the lag in time required by all collecting agencies to complete
the processing, quality control, and publication of their data.
Table of Contents
1 Introduction .......................................................................................................................... 1
2 Texas Trading Partners ....................................................................................................... 3
2.1 Mexico .............................................................................................................................4
2.2 China ...............................................................................................................................4
2.3 Canada ............................................................................................................................5
2.4 Saudi Arabia ..................................................................................................................6
2.5 Venezuela .......................................................................................................................6
3 Texas Trade by Mode .......................................................................................................... 8
3.1 Trade with Mexico and Canada by Mode ...............................................................11
3.2 Land Ports of Entry .....................................................................................................13
3.3 Water Ports of Entry ...................................................................................................25
3.4 Pipelines .......................................................................................................................30
4 Texas Trade Corridors and Infrastructure Projects ....................................................... 34
4.1 International Trade Corridors Serving Texas .........................................................34
4.2 Major Trade Corridors in Texas ................................................................................36
5 Mexico Infrastructure Projects Related to Trade ........................................................... 46
5.1 Chihuahua ....................................................................................................................46
5.2 Coahuila .......................................................................................................................47
5.3 Tamaulipas ...................................................................................................................47
5.4 National ........................................................................................................................48
5.5 Aduanas........................................................................................................................49
6 U.S.-Mexico Border Master Plans and Border Wait Time Studies .............................. 50
6.1 El Paso/Santa Teresa-Chihuahua Border Master Plan ...........................................50
6.2 Lower Rio Grande Valley-Tamaulipas Border Master Plan .................................51
6.3 Laredo District Coahuila/Nuevo León/Tamaulipas Border Master Plan ...........53
6.4 Border Wait Time Studies ..........................................................................................55
7 Border Trade Advisory Committee ................................................................................. 56
7.1 Goals and Strategies ...................................................................................................56
7.2 Update to BTAC Initiatives .......................................................................................57
8 Concluding Remarks ......................................................................................................... 60

Appendix A: Border Trade Advisory Committee (BTAC) Members................................. 62
Appendix B: Border Trade Advisory Committee (BTAC) Strategies ................................. 65
Bibliography ............................................................................................................................... 71
List of Figures
Figure 1: Top Trading States in the U.S. ................................................................................... 1
Figure 2: Total U.S. Trade by Imports and Exports ................................................................ 2
Figure 3: Top Texas Trading Partners ....................................................................................... 3
Figure 4. Exports to Mexico ........................................................................................................ 4
Figure 5: Imports from Mexico .................................................................................................. 4
Figure 6. Exports to China .......................................................................................................... 5
Figure 7: Imports from China ..................................................................................................... 5
Figure 8. Exports to Canada ....................................................................................................... 5
Figure 9: Imports from Canada .................................................................................................. 5
Figure 10. Exports to Saudi Arabia ............................................................................................ 6
Figure 11: Imports from Saudi Arabia ...................................................................................... 6
Figure 12. Exports to Venezuela ................................................................................................ 7
Figure 13: Imports from Venezuela ........................................................................................... 7
Figure 14: CBP POE Cities in Texas ........................................................................................... 8
Figure 15: Texas Exports by Value and by Mode .................................................................... 9
Figure 16: Texas Exports by Weight and by Mode ................................................................. 9
Figure 17: Texas Imports by Value and by Mode ................................................................. 10
Figure 19: Texas Exports to Mexico by Mode and Value ..................................................... 11
Figure 20: Texas Imports from Mexico by Mode and Value ............................................... 11
Figure 21: Texas Exports to Canada by Mode and Value .................................................... 12
Figure 22: Texas Imports from Canada by Mode and Value ............................................... 12
Figure 23: Commercial Land POEs ......................................................................................... 13
Figure 24: Northbound Truck Border Crossings in 2013 ..................................................... 14
Figure 25: Northbound Trucks crossing through Texas Border POEs ............................... 15
Figure 26: Northbound Loaded Truck Containers crossing through Texas Border
POEs ................................................................................................................................. 16
Figure 27: Comparison of Import Value to Truck and Container Movements from
Mexico .............................................................................................................................. 17

Figure 28: Percentage of Northbound Trucks with Loaded Containers through
Texas Border POEs ......................................................................................................... 17
Figure 29: Northbound Empty Truck Containers crossing through Texas Border
POEs ................................................................................................................................. 18
Figure 30: Northbound Trucks crossing through U.S. Southern Border POEs ................ 19
Figure 31: Northbound Loaded Truck Containers crossing through U.S. Southern
Border POEs .................................................................................................................... 19
Figure 32: Northbound Empty Truck Containers crossing through U.S. Southern
Border POEs .................................................................................................................... 20
Figure 33: Northbound Trains crossing through Texas Border POEs ............................... 21
Figure 34: Northbound Loaded Rail Containers crossing through Texas Border
POEs ................................................................................................................................. 22
Figure 35: Northbound Empty Rail Containers crossing through Texas Border
POEs ................................................................................................................................. 23
Figure 40: Domestic Tonnage Moved through Texas Marine Ports ................................... 26
Figure 41: Imports Tonnage Moved through Texas Marine Ports ..................................... 26
Figure 42: Exports Tonnage Moved through Texas Marine Ports ...................................... 27
Figure 43: Landed Air Cargo – U.S. and Texas ...................................................................... 29
Figure 44: Landed Air Cargo at Texas Airports .................................................................... 30
Figure 45: U.S. Major Natural Gas Transportation Corridors, 2008 ................................... 30
Figure 46: Lower 48 States Shale Plays .................................................................................. 31
Figure 47: 2012 Top 10 Natural Gas Producing States in the U.S. ...................................... 31
Figure 48: 2012 Top 10 Crude Oil Producing States in the U.S. .......................................... 32
Figure 50: Major Crude Oil Pipelines ...................................................................................... 33
Figure 51: Global Corridors Serving Texas Trade ................................................................. 34
Figure 52: Major Interstate and State Highway Corridors Serving Texas Ports ............... 36
Figure 53: Ongoing Projects on IH 35 Corridor ..................................................................... 37
Figure 54: Grand Parkway (SH 99) .......................................................................................... 40
Figure 55: IH 69 Corridor Designation ................................................................................... 41
Figure 56: Border Highway West Extension .......................................................................... 42
Figure 57: DFW Connector ....................................................................................................... 43
Figure 58: Harbor Bridge .......................................................................................................... 44
Figure 59: Loop 9 Project ........................................................................................................... 44
Figure 60: Loop 1604 Relief Route ........................................................................................... 45
Figure 61: US 77 Upgrade ......................................................................................................... 45
Figure 62: El Paso/Santa Teresa-Chihuahua Border Master Plan Focused Study
Area .................................................................................................................................. 50
Figure 63: Lower Rio Grande Valley–Tamaulipas Border Master Plan Focused
Study Area ...................................................................................................................... 52
Figure 64: Laredo District Coahuila/Nuevo León/Tamaulipas Border Master Plan
Focused Study Area ....................................................................................................... 54
Figure 65: Pharr-Reynosa Bridge Hourly Average Wait Time in December 2014 ........... 55
List of Tables
Table 1: Texas Top 5 Export and Import Commodities by Value in 2013 ........................... 3
Table 2: Ranking of Busiest Northbound Commercial Bridges in 2013 ............................. 14
Table 3: Ranking of Busiest Southbound Commercial Bridges in 2013 ............................. 16
Table 3: Total U.S. Container Trade in TEUs by Customs Port ........................................... 27
Table 4: U.S. Container Exports in TEUs by Customs Port ................................................. 28
Table 5: U.S. Container Imports in TEUs by Customs Port ................................................. 28

| 1
1 Introduction
Texas trade exceeds all other U.S. states in value and in 2013 accounted for 15.4% of U.S.
total trade compared to its nearest competitors—California (14.3%) and New York (5.6%).
Figure 1 tracks total trade data for these three states since 2009, separated into export and
import values, and the data show that Texas reached a new high in 2013 when state total trade
was valued at $591 billion.1 Texas has remained the top exporting state since 2002 and in 2013
exports reached $279 billion, again substantially greater than its nearest competitors—over $111
billion more than California and $192 billion more than New York.1 Imports have been led by
California over the same period and in 2013, Texas imports were worth over $311 billion—$70
billion less than California—partially reflecting an $18 billion reduction in Texas mineral
products and oil imports since 2012.1
Figure 1: Top Three Trading States in the U.S.
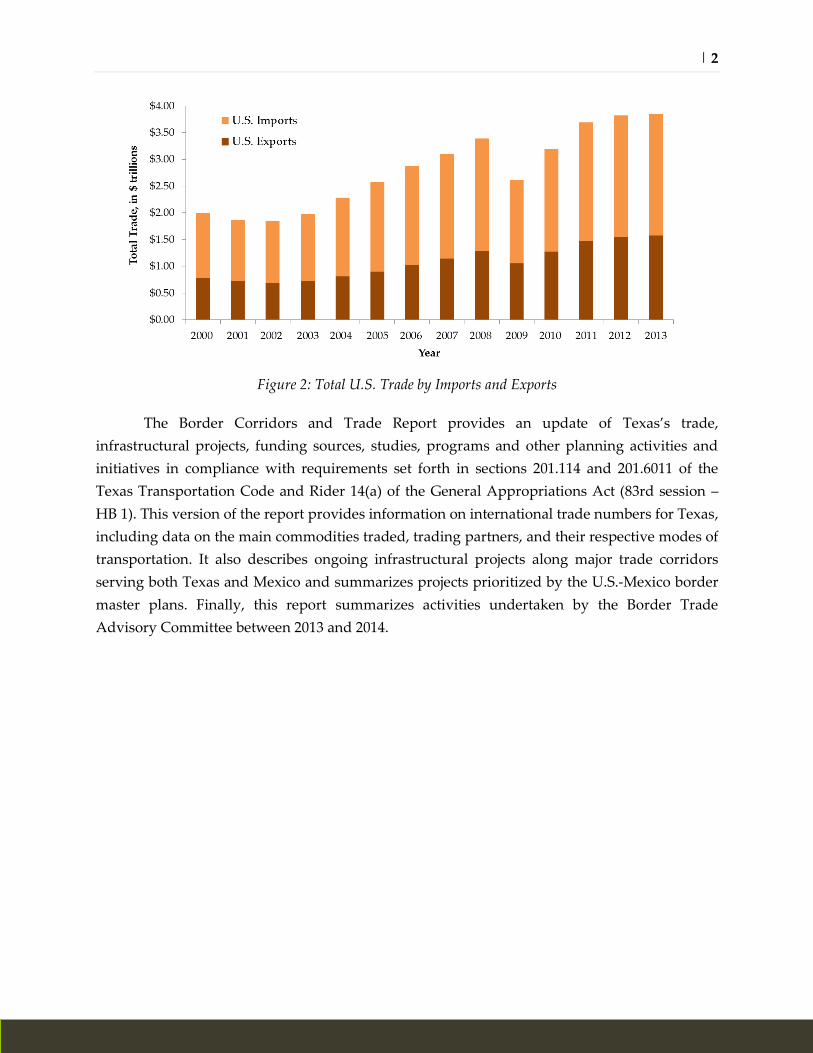
U.S. total trade is at record levels for both imports and exports. In 2013, the U.S.
imported about $2.2 trillion in goods and exported about $1.6 trillion, for a total of over $3.8
trillion. Though the global economic recession of 2009 caused a significant decrease in trade, as
of 2011 the U.S. had reached pre-crisis values, as shown in Figure 2.2 The U.S. trade deficit has
been substantially reduced since 2012 as domestic oil and gas production output grew strongly
and cut back oil import values. It is expected to have an even stronger impact when 2014 data
become available.
$0
$100
$200
$300
$400
$500
$600
$700
2008 2009 2010 2011 2012 2013
To
tal
Tra
de
, in
$ b
illi
on
s
Year
TX Exports TX Imports
CA Exports CA Imports
NY Exports NY Imports
| 2
Figure 2: Total U.S. Trade by Imports and Exports
The Border Corridors and Trade Report provides an update of Texas’s trade,
infrastructural projects, funding sources, studies, programs and other planning activities and
initiatives in compliance with requirements set forth in sections 201.114 and 201.6011 of the
Texas Transportation Code and Rider 14(a) of the General Appropriations Act (83rd session –
HB 1). This version of the report provides information on international trade numbers for Texas,
including data on the main commodities traded, trading partners, and their respective modes of
transportation. It also describes ongoing infrastructural projects along major trade corridors
serving both Texas and Mexico and summarizes projects prioritized by the U.S.-Mexico border
master plans. Finally, this report summarizes activities undertaken by the Border Trade
Advisory Committee between 2013 and 2014.

| 3
2 Texas Trading Partners
As Table 1 shows, Texas’s top exports, aggregated by commodity type, are (1)
machinery and electrical products, (2) mineral products including oil, (3) chemicals and allied
industries, (4) transportation, and (5) plastics and rubbers. Top imports are (1) mineral products
including oil, (2) machinery and electrical products, (3) transportation, (4) metals, and (5)
miscellaneous commodities.
Table 1: Texas Top 5 Export and Import Commodities by Value in 2013 1
Note: Commodity categories are aggregates of more detailed subcategories. See Appendix A for examples of
commodities included in aggregated categories.
In comparison, the U.S.’s top exports are (1) machinery and electrical products, (2)
transportation, (3) chemicals and allied industries, (4) mineral products including oil, and (5)
miscellaneous. The top U.S. imports are (1) machinery and electrical products, (2) mineral
products including oil, (3) transportation, (4) chemicals and allied industries, and (5)
miscellaneous.
Figure 3: Top Texas Trading Partners1
$0
$20
$40
$60
$80
$100
$120
$140
$160
$180
$200
2009 2010 2011 2012 2013
To
tal
Tra
de,
in
$ b
illi
on
s
Year
Mexico China Canada Venezuela Saudi Arabia
Exports Imports
Rank Commodity Value
($ mil.) % U.S. Commodity
Value
($ mil.) % U.S.
1 Machinery, Electrical $88,178 23.3% Mineral products $109,579 28.4%
2 Mineral products $70,911 44.6% Machinery, Electrical $101,819 16.9%
3 Chemicals & Allied Industries $32,943 20.1% Transportation $19,716 7.0%
4 Transportation $20,676 8.1% Metals $15,261 13.5%
5 Plastics, Rubbers $20,734 27.4% Miscellaneous $14,156 8.3%

| 4
Mexico plays a crucial role in Texas trade, substantially surpassing other trade partners (China,
Canada, Venezuela, and Saudi Arabia), as shown in Figure 3. This high trade level is primarily
due to Mexico’s proximity and the passage of the North American Free Trade Agreement
(NAFTA) in 1994.3 This trade agreement stimulated a profound impact on border communities
located along the Texas-Mexico border and on the transportation corridors, predominantly
highway and rail.Error! Bookmark not defined.
2.1 Mexico
Texas’s trade with Mexico is found to have the least variation in terms of the value of
commodities exported and imported during the last six years, as shown in Figures 4 and 5. In
2013, top exports from Texas to Mexico in 2013 were machinery and electrical products ($40
billion) and mineral products including oil ($16 billion).1 Top commodity imports from Mexico
were also machinery and electrical products ($38 billion) and mineral products including oil
($25 billion).1 Similar to the national trend, imports of mineral products (including oil) from
Mexico is on a decline since 2012. This can be attributed to growing oil production in Texas.
Figure 4. Exports to Mexico1
Figure 5: Imports from Mexico1
2.2 China
The total value of Texas exports to China is much less in comparison to imports and
varies in terms of commodity type. The export values of most of the commodities were less than
$3 billion dollars. Exports to China are also more volatile, with frequent variations from 2008 to
2013, as shown in Figure 6.1 Figure 7 indicates that the top import commodity in 2013 from
China to Texas was machinery and electrical products (almost $30 billion), the majority of
which is highly concentrated in communication devices, such as phones. The values of other
commodities imported were much less than the top commodity import. The import values of

| 5
most of these commodities were below $4 billion from 2008 to 2013 and include items such as
miscellaneous products, metals, textiles, and plastics/rubber products.1
Figure 6. Exports to China1
Figure 7: Imports from China1
2.3 Canada
The top exports to Canada from Texas in 2013 were machinery and electrical products
($7.4 billion) and mineral products including oil ($6 billion). As shown in Figure 8, since 2008
the value of mineral products (including oil) exported to Canada has grown 85%, and the value
of machinery and electrical products has grown by 24% (see Figure 8).1 Other top exports are
worth under $3 billion each. Top imports by value from Canada to Texas in 2013 were
machinery and electrical products (almost $3 billion) and mineral products including oil ($2.3
billion) as shown in Figure 9.1 The value of machinery and electrical products imported from
Canada decreased in 2008 and has since remained stable. Overall, Texas exports to Canada were
of greater value than imports.1
Figure 8. Exports to Canada1
Figure 9: Imports from Canada1

| 6
2.4 Saudi Arabia
As shown in Figure 10, exports to Saudi Arabia are dominated by transportation goods
($1.7 billion), which is mostly made up of passenger vehicles. This category has increased by a
dramatic 224% since 2008.1 The top Texas import commodity from Saudi Arabia is mineral
products, which includes oil. The value of mineral products imported from Saudi Arabia lost an
immense 63% of its value from 2008 to 2009 due to a cut in production as a response to
decreased demand during the global economic crisis.4 Its value has since recovered and in 2013
surpassed $22 billion, as shown in Figure 11.1
Figure 10. Exports to Saudi Arabia1
Figure 11: Imports from Saudi Arabia1
2.5 Venezuela
Similar to the Saudi Arabia trade profile, Texas trade with Venezuela is almost
exclusively mineral products such as oil. Texas exports to Venezuela are quite volatile, with the
top export of mineral products including oil ($2 billion), as shown in Figure 12.1 Remarkably,
the value of this export increased almost 500% from 2011 to 2012. Increased U.S. exports of
petroleum products to Venezuela in 2012 have been attributed to reduced capacity at
Venezuelan refineries.5 Imported oil from Venezuela in 2013 ($16 billion) has yet to reach its
2008 value of $20 billion, as shown in Figure 13.1

| 7
Figure 12. Exports to Venezuela1
Figure 13: Imports from Venezuela1

| 8
3 Texas Trade by Mode
The U.S. has 328 official Customs and Border Protection (CBP) ports of entry (POE), with
29 in Texas, as shown in Figure 14. These POEs serve various freight modes of transport,
including truck, rail, air, and marine gateways. CBP officers inspect goods, collect duties, and
enforce the import/export laws and regulations of the U.S. federal government. In addition,
various agencies, such as the CBP, U.S. Army Corps of Engineers, U.S. Census Bureau, and the
Bureau for Transportation Statistics, collect data on the movement of goods.
Figure 14: CBP POE Cities in Texas6

| 9
Figure 15: Texas Exports by Value and by
Mode 7
Figure 16: Texas Exports by Weight and by
Mode 7
As shown in Figures 15 and 16, the dominant mode of transport for moving trade to and
from Texas is trucking, both by value and by tonnage. The term truck movements, as defined in
the Freight Analysis Framework (FAF) database7, includes private and for-hire trucks and
excludes trucks that are part of multiple modes and mail or truck moves made in conjunction
with the routing of domestic air cargo exports from Texas, as.
In 2012, trucks moved 60.7% by value and 35.1% by weight of compared to 62.1% by
value and 38% by weight in 2007. The changes in modal share between 2007 and 2012 can
mainly be attributed to pipeline movements increasing from 5.9% to 7.8% by value and from
21.3% to 25.7% by weight. Pipelines move crude petroleum and natural gas—commodities
whose exports increased significantly from 2007 and 2012. Rail mode share by value was
relatively the same at 11% in 2007 compared to 2012, but by weight decreased slightly from
19.1% in 2007 to 18% in 2012. Air modal share (including truck and air) also remained relatively
unchanged from 2007 to 2012 both by value and weight. Air as categorized in the FAF includes
shipments typically weighing more than 100 pounds that move by air or a combination of truck
and air in commercial or private aircraft. Shipments typically weighing 100 pounds or less are
classified as multiple modes and mail. This category also includes shipments by parcel delivery
services, U.S. Postal Service, or couriers. The modal share of this category also remained
relatively unchanged in 2007 compared to 2012 both by value and weight at approximately 9%
and 12%, respectively. The “Other and unknown” modal category includes movements not
elsewhere classified and shipments for which the mode cannot be determined.
0%
10%
20%
30%
40%
50%
60%
70%
80%
90%
100%
1997 2002 2007 2012
Mo
dal
Sh
are
by
Val
ue,
in
per
cen
tag
es
Year
Other and unknown
Water
Air (incl. truck-air)
Pipeline
Multiple modes & mail
Rail
Truck
0%
10%
20%
30%
40%
50%
60%
70%
80%
90%
100%
1997 2002 2007 2012
Mo
dal
Sh
are
by
Wei
gh
t, i
n p
erce
nta
ges
Year
Other and unknown
Air (incl. truck-air)
Water
Multiple modes & mail
Rail
Pipeline
Truck

| 10
Figure 17: Texas Imports by Value and by
Mode 7
Figure 18: Texas Imports by Weight and by
Mode 7
As shown in Figures 17 and 18, modal share for the “No domestic mode” category is a
significant percentage of freight imported into Texas in 2012 at 21.2% and 44.6% by value and
weight, respectively. This category is used to capture petroleum imports that go directly from
foreign, inbound ships to an on-shore U.S. refinery. Use of this category ensures a proper
accounting when foreign and domestic flows are summed, while avoiding assigning flows to
the domestic transportation networks that do not use it. For modes of transport utilizing the
domestic transportation network, trucks moved 45.3% of Texas imports in 2012 by value, a
slight increase from 42.9% in 2007. By weight, trucks moved 19.7% of imports in 2012 in
comparison to 17.9% in 2007. Crude petroleum and natural gas moved on domestic pipelines
accounted for 8.3% of imports by value but 19.7% of imports by weight in 2012. In the same
year, rail also accounted for 4.2% of imports by value and approximately 5.6% by weight. There
were marginal modal share changes for both domestic pipeline and rail movements in 2007
compared to 2012. Similarly, air freight and multiple modes and mail also experienced minimal
modal share changes for the same years. In 2012, air freight accounted for 8.3% of imports by
value and 0.1% of imports by weight. Multiple modes and mail also accounted for 9.2% by
value and 5.8% by weight in 2012 as well.
0%
10%
20%
30%
40%
50%
60%
70%
80%
90%
100%
1997 2002 2007 2012
Mo
dal
Sh
are
by
Val
ue,
in
per
cen
tag
es
Year
Other and unknown
Air (incl. truck-air)
Water
Multiple modes & mail
Rail
Pipeline
No domestic mode
Truck
0%
10%
20%
30%
40%
50%
60%
70%
80%
90%
100%
1997 2002 2007 2012
Mo
dal
Sh
are
by
Wei
gh
t, i
n p
erce
nta
ges
Year
Other and unknown
Air (incl. truck-air)
Water
Multiple modes & mail
Rail
Pipeline
Truck
No domestic mode

| 11
3.1 Trade with Mexico and Canada by Mode
As reported in the North American Transborder Freight database8 and shown in Figures
19 and 20, Texas trade with Mexico is dominated by truck movements, which accounted for
70.7% for exports and 65.9% for imports in 2013. Transporting goods by vessels to and from
Mexico accounted for 16.4% of exports and 26% of imports in 2013.
Figure 19: Texas Exports to Mexico by Mode and Value8
Figure 20: Texas Imports from Mexico by Mode and Value8
The remaining modes moving trade between Texas and Mexico in 2013 had the
following shares: rail moved 8.1% of exports and 4.6% of imports; pipelines moved 3.1% for

| 12
exports and 0.2% for imports; air moved 1.1% for exports and 0.7% for imports; and
commodities categorized as “Mail, Foreign Trade Zones (FTZs), and Other” moved 0.6% for
exports and 2.5% for imports.
In comparison, truck movements to and from Canada accounted for 53.2% for exports
and 50.5% for imports in 2013, as shown in Figures 21 and 22. Rail moved 18.3% of exports and
30.5% of imports in the same year. Vessel, air, and pipelines moved 19.5%, 7%, and 1.9% of
exports, and 4.1%, 12.6%, and 2.4% of imports, respectively, in 2013. For exports, the modal
share for vessels increased by 10.3% and that of trucks decreased by 7.8% from 2012 to 2013.
Figure 21: Texas Exports to Canada by Mode and Value8
Figure 22: Texas Imports from Canada by Mode and Value8

| 13
3.2 Land Ports of Entry
3.2.1 Trucks
Texas has 29 ports of entry (POEs) of which thirteen are commercial as shown in Figure
23 . Commercial POEs differ from non-commercial POEs in that they process commercial trucks
in addition to or instead of privately owned vehicles. Trucks volumes are dominated by six POE
sites where Texas Department of Public Safety (DPS) have permanent inspection stations
adjacent to the Federal CBE ports through which northbound trucks pass and can be selected to
insure they meet state and federal safety standards. As shown in Figure 24, the World Trade
Bridge in Laredo remains the busiest POE for truck crossings between Texas and Mexico.
Figure 23: Commercial Land POEs
In 2013, the World Trade Bridge accounted for 41.6% of total northbound truck
crossings. In comparison, the Pharr-Reynosa International Bridge in the Lower Rio Grande
Valley and the Ysleta-Zaragoza Bridge in El Paso accounted for 14.4% and 11.9% of total
northbound truck crossings, respectively.

| 14
Figure 24: Northbound Truck Border Crossings in 20139
Table 2 ranks bridges by number of truck crossings in 2013, and also shows percent
changes in traffic across three different time ranges: percent change from 2000 to 2013; percent
change from 2009 to 2013 (i.e., after the global economic recession); and percent change from
2012 to 2013, reflecting the most recent changes in truck traffic.
Table 2: Ranking of Busiest Northbound Commercial Bridges in 20139
2013
Rank POE Location
%
change
2000–
2013*
%
change
2009–
2013
%
change
2012–
2013
1 World Trade Bridge Laredo -17.6% 10.1% -6.9%
2 Pharr-Reynosa International Bridge Hidalgo -63.1% 8.3% 14.1%
3 Ysleta-Zaragoza Bridge El Paso 273.1% -7.0% -3.5%
4 Laredo-Colombia Solidarity Bridge Laredo 36.5% 21.8% 6.5%
5 Bridge of the Americas El Paso 12.7% 2.0% -7.0%
6 Veterans International Bridge Brownsville -41.7% 8.5% 4.9%
7 Camino Real International Bridge Eagle Pass 103.1% 35.7% 5.8%
8 Del Rio-Ciudad Acuña International Bridge Del Rio -38.4% 18.7% -9.6%
9 Progreso International Bridge Progreso 10.8% 42.2% 1.3%
10 Rio Grande City-Camargo Bridge Rio Grande City 12.3% 36.5% 3.8%
11 Free Trade Bridge (Los Indios Bridge) Brownsville 11.2% 38.0% -13.9%
12 Presidio Bridge Presidio 15.5% 33.6% 3.0%
13 Roma-Ciudad Miguel Alemán Bridge Roma -10.8% -0.1% 0.6%
All Bridges 22.3% 21.9% 2.3%
*Juarez-Lincoln Bridge, Lake Falcon Dam Crossing, and Fabens-Caseta Bridge were processing commercial truck
traffic until May 2000, March 2009, and December 2001, respectively, and are excluded from this analysis.
177,008
31,140
42,761
510,706
27,120
7,479
1,480,391 345,831
118,388
67,718
9,714
422,059
316,510
0 500,000 1,000,000 1,500,000
Veterans International Bridge
Free Trade Bridge
Progreso International Bridge
Pharr-Reynosa Intl. Bridge on the Rise
Rio Grande City-Camargo Bridge
Roma-Ciudad Miguel Aleman Bridge
World Trade Bridge
Laredo-Colombia Solidarity Bridge
Camino Real International Bridge
Del Rio-Ciudad Acuna Intl. Bridge
Presidio Bridge
Ysleta-Zaragoza Bridge
Bridge of the Americas

| 15
Across all Texas bridges, truck traffic increased by 22.3% since 2000, 21.9% since 2009,
and 2.3% between 2012 and 2013. The bridge that has shown the most significant growth since
2000 is the Ysleta-Zaragoza Bridge in El Paso, with an impressive 273.1% increase in traffic. In
more recent growth, truck traffic at Pharr-Reynosa International Bridge grew by 14.1% from
2012 to 2013. Between 2012 and 2013 the World Trade Bridge, Ysleta-Zaragoza Bridge, Bridge of
the Americas, Del Rio-Ciudad Acuña International Bridge, and the Free Trade Bridge all
experienced decreases in truck traffic. Figure 25 also shows the trend in the number of
northbound truck crossings by POE from 2000 to 2013 with the Laredo POE, comprising the
World Trade Bridge and Laredo-Colombia Solidarity Bridge, being the busiest POE, followed
by El Paso, Hidalgo, and Brownsville.
Figure 25: Northbound Trucks crossing through Texas Border POEs10
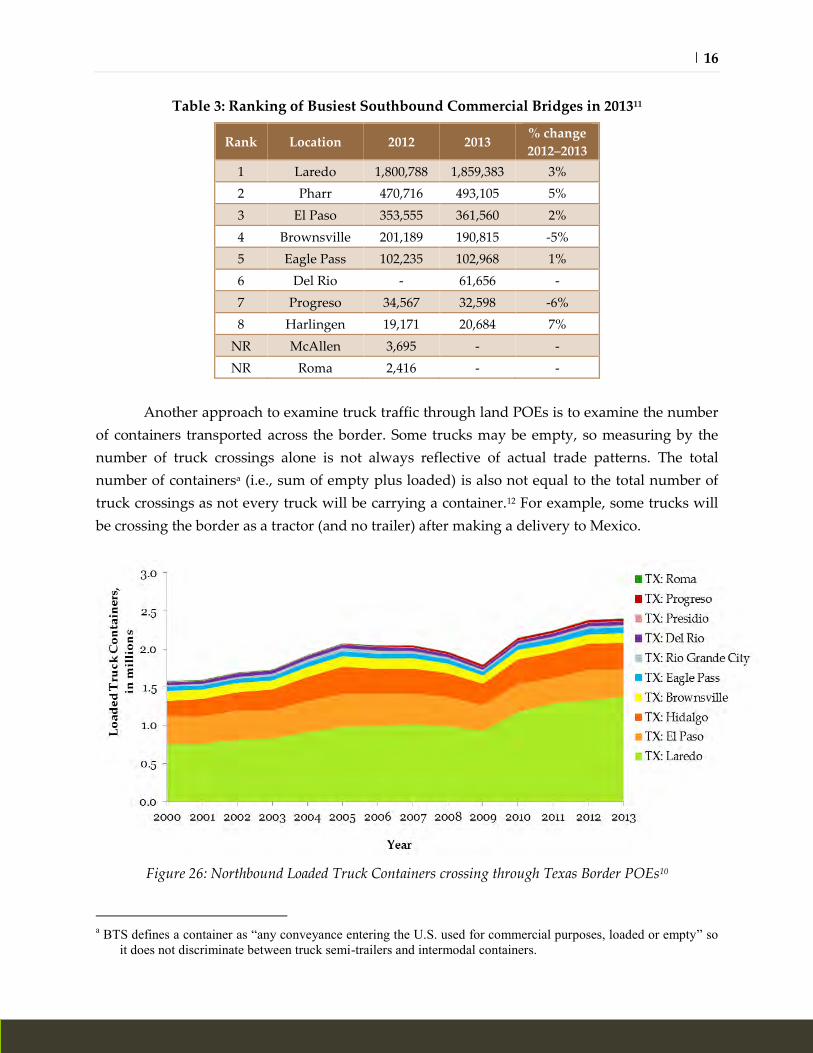
Table 3 shows limited 2012–2013 southbound truck crossing data by POE. Similar to
northbound crossing data, bridges in Laredo ranked highest in terms of number of truck
crossings. Pharr and El Paso also ranked second and third, a trend similar to northbound
crossings. The remaining southbound locations differ slightly from northbound locations in
terms of which bridges are included in each location. For example, Harlingen and McAllen are
listed as POEs for the southbound traffic; however, these locations are not included in the
northbound crossing delineations in Figure 25. An accurate comparison between northbound
and southbound crossings can therefore not be made for these locations, as the dataset does not
specify which bridges are included.
| 16
Table 3: Ranking of Busiest Southbound Commercial Bridges in 201311
Rank Location 2012 2013 % change
2012–2013
1 Laredo 1,800,788 1,859,383 3%
2 Pharr 470,716 493,105 5%
3 El Paso 353,555 361,560 2%
4 Brownsville 201,189 190,815 -5%
5 Eagle Pass 102,235 102,968 1%
6 Del Rio - 61,656 -
7 Progreso 34,567 32,598 -6%
8 Harlingen 19,171 20,684 7%
NR McAllen 3,695 - -
NR Roma 2,416 - -
Another approach to examine truck traffic through land POEs is to examine the number
of containers transported across the border. Some trucks may be empty, so measuring by the
number of truck crossings alone is not always reflective of actual trade patterns. The total
number of containersa (i.e., sum of empty plus loaded) is also not equal to the total number of
truck crossings as not every truck will be carrying a container.12 For example, some trucks will
be crossing the border as a tractor (and no trailer) after making a delivery to Mexico.
Figure 26: Northbound Loaded Truck Containers crossing through Texas Border POEs10
a BTS defines a container as “any conveyance entering the U.S. used for commercial purposes, loaded or empty” so
it does not discriminate between truck semi-trailers and intermodal containers.

| 17
Figure 26 shows the number of loaded containers crossing at Texas border POEs. Similar
to the number of trucks, Laredo (57%), El Paso (14.9%), Hidalgo (14.8%), Brownsville (5.2%),
and Eagle Pass (3.2%) accounted for most of the loaded containers crossing into Texas from
Mexico in 2013. The overall increasing trend of northbound loaded containers can be linked to
increased imports into Texas and the U.S. as shown in Figure 27.
Figure 27: Comparison of Import Value to Truck and Container Movements from Mexico8, 10
Figure 28: Percentage of Northbound Trucks with Loaded Containers through Texas Border POEs10
Figure 28 shows the percentage of trucks carrying loaded containers into Texas. Rio
Grande City recorded the highest percentages, which is attributed to the way the data is

| 18
collected. A container, as defined in the Border Crossing/Entry Data, includes trucks with two
linked trailers/containers. There exists a free trade zone at Rio Grande City where these types of
vehicles from Mexico go to transload commodities, as the state of Texas does not allow the use
of double trailers, except with a permit. In comparison, most of the other POEs recorded a 45%
to 55% utilization ratio for trucks carrying containers into Texas.
Figure 29 shows the number of northbound empty truck containers entering Texas from
Mexico. Overall, the number of empty containers is much lower than the number of full
containers. The total number of loaded containers entering Texas in 2013 was approximately 2.4
million, whereas the total number of empties was 1 million. The decrease in empty containers
indicates either increasing imports from Mexico or increased truck utilization where trucks are
able to pick up commodities on both sides of the border.
Figure 29: Northbound Empty Truck Containers crossing through Texas Border POEs10
Figures 30, 31, and 32 show northbound truck and container crossings through Texas in
comparison to the other southern U.S. border states, namely, New Mexico, Arizona, and
California. These figures also show annual total trade through all the states. In 2013, truck
movements through Texas accounted for 68.9% of total southern border movements. California,
Arizona, and New Mexico accounted for 22%, 7.3%, and 1.8%, respectively.

| 19
Figure 30: Northbound Trucks crossing through U.S. Southern Border POEs10
Figure 31: Northbound Loaded Truck Containers crossing through U.S. Southern Border POEs10

| 20
Figure 32: Northbound Empty Truck Containers crossing through U.S. Southern Border POEs10

| 21
3.2.2 Rail
Second to trucking, rail movement through Texas land POEs plays an essential role in
the growth of U.S. and Mexico trade. Current rail crossings between Mexico and Texas are
Brownsville (B&M Bridge, Brownsville West Rail Bypass International Bridge), Eagle Pass
(Union Pacific International Railroad Bridge), El Paso (Santa Fe Railroad Bridge, Union Pacific
Railroad Bridge), and Laredo (Texas-Mexican Railway International Bridge). Presidio also has a
rail bridge (Presidio-Ojinaga Rail Bridge) which has not been rebuilt after a fire on 29 February
2008.13 .
Figure 33: Northbound Trains crossing through Texas Border POEs10
As shown in Figure 33 and 34, Laredo handles the most trains and intermodal rail
containers, followed by Eagle Pass, El Paso, and Brownsville. During the 2009 recession, El Paso
and Laredo experienced sharp drops in rail container movements. Cargo movements through
Eagle Pass continued to grow during the recession. However, since 2009 Laredo has
experienced a much sharper growth rate compared to Eagle Pass. Average annual growth rate
of northbound loaded rail traffic from 2009 to 2013 at Laredo is 20.15%, compared to 13.70% at
Eagle Pass, as shown in Figure 34. El Paso, on the hand, never seemed to recover; its average
annual growth rate is only 6.35% from 2009 to 2013, as shown in Figure 34.
Loaded rail containers follow a very similar pattern to the total number of rail containers
(see Figure 34). The only difference is that Brownsville has stayed quite stable in number since
2000, which contrasts with the drops and subsequent increases in containers surrounding the

| 22
2009 global economic crisis. No decrease in number of loaded rail containers from 2012 to 2013
occurred at any of the rail crossings. For empty containers, the patterns are slightly different as
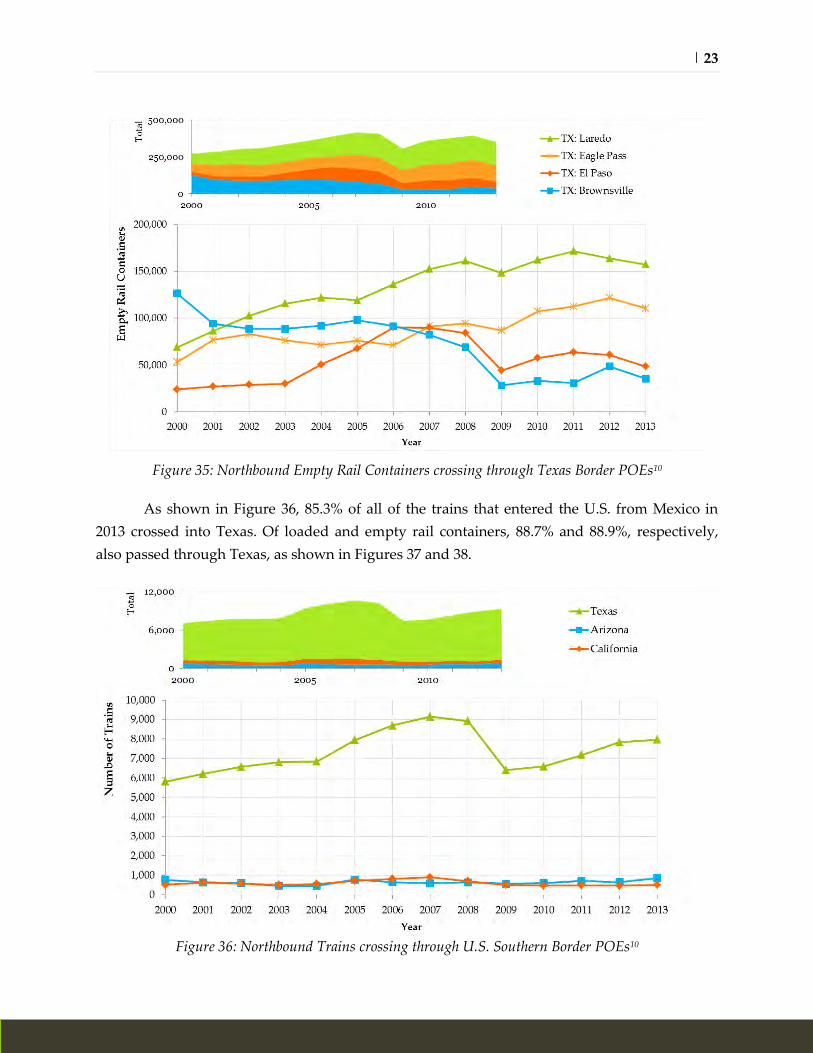
shown in Figure 35. Though there was also growth in the number of empty rail containers after
2009, there was a decrease at all Texas rail crossings.
Figure 34: Northbound Loaded Rail Containers crossing through Texas Border POEs10
| 23
Figure 35: Northbound Empty Rail Containers crossing through Texas Border POEs10
As shown in Figure 36, 85.3% of all of the trains that entered the U.S. from Mexico in
2013 crossed into Texas. Of loaded and empty rail containers, 88.7% and 88.9%, respectively,
also passed through Texas, as shown in Figures 37 and 38.
Figure 36: Northbound Trains crossing through U.S. Southern Border POEs10

| 24
Figure 37: Northbound Loaded Rail Containers crossing through U.S. Southern Border POEs10
Figure 38: Northbound Empty Rail Containers crossing through U.S. Southern Border POEs10

| 25
3.3 Water Ports of Entry
The Port of Houston is by far Texas’s busiest customs water port (Figure 39) and ranked
second in the U.S. in terms of total tonnage moved through the port in 2012.14 It ranked first in
U.S. imports and second in exports by tonnage. In terms of total foreign trade tonnage, other
high ranking ports in Texas in 2012 include the Port of Beaumont (6th), Port of Corpus Christi
(7th), Port of Texas City (11th), and Port Arthur (19th).
Figure 39: Total Tonnage Moved through Texas Marine Ports14
Figures 40 to 42 illustrate the tonnage of goods moved through Texas marine ports from
2000 to 2012. On average, the Port of Houston moved 41.6% of total tonnage, 43.2% of domestic
tonnage, 34.8% of imports, and 59.5% of exports from 2000 to 2012. In comparison, the Port of
Beaumont moved, on average, 15.7% of total, 14.1% of domestic, 19.5% of imports, and 7.2% of
exports during the same time period. The Port of Corpus Christi recorded 15.0% of total, 14.3%
of domestic, 16.3% of imports, and 12.4% of exports, and the Port of Texas City moved 11.4% of
total, 10.9% of domestic, 13.5% of imports, and 5.9% of exports, on average, for the same time
period. The Port of Houston also experienced sharp increase in exports (Figure 41) from 2002 to
2011, with an average annual growth rate of 9.3%.

| 26
Figure 40: Domestic Tonnage Moved through Texas Marine Ports14
Figure 41: Imports Tonnage Moved through Texas Marine Ports14

| 27
Figure 42: Exports Tonnage Moved through Texas Marine Ports14
In addition to tonnage, the state of Texas accounted for 5.3% of total container trade in
twenty-equivalent units (TEUs) moved through U.S. marine ports in 2012, an increase of 0.2%
compared to 2010 and 2011. The Port of Houston ranked 7th amongst U.S. ports for container
trade in 2012, followed by the Port of Freeport (26th), Galveston (33rd), Beaumont (43rd), and
Corpus Christi (44th) as shown in Table 3. Houston accounted for 95.1% of total TEUs moved
through Texas marine ports in 2012.
Table 3: Total U.S. Container Trade in TEUs by Customs Port14
Customs
Port 2007 2008 2009 2010 2011 2012
2012
U.S.
Rank
2012
%
TX
Houston 1,416,710 1,374,437 1,255,153 1,346,313 1,418,427 1,494,516 7 95.1
Freeport 59,837 56,201 57,689 57,250 51,533 60,818 26 3.9
Galveston 6,228 7,718 8,542 10,828 13,995 12,609 33 0.8
Beaumont 331 3,208 382 523 393 1,140 43 0.1
Corpus Christi 774 245 204 269 380 1,068 44 0.1
Sabine 0 0 0 0 187 455 49 0.0
Port Arthur 64 33 306 191 74 343 54 0.0
Brownsville 0 1 0 0 1 1 86 0.0
Port Lavaca 0 1 0 0 0 0 87 0.0
Texas City 0 0 0 0 3 0 88 0.0
Texas 1,483,944 1,441,844 1,322,277 1,415,374 1,484,993 1,570,953
U.S. 29,228,177 28,453,588 24,903,898 27,866,377 29,029,577 29,477,025

| 28
For exports and imports, Texas ports accounted for 7.6% and 3.8%, respectively, of TEUs
exiting or entering U.S. marine ports, as shown in Tables 4 and 5. Houston ranked fifth in
exports through all U.S. ports and accounted for 96.6% of TEUs moved in Texas. It also ranked
10th in imports.
Table 4: U.S. Container Exports in TEUs by Customs Port14
Customs Port 2007 2008 2009 2010 2011 2012
2012
U.S.
Rank
2012
%
TX
Houston 800,271 800,089 773,450 827,066 859,112 875,625 5 96.6
Freeport 28,511 25,087 22,319 25,648 21,924 26,583 26 2.9
Galveston 2,246 2,671 2,526 2,790 2,568 4,092 35 0.5
Sabine 0 0 0 0 187 455 44 0.1
Beaumont 35 2,920 0 51 6 40 51 0.0
Port Arthur 15 0 3 2 4 32 52 0.0
Corpus Christi 179 2 9 28 0 17 53 0.0
Texas 831,258 830,769 798,307 855,586 883,800 906,843
U.S. 10,726,069 11,332,821 10,362,483 11,240,344 11,952,135 11,935,906
Table 5: U.S. Container Imports in TEUs by Customs Port14
Customs Port 2007 2008 2009 2010 2011 2012
2012
U.S.
Rank
2012
%
TX
Houston 616,439 574,348 481,703 519,247 559,316 618,891 10 93.2
Freeport 31,326 31,114 35,370 31,601 29,609 34,235 26 5.2
Galveston 3,982 5,047 6,016 8,037 11,427 8,517 32 1.3
Beaumont 296 288 382 472 387 1,100 37 0.2
Corpus
Christi
595 243 195 241 380 1,051 38 0.2
Port Arthur 49 33 303 189 70 312 45 0.0
Brownsville 0 1 0 0 1 1 81 0.0
Port Lavaca 0 1 0 0 0 0 82 0.0
Texas City 0 0 0 0 3 0 83 0.0
Texas 652,686 611,075 523,969 559,788 601,193 664,109
U.S. 18,502,108 17,120,767 14,541,415 16,626,033 17,077,443 17,541,120

| 29
3.3.1 Air Cargo
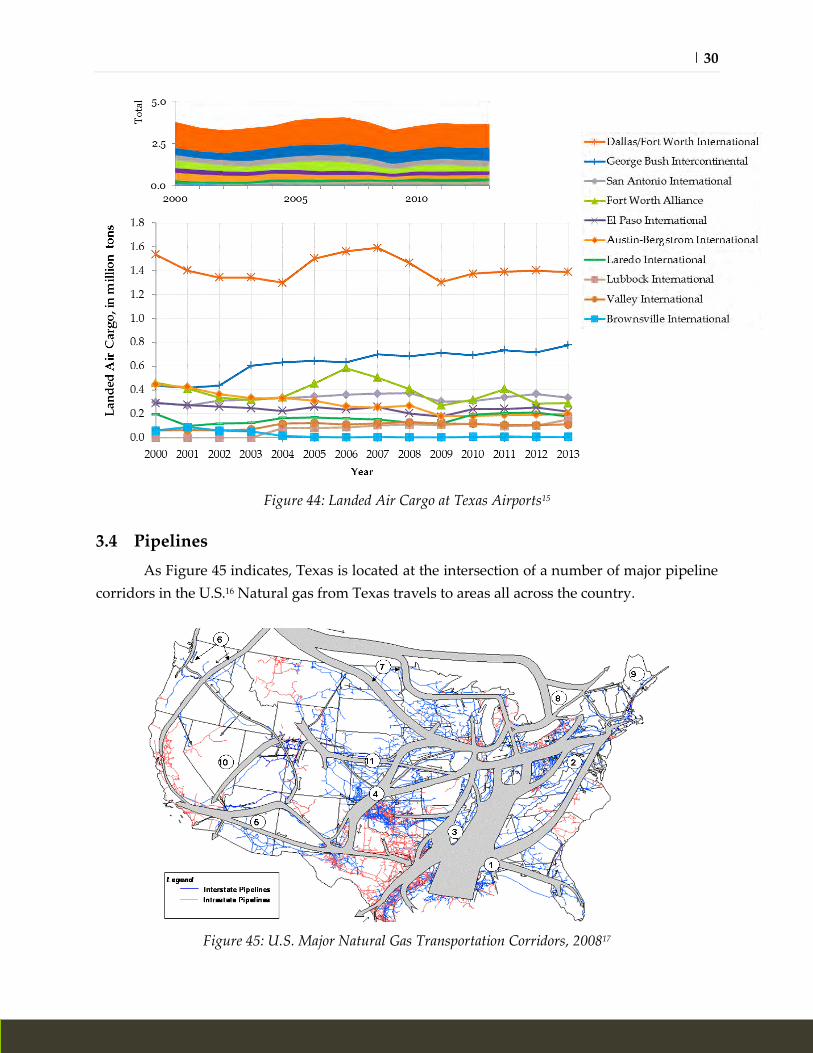
The Federal Aviation Administration reports data on the amount of cargo landing at
each of the major airports in the U.S.15 In 2013, airports in Texas moved a total of 8 billion tons
of cargo, representing 5.9% of total U.S. air cargo tonnage, as shown in Figure 43. Dallas-Fort
Worth International Airport ranked 10th amongst U.S. airports located in Texas, followed by
George Bush Intercontinental (17th), San Antonio International (28th), and Fort Worth Alliance
(35th). Figure 44 shows the annual trend in cargo movement through Texas airports. George
Bush International experienced a gradual growth in air cargo movements from 2000 to 2013 at
an annual average growth rate of 4.5%. Other airports experienced less steady growth within
the same time period, except from 2009 when annual average growth rates greater than 1%
were recorded for Brownsville (3.5%), Laredo (3.0%), Lubbock (2.6%), and El Paso (1.6%). All
the other remaining airports had annual average growth rates of less than 1% from 2009 to 2013.
Figure 43: Landed Air Cargo – U.S. and Texas15
| 30
Figure 44: Landed Air Cargo at Texas Airports15
3.4 Pipelines
As Figure 45 indicates, Texas is located at the intersection of a number of major pipeline
corridors in the U.S.16 Natural gas from Texas travels to areas all across the country.
Figure 45: U.S. Major Natural Gas Transportation Corridors, 200817

| 31
Texas is the top natural gas producer and consumer in the U.S. and has the most
intrastate natural gas pipelines.18 Demand for pipelines in Texas is high due in large part to
natural gas fields found in areas such as the Eagle Ford Shale, the Barnett Shale, and the
Permian Basin, as shown in Figure 46.
Figure 46: Lower 48 States Shale Plays19
Figure 47: 2012 Top 10 Natural Gas Producing States in the U.S. 20
0.0
1.0
2.0
3.0
4.0
5.0
6.0
7.0
8.0
Nat
ura
l G
as P
rod
uct
ion
,
in t
rill
ion
cu
bic
fee
t

| 32
In terms of production, in 2012, Texas produced almost 30% of the natural gas in the U.S.
in trillions of cubic feet, as shown in Figure 47.20 Louisiana, the second highest producer,
produced less than half of Texas’s over 7 trillion cubic feet. Based on the most recently available
data, Texas also accounted for 31.8% of total U.S. natural gas exports in 2013 as shown in Figure
48.
Figure 48: 2012 Top 10 Natural Gas Producing States in the U.S.Error! Bookmark not defined.
As shown in Figure 49, Texas is also the U.S. leader in crude oil production. In 2012,
Texas produced over 30% of the U.S.’s crude oil, and over three times as much as the next
highest producer, North Dakota.
Figure 49: 2012 Top 10 Crude Oil Producing States in the U.S. 20
0
100
200
300
400
500
600
700
800
Cru
de
Oil
Pro
du
ctio
n,
in m
illi
on
bar
rels

| 33
A heated debate surrounds the transport of fuel by pipeline versus rail. Many
environmentalists and landowners are against pipelines because of the risk of spills or leaks, but
recent reports by the U.S. State Department have highlighted the danger of transporting fuel by
rail.21 Recently, a number of accidents involving oil transport by rail have occurred, some of
them with fatalities. One of the most deadly was a derailment in Quebec in 2013 that killed 47
people.22, 23
In Texas and at the national level, the debate centers around the approval of the
northern section of the Keystone XL pipeline as shown in Figure 50 which would transport oil
from Canada to the Gulf Coast through Texas.24
Figure 50: Major Crude Oil Pipelines25

| 34
4 Texas Trade Corridors and Infrastructure Projects
4.1 International Trade Corridors Serving Texas
Texas is served by a number of international and national major trade corridors. Figure 51
shows the international trade corridors serving Texas companies through imports and exports.
The dominant options are the Asia-West Coast trade corridor through the Port of Los Angeles26
and the Asia-Panama Canal corridor.
Figure 51: Global Corridors Serving Texas Trade27
The Asia-West Coast ports trade corridor is the dominant option for transporting
containerized cargo from Asia to the Texas market. It is served by rail, which provides premium
services to be competitive with trucking. The total transit time from Hong Kong to Houston is
estimated to be 18–22 days, including at least 11 days sailing, 2 days port clearance and rail
loading, and 4–6 days on rail26.
The Asia-Panama Canal corridor is served by two main options: 1) direct calls between
an Asian port and the Port of Houston, and 2) a hub-and-spoke network where large vessels
dock at either the Panama Canal Zone (Port of Manzanillo or Port of Balboa) or a Caribbean

| 35
port, and cargo is transferred into smaller vessels that serve Gulf Coast and East Coast ports.
Reported transit times for container deliveries from Hong Kong to Houston or most other
destinations within Texas are 21 days under normal conditions. Potential delays of up to one
day can occur at the Panama Canal locks, particularly if the vessel does not secure a reservation
slot26. Though the construction of new locks to serve larger (post-Panamax) vessels will offer
more choices to shippers, the direct impact of the Panama Canal expansion on Texas ports is
uncertain. This uncertainty is due to a number of factors, such as global supply chain trends,
consumer demand, access to existing and emerging markets, advancements in maritime-related
technologies, transportation costs, and competition from western railroads, amongst others28. A
major concern for Texas, however, is landside issues such as rail terminal and highway
chokepoints. Researchers recommend that Texas continues to invest in its freight transportation
infrastructure to make the state more attractive for shippers considering using Texas Gulf Coast
ports to access the U.S. Midwest.
In addition to the Asia-West Coast and Asia-Panama Canal corridors, another key
emerging international trade corridor is the Mazatlán-Matamoros Corridor. Mexico recently
made a major investment in facilitating cargo movement in the form of the Durango-Mazatlán
Highway. This $2.2 billion dollar highway traverses an area of the country so geographically
treacherous it is known as the “Devil’s Backbone” and will cut travel times between Mazatlán
and the Lower Rio Grande Valley by six or more hours; transportation costs are expected to
drop between $500 and $1,500 per truck 29,30. The new corridor is expected to serve cargo marine
ports along the northern Pacific coast of Mexico and industries such as the Sinaloa-based
shippers of agricultural products26.
Other alternative international shipping routes to Texas include Lazaro Cardenas in
Mexico and the Suez Canal-East Coast corridor. The Port of Lazaro Cardenas is known to have
both the space and a naturally deep channel capable of serving the largest containership
currently in service. It is served by KCS de Mexico (KCSM), which controls a 1500-km (1000-
mile) route from Lazaro Cardenas to Laredo. KCSM has invested in its infrastructure in the last
three years to improve both speed and security and continues to grow its container traffic31. The
Suez Canal-East Coast corridor also serves Texas through U.S. East Coast ports via rail and
truck. Cargo vessels from Southeast Asia to the East Coast tend to use this route as the Suez
Canal provides the capacity to handle Post-Panamax vessels32. The expansion of the Panama
Canal is expected to strongly compete with this trade route once completed.

| 36
4.2 Major Trade Corridors in Texas
Texas boasts a number of trade routes that connect U.S. POEs to major urban areas in the
state and other parts of the U.S. The major interstate corridors serving the state include
Interstate Highways (IH) 10, 20, 35, 37, 45, and the newly designated 69, as shown in Figure 52.
Other critical highways serving the state include U.S. Highway 54 and State Highway 67. The
major rail corridors serving the state include the BNSF Midcon corridor, the Union Pacific (UP)
Memphis-Oakland and Laredo-Chicago corridors, and the Kansas City Southern Railway
Company (KCS)/KCSM Laredo corridor.
Figure 52: Major Interstate and State Highway Corridors Serving Texas Ports33
4.2.1 IH 35 Corridor
IH 35 extends from Laredo to the Oklahoma state line and directly connects the CBP
land and sea POEs of Laredo, San Antonio, Austin, Dallas/Fort Worth (DFW), Addison Airport,
Alliance Airport, and McKinney Airport. It traverses IH 10 at San Antonio and IH 20 at DFW as
shown in Figure 53. It connects to the Ports of Corpus Christi, Brownsville, Harlingen, Port
Isabel, and Port Mansfield via IH 37 and IH 69.33

| 37
Figure 53: Projects on IH 35 Corridor
As shown in Figure 53, major infrastructure projects to support trade that have been
recently completed or are currently underway along this corridor include the following:
IH 35 Central Expansion – Capital Area Project: The 66.5-mile project between SH 130
(north of Georgetown) and Centerpoint Road (south of San Marcos) will seek to identify
the effect of short- and mid-term transportation improvement strategies to alleviate
congestion and improve connectivity between all modes of transport (pedestrians,
bicycles, automobiles, transit, trucks, and emergency vehicles). The project concepts
include a future transportation corridor to accommodate an additional lane in each

| 38
direction, super streets, collector-distributor roads, innovative intersection solutions,
bicycle/pedestrian accommodations, traffic incident management, transit, and ramp
modifications. The project, which is divided into five segments, began in August 2011
with an expected completion date between 2018 and 2022 at a cost of $2.5 billion.34
IH 35 Central Expansion – Waco Area Projects: As part of a larger multijurisdictional
project from San Antonio to DFW, the Waco Area Project from Hillsboro (IH 35E/W
split) to the Bell/Williamson County Line will upgrade the existing IH 35 facility to a
minimum of six lanes at an estimated cost of $2.2 billion. Sections of this project are
currently under construction, completed, or have received bids for construction. Other
sections are also ready for construction but are currently unfunded.34
IH 35 Central Expansion – San Antonio Area Projects: These projects include the following:
1) Operational improvements to add an additional lane to IH 35 between FM 3009
and Judson Road,
2) Interchange improvements on IH 35 between IH 410N and IH 410S to provide
better access to Fort Sam Houston. Construction was anticipated to have begun
in 2013,
3) Long-range planning studies to manage congestion on IH 35, and
4) An environmental study on improvements to IH 35 from FM 1103 to IH 410
south. 34
SH 130 – The 91-mile state-owned toll road from Georgetown to IH 10 near Seguin was
opened to traffic in November 2012. The roadway provides congestion relief for IH 35
through Central Texas and offers additional mobility options for motorists in the area. 35
IH 35 East – This project involves the construction of managed lanes with dynamic
tolling along IH 35E from IH 635 at Farmers Ranch to IH 35 at Denton. The proposed
$4.8 billion project rebuilds the entire 28-mile corridor and involves two phases. Phase 1
will add one general purpose lane in each direction and two reversible managed lanes.
In addition, it will create continuous two to three lane frontage roads in each direction.
The estimated completion date for Phase 1 is 2017. Phase 2, which currently has no
estimated completion data, proposes two or more concurrent managed lanes in each
direction and rebuilding the highway and its respective bridges.36
LBJ Express - This 16.5-mile state-owned comprehensive development agreement (CDA)
with LBJ Infrastructure Group (LBJIG) is in Dallas County and involves improvements
on IH 35E from Loop 12 to IH 635. The estimated $3 billion project will construct four
general-purpose lanes and three managed lanes in each direction on IH 635 from east of

| 39
Luna Road to Greenville Avenue. Additional two-lane elevated ramps on IH 35E from
Loop 12 to north of IH 635 will also be constructed. The managed lanes will feature toll
rates adjusted as traffic increases or decreases (dynamic pricing) to improve traffic flow.
Construction of the project began in January 2011 and is scheduled to be opened by mid-
201537. Upon completion, LBJIG will be responsible for $500 million in operations and
maintenance over the next 52 years.38
North Tarrant Express - The North Tarrant Express (NTE) is a multiphase project in
Tarrant County that will provide six to 10 lanes on IH 35W, IH 820, SH 121, and SH 183.
It is also the first project built under a CDA agreement in Tarrant County with NTE
Mobility Partners (NTEMP). It is state owned, but financed, designed, and built by the
NTEMP. NTEMP will also operate and maintain the facility for 52 years. Segments 1 (IH
820 from IH 35W to SH121) and 2 (SH 121/183 to FM 157/Industrial Boulevard) were
completed in October 2014, nine months ahead of schedule. Segments 3A (IH 35W from
north of IH 30 to south of IH 820) and 3B (IH 35W from north of IH 820 to US 81/ 287)
are scheduled to be completed between 2017 and 201839. Future Segments 3C (IH 35W
from US 81/287 to SH 170/ SH 183) and 4 (IH-820 from SH 183 to Randol Mill Road) is
pending CDA request40.
Dallas Horseshoe Project – This is a $798 million design-build roadway construction to
improve the IH 35E/IH 30 interchange. Construction improvements include the
expansion, repaving, and addition of several new bridges and roadways along IH 30
and IH 35E; the widening of IH 30 and IH 35E to a total of 23 lanes, and the construction
of a new signature bridge, the Margaret McDermott Bridge, over IH 30.41
Southern Gateway – This project involves the reconstruction and widening of 19 miles of
IH 35E to include additional main lanes and reversible high-occupancy vehicle
(HOV)/managed lanes from IH 20 to Eighth Street. It also involves the reconstruction
and widening of 11 miles of US 67 to include additional main lanes and reversible
HOV/managed lanes from FM 1382 to IH 35E. Phase 1 of the project is still in the
preliminary engineering phase and an estimated completion date is not yet set. A CDA
will be requested to fund the managed HOV lanes.42
4.2.2 IH 10 Corridor
IH 10 extends from the New Mexico state line west of El Paso to the Louisiana state line
east of Beaumont. It directly connects the CBP POE cities of El Paso, Fabens, San Antonio, and

| 40
Houston. It connects to Midland and DFW via IH 20, Laredo and Austin via IH 35, and Corpus
Christi via IH 35 in San Antonio. It also connects to the Port of Beaumont (US 90), Port Orange
(US 90), Port Arthur (TX 73), Sabine Pass (TX 73), and Texas City (IH 45). One major
infrastructure project in Houston with a relationship to IH 10 is the proposed 180-mile Grand
Parkway (SH 99). The proposed loop, sections of which are currently under construction, will
have two major interchanges with IH 10. The first interchange will connect IH 10 with US 290
and IH 69 on the west end of the loop. The second interchange will connect IH 10 with US 90 on
the east end, as shown in Figure 53.43
Figure 54: Grand Parkway (SH 99)43
4.2.3 IH 69 Corridor
IH 69 is a proposed 1,600-mile roadway from south Texas to the city of Texarkana, en
route to the state of Michigan. The IH 69 route in Texas includes existing highways such as US
59, US 77, US 84, US 281, and SH 44, as shown in Figure 55. The roadway segments are
identified through a Citizen Advisory and Segment Committee and are expected to benefit both
passenger and freight movement. The first segment of IH 69 in Texas was designated in October
2011. It runs along US 77 from IH 37 in Corpus Christi to SH 44 in Robstown (approximately 6.2
miles). The second segment, designated in July 2012, runs concurrently with US 59 for 35 miles,

| 41
from approximately 0.2 mile north of the Liberty/Montgomery County line to IH 610 North in
Houston. Additional designated segments include IH 369 from IH 30 to Loop 151 in Texarkana,
IH 69 from IH 610 West in Houston to the limits of US 59 access control south of Rosenberg, IH
69E from the junction of Business 77 north of Raymondville to the limits of US 77 access control
in Brownsville, and IH 69C from the junction of FM 2812 in Edinburg to IH 2 in Pharr. To date,
a total of approximately 140 miles have been designated as part of the IH 69 system in Texas.
The Texas Department of Transportation (TXDOT) is petitioning the American Association of
State Highway Officials and Federal Highway Administration (FHWA) to recognize additional
segments of IH 69, including US 59 inside IH 610 in the Houston area, US 59/Loop 20 in Laredo,
and extending segments on US 281 and US 77. To date, approximately 31 projects have been
funded along the IH 69 system with total development costs exceeding $850 million.44
Figure 55: IH 69 Corridor Designation44
4.2.4 IH 20 Corridor
IH 20 runs east to west from IH 10 near Kent, through Midland, Abilene, and DFW to
the Texas-Louisiana border line near Waskom. In Fort Worth, it interchanges with IH 30, which
heads east and IH 20 continues to the southeast. IH 20 intersects IH 35 in Fort Worth, IH 45 in
Dallas, and US 69 in Lindale, east Texas.

| 42
4.2.5 IH 45, 37, and 40
IH 45 connects the Port of Galveston to Dallas through Houston. It is a major trade
corridor for shipments from the Port of Houston and destined to the U.S. heartland. It intersects
with IH 10 in Houston and connects to IH 35 via IH 20, IH 30, or US 77 in Dallas.
In addition, two other important trade corridors serving Texas trade are IH 37 and IH
40. IH 37 runs from Corpus Christi to San Antonio and IH 30 runs from IH 20 (west of Fort
Worth) to IH 40 in North Little Rock (Arkansas) through Dallas and Texarkana. IH 37 connects
to IH 10 and IH 35 in San Antonio.
4.2.6 Other Major Infrastructure Projects Supporting Trade
Border Highway West Extension – As shown in Figure 56, the Loop 375 Border Highway
Extension Project is a 9-mile roadway from Racetrack Drive to US 54. It adds additional
capacity to and upgrades the existing facility by providing a new four-lane, partially
controlled access facility. Of the 9 miles, 7.1 miles are tolled. The project also closes the
gap on existing Loop 375 that exists from downtown Santa Fe Street to US 85. Planning
for the project was originally federally funded and began in September 2007. TXDOT
restarted the planning studies in September 2011 with state funds. All segments of this
$800 million project are expected to be completed by 2018.45
Figure 56: Border Highway West Extension45

| 43
DFW Connector – The DFW Connector project doubles the capacity of SH 114/121 around
the north DFW International Airport entrance from FM 1709 to north of IH 635. The
project adds four to seven northbound and three to six southbound lanes on SH 121 and
six to eight lanes in each direction on SH 144, as shown in Figure 57. The SH 114/121
segment of project was completed in 2014 and segments of the 8.4-mile roadway is tolled
using dynamic pricing. 46, 47 Construction of the FM 2499 section of the project began in
August 2013 and is estimated to be completed by 2017 at a cost of $90 million.48
Figure 57: DFW Connector48
Harbor Bridge – As shown in Figure 58, the approximately $800 million project seeks to
replace the existing Harbor Bridge over the Corpus Christi Ship Channel and reconstruct
sections of US 181, IH 37, and the Crosstown Expressway in Corpus Christi. The Final
Environmental Impact Statement identifies the recommended design to consist of a
controlled-access facility and six lanes (three in each direction) within the right-of-way.
The design includes a 10-foot bicycle and pedestrian shared-use path on the main span
of the bridge and on the bridge approaches. The current construction start date is late
2015 with an estimated project completion date of 2019.49
Loop 9 – The estimated $1.3 billion Loop 9 expansion located southeast of Dallas will
facilitate the movement of people and serve intermodal facilities in southern Dallas,

| 44
Ellis, and Kaufman Counties. As shown in Figure 59, the project extends 35 miles from
IH 20 in Mesquite to US 67 and will provide mobility for increasing residential,
industrial, and commercial development. The project consists of constructing three
mixed auto and truck tolled lanes in each direction with an opportunity for separating
auto and truck traffic in the future. Insufficient funding since 1995 has stalled project
development. A draft environmental impact statement is currently underway and the
current planning approach is to allow for portions of the project to be built
incrementally.50
Figure 58: Harbor Bridge49
Figure 59: Loop 9 Project50
Loop 1604 – This project involves the development of a relief route along Loop 1604
between US 90 and IH 35, as shown in Figure 60. Phase I of the project involves the
construction of a four-lane non-tolled expressway from FM 471 to SH 16 (Bandera
Road). It is estimated to be completed in 2017. Phase II involves constructing a four-lane
non-tolled expressway from FM 1957 to FM 471. It is planned for letting in FY 2015.
Construction of additional capacity improvements between US 90 and IH 35 will be
scheduled as the environmental studies progress and financial strategies develop.51
US 77 – A 10-mile upgrade of US 77 to interstate standards is planned between
Kingsville and Driscoll as part of an overall US 77 upgrade from Corpus Christi to
Harlingen, as shown in Figure 61. The upgraded US 77 is part of the IH 69 High Priority
System. The project involves the construction of a four-lane divided highway with

| 45
frontage roads, new overpasses and interchanges at an estimated cost of $84.2 million.
The project has an estimated completion date of 2016.52
Figure 60: Loop 1604 Relief Route51
Figure 61: US 77 Upgrade52
| 46
5 Mexico Infrastructure Projects Related to Trade
The Mexican National Infrastructure Program has published data for their 2014–2018
planning period. 53 Projects are categorized by sector and state.54 One of the major stated goals
by the Secretaría de Comunicaciones y Transportes (SCT) for the 2014–2018 plan is to make
Mexico a key global logistical center, reaching beyond NAFTA boundaries. Improved
transportation systems will continue to benefit trade with Texas and for the purpose of this
report, projects for the Communications and Transport sector for the states of Coahuila,
Chihuahua, Nuevo León, and Tamaulipas are listed below. These four states share a border
with Texas and are therefore assumed to have the most direct impact on facilitating trade with
Texas. Below is a list of projects, brief descriptions, and their cost by region.b
5.1 Chihuahua
East Chihuahua Bypass: Located in the municipalities of Aquiles Serdan, Chihuahua,
and Aldama, the bypass will be approximately 42 kilometers long and 12 meters wide. It
is projected to increase safety for the almost 1 million inhabitants, offer a faster way to
travel through the area, and foster economic development.55 Estimated cost: MEX$1.62
billion
Guadalupe/Tornillo International Bridge and approach: This new 0.68-kilometer-long
crossing will replace the Fabens-Caseta bridge and will accommodate both commercial
trucks and private vehicles.56 Estimated cost: MEX$188 million
Expansion of Chihuahua Airport: Plans are to improve the security areas and the
perimeter roads. Estimated cost: MEX$50 million
Highway Parral (Vía Corta), Palomas-Satevo section: 44.5 kilometers of the highway
between Palomas and Satevo will be widened to four lanes. This is expected to alleviate
traffic for the over 111,000 inhabitants in the region and foster economic development.57
Estimated cost: MEX$475 million
Urban coexistence in Ciudad Juárez: 19 kilometers of train tracks are planned for Ciudad
Juárez. Estimated cost: MEX$910 million
Modernization of the Palomas-Parral Highway: From kilometer 92 to kilometer 18,
widen the federal highway Palomas-Hidalgo of Parral to a section with two 3.5-meter
lanes and 2.5-meter shoulders. Estimated cost: MEX$207 million
b It is unknown by the authors how many of these projects are included in the Regional Border Master Plans discussed in Section 6 of this report.

| 47
5.2 Coahuila
La Laguna bypass: Construct a 21-kilometer bypass made up of four lanes. Estimated
cost: MEX$1.33 billion
Government Commitment-055: Build the Abasolo Peripheral Bridge in Saltillo. The
bridge will be 890 meters long and is expected to be able to hold 4,500 vehicles.
Currently 95,000 vehicles travel in this area.58 Estimated cost: MEX$300 million
Government Commitment-186: Modernize approximately 180 kilometers of the San
Pedro-Cuatro Ciénagas highway. This highway is particularly important as a trade
route, as it is part of the economic corridor that originates in Mazatlán, where many
Asian goods are received. The connection of the Torreón, Coahuila region to the coast is
known as the “Port to Plains” project.59 Estimated cost: MEX$160 million
Government Commitment-187: Modernize the San Buenaventura-Hermanas bypass.
Estimated to be 47 kilometers long at its completion, the bypass will connect San
Buenaventura to Highway 57, eliminating the need to pass through Ciudad Frontera to
get to Highway 57 and reducing traffic in populated areas.60 Estimated cost: MEX$66
million
Government Commitment-115: Finish the modernization of the second Gomez-Palacio-
Torreón ring road. The new four-lane road will begin in Matamoros, Coahuila and
connect with Durango. Once the modernization is complete, commercial trucks will be
able to avoid entering towns. Estimated cost: MEX$1.15 billion
5.3 Tamaulipas
Expansion of the Port of Altamira: The Port of Altamira is the first Latin American port
with enough depth for petroleum platforms. This work will consist of an expansion of
the breakwaters and dredging the port. The dredging will allow the port to receive
vessels with 50 foot depth.61 The port will have significant access to rail and roadways
and will have an area for natural gas compression. Estimated cost: MEX$10.7 billion
Reynosa Bypass: Construction of two lanes from San Fernando to the Pharr-Reynosa
International Bridge.62 It is expected that this bypass will cut wait times from up to 2
hours to only 30 minutes. In 2013 it was estimated that the bypass is being used at only
56% of its capacity for commercial vehicles.63 Estimated cost: MEX$644 million
Multiple Use Terminal in Tampico: Construction of a new terminal to increase the
capacity of general cargo handling, especially steel and mineral bulk. Estimated cost:
MEX$922 million
| 48
Second part of the International Bridge of Matamoros III “Los Tomates” and two vehicle
crossings: Construction of a 14.4-meter-wide parallel bridge in order to increase
capacity. Repaving of 1.8 kilometers and construction of two vehicle overpasses on the
access road, which is expected to double the crossing capacity.64 Estimated cost:
MEX$154 million
Matamoros bypass and border crossing: Construction of an international rail bridge and
11 kilometer bypass. This will move rail traffic away from the urban areas of
Brownsville and Matamoros. The Mexican Association of Railroads estimates that in a
few years a third of cargo in Mexico will be moved by rail.65 Estimated cost: MEX$804
million
International bridge and Matamoros-Brownsville bypass: New highway access to the
Matamoros border crossing. Estimated cost: MEX$46.8 million
Government Commitment-128: Modernize Monterrey Avenue in Tampico, Ciudad
Madero, and Altamira. This project will greatly improve travel between the three areas.66
Estimated cost: MEX$260 million
Government Commitment-131: Modernize the Tampico- Ciudad Victoria Highway on
the border with the state of Nuevo León, first phase. Estimated cost: MEX$991 million
Government Commitment-180: Modernize the Reynosa-Río Bravo Highway and
complete the Reynosa viaduct. The first phase of the modernization of the Reynosa- Río
Bravo Highway will include expanding the highway to six lanes from the Pharr-Reynosa
International Bridge to Anzaldúaz and is expected to have a traffic flow of almost 26,000
vehicles.67 Estimated cost: MEX$486 million
Government Commitment-182: Consolidate the development and operation of the Port
of Matamoros. The port will principally deal with petroleum products.68 Estimated cost:
MEX$1.06 billion
Government Commitment-183: Finalize and begin operation of the Nuevo Laredo cargo
airport. Though it has been projected to handle 170,000 tons of cargo and be open 24
hours a day, construction on the airport started in 2008 and the project has struggled for
completion.69 Estimated cost: MEX$185 million
5.4 National
A number of national projects were also deemed relevant, such as the following:
Urban signage package: Package to improve rail signage in the entire country. Estimated
cost: MEX$2 billion
| 49
National rural roads program: Project to modernize and conserve 12,500 kilometers of
rural roads. Estimated cost: MEX$70.2 billion
National program to conserve highways: Program to conserve the federal non-toll
system of 43,800 kilometers. Estimated cost: MEX$102 billion
Government Commitement-027: Strengthen air, maritime, and rail connectivity in the
country to accelerate the growth of tourism. Estimated cost: MEX$775 million
5.5 Aduanas
The Administración General de Aduanas (the counterpart to the CBP in the U.S.) publishes its
own list of high impact projects under the Secretaría de Hacienda y Crédito Público (SCHP, The
Ministry of Finance and Public Credit).70 The following list of cargo-related projects are
included in the high impact projects slated for 2013–2018 along the Texas border.
Nuevo Laredo, World Trade Bridge: Automate dispatch and reorganizations.
o Projected benefits: Ease of operations; optimization of human resources,
materials, and space
Reynosa, Pharr International Bridge: Opening of cargo handling at Anzaldúaz and Río
Bravo-Donna.
o Projected benefits: Redistribution of cargo across bridge system; increased
competitiveness
Ciudad Juárez, Guadalupe-Tornillo: New border crossing for cargo, private vehicles,
and pedestrians.
o Projected benefits: New installations for the inspection of private vehicles and
commercial cargo; opening of a commercial cargo crossing
Ciudad Juárez, Zaragoza-Ysleta Bridge: Reorganization
o Projected benefits: 50% increase in platform capacity, 66% increase in import exit
lane capacity, and 25% increase in equipment capacity
Colombia Solidarity: Highway connection to Aduanas
o Projected benefits: Redistribution of cargo with Nuevo Laredo; optimization of
current infrastructure

| 50
6 U.S.-Mexico Border Master Plans and Border Wait Time
Studies
Border master plans are comprehensive, binational long-range plans to 1) inventory
transportation and POE infrastructure that facilitates trade, 2) prioritize and promote planned
POE and related transportation projects, 3) inform decision making, 4) allocate limited funding
resources, and 5) ensure continued dialog and coordination on future POE and supporting
transportation infrastructure needs and projects.71
With support from the U.S.-Mexico Joint Working Committee on Transportation
Planning and Programming, the FHWA, and the U.S. Department of State, so far five major
border master plans have been developed for the U.S.-Mexico border region. Three of these
plans were developed for the Texas-Mexico border alone. A summary of prioritized projects for
each of the Texas-Mexico border master plans, as presented in their respective reports, is
provided below. The summary is limited only to the projects in Texas counties. It is unknown
at this time how many of the Mexico projects discussed in Section 5 of this report are included
in the Regional Border Master Plans.
6.1 El Paso/Santa Teresa-Chihuahua Border Master Plan
The El Paso/Santa Teresa-Chihuahua Border Master Plan was completed in October 2013. Its
focused study area, as shown in Figure 62, ranged from the northwest (Las Cruces, New
Mexico, on the U.S. side; and approximately Marker 28 on MEX 2 and Marker 305 on MEX 45
on the Mexican side) to the southeast (Sierra Blanca, Van Horn, and Casa Piedra on the U.S.
side; and Coyame del Sotol and Ejido Potrero del Llano on the Mexican side).
Figure 62: El Paso/Santa Teresa-
Chihuahua Border Master Plan Focused
Study Area71

| 51
On the U.S. side, 35 POE projects, 43 road and interchange projects, 5 transit projects,
and 2 rail projects were identified. On the Mexican side, 23 POE projects, 51 road and
interchange projects, 1 transit project, and 3 rail projects were identified. Projects were ranked
by country, county, type of POE, road and interchange, transit, and rail. The complete ranking
and descriptions of all projects, by type, in each country is provided in the El Paso/Santa Teresa-
Chihuahua Border Master Plan.71
In El Paso County, the top ranked existing POE projects are i) constructing the Freight
Shuttle System, ii) adding up to six primary inspection lanes to increase capacity on Ysleta-
Zaragoza International Bridge, and iii) reconfiguring the passenger vehicle bridge, also on
Ysleta-Zaragoza International Bridge, to increase the number of lanes from five to six.
The top ranked road and interchange projects in El Paso County include i) constructing
a new commercial access road to the Ysleta-Zaragoza International Bridge, ii) interchange
improvements on IH 10, and iii) expanding the capacity of US 62 between Global
Reach/Yarbrough Drive and RR 659 (Zaragoza Road).
Four bus rapid transit (BRT) projects and one preliminary engineering study for a BRT
system on US 62/180 were identified in El Paso County. The BRT system routes include SH 20
(Alameda Avenue) on Santa Fe Street at Fourth Avenue to Zaragoza Road, US 180 Montana
Corridor Route, and SH 20 (Mesa Street) between Fourth Avenue and Remcon Circle.
A planned freight rail project in El Paso County involves various upgrades to 31 bridges
on the BNSF El Paso Subdivision over the next 10 to 15 years. The project, which was ranked
second in the U.S., is expected to have substantial impacts on rail freight movement between the
United States and Mexico. 71
In Presidio County, the highest ranked POE projects are the preparation of a Presidential
Permit for the addition of a twin structure at the Presidio-Ojinaga International Bridge, the
construction of a commercial and bus inspection facility, and the International Rail Bridge on
South Orient. Planned improvements to install intelligent transportation system (ITS)
technologies on US 67 between O'Reilly Street and the Presidio-Ojinaga International Bridge
constitute the only road and interchange project in Presidio County that was identified and
included in the Border Master Plan.71
6.2 Lower Rio Grande Valley-Tamaulipas Border Master Plan
The Lower Rio Grande Valley-Tamaulipas Border Master Plan was completed in October 2013.
Its focused study area, as shown in Figure 63, comprised TXDOT’s Pharr District (i.e., the
counties of Cameron, Hidalgo, Starr, and Zapata) and the Mexican municipalities of Camargo,
Guerrero, Gustavo Díaz Ordaz, Matamoros, Mier, Miguel Alemán, Reynosa, Río Bravo, and
Valle Hermoso in the State of Tamaulipas.72

| 52
Figure 63: Lower Rio Grande Valley–Tamaulipas Border Master Plan
Focused Study Area72
On the U.S. side, 38 POE projects, 18 road and interchange projects, and 2 marine port
projects were identified in the focused study area. On the Mexican side, seven POE projects,
seven road and interchange projects, and one marine port project were identified. Similar to the
El Paso/Santa Teresa-Chihuahua Border Master Plan, projects were ranked by country, county, type
of POE, road and interchange, and marine port. The complete ranking and descriptions of all
projects, by type, in each country is provided in the Lower Rio Grande Valley-Tamaulipas Border
Master Plan report.72
In Cameron County, the highest ranked POE projects are i) constructing two new
causeway-style bridge spans to connect the Port of Brownsville directly with Mexico, ii)
constructing a new bridge between FM 3248 and Avenida Flor de Mayo, and iii) reconfiguring
and rebuilding the existing Gateway International Bridge to comply with current design
standards and operational requirements.
Planned road and interchange projects also in Cameron County include i) widening FM
1925 from a two-lane undivided facility to a four-lane divided facility between FM 907 and US
77, ii) widening SH 32 to a four-lane divided facility, and iii) constructing overpasses on SH 32
at SH 4 and FM 3068. The two marine port projects, which are both located in Cameron County,
involve widening and deepening the Brownsville Ship Channel to accommodate post-Panamax
vessels and constructing a new general-purpose cargo dock along the Brownsville Ship
Channel.72

| 53
In Hidalgo County, highest ranked POE projects involve i) constructing northbound and
southbound Federal inspection facilities for empty commercial trucks at the Donna
International Bridge, ii) adding four additional non-commercial lanes to the existing six non-
commercial lanes at Anzaldúas International Bridge and constructing new northbound
commercial import lot facilities, and iii) adding two additional northbound passenger-only-
vehicle (POV) lanes to alleviate queuing also at Anzaldúas International Bridge and expanding
the secondary vehicle inspection facility to accommodate southbound commercial truck traffic
and buses.
The highest ranked road and interchange projects in Hidalgo County include i)
constructing a new two-lane controlled-access tolled facility for the International Bridge Trade
Corridor from US 281 at Spur 600 to FM 493, ii) constructing an overpass and modifying ramps
at US 83 and Bicentennial Boulevard, and iii) constructing a new four-lane controlled-access
facility on US 83 La Joya Loop from 2.3 miles west of the Hidalgo County line to 1 mile east of
the Hidalgo County line.72
Three planned POE projects were identified in Starr County. These involve i) expanding
the Río Grande City-Camargo Bridge by constructing two additional lane spans for southbound
traffic, ii) conducting a feasibility study and constructing a new commercial bus inspection
facility at Roma-Ciudad Miguel Alemán Bridge, and iii) constructing a new international border
crossing. However, very limited data were received for the two latter projects in the county.
The ranked road and interchange projects in Starr County include i) constructing a new
four-lane divided facility to connect Río Grande City-Camargo Bridge with FM 755 that
provides direct access to Río Grande City between US 83/Loma Blanca and US 83/La Puerta,
and ii) widening FM 755 to a four-lane divided facility from FM 755 (new realignment in Starr
County) to US 281 in Brooks County.72
6.3 Laredo District Coahuila/Nuevo León/Tamaulipas Border
Master Plan
The Laredo District Coahuila/Nuevo León/Tamaulipas Border Master Plan was the first of the
Texas-Mexico Border Master Plans and was completed in June 2012. Its focused study area was
25 miles north and south of the Texas-Coahuila/Nuevo León/Tamaulipas international border,
as shown in Figure 64.73
On the U.S. side, 14 POE projects, 88 road and interchange projects, and 3 rail projects were
identified in the focused study area. On the Mexican side, 37 POE projects, 44 road and
interchange projects, and 5 rail projects were identified. Similar to the previously discussed
border master plans, projects were ranked by country, type, U.S. city, and Mexican state. The
complete ranking and descriptions of all projects, by type, in each country is provided in the
Laredo District Coahuila/Nuevo León/Tamaulipas Border Master Plan report.73
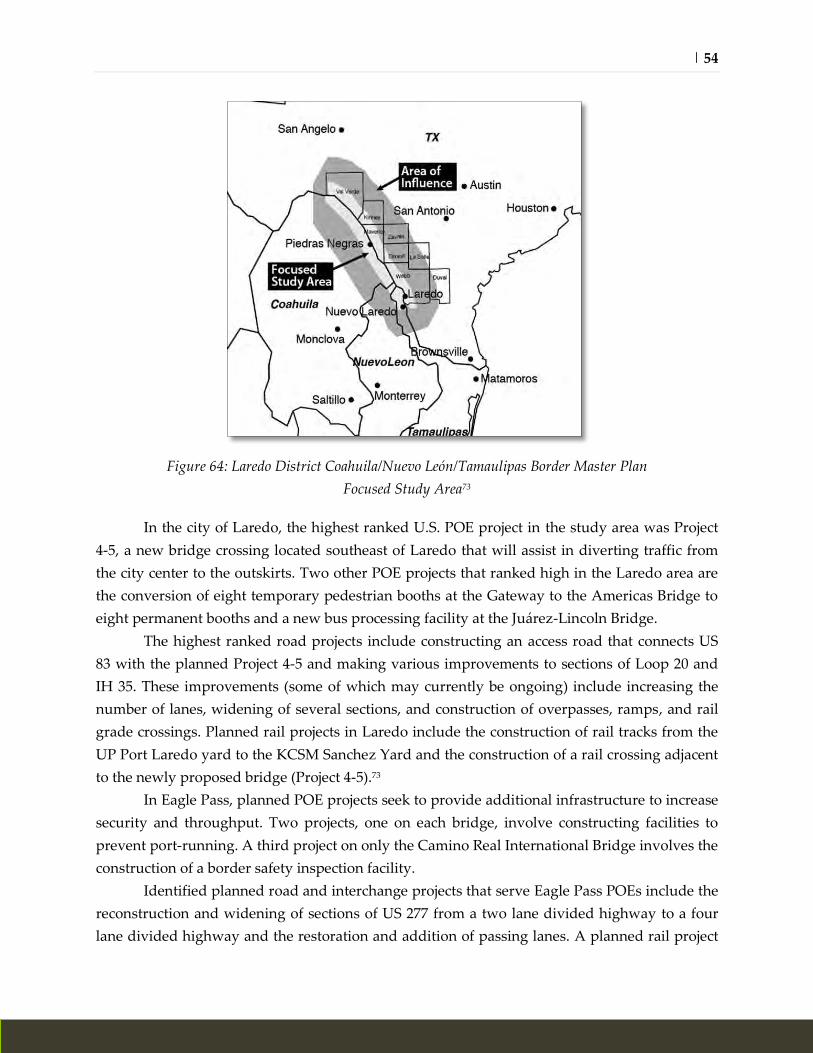
| 54
Figure 64: Laredo District Coahuila/Nuevo León/Tamaulipas Border Master Plan
Focused Study Area73
In the city of Laredo, the highest ranked U.S. POE project in the study area was Project
4-5, a new bridge crossing located southeast of Laredo that will assist in diverting traffic from
the city center to the outskirts. Two other POE projects that ranked high in the Laredo area are
the conversion of eight temporary pedestrian booths at the Gateway to the Americas Bridge to
eight permanent booths and a new bus processing facility at the Juárez-Lincoln Bridge.
The highest ranked road projects include constructing an access road that connects US
83 with the planned Project 4-5 and making various improvements to sections of Loop 20 and
IH 35. These improvements (some of which may currently be ongoing) include increasing the
number of lanes, widening of several sections, and construction of overpasses, ramps, and rail
grade crossings. Planned rail projects in Laredo include the construction of rail tracks from the
UP Port Laredo yard to the KCSM Sanchez Yard and the construction of a rail crossing adjacent
to the newly proposed bridge (Project 4-5).73
In Eagle Pass, planned POE projects seek to provide additional infrastructure to increase
security and throughput. Two projects, one on each bridge, involve constructing facilities to
prevent port-running. A third project on only the Camino Real International Bridge involves the
construction of a border safety inspection facility.
Identified planned road and interchange projects that serve Eagle Pass POEs include the
reconstruction and widening of sections of US 277 from a two lane divided highway to a four
lane divided highway and the restoration and addition of passing lanes. A planned rail project
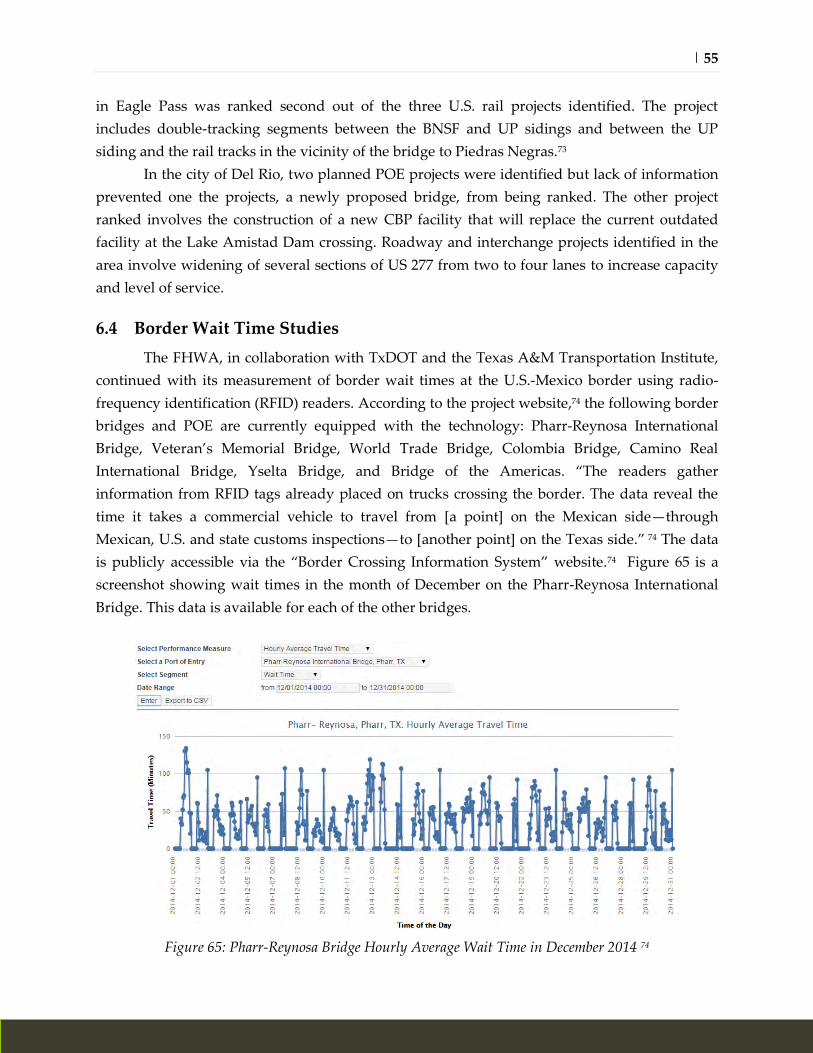
| 55
in Eagle Pass was ranked second out of the three U.S. rail projects identified. The project
includes double-tracking segments between the BNSF and UP sidings and between the UP
siding and the rail tracks in the vicinity of the bridge to Piedras Negras.73
In the city of Del Rio, two planned POE projects were identified but lack of information
prevented one the projects, a newly proposed bridge, from being ranked. The other project
ranked involves the construction of a new CBP facility that will replace the current outdated
facility at the Lake Amistad Dam crossing. Roadway and interchange projects identified in the
area involve widening of several sections of US 277 from two to four lanes to increase capacity
and level of service.
6.4 Border Wait Time Studies
The FHWA, in collaboration with TxDOT and the Texas A&M Transportation Institute,
continued with its measurement of border wait times at the U.S.-Mexico border using radio-
frequency identification (RFID) readers. According to the project website,74 the following border
bridges and POE are currently equipped with the technology: Pharr-Reynosa International
Bridge, Veteran’s Memorial Bridge, World Trade Bridge, Colombia Bridge, Camino Real
International Bridge, Yselta Bridge, and Bridge of the Americas. “The readers gather
information from RFID tags already placed on trucks crossing the border. The data reveal the
time it takes a commercial vehicle to travel from [a point] on the Mexican side—through
Mexican, U.S. and state customs inspections—to [another point] on the Texas side.” 74 The data
is publicly accessible via the “Border Crossing Information System” website.74 Figure 65 is a
screenshot showing wait times in the month of December on the Pharr-Reynosa International
Bridge. This data is available for each of the other bridges.
Figure 65: Pharr-Reynosa Bridge Hourly Average Wait Time in December 2014 74

| 56
7 Border Trade Advisory Committee
The Border Trade Advisory Committee (BTAC) was originally established in 2001 by the
Texas Transportation Code, Sec. 201.114. Members of this committee are appointed by the Texas
Transportation Commission. BTAC members represents a variety of interests—agencies, cities
and bridges along the border with Mexico and since 2006 have contributed to both TXDOT and
the Office of the Texas Secretary of State on their activities and success in meeting the BTAC
goals. The current BTAC members can be found in Appendix A of this report. According to the
Texas Transportation Code, "the committee shall define and develop a strategy and make
recommendations to the commission and governor for addressing the highest priority border
trade transportation challenges. In determining action to be taken on the recommendations, the
commission shall consider the importance of trade with the United Mexican States, potential
sources of infrastructure funding at border ports, and the value of trade activity in the
department's districts adjacent to the border with the United Mexican States.”
7.1 Goals and Strategies
Following its formation, the BTAC identified four main goals, documented in the first
BTAC report dated November 16, 2006. The BTAC also identified strategies, implementation
actions, measures, and responsible parties. These goals and implementation strategy summaries
are listed below, while the implementation strategies, measures, and responsible parties are
detailed in Appendix B:
1. Promote the development of ample and expandable trade transportation corridors.
o Support major trade corridors.
o Develop policies to facilitate trade at both state and federal levels.
2. Develop coordination mechanisms to foster trade between Mexico and Texas.
o Coordinate with Mexico to ensure proper planning of trade corridors
o Promote more efficient international border crossings.
o Promote cooperation with and understanding of U.S. policies.
3. Leverage safety and security measures to enhance trade efficiencies.
o Promote efficiencies at international border crossings.
o Develop international border crossings that take advantage of the latest
technologies and procedures.
o Review the Presidential Permit policy to facilitate international bridge
construction.
o Provide a balance between required inspections and efficient trade flow.

| 57
4. Demonstrate the economic benefits of international trade at the national, state, and local
levels.
o Identify national, statewide, and international benefits of trade.
Strategies developed by the BTAC are designed to be carried out by the state of Texas
but are not independent of the federal process. Some of the issues that the strategies address are
beyond the control of the State of Texas and are the responsibility of various federal agencies.
Each specific proposal, along with its implementation actions, measures of success, and
responsible party(ies), is presented in Appendix B of this report.
7.2 Update to BTAC Initiatives
Two BTAC meetings were organized from 2013 to 2014. The first was in December 11,
2013, and the second on July 16th, 2014. Key items and studies discussed during the meetings
are outlined in the next sections.
7.2.1 Study Regarding International Trade: Economic Impacts of Border Wait Times
This study was developed in fulfilment of section 201.1145 of the Transportation Code
(HB 1777 from the 83rd session) to examine the impacts of wait times on northbound
international truck crossings at Mexico-Texas border POEs. The report includes i) a discussion
of the border crossing process, ii) a literature review of recent studies on the economic impacts
of border delays, iii) results from interviews with and a survey of U.S. and Mexican border
stakeholders on the key issues determining delays, and iv) recommendations for improving
northbound Texas border POE truck wait times. The following outline summarizes the
recommendations for mitigating border wait times from the study as presented to the BTAC:
1. Improving inspection processes by:
o expanding the Free and Secure Trade (FAST) and Customs-Trade Partnership
Against Terrorism (C-TPAT) programs,
o standardizing and streamlining the inspection process across POEs,
o opening and manning all available primary and secondary inspection stations,
o expediting the processing of empty trucks, and
o speeding up the inspection process either through pre-screening cargo before it
enters the customs yard or designating specialized ports to process specific
commodities.
2. Improving coordination and management issues by:
o improving binational cooperation and planning of infrastructure between the
U.S. and Mexico,
| 58
o coordinating inspection processes,
o creating consistency among the rules and regulations between U.S. and Mexican
customs, and
o improving communication and exchange of ideas between the industry and CBP.
3. Implementing infrastructural improvements by:
o expanding, redesigning, or reconstructing current land POEs,
o clearly separating commercial vehicle processing facilities from passenger
vehicle processing facilities,
o providing additional inspection facilities, and
o constructing new POEs in low density areas.
4. Improving staffing by:
o increasing the number of inspectors at all land POEs,
o providing sufficient training to personnel, and
o providing more flexible staffing schedules to respond to peak demand.
5. Implementing changes to operating hours by:
o increasing POE operating hours to reduce peak demand volumes,
o modifying staff hours to meet demand, and
o implementing a phased and permanent rollout of the 24-hour commercial
crossing program.
6. Adopting technology to achieve these ends:
o speed up the document verification process,
o implement an integrated travel information system to provide cross-border
travel information for private and commercial travellers,
o track trailers to avoid re-inspection by other agencies, and
o develop and utilize a single electronic portal that provides all the agencies
involved in the inspection processes with access to similar information.
7. Examining strategies for sharing information regarding wait times with drivers and the
general public by:
o improving the consistency and precision of the CBP’s wait time collection,
o providing an accurate measure of wait times and crossing times for industries to
use for logistics decisions, and
o examining alternative means of data collection and dissemination, such as real-
time GIS maps of dynamic traffic conditions.

| 59
7.2.2 Texas Freight Mobility Plan
The Texas Freight Mobility Plan seeks to identify Texas’s freight transportation needs
and challenges, and define policies and investments that will enhance Texas’s freight
transportation system. The BTAC was briefed on the status of the Plan, including an extensive
outreach program carried out in June 2013 that covered 11 cities, including the border gateways
of El Paso, Laredo, and Brownsville. During the briefing, BTAC members were notified that
border concerns were raised during outreach meetings in Dallas, Houston, and other cities like
Lubbock, confirming the reach of NAFTA trade. The Texas Freight Mobility Plan also identifies
the Texas Priority Freight Network, which describes how freight moves within the state
boundaries, including connections to border gateways. Recommendations from the Plan will be
circulated to the stakeholders, including members of the BTAC, in 2015.
7.2.3 GAO Report No. 13-603: U.S. Mexico Border—CBP Action Needed to Improve
Wait Time Data and Measure Outcomes of Trade Facilitation Efforts
This report was presented to the BTAC with regards to CBP wait time data collection.
The report establishes that CBP commercial vehicle wait time data (i.e., the time it takes to
travel from the end of the queue to the CBP primary inspection point at land border crossings)
“are unreliable for public reporting and CBP management decisions across border crossings.”
The problem arises because CBP officers inconsistently implement the approved data collection
methodology and the methodologies used vary by crossing. The GAO report recommends that
steps be taken to help overcome challenges to consistent implementation of existing
methodologies—an example being the automated border wait time data collection program.
Other recommendations from the report include documenting CBP staff allocation process and
rationale, and developing outcome-oriented performance measures.75
The city of El Paso and the South Texas Assets Consortium, which includes Laredo,
Cameron County, Brownsville, Pharr, McAllen, and Rio Grande City, are exploring new ways
to fund CBP staffing at land POEs (although this effort currently does not address infrastructure
improvements). Through the Consolidated and Further Continuing Appropriations Act of 2013,
the cities gained the right to enter into a public-private partnership with the CBP to fund part of
the bill for increased staffing.76 In January, El Paso increased tolls at two bridges in order to
fund overtime for additional CBP staff at POEs.77,78 Using city funding for POEs has not been
previously allowed; this is the first time that the federal government and a local community
have partnered to encourage growth and trade across borders.79

| 60
8 Concluding Remarks
Texas continues to play a key role in growing U.S. international trade and serves as the
main gateway for trade with Mexico and other overseas partners. In 2013, the U.S. exported
about $1.6 trillion and imported about $2.2 trillion in goods, for a total of over $3.8 trillion in
trade. Texas was the number one exporting state accounting for 17.4% of total U.S. exports and
the number two importing state (second to California), accounting for 14.1% of total U.S.
imports. Texas’s top trading partners in 2013 were Mexico, China, Canada, Venezuela, and
Saudi Arabia. The state’s top commodity exports include machinery/electrical products, mineral
products, chemicals, transportation equipment, and plastics/rubbers. Top commodity imports
include mineral products, machinery/electrical products, transportation equipment, metals, and
other miscellaneous commodities.
Truck traffic continues to be the dominant mode for trade between the U.S. and Mexico
and exceeded pre-recession levels in 2011, 2012, and 2013. Laredo remains the number one port
of entry (POE) with the highest value of trade, followed by El Paso and Hidalgo. Northbound
commercial traffic at the Pharr-Reynosa International Bridge continues to increase, growing by
14.1% from 2012 to 2013. Between 2012 and 2013 the World Trade Bridge, Ysleta-Zaragoza
Bridge, Bridge of the Americas, Del Rio-Ciudad Acuña International Bridge, and the Free Trade
Bridge all experienced decreases in truck traffic.
The Laredo gateway continues to process the most trains and rail containers, followed
by Eagle Pass, El Paso, and Brownsville. Average annual growth rate from 2009 to 2013 at
Laredo is 20.15% compared to 13.70% at Eagle Pass. The Port of Houston is Texas’s busiest
water port and ranked second in the U.S. in terms of total tonnage moved through the port in
2012. It ranked first in U.S. imports and second in exports by tonnage. The state of Texas
accounted for 5.3% of total container trade in twenty-equivalent units (TEUs) moved through
U.S. marine ports in 2012, an increase of 0.2% compared to 2010 and 2011. Airports in Texas
moved a total of 8 billion tons of cargo in 2013, representing 5.9% of total U.S. air cargo. Dallas-
Fort Worth International Airport ranked 10th amongst U.S. airports located in Texas, followed
by George Bush Intercontinental (17th), San Antonio International (28th), and Fort Worth Alliance
(35th).
In 2013, 45% of the $158 billion worth of mineral fuel and oil exported from the U.S.
originated from Texas and natural gas and oil exploration in the shale regions was a significant
contributor. The impact of the recent drop in oil prices from fall 2014 to early 2015 on the Texas
economy is still unknown. For example, 37 out of 38 U.S. shale oilfields have an operating
break-even price greater than $50.00 a barrel and prices below this figure is already forcing
companies to lay off workers and cut production.80 It is already being reported that since the
beginning of the oil price decline, an estimated 30,000 workers worldwide are at risk of being
laid off at major energy companies such as Petróleos Mexicanos, Schlumberger, Baker Hughes,

| 61
and Halliburton.81 However, many global companies using natural gas as a feedstock are
evaluating investments in new facilities or extending capacity in Texas and Louisiana on the
basis of cheap available energy.82 In addition, global manufacturing companies—for example in
the automobile sector—are examining the benefits of re-shoring in the U.S and near-shoring in
Mexico to serve both NAFTA and global markets.83
A number of important infrastructure-related projects are also ongoing in some of the
major trade corridors serving Texas trade, especially the IH 35 corridor. Studies such as the
regional border master plans which help prioritize border infrastructure projects and the border
wait time measurement initiative which provides more accurate commercial vehicle wait times
are also relevant resources to facilitate U.S.-Mexico border trade. The completion of the
Statewide Freight Plan and an update to the Statewide Long-Range Transportation Plan will
also ensure that Texas’s transportation system can support the continued success of the state’s
economy. Overall, Texas seems well positioned to retain its role in U.S trade and this requires
investing in new transportation corridors, gateways and technologies—using federal, state and
public-private partnerships—to remain efficient and competitive.

| 62
Appendix A: Border Trade Advisory Committee (BTAC) Members
Metropolitan Planning Organizations
Brownsville MPO
Mayor Tony Martinez
City of Brownsville
Exp: 2014
El Paso MPO
Mayor Walter Miller
City of Horizon
Exp: 2014
Hidalgo County MPO
Mayor Diana Martinez
City of Alamo
Exp: 2014
Laredo MPO
Mayor Raul Salinas
City of Laredo
Exp: 2014
Harlingen-San Benito MPO
Mayor Chris Boswell
City of Harlingen
Exp: 2014
Ports of Entry
B&M Bridge
Julia Araujo
Director of Operations
Brownsville & Matamoros Bridge
Company
Exp: 2016
McAllen-Hidalgo & Anzalduas
International Bridges
Rigo Villarreal
Superintendent
McAllen-Hidalgo & Anzalduas Bridges
Exp: 2016
Veterans International Bridge at Los
Tomates
Free Trade Bridge at Los Indios
Gateway International Bridge
Pete Sepulveda, Jr.
Director
International Bridge System
Cameron County
Exp: 2016
Presidio Bridge
Michael O’Toole
TxDOT Bridge Division
Exp: 2016

| 63
Progreso International Bridge
Julie Ramirez
Bridge Manager
B&P Bridge Company of Weslaco
Exp: 2016
Yselta-Zaragoza Bridge
Good Neighbor Bridge
Paso del Norte Bridge
Paul Stresow
Bridge Director
City of El Paso
Exp: 2016
Port of Brownsville
Eddie Campirano
Port Director
Exp: 2014
Lake Falcon Dam Crossing
Lake Amistad Dam Crossing
Fort Hancock-El Porvenir Bridge
Fabens-Caseta Bridge
Bridge of the Americas
Commissioner Ed Drusina
International Boundary and Water
Commission
Exp: 2016
Starr-Camargo Bridge
Sam F. Vale
President
Starr-Camargo Bridge Company
Exp: 2016
Pharr-Reynosa International Bridge on the
Rise
Juan Guerra
Bridge Director
City of Pharr
Exp:2016
University Research Centers
Center for International Intelligent
Transportation Research
Texas Transportation Institute
Texas A&M University System, El Paso
Rafael M. Aldrete, Ph.D.
Program Manager
Exp: 2015
Center for Transportation Research
The University of Texas at Austin
Rob Harrison
Deputy Director
Exp: 2015

| 64
City and County Officials
Del Rio
Mayor Roberto Fernandez
Exp: 2014
Eagle Pass
Mayor Ramsey English Cantu
Exp: 2015
Regional Mobility Authority
Cameron County
David Allex
Chair
Exp: 2015
Others
International Bank of Commerce (IBC
Bank)
Eddie Aldrete
Sr. Vice President
Exp: 2015
Laredo Development Foundation
Rolando Ortiz
President
Exp: 2015
Independent Consultant
Jorge Canavati
Exp: 2015
Union Pacific
Ivan Jaime
Director Border Policy & Community
Affairs
Exp: 2016
Port of Corpus Christi
Judy Hawley
Port Commissioner
Exp: 2015
Borderplex Alliance
Rolando Pablos
CEO
Exp: 2016

| 65
Appendix B: Border Trade Advisory Committee (BTAC) Strategies
A. Trade Transportation Corridors
Promote the development of ample and expandable trade transportation corridors.
1. Strategy: Support the development of major identified trade corridors to assist the
expansion of Texas’s international trade. Efficient multimodal trade corridors in Texas
with connections to the Mexican transportation system will foster Texas trade with
Mexico and other regions of the world.
Implementation Action 1.1: Develop consensus and support for international
trade corridors.
Measure 1.1: Local delegations demonstrate broad support through
testimony at Texas Transportation Commission meetings/hearings.
Responsible Parties 1.1: Local.
Implementation Action 1.2: Develop consensus and support for all major trade
corridors.
Measure 1.2: Local delegations demonstrate broad support for future Texas
transportation projects.
Responsible Parties 1.2: Local.
Implementation Action 1.3: Develop local support for public-private
partnerships to fund international trade corridors.
Measure 1.3: Sufficient financial support to accelerate international trade
corridor development.
Responsible Parties 1.3: Local, state.
2. Strategy: Develop policies to facilitate trade at both state and federal levels. Trade
policies supported by adequate transportation infrastructure will stimulate the flow of
goods in the state and improve existing commercial corridors.

| 66
Implementation Action 2.1: Develop common measures of efficiency to reflect
trade throughput at all trade corridors to serve as a basis for establishing
funding priorities.
Measure 2.1: Completion and adoption of measures by state and federal
entities.
Responsible Parties 2.1: Local, state, federal.
B. Coordination with Mexico
Develop coordination mechanisms to foster trade between Texas and Mexico.
3. Strategy: Coordinate effectively with Mexico to ensure the planning and development
of through trade corridors. Formal and informal coordination efforts with Mexican
federal and state government agencies are important to ensure the development of
efficient U.S.-Mexico trade corridors.
Implementation Action 3.1: Enhance bi-state multimodal corridor planning
efforts through coordinated workshops
Measure 3.1: Number of workshops held for high-level bi-state multimodal
corridor planning.
Responsible Parties 3.1: State, Mexico.
Implementation Action 3.2: Develop prioritized binational local improvement
plans.
Measure 3.2: Number of prioritized binational local improvement plans
developed.
Responsible Parties 3.2: Local, Mexico.
4. Strategy: Promote more efficient international border crossings. Existing international
border crossing procedures and infrastructure should be examined on a continuing
basis to identify efficiencies that can be gained by coordinating with Mexican
stakeholders. Future international border crossing plans should be developed in close
coordination with Mexican and U.S. stakeholders to promote the efficient use of the
latest technologies, procedures, and infrastructure on both sides of the border.

| 67
Implementation Action 4.1: Harmonize private and public sector activities and
schedules to achieve maximum effective use of available international border
crossing infrastructure.
Measure 4.1: Reduced average delay at all international border crossings.
Responsible Parties 4.1: Federal.
5. Strategy: Promote cooperation with and understanding of U.S. policies. Constant
changes in U.S. security and safety policies impact the international border crossing
process and the overall trade between Texas and Mexico. It is important to support
cooperation efforts with Mexican government agencies and the trade community so that
new rules are understood and their impact on international trade is minimized.
Implementation Action 5.1: Organize and promote attendance to local
workshops for presentations by federal and state regulatory bodies, to include
extensive question and answer sessions with private sector and trade
communities.
Measure 5.1: Number of workshops and attendance.
Responsible Parties 5.1: Federal.
C. Safety and Security Measures
Leverage safety and security measures to enhance trade efficiencies.
6. Strategy: Promote efficiencies at international border crossings. By evaluating,
recommending, and implementing various procedures, efficiencies can be gained
throughout international border crossings. Some of the efforts that have been discussed
include eliminating the duplication of the vehicle safety inspections, combining security
facilities, implementing interoperable technology, modifying hours of operation,
increasing staffing levels, and applying demand management techniques like off-peak
incentives and value pricing.
Implementation Action 6.1: Expand the use of the FAST (Free and Secure
Trade) program, and the proposed express lane at the Department of Public
Safety (DPS) inspection stations.
| 68
Measure 6.1: Number of local stakeholders willing to participate in and
promote FAST and DPS programs.
Responsible Parties 6.1: Local.
Implementation Action 6.2: Evaluate the design of international border
crossings and local access points to ensure efficient use of FAST lanes.
Measure 6.2: Crossing time for FAST trucks compared to non-FAST trucks.
Responsible Parties 6.2: Federal.
Implementation Action 6.3: Evaluate operations at existing international
border crossings to ensure they are performing at optimum efficiencies.
Measure 6.3: Commercial vehicle crossing time.
Responsible Parties 6.3: Federal.
7. Strategy: Develop international border crossings that take advantage of the latest
technologies and procedures. New procedures and technologies significantly impact the
way international border crossing inspections are carried out and therefore the
infrastructure needs at international border crossings. Planned international border
crossings should be designed with enough flexibility to benefit from the latest
technology and expedite the design and construction process, as well as to make it easy
to change in the future when new technologies are implemented.
Implementation Action 7.1: Work with the General Services Administration
and other U.S. federal agencies to develop flexible user-oriented
configurations and practices for new or rehabilitated international border
crossings.
Measure 7.1: Conduct joint workshops with federal officials intended to
achieve a modified approach to international border crossing design.
Responsible Parties 7.1: Federal.
8. Strategy: Review Presidential Permit policy to facilitate international bridge
construction. Current Presidential Permit procedures to construct or modify
international bridges are lengthy and difficult to obtain. A streamlined procedure will

| 69
smooth the progress of any required modification to take advantage of new
technologies or processes.
Implementation Action 8.1: Develop and coordinate with binational federal
officials an approach to facilitate improvements to existing international
border crossings.
Measure 8.1: Revised procedures for national consideration.
Responsible Parties 8.1: Local.
Implementation Action 8.2: Coordinate permitting process for new
international border crossings.
Measure 8.2: Time required obtaining permits.
Responsible Parties 8.2: Local.
9. Strategy: Provide a balance between required inspections and efficient trade flow.
Implementation Action 9.1: Ensure proper staffing, resource management, and
appropriations for new international border crossings or expansion of existing
international border crossings that will allow for adequate inspections yet
ensure efficient trade flow.
Measure 9.1: Commercial vehicle crossing time and security level.
Responsible Parties 9.1: State, federal.
D. Economic Benefits of International Trade
Demonstrate the economic benefits of international trade at the national, state, and local levels.
10. Strategy: Identify national, statewide, and international benefits of trade. Increased
land commercial trade not only benefits the local international border crossing where
the transaction takes place but also has a ripple effect that benefits the state and the
nation as a whole. The Alameda Corridor Project in California is an example of how a
trade corridor improvement can benefit not only the region but the whole nation.

| 70
Implementation Action 10.1: Review and implement previous
recommendations to quantify local, regional, and national benefits of
improved trade at the Texas-Mexico border.
Measure 10.1: Identify which actions must occur at the state or federal level
to provide trade benefits.
Responsible Parties 10.1: State.
Implementation Action 10.2: Perform economic impact analysis of trade on
local, state, and national levels.
Measure 10.2: Complete economic impact analysis of trade.
Responsible Parties 10.2: State.
Implementation Action 10.3: Establish an advocacy program led by the four
U.S. border governors to promote the benefits of trade efficiencies at the state,
national, and international level.
Measure 10.3: Success of advocacy program in Washington, D.C.
Responsible Parties 10.3: State

| 71
Bibliography
1 USA Trade Online, available at https://usatrade.census.gov/, accessed March 2014. 2 Bureau of Economic Analysis, International Data. Available at: http://www.bea.gov/itable/, accessed
March 2014. 3 Office of the United States Trade Representative, “North American Free Trade Agreement (NAFTA)”.
Available at https://ustr.gov/trade-agreements/free-trade-agreements/north-american-free-trade-
agreement-nafta, accessed February 2014. 4 Summer Said and Sarah Kent, ”Saudi Arabia Slashed Oil Output in December,” The Wall Street Journal,
January 10, 2013. Available at:
http://online.wsj.com/news/articles/SB10001424127887324081704578233400106949778, accessed
February 2014. 5 Jose Orozco, “Venezuela’s Oil Product Imports from U.S. Surge Ninefold,” Bloomberg News, November
29, 2012. Available at: http://www.bloomberg.com/news/2012-11-29/venezuela-s-oil-product-
imports-from-u-s-surge-ninefold-1-.html, accessed March 2014. 6 Texas Wide Open for Business, 2014, “U.S. Ports of Entry in Texas”. Available at:,
http://governor.state.tx.us/files/ecodev/USPortsinTexas.pdf, accessed December 2014 7 Federal Highway Administration, Freight Analysis Framework 3. Available at
http://faf.ornl.gov/fafweb/Extraction4.aspx, accessed December 2014 8 Bureau of Transportation Statistics, “North American Transborder Freight Data”. Available at:
http://transborder.bts.gov/programs/international/transborder/TBDR_QA.html, accessed December
2014 9 Customs and Border Patrol, Texas Bridge Crossing Data. 10 Bureau of Transportation Statistics, “Border Crossing/Entry Data”, Available at
http://transborder.bts.gov/programs/international/transborder/TBDR_BC/TBDR_BC_Index.html,
accessed December 2014 11 Texas A&M International University, ”Texas Center for Border Economic and Enterprise
Development”, Available at: http://texascenter.tamiu.edu/texcen_services/truck_crossings.asp,
accessed December 2014. 12 Bureau of Transportation Statistics, “Border Crossing/Entry Data: Frequently Asked Questions”,
Available at http://transborder.bts.gov/programs/international/transborder/TBDR_BC_FAQs.html,
accessed December 2014. 13 Saenz, Amadeo (January 2009). "Trade Transportation Activities Report" (pdf). Texas Department of
Transportation. 14 U.S. Army Corps of Engineers – Navigation Data Center, Waterborne Commerce Statistics. Available at:
http://www.navigationdatacenter.us/wcsc/wcsc.htm, accessed December 2014 15 Federal Aviation Administration, “Passenger Boarding (Enplanement) and All-Cargo Data for U.S.
Airports” Available at:
http://www.faa.gov/airports/planning_capacity/passenger_allcargo_stats/passenger/?year=2013,
Accessed December 2014. 16 U.S. Energy Information Administration, Office of Oil and Gas Division, GasTran Gas Transportation
Information System. Available at:
http://www.eia.gov/pub/oil_gas/natural_gas/analysis_publications/ngpipeline/transcorr_map.html,
accessed May 2014.

| 72
17 U.S. Energy Information Administration, “Natural Gas”, Available at
http://www.eia.gov/pub/oil_gas/natural_gas/analysis_publications/ngpipeline/transcorr_map.html,
accessed December 2014 18 U.S. Energy Information Administration, “About U.S. Natural Gas Pipelines.” Available at
http://www.eia.gov/pub/oil_gas/natural_gas/analysis_publications/ngpipeline/intrastate.html,
accessed May 2014. 19 U.S. Energy Information Administration, “Lower 48 states shale plays”, Available at
http://www.eia.gov/oil_gas/rpd/shale_gas.pdf, accessed December 2014. 20 U.S. Energy Information Administration, State Energy Data System (SEDS): 1960-2012 (Complete),
Available at http://www.eia.gov/state/seds/seds-data-complete.cfm#Production, accessed December
2014. 21 Maria Gallucci, “Keystone XL Report Finds Higher Number of Railroad Deaths, Injuries Expected if
Obama Rejects Pipeline,” International Business Times, June 10, 2014. Available at:
http://www.ibtimes.com/keystone-xl-report-finds-higher-number-railroad-deaths-injuries-expected-
if-obama-rejects-1596197, accessed June 2014. 22 Austen, Ian, “Deadly Derailment in Quebec Underlines Oil Debate,” The New York Times, July 7, 2014.
Available at: http://www.nytimes.com/2013/07/08/world/americas/deadly-derailment-in-quebec-
underlines-oil-debate.html?module=Search&mabReward=relbias%3As, accessed June 2014. 23 Austen, Ian, “Negligence Charges Brought in Quebec Derailment and Fire,” The New York Times, May
12, 2014. Available at: http://www.nytimes.com/2014/05/13/world/americas/negligence-charges-
brought-in-quebec-derailment-and-fire.html?module=Search&mabReward=relbias%3As, accessed
June 2014. 24 Anna M. Tinsley, “Emotions Run Deep in East Texas Over Keystone Pipeline,” The Seattle Times, May
17, 2014. Available at:
http://seattletimes.com/html/businesstechnology/2023610201_pipelinefearsxml.html, accessed June
2014. 25 EnSys Energy, “Keystone XL Assessment - Final Report”, December 2010 26 Harrison, Robert, Nathan Hutson, Dan Seedah, Jim Kruse, and Curtis Morgan. Emerging Trade Corridors
and Texas Transportation Planning. No. FHWA/TX-10/0-5973-2. 2010. 27 Harrison, Robert and Manuel Trevino, “Evaluating the Impacts of the Panama Canal Expansion on
Texas Gulf Ports”, SWUTC/13/476660-00062-1, March 2013. Available at
http://d2dtl5nnlpfr0r.cloudfront.net/swutc.tamu.edu/publications/technicalreports/476660-00062-
1.pdf 28 Seedah, Dan, Rob Harrison, Leigh Boske, Jim Kruse, Anna Protopapas, “Trade Flows and Texas Gulf
Ports: Panama Canal Expansion and South American Markets”. Available at
http://library.ctr.utexas.edu/ctr-publications/0-6690-CTR-2.pdf 29 Corcoran, Katherine, “Spectacular new highway to link Mexico’s two coasts,” The Seattle Times, July 6,
2013. Available at: http://seattletimes.com/html/nationworld/2021335446_mexicohighwayxml.html,
accessed July 2014. 30 Center for North American Studies, “Economic Impacts of Increased U.S. Imports of Fresh Produce
from Mexico by 2020,” CNAS Issue Brief 2013-04, September 2013. 31 Robert Harrison and Manuel Trevino, “Evaluating the Impacts of the Panama Canal Expansion on
Texas Gulf Ports” , SWUTC/13/476660-00062-1 32 United States Department of Agriculture, “Impact of Panama Canal Expansion on the U.S. Intermodal
System,” Agricultural Marketing Service, January 2010. 33 Panama Canal Stakeholder Working Group, “0-6800: Impacts on Texas Ports from the Panama Canal
| 73
Expansion”. Available at http://d2dtl5nnlpfr0r.cloudfront.net/tti.tamu.edu/documents/0-6800-1.pdf
Page25-26 34 Texas Department of Transportation, TxDOT Priority Projects I-35 Expansion. March 2014. Available at
http://ftp.dot.state.tx.us/pub/txdot-info/sla/projects/i35-central-expansion.pdf, accessed December
2014. 35 Texas Department of Transportation, TxDOT Priority Projects SH 130 (Segments 5 & 6). March 2014.
Available at http://ftp.dot.state.tx.us/pub/txdot-info/sla/projects/sh-130.pdf, accessed December 2014. 36 Texas Department of Transportation, TxDOT Priority Projects I-35E. March 2014. Available at
http://ftp.dot.state.tx.us/pub/txdot-info/sla/projects/i-35e.pdf, accessed December 2014. 37 Texas Department of Transportation, LBJ Express Project Schedule & Timeline, Available at
http://www.lbjexpress.com/scheduleTimeline.asp, accessed December 2014. 38 Texas Department of Transportation, TxDOT Priority Projects LBJ Express. March 2014. Available at
http://ftp.dot.state.tx.us/pub/txdot-info/sla/projects/lbj-express.pdf, accessed December 2014. 39 North Tarrant Express Mobility Partners, Project Timeline, Available at
http://www.northtarrantexpress.com/ProjectTimeline.asp, accessed December 2014. 40 Texas Department of Transportation, North Tarrant Express. March 2014. Available at
http://ftp.dot.state.tx.us/pub/txdot-info/sla/projects/nte.pdf, accessed December 2014. 41 Pegasus Link Constructors, The Horseshoe Project Overview. Available at
http://dallashorseshoe.com/project-overview/, accessed December 2014. 42 Texas Department of Transportation, Southern Gateway. March 2014. Available at
http://ftp.dot.state.tx.us/pub/txdot-info/sla/projects/southern-gateway.pdf, accessed December 2014. 43 Texas Department of Transportation, Grand Parkway (SH 99). March 2014. Available at
http://ftp.dot.state.tx.us/pub/txdot-info/sla/projects/grand-parkway-h-i1-i2.pdf accessed December
2014. 44 Texas Department of Transportation, I-69. March 2014. Available at http://ftp.dot.state.tx.us/pub/txdot-
info/sla/projects/i-69.pdf, accessed December 2014. 45 Texas Department of Transportation, Border Highway West Extension. March 2014. Available at
http://ftp.dot.state.tx.us/pub/txdot-info/sla/projects/border-highway.pdf, accessed December 2014. 46 Texas Department of Transportation, DFW Connector. March 2014. Available at
http://ftp.dot.state.tx.us/pub/txdot-info/sla/projects/dfw-connector.pdf, accessed December 2014. 47 Texas Department of Transportation, DFW Connector TEXpress Lanes. Fall 2014. Available at
http://www.dfwconnector.com/pdfs/Fact%20Sheets/TEXpress%20Fact%20Sheet.pdf, accessed
December 2014. 48 DFWConnector, Fact Sheet. Available at
http://www.dfwconnector.com/pdfs/Fact%20Sheets/FM%202499%20Basic%20Facts.pdf, accessed
December 2014. 49 Texas Department of Transportation, DFW Connector. March 2014. Available at
http://ftp.dot.state.tx.us/pub/txdot-info/sla/projects/harbor-bridge.pdf, accessed December 2014. 50 Texas Department of Transportation, Loop 9. March 2014. Available at
http://ftp.dot.state.tx.us/pub/txdot-info/sla/projects/loop-9.pdf, accessed December 2014. 51 Texas Department of Transportation, Loop 1604. March 2014. Available at
http://ftp.dot.state.tx.us/pub/txdot-info/sla/projects/loop-1604.pdf, accessed December 2014 52 Texas Department of Transportation, US 77. March 2014. Available at
http://ftp.dot.state.tx.us/pub/txdot-info/sla/projects/us-77.pdf, accessed December 2014.
| 74
53 Presidencia de la República de México, Program Nacional de Infraestructura 2014-2018. Available at:
http://cdn.presidencia.gob.mx/pni/programa-nacional-de-infraestructura-2014-2018.pdf?v=1,
accessed August 2014. 54 Presidencia de la República de México, Program Nacional de Infraestructura 2014-2018, Proyectos.
Available at: http://presidencia.gob.mx/pni/proyectos.php, accessed August 2014. 55 “Avance del libramiento Oriente de Chihuahua lleva más del 50%: SCT,” tiempo.com, May 30, 2014.
Available at: http://www.tiempo.com.mx/_notas/1826230, accessed August 2014. 56 “New Tornillo Bridge Nears Completion,” The El Paso Times, February 3, 2014. Available at:
http://www.elpasotimes.com/opinion/ci_25047336/new-tornillo-bridge-nears-completion, accessed
August 2014. 57 “Arranca Ampliación de la corta a Parral,” El Heraldo de Chihuahua. August 15, 2012. Available at:
http://www.oem.com.mx/elheraldodechihuahua/notas/n2657205.htm, accessed August 2014. 58 “Avanza construcción de Puente vehicular Abasolo-Periférico en Saltillo,” Vanguardia.com, April 8,
2014. Available at:
http://www.vanguardia.com.mx/avanzaconstrucciondepuentevehicularabasoloperifericoensaltillo-
1993743.html, accessed August 2014. 59 “Será de gran beneficio modernización carretera en Coahuila,” El Diario de Coahuila, November 20,
2014. Available at: http://www.eldiariodecoahuila.com.mx/notas/2013/11/20/sera-gran-beneficio-
modernizacion-carretera-coahuila-399902.asp, accessed August 2014. 60 Jesús Jiménez, “Cerca de licitarse el Libramiento San Buenaventura-Hermanas en Coahuila,”
Zocalo.com.mx. Available at: http://www.zocalo.com.mx/seccion/articulo/cerca-de-licitarse-el-
libramiento-san-buenaventura-hermanas-en-coahuila-137, accessed August 2014. 61 Diana Alvarado, “Ampliación de Puerto de Altamira sólo contempla 2 obras,” hoytamaulipas.net,
February 18, 2013. Available at: http://www.hoytamaulipas.net/notas/70142/Ampliacion-de-puerto-
de-Altamira-solo-contempla-2-obras.html, accessed August 2014. 62 Gloria Treviño, “Pondrá en operación Libramiento Reynosa Sur,” elmanana.com., January 23, 2011.
Available at:
http://www.elmanana.com/diario/noticia/reynosa/noticias/pondran_en_operacion_libramiento_reyn
osa_sur/1019246, accessed August 2014. 63 Sandra Tovar, “Libran a Reynosa del tráfico pesado,” elmanana.com., August 1, 2013. Available at:
http://www.elmanana.com/diario/noticia/reynosa/noticias/libran_a_reynosa_del_trafico_pesado/217
1380, accessed August 2014. 64 “Puente Internacional Matamoros III-Brownsville ‘Los Tomates-Veterans,’” Periodico Frontera de
Matamoros, April 9, 2014. Available at:
http://periodicofronteradematamoros.blogspot.com/2014/04/puente-internacional-matamoros-
iii.html, accessed August 2014. 65 Miriam Posada, “Gobierno Federal Prevé Invertir 95 mil md den 13 proyectos ferroviarios,” La Jornada,
February 10, 2014. Available at: http://www.jornada.unam.mx/ultimas/2014/02/10/gobierno-federal-
preve-invertir-95-mil-mdd-en-13-proyectos-ferroviarios-2246.html, accessed August 2014. 66 “Arracará tercera etapa de la avenida Monterrey en Tampico,” Tamaulipas: Secretaría de Obras
Públicas, September 25, 2012. Available at: http://obraspublicas.tamaulipas.gob.mx/09/arrancara-
tercera-etapa-de-la-avenida-monterrey-en-tampico/, accessed August 2014. 67 “Arranca gobernador inicio de modernización de carretera Reynosa-Río Bravo,” Notigape, January 31,
2014. Available at: http://www.notigape.com/?id=34818, accessed August 2014.

| 75
68 Puri Lucena, “El Puerto de Matamoros empezará a operar en agosto de 2015,” Obras Web, June 9, 2014.
Available at: http://www.obrasweb.mx/construccion/2014/06/09/el-puerto-de-matamoros-empezara-
a-operar-en-agosto-de-2015, accessed August 2014. 69 Raúl S. Llamas, “No despega terminal de carga aérea en Nuevo Laredo,” La Prensa.mx., February 21,
2014. Available at: http://www.laprensa.mx/notas.asp?id=261046, accessed August 2014. 70 “Proyectos de Alto Impacto 2013-2018” Administración General de Aduanas, Secretaría de Hacienda y
Crédito Público, December 2013. Available at:
http://borderplanning.fhwa.dot.gov/filemanager/uploadfile/08%20Morales%20SAT%20060314%20Pr
esentaci%C3%B3n%20CCT.pdf, accessed August 2014. 71 Federal Highway Administration, El Paso/Santa Teresa-Chihuahua Border Master Plan, Prepared by The
Center for Transportation Research and Texas A&M Transportation Institute for the Texas
Department of Transportation, 31 October 2013. 72 Federal Highway Administration, Lower Rio Grande Valley -Tamaulipas Border Master Plan, Prepared by
The Center for Transportation Research and Texas A&M Transportation Institute for the Texas
Department of Transportation, 31 October 2013. 73 Federal Highway Administration, Laredo District Coahuila/Nuevo León/Tamaulipas Border Master Plan,
Prepared by The Center for Transportation Research for the Texas Department of Transportation,
June 2012. 74 Border Crossing Information System, Available at http://bcis.tamu.edu/, accessed January 2015. 75 United States Government Accountability Office, U.S. Mexico Border - CBP Action Needed to Improve
Wait Time Data and Measure Outcomes of Trade Facilitation Efforts, Report to the Ranking Member,
Subcommittee on Immigration, Refugees and Border Security, Committee on the Judiciary, U.S.
Senate. July 2013. 76 Julián Aguilar, “Texas Ports of Entry Tapped for Federal Pilot Program,” The Texas Tribune, August 2,
2013. Available at: http://www.texastribune.org/2013/08/02/feds-tap-texas-ports-pilot-program-
trade/, accessed May 2014. 77 Cindy Ramirez, “El Paso City Council Approves Bridge-Toll Hikes,” El Paso Times, December 4, 2013.
Available at: http://www.elpasotimes.com/news/ci_24650076/el-paso-city-council-approves-paying-
keep-more, accessed May 2014. 78 Aaron Bracamontes, “El Paso Can Pay for International Ports’ Staffing,” El Paso Times, August 3, 2013.
Available at: http://www.elpasotimes.com/ci_23788765/pilot-program-allows-city-pay-cbp-officers,
accessed May 2014. 79 Congressman Beto O’Rourke, “El Paso Selected for Program to Reduce Bridge Wait Times,” Press
Release, August 2, 2013. Available at: http://orourke.house.gov/media-center/press-releases/el-paso-
selected-for-program-to-reduce-bridge-wait-times, accessed May 2014. 80 Loder, Asjylyn, “Oil Below $60 Tests Economics of U.S. Shale Boom”, Bloomberg.com. Available at
http://www.bloomberg.com/news/2015-01-05/oil-below-60-tests-u-s-drive-for-energy-
independence.html. Accessed January 6, 2015. 81 Strauss, Gary. “Baker Hughes to lay off 7,000 as oil patch layoffs mount”, USA Today, January 20, 2015.
Available at http://www.usatoday.com/story/money/2015/01/20/baker-hughes-latest-hit-by-oil-
slump-to-lay-off-7000/22042433/, accessed January 2015. 82 Birnbaum, Michael, “European industry flocks to U.S. to take advantage of cheaper gas”, Washington
Post, April 1 2013. Available at http://www.washingtonpost.com/world/europe/european-industry-
flocks-to-cheap-us-gas/2013/04/01/454d06ea-8a2c-11e2-98d9-3012c1cd8d1e_story.html, accessed
January 2015.

| 76
83 Eisenstein, Paul A., “New Audi Plant Rises Out of the Mexican Dust”, The Detriot Bureau, May 22 2014.
Available at http://www.thedetroitbureau.com/2014/05/new-audi-plant-rises-out-of-the-mexican-
dust/, accessed January 2015.