boqk 0 ^ 3 8 • j3 v
TRANSCRIPT

UNIVERSITY OF GHANA THE BALME LIBRARY
BALME LIBRARY THESES
1. Balme Library theses are available for consultation
in the Library. They are not normally available
for loan, and they are never lent to individuals.
2. All who consult a thesis must sign an undertaking
not to copy or quote from it without the consent
of the author and of this University.
UNIVERSITY OF G H A N Al i b r a r y
aasnweaaaaiaseta'SGZfm
BOQK number
0 ^ 3 8 • J 3 V 8
University of Ghana http://ugspace.ug.edu.gh

Life history of Chrysichthys catfish in Volta Lake, Ghana
by
Chief John Vanderpuye
An Abstract of
A Dissertation Submitted to the
Graduate Faculty in Partial Fulfillment of the
Requirements for the Degree of
DOCTOR OF PHILOSOPHY
Approved:
in Charge of Major Work
VvvFor the Major Department
lZ>For the Graduate College
Iowa State University Ames, Iowa
1979
University of Ghana http://ugspace.ug.edu.gh
Chief John Vanderpuye
Under the supervision of K. D. Carlander From the Department of Animal Ecology
Iowa State University
This study, undertaken during 1974 to 1977 in Volta Lake, investi
gated the identification, abundance and distribution, reproductive biology
and weight-length relationships of four Chrysichthys species (C . auratus,
C. walkeri, C. velifer and C. furcatus). The species were separated on
basis of position of the dorsal fin, color of the barbels and the body
and shape of the caudal fin and its lobes. Gill rakers also proved of
some value.
The Volta Lake, on the Volta River in Ghana, is the largest man-
made lake (area: 8,700 km^). It was dammed in 1964 and reached the maxi
mum controllable level in 1968. The northern narrower arms are of riverine
character and the southern section, lacustrine. Water temperatures range
between 26.5 to 30.5°C throughout the year. Except in periods of overturn
(usually between December to March and June to August), dissolved oxygen
is considerably reduced below 10 m. Ampem station, established on one of
the main arms of the lake, was sampled monthly (except 9 out of 29 months)
with gill nets of graded mesh size, a beach seine, traps (hoop nets) and
rotenone. Other stations, in the various sections of the lake, were also
sampled occasionally.
ln 196 5 Chrysichthys were relatively abundant near the dam at
Akosombo. Sampling in 1970 showed a decline and a more even lakewide
Life history of Chrysichthys catfish in Volta Lake, Ghana
University of Ghana http://ugspace.ug.edu.gh
distribution with indications of higher abundance in the southern (more
lacustrine) areas. Thereafter, abundance fluctuated seasonally with
more fish being caught in the rainy season. Chrysichthys were seldom
found deeper than 10 m, probably because of low dissolved oxygen con
centrations. Chrysichthys also were seldom found in higher currents.
Length frequency data did not indicate different year classes or
spawning periods but were characterized by single modes which remained
fairly constant over a 6-month period.
Spawning C. walkeri and C. auratus were taken in traps fabricated
from bamboo stems. Spawning was in a sheltered bay at depths of 1.0-1.5 m
over a firm substrate and egg masses were placed in darkened interior of
the bamboo traps. The smallest (standard lengths) spawning males, and
females were respectively 76 mm and 82 mm (C. auratus) and 82 mm and 72
mm (C. walkeri). Males were larger than their mates in 42 of the 43 pairs
collected in the bamboo traps.
The number of eggs per female increased linearly with weight for
C. walkeri and with weight and length for C. velifer and linearly with
the log lengths of C. walkeri and C. auratus.
The slopes for functional regressions of log weight on log length
did not differ significantly from 3.0 for C. walkeri and C. velifer but
was less than 3.0 for C. auratus and C. furcatus.
2
University of Ghana http://ugspace.ug.edu.gh
by
Chief John Vanderpuye
A Dissertation Submitted to the
Graduate Faculty in Partial Fulfillment of the
Requirements for the Degree of
DOCTOR OF PHILOSOPHY
Life history of Chrysichthys catfish in Volta Lake, Ghana
Department: Animal EcologyMajor; Fishery Biology
Approved;
In Charge of Major Work
For the Graduate College
Iowa State University
Ames, Iowa
1979
University of Ghana http://ugspace.ug.edu.gh

ii
INTRODUCTION 1
The Volta Lake ^
Main Study Area 13
The Fishery 22
Prior Studies on the Fish Species in Volta Lake 24
MATERIALS AND METHODS 26
IDENTIFICATION OF CHRYSICHTHYS SPECIES IN VOLTA LAKE 37
ABUNDANCE AND DISTRIBUTION 48
Temporal and Areal Changes 52
Depth Distribution 56
Length-Frequency Distributions 60
REPRODUCTIVE BIOLOGY 70b
Maturity Stages 7Ob
Sex Ratios 84
Size of Ovaries and Eggs 86
Fecundity 89
Preferred Spawning Site 99
Spawning Behavior and Spawning 101
Habitat Preference of the Juveniles 102
WEIGHT-LENGTH RELATIONSHIP 103
Condition Factor 105
RECOMMENDATIONS FOR FUTURE RESEARCH 112
SUMMARY 116
LITERATURE CITED 101
TABLE OF CONTENTSPage
University of Ghana http://ugspace.ug.edu.gh

iii
ACKNOWLEDGEMENTS
TABLE OF CONTENTS (Continued)
Page
126
APPENDIX 129
University of Ghana http://ugspace.ug.edu.gh

iv
Table
Table
Table
Table
Table
Table
Table
Table
Table
Table
LIST OF TABLES
1. List of sampling stations: all except 1, 5 and 6were sampling stations in the stock sampling
program
Page
29
2. Morphological comparisons between the fourChrysichthys species in Volta Lake 38
3. Comparison of number of gill-rakers of Chrysichthys
spp in Volta Lake 39
4. Large specimens of Chrysichthys captured in otherbodies of water in Africa 45
5. Numbers of Chrysichthys and other species taken at Ampem in survey samples (except for 13 mm mesh nets), June 1975 to May 1976, and percentages of Chrysichthys in the ichthyofauna 49
6. Distribution of Chrysichthys in Volta Lake duringthe period January to May 1970 50
7. Numbers of bagrids and of other fish in catches in Areas 3, 7 and 8 during August 1974 to May 1975 taken by gill nets (excluding 13 mm mesh), trapsand rotenone 51
8. Temporal abundance of Chrysichthys in Volta Lake byseasons as monitored by standardized gang of experimental gill nets by the Stock Assessment Section of the VLRP during the period, December 1969 toFebruary 1972 53
9. Distribution of Chrysichthys in gill nets in inshore and surface of offshore waters during the period December 1969 to February 1972, as monitored by a standardized gang of experimental gill nets by the Stock Assessment Section of the VLRP during theperiod December 1969 to February 1972 57
10. Area and depth distribution of Chrysichthys in VoltaLake as monitored by a standardized gang of experimental gill nets by the Stock Assessment Section of the VLRP during the period, December 1969 toFebruary 1972 50
University of Ghana http://ugspace.ug.edu.gh

V
Table
Table
Table
Table
Table
Table
Table
Table
Table
Table
Table
Table 11. Length frequency distributions of C . velifer captured with different types of gear and rotenone in varying depths during the period, October 1974 to November 1975
12. Length frequency distribution of C. auratus captured with different types of gear and rotenone in varying depths during the period October 1974 to November
1975
13. Length frequency distribution of C. walkeri captured with different types of gear and rotenone in varying depths during the period October 1974 to November 1975
14. Length distribution of C. furcatus captured with different types of gear and rotenone in varying depths during the period October 1974 to November 1975
15. Length frequency distribution of C. velifer (by months) during the period April - December 1975
16. Length frequency distribution of C. auratus (by months) during the period April - December 1975
17. Length frequency distribution of C. walkeri (by months) during the period April - December 1975
18. Length frequency distribution of C. velifer (by months) during the period April to December 1975
19. Length frequency distribution of C. auratus (by months) during the period April to December 1975
20. Length frequency distribution of C. walkeri (by months) during the period April to December 1975
21. Deviation of abundant size groups of C. velifer from calculated average ratio for the period June to December 1975
22. Maturity of female C. auratus by size groups showing the number of fish at various stages of maturityin each 1 cm length group for all females sexed during the period December 1974 to November 1976
LIST OF TABLES(Continued)
62
63
64
65
66
66
67
67
68
69
70a
Page
71
University of Ghana http://ugspace.ug.edu.gh

Page
72
73
74
82
82
83
85
86
87
90
106
vi
LIST OF TABLES(Continued)
Maturity of female C # velifer by size groups showing the number of fish at various stages of maturity in each 2 cm length group for all females sexed during the period December 1974 to November 1976
Maturity of female C. walkeri by size groups showing the number of fish at various stages of maturity in each 1 cm length group for all females sexed during the period December 1974 to November 1976
Length distribution of spawning Chrysichthys captured on breeding grounds
Changes in the maturity of male C, auratus with size, showing the number of fish at various stages of maturity in each 1 cm length group for all males sexed during the period September 1975 to August 1976
Changes in the maturity of male C. walkeri with size showing the number of fish at various stages of maturity in each 1 cm length group for all males sexed during the period September 1975 to August 1976
Changes in maturity of male C. velifer with size showing the number of fish at various stages of maturity in each 2 cm length group for all males sexed during the period September 1975 to August 1976
Sex-ratios at various lengths of Chrysichthys captured at Ampem during the period September to November 1975
Sex-ratios at various lengths of Chrysichthys captured at Ampem during the period December 1975 - February 1976
Comparison of size of left and right ovaries in C. walkeri and C, auratus
Fecundity of Chrysichthys spp in Volta Lake during the period 1974 to 1977
Log weight-log length regression equations by species and sex for Chrysichthys spp in Volta Lake during the period 1974 - 1977
University of Ghana http://ugspace.ug.edu.gh

vii
Table 35
Table A-
Table A-
Table A-
Table A-
Table A-
Table A-
Table A-
Table A-
Table 34
LIST OF TABLES(Continued)
■ . Log weight-log length regression equations by species and quarter of the year for Chrysichthys captured in Volta Lake, during the period 1974 to 1977
* Regressions of log K on log SL based upon geometric mean, log W-log SL regressions
1. Field sampling schedule in connection with study of life history of Chrysichthys catfish in Volta Lake, Ghana
2. Composition of fish catches at Ampem station during the period June 1975 - May 1976
3. Distribution of Chrysichthys in Volta Lake during the period Jan. - M a y 1970
4. Numbers of Chrysichthys and other species in catches in Areas 3, / and_8 during August 1974 to May 1975
5. Data from Chrysichthys velifer females used to estimate relative fecundity based on (1) length and (2) weight
6. D a t a from Chrysichthys walkeri females used to estimate relative fecundity based on (1) length and(2) weight
7. Data from Chrysichthys auratus females used to estimate relative fecundity based on (1) length and (2) weight
8. Data from Chrysichthys furcatus females used to estimate relative fecundity based on (1) length and (2) weight
107
109
130
132
134
136
138
139
140
140
Page
University of Ghana http://ugspace.ug.edu.gh

Page
3
9
15
13
21
28
41
76
78
80
92
94
96
98
111
viii
LIST OF FIGURES
Map of Africa showing river basins with those, in which Chrysichthys have been recorded, stippled
Map of Ghana showing position of Volta Lake
Map of Ampem Station showing contours (in feet)
above sea level
Surface and bottom temperatures and dissolved oxygen at Ampem, January 1974 to December 1975
Ampem Station--Monthly rainfall and water level, 1974-1976
Map - Sampling stations
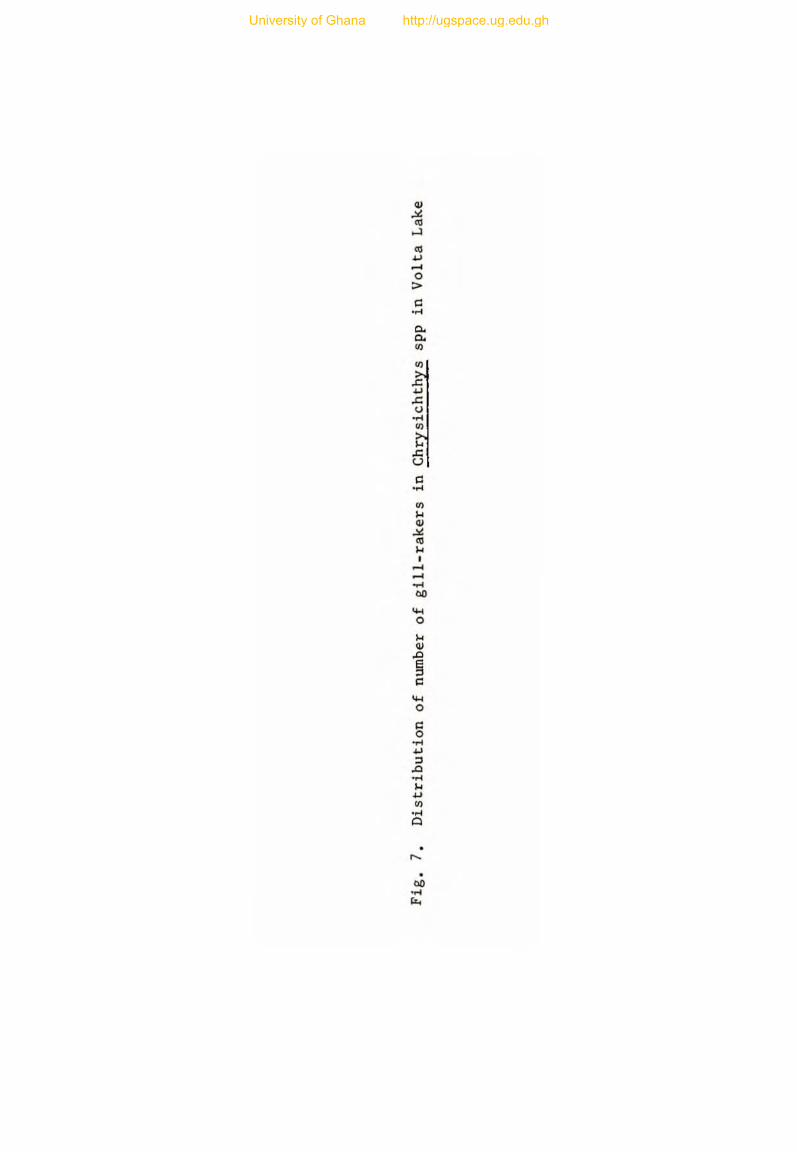
Distribution of number of gill-rakers in Chrysichthys spp in Volta Lake
Seasonal distribution of gonad maturity stages for female C. auratus, Dec. 1974-Nov. 1976
Seasonal distribution of gonad maturity stages for female C. walkeri, Dec. 1974-Nov. 1976
Seasonal distribution of gonad maturity stages for female £. velifer, Dec. 1974-Nov. 1976
£. velifer - Regression of fecundity on 1) length and 2) weight
C, walkeri - Regression of fecundity on 1) length and 2) weight
C. auratus - Regression of fecundity on length
C. furcatus - Regression of fecundity on 1) length and 2) weight
Regressions of log K. on Log SL based upon geometric mean, Log, W-Log SL regressions
University of Ghana http://ugspace.ug.edu.gh

1
INTRODUCTION
The present study forms part of the research program of the multi
disciplinary Volta Lake Research Project (formed in 1968) which aims
at (among other things) the rational exploitation of the fish resources
of the lake.
In a multi-species fishery, the efficiency envisaged by Henderson
et al. (1973) could be achieved if for each species, harvest could be
related to 1) the proportion of the species in the population and 2)
the biotic potential of the species. The latter factor in particular,
presupposes knowledge of the life history of the species. Unfortunately,
this is not available for many Volta Lake species.
Comparison of experimental with commercial catch estimates (Vander-
puye, 1972) in Volta Lake, showed that while certain species (mainly
Tilapia spp) were being over-harvested in relation to their apparent
proportion in the populations, others were being under-harvested.
Chrysichthys fell into the latter group (categorized with ’others').
The present study provides information on some aspects of the life history
of the four species to aid in rational exploitation. Aspects covered in
clude: identification, abundance and distribution, reprodictive biology
and weight-length relationships.
Chrysichthys catfish (Family: Bagridae) have been reported from
practically all the river systems of tropical Africa within latitudes
25°N and 25°S and from Tanzania in the east to Senegal in the west
(Jayaram, 1966) (Fig. 1). Within this geographical range, 40 species
have been identified (Jayaram, 1955). Four species in Volta Lake are
University of Ghana http://ugspace.ug.edu.gh

University of G
hana http://ugspace.ug.edu.gh
-30
:.~ ....
o 500 1000km I I I
30°

Q)>cd£1co
434->43O*HCO
M43O43O•H
•i{3*H
a>coo
43
43u«H
CO
C•H
COcdxiNCU>
•HJ-J TJ
a>60 r-4C a,
•H
oCO
a•H4JCO
cd x> O <U •H T3 M M
<J O a>
*4-1 M O^ (3 CL 0)
<DS
60•HCu
University of Ghana http://ugspace.ug.edu.gh

University of G
hana http://ugspace.ug.edu.gh
-. " .. , .
r.OA~TAL
o 500 1000km ! I I
-
0°
COASTAL 30°

4
C. velifer (Norman), C. auratus (Geoffroy Saint-Hilaire), C. walkeri
(Gunther) and C. furcatus (Gunther). Most species of Chrysichthys are
found in freshwaters but a few occur in both fresh and brackish waters
of coastal lagoons (Chauvet, 1972). In many West African countries,
Chrysichthys spp support thriving commercial fisheries (Chauvet, 1972;
Ikusemiju and Olaniyan, 1977).
The importance of the genus has been overshadowed by Tilapia, which
has been the subject of considerably more research and study. The bib
liography of African freshwater fish, published by the Food and Agri
culture Organization (FAO) of the United Nations (Matthes, 1973), lists
360 references under Tilapia and only 3 for Chrysichthys. None of these
references has any bearing on the biology of the latter. More recently,
some aspects of the biology of C. walkeri, £. nigrodigitatus and C.
filamentosus in Lekki Lagoon, Nigeria (Ikusemiju, 1976 ; Ikusemiju and
Olaniyan, 1977) and age and growth of C . nigrodigitatus in Ebrie Lagoon,
Ivory Coast (Dia, 1975) have been published.
C. nigrodigitatus and C. walkeri are among 25 fish species con
sidered by the FAO sponsored Committee on Inland Fisheries of Africa
to be of high interest for future of fish culture in Africa (Micha and
Frank, 1975). In Nigeria, where experiments on breeding of C. nigrodigi
tatus were in progress, no break-through had been recorded in spawning of
C. nigrodigitatus in captivity via natural or artificial means (B. Ezenwa,
Nigerian Institute for Oceanography and Marine Research, Lagos; personal
communication, August, 1977 ). This may be attributed to lack of suffi
cient knowledge on the biology of the species.
University of Ghana http://ugspace.ug.edu.gh
Alestes baremose was dominant in the fish population when the lake
was first filling (1964), but Chrysichthys became dominant during the
next year (Petr, 1967). The percentage occurrence of Chrysichthys rose
from 21.7% in January, 196 5, to 79.7% in July, and fell again to 36.9%
in August (Wuddah, 1967). Thereafter, the genus has maintained a lower
status of abundance in the fish population. The reason for this sudden
rise and decline is not clear. Ewer (1966) reported that deoxygenation
during early stages of impoundment led to the death of a variety of
fishes prominent among which were Chrysichthys. Loiselle (1972) who
sampled 23 littoral stations (depth less than 1.5 m) scattered around
the lakeshore, stated that C. auratus and £. velifer comprised 7.57„ and
18.37o, respectively, of the littoral ichthyomass. C. velifer was the
species with the highest ichthyomass, outstripping Sarotherodon niloticus
(Tilapia nilotica) which ranked second with 137<>.
Lewis (1974) found an increase in the catch of Bagridae (comprised
mostly of Chrysichthys) relative to the catches of other families after
the formation of the Kainji Reservoir, Nigeria. Lelek (1973) classified
Chrysichthys as of occasional occurrence in Kainji Reservoir and showed
that it had followed the usual pattern of sudden rise and later decline
in abundance which has been demonstrated for many fish species following
impoundment. During the filling of the Kossou Reservoir (less than 500
km from the Volta Lake), Roest (1973) recorded that C. velifer was the
second most abundant species in the reservoir, following Alestes baremose.
Presently, there is little emphasis on a Chrysichthys fishery
in Volta Lake because of small size of the fish (apparently stunted)
5
University of Ghana http://ugspace.ug.edu.gh
and their comparative low vulnerability to gill net capture. At my
main sampling station of Ampem, however, fishermen nightly dragged
small-meshed seines along the shore and used the catches (usually
juveniles) as bait for Lates niloticus.
The identification of Chrysichthys spp has always been difficult
(Jayaram, 1955; Daget and litis, 1965; Micha and Frank, 1975). During
the initial stages (1968-69) of the Volta Lake Research Project (VLRP)
only C. walkeri and C. nigrodigitatus were recognized. The single
criterion used for separating these two species was the shape of the
head. C. walkeri was considered to have a broader head than C.
nigrodigitatus. Loiselle (1972), who had worked in other water bodies
in West Africa before joining the VLRP in 1969, pointed out that C.
velifer was being misidentified as _C. nigrodigitatus. The latter, he
contended, was an estuarine species which did not exist in the Volta
Lake. Moreover, C. walkeri was made up of C. walkeri and C. auratus. A
fourth species, C. furcatus, was also present but rare.
During the present study, specimens were sent to Dr. Thys van den
Audenaerfe of the Musee Royal de l'Afrique Centrale, Tervuren, Belgium,
for confirmation of the identification of the species. In a personal
communication (December, 1974), Dr. Thys stated that local, geographical
and size- or sex-linked variation of these fishes are unknown, un
described, or badly described. In his opinion, the whole genus is in
need of a detailed revision. Notwithstanding this view, I have followed
Loiselle*s identifications. What seems unresolved, is the difference
between C. velifer and C. nigrodigitatus. Since C. nigrodigitatus is
6
University of Ghana http://ugspace.ug.edu.gh

7
apparently not present in Volta Lake, there was no opportunity to make
comparison. After acknowledging difficulties inherent in identification
of Chrysichthys spp., Micha and Frank (1975) stated that in Kossou
Reservoir, one can distinguish between C. nigrodigitatus and C. velifer
by examining the dorsal fin which reaches the base of the adipose in
C. nigrodigitatus. In a personal communication (April, 1977) however,
Frank could not confirm this fact.
The Volta Lake
With a surface area of about 8,700 k m ^ , the Volta Lake, located on
the Volta River, is the largest man-made lake in the world (Fig. 2). It
covers about 47„ of the total surface area of Ghana and lies between
longitudes 1°30'W and 0°20'E and latitudes 6°15'N and 9°10'N at an alti-
tude of 85 m above sea level when full. Other morphological data are
as follows (Czernin-Chudenitz, 1971):
Total length 400 km
Maximum width 23.8 km
Average width 6.9 km
Maximum depth 75 m
Average depth 18.8 m
Total shoreline (including islands) 5,300 km
Volume 164.8 km3
Shore development 16.0
The relationship of depth to surface area and volume follows:
University of Ghana http://ugspace.ug.edu.gh

Fig. 2. Map of Ghana showing position of Volta Lake
University of Ghana http://ugspace.ug.edu.gh
Fig. 2. Map of Ghana showing position of Volta Lake
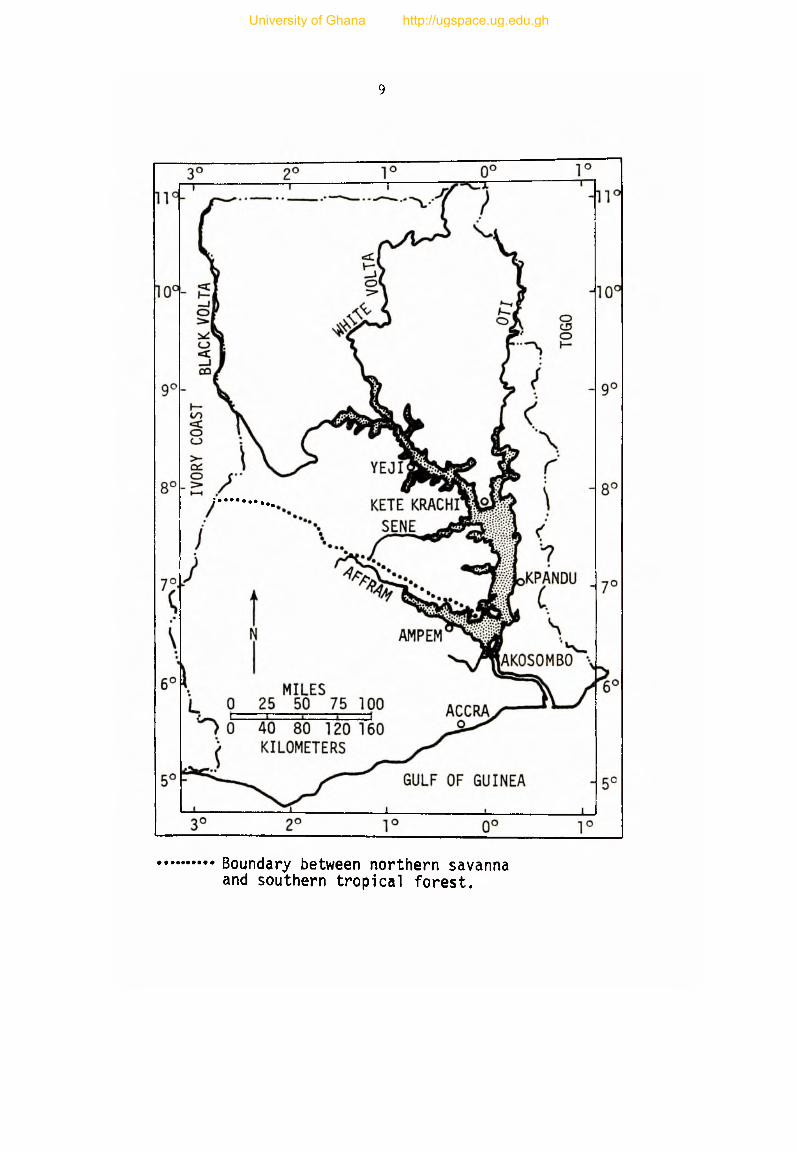
9
Boundary between northern savanna and southern tropical forest.
University of Ghana http://ugspace.ug.edu.gh

10
Water depth Area Volume
m km2 _% kmJ J o
0 - 9 . 1 4 2,810 32.20 66.464 40.3
9.14 - 25.0 3,367 38.58 64.052 38.9
25.0 - 40.3 1,703 19.50 25.709 15.6
40.3 - 55.4 705 8.08 7.500 4.5
55.4 plus 143 1.64 1.083 0.7
Thus it is a moderately shallow lake with extensive shoreline
and shallow margin. Such a morphometry should be conducive to rapid
mineral recycling with attendant high fish production. Unfortunately,
no detailed study has been done on this aspect of the lake’s limnology.
A review of the available data on the mineral cycling in the lake
and below the dam by Livingstone (1974), however, led to the con
clusion that the lake was oligotrophic.
Three sections of the lake are distinguished (Czernin-Chudenitz,
1971):
(a) The northern part is influenced mainly by the Black Volta
and consequently is of riverine character. Surface and bottom tempera
tures are equal all year round and current is quite perceptible, es
pecially during the rainy season. Oxygen is present in sufficient
quantities (40% saturation) to support fish life clear to the
bottom. (Areas 5, 6, 7, and 8, referred to later, comprise this
northern part, Fig. 6).
(b) The southern partis' of truly lacustrine character.
Although the temperature gradient is always very slight (except in the
University of Ghana http://ugspace.ug.edu.gh
11
surface layers) stratification could be observed with a metalimnion at
a depth of 25 - 35 m (Areas 2, 3, and 4).
(c) The inundated river arms are generally similar to the
main lake. The upper reaches assume a riverine character while the
lower parts grade into the lacustrine main body of the lake (Area 1),
In the deeper layers the warmest temperature was 27.8°C and the
coldest 25.7°C. More extreme temperatures were found in bays. The
highest recorded was 33.6°C in shallow water within Pistia beds.
Turbidity is greatest in the northern sector of the lake during
the rainy season when the large tributaries (the White and Black Voltas
and the Oti) discharge turbid waters into the lake. Turbidity generally
decreases towards the south. For example: in August 1968 (a month of
moderate rains), Czernin-Chudenitz (1971) recorded 30, 45, 230, 220, and
270 cm transparency during a north to south transect sampling.
The main water body lies in the Guinea savanna climatic zone with
a precipitation of 890 - 1520 mm per annum (Boateng, 1967 ). The extreme
southern part falls in the zone with more rainfall, and with June being
the wettest month. Another smaller peak of rainfall occurs in September
and October. There is a tendency towards a reduction of the June peak
and an emergence of one peak in September as one progresses from south
to north. Rainfall is the single most influential environmental factor
on the hydrobiology of the lake and consequently, on the ecology of
the fishes. During the rainy season (1) the temperature is lowered
resulting in thermal overturn, (2) surface dissolved oxygen concentration
University of Ghana http://ugspace.ug.edu.gh
12
declines (a result of the mixing), (3) nutrients are recycled to the
surface from the bottom and (4) nutrients are washed into the lake and
tributaries by run-offs.
Aquatic plants grow luxuriantly along much of the lakefs margin
to a depth of ca. 3 m. Hall ej: al. (1971) discerned three zones in the
drawdown vegetation. These are:
(1) Sedge zone: dominated by Cyperus spp, Fimbristylis spp, and
Ludwigia spp.
(2) Perennial grass/Polygonum zone: made up mostly of Vossia
cuspidata, Polygonum senegalense, Echinochloa spp, Brachiaria mutica,
and Leptochloa caerulescens. They also observed that the larvae of
Povilla, an important fish food, live in the hollow stems of Polygonum
and Vossia.
(3) Annual forb zone: dominated by Indigofera spp, Tephrosia spp,
Imperata cylindrica, and Schizachyrium sanguineum.
Pierce (1971) reported that aquatic plants which were common in cer
tain areas included: Ceratophyllum demersum, Pistia stratiotes, Lemna
sp, Salvinia nymphellula, and Ultricularia inflexa.
With the exception of Distichodus rostratus and Alestes spp, Volta
Lake fishes do not feed on the aquatic weeds (Lawson et al., 1969). The
plants, however, form substrates for aquatic invertebrates which serve
as important food for fish.
Except for 3 or 4 experimental areas of a few hectares located on
the Affram arm (Area 1), the basin was not cleared of timber and brush
University of Ghana http://ugspace.ug.edu.gh

13
before flooding. The resultant flooded vegetation has contributed con
siderably to the ecology of the lake environment and the nature of the
fishery. Two important consequences have been that (1) the biomass of
periphyton has exceeded by many times, the biomass of benthos (Petr,
1969), and (2) fishing gear is limited to the stationary type.
Main Study Area
The main study area (Fig. 3) was that section of the lake within
about 5 miles of the village of Ampem, located on the southern shore
of the Affram arm (Area 1). As operational base for field studies,
Ampem has the following advantages: (1) it is an important road-head
which is accessible throughout the year; (2) it is only about 50 km from
VLRP headquarters at Akosombo; (3) it is an important fishing village
and lakeside market which meant that experimental fish catch data could
be checked closely with those of the commercial fishermen; (4) the VLRP
has lodging facilities at the village; (5) the littoral zone is among a few
areas along the Affram arm which were cleared of vegetation before
flooding, thus facilitating the use of beach seine for sampling; and
(6) Loisellefs study on the inshore fauna of the lake indicated that
populations of Chrysichthys in the Affram arm, as a whole, might be
higher than the average for the lake.
Unlike the rest of the lake, which is located in Guinea savanna
vegetative zone, the Affram arm is located in a moist semi-deciduous
forest with some trees reaching heights of over 60 m (Boateng, 1967).
University of Ghana http://ugspace.ug.edu.gh

Fig. 3. Map of Ampem Station showing contours (in feet) above sea level (the 280 ft. contour represents the shoreline when the lake is full)
University of Ghana http://ugspace.ug.edu.gh

jui*4 Mitt
AMPEMFISHINGVILLAGE
<zr AMPEM y RESETTLEMENT
SITE(KWAHU-AMANFROM)'
Meters
Miles
1000 500
SCALE 1:25,000
1
1 3/4 1/2 1/4 0
Yards 1000
LEGEND
Sit Aquatic Weeds and Debris
t Flooded Timber
— - Class 1 Road
= Class 2 Road
2 kmd
1
1000
University of Ghana http://ugspace.ug.edu.gh

16
Much of this type of forest was drowned during the formation of the
lake. Though many softwood trees have been felled by the burrowing ac
tivities of beetles, many hardwood species still stand with their bare
dried tops reaching out 20 - 30 m above the water surface. The shore is
gently sloping back to the hills about 5 km from the lake.
The Affram area is well known for its frequent algal blooms.
This may indicate that this shallow basin is richer in nutrients than
the other arms.
Biswas (1972) showed a positive correlation between dissolved oxygen
and phytoplankton in Volta Lake. Thus dissolved oxygen concentration in
the Affram may be higher than the average for the lake. Czemin-Chudenitz
(1971) stated that at the Affram confluence area, he observed a sharp
drop in dissolved oxygen between 20 and 30 m, varying according to the
location of the thermocline. Oxygen rich water, however, penetrated to
a depth of 40 m twice in one year: in June, 1969 and December, 1969-
February, 1970.
At the Ampem station in 1974 and 1975, dissolved oxygen in surface
waters was between 70 and 9570 saturation except for January, June, July,
and December 1975 (Fig. 4) but became depleted in the bottom waters.
Water temperatures were from 26.6 to 30.0°C and were always higher at
the surface than the bottom. During August 1974, January and July 1975,
the difference between surface and bottom dissolved oxygen was consider
ably reduced. The difference during the last two months was so small
that overturn was apparent. This pattern is similar to the seasonal
pattern observed for the whole lake. As explained by Czernin-Chudenitz
University of Ghana http://ugspace.ug.edu.gh

Fig. 4. Surface and bottom temperatures and dissolved oxygen atAmpem, January 1974 to December 1975 (data from Limnology Section of Volta Lake)
University of Ghana http://ugspace.ug.edu.gh

18
% SATURATION
•* 1974 *+* 1975
University of Ghana http://ugspace.ug.edu.gh

19
(1971), the two overturns result from the effect of dry and cold north
east trade winds which blow over the lake during December to March and
from floods during June to August. Because of these two overturns and
their effect on the hydrobiology and fisheries of the lake, the VLRP
prefers to separate the year into the following quarters: December -
February, March - May, June - August, September - November. The same
quarters have been used in the present study.
Rainfall and water level during January 1974 to December 1976 were
obtained from Ghana Meteorological Services and the Volta River Authori
ty, respectively (Fig. 5). Two peaks of rainfall in a year were re
corded: one in June - July and the other in October. Total rainfall
for the period averaged 790 mm per annum. Lowest water levels were
in July - September (a period of low rains) and the peaks in November -
December (a period of declining rains). The continued drop in water
levels from May through July when much of the rainfall came indicates
that the water levels in the arm are more controlled by rainfall in
other parts of the lake’s watershed than by the rainfall in the Ampem
area.
The Affram arm has more than its share of aquatic plants owing to
the comparatively high nutrient concentration in this section of the
lake. The submerged aquatic plant, Ceratophyllum demersum is well es
tablished in inshore waters. At certain localities at Ampem, thick
beds of this plant rendered the operation of seines ineffective. The
commonest emergent semi-aquatic plant is Polygonum senegalense which
often occurred in thick stands. Other aquatic plants included Ludwigia
University of Ghana http://ugspace.ug.edu.gh

Fig. 5. Ampem Station-Monthly rainfall and water level, 1974-1976
University of Ghana http://ugspace.ug.edu.gh

21
INCHES
Ft 6 r-
280 5 -
1974 4
270 3
2
260 1
Rainfall
0—0 Water Level
Total 27.14
1976
280
270
260
Total 32.6
University of Ghana http://ugspace.ug.edu.gh
stolonifera, A1teranthera sessilis, Pistia stratiotes, Echinocloa spp
and Cyperus spp.
Many fallen trees littered the shallow water area in which the hoop
nets were set. These trees had been pitted by beetles and the resultant
burrows were inhabited by nymphs of the mayfly, Povilla adusta.
Bottom types at this station were silty-sand at the shore and clayey
clumps in deeper water.
A station at the village of Suborni (about 5 km from Ampem) was also
occasionally sampled to determine bottom type preference of Chrysichthys.
This station has a sharper sloping shore than that of Ampem. Sparse
vegetation was observed growing in depressions and crevices of rocks
which dominated the shore landscape.
The Fishery
The construction of the dam at Akosombo was completed in May 1964
and the water reached the maximum controllable level in 1968. Stock
assessment studies (Evans and Vanderpuye, 1973) and quarterly commercial
catch estimates (Bazigos, 1971) started in 1968 and 1969, respectively.
Results of these studies suggest that the fish populations reached their
peak in abundance in the quarter, August to October, 1969, when the total
commercial catch was estimated at 22,900 m tons. Catches dropped steadily
through the three subsequent quarters. The estimated catch for May to
July 1970, was 9,600 m tons. During the following quarter (August to
October 1970), catch rose again to 11,300 m tons which was about half
22
University of Ghana http://ugspace.ug.edu.gh
the magnitude of that of the previous year’s peak. Thereafter, through
July 1975, the quarterly catches fluctuated within the range 11,800 to
7,500 m tons with higher catches in the rainy season and lower catches in
the dry season. The yearly catches indicated a minor downward trend
from 1970 (39,000 m tons) to 1973 (35,000 m tons). Estimated catches
for 1974 and 1975 were 37,000 and 42,000 m tons respectively.
While the total catch seems to have more or less levelled, compari
son between 1970 and 1975 effort statistics (Coppola and Agadzi, 1976;
catch assessment, unpublished data) show the following changes:
23
1970 1975 7o increase
Total number of fishing sites 883 1,479 67.5
Total number of fishermen 18,557 20,615 11.1
Total number of canoes 10,664 15,214 42.7
Thus all 3 indices of effort increased during the period meaning a
decreased catch per unit of effort. An available figure for August to
October 1972 (catch assessment; unpublished data) was 8.73 kg/
fisherman/day.
In 1971, comparison of catch per unit effort in Lakes Nasser
(Egypt), Kainji (Nigeria), Kariba (Zambia), and Volta (Ghana) showed
catch in Volta to be the lowest (Regier, 1972). This observation was
further confirmed when the Morpho-Edaphic Index (MEI) model of Regier
et al. (1971) was used to calculate the potential catch. This model es
sentially predicts the total annual catch from Ryder’s (196 5) MEI, (that
is, the total dissolved solids in mg/1 (TDS)/mean depth in m) for a set of
African Lakes. With a mean depth of 18.8 m (Czernin-Chudeintz, 1971)
TDS of 70 mg/1 (Welcomme, 1972), the calculated MEI for Volta Lake is
University of Ghana http://ugspace.ug.edu.gh

24
3.72. This value gave a predictive yield of 25 kg/ha/yr when intrapolated
in the above model. The estimated actual yield, however, was 42 kg/ha
(Bazigos, 1971). This indicates that the present catch is rather high
and may probably be near the upper limit. Thus the fishery might have
reached stage 3 (intense stage) of Henderson et. a l . (1973 ). They sug
gest that at this stage Mdevelopment objectives must necessarily shift
to maintaining the maximal yield and to improving efficiency rather
than increasing catches".
Prior Studies on the Fish Species in Volta Lake
Major work on the fish species has centered on the distribution,
abundance, and composition changes. The only known pre-impoundment
studies were by Trewavas and Irvine (1947) and Roberts (1967). Their
efforts resulted in the listing of 110 species for the Volta basin. From
October 1964 (5 months after the lake had started filling) to August 1966
the Fisheries Department fished a battery (or gang) of experimental gill
nets near the dam at Akosombo. Denyoh (1969) listed the order of their
relative abundance as follows: Clarias senegalensis, Clarias laeviceps,
Ctenopoma kingsleyae, Alestes dentex, Alestes nurse, Alestes macrolepidotus,
Schilbe mystus, Synodontis schall, Synodontis nigrita, Synodontis membrana
ceous, Synodontis obesus, Labeo coubie, Labeo senegalensis, Labeo
chariensis, Labeo brachypoma, Chrysichthys nigrodigitatus (really C.
velifer), Chrysichthys walkeri, Hydrocyon lineatus, Hydrocyon brevis, and
Hydrocyon forskali. Forty other species of lesser importance were also
recorded. The catch data which he tabulated, however, did not agree with
University of Ghana http://ugspace.ug.edu.gh
this sequence but rather, largely, with Wuddah (1967) who shows that from
November 1965 - August 1966, Chrysichthys was the most abundant genus in
experimental gill net catches.
Petr (1967; 1968b) and Petr and Reynolds (1969) showed that in the
riverine condition, the bulk of the population consisted of mormyrids,
characids, mochokids, and schilbeids and that during the first two years,
many of these families (especially Mormyridae), completely disappeared
while Tilapia (including Sarotherodon) became common in some parts of the
lake. Later, there was (a) a decrease in number of Alestes baremose and
an increase in Eutropius and Cynothrissa in Area 7; (b) an almost complete
absence of Citharinus in Area 4 and (c) an increase in numbers of Tilapia
in fish catches in Areas 6 and 7. Loiselle's (1972) studies on the fauna
in inshore habitats revealed that Chrysichthys velifer had the highest
biomass accounting for 18.37> of the littoral ichthyomass. Sarotherodon
niloticus was second (13.9%) and C. auratus third (7.57<>). As shown by
Vanderpuye (1973), the clupeids (Cynothrissa mento and Pellonula afzeliusi)
accounted for 237o by weight of the experimental gill-net catches for the
period 1969 to 1973. Evans and Vanderpuye (1973) described the early de
velopment of the fish populations and fisheries of the Volta Lake.
Work accomplished in the field of fish biology includes food prefer
ence of Mormyridae and Characidae in the Black Volta River and the Volta
Lake (Petr, 1968a; 1974); reproductive biology of Tilapia species (Wuddah,
1967); food habits of some juvenile fish (Whitehead, 1969); feeding, m i
gration and schooling of small pelagic fishes (Reynolds, 1970; 1971), and
reproductive biology and food habits of four species of Alestes (Reynolds, 1973).
25
University of Ghana http://ugspace.ug.edu.gh

26
MATERIALS AND METHODS
Data on the distribution and abundance of Chrysichthys in Volta
Lake were collected as part of the stock assessment program during the
period May 1969 - October 1973. The selection of the sampling stations
was based on eight geographical areas (also called strata) into which
the lake had been divided, mainly for catch assessment purposes. In
each of areas 1, 2, 4, 5, 6 and 8, three sampling stations were estab
lished: one in deep or open water and two inshore on opposite shores;
in areas 3 and 7, the former representing the riverine north and the latter,
lacustrine south, the number of stations were 6 (4 inshore and 2 offshore).
This was designed to increase the precision of the estimate of the catch
per station for these areas (Fig. 6). Sampling was solely by three bat
teries of gill nets of graded mesh sizes. Each battery was made up of 15
nets of mesh sizes from 13 to 205 mm (stretched mesh) at increments of
12.5 mm ( .5 inch). While all nets were 30 m in length, depth was in 3
categories: 1.5, 3.0, and 9.1 m. Nets were set at about 18:00 h and lifted
the following day at about 06:00 h. During recovery, notes were made of
the vertical section of the net in which a fish was gilled. This was
either top, middle or bottom. Length, weight, sex, and degree of
maturity were recorded for each fish captured, except when the numbers
were large and only a portion of the catch was sampled.
A separate sampling program, initiated in May 1974 and ended August
1977 (Table. A*l) was directed toward the study of the life history of Chrys-
ichthys spp in Volta Lake. After evaluating difficulties inherent in the
University of Ghana http://ugspace.ug.edu.gh

Fig. 6. Map - Sampling stations
University of Ghana http://ugspace.ug.edu.gh

28
1° 3 0 1 1°00'
ooocr>
oooo00
ooo00
oooo
ooo
o000LO
0 ° 3 0 '
oooLO
0 ° 0 0 ' 0 ° 3 0 '
n r — i— r— j - q
Abotoase
KpanduTokor
MILES
10 20 30 40 50
Akosombo Dam _
Ooocr>
oroooo
oooCO
oCOo
ooo
ooooLO
1° 30 ' 1°00* 0 ° 3 0 1 0° 0 0 ' 0°30
University of Ghana http://ugspace.ug.edu.gh

29
Table 1. List of sampling stations: all except 1, 5 and 6 were samplingstations in the stock sampling program (Index to numerals on
Fig. 6)
Station Area Station Area
1. Abochire 1 18. Azizakpoe 4
2. Adawso 1 19. Kpetsu 5
3. Suborni Junction 1 20. Dumb a i 5
4. Kwame Jamara 1 21. Lidza 5
5. Ampem 1 22. Nsunua 6
6. Adidokpoe 1 23. Manoayikpo 6
7. Asekoko 2 24. Boafori 6
8. Dodi Island 2 25. Adormiabra 7
9. Worhekope 2 26. Lanto 7
10. Khoga 3 27. Awusakope 7
11. Khoga Offshore 3 28. Accra Town 7
12. Agornyomi 3 29. South East Yeji 7
13. Tsikpor 3 30. AwQyovikQpe 7
14. Mangoase Offshore 3 31. Aklor No. 1 8
15. Mangoase 3 32. Black Volta 8
16. Zikpo 4 33. White Volta 8
17. Breniassi 4
University of Ghana http://ugspace.ug.edu.gh
30
sampling of a body of water of the magnitude of Volta Lake, I decided to make
Ampem my main sampling station. Originally, this station was to be
sampled for a period of 5 - 6 days in each month. It was expected
that such a schedule would adequately monitor biological activities.
A sampling circuit of the stock assessment stations was also to be
undertaken biannually to monitor the relation of the Ampem study to the
whole lake. Owing to logistic problems, however, such an ideal program
could not be adhered to. This was especially so during those months
when the other stations were sampled. Thus there were 9 out of 29 months
(May 1974 - September 1976 ) when the Ampem station could not be sampled.
From July 1976 to August 1977, a number of field trips with special ob
jectives were undertaken. Some of these were: 1) collection of benthic
samples; 2) search for breeding grounds of Chrysichthys; and 3) trial
capture of Chrysichthys with bamboo traps.
To circumvent problems inherent in gear selectivity, the fish popu
lations were sampled with a gang of gill nets of graded mesh size, a beach
seine, traps (hoop nets), and rotenone.
The mesh size of the gill nets ranged from 13 - 86 mm (stretched
mesh) at 12.5 mm intervals. There were 2 sets of this mesh size range:
one was 3 m deep and the other 10 m deep. Each gill net was 30 m long.
In inshore areas, effort was made to set these nets in waters equivalent
to their depth. In offshore areas, the 10 m deep nets sampled the surface
while the 3 m deep nets sampled the bottom. Nets were always set in the
evening and recovered in the morning.
University of Ghana http://ugspace.ug.edu.gh
31
The overall length of the beach seine was 80 m. The length of
the bag was 9.1 m. The opening of the bag was 20 m long and 6.6 m deep.
The meshes in the bag were 36 and 40 mm, and in the wings, 40 mm. The
dragging of the seine started from a depth of about 10 m, although this
was not measured; on the average 6 hauls were made during a 5-day period.
Hauls were either in the morning or evening or both morning and evening
depending on the objectives in view at the time of sampling. Owing to
under water obstacles (mainly plant debris and clay clumps), the beach
seine was not always successfully operated.
The hoop nets were 8 in number. The stretched length of a net was
2.64 m. There were 6 hoops in a net. The largest hoop measured 80 cm in
diameter and the smallest, 50 cm. The single lead was 20 m long. The
traps were set in such a way that the lead of one touched the first hoop
of another thus forming a barrier. For some time the leads were set
parallel to the shore with the traps in alternately opposite directions
to monitor the direction of movement of Chrysichthys in the night.
Rotenone was used in inshore areas, at depths usually less than 1 m.
As a result of prior experiments (Loiselle, 1972), it was not administered
in dosages recommended by the manufacturers but rather in litre units.
Before the application of the chemical, the sample area was blocked off
with a 25 mm mesh net. It is believed that complete kill was effected
owing to the higher than normal concentrations used. Recovery of killed
and dazed fish continued over a 24 h period.
Captured fish were always measured and both standard length and total
length (from the anteriormost extremity to the end of the longer lobe of
University of Ghana http://ugspace.ug.edu.gh

32
the tail fin) were recorded. The fish were then weighed. In cases of
occasional heavy catches, either a random sample or a stratified subsample
was taken and the rest counted and weighed. Depending on the size of the
catch either all or a sample was sexed. A fish was sexed by cutting open
the abdomen and examining the gonads.
The following categories of sexual maturity stages were utilized
during the early part of the study.
Female:
1. Immature. No individual eggs clearly visible. Ovary small.
2. Developing. Individual eggs visible but not loose and free flowing.
3. Ripe. Eggs large and completely rounded but still opaque; when squeezed, eggs do not flow from body.
4. Spawning. Eggs translucent; flow from the body when squeezed.
5. Spent. Ovaries flabby and only a few scattered eggs (usually small and being resorbed) remain.
Male:
1. Immature. Testes very small; have smooth outline and more or less translucent.
2. Developing. Testes fairly enlarged; possess small side lobes; more or less opaque.
3* Developed. Testes reddish white; side lobes enlarged; no milt flows when cut.
4. Ripe. Testes white; considerably enlarged; milt flows when cut.
5. Spent. Testes still enlarged; well vascularized and flame red in color; no milt flows when cut.
In the above scheme, no distinction was made between ’resting1 (stage
after ’spent’) and immature. The female reverted to the immature stage
University of Ghana http://ugspace.ug.edu.gh
33
since it was not always easy to distinguish between these two stages by
gross inspection in the field. The male reverted to the developed
stage since the mature male can always be distinguished from the immature
by the lobular appearance of the testes.
To make my data comparable to those of other FAO projects in
Africa, stages of maturity suggested by Laevastu (1965) were adopted from
August 1975 to the end of the study period. These are:
Stage 1. Virgin. Very small organs close under the vertebralcolumn. Testes and ovaries transparent, colorless togray. Eggs not visible to naked eye.
Stage 2. Maturing virgin and recovering spent. Testes and ovariestranslucent, gray-red. Length half or slightly more thanhalf the length of the ventral cavity. Single eggs can be seen with magnifying glass.
Stage 3. Developing. Testes and ovaries opaque, reddish withblood capillaries. Occupy about half of ventral cavity. Eggs visible to the eye as whitish granular.
Stage 4. Developed. Testes reddish-white. No milt drops appearunder pressure. Ovary orange-reddish. Eggs clearly discernible; opaque. Testes and ovaries about two-thirds of central cavity.
Stage 5. Gravid. Sexual organs filling ventral cavity. Testeswhite, drops of milt fall with pressure. Eggs completely round, some already translucent and ripe.
Stage 6. Spawning. Roe and milt run with slight pressure. Most eggs translucent with few opaque eggs left in ovary.
Stage 7. Spent. Not yet fully empty. No opaque eggs left in ovary.
Stage 8. Resting. Testes and ovaries empty, red. A few eggs in the state of resorption.
Data on the gonad stages for this study have been organized on the
lines of the earlier categories. This has meant the combination of some
of the categories of Laevastu (1965). The following are the equivalents:
University of Ghana http://ugspace.ug.edu.gh

34
Male:
Categories Stages________ Laevastu Earlier
Immature 1 1
Developing 2 2
Developed 3 and 4 3
Ripe 5 and 6 4
Spent 7 5
Female:
Immature 1 and 8 1
Developing 2 and 3 2
Ripe 4 and 5 3
Spawning 6 4
Spent 7 ' 5
On a few occasions, an attempt was made to determine sex by ex
amination of the external genitalia in the field. The male can be dis
tinguished from the female by the possession of a tubular genital papilla.
The female has, in place of this male organ, a vent (or urinogenital
opening). In breeding females, the vent is enclosed by two fleshy lobes
which are continuous at their posterior aspect. These are highly vas
cularized and flame-red in color. Practically all individuals sexed
were not in breeding condition. This, combined with the small size of
the species, made sexing by external examination difficult. Sex was final
ly checked by dissection and inspection of the gonads. Then the ovaries
were removed, fixed and preserved in Bouin's Piero-formol (Picric acid
University of Ghana http://ugspace.ug.edu.gh

35
sat. sol. 75 parts; 40% formalin, 25 parts; and glacial acetic acid, 5
parts).
Stomachs were preserved in 7% formalin, whereas spines, vertebrae,
and otoliths were put in coin envelopes and appropriately labelled.
Traps which simulated natural spawning sites were made from
lengths of bamboo stems. Each was about 1.2 m long and 8 cm in diameter.
The length of an internode ranged from 40 - 50 cm. Each bore a single
rectangular window about 6 x 6 cm. There were dark chambers on each side
of the window. Between 30 and 40 of these traps were set at the Ampem
station for periods varying between 2 - 5 days. From June 3, 1977, trial
fishing with them started in Ajena Bay. This is a well protected bay
which serves as anchorage for the VLRP boats. The bottom of the set area
was silty sand. Aquatic plants were present but sparse. The traps were
weighted with stones and marked with small floats which were connected to
the traps with twine. Depth of water was between 1.0 and 1.5 m.
Following success at capturing Chrysichthys auratus and C. walkeri
with the bamboo traps, larger traps made from lengths of asbestos pipe
were also set from September 14, 1977. The aim of this second experiment
was to determine if C . velifer and £. furcatus which are larger species
could similarly be captured. The asbestos pipes were about 1 m in
length and the diameter was 12 cm. Each length had 2 windows on the same
side. Each end was covered with a piece of black cloth which was held
in place by a thread. Four of these were set in inshore waters with
the bamboo traps and the other 4 in water about 6 m deep. These were
University of Ghana http://ugspace.ug.edu.gh

36
set offshore in the midst of a cluster of drowned emergent trees.
In the laboratory, the volume of each ovary was determined by
water displacement. After counting the eggs in a 1 cc sample, the
total number of eggs in each ovary was estimated on a simple proportion
basis. Counts of right and left ovaries were added to provide a total
count for a specimen. Average diameter of an egg was determined by taking
20 eggs from each of three sections of an ovary (top, middle, and bottom),
measuring each set in a straight line, and then finding the mean of the 20.
University of Ghana http://ugspace.ug.edu.gh

37
IDENTIFICATION OF CHRYSICHTHYS SPECIES IN VOLTA LAKE
Many past investigators (Boulenger, 1911; Jayaram, 1966; and Daget
and litis, 1965) have used several morphological and meristic character
istics to separate the species in the genus Chrysichthys. Some of these
are: the length of the dorsal fin, shape of premaxillary teeth, ratio
of head length to body length, ratio of the longest caudal ray to length
of the median fin, and number of gill-rakers. The discovery that most
of these characteristics may be environmentally modified or size- or sex-
linked, has rendered keys for separating the species based on such charac
teristics unreliable. During this study many characters were evaluated
for their reliability in separating the species.
Jayaram (1966) used the breadth of premaxillary teeth as an important
taxonomic characteristic for identifying some of the species. In the
present study little variation between species in this characteristic was
discerned. Daget and litis (1965) stated that the number of the gill-
rakers were stable in a number of C. nigrodigitatus they examined. Their
count of 16 - 18 below the first branchial arch, however, differed from
the 12 - 17 obtained by Boulenger (1911) for the same species. Hence they
concluded that the systematic value of this characteristic is as unde
pendable as the others. In Volta Lake the gill-raker counts, especially
when divided into upper and lower, overlap so that they do not give precise
identification (Table 2). A contributory factor might be due to the fact
that the branchial arch of Chrysichthys does not bend acutely to permit
easy division into upper and lower segments. If, however, whole counts
University of Ghana http://ugspace.ug.edu.gh

38
Table 2. Morphological comparisons between the four Chrysichthys species
in Volta Lake
Character
No. examined
C. auratus
27
C. walkeri
15
C. velifer
14
C. furcatus
16
S.L.a 48 - 138 106 - 167 122 - 205 92 - 405
S.L./T.L. .73 - .79 .72 - .78 .69 - .75 .71 - .81
S.L./L. head 2.86-3.78 3.09-4.07 3.20-3.86 3.08-3.84
Dorsal rays (No.) 6 6 6 6
S.L./D.F.H. 1.97-3.57 3.16-3.75 2.72-3.73 3.08-4.92
Longest D.R. 1st 1st 2nd 2nd or 3rd
Gill-raker count
1) upper 8-13 10-14 22-27 18-28
2) lower 14-19 17-20 12-18 11-17
Anal ray count
Branched 5-7 6-7 5-10 5-10
Unbranched 3-5 3-4 3-6 2-5
SiAbbreviations: S.L. = standard length; T.L. = total length; L.Head =
head length; D.F.H. = length of longest dorsal ray; D,R. = dorsal ray.
(upper and lower) are considered,a clearer pattern emerges (Table 3). The
calculated confidence intervals (P < 0.05) of gill-raker counts (first gill
arch) for C. auratus and C. walkeri were 26.52 - 28.82 and 28.96 - 30.90
respectively and those for C. furcatus and C. velifer were 34.99 - 40.13
and 37.43 - 40.71 respectively. Thus if the gill raker counts are less
University of Ghana http://ugspace.ug.edu.gh

39
Table 3. Comparison of number of gill-rakers of Chrysichthys spp in
Volta Lake
Species No. specimens Size range No. gill- rakers 957o confidence
examined SL in mm Mean Range interval
C. auratus 21 16-138 27.67 23-32 26.52-28.82
C. walkeri 15 105-167 29.93 27-32 28.96-30.90
C. furcatus 16 92-310 37.56 30-43 34.99-40.13
C. velifer 14 122-195 39.07 34-44 37.43-40.71
than 32 the specimen is probably C. auratus or C. walkeri and if over 32,
C. furcatus or C. velifer. In the former group, C. walkeri had a sig
nificantly higher mean count, 29.93, than C. auratus, 27.67 but the
ranges overlap so much that the counts are of little value in separating
the species. Specimens with counts of 23 to 26 are likely C. auratus.
Since the smaller species (C. auratus and C. walkeri) showed lower
gill-raker counts than the larger species (C. velifer and C. furcatus),
the question of w h e t h e r the number of gill-rakers was correlated with
size was investigated. There was no discernible trend within each species
(Fig* 7). Both small and large fish of each species tended to have the
same number of rakers distributed randomly within a range. This indi
cates that the gill-raker count could be relied upon, notwithstanding the
size of the fish.
In my studies, the following characteristics were used in separating
the species:
University of Ghana http://ugspace.ug.edu.gh
University of Ghana http://ugspace.ug.edu.gh

• auratus
Awalkeri
41
□ □
O
□□
o □ o o o o o □
o ODD □O □ □ □
o o
</>=3+->naus-3M-
S-<DM-
<U>
o □
<
<3*3 •O
<a <
<1X33 #•
<1 O #
< *4 <1 • •
< •
i----------------- 1------------------1_________________i_o o o oo o o o*3- CO <NI r—
wui N I H 19 N 3 1 Q W Q N V I S
LO
L OCO
_ oCO
— L OC\J
_ oCM
NUMB
ER
OF GI
LL-R
AKER
S
University of Ghana http://ugspace.ug.edu.gh

42
a. Longest ray of dorsal fin, the first
1. barbels pinkish, olivaceous green back, pinkish silvery
grey below: C. walkeri.
2. barbels yellowish, yellow-green back, light yellow-green
below: C. auratus.
b. Longest ray of dorsal fin, second or third
1. caudal fin lobes almost equal: £. furcatus.
2. upper caudal lobe prolonged and somewhat hooked:
C. velifer.
Apart from color, C. walkeri were separated from C. auratus in the
field on basis of eye protrusion. From the ventral aspect, C. walkeri
eyes protrude slightly more than those of £. auratus. No measurements
were, however, taken during the study period to confirm this observation.
Recently, at my request, staff of VLRP submitted data on orbital diameter,
interorbital distance and width of the head in the eye region with which
I hoped to validate this observation. Unfortunately, the data showed
considerable variation with no clear-cut species differences. There is,
however, need for further checking.
Some of the sex-linked characters noted during the breeding season
were: 1) an extraordinary increase in the size of the head and buccal
region of the male (Ajayi, 1972); 2) a change of color from bright silvery
grey in both sexes to dusky grey; and 3) the development of a fold of skin
which encloses the urinogenital opening of the female. The main environ
mentally-induced variation observed was in respect to color. For example:
the downstream population looked darker than the Ampem population. But
the Ampem population also looked darker than the population in the northern
University of Ghana http://ugspace.ug.edu.gh

43
sector of the lake. It is interesting to note that the downstream waters
are very dark as a result of dye material dumped into this section of the
river by a textile factory. Also, the northern waters appear more whitish
as a result of considerable silt brought into the lake by the large
tributaries, the Black and White Voltas and the Oti River. Thus there is
circumstantial evidence that the color variation might be an adaptation to
background. Another variation was size. It is common knowledge that the
same species in different bodies of water may have different growth rates
and consequently different ultimate lengths. For example: 1) when I
visited the Ivory Coast in 1976, I observed that the average size of C.
walkeri caught by the commercial fisherman in the Ebrie Lagoon, was larger
than the largest I ever caught in Volta Lake during this study; 2) in 1966
when Chrysichthys was the predominant species in Volta Lake, large sizes
were caught but no measurements were recorded. Since then there has been
a considerable diminution in size of many species including Chrysichthys.
The largest Chrysichthys caught during this study was a ripe male C.
furcatus. It measured 41.8 cm SL (52.3 cm TL) and weighed 1.125 kg. The
largest C. velifer measured 39.0 cm SL (51.1 cm TL) and weighed 1.00 kg.
The heaviest of this species, however, measured 38.0 cm SL (49.0 TL) and
weighed 1.08 kg. These were both females; the former had developing
gonads and the latter was ripe. Similar statistics for the remaining
two species were: C. walkeri, male; developing gonads; SL, 23.5 cm
(TL, 36.0 cm); weight, 0.18 kg; and C. auratus, male; developing gonads;
SL, 19.5 cm (TL, 26.5); weight, 0.12 kg. Large Chrysichthys specimens
captured in other bodies of water in Africa and reported in the literature
University of Ghana http://ugspace.ug.edu.gh
44
are presented in Table 4. Except for C. furcatus in Kainji Lake and C.
walkeri in Lekki Lagoon, the reported sizes were larger than those cap
tured in Volta Lake during the period of this study.
The, following descriptions apply to the species in the Volta Lake:
C. walkeri (Gunther 1899)
The color is olivaceous green on the back and pinkish silvery grey
underneath. The barbels are pinkish. The base of the dorsal spine has
a blackish spot. Sometimes the dorsal fin has crimson splashes at the
margins. The adipose is clear. The snout is prominent and the eyes
are large. The mean anal ray counts were: branched, 6 (range: 6 - 7 ) ,
unbranched 3 (range: 3 - 4). The longest dorsal ray is the first. The
upper caudal lobe is somewhat prolonged and hooked. The mean lower gill-
raker count of the first branchial arch is 11 (range: 10 - 14) and the
upper, 18 (range: 17 - 20).
While the above description is close to that of Daget and litis
(1965), it differs slightly from that of Loiselle (1972) in respect to
color. He describes C. walkeri as brown dorsally, beige on the flanks and
paling to dirty white on the venter. It would appear that his description
applies to individuals that have assumed the breeding color.
C. furcatus (Gunther 1864)
The large rounded dorsal fin and moderately forked caudal fin with
almost equal lobes easily distinguish, this species from the rest. The
specimens I examined had the upper caudal lobe slightly longer and taper
ing than the lower. The color is dusky grey with iridescent greenish
sheen on the back and silvery white beneath. The adipose has a dark
University of Ghana http://ugspace.ug.edu.gh

Table
4.
Large
specimens
of
Chrysichthys
captured
in
other
bodi
es
of
water
in
Africa
45
uo43•U
<
do•H-Uoo
m T3 r- cu on
4 J r—( •HO -
ccd cd
H•v Ct4
CO
mON
CO
4->
in Q) on
4-> i— I •pHo •*
44 c o p i cd cd
/ - s vD ^ t— 1 X~N \ Q ^CM CM O N (=| M OJ O N dr -- r -. r - H Cd »— 4 cdO N O N * 0 o ni - i r —1 cd a r —) cds - / co , £ cd '__ co 43
d o d O•H • p H a) .H 4-> •pH cu .h
> * ^ s <u > , r O 2cd cd 00 cd
•r-) •i— ) o a cd • r - > o a< <J hJ -H Q <d t-J - H
4-> 4 JCO cocd cdo o
a CJcd cd Cd
•H x • H >>M ' M M M MG> CU O cu O50 00 > M 00 >
•p4 •H W <U • H Mo o
•H•V d *\ d
cu <U o CL) o44 44 o •v 44 ocd cd 00 u cd 00
J cd 0) cdhJ 00 J
•H •rl •H •H•I- ) CU z CU
a d 3 d 3•H •H O T> • H oco cd 00 •H cd 00
o s o
TJ m (D r-
4 -) O N •r—I i— IoCO 44 cd a
cd - M
<1* fa r-O N rO«— I d w cd
dcd 4 3
B oO *H ffJ S
cd4->f-Jo>
MDr»on
p•f—)
6a)coP
44M
OinO N
ofa
<-d
cd cd•H 44H cd<D r—t a)00 cd u
•H P ♦pHh J cd
CO•v m
c oo coo cu u00 o 0)cd c >hJ a; •H
P P i• p H >— i
M-J cd44 Pi 44Q) O cd
► J o S
OO
-U4360..-I<u
eo
434-100d<uJ
CO<u•HoCL)CUw
r—1 o o in mo m o T"- v OCNJ r ^ <r o rH
# • • • •O O Csl CO o
.J JH H H fH
O r - - m CO• • • •
r>- 's O m O'CN CM
•sh4 • J .-J
CO CO C/!) CO
in o O m 00• • • • •
o OO o CM oCNJ CO m m CM
CO COD p
4-> ucd cd■p 4-»•rH •rH00 00 CO CO
CO •pH •H d od T3 4 -) 4 J
4-> O O cd cdcd }-i o o
00 00 Md •H •pH p 3cd d d U-4 iw
oom
•o
o
co
•HCU44i— 4
cd£
oo•
C O
oiHm
►JE-*
mC M
om
Ol o| o | u| o| u|
•pH •rl•H•H
M u 43<u V O
44 44 dr—1 rH cdcd cd u
o
• • •0 | 1 U | 1 O l QJ I
laticeps
154.0
148.00
Stanley
Pool
, Zaire
Poll
(1950)
University of Ghana http://ugspace.ug.edu.gh

46
center with a translucent border. The part of the breast nearest the
opening of the gill-chamber has an iridescent greenish blotch. The mean
lower gill-raker count of the first branchial arch is 14 (range: 1 1 - 1 7 )
and the upper, 24 (range: 18 - 28). The mean anal ray counts are:
branched, 8 (range: 5 - 1 0 ) and unbranched 4 (range: 2 - 5 ) .
The identity of this species was not in doubt since the description
tallies closely with those of Reed eX al . (1967), Daget and litis (1965),
and Loiselle (1972).
C. velifer (Norman 1923)
Like C. auratus and C. walkeri, the caudal fin is deeply forked.
The upper caudal lobe is prolonged and somewhat hooked. The adipose has
a dark center bordered by a translucent margin. The dorsal fin is high
and sail-like. The fish is dusky above with dusky silvery sides and
belly. The barbels and the caudal fins have a pinkish tinge. The mean
anal ray counts are: branched 7 (range: 5 - 10), unbranched, 5 (range:
3 - 6 ) . The mean lower gill-raker count of the first branchial arch is
15 (range: 12 - 18) and the upper, 24 (range: 22 - 27). The dorsal fin
is long and filamentous with a black tip. The second dorsal ray is the
longest. The dorsal fin is low in some w h i l e fairly high in others. This
is evidenced in the fairly wide range of the ratio: standard length/
dorsal fin height (2.72 - 3.73). Those with long filamentous dorsal
fin may be difficult to distinguish from C. auratus longifilis. But
whereas in C, velifer it is either the second or third ray which is the
longest, in C. auratus longifilis, it is the first.
University of Ghana http://ugspace.ug.edu.gh
47
C. auratus (Pfaff 1933)
The color is yellowish green, darker on the back and lighter ventral-
ly. The dorsal and pectoral fins are lemon yellow. It is the smallest of
the Chrysichthys species in Volta Lake. The eyes are larger than those
of C. velifer and C. furcatus but smaller than those of £. walkeri.
The longest dorsal ray is the first. The height of the dorsal fin is
often very variable as evidenced by the ratio, standard length/dorsal
fin height (1.97 - 3.57). £. auratus longifilis, in which the longest
dorsal fin ray reaches all the way down the caudal fin was described
by Reed e t (1967) in River Niger. My specimens seemed to indicate
a more or less continuous variation in the length of the longest dorsal fin
ray rather than a separation into subspecies. The mean lower gill-raker
count of the first branchial arch is 10 (range: 8 - 1 3 ) and the upper,
17 (range: 14 - 19). The mean anal ray counts are: branched, 6 (range:
5 - 7 ) , unbranched 4 (range: 3 - 5).
University of Ghana http://ugspace.ug.edu.gh

48
ABUNDANCE AND DISTRIBUTION
With the exception of catches by the 13-mm mesh gill nets which
usually consisted of the tiny species (mainly, Pellonula afzeliusi,
Physailia pellucida, Paradistichodus dimidiatus, and Barbus spp),
Chrysichthys accounted for 43.8% of the total catch at the Ampem
station (Table 5) thus making it the most abundant genus, distributed
as follows: C. velifer 23.37,, C. auratus 10.37,, C. walkeri 10.07, and C.
furcatus 0.0027,. Chrysichthys comprised an average of 34.57, (by number)
of Loiselle?s (1972) collections at 3 stations in the Affram arm. £.
velifer, C. auratus and C. walkeri contributed 19.8, 14.4, and 0.37, re
spectively (Table 6). Even though all three stations were sampled in a
space of one month and only one sample was taken at a station, agreement
between the two studies as regards general order of abundance was good.
A more general picture is obtained from his sampling of 23 stations
scattered throughout the lake which showed that Chrysichthys was the most
abundant genus accounting for 25.87, of the littoral ichthyomass. This
was made up of mostly C. velifer (18.37,) and C. auratus (7.57,). C.
furcatus and C. walkeri made insignificant contributions.
During August 1974 to May 1975, various stations were sampled in
Areas 3, 7, and 8. Traps and rotenone were used in Area 3 while gill
nets were used in Areas 7 and 8. Depth sampled ranged from 0 - 3 m.
The result of the survey (Table 7) showed that the bagrids (997, Chrysich-
thyjO comprised 527c of the experimental catch. The varying efforts ex
pended in the Areas and the different catching methods employed, precluded
University of Ghana http://ugspace.ug.edu.gh

49
Table 5. Numbers of Chrysichthys and other species taken at Ampem in survey samples (except for 13 mm mesh nets), June 1975 to May 1976, and percentages of Chrysichthys in the ichthyo-
faunaa
Species Periods*5 Total 7o1 2 3 4
Chrysichthys auratus 122 500 195 132 949 10.3
C. walkeri 340 272 170 138 920 10.0
C. velifer 804 769 382 188 2143 23.3
C. furcatus 1 1 1 9 12 0.002
Total 1267 1542 748 467 4024
Others 2431 1443 722 578 5174
7e Chrysichthys 34 52 51 45 43.8
aDetailed data in Table A-2.
Periods = 1 - June to August 1975
2 - September to November 19753 - December 1975 to February 19764 - March to May 1976.
University of Ghana http://ugspace.ug.edu.gh

50
Table 6. Distribution of Chrysichthys in Volta Lake during the period January to May 1970* (Data collected by Loiselle (1972); de
tailed data in Table A-3)
AreaNo. of samples C. auratus C. walkeri C. velifer C. furcatus Kg/ha
1 3 268 3 351 - 222.3
2 4 244 - 123 - 83.9
3 5 102 1 279 2 52.8
4 2 - - 42 - 7.4
5 3 - - 385 - 5.70
6 1 - - - 52 3.27
1 5 70 - 43 - 7.94
Totals 714 4 1223 54
direct comparison of catches between areas. Comparison could, however,
be made between Areas 7 and 8 where gill net was the only gear used.
Catching effort in Area 8 was one-quarter that in Area 7, Chrysich
thys caught in Area 7, was 69 as against 5 in Area 8. Thus it would
appear that there were less Chrysichthys in Area 8 than in Area 7. In
Area 3, examination of 186 individuals showed C. walkeri to be the most
abundant, accounting for 78%. It was followed by C. velifer (12%) and
C. furcatus (17<>). Thus C. walkeri showed up more strongly in Area 3
during this period than it did during Loiselle's (1972) survey.
In Area 7, the order of abundance was C. velifer (477c), C. auratus (327,)
and C. walkeri (17%). Only 3 C. auratus, 1 C. velifer and 1 C. furcatus
were captured in Area 8.
University of Ghana http://ugspace.ug.edu.gh

51
Table 7. Numbers of bagrids and of other fish in catches in Areas 3, 7 and 8 during August 1974 to May 1975 taken by gill nets (excluding 13 mm mesh), traps and rotenonea
Family Area_________________ Total3 7 8
Osteoglossidae 1 1
Mormyridae 18 2 20
Clupeidae 4 4 8
Characidae 14 99 81 194
Citharinidae 2 8 5 15
Schilbeidae 1 86 40 127
Mochokidae 11 26 4 41
Cichlidae 22 14 36
Malapteruridae 4 4
Centropomidae 4 7 11
Bagridae 441 72 5 518
Cyprinidae 8 4 12
504 342 141 987
No. of stations sampled: 5 8 2
aDetailed data in Table A-4.
University of Ghana http://ugspace.ug.edu.gh
52
Temporal and Areal Changes
Petr (1967) compared the commercial catch at Bui on the Black
Volta River (the largest tributary of the Volta Lake) during the rainy
season of 1965 with the catch of several lakeside fishing villages, and
found the relative abundance of bagrids (mostly Chrysichthys) to be
similar. Furthermore the results were similar to those of the Kainji
Reservoir, Nigeria (University of Liverpool’s Expedition Report, 196 5,
as cited in Petr 1967). The data in Petr (196 7 ) indicate that no
Chrysichthys were caught at Akosombo from January to April 196 5 but
Chrysichthys constituted 55%, of the experimental catch at the station in
November and December 1965. In February 1966, Chrysichthys made up
only 1.47% of the catch at Kpandu (Area 3) and 1.78% at Ampem (Area 1).
The localized abundance around Akosombo was similarly recorded by
Wuddah (1967), who recorded catches of 79.66%, and 79.907o in ex
perimental gill nets in July 1966. This was followed by a decline
to a lower level in August 1966; 36.93% of the experimental catch
and 71.65% in nets run by the Fisheries Department (Wuddah, 1967).
From 1969 to 1972, the relative abundance of the fish species
in the Volta Lake was monitored by the Stock Assessment Section of the
VLRP (Table 8). Owing to logistic problems, periods within which a
circuit of the stations was completed varied from 3 - 6 months. Further,
the rigid webbing of the monofilament nets reduced the vulnerability of
Chrysichthys. to capture; especially that part of the vulnerability
through spine entanglement in the webbing. Consequently, the Stock
University of Ghana http://ugspace.ug.edu.gh

53
Table 8. Temporal abundance of Chrysichthys in Volta Lake by seasons as monitored by standardized gang of experimental gill nets by the Stock Assessment Section of the VLRP during the period, December 1969 to February 1972 (Fishing effort in Areas 3 and 7 was twice that of the other areas)
Periods3Area
1 2 3C. auratus
4 5 6Totals
1 160 2 5 5 35 1 2082 28 - - 1 - 293 - 4 7 - 14 4 294 - 2 - 1 - - 35. - 3 - - 18 - 216 - 2 - 7 4 - 137 - 14 2 9 - - 258 - 6 1 4 18 10 39
Totals 188 33 15 27 89 15 367
C. velifer
1 66 1 _ 24 1 922 75 3 - - 18 - 963 34 5 - - 24 6 694 - 3 2 - - - 55 - 1 - - - _ 16 - 1 1 _ 7 6 157 - 7 - 1 3 2 138 - 3 4 - - 1 S
Totals 175 24 7 1 76 16 299
Periods = 1. Decemher 1969 - May.19702. June 1970 - September 19703. October 1970 - March 19714. February 1971 - April 19715. May 1971 - September 1971
6. September 1971 - February 1972.
University of Ghana http://ugspace.ug.edu.gh
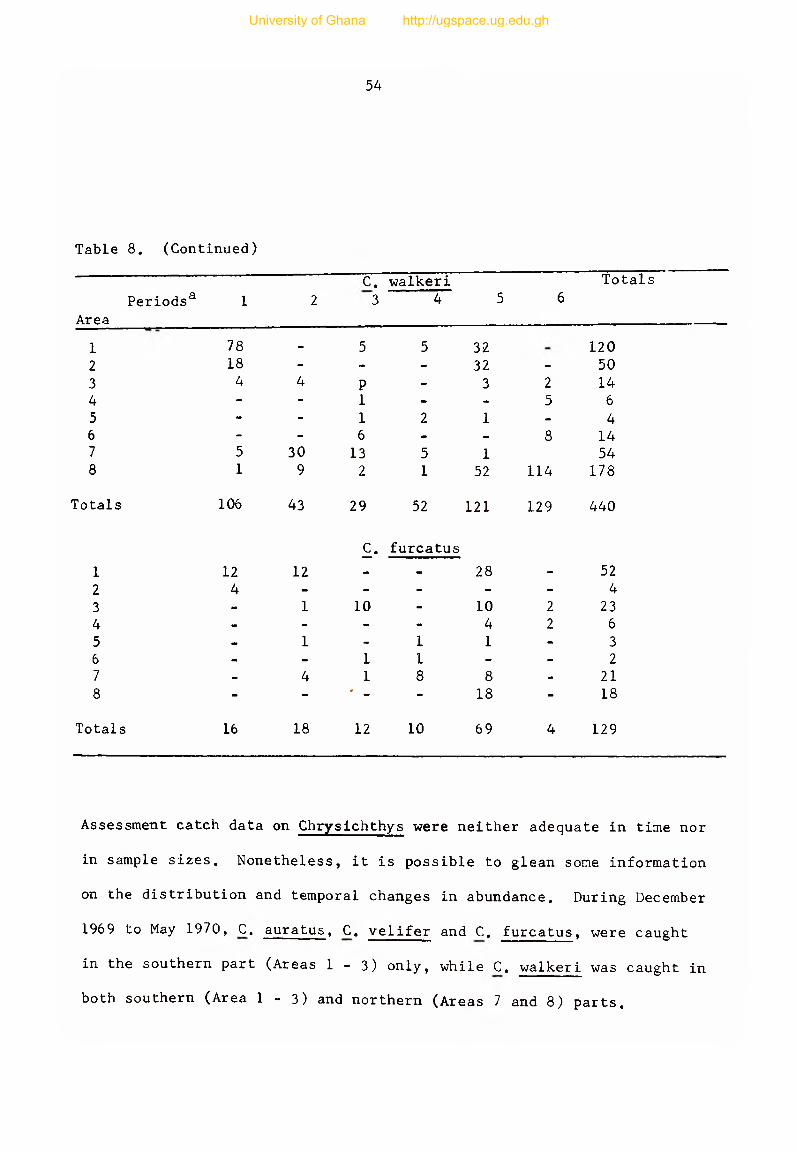
54
Table 8. (Continued)
PeriodsaArea
1 2
c.3
walkeri4 5 6
Totals
1 78 _ 5 5 32 120
2 18 - - - 32 - 50
3 4 4 P - 3 2 144 - - 1 - - 5 65 - - 1 2 1 - 46 - - 6 - - 8 147 5 30 13 5 1 548 1 9 2 1 52 114 178
Totals 106 43 29
£•
52
furcatus
121 129 440
1 12 12 - - 28 - 52
2 4 - - - - - 4
3 - 1 10 - 10 2 234 - - - - 4 2 65 - 1 - 1 1 - 36 - - 1 1 - - 27 - 4 1 8 8 - 218 - - * - - 18 - 18
Totals 16 18 12 10 69 4 129
Assessment catch data on Chrysichthys were neither adequate in time nor
in sample sizes. Nonetheless, it is possible to glean some information
on the distribution and temporal changes in abundance. During December
1969 to May 1970, C. auratus, C. velifer and C. furcatus, were caught
in the southern part (Areas 1 - 3 ) only, while C. walkeri was caught in
both southern (Area 1 - 3) and northern (Areas 7 and 8) parts.
University of Ghana http://ugspace.ug.edu.gh

55
Chrysichthys showed more even distribution during June to September 1970;
C. auratus and C. velifer were caught in all areas while C. walkeri
aftd C. furcatus showed patchy distributions. Thereafter, the dis
tribution continued to be patchy with the central areas (4, 5, 6) indi
cating lower abundance. Abundance for many areas increased during May -
September 1971. It is noteworthy that Chrysichthys showed more con
tinuous distribution and increased abundance during June - September
1970 and May - September 1971, the wet seasons for most areas of the lake.
This might indicate increased activity of the fish during this time of
the year. This is a phenomenon well noted among fish species in Volta
Lake (unpublished commercial catch assessment data).
From the above temporal changes, it could be concluded that
from around November 196 5 (about a year after the lake had started
filling) to May 1970, Chrysichthys was relatively abundant near the
damsite at Akosombo. Sampling during June - September 1970 showed a
decline in abundance and a more even lakewide distribution. Thereafter,
abundance fluctuated seasonally with more fish being caught in the
rainy season.
Petr (1967) recorded that Chrysichthys spp comprised 1.987„ of
catches in the Volta River and 0.527o of the catches in the Niger River.
These proportions are far lower than have been realized since the forma
tion of the lake. Lewis (1974) stated that there was an increase in
Bagridae (mostly Chrysichthys) after the formation of the Kainji Lake,
University of Ghana http://ugspace.ug.edu.gh

56
Nigeria. Thus it would appear that Chrysichthys prefers comparatively
lacustrine to riverine environment. Since the formation of the Volta
L a k e , some fish families have disappeared from the southern lacustrine
sector and are now confined more or less to the northern riverine sector
(Table 7). These include: Mormyridae, Characidae (except Alestes
m a crolepidotus), Cyprinidae (except Barbus spp), Schilbeidae, Citharinidae
(except Distichodus spp). Others, mostly the cichlids, have expanded in
the southern lacustrine area. The present study shows that Chrysichthys
have increased in abundance in all areas with indications of higher
abundance in the southern areas.
Depth Distribution
Generally, the abundance of Chrysichthys decreased with depth (Table
9), indicating that the species prefer inshore, habitats. Most of the
small species (£. auratus and C. walkeri) were caught in 1.5 m deep water
while most of the large species (C. velifer and C. furcatus) were caught
in the bottom half of 3.0 m deep water. In 10.0 m depth, there seemed to
be preference for middle waters by C. furcatus and C. velifer in that chi-
square tests of independence indicated significant differences ( P <0.05)
University of Ghana http://ugspace.ug.edu.gh

Table
9.
Distribution
of
Chrysichthys
in gill
nets
in insh
ore
and
surf
ace
of
offshore
waters
during
the
period
December
1969
to
February
1972,
as
monitored
by
a standardized
gang
of
experimental
gill
nets
by
the
Stock
Assessment
Sectio
n of
the
VLRP
during
the
period
December
1969
to
February
1972
57
PQ
Boo
Q)UOrC
CO
U-lo
BoCO
PQ
PQ
B<DU oO •
A o oCOG
M
PQ
$
Bm
(0<U•HO<L>D,
CO
i v O r ^ . c m
i n c o
vO< 1-
CM 00 CMCM
CN 0 0 I CO
a> 0 O r-s f r —I i—I r - l
C OCM
o O m op - o o o o o o
«n <r onr - l C O CM
r-J CO ON 0OvD o o 0 0 CN
o|
CO* r H u p
QJ 4-1a; MH cd
•H oi—i r - l Mcd <u p£ > <4-1. • •
1 u | 1 u|1 0 |
m
m
o o
O'CN
mON
o oCN
CMm
mvOo o
CN00
VOin
cor—Jcd4->oH
Abbreviations:
T =
top,
M =
middle,
B =
bottom,
here
and
throughout
the
dissertation.
University of Ghana http://ugspace.ug.edu.gh

58
in the numbers in the top, middle and bottom waters. In the same depth,
C. auratus and C. walkeri tended to concentrate at the bottom two-thirds.
The offshore nets which fished surface waters, caught only a few speci
mens indicating less preference for this zone of the lake. Bottom nets
could not be set in this area because of flooded trees which made fishing
ineffective.
Chernin-Chudenitz (1971) showed that for most areas in Volta Lake,
oxygen concentration below 10 m is zero. Ajayi!s (1972) laboratory study
of oxygen tolerance of Chrysichthys, showed that experimental fish ex
hibited signs of distress when the ambient oxygen concentration was re
duced to 0.46 mg/1. They finally died at a concentration of 0.30 mg/1.
Thus it can reasonably be concluded that except for periods when the lake
waters are holomictic and dissolved oxygen extends well to the bottom,
C hr ysichthys distribution may be confined to roughly a maximum depth of
10 m in Volta Lake. During this study, when gill nets were set at the
b o t t o m in the channel of the former Affram River (depth about 30 m), and
near the mouth of a tributary stream (Oworobong River), the following
species caught: Synodontis sp (6), Hydrocyon sp (3) and Lates niloticus.
Dissolved oxygen at this depth was 47?0 saturation (3.61 mg/1) probably
because of the inflow from the river. Inspection of catches of fisher
men who fished deeper waters (because of intimate knowledge of the locali
ties free of underwater obstructions) than I fished, showed that only
Synodontis catfish may inhabit the deepest parts of the lake. There were
catches which comprised Synodontis only and others with a sprinkling of
University of Ghana http://ugspace.ug.edu.gh
59
large C. velifer. The latter catch might have been made at the fringe of
the distribution of C. velifer. There is also the further suggestion
that the distributions of C. auratus and C. walkeri end in shallower
w a t e r than that of C. velifer.
Finally, low oxygen concentrations which have resulted in *fish killst
in both Volta and Kainji Lakes, have first showed in mass death of
C hrys ichthys (Ewer, 1966; Petr, 1968b; Ajayi, 1972).
Notwithstanding this low tolerance for oxygen deficiency, fish are
capable of penetrating into deoxygenated water for lengths of time (Sprugel,
1951). During those periods when the lake level rose and covered the
marginal vegetation resulting in decomposition (zero oxygen saturation was
recorded on many occasions during this study), Chrysichthys and other
species were caught in traps set in the flooded bush overnight and were
dead when the traps were lifted. The more advanced state of decomposition
of Chrysichthys than the other species observed when traps were being
tended the next day, seemed to indicate that they were the first to suc
cumb to the anoxic situation. General kills of fish not trapped were not
noted at this time, indicating that they probably moved to better water.
Catches were lower in the central areas (4, 5, 6) than in the rest.
The central areas represent an interphase between the shallow riverine
north and the deep lacustrine south. The most preferable area was 1,
which was both lacustrine and shallow. Thus it would appear that depth
and degree of flow, are two independent factors which interact to deter
mine the distribution of Chrysichthys. Both increasing (1) depth and (2)
flow, have negative effects.
University of Ghana http://ugspace.ug.edu.gh

60
Table 10. Area and depth distribution of Chrysichthys in Volta Lake as monitored by a standardized gang of experimental gill nets by the Stock Assessment Section of the VLRP during the period,
December 1969 to February 1972
Area Totals Inshore Offshore
1.5 m 3.0 m »-* o • !o m 30 m i—>
o • o m
T B T M B T B T M B
1 510 169 37 118 21 96 44 7 4 9 - 5
2 175 111 11 49 4 - - - - - - -
3 134 26 8 68 12 4 8 4 - 2 2 -
4 18 2 4 6 1 1 - 1 - - - 3
5 28 6 6 11 - 1 1 3 - - - -
6 52 16 6 18 1 5 2 - - - 2 2
7 229 78 3 71 7 11 22 12 9 1 8 7
8 117 48 7 24 6 11 17 2 - 2 - -
1263 456 82 36 5 52 129 94 29 13 14 12 17
Length-Frequency Distributions
Catches with rotenone, traps, gill nets of various mesh sizes and
depths, beach seine and gill nets set at the bottom, provide an insight
into size distribution in relation to depth. Though the seine net was
usually paid out at a depth of about 10 m, it could only have been effective
when the lead line contacted the bottom. The maximum depth of the seine
was 6.57 m; hence the real depth sampled was less than 6.5 m.
University of Ghana http://ugspace.ug.edu.gh

61
Analysis of the data for C. velifer (Table 11), auratus (Table 12),
and C. walkeri (Table 13), showed that, generally, size increased with
depth. Inadequate data for C. furcatus (Table 14) have precluded a
definitive statement for that species.
Usually, study of the length frequency distributions of the young
at reasonably short intervals, e.g. monthly, provides an insight into
periodicity or uniformity of spawning of a species. With the exception of
C. furcatus. the rotenone reasonably sampled the young Chrysichthys;
hence monthly length frequency distributions of collections with this
chemical were studied with a view to identifying any possible trends
(Tables 1 5 - 1 7 ) . In September and October 1975, more and smaller in
dividuals of all three species were collected which may indicate new re
cruitment. In November and December, the modal lengths were greater sug
gesting growth but the increases are more than might be expected particu
larly for November. C. auratus reaches a length of 88 mm at the end of the
first year in Kainji Lake (Ajayi, 1972) and C. velifer spawns at about
100 mm. Since growth probably is year-round, monthly increases of 25 mm
or more are unlikely. Sampling variation may account for all the monthly
differences in these tables. If spawning were markedly seasonal it should
show up even with this type of sampling.
In view of the foregoing discussion, length frequency distribution of
larger fish which usually inhabit deeper water was studied for the period
April to December 197 5 (Tables 18 - 20) for which there was least interrup
tion of the monthly sampling schedule. When captures with the least
selective of the sampling gear (beach seine) were analyzed, modes were
University of Ghana http://ugspace.ug.edu.gh

62
Table 11. Length frequency distributions of £. velifer captured with^different types of gear and rotenone in varying depths u r m g
the period, October 1974 to November 1975a
Length RotenonegroupsSL in mm
Traps 1.5 m net
3.0 m net
Seinenet
10.0 m net
Bottom
set
36-49 16 3 1
50-64 42 7 5
65-78 33 12 22 2
79-93 34 31 8 3 39 8
94-107 11 42 3 67 3 1
108-121 10 28 2 7 63 10 2
122-136 5 47 8 261 23 2
137-150 4 39 15 387 23 8
151-164 2 30 3 243 12 2
165-179 2 21 139 17
180-193 1 28 11 76 22 4
194-208 3 7 6 52 14 1
209-222 1 3 4 8 18 4
223-236 1 4 6 10 2
237-251 4 13 4
252-266 1 2 3 3266-281 5 5
281-293 2 1294-308 2
309-323 1
324-337 1 1338-352 1353-366 1367-380 1
Total 164 296 10 70 1373 191 42
Mean length(mm) 82 131 92 16 7 144 178 208
^ h i s shows a general increase in size with depth. Methods of capture have been arranged in such a way that depth increased from left to right.
University of Ghana http://ugspace.ug.edu.gh

63
Table 12. Length frequency distribution of C. auratus captured withdifferent types of gear and rotenone in varying depthsduring the period October 1974 to November 1975a
Length groups SL in mm
Rotenone Traps 1.5 m net
3.0 m net
Seinenet
10.0 m net
Bottomset
38-52 134 1
53-68 177 18 7 1 1
69-83 52 11 3 19 5 1
84-98 8 31 7 14 31 5 1
99-114 2 16 1 2 37
115-129 2 3 1 50 4 3
130-144 3 1 1 63 2 3
145-159 1 22 3
160-175 8
176-190 1 1
191-205 2
206-220 1
Total 379 81 8 21 241 20 10
Mean length (mm)
59 88 93 94 119 106 122
^?his shows a general increase in size with depth. Methods of capture have been arranged in such a way that depth increased from left to right.
University of Ghana http://ugspace.ug.edu.gh
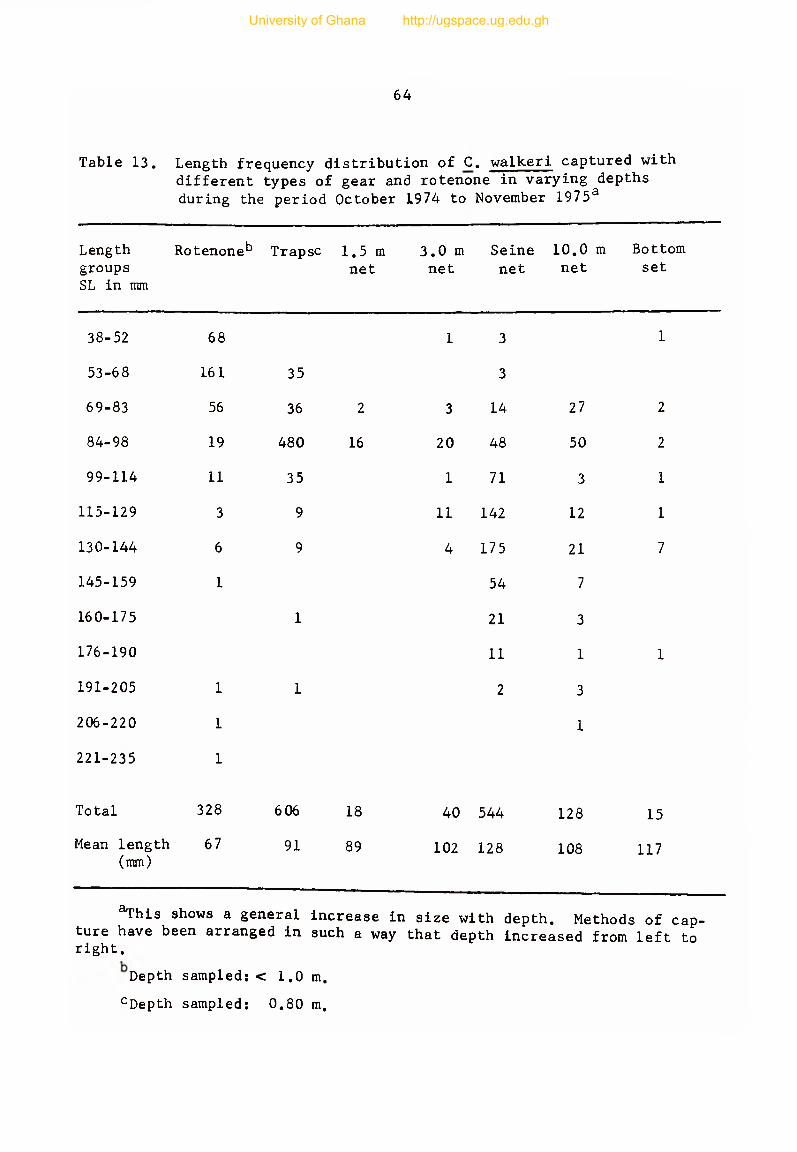
64
Table 13. Length frequency distribution of C. walkeri captured withdifferent types of gear and rotenone in varying depthsduring the period October 1974 to November 1975a
Length groups SL in mm
Rotenoneb Trapse 1.5 m net
3.0 m net
Seinenet
10.0 m net
Bottomset
38-52 68 1 3 1
53-68 161 35 3
69-83 56 36 2 3 14 27 2
84-98 19 480 16 20 48 50 2
99-114 11 35 1 71 3 1
115-129 3 9 11 142 12 1
130-144 6 9 4 175 21 7
145-159 1 54 7
160-175 1 21 3
176-190 11 1 1
191-205 1 1 2 3
206-220 1 1
221-235 1
Total 328 606 18 40 544 128 15
Mean length (mm)
67 91 89 102 128 108 117
^This shows a general increase in size with depth. Methods of capture have been arranged in such a way that depth increased from left to right.
Depth sampled: < 1.0 m.
cDepth sampled: 0.80 m.
University of Ghana http://ugspace.ug.edu.gh

65
Table 14. Length distribution of C. furcatus captured with differenttypes of gear and rotenone in varying depths during the period
October 1974 to November 1975a
Groups Rotenone Traps 1.5 m 3.0 m Seine Bottom setnet net net
53 - 68 1
6 9 - 8 3 6
8 4 - 9 8 2
99 - 114 3
115 - 129 1
130 - 144 2 3
145 - 159 1
160 - 175 2 6
176 - 190 2 2
191 - 205 3 14
206 — 220 3
221 - 235 2 2
236 - 250 1
251 - 266 1
Total 12 13 0 2 30
Mean length (mm) 85 185 228 186
General increase in size with depth is shown; methods of capture have been arranged in such a way that depth increased from left to right.
University of Ghana http://ugspace.ug.edu.gh

66
Table 15. Length frequency distribution of velifer (by months) during
the period April - December 1975a
Length group Month
(SL in mm) April May June July Aug. Sept. Oct. Nov. Dec.
30 - 49 _b 7
50 - 69 3 17 15
70 - 89 1 3 1 16 3 1 8
90 - 109 6 3 2 3 4 10 2
110 - 129 2 6 1 6
130 - 149 7 2 1
150 - 169 1 2170 - 189 2 1190 - 209 2
aRotenone captures at Ampem only.
^No sampling during May.
Table 16. Length frequency distribution of C.the period April - December 1975a~
auratus (by months) during
Length group Month
(SL in mm) April May June July Aug. Sept. Oct. Nov. Dec.
30 - 39 _b c2 1
40 - 49 2 71 2150 - 59 2 3 85 54 3260 - 69 4 2 32 25 4 2270 - 79 1 2 8 4 5 1480 - 89 1 6 2 7 190 - 99 1 4 2
100 - 109 1 1 3110 - 119 1 2120 - 129 1
aRotenone captures at Ampem only.
catch in April.
cNo sampling during May.
University of Ghana http://ugspace.ug.edu.gh

67
Table 17. Length frequency distribution of £. walkeri (by months) during
the period April - December 1975a
Length group
S.L. in mm
Months
April May June July Aug. Sept. Oct. Nov. Dec.
30 - 39 1 140 - 49 1 18 25 3
50 - 59 2 15 49 25
60 - 69 1 1 4 18 25
70 - 79 1 4 1 5 3 480 - 89 9 1 1 1 190 - 99 1 2 1
100 - 109 2 1110 - 119 3 2 2120 - 129130 - 139 1
Rotenone captures at Ampem only.
^No sampling during May.
Table 18. Length frequency distribution of C.the period April to December 1975*^
velifer (by months) during
Length group
S.L. in mm
Months
April May June July Aug. Sept. Oct. Nov. Dec.
30 - 49 -b
50 - 69 2 1 170 - 89 7 1 4 190 - 109 3 3 6 6 8 2 2110 - 129 5 10 13 17 32 10 16 9130 - 149 47 1 60 61 37 83 63 69 56150 - 169 12 3 35 38 10 35 31 38 43170 - 189 5 26 20 5 28 21 30 30190 - 209 1 1 12 12 3 11 8 7 15210 - 229 3 3 3 3 1 1230 - 249 1 2 1250 - 269 1
^Captures with seine net at Ampem only.
Random sample from 380 specimens collected during the month.
University of Ghana http://ugspace.ug.edu.gh

68
Table 19. Length frequency distribution of C . auratus (by months) during
the period April to December 1975a
Length group Month
S.L. in mm April May June July Aug. Sept. Oct. Nov. Dec.
30 - 3940 - 4950 - 59 1 260 - 69 1 2 1 2 1 1 1
70 - 79 1 1 2 2 4 4 8 2
80 - 89 4 2 14 1 2 1
90 - 99 4 1 2 6 1 4 1
100 - 109 3 2 4 2 12 3 2110 - 119 1 2 2 3 17 1 3 4120 - 129 3 3 4 2 18 2 3 13130 - 139 1 1 2 6 9 6 5 18140 - 149 1 1 1 1 3 3 7 5150 - 159 1 1 2 1
QCaptures with seine net at Ampem only.
not clear in all monthly collections of £. auratus owing to inadequate
sample sizes. C. velifer and C. walkeri for which larger samples were
collected, showed fixed modes at 140 and 125 mm, respectively.
While the mode may be fixed, proportion in the size groups may
change with time. This concept was tested with the 3 abundant middle
classes of £. velifer collections for the period, June to December 1975
(except August when the smallest sample size was collected) (Table 21).
With number in size group 170 - 189 assumed to be one, ratios for the
other size groups were calculated. The hypothesis that collections for
a month was significantly different from this ratio at 95% level of
probability was then tested. The results showed that there was no
University of Ghana http://ugspace.ug.edu.gh

69
Table 20. Length frequency distribution of C. walkeri (by months) during
the period April to December 1975^”
Length group Month
S.L. in mm April May June July Aug. Sept. Oct. Nov. Dec.
30 - 3940 - 4950 - 59 160 - 69 4 170 - 79 2 3 3 2
80 - 89 2 1 1 1 2
90 - 99 1 2 2 1 1100 - 109 4 6 6 3 2 2110 - 119 6 4 7 3 8 3 3 6
120 - 129 12 3 37 16 15 8 4 12 17
130 - 139 12 5 30 13 5 9 10 18
140 - 149 5 4 19 9 1 5 2 2 8150 - 159 3 10 2 1 3 1 4160 - 169 1 1 2 2 1 2 1 1 1170 - 179 1 5 1 1 2180 - 189 3 2 1190 - 199 1200 - 209 1 1210 - 219 1220 - 229
Captures with seine net at Ampem only.
significant deviation from the ratio for the 6 monthly collections. There
was no evidence of two or more modes which might suggest different year
classes or spawning periods.
If the above picture is a true reflection of the population status,
then the following conclusions may be drawn: 1) spawning had been con
tinuous throughout the year with no well-defined peaks; 2) the population
was in a steady state, that is, gains through growth, immigration, and re
cruitment were being balanced by losses through mortality and emigration
during the period.
University of Ghana http://ugspace.ug.edu.gh

70a
Table 21. Deviation of abundant size groups of C. velifer from calculatedaverage ratio for the period June to December 1975 (exceptAugust when the smallest number of specimens were collected)
Length group Month
S.L. in mm June July Aug. Sept. Oct. Nov, Dec. Totals
130 - 149 (a) 60 61 37 83 63 69 56 392
150 - 169 (b) 35 38 10 35 31 38 43 219
170 - 189 (c) 26 20 5 28 21 30 30 155
Calculated ratios tc
if length group (c) is > be 1
assumed Av.ratio
(a) 2.31 3.05 2.96 3.00 2.30 1.87 2.58
(b) 1.35 1.90 1.25 1.48 1.27 1.43 1.45
(c) 1 1 1 1
Expected values:
1 1 1
5.03
(a) 62.06 61.04 75.40 58.99 70.27 66.17
(b) 34.88 34.30 42.38 33.15 39.49 37.19
(c) 24.06 23.66 33.15 22.86 27.24 25.65
Calc. X2 0.227 0.960 2.850 0.563 0.359 3.209
Rejection region at 95% level of probability: X 2 = 5.99
University of Ghana http://ugspace.ug.edu.gh

70b
REPRODUCTIVE BIOLOGY
Maturity Stages
All data from the Ampem area relating to maturity of females have
been grouped according to species and sizes (Tables 22 - 24). Results
show that for all three species, stage 4 fish (spawning) were rarely
encountered on the sampling grounds. This may indicate that ripe fish
go to their breeding grounds for spawning at this stage, as indicated
later in this study. Likewise, spent fish did not return to the sampling
grounds until they were well advanced into the resting stage. At this
stage, the maturity state of the gonad was not easily differentiated
from that of an immature by gross examination. The highest proportion of
females with active gonads was found in stage 2 (developing) where 72, 46,
and 767o were recorded for C. auratus, C. walkeri, and C. velifer, re
spectively. The proportions diminished as higher stages of maturity
were attained.
If maturity is defined as having gonads enlarged and the eggs well-
formed (stage 3), the 70 - 79 mm group included the first mature females
in £. auratus and £. walkeri and the 100 - 119 mm in £. velifer. The re
sults would be about the same using stage 2 as the first indication of
maturity. The smallest spawning female was 72 mm in C. walkeri and 82 mm
in c. auratus (Table 25). These spawning fish were all collected in
bamboo traps on the breeding ground and were either ripe or spent.
All female C. auratus, almost all female C. velifer, and most female
University of Ghana http://ugspace.ug.edu.gh

71
Table 22. Maturity of female C. auratus by size groups showing the number of fish at various stages of maturity in each 1 cm length group for all females sexed during the period
December 1974 to November 1976
Length group N o . of Stage 7, with active
S.L. in mm fish 1 2 3 4 5 gonads
60 - 69 6 6 -
70 - 79 22 19 3 14
80 - 89 51 38 6 7 25
90 - 99 52 40 8 4 23
100 - 109 30 20 5 5 33
110 - 119 37 21 15 1 43
120 - 129 90 42 39 9 53
130 - 139 58 26 22 8 1 1 55
140 - 149 15 2 11 1 1 87
150 - 159 4 2 1 1 50
160 - 169 1 1 100
Totals 366 216 108 38 2 2
7o total 59 30 10 1 1
Total active gonad 150
7o active gonad 72 25 1 1
University of Ghana http://ugspace.ug.edu.gh

72
Table 23. Maturity of female C. velifer by size groups showing the number of fish at various stages of maturity in each 2 cm length group for all females sexed during the period
December 1974 to November 1976
Length group S.L. in mm
No. of1 2
Stage
3 4 5
7o with active gonads
40 - 59 1 160 - 79 5 580 - 99 39 38 1 3
100 - 119 61 55 4 2 10
120 - 139 290 207 72 7 2 2 29140 - 159 297 181 103 10 1 2 39160 - 179 198 85 94 17 1 1 57
180 - 199 125 27 71 24 3 78200 - 219 51 12 25 11 1 2 76220 - 239 27 4 14 6 1 2 85240 - 259 19 5 7 5 2 74260 - 279 21 3 11 6 1 86280 - 299 22 6 4 8 3 1 73300 - 319 4 2 1 1 100320 - 339 3 1 1 1 100
Totals 1163 629 408 98 10 18
7o 54 35 8 1 2
Total active gonad
7o active gonad
534
76 18 2 3
C. walkeri examined in the December 1974 to February 1975 period were
classed as stage 1. Otherwise no clear seasonal trend in maturity was
discernible from December 1974 to November 1976 (Figs. 8 - 10). The
December to February period the next year showed maturity stages not
different from the other periods of the year. After sampling with
electro-shocker in Kainji Lake from March to November 1971, Ita (1972)
University of Ghana http://ugspace.ug.edu.gh
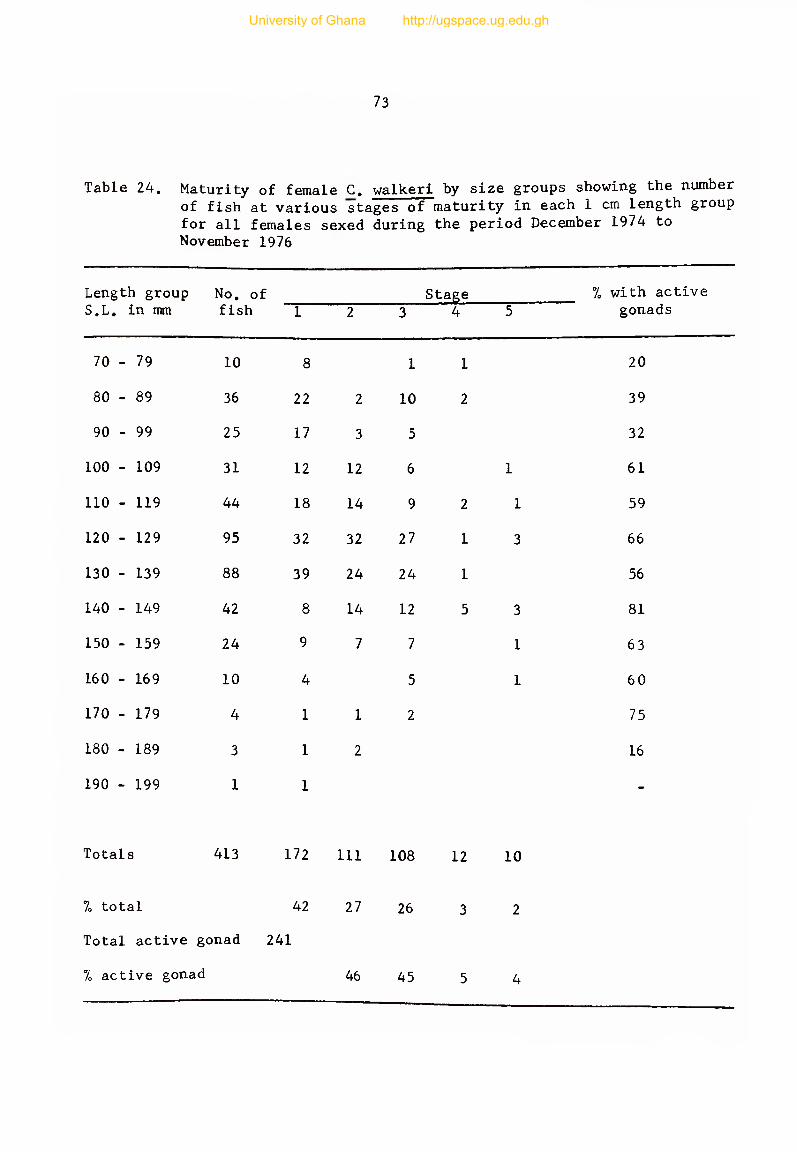
73
Table 24. Maturity of female C. walkeri by size groups showing the number of fish at various stages of maturity in each 1 cm length group for all females sexed during the period December 1974 to
November 1976
Length group S.L. in mm
No. of fish 1 2 3
Stage4 5
7o with active gonads
70 - 79 10 8 1 1 20
80 - 89 36 22 2 10 2 39
90 - 99 25 17 3 5 32
100 - 109 31 12 12 6 1 61
110 - 119 44 18 14 9 2 1 59
120 - 129 95 32 32 27 1 3 66
130 - 139 88 39 24 24 1 56
140 - 149 42 8 14 12 5 3 81
150 - 159 24 9 7 7 1 63
160 - 169 10 4 5 1 60
170 - 179 4 1 1 2 75
ioOOT—1 189 3 1 2 16
190 - 199 1 1 -
Total s 413 172 111 108 12 10
7o total 42 27 26 3 2
Total active gonad 241
7o active gonad 46 45 5 4
University of Ghana http://ugspace.ug.edu.gh

74
Table 25. Length distribution of spawning Chrysichthys captured on
breeding grounds
Size group
S . L . in mm
C. auratus c. walkeri
Numbers Male Female Male
NumbersFemale
70 - 79 1 - - 2
80 - 89 2 5 7 13
90 - 99 1 5 6 9
100 - 109 5 3 5 4
110 - 119 - 4 6 3
120 - 129 2 1 8 1
130 - 139 1 - 5 -
140 - 149 2 - 3 -
150 - 159 1 - 1 -
Totals 16 18 41 32
reported that Chrysichthys auratus bred throughout the year, with a peak
from September to November. This peak was evident in the large numbers
of fry collected during that period. Loiselle (1972) stated that he
observed auratus spawning in the main channels of coastal rivers
in the neighboring country of Togo, from mid-April to late May. His
University of Ghana http://ugspace.ug.edu.gh

60•H
University of G
hana http://ugspace.ug.edu.gh
Fi g . 8 . Seasona l distribution of gonad maturi ty s tages for female f . aur a tu s , Dec. 1974· Nov . 1976

76
LOr-*.Ch
>0 z :1•
4~>Q .CD
OO
LOCXIII E=
LO
CT)
cn3
<I
CUc
■"3
LO
CO
OJ
KOr - .ii E
LO
■3-
C O
C\J
LOp-.CTi
>>fOs:I
- CCJs-(O
LOr->CT>
jQCD
Li-I
r->cn
ocu
Q
oCMII
CMCMII
UDr - .cn
>0
z1
+ JQ -<D
OO
LOr ^cr>
4->to3cn
cI
CDC3
OLOII r 00
CM
00II ICO
CM
CO
CM
cn
> >fO's:i
- c<Js-rO
CMii
(r
LO
<3-
co
CM
LO
a >
JOxCD
oCD
Q
O
ii n CO
CM
OO
O00
oUD
O«!fr
oCM O
LOO o
CM
GONAD
MATURITY
STAGES
University of Ghana http://ugspace.ug.edu.gh

University of Ghana http://ugspace.ug.edu.gh
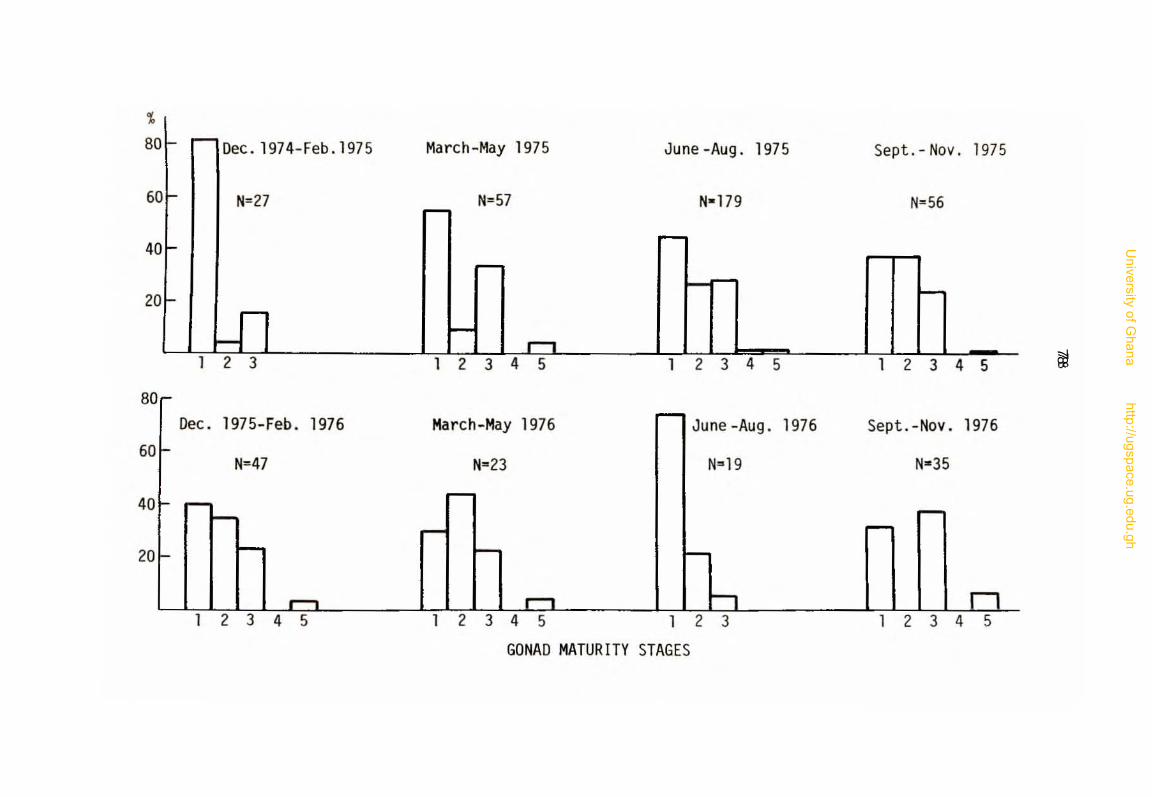
78
University of G
hana http://ugspace.ug.edu.gh
" 80
6 0
4 0
20 l
80
60
40
20
Dec. 1974-Feb. 1975
N=27
1 2 3
Dec. 1975-Feb . 1976
N=47
,......, 1 2 3 4 5
March-May 1975 June -Aug . 197 5
N=57 N- 179
r-
r-"I
1 2 3 4 5 1 2 3 4 5
March-May 1976 June -Aug. 1976
N-23 N-19
..., 1 2 3 4 5 1 23
GONAO MATUR1TY STAGES
Sept.-Nov. 1975
N-56
1 2 345
Sept.-Nov . 1976
N-35
n 1 2 3 4 5
~
co

vOON
>0
z1
< rr -O '
oQ)Q
J-4 Q) U-i •rl ?—< 0) >
o|Q)
r-4(d§
4-1
OM-l
CO<Ut>0CO
4 -JCO
4-J*rH
4->Ctf6T3
Ctf
COtxO
GO
• H4 -)3rQ• Hu4->CO
• HT3
CddoCOctfcu
CO
60♦ H
University of Ghana http://ugspace.ug.edu.gh

De
c. 1974-Feb.1975
March-May
1975
June
-Aug.
1975
Sept
.-Nov.
1975
80
oocr>ooH
D
LO
oo
CM
•5coCMII E
[0000II 5
II
LO
00
CM
CM
o o00
oV£>
o oCM
LO
CD
>oz:
t•
4->C L<D
OO
o
LO
oo
C\J
LO
CTi
cn
(a>c13*“3
C\JOJII
CJj
LO LO
cn
ro
00>*>1 1 , 1
OO
CMi
JCo 1
CM
- IIr—
LO
00
CM
LOr*cr»
. a<u
Ll.I•<3-cn
o<D
O
CM00
ELO
•53*
OO
CM
O<X>
o oCM
GONAD
MATURITY
STAGES
University of Ghana http://ugspace.ug.edu.gh

observations apparently, did not extend beyond this period. Blache (1964,
as cited in Loiselle, 1972) stated that this species commences spawning
at the beginning of the flood season in June and July in Lake Chad.
In Lekki Lagoon, Nigeria, Ikusemiju (1976) reported the collection of
ripe ova and juvenile C. walkeri during most months of the year. How
ever, most ripe fish were captured in March. In Kainji Lake, Ajayi
(1972) similarly collected ripe C. auratus more or less throughout the
year with a peak in June to October (rainy season). These studies suggest
that though spawning may be year round, activities may peak during certain
period(s) of the year. Results of the present study in Volta, however,
showed no marked peaking.
Many previous investigators in temperate climes (June, 1953; 1971;
Bodola, 1966; Otsu and Uchida, 1959) have reported that it is difficult,
if not impossible, to categorize variations in the maturity stages of
males of some species, mainly because of the extended period of running-
ripe stage. In the tropics, Hopson (1972) made a similar observation on
Lates niloticus. In the present study, the differentiation between im
mature and mature can be regarded as satisfactorily accurate but further
designation can only give a rough guide since the distinction between the
stages was not clear-cut.
Males first became mature (stage 2) at size 70 mm in C. auratus
and C. walkeri, and 100 mm in C. velifer (Tables 26 - 28). These were
the same sizes as found in the female. In Lake Chad, Blache (1964, as cited
in Loiselle, 1972) observed a spawning male C. auratus which measured
81
University of Ghana http://ugspace.ug.edu.gh

82
Table 26. Changes in the maturity of male _C. auratus with size, showing the number of fish at various stages of maturity in each 1 cm length group for all males sexed during the period September
1975 to August 1976
Size
S.L.
group
in mm
Number Stage
1 2 3 4 5
50 - 59 1 160 - 69 10 1070 - 79 11 9 280 - 89 28 27 190 - 99 11 10 1
100 - 109 14 10 4110 - 119 21 9 7 3 2120 - 129 35 10 23 2130 - 139 26 14 8 3 1140 - 149 5 4 1150 - 159 3 3
Totals 165 100 50 12 1 2
Table 27. Changes in the maturity of male C. walkeri with size showing the number of fish at various stages of maturity in each 1 cm length group for all males sexed during the period September 1975 to August 1976
Size group Number StageS.L. in mm 1 2 3 4 5
50 - 59 1 160 - 69 2 270 - 79 5 4 180 - 89 3 2 190 - 99 4 4
100 - 109 3 2 1110 - 119 6 2120 - 129 37 23 7 7130 - 139 42 18 13 9 1 1140 - 149 14 3 8 3150 - 159 5 1 1 3160 - 169 6 3 2 1170 - 179 1 1180 - 189 1 1
Totals 130 61 39 23 6 1
University of Ghana http://ugspace.ug.edu.gh
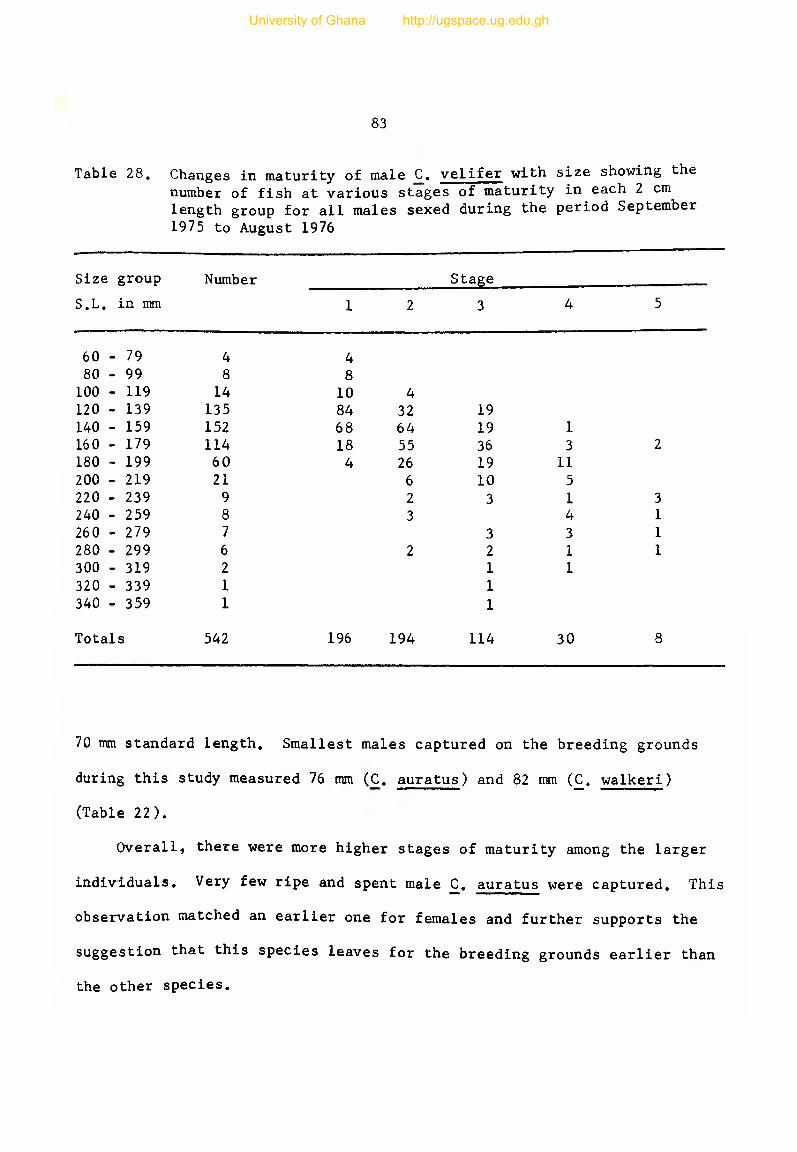
83
Table 28. Changes in maturity of male C . velifer with size showing the number of fish at various stages of maturity in each 2 cm length group for all males sexed during the period September
1975 to August 1976
Size group Number Stage
S.L. in mm 1 2 3 4 5
60 - 79 4 480 - 99 8 8
100 - 119 14 10 4120 - 139 135 84 32 19140 - 159 152 68 64 19 1160 - 179 114 18 55 36 3 2180 - 199 60 4 26 19 11200 - 219 21 6 10 5220 - 239 9 2 3 1 3240 - 259 8 3 4 1260 - 279 7 3 3 1280 - 299 6 2 2 1 1300 - 319 2 1 1320 - 339 1 1340 - 359 1 1
Totals 542 196 194 114 30 8
70 mm standard length. Smallest males <captured on the breeding grounds
during this study measured 76 mm (C. auratus) and 82 mm (£. walkeri)
(Table 22).
Overall, there were more higher stages of maturity among the larger
individuals. Very few ripe and spent male £. auratus were captured. This
observation matched an earlier one for females and further supports the
suggestion that this species leaves for the breeding grounds earlier than
the other species.
University of Ghana http://ugspace.ug.edu.gh

84
Sex Ratios
Tables 29 and 30 show changes in sex ratio with length of C . auratus,
C. walkeri, and C. velifer for the periods September to November 1975
and December 1975 to February 1976. The former was a rainy season and
the latter, a dry season. In parentheses are calculated chi-square for
those groups whose total number exceeded 20.
In all three species, the females outnumbered the males in both the
wet and dry season samples, but the ratios differed from the hypothetical
1 : 1 ratio only for £. velifer in the rainy season (P < 0.001).
The number of females to males were:
C. auratus C. walkeri £. velifer
rainy season 1.11 1.14 1.28
dry season 1.26 1.11 1.12
There did not seem to be sexual difference in death or growth rates
except for the fact that the 3 largest C, walkeri were all females
(Table 29). The largest C. auratus was a male, however. More data
should be collected to determine whether there is a difference in maximum
size reached. In the dry season (Table 30), the 3 largest C. velifer were
females but there were no differences between maximum sizes of the sexes
in C. auratus and C. walkeri,
Ajayi (1972) found 1,31 and 1,35 as female/male sex ratios for C,
auratus and C. nigrodigitatus respectively, in Kainji Lake. The ratio was
as large as 4:1 in favor of females in C. furcatus. He, however, did not
disclose the size of his samples nor period of collection.
University of Ghana http://ugspace.ug.edu.gh
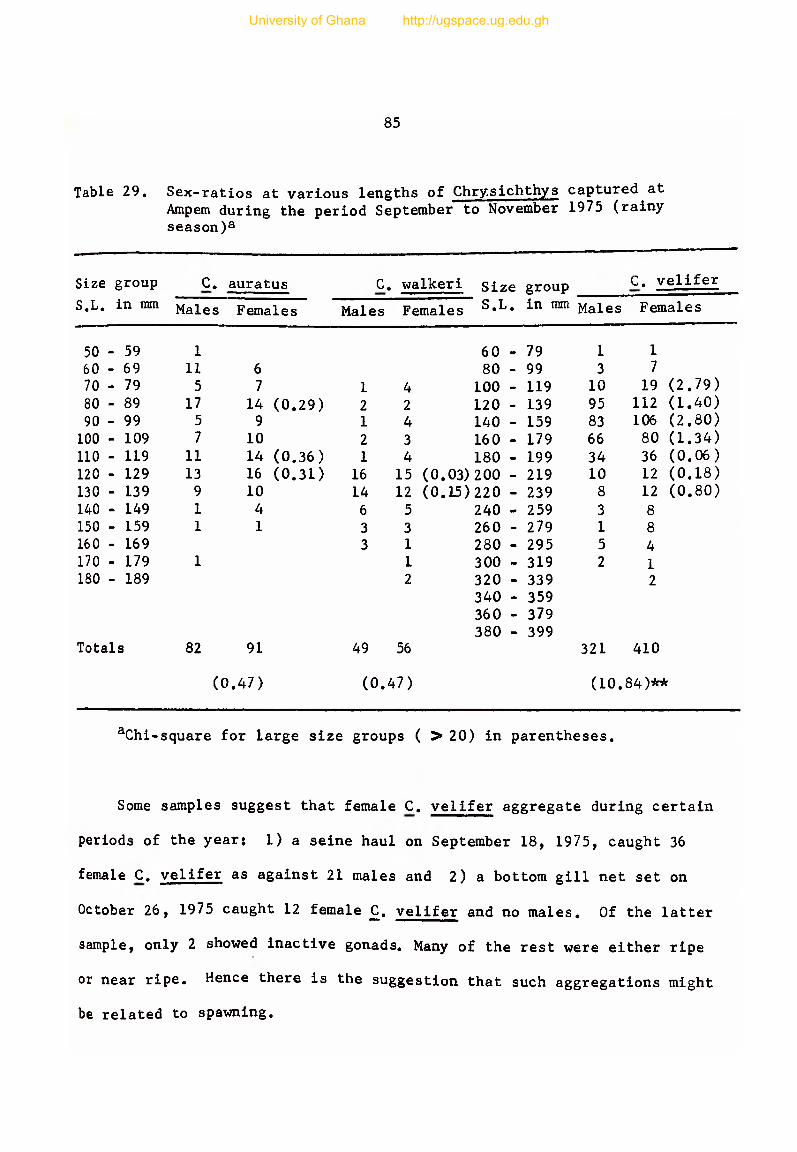
85
Table 29, Sex-ratios at various lengths of Chry.sichthys captured at Ampem during the period September to November 1975 (rainy season)a
Size group C. <auratus C . walkeri Size group C. velifer
S,L, in mm Males Females Males Females S.L. in ram Males Females
50 - 59 1 60 - 79 1 1
60 - 69 11 6 80 - 99 3 7
70 - 79 5 7 1 4 100 - 119 10 19 (2.79)
80 - 89 17 14 (0.29) 2 2 120 - 139 95 112 (1.40)
90 - 99 5 9 1 4 140 - 159 83 106 (2.80)
100 - 109 7 10 2 3 160 - 179 66 80 (1.34)
110 - 119 11 14 (0,36) 1 4 180 - 199 34 36 ( 0 , 06)
120 - 129 13 16 (0,31) 16 15 (0.03)200 - 219 10 12 (0,18)130 - 139 9 10 14 12 (0.15)220 - 239 8 12 (0,80)
140 - 149 1 4 6 5 240 - 259 3 8150 - 159 1 1 3 3 260 - 279 1 8160 - 169 3 1 280 - 295 5 4170 - 179 1 1 300 - 319 2 1180 - 189 2 320 - 339 2
340 - 359360 - 379380 - 399
Totals 82 91 49 56 321 410
(0.47) (0.47) (10.84)**
aChi~square for large size groups ( > 20) in parentheses.
Some samples suggest that female C. velifer aggregate during certain
periods of the year; 1) a seine haul on September 18, 1975, caught 36
female C. velifer as against 21 males and 2) a bottom gill net set on
October 26, 1975 caught 12 female £, velifer and no males. Of the latter
sample, only 2 showed inactive gonads. Many of the rest were either ripe
or near ripe. Hence there is the suggestion that such aggregations might
be related to spawning.
University of Ghana http://ugspace.ug.edu.gh

86
Table 30. Sex-ratios at various lengths of Chrysichthys captured at Ampem during the period December 1975 - February 1976 (dry season)a
Size group C. auratus C. walkeri Size group C. velifer
S.L. m mm Males Females Males Females S.L. in mm Males Females
50 - 59 1 60 - 7960 - 69 1 80 - 99 4 1
70 - 79 5 3 100 - 119 4 480 - 89 1 4 2 1 120 - 139 39 45 (0.43)90 - 99 3 5 1 140 - 159 55 60 (0.22)100 - 109 6 4 5 160 - 179 30 40 (1.43)110 - 119 5 9 2 9 180 - 199 21 20 (0.02)120 - 129 14 23 (2.19) 17 9 (2.46) 200 - 219 5 4130 - 139 18 20 (0.11) 13 13 (0.00) 220 - 239 1 5140 - 149 2 3 4 5 240 - 259 4 2150 - 159 1 1 1 4 260 - 279 4 1160 - 169 3 1 280 - 299 2170 - 179 2 2 300 - 319 1180 - 189 320 - 339
340 - 35936 0 - 379380 - 399 2
51 72 44 49 16 7 187
(1 .74) (0.27) (1. 13)
Chi-square for large size groups ( > 20) in parentheses.
Size of Ovaries and Eggs
Ajayi (1972) reported that the left ovary of Chrysichthys in Kainji
Lake was slightly longer and heavier than the right. At Volta Lake
this difference was also observed in 4 specimens of C. walkeri and in 3 of
5 C. auratus (Table 31). The other two auratus had ovaries of equal
size but they were small suggesting possible further development which
might result in size differences. Mean increase in volume and weight after
University of Ghana http://ugspace.ug.edu.gh

87
Table 31. Comparison of size of left and right ovaries C. auratus
in C. walkeri and
Ovary (vol . in cc) Left-right ratio Fish length
Left Right S.L. in mm
2.0 1.7C. walkeri
1.18 102
3.5 3.0 1.17 170
1.0 0.5 2.00 95
2.8 1.2 2.33
C, auratus
2.0 1.7 1.18 102
1.5 1.5 1.00 105
2.0 1.0 2.00 105
3.0 2.0 1.50 99
0.5 0.5 1.00 89
preservation of a sample of 10 ovaries were found to be 2.07o and 3.87o re
spectively. These measurements were made of ovaries preserved in Bouin's
solutions reported under Methods.
Analysis of variance test as applied to diameters of 3 samples of 10
eggs each from the top, middle and bottom, from the left and then right
ovaries of one specimen of _C. walkeri gave non-significant F-ratios of
0.80 and 1.48 (with 2 and 27 d.f.; p >0.05), Similar tests for an ovary
each from C. furcatus and C. velifer also gave non-significant values of
2.78 and 2.48 respectively. Thus the eggs were about the same size in
University of Ghana http://ugspace.ug.edu.gh

88
various parts of the ovary. Another test showed no significant differ
ence between the size of the eggs in two ovaries from the same individual.
Such observations are in agreement with the behavior whereby all eggs are
shed within a short time; that is, Chrysichthys spp. are non-fractional
spawners.
Calculated mean diameter of the eggs were: C.. velifer, 1,66 ^ 0,02 mm;
C. auratus, 1.72 i 0,05 mm; C, walkeri, 1,71 + 0,02 mm; C, furcatus,
1,69 t 0,01 mm. Thus the smaller species (C, auratus and C, walkeri)
appeared to have larger eggs than the larger species (C. velifer and C.
furcatus) although this difference was not statistically significant
(P>0,05). It is noteworthy that samples involved in the comparison were
captured on the sampling grounds but not on the breeding grounds. The
observation that C, auratus leaves the sampling grounds earlier than the
rest, however, makes it doubtful that the same maturity stages were involved
in the comparison. Almost all the eggs involved in the calculation were
ripe but not in running condition. The mean diameter of eggs of 5 ripe and
running specimens of C. auratus captured on the breeding grounds, was 2,24
mm indicating an increase of 30,2% over and above the mean size of eggs
of individuals caught at Ampem which were classified as ripe. The mean
size of the eggs of one specimen C. walkeri which was in ripe and running
condition was 2,45 mm. Ikusemiju (1976 ) reported egg size range of 2,0 -
2,5 mm for C. auratus in Lekki Lagoon, while Imevbore (1970, as cited in
Ikusemiju, 1976 ) recorded 3.23 and 2,61 mm for C. nigrodigitatus and C.
auratus longifilis, respectively, in River Niger,
University of Ghana http://ugspace.ug.edu.gh

89
Fecundity
Bagenal (1966) suggested that the usual definition of fecundity as
"the number of ripening eggs found in the female just prior to spawning1’,
should apply to temperate regions. He thought the definition presupposes
that there is a definite spawning season. This, however, is not the case
in many tropical regions, Lowe (1955, as cited in Bagenal, 1966) defined
fecundity as ,?the number of young produced during the life time of an in
dividual ". Bagenal considered that a more satisfactory definition suitable
for both temperate and tropical species could be "the number of eggs laid
during the average lifetime of an individual". In the present study
since it was not possible to determine the number of times Chrysichthys
spawned in a year, much less a lifetime, fecundity was simply assumed
to be the number of eggs in a ripening ovary.
Ranges of individual fecundity estimates for the 4 species were as
in Table 32. Within each species, fecundity varied among females but
generally increased with size. For 21 specimens of C. walkeri (TL range:
133 - 245 mm) in Lekki Lagoon, Ikusemiju (1976) recorded fecundities of
896 to 4,168 eggs.
Least squares estimates of fecundity (F) in relation to body length
(SL) and weight (W) were calculated for C. velifer and C. walkeri and to
length alone for C. auratus (Figs, 11 - 13; Tables A-5 - A-8). The best
fit on length of C . walkeri was:
log F = -1,905 4-2.36 log SL, or in exponential form
F => -0.0124 ( S L )2 *36.
University of Ghana http://ugspace.ug.edu.gh

90
Table 32. Fecundity of Chrysichthys spp in Volta Lake during the period 1974 to 1977 (Detailed data in Tables A-5 - A-8)
Species No. of specimens
Range of no. of eggs
Size range S.L. in mm
Weight(bm)
C. auratus 9 218 - 914 78 - 112a
C. walkeri 26 270 - 2690 79 - 170 12 - 95
C. velifer 23 1263 - 10,656 132 - 347 50 - 730
C. furcatus 4 599 - 15,938 160 - 335 110 - 565
a0nly 2 out of 9 specimens were weighed*
The calculated coefficient of determination (r ) which measured the
goodness of fit of the regression line was 0.65. A similar calculation
for a rectilinear equation was 0.56. Hence the former relationship pro
vided the better fit. In £. velifer, however, a similar comparison (0.68
for rectilinearity and 0.57 for curvilinearity) favored rectilinearity.
The rectilinear relationship was defined by the equation: F = 4295 +
40.95 (SL). For C. auratus, the curvilinear relationship was F =-3.98 +
3,312 log (SL). Only a small amount of data were available for C, furcatus
(Fig. 14).
In many species, the relationship between length and number of eggs
in the ovary is curvilinear (Bagenal 1966, Martinez and Houde, 1975). The
rectilinear relationship in C. velifer might be due to: 1) the large
variation in egg number for a given length and 2) insufficient data for
University of Ghana http://ugspace.ug.edu.gh

University of Ghana http://ugspace.ug.edu.gh
~ -
• u l
•
"" '" to.
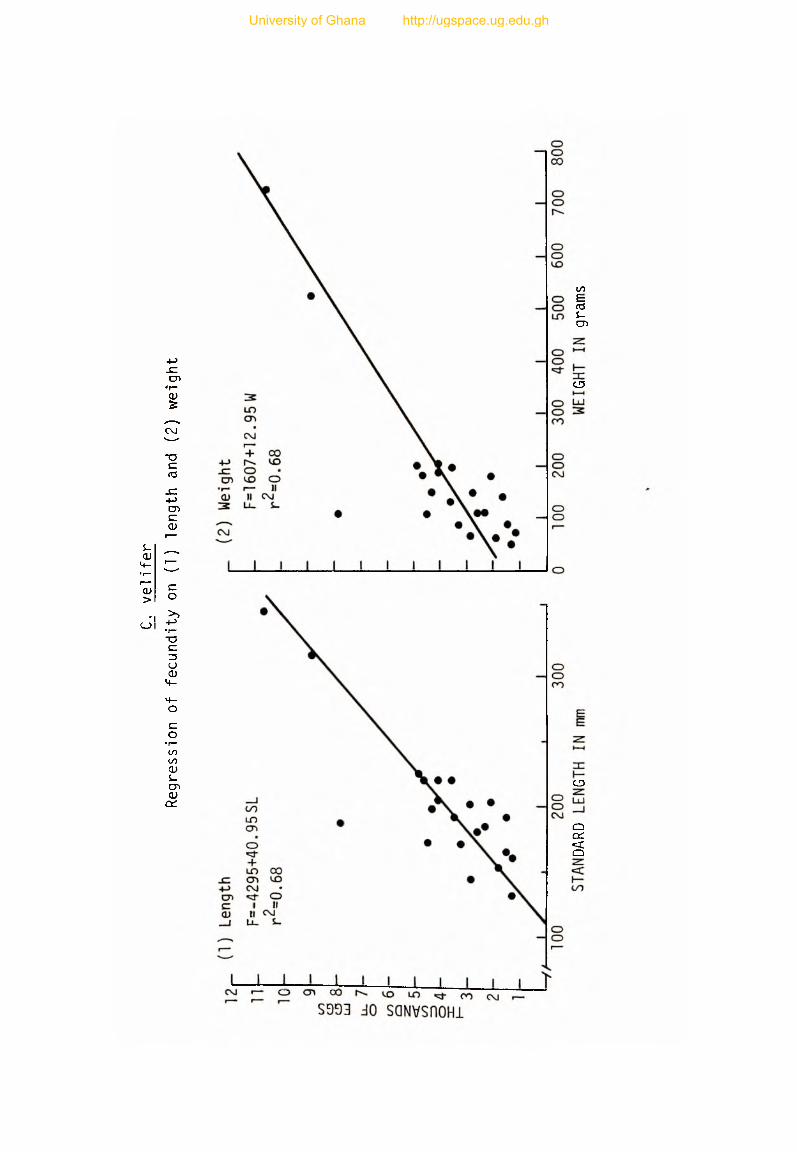
C_, velifer
Regression
of
fecundity
on
(1)
length
and
(2)
weight
tOE=rOi-CJ)
CD
O
Qq:CQ
University of Ghana http://ugspace.ug.edu.gh

University of G
hana http://ugspace.ug.edu.gh
Fig. 12. c. walkeri - Regre ss ion of fecundity on 1) length and 2 ) wei ght

C_. wal keri
Regression
of
fecundity
on
(1)
length
and
(2)
weight
+->u>cCD
CMi-
O -n 00
O
ooC\J C\J
o(X I
O«3-
ooo
oo
o00
o
CNJ co
S993 dO SQ3yQNnH
STANDARD
LENGTH
IN mm
WEIGHT
IN grams
University of Ghana http://ugspace.ug.edu.gh

Fig. 13. C. auratus - Regression of fecundity on length
University of Ghana http://ugspace.ug.edu.gh

HUNDREDS
OF
EGG
S
C. auratus
Regression of fecundity on length
STANDARD LENGTH IN mm
University of Ghana http://ugspace.ug.edu.gh

University of Ghana http://ugspace.ug.edu.gh
· (.) 1
OIl -""
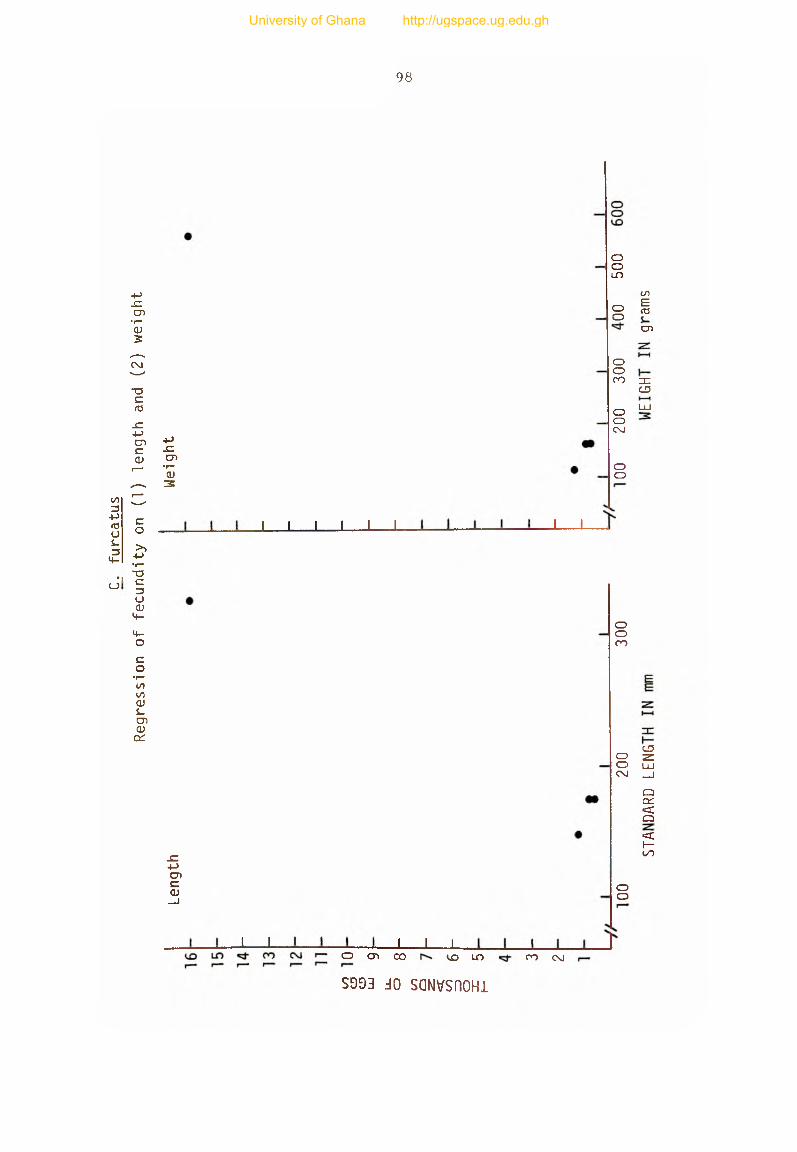
C_.
furcatus
Regression
of
fecundity
on
(1)
length
and
(2)
weight
Length
I Weight
98
OOLT>
Oo
COE<oCD
o200 zn
CD
ooCM
oo
LU
l 1 I I 1 L J L
J L J I L
ooCO
ooC\J
CDzLU— I
QCH<Q< I—oo
oo
o cn co u d in r o cm
S993 J O S QNVSnOHl
University of Ghana http://ugspace.ug.edu.gh

99
large fish. Ikusemiju (1976), however, defined the relationship between
total length and fecundity for C. walkeri with the rectilinear equation:
F = -197.97 + 243.5(TL) where TL = total length in cm.
In both species, rectilinear equations provided the best fit for
2fecundity and weight data: £. walkeri: F = -126.18 + 27.63 W, r =
0.72; C. velifer: F = 1607 + 12.95 W, r2 = 0.68.
Preferred Spawning Site
Between 30 and 40 bamboo traps to catch spawning Chrysichtys were set
near A m p e m , f o r periods of 2 - 5 days in June and July 1977 but they
caught nothing. During the same period the bamboo traps were set in Ajena
Bay and spawning fish were taken. Ajena Bay is located in the Gorge area
adjacent to the damsite and enclosed by high hills. The waters were al
most always calm. The substrate in the set area was of silty sand and
emerged aquatics were sparse. Compared with other inshore areas of the
lake, the bottom was sharper sloping. The traps were set in waters rang
ing in depth between 1 and 2 m. It was noteworthy that only those com
partments in the middle of the traps caught any Chrysichthys. These com
partments had darker interiors than those at the open ends. The asbestos-
pipe traps with wider diameters, set together with bamboo traps caught
no fish. The eggs were embedded in, and firmly cemented to the substrate
by a gelatinous matrix. It took several hard knocks on rocks to dislodge
the spongy mass from the interior of the compartment.
No fish were taken until the traps had been in the water at least 7
days. Thus the failure at Ampem may have been due to the shorter periods
University of Ghana http://ugspace.ug.edu.gh

100
that the traps were set. The larger size of the eggs in specimens taken
at Ajena than Ampem and the lack of spawning fish at Ampem suggest that
the traps may not have been successful even if left for longer periods.
From the above, the following general picture of the preferred
spawning site of £. auratus and C. walkeri emerges: 1) calm shallow
waters; 2) darkened interior of a hole or a crevice; and 3) a firm
substrate for the deposition of eggs. These characteristics of the spawn
ing site closely tallied with those described by interviewed fishermen.
They added that the entrance to the nest is always directed away from the
wind. This fact could not be ascertained in the calm waters of the Ajena
Bay. It may, however, be the case in unsheltered areas.
C. velifer and C. furcatus were not collected in the area. Thus
their preferred spawning site might be different from those of C. auratus
and C. walkeri.
The electric catfish, Malapterurus electricus was the only other fish
species caught in a few of the chambers. The size of the entrance limited
specimens of this species to juveniles. M. electricus is known to possess
a remarkable capacity for discharging high electric voltage which either
dispels or stuns other fish which they then use as food. The size range
captured, however, could only have dispelled Chrysichthys spawners. Their
comparative scarcity in the ichthyofauna probably makes their competition
with Chrysichthys for space relatively insignificant.
University of Ghana http://ugspace.ug.edu.gh

101
Spawning Behavior and Spawning
The fact that ripe male and female Chrysichthys started entering the
traps after a 7-day period, tends to suggest that it takes time before the
traps are accepted as part of the environment. Occasionally, only a single
male or female was found in a compartment. Although efforts were made
to ensure that no fish escaped during recovery of the traps, there was no
way of determining if 100% success was achieved. Hence it could not be
said with certainty that a female or male was the first to enter the spawn
ing chamber. However, in all cases that eggs or larvae were found in a
chamber, both male and female were present. Micha and Frank (1975) re
ported that both male and female care for the eggs. As earlier mentioned
(page 4 2), at this time, the male's head is at the peak of its enlargement
and the lower jaw deeply pouched. This gives the impression that the male
might collect and incubate the eggs in the mouth as Sarotherodon species
do. No evidence of this behavior was, however, observed.
Of 43 mating pairs collected with the traps, 42 showed the male bigger
than the female. In the exceptional case, the female was only 5% longer
than the male. For the rest, the size difference ranged from 0 to 75?0.
The smallest specimen captured in bamboo traps was a male (SL,
76 mm) and it was without a partner. Thus it would appear that the
observed characteristic whereby the male of a mating pair was bigger
than the female might be an important requirement for successful mating
and consequent spawning. If females actually reach a larger maximum size
than males (Tables 29 and 30), they may have difficulty finding mates.
University of Ghana http://ugspace.ug.edu.gh
102
Habitat Preference of the Juveniles
Two juveniles of either C. auratus or £. walkeri which might be
about 3 weeks old and measured 13 and 15 mm (TL), were found sheltered in
the asbestos-pipe traps set in 3.5 m deep water. This discovery was
significant, in that throughout Loiselle's (1972) sampling survey of
inshore habitats and the present study, no specimen smaller than 20 mm was
captured. There is thus the suggestion that after the larval stage, the
juveniles migrate into deeper water where they hide in the shelter of sub
merged vegetation until they reach a certain size (about 20 mm: the
lower size range collected with rotenone) and then return once more into
shallow waters.
University of Ghana http://ugspace.ug.edu.gh

103
WEIGHT-LENGTH RELATIONSHIP
Weight-length relationship computed from linear least squares re
gressions of log weight on log length (i.e., log W = log a + b log SL)
(Table 31) for fish collected during the period 1974 to 1977 showed no
significant difference in either slope (b) or intercept (log a) ( P > 0 . 0 5 )
between male and female fish. (It was significant in £. walkeri in the
first calculation. Closer inspection of plots of the data for £. walkeri,
however, revealed the inclusion of an outlier which was obviously the
result of human error. It was for a female fish which measured 30 mm and
weighed 10 grams, thus making the calculated K, 37.04. Exclusion of this
one point and recalculation, resulted in no significant difference between
the two equations.) Weights, predicted for fish, in the mid-point of an
abundant size class (130 mm for C. auratus and C. walkeri and 210 mm for C.
velifer and C. furcatus) with the calculated equations, showed males
slightly heavier than females in 3 of the 4 species. The difference was
smallest in C. walkeri which showed females heavier than males. Since
these differences were not statistically significant, the data for
each species were pooled for the calculation of weight-length relation
ships. The regression slopes were significantly less than 3 (P<0.05)
for 3 species, but not for C . walkeri. Thus overall, it may be con
cluded that smaller individuals in the Chrysichthys population in
Volta Lake were plumper than the longer members. Since the population
University of Ghana http://ugspace.ug.edu.gh

104
structure was more or less constant during this period, it may further be
concluded that as Chrysichthys grow older in Volta Lake they become poorer
in condition.
This change in shape with growth is similar to that described for the
smaller species of catfish (Fam. Ictaluriidae) in North America by Carlander
(1969). The cause was ascribed to stunting in overcrowded populations with
the larger fish in poorer condition. As earlier shown in this study, and
in the survey of inshore fish fauna by Loiselle (1972), the ichthyomass of
Chrysichthys in inshore shallows was higher than that of any other species.
This, and the fact that individuals of the genus in Volta Lake are smaller
in size than individuals recorded for some water bodies in West Africa
(Ajayi, 1972; Ikusemiju, 1976; Chauvet, 1973), indicate that members of
the Volta populations may be stunted and overcrowded. Stunting is often
associated with overpopulation (dense populations in relation to carrying
capacity).
Although Ricker (1973; 1975) has shown that the geometric mean re
gression is preferable, predictive regressions have been used in the above
discussion because most comparable studies have used the predictive re
gression. The slope (v) of each geometric mean regression is computed by
dividing the slope (b) by the correlation coefficient, (r) (Table 31).
The slope for £. velifer, which significantly differed from 3.0 when cal
culated with b value, was no longer significantly different from 3.0
(Table 33). Hence with the geometric mean regression equation, C. walkeri
and C. velifer had slopes which were not significantly different from 3.0
University of Ghana http://ugspace.ug.edu.gh

105
while C. auratus and C. furcatus had slopes which were significantly less
than 3 • 0
When the data were further broken down into quarters (Table 34),
it. was observed that slopes were lowest in March to May for 3 species with
the C. velifer slope being somewhat lower in June to August. The lack of
clear-cut pattern may have resulted from combining data for several years
but the data were not sufficient to consider each year separately. Lower
slopes in some cases are associated with the post-spawning period when
the larger fish are below normal weight because of loss of reproductive
products, but the Chrysichthys of Volta Lake do not appear to have a well-
defined spawning season.
Condition Factor
Another measure of the weight-length relationship is the coefficient
of condition, K, where
W x 105
K = L3
The coefficient of condition is an index of the weight-length rela
tionship of the individual fish rather than of the population. Frequently,
however, mean Ks are used in comparing populations, a practice which may
lead to false conclusions if the slope of weight-length regression differs
from 3.0.
Le Cren (1951) pointed out that the coefficient of condition will
vary with length itself according to the expression K = Ln "3 . Consequently,
University of Ghana http://ugspace.ug.edu.gh
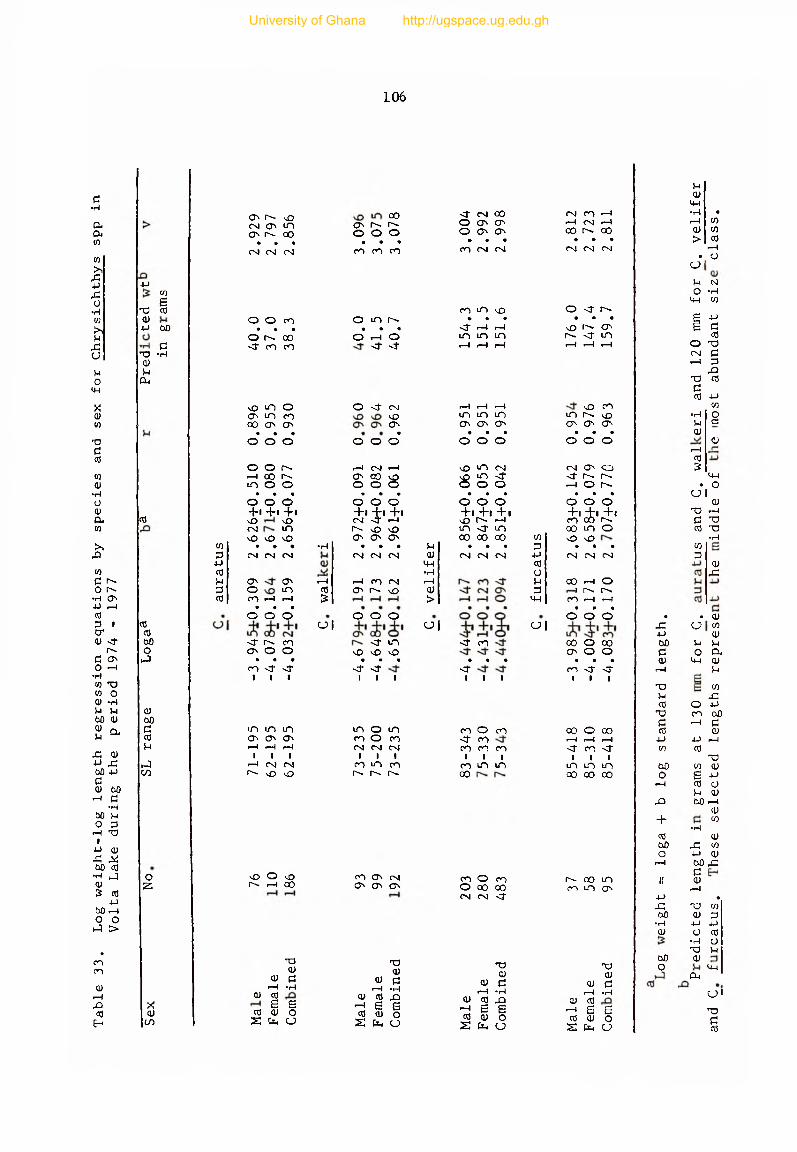
Tabl
e 33
. Lo
g w
eigh
t-lo
g le
ngth
re
gres
sion
eq
uat
ion
s by
spec
ies
and
sex
for
Ch
rysi
chth
ys
spp
in
Vol
ta
Lake
du
ring
th
e p
erio
d 19
74
- 19
77106
4->COB
rU cd<U
4->
X)<dufa
txO
d•H
cd
COcdb0OhJ
<u&0dcdnJco
o:z
XQJ
CO
coo4-Jc0Uacd
on r-. \o eg on m o n o . oo
• • • O J 0 4 O l
O O co • • •
O r~- oO < f ro CO
vo m o O n m c o00 On O' • • •
o o o
O O On r—I 00 r-to O O • • •
o o o +1 +1 +1nO
o i'sOm
vO vO yQ • • •
N i n C N
On ONO LOC O t - H i— 1
t • •o o o
vO O VsO r s r 4 00
X )a)cu c
r—I * Ha ; 03
S £ cd Q) o S fa O
•H
rHCO5
o|
O n r - >O O • •
co co co
o m r-» • • •
0 ^ 0<r <t
o <r
o o
r4 N HON CO Vpo o o
t • to o o +11* +«04 -T —I N vO ^ On On On
• • •N N N
r - ( C O 0 4O' rs. vo
o o o
o o < r 04 00 04 C O r—1o * o ONON r—1 04 f—4
O o ONON 00 O n o o• • • • • • •
CO C O O J 0 4 0 4 0 4 O J
C O in v O o <rO n• • • • • •
< r r H i— 1 v O O n O 'm m m O * < r inr - l r - l r H r - < r—1 r—1
O J r - l I— 1 r —4v O i n m mO N O N O N O N
• • • •o o o o
ua)m•H
rH<U>
o|
v O ‘ O O Jv> m <t© o o
• • •o o o+1 +1 +1vO O'* i—4in 'd* moo oo oo
• • •0 4 O J 0 4
co3
4 JcdoudU-4
o|< f O n c o < r m < 1 - COON o o vD v O \D• • • • • • • • •CO < r <r <r<r <r1 i i i i i i i i
C O O n C NOn O' On
X)<Ua) af-H *Ha> cd ,jd
^ G Scd <u oX fa u
X )a>
<u drH -H
( !) CO J D ^ £ 6 cd qj o S fa u
v O C O in n ^ O' O' O'
• f to o o
0 4 O ' Q < J * O n O n «—I O On
• • « o o o+1+1 +1C O 0 0 no o m ovO so
• • •O J O J C N
00 r - i Oi On i—
C O r H r—I • * •
o o o
00 O 00 O' o o
• • •co <r <j-i i i
m m m m o m C O o C O o o O o oO N O N O n c o o c o < r C O r —4 r H r —4.—I r - l r H O J O J O J c o C O C O < r C O < r
i 1 1 1 1 i i 1 1 i 1 ir H O J O J C O i n C O C O m m m m mO - v O v O O n O n O n 0 0 o o o o o o
C O O C O On o o mo 0 0 0 0 C O m O NO J O J < r
V
T3a)d
i—4 •H(Ucd
r H B Bcd 0) oS fa u
ua>
<4-1H ••—1 CO
<L) co> cd
r -H• a
C J I
i-4 No •H
<4-4 CO
£ +■> e ccd0 X01 drH 3
rOx) co dCd 4->
CO•H O U Ca) a>
r—Icd 5 MH• o
o|CD
X J r—Id X cd x*HCO 3 <u
£
• • Q>s : C J CO4 -) <uO J) }-i }-ld o Cl,cu M-l Q>
r—1 UX COu £
cd O 4 JX ) C O OO
a r—1 dcd <D
4-> 4-> 1— 1CO cd
XGO CO <Do e 4->
r—\ cd o}-i 0 )
r O 0 0 r H<u
- h co• f l
cd <ud O rC, coO 4 -J cu
r - l 0 0 r Cc
II Q)r H
4-> •r C X ) CO
GO a ) 3•» H 4-> 4 J
a> o cd* H oX ) }-l
o o cuo <4-1
f a
CJIX ?
dcd
University of Ghana http://ugspace.ug.edu.gh

107
O<4-1
Ucd<u>>
d)4-1
MHO r .
r .l-i o >Q) r—<
- UJ-l ocd 4->Pcr<t
r^.T3 O 'C Hcd
x>CO o<u •rl
•H uO V<v a,a,CO <v>>
rO00
CO cco u*H 34-> TJcd3 c\c r a>
cdC *-4o
•r4 cd(0 4->CO H0) o
>00Q) cU •H
JZ TDU CL)00 >-ic P
4->.—1 a.
cd60 oo
r—< co1
4->.c -U>oo ,c
•rH oQ) •HZ CO
>,bC1 uO A
a
CO
XIc0
H
CO3
4->CdoJ-l3
4-1
Ul
5-4 Q> M-l ■H »— IQ>>
Ol
0)Mf—Icd
o|
CO
34-JcdM3cd
o|
doCOcd<D
g o
cd
cd
cd
o5S
cd
or -
a>&H
I•
CJ0)
Q
Mcd
E
CM
ovOr ^
•OJ
Oo 8o CM
i • • 1<i-
1 i
r-»i vO CM 1
m co vO mm O ' r --Jo r^. vD o
• • • •CNl CNJ CNj CO
r-". CM < r0 0 r-» r - l
v D CM O 0 0• • • •
<r <r < ri i i i
.— I CO0 0 O v£> CO
r - l i— 1 r —1
O ' < f0 0 CM oO' r ^ i— 1
• • • •CM CM CO CM
<1* 0 0 <t vOCM 0 0 vO r—1
vO r - l 0s m• • • •
<t <r1 1 i i
t—■i CM mOO C O m
m r > . CM ONo CNJ O00 CO m• • • •CNI CM CM CM
ON CM COCM o <1- CM•n C O 00• • ♦ •
CO <r COi 1 i 1
o o CM mco m vO CO
60
I(L>
§*-)
CO
>0
1
4->cu<v00
University of Ghana http://ugspace.ug.edu.gh

108
except where n = 3 (indicating isometric growth), condition factors of
fish of different lengths cannot be directly attributed to features other
than length. He therefore sounded a note of caution in comparing con
dition factors between fish of different lengths where n is not equal
to 3. He suggested "alternate methods of analyzing condition which may
be more suitable11. These methods mainly involve the empirical calcula
tion of the regression slope in the weight-length relationship equation
for the population of interest and its substitution for the exponent 3
in the formula: W = aLn , where n is equal to the empirically calculated
slope value. This he referred to as the ’relative condition factor1.
Carlander (1969) pointed out that Le Cren’s relative condition
factor assumes that the slope is the same in the populations being
studied and remains the same when collections in different seasons are
compared. In the Volta Lake studies, the slopes are not always the same
(Table 34).
The mean K values may be used for comparing the condition of one
population with another or with others if 1) the regression slope does
not differ from 3 or if there is no trend in K with length, 2) if
the size distributions of the samples are truly representative of the
size distributions of the populations, or 3) if the lengths of the
fish are within the same fairly narrow size range in each sample. In
the last case, the comparison is not between populations but between the
fish of this size range in the populations. If fish of the same lengths
are compared, the mean weights can be used rather than calculated K.
University of Ghana http://ugspace.ug.edu.gh

109
When the weight-length regression has been calculated (as in Tables
31 and 32) the expected mean K at each length can be calculated with
the following formula:
Log K = logioa + 5 + (n-3)logL .
This was arrived at through the following reasoning:
W x 105Coefficient of condition K = --- ----
L3
But W = aLn , therefore
aLn x 105
K = — = aLn '3 x 10⁵ .
Hence:
logI0K = log1Qa + 5 + (n-3)Log1QL .
Regressions of log K on Log SL based upon geometric mean,
LogW - log SL regressions are presented in Table 35 and Fig. 15. It
should be pointed out, however, that the largest C. auratus were 195 mm
C. walkeri, 235 mm and therefore the extension of the line beyond these
points is theoretical
Table 35. Regressions of log K on log SL based upon geometric mean, log W-log SL regressions
a b
C. auratus 0.558 -0.143
C. walkeri 0.103 0.079
C. velifer 0.234 -0.001
C. furcatus 0.695 -0.191
University of Ghana http://ugspace.ug.edu.gh

COco•H
COCOQ)M00CL>UhJCO
0001
ooo
ccOcu£C J
J-l4 -Jcu6oCU00
eoCu3
X )cuCO03
CO
60o-JcouGOo
o(OCO
•tH<0if)CUuoocuPC
m
oo•H|Jh
University of Ghana http://ugspace.ug.edu.gh

Regressions
of
logK
on
LogSL
based
upon
geometric
mean,
LogW-LogSL
regressions
111
</l13
4 -> <05- Z5 fO
s~CD
ftJ3S
U<D4 -
CU>
1 34->fOOs~! 3M—
i/)
O O O O
I I I! i 00
cr> o
UD • . 00 c\j cn
cn
C\J
uoCNJ
- 00CNJ LD
OCNJ
00• CO
-
<D
inCNJ
CNJ
O o1 o
\ v^ 0 O O 0
CNl O 00 kOc o CNJ CNl
0 • • •
cn O r— CNJ
* ®0 cn 00
CNJ CNJ 1— r—
O 0 0 0 O*3* CNJ 0 00 <DCNJ CNJ CNJ r—
* * • • *
ID 00 __ LOLO LO
• • • ••— r— r— 1— 1—
University of Ghana http://ugspace.ug.edu.gh

112
RECOMMENDATIONS FOR FUTURE RESEARCH
Some vital aspects of the life history which were not covered during
this study include: age, growth and mortality rates. Knowledge of
these parameters is essential in productivity studies of this nature.
Past efforts to age Volta Lake fishes have been unsuccessful. In 1969 to
1970, a researcher (Mariam Brooks) of the Volta Basin Research Project of
University of Ghana, explored all the known techniques of aging, using
Volta Lake species. Her results in general were negative (Taylor, 1971).
Earlier, Wuddah (1967) had reported inability to read scales of Volta
Lake Tilapia spp.
Encouraged by reports from the Ivory Coast that Chrysichthys walkeri
had been aged via spine sectioning and examination (Dia, 1975), I under
took a trip to that country to study the method. Sectioned spines of
Chrysichthys walkeri in Ebrie Lagoon showed, fairly clearly, alternation
of dark and light bands. Two dark bands were proved to be formed during
the two periods of peak rainfall in a year. No similar bands were
identified in the sectioned spines of Volta Lake Chrysichthys. At
Iowa State University, about 6 - 1 0 otoliths were preliminarily examined
under the scanning electron microscope for evidence of growth rings.
These few did not show any consistent structural patterns which could
be associated with any seasonal activities. It is however, recognized
that more effort needs to be spent on this technique before a definitive
statement can be made as to its utility. In Kainji Lake, Ajayi (1972)
aged £. auratus by reading annuli of sectioned spines and vertebrae.
Kainji Lake, however, is located at a higher latitude (10°00 - 10°50»N)
University of Ghana http://ugspace.ug.edu.gh

than Volta Lake (6°15T - 9°10!N) and consequently, experiences more ex
tremes of climate which might be conducive to growth ring formation.
Ikusemiju (1976) used the progression of the modes in the length frequency
distribution to determine growth rate of C. walkeri in Lekki Lagoon. This
technique could not be used in the present study insofar as the modes ap
peared fixed for the period investigated.
Knowledge of mortality rates can be secured from age structure data
or mark and recapture technique (Healey, 1975). Until Volta Lake fishes
can be aged, efforts should be concentrated on the latter method.
During November 6 - 2 4 , 1975, 14 Chrysichthys specimens were marked
with Floyd spaghetti tags which were inserted through the dorsal muscles
and secured between the interneurals. The fish were then kept in a cir
cular pond of about 1 m radius. Tag retention time ranged from 1 1 - 1 8
days. In a following field experiment on November 28, 1975, 37
Chrysichthys specimens were marked and released at Ampem. There was one
recovery on December 7 (i.e., 9 days after tagging) at about a mile off
shore of same station. Though the experiment was terminated when
available tags were used up, it was obvious that tag retention of 18
days would be of little value in determining mortality rates. Hence
exploration of other methods has been planned for the future.
The present study has suggested that the Chrysichthys populations
in Volta Lake were stunted although growth rates are not known. Growth
rate and productivity could be increased if serious exploitation starts
(Healey, 1975). Though there is no market objection to small fish in
Ghana, the fishermen are not attracted to Chrysichthys fishery, probably
because it has not proved profitable to harvest them with the present
113
University of Ghana http://ugspace.ug.edu.gh

114
means of capture. The commercial fishery uses principally gill nets which
accounts for about 75% of the catch. Bazigos (1969) estimated that for
the first two quarters of 1969 an average of 97,043 units of gill nets,
859 cast nets, 2,714 lines, and 25,375 traps per day were used. Vanderpuye
(1975) showed that in May 1969 - October 1973, there was a decline in
catches of herbivorous Tilapia and a concomittant increase in carnivorous
Lates. The two species comprised 63% by weight of the commercial catch
from May 1969 to April 1972. Since the Tilapia fishery used almost ex
clusively gill nets and the Lates fishery, gill net and line, it may be
reasonable to conclude that after these estimates in 1969, there was a
relative decrease in gill nets and traps and increase in number of lines.
The traps are made of either cane or wire. They have no leads and are
set in the marginal weeds at the end of cleared paths which direct the fish
into the traps. The present study has shown that the catch of one hoop net
with a single lead might be as much as that of one gill net (30 m x 3 m
long) set in 3 m deep water. A hoop net has the following advantages over
a gill net: 1) it can be set in the marginal areas without the use of a
boat; 2) the fishes are trapped and not gilled or entangled; hence recoveiy
is easier resulting in saving of time; 3) less damage is done to the web
bing thus cutting down on cost of maintenance; 4) fish are captured alive
(except in anoxic environment) and thus the fisherman can lift the traps
at more convenient time intervals and 5) although no figures are available,
it might be cheaper to make a hoop net of the same catching efficiency as
a gill net. Consequently, introduction of hoop net fishery to the commer
cial fisherman should lead to more efficient harvest of Chrysichthys.
University of Ghana http://ugspace.ug.edu.gh
115
About 1,000 Chrysichthys stomachs were examined for items eaten,
during the present study. Unfortunately, field studies on degree of se
lection of organisms in the environment were not completed before I left
Ghana; hence this aspect has not been reported on, I hope to continue
this study on my return to Ghana because of its importance in productivity
studies. Further, the position of Chrysichthys in the food web needs to
be clearly defined. A preliminary investigation (Vanderpuye, 1975)
showed that Chrysichthys may be one of the important food items for the
much-relished Lates niloticus.
Chrysichthys auratus and C. walkeri were observed spawning in the
sheltered Ajena Bay in shallow water. There is the need to pursue the
search for the spawning areas of C. velifer and C. furcatus. The protec
tion of the spawning areas might be necessary should it turn out that the
preferred habitat is localized and in danger of being rendered unsuitable
on account of human activity. The estimated 1,479 fishing villages
scattered around the lakeshore makes this problem real and not imaginary.
Finally, it is recognized that almost all aspects of the life his
tories of these Chrysichthys in Volta Lake need further study. The
present study gives leads as to the areas needing further study and to
the methods to be used.
University of Ghana http://ugspace.ug.edu.gh

SUMMARY
Though Chrysichthys have been reported from practically all the river
systems in tropical Africa, little is known about their biology* Species
in the genus have not been adequately separated, identified, and described.
This, in the main, is due to lack of dependable taxonomic characteristics.
When some morphological and meristic characteristics used in the literature
were tested, only number of gill rakers proved to be of some value at Volta
Lake. In the present study, the following characteristics were used for
identification: position of the dorsal fin, color of the barbels and the
body, and the shape of the caudal fin and its lobes. Four species in Volta
Lake are C. velifer (Norman), C, auratus (Geoffroy Saint-Hilaire), C.
walkeri (Gunther), and C. furcatus (Gunther).
From around November 1965 (about a year after the lake had started
filling) to May 1970, Chrysichthys was relatively abundant near the dam-
site at Akosombo. Sampling during June - September 1970 showed a decline
and a more even lakewide distribution. Thereafter, abundance fluctuated
seasonally with more fish being caught in the rainy season.
At Ampem sampling station, Chrysichthys accounted for 43.870 of the
total catch thus making it the most abundant genus, distributed as follows:
C, velifer 23.3%, £. auratus 10.37o, C. walkeri 10.07o, and £, furcatus
0.0027o.
During August 1974 to May 1975, Chrysichthys accounted for 527o of
the catch in inshore portions (depth: 0 - 3 m) of Areas 3, 7, and 8.
Abundance of Chrysichthys decreased with depth, indicating that the
species prefer inshore habitats. In most parts of the lake, except in
periods of overturn, oxygen concentration below 10 m was 0. Since
116
University of Ghana http://ugspace.ug.edu.gh

117
Chrysichthys are sensitive to low oxygen concentration, their depth dis
tribution might be limited to roughly 10 m in most parts of the lake.
Catches with hoop nets in decomposing marginal vegetation devoid of dis
solved oxygen, however, showed that Chrysichthys are capable of pene
trating deoxygenated water for lengths of time.
Depth and degree of flow are two independent factors which interact
to determine the distribution of Chrysichthys. Both increasing 1) depth
and 2) flow have negative effects.
Length frequency distribution of catches with rotenone did not show
seasonal changes in abundance of juveniles. While inadequate sampling
technique may be responsible, it is argued that had spawning been seasonal,
it would have shown up even with this type of sampling.
When monthly captures with the least selective of the sampling gear
(beach seine) were analyzed, catches of C. velifer and C. walkeri showed
fixed modes at 140 and 125 mm, respectively. There was no evidence of two
or more modes which might suggest different year classes or spawning
periods.
Fish in ’running’ condition were rarely encountered on the sampling
grounds. This indicated that ripe fish go to the breeding grounds for
spawning before this stage. Likewise, spent fish do not return to the
sampling grounds until they are well advanced into the resting stage.
Both male and female C. auratus and C . walkeri matured within the
standard length range 70 - 79 mm. For C. velifer, it was 100 - 119 mm.
The smallest spawning female was 72 mm in C. walkeri and 82 mm in C.
auratus. No clear seasonal trend in maturity was shown by any of the
University of Ghana http://ugspace.ug.edu.gh

118
species.
In C. auratus, C. walkeri and C. velifer, the female outnumbered
the males in both the wet and dry season samples, but the ratios dif
fered from the hypothetical 1 : 1 ratio only for C. velifer in the rainy
season.
The left ovary was bigger than the right in 4 specimens of
walkeri and 3 of 5 C. auratus. The other 2 C. auratus had ovaries of
equal size but they were small suggesting possible further development
which would result in size differences.
The smaller species (C. auratus and C. walkeri) appeared to have
larger eggs than the larger species (C. velifer and C. furcatus) although
this difference was not statistically significant (P>0.05). Samples
involved in the comparison were captured on the sampling grounds but noton
the breeding grounds. The observation that C. auratus leaves the sampling
grounds for the breeding grounds earlier than the rest, however, makes
it doubtful that the same maturity stages were involved in the comparison.
Within each species, fecundity varied among females but generally in
creased with size. Least squares estimates of fecundity (F) on
(1) body length (SL) were:
C. walkeri, Log F = -1.905 + 2.36 log SL.
C. auratus, Log F =-3.98 + 3.312 log (SL). Curvilinear equations
best described the relationship in both species.
£* v e l i F = -4295 -f- 40.95 (SL). Rectilinear equation best
described the relationship.
(2) body weight (W) were;
C. walkeri, F = -126.18 + 27.63 W.
University of Ghana http://ugspace.ug.edu.gh
119
C. velifer, F = 1607 + 12.95 W.
Rectilinear equations best described the relationship in both species.
C. auratus and C. walkeri were captured with bamboo traps on the
spawning grounds in the well sheltered Ajena Bay. Their preferred spawn
ing site appears to be 1) calm shallow waters; 2) darkened interior of
a hole or a crevice; and 3) a firm substrate for the deposition of the
eggs.
Ripe male and female did not enter the traps until at least 7 days
after setting. Of 43 mating pairs collected in the traps, 42 showed the
male bigger than the female. It was concluded that this characteristic
might be an important requirement for successful mating and subsequent
spawning.
Two juveniles of either C. auratus or C. walkeri, of sizes 13 and 15
mm (TL) were caught sheltered in the asbestos-pipe traps set in 3.5 m
deep water. This suggested that after the larval stage, the juveniles
migrate into deeper water, where they hide in the shelter of submerged
vegetation until they reach a certain size (about 20 mm: the lower size
range collected with rotenone) and then return once more into shallow
waters.
Weight-length relationship computed from linear least squares re-
gressions of log weight on log length (i.e., log W = log a + b log SL)
for (1) male and (2) female fish, showed no significant difference in
either slope (b) or intercept (log a).
The regression slopes were significantly less than 3.0 for 3 species
but not for C, walkeri. However with functional regression, C. walkeri
and C. velifer had slopes which were not significantly different from 3.0
University of Ghana http://ugspace.ug.edu.gh

120
while C. auratus and C. furcatus had slopes which were significantly less
than 3.0. Thus overall, smaller individuals in the population were plumper
than the longer members. It was further concluded that as Chrysichthys
in Volta Lake grow older, they become poorer in condition.
When the data were further broken down into quarters, it was observed
that regression slopes were lowest in March to May for 3 species with the
C. velifer slope somewhat lower in June to August.
When the weight-length regression has been calculated, the expected
K at each length can be calculated with the following formula:
Log K = log1Q a + 5 + (n-3) log L.
Areas recommended for either continuing or future studies include:
1) age and growth; 2) mortality rates; 3) food habits; and 4) identifi
cation and delineation of spawning areas. All are considered important
for the rational management of the Chrysichthys fishery envisaged.
University of Ghana http://ugspace.ug.edu.gh

121
l i t e r a t u r e c i t e d
Ajayi, S. 0. 1972. Biological studies on the family Bagridae (Pisces:Siluroidae) in Lake Kainji, Nigeria. Unpublished M.S. thesis.Library, University of Ife, Nigeria. 151 p.
Bagenal, T. B. 1966. A short review of fish fecundity. Pp. 89-111 in S. D. Gerking, ed. The biological basis of freshwater fish production. John Wiley and Sons, Inc., New York, N . Y .
Bazigos, C. P. 1969. Estimated magnitudes of variable input (Fishingeffort) (Objective measurements). Series C. Tech, Rept. Volta Lake Research Project, Akosombo, Ghana. 15 p.
Bazigos, G. P. 1971. Yield indices in inland fisheries with special reference to Volta Lake. Stat. Stud. St. S/3. FAO, Rome 25 p.
Biswas, S. 1972. Ecology of phytoplankton of the Volta Lake. Hydro- biologia 39: 277-288.
Boateng, E. A. 196 7. A geography of Ghana. Cambridge University Press, Cambridge, England. 210 p.
Bodola, A. 1966. Life history of the gizzard shad. Dorosoma cepedianum (LeSueur), in Western Lake Erie. U.S. Fish and Wildl. Serv. Fish Bull. 65: 391-425.
Boulenger, G. A. 1911. Catalogue of freshwater fishes of Africa. Vol. 2. British Museum Natural History, London. 259 p.
Carlander, K. D. 1969. Handbook of freshwater fishery biology. Vol. 1. Iowa State Univ. Press , Ames. 752 p.
Chauvet, C. 197 3. Note prelimnaire a l’etude des stocks de poissons du genre Chrysichthys des lagunes et rivieres de la Cote d’Ivoire.Tethys 4: 981-988.
Coppola, S. R. and K. Agadzi. 1976. Frame surveys at Volta Lake (Ghana), 1975. Gha/71/533. St. S/5. FAO, Rome. 148 p.
Czernin-Chudenitz, C. W. 1971. Physico-chemical conditions of Lake Volta, Ghana. FI:SF/Gha 10., Tech. Rept. 1, FAO, Rome. 77 p.
Daget, J. and litis, A. 1965. Poissons de Cote d’Ivoire (eaux douces et saum£tres). Mem. Inst. Fr. Afr. Noire, 74: 385 p.
Denyoh, F. M. K. 1969. Changes in fish population and gear selectivityin the Volta Lake. Pages 206-219 in L. E. Obeng, ed. Man-made lakes. The Accra Symposium. Ghana Universities press, Accra, Ghana.
University of Ghana http://ugspace.ug.edu.gh

122
Dia, A. e . K. 1975. Determination de l'age des Machoirons (Chrysichthys nigrodigitatus)premiere estimation de la croissance. Doc. Scient.
Centre Rech Oceanogr., Abijan 4: 139-151.
Evans, W. A. and C. J. Vanderpuye. 1973. Early development of the fish populations and fisheries of Volta Lake. Pages 114-120 in W. C. Ackermann, G. F. White, and E. B. Worthington, eds. Man- made lakes: Their problems and environmental effects. American
Geophysical Union, Washington, D.C.
Ewer, D. W. 1966. Biological investigations on the Volta Lake, May 1964 to May 1965. Pages 21-31 in R. H. Lowe-McConnell, ed. Man-made lakes.
Academic Press, London.
Hall, J., P. Pierce and G. Lawson. 1971. Common plants of the Volta Lake. University of Ghana, Legon. 123 p.
Healey, M. C. 1975. Dynamics of exploited whitefish populations andtheir management with special reference to the Northwest Territories.J. Fish. Res. Board Can. 32: 427-448.
Henderson, H. F., R. A. Ryder, and A. W. Khudhongania. 1973. Assessing fishery potential of lakes and reservoirs. J. Fish. Res. Board Can.30: 2000-2009.
Hopson, A. J. 1972. A study of the Nile Perch in Lake Chad. OverseasResearch Publication No. 19. Her Majesty's Stationery Office, London. 93 p.
Ikusemiju, K. 1976. Distribution, reproduction, and growth of the catfish, Chrysichthys walkeri (Gunther) in the Lekki lagoon, Nigeria.J. Fish. Biol. 8: 453-458.
Ikusemiju, K. and C. I. 0. Olaniyan. 1977. The food and feeding habits of the catfishes, Chrysichthys walkeri (Gunther), Chrysichthys filamentosus (Boulenger) and Chrysichthys nigrodigitatus (Lacepede) in the Lekki Lagoon, Nigeria. J. Fish. Biol. 10: 105-112.
Ita, E. 0. 1972. Approaches to the evaluation and management of thefish stocks in Kainji Lake, Nigeria. Afr. J. Trop. Hydrobiol. Fish, Special issue 1: 35-52.
Jayaram, K, C. 1955. A preliminary review of the genera of the family of Bagridae (Pisces: Siluroidea). Proc. Nat. Inst. Sci., India,21: 120-128.
Jayaram, K. C. 1966. Contributions to the study of the fishes of the family Bagridae. Bull. Inst. fr . Afr. noire 28(3): 1064-1139.
University of Ghana http://ugspace.ug.edu.gh

123
June, F. C. 1953. Spawning of yellow fin tuna in Hawaiian waters.U.S. Fish and Wildl. Serv., Fish. Bull. 54(77): 47-64.
June, F. C. 1971. The reproductive biology of the northern pike, Esox lucius,in Lake Oahe, an Upper Missouri River Storage Reservoir.Pages 53-71 in G. E. Hall, ed. Reservoir Fisheries and Limnology. Special Publ~No. 8. American Fisheries Society, Washington, D.C.
Laevastu, T. 1965. Manual of methods in fisheries biology. FAO, Rome.
Lawson, G. W . , T. Petr, S. Biswas, E. R. I. Biswas and J. D. Reynolds. 1969. Hydrobiological work of the Volta Basin Research Project, 1963-1968. Bull. Inst. Fondl. Afr. Noire 21: 966-1003
Le Cren, E. D. 1951. The length-weight relationship and seasonal cycle in gonad weight and condition in the perch (Perea fluviatilis).J. Anim. Ecol. 20: 201-219.
Lelek, A. 1973. Sequence in changes in fish populations of the new tropical man-made lake. Kainji, Nigeria. W. Africa. Arch. Hydrobiol. 71: 381-420.
Lewis, D. S. C. 1974. The effects of the formation of lake Kainji(Nigeria) upon the indigenous fish population. Hydrobiologia 15: 281-301.
Livingstone, D. A. 1974. Mineral cycling. Pages 7-10 in Environmental aspects of a large tropical reservoir. Preliminary report on a case study of the Volta Lake, Ghana. Office of International and Environmental Programs, Smithsonian Institution, Washington, D.C.
Loiselle, P. V. 1972. Preliminary survey of inshore habitats in VoltaLake, Ghana. FI:DP/GHA/67/510/2. FAO, Rome. 122 p.
Martinez, S. and E. D. Houde. 1975. Fecundity, sexual maturation, andspawning of scaled sardine (Harengula jaguana Poey). Bull, of MarineSci. 25: 35-45.
Matthes, H. 1973. A bibliography of African freshwater fish. FAO, Rome. 299 p. '
Micha, J. C., et V. Frank. 1975. Biologie des principales especesutilisees en pisciculture Africaine. C1FA/75/SR 8. FAO, Rome. 39 p.
Otsu, T. and R N Uchida. 1959. Sexual maturity and spawning of albacore
287-305. 0cean- U.S. Fish and Wildl. Serv., Fish. Bull. 59(148):
- M ; ^ o . Gh*n*’
University of Ghana http://ugspace.ug.edu.gh

124
Petr, T, 1968a. Distribution, abundance, and food of commercial fish mthe Black Volta and the Volta Man-Made Lake in Ghana during its first period of filling (1964-1966). 1. Mormyridae. Hydrobiologia 32:
417-448.
Petr, T. 1968b. The establishment of lacustrine fish population inGhana during 1964-1966. Bull. Inst. Fondl. Afr. Noire 23: 257-269.
Petr, T. 1969. Fish population changes in the Volta Lake over theperiod January 196 5-September 1966. Pages 220-234 in L. E. Obeng, ed. Man-made lakes. The Accra Symposium. Ghana Universities
Press, Accra, Ghana,
Petr, T. 1974. Distribution, abundance and food of commercial fish in the Black Volta and the Volta man-made lake in Ghana during the filling period (1964-1968). II. Characidae. Hydrobiologia 45:303-337.
Petr, T. and J. D. Reynolds. 1969. Fish population changes in the Volta Lake in 1968. Tech. Rept. X32. Volta Basin Research Project, University of Ghana, Legon. 18 p.
Pierce, P. C. 1971, Aquatic weed development, impact and control atVolta Lake, 1967-71. Volta Lake Research Project, Akosombo, Ghana.86 p.
Reed, W,, _et ail. 1967, Fish and fisheries of Northern Nigeria. Ministryof Agriculture, Northern Nigeria, Zaria. 226 p.
Poll, M. 1950. Les poissons geants du Congo. Zooleo. 6: 3-8.
Regier, H. A. 1972. Report on the seminar on fisheries resources assessment and evaluation, Burundi, 1-7 June 1971. CIFA/72/5.3. FAO,Rome, li p.
Regier, H. A., A. J. Cordone and R. A, Ryder. 1971. Total fish landingsfrom fresh waters as a function of limnological variables, with special reference to lakes of east-central Africa, FI:SF/GHA 10, FAO, Rome.13 p.
Reynolds, J# D. 1970. Biology of the small pelagic fishes in the newVolta Lake in Ghana. Part 1. The lake and the fish; feeding habits.Hydrobiologia 35: 568-603.
Reynolds, J. D # 1971. Biology of the small pelagic fishes of the newVolta Lake in Ghana. Part II, Schooling and migration. Hydrobiologia38(1): 79-91. 6 6
Reynolds, J. D. 1973, Biology and fisheries potential of four species of Alestes (Pisces - Characinidae) in the new Volta Lake, Ghana, Rev,Zool. Bot. afr., 8/s 298-307.
University of Ghana http://ugspace.ug.edu.gh
125
Ricker, W. E. 1973. Linear regressions in fishery research. J. Fish.
Res. Board Can. 30: 409-434.
Ricker, W. E. 1975. Computation and interpretation of biologicalstatistics of fish populations. Bull. Fish. Res. Board Can. 191:
1-382.
Roberts, T. 1967. A provisional checklist of the freshwater fishes of the Volta Basin with notes on species of possible economic importance. Jour, of the West African Science Association 12(1):
10-18.
Roest, F. C. 1973. Developpment de la peche du lac de Kossou Coted’Ivoire Project PNUD/AVB. FAO, Rome. 15 p.
Ryder, R. A. 196 5. A method for estimating the potential fish production of north-temperate lakes. Trans. Am. Fish. Soc., 94: 214-218.
Sprugel Jr., G. 1951. An extreme case of thermal stratification and its effect on fish distribution. Iowa Acad. Sci. 58: 563-566.
Taylor, B. W. 1971. Volta Lake Research, Ghana. Interim Report FI:SF/GHA 10. FAO, Rome. 58 p.
Trewavas , E. and F. R. Irvine. 1947. Freshwater fishes. Pages 221-282in F. R. Irvine, ed. Fisheries of the Gold Coast. Crown Agents,London.
Vanderpuye, C. J. 1972. Fishery resource assessment and monitoring in the development and control of fisheries in Lake Volta. Afr. J. Tropical Hydrobiol. Fish. Spec. Issue II: 115-134.
Vanderpuye, C. J. 1973. Population of clupeids in Volta Lake. Ghana J. of Sci. 13: 179-193.
Vanderpuye, C. J. 1975. Investigation into causes of increase in abundance of Lates niloticus and concomitant decline of Tilapia spp stocks in Volta Lake. Tech. Rept. Volta Basin Research Project, University of Ghana, Legon. 25 p.
Welcomme, R. L. 1972. The inland waters of Africa. CIFA Tech. Pap., 1, FAO, Rome. 117 p.
Whitehead, V. 1969. Investigations into the food habits of juvenile fish in the Volta Lake during the period October 196 7 to March 1969, with some notes on distribution and abundance. Tech. Rept. X30. Volta Basin Report Project, University of Ghana, Legon. 14 p.
Wuddah, A. A. 1967. Studies of the biology of the species of Tilapia in the Volta Lake. Unpublished M.S. thesis. Library, University of Ghana, Legon. 121 p.
University of Ghana http://ugspace.ug.edu.gh

126
Field work in connection with this study was undertaken in 1974 to
1977 when I was a registered Ph.D. student with the Zoology Department of
University of Ghana. I wish to thank the following members of my com
mittee for their advice and suggestions during the period: Prof. J.K.M.
Hodasi, the then Head of the Zoology Department and Chairman of the Com
mittee, Dr. Robert Lee, my supervisor, and Dr. P. Grubb, a member.
Data which relate mainly to the assessment of the status of abundance
of the fish populations from December 1969 to October 1973 were also avail
able to me. They were particularly helpful in describing species dis
tribution. Mr. Willis A. Evans (an FAO Fishery Biologist) and I, were
jointly responsible for the stock sampling program from December 1968
to March 1971. After this period, I had sole responsibility for it.
Throughout my field and laboratory studies, I was assisted by my ever
faithful assistants: Messrs. Joe Akpey, Gilbert Tuwor, S.R.G. Lartey,
and Gabriel Agbodoka. My colleague, Dr. E. K. Obeng-Asamoah, Head of the
Limnology Section, was kind enough to allow me to use his unpublished data
on dissolved oxygen and temperature at Ampem. I thank him for his kind
cooperation.
Study at Iowa State University was made possible by a 2-year study
leave granted me by my employers, the University of Ghana. I am particu-
larly thankful to the Vice Chancellor, Prof. D. A. Bekoe and to Prof. J.K.M.
Hodasi, former Head of the Zoology Department for favorably responding to
my petition to permit me to complete my study at Iowa State University.
ACKNOWLEDGEMENTS
University of Ghana http://ugspace.ug.edu.gh
127
The Ghana Government, the University of Ghana, and the Iowa State
University Alumni Achievement Fund shared the financial burden of my stay
at Iowa State University. I am particularly thankful to Prof. K. D.
Carlander, C. F. Curtiss Distinguished Professor, for recommending me for
the alumni award.
Professors K. D. Carlander and R. C. Muncy were the co-chairmen of
my committee. Prof. Muncy was in charge of my program during the period
November 1977 to November 1978 when Prof. Carlander was on a sabbatical
to Universitas Satya Wacana, Indonesia. On his return, they were jointly
in charge until June 1979 when Prof. Muncy was transferred by the U.S.
Fish and Wildlife Service to become Leader of the new Mississippi Coopera
tive Fisheries and Wildlife Research Unit. After this date, Prof.
Carlander handled my program single-handedly. I thank Prof. Muncy for
his guidance and advice in the analysis of data and the writing of this
dissertation. Mrs. Betty Muncy’s ready wit and moral encouragement kept
up my occasionally flagging spirit.
Special thanks are due to Prof. K. D. Carlander, for his continued
interest in me. From 1968 (year of departure from ISU) to 1977 (year of
return to ISU), he followed my activities not only in Ghana, but on the
African fishery scene as a whole. My present effort is the culmination of
his continued inspiration and advice. Throughout my stay at ISU, he en
sured that I was free from the encumbrances which are usually the lot of a
mature student studying in a foreign country. Mrs. Julia Carlander was
privy to this role and I suspect, actively fostered it. To both of them, I
express my sincerest appreciation and warmest thanks.
University of Ghana http://ugspace.ug.edu.gh
128
Dr. David Cox advised me on many statistical analyses. The rest of
the Committee members, Professors R. C. Summerfelt, R. W. Bachmann, and
W. Rowley are to be thanked for reading and criticising the manuscript.
My wife, Faustina, ably managed the home front during my 2-year stay
at ISU. For 2 years my children, Joseph, Mercy, and Kate, missed the love
and care of a father. I commend each and every one of them for cheerfully
putting up with inconveniences arising from my absence during this period.
University of Ghana http://ugspace.ug.edu.gh

129
a p p e n d i x
University of Ghana http://ugspace.ug.edu.gh

Ta
ble
A
-1.
F
ield
s
am
pli
ng
s
ch
ed
ule
in
c
on
ne
cti
on
w
ith
st
ud
y
of
life
h
ist
or
y
of
Ch
ry
sic
ht
hy
s
ca
tf
ish
in
Vo
lta
L
ak
e,
Gh
an
a130
00 Er^5 cdM dcd *H6<U •H
QtS H< v
ua .
q; <U-p d0 0c c d
coa ,cd +u
X ! 0)o d a *h<U Q )
03 CO
i—I 4J •H 0>O d
a .ea>
Eh
d(U60
jC ^ O to o -H a) xi
CO
Pio
•H4J<04-»CO
cd<u
« !
"Oo
•H
a)
< u
>u
p<0
+ + + + + + +
+ + + + + + + + + + + + + + + +
+ + + + +
+ + + + + + + +
+ + + + + + + +
+ + + + + + + +
+ + + + + + + + + + + + + + + + + + + + + H- + H—h 4-4-4-
4- + + + + 4- 4- 4- 4- 4- 4- 4- 4- + + + + + + 4- 4- 4- + 4- + 4-
4- 4- 4- + 4- 4- + 4- + 4- 4- 4- 4- 4- + 4- + + 4- + + + + + + +
+ 4* 4- + + + 4- 4- + + + + 4- 4- + + + + + 4- 4- + + + 4- +
B B S aJ a) <y CU CXi 04
6 0 ^a s_ B
<D Q J
CU CU
0)a.Mo
McdCO
<ya cd
3 0 M>H O j d X I*-> H • H cda> > •H
£ 1 1 I §C hJ
uo
%
o _ >> ft 0 o
a> a* o
6 « <u d cl a, cd§
1 1 6
•H♦'—> cd ai XI
cd<4-4
w cd
3<L>a e• H Cdp a
6a>a.
co cq UhHMiO^QiCliCliQddl l l l l l l l
00 00 co
$z
xCNCNJ
P
001bO
P 60 60 .< 3 2 >
< < o ^ ^ S3I O rHco co co in
0123OCM
1m
>0
55
<r m1— i r^.
1 ON O r H
XI Q>
I p3HX) x»CL) <L>
X Ia>
<1* in ^ rs
0)(H
•
>f— < s • O
• • r l <u X • 4-> •M d r H 60 a, 1 • Ocd a * P P P Q) f H
> CL)• • S < 1 *-> ■d <d CO O Q
X ) X i > > > N > > > N > * 4 J<D a )Pm
C OCNl CNJ
cd cd X X 2
cdX
v OCM CNJ
0O J
0CNJ
OO ON
CNCN
1 1 1 1 1 1 CM 10 0 c n 0 0 c n < 1 - m v O r'**' r H O v O m CM O CNJ 1 CNr -| r—1 .-H r - 4 r H r H ( H r H CM CO r H r H r H r H CM P " . r H
University of Ghana http://ugspace.ug.edu.gh

Table
A-l#
Field
sampling
schedule
in
connection
with
study
of
life
history
of
Chrysichthys
catfish
in Volta
Lake
,
Ghana
130
co4*5ucd
§
ucd x C CU
•H >e u
«— 1 CO<U
Oi
CU <U4J J3O o es a + + + + + + + + + + + + + + +
COd rcd
H+ + + + + + + + + + + + + + + + + + + + + + + +
43 <Uo acd «Q) Q)
PQ co
+ + + + + + + + + + + +
— I 4->• h cu O (3
+ + + + + + + H- + + + + + + + + + + + + + + + + + + + +
a,£<uH
+ + + + + + + + + + + + + + + + + + + + + + + + + +
a<u5 0
+ + + + + + + + + + + + + + + + + + + + + + + + + +
43 4*5 O co O *H <U T>
CO
+ + + 4- + + + + + + + + + + + + + + + + + + + + + +
{3o4->cd4Jco
§OCU g
t>0 cu £cucu
0)auocdco
•H 0•nHcu
I §<1 t-3
O >*WCO
CUcu cd o u
• H Cd > *r4
§.e so o cu
<DCUo
£ Cda> c l a, cd
•H•<—> cd CU 4 3 >* cd
D a i3- H Cd
<u<u §<u
£cu
CU CU CU CU CU Qj Q-i£a>cuV t—bl w ' ' —I ’ 1-1 W i-M I—M t-w I—U I—M I U U M i
^ I 5 I I S S 3 S S ,I I 4 I I I I I
cd<u oo oo co
T3O•HUCUCU
ONI<NC M
31-3
00
5 0 I5 0 5 0
3 3r-* i O r-t
co co co »n
>o5Z
>0!ZoC M1m
mr-*.on
4 3 4 3 X i rQ rQ 4 3<U CU CU 0) CU cu&U &H (J4 Cjh Pt, Pn
^ * n v o o o O '
Mcd33
Ma<
>> >> cd cdco <j-
OM CM I I
oo O ' < t cn vo
i
cd cd v o
0){3
. S> > • 4J SS
«—< 5 0 C U ,3 3 CD
*~ ) < ! c o
r-i oC M C O
<1-0 0 C M C M C M C M I I I I\o *n cm o
• o> Q)o Qa
C M O N C M C M I
• C Mt—1
University of Ghana http://ugspace.ug.edu.gh

Ta
ble
A
-1.
Co
nti
nu
ed
131
CO
Us<L>OS
\
(U O) (3
o o cC fl
CO
a.cdJ-4E-*
43a)Oacd ♦H<u a)
PQ co
rHr—1 4 J•H a)o (3
•0 4e0)H
csCL)0 0
KO
•rH434*1O COO •HCL) T 3
CO
do•H-Ucd4-)CO
cda;
<
T3O
•rHHa)cu
+ +
+ +
+ + + +
+ + + + + + +
+
+
+
§
B o o )0) Ch 4->a* M o)§ -H ^< ! N) Jz;
+ +
+ +
+ +
+
+
+
T3 QJ (Ua, cdO CO M I—I cd<d -h d T3< Q
£a;Cu
& oCL) T 3a, *h S XJ< c
cducd
o § cu *-)
a>
£
Q)U•H43OO
<!
Sa)cu
+J<uco
cucdu■u
oo
PQ+ + +
+ + + + +
+ + + + +
+ + + +CO00a•H
+ + + + S<uCO
a.cdM4_>
o0
1CQ
>%cd
PQ
s e e e «oa) a) <u a> cCXi Q* CL. cu CL)
r - l < 1 - < f r r ^ .r - l
*43<U
pJn • • • •u u J-l00 cd cd cd cd
vO i— 1 S S S sr"» 1o C O r * . o r -H«— i T—1 C M CN <N| » ~ l
3»->
!> » c m
X io § ro ►-}
4-J CU
• • • • Q J
00 00 60 4-J CO 3 3 3 D<<J <! <3 <u id r>.
3 *-> oi
I 3<u *-) (33 •—i *~) co
iC O v o C M CSJ
- UCu Cu<v <uCO CO
X—i vo <r
ii00 3 <3 300CNJ t— I
University of Ghana http://ugspace.ug.edu.gh

132
Table A-2. Composition of fish catches at Ampem station during the
period June 1975 - May 1976
Species1975
June-Aug.
1975Sept.-Nov.
Dec.75 Feb.76
1976
Mar.-May
Total
Bagridae
Chrysichthys auratus 122 500 195 132 949
C. walkeri 340 272 170 138 920 4024
C. velifer 804 769 382 188 2143C. furcatus 1 1 1 9 12Bagrus bayad - 4 3 1 8
Auchenoglanis occidentalis 36 66 65 28 195
CichlidaeSarotherodon galilaeus 1134 122 63 57 1376
S. niloticus 182 30 151 6 369Tilapia zilli/melanopleura 33 121 73 42 269Chromidotilapia guntheri 82 196 72 32 382Hemichromis fasciatus 181 140 71 96 488Hemichromis bimaculatus 128 127 103 68 426
AnabantidaeCtenopoma kingsiaye - 3 3
ClupeidaePellonula afzeliusi 29,182 21,594 3449 8902 63,127
Cynothrissa mento 46 104 6 - 156
CyprinidaeLabeo coubie - - 1 - 1Barbus spp 165 9 13 79 266
CentropomidaeLates niloticus 36 134 26 112 308
TetraodontidaeTetraodon fahaka 22 19 14 8 63
CharacidaeHydrocyon brevis 4 7 6 48 65H. lineatus « . 14 5 2 21Alestes macrolepidatus 2 7 2 8 19A. nurse 1 mm 1 2A. baremose 2 _ 2A. dentex A. leuciscus
41
1 1 - 61
University of Ghana http://ugspace.ug.edu.gh

133
Table A-2. Continued
Species1975June-Aug.
1975Sept.-Nov.
Dec.7 5 Feb.76
1976MarMay
Total
Mochokidae
Synodontis schall 279 247 31 15 572S. gambiensis 23 12 - 35S. nigrita 86 8 - 7 101Synodontis spp 1 - 1 1 2
SchilbeidaeSchilbe mystus 4 3 _ 5 12Lutropius niloticus 1 - - - 1Physailia pellucida 751 382 3068 3050 7251
OsteoglossidaeHeterotis niloticus 1 9 1 1 12
CitharinidaeDistichodus rostratus 2 13 3 1 19Paradistichodus dimidiatus 2341 1345 1171 471 5328
MormyridaeMormyrops deliciosus 1 2 - - 3Gnathenemus pictus - 1 1 - 2Mormyrus rume - 1 - 1 2Petrocephalus bov<ei - 6 - 1 7Hyperopisus bebe 19 16 1 4 40Marcusenius sp - 2 2 1 5
PolypteridaePolypterus senegalensis 86 9 1 17 113
ClariidaeClarias lazera Clarias sp
11
- - - 11
Heterobranchus bidorsalis 1 3 - 4
GymnarchidaeGymnarchus niloticus 9 7 17 3 36
Ophiocephalus obscurus 14 2 2 11 29
MalapteruridaeMalapterurus electricus 10 5 - 2 17
85,170
University of Ghana http://ugspace.ug.edu.gh

Table A-3. Distribution of Chrysichthys in Volta Lake during the period Jan. - May 1970 (Data extracted and reprocessed from Loiselle
(1972) , numbers and weight (grams)
C # auratus C. walkeri
Area No. % Wt. % No. % Wt. %
Adowso 1 - - - - 1 0.4 56 3.0
Suborni Junction 1 268 43.3 2965 34.7 1 0.2 1160 13.6
Kwame Jamara 1 1 0.3 281 14.7
Asekoko 2 234 68.4 186 5 65.2
Ajena Bay 2 9 0.2 65 2.2
Ajena Bay SE 2 1 4.0 9 6.9Abotere 2Agornyomi No. 1 3 25 22.5 130 8.8Agornyomi No. 2 3 27 44.3 155 21.3Mangoose 3 36 36 .4 335 13.2 1 1.0 10 0.4Second Dodi 3Tsikpor 3 14 4.5 69 1.3Breniasi 4Azizakpoe 4Kpetsu 5Dumbai 5Lidza 5Boafori 6Lanto No. 1 7Lanto No. 2 7Lanto No. 3 7 66 5.7 1476 3.8Awoyorvikope 7Accra Town 7 4 1.3 300 14.4
Av. biomass per station = 1458.— = 63.42 gm •
23
University of Ghana http://ugspace.ug.edu.gh

No.
10341
67
4268
542627
62110
4217
368
135
c . velifer C. furcatus kg/ha
% Wt. % No. % Wt. %
4.3 140 7.4 9.70
55.0 4285 50.2 641.92_ 16.90
19.6 685 23.9 254.02
0.9 830 28.0 66.31
23.0 68 52.3 5.68
5.0 200 20.8 9.56
48.6 550 37.3 31.62
42.6 269 36.9 42.42
27.3 580 22.8 92.63
27.3 930 28.9 2 0.9 120 3.7 97.18
35.1 473 8.8 57.52
25.3 532 26.8 14.78
5.1 182 8.7 4.04
58.9 1200 48.4 13.35
52 33.1 1140 14.0 61.41
7.9 26 18.3 3.27
3.3 1172 3.0 4.76ap - -
31.66
University of Ghana http://ugspace.ug.edu.gh

136
Table A-4. Numbers of Chrysichthys and other species in catches in Areas3 , 7 and 8 during August 1974 to May 1975 (Catches by gill nets,
excluding 13 mm mesh, traps and rotenone)
Family and species Area________ Total______7a 7 ^ 8^ SPP Family
Osteoglossidae
Heterotis niloticus
Mormyr.idaePetrocephalus bovei Hyperopisus bebe Mormyrus rume M # deliciosus Gnathonemus harringtoniG. tamandua
ClupeidaeCynothrissa mento
Characidae Hydrocynus brevisH. lineatus A. dentex A. baremoseA. macrolepidotus A. leuciscus A. nurseMicralestes a cu tidens
Citharinidae Citharinus citharus C. latusDistichodus rostratus
Schilbeidae Schilbe mystus Eu t ropius niloticus
1 1
10 101 11 11 1 23 1 42 2
4 4 8
6 1 72 16 11 294 40 17 61
6 10 161 8 2 114 18 13 353 3 16 22
2 11 13
1 5 6
2 7 9
64 641 22 40 63
20
194
15
127
aMeans o f capture: traps and rotenone,
bMeans o f capture: g i l l n ets.
University of Ghana http://ugspace.ug.edu.gh

137
Table A-4. Continued
Family and species Area Total
3a 7b 8b spp Family
Mochokidae 41
Synodontis membranaceous 3 2 5
S. nigrita 1 1
S. schall 9 2 2 13
S. gambiensis 21 21
S. eupterus 1 1
Cichlidae 36
Hemichromis fasciatus 6 6 12H. bimaculatus 2 2Chromidotilapia guntheri 3 2 5Sarotherodon galilaeus 4 1 5S. niloticus 7 7Tilapia zilli 5 5
Malapteruridae 4Malapterurus electricus 4 4
Centropomidae 11Lates niloticus 4 7 11
Bagridae 518Bagrus bayad 3 3Auchenoglanis occidentalis 1 1Chrysichthys auratus 23 3 26C. walkeri 159 12 1 172C. velifer 25 34 59C. furcatus 2 1 3Chrysichthys spp 254 254
Cyprinidae 12Labeo brachypoma 1 1L. seneealensis 1 3 4L. coubie 6 1 7
987
University of Ghana http://ugspace.ug.edu.gh

12345
6789
10
1112131415
1617181920
2223
138
imtu from Chrvsichthys v e l i f e r fem ales used to estim ate r e la tive fecundity b a sed ^ n (1 J length and (2 ) weight
Standard Weight No. of Relative Relativelength (gm) eggs fecundity fecundity
(mm) (no./mm) (no./gr)
( 1 ) (2 )
132 50 1263 9 25
145 65 2927 20 45
153 60 1880 12 31
16 0 70 1145 7 18
16 5 85 1549 9 39
170 85 3349 19 42
170 105 4439 26 42
183 110 2597 14 23185 109 2343 12 21185 112 7956 43 71
190 130 3547 18 27
190 136 1635 8 12195 150 4354 22200 150 2875 14 29205 180 2049 10 11
205 190 4060 19 21220 200 3600 16 18220 180 4752 21 26221 205 4110 18 20225 200 4866 21 24
315 525 8982 28 17347 730 106 56 30 14
University of Ghana http://ugspace.ug.edu.gh

139
Table A-6. Data from Chrysichthys walkeri females used to estimate relative fecundity based on (l7 length and (2) weight
Specimen Standardlength(mm)
Weight(gtn)
No. of eggs
Relative fecundity (no./mm)
(1)
Relativefecundity(no./gr)
(2)
1 79 270 3 .
2 80 12 600 7 503 88 24 698 8 294 95 - 325 3 -
5 102 30 580 6 19
6 118 30 1038 9 347 120 - 1180 10 -
8 120 - 1520 12 -
9 122 - 800 7 -
10 122 45 980 8 21
11 125 43 600 5 1412 125 45 1532 12 3413 130 45 895 7 2014 130 - 1264 10 -
15 130 48 875 7 20
16 132 _ 1980 15 _
17 132 46 1084 8 2418 133 45 1134 8 2519 134 46 1000 7 2220 140 55 1382 10 25
21 140 2120 1522 140 55 950 7 1923 142 55 1280 9 2224 147 60 1200 8 2025 150 70 2530 17 3626 170 95 2690 16 28
University of Ghana http://ugspace.ug.edu.gh

140
Table A- 7 . Data from Chrysichthys auratus fem ales used to estim ate r e la t iv e fecundity based on ( l ) length and (2 ) weight
Specimen Std. length (mm)
Weight
(gm)
Number of oocytes
Relative No./mm
fecundityNo./gm
-------------
1 78 218 2.79
2 89 249 2.80 -
3 92 10 426 4.63 42.6
4 99 - 396 4.00 -
5 101 376 3.72 -
6 102 - 383 3.75 -
7 105 - 642 6.11 -
8 105 . 374 3.55 -
9 112 30 914 8.16 30.47
I
Table A-8.& Data from Chrysichthys furcatus females used to estimate relative fecundity based on (1) length and (2) weight
Specimen Std. length Weight Number of Relative fecundity(mm) (gm) oocytes No./mm No./gm
1 160 110 1234 7.71 11.222 195 160 599 3.07 3 .743 195 160 679 3.48 4.344 335 565 15938 47.58 28.21
University of Ghana http://ugspace.ug.edu.gh