boosting the earnings and employment of low-skilled
TRANSCRIPT

Upjohn Institute Press
Boosting the Earnings and Employment of Low-Skilled Workers in the United States: Making Work Pay and Removing Barriers to Employment and Social Mobility Steven Raphael University of California, Berkeley
Chapter 7 (pp. 203-304) in: A Future of Good Jobs? : America’s Challenge in the Global Economy Timothy J. Bartik and Susan N. Houseman, eds. Kalamazoo, MI: W.E. Upjohn Institute for Employment Research, 2008 Copyright ©2008. W.E. Upjohn Institute for Employment Research. All rights reserved.
245
7Boosting the Earnings and
Employment of Low-Skilled Workers in the United States
Making Work Pay and Removing Barriers to Employment and Social Mobility
Steven RaphaelUniversity of California, Berkeley
The last few decades of the twentieth century witnessed fairly dra-matic changes in the labor market outcomes and socioeconomic status of American workers at the bottom of the earnings distribution. Earn-ings of the least skilled adults either stagnated or fell. Moreover, labor force participation and employment have declined considerably, sug-gesting a reduction in demand for the labor of the least skilled and an accompanying withdrawal from the labor force on the part of many low-skilled workers unwilling to accept diminished wages.
Certain economy-wide developments have affected the employment prospects of all low-skilled workers regardless of race or gender. For example, the well-documented changes in the earnings distribution be-ginning in the late 1970s have increased the relative returns to postsec-ondary schooling as well as the returns to experience (Katz and Autor 1999).1 Nonetheless, certain social and institutional developments are likely to have had disproportionate impacts on the labor market pros-pects of certain subgroups within the population of low-skilled adults. For example, the prison incarceration rate between the late 1970s and the present more than quadrupled. That has had a disproportionate im-pact on less-educated black men and has left in its wake large groups of less-educated men who are hampered by their criminal histories in their search for employment.2 As a further example, the expansion of the Earned Income Tax Credit (EITC), welfare reform, the Medicaid
tb08fogjch7.indd 245tb08fogjch7.indd 245 9/10/2008 12:50:27 PM9/10/2008 12:50:27 PM
246 Raphael
expansions, and the introduction of the State Children’s Health Insur-ance program (SCHIP) greatly increased the relative returns to work over welfare for poor women with children.
This chapter documents the relative economic performance of low-skilled disadvantaged workers in the United States and identifi es key factors that have either enhanced their economic security or that are becoming increasingly important barriers to steady employment and self-suffi ciency. As the introduction suggests, there are important dif-ferences by gender. Low-skilled men are currently participating in the labor force at rates that are extremely low by historical comparison, which suggests that procuring and maintaining steady employment has become a serious problem for this particular group. The analysis be-low demonstrates that the unprecedented decline in employment and participation among men is only partially explained by the decline in earnings potential. Thus, boosting the employment rates of low-skilled men will require both supply-side incentives that make work pay and demand-side efforts aimed at increasing employer willingness to hire from this particular labor pool.
Low-skilled women have fared better in recent decades, experienc-ing more modest declines in earnings and changes in employment rang-ing from modest decreases to substantial increases. The greatest gains in employment are found for those women most likely to have been affected by the institutional changes to the nation’s safety net during the 1990s, in particular poor and near-poor women with children.
I analyze and offer several policy proposals designed to boost the employment and earnings of the least-skilled workers. First, I discuss several recent proposals to substantially expand the Earned Income Tax Credit (EITC) for childless adults. I analyze the likely costs of these proposals, the degree to which the expansions would actually benefi t workers at the bottom of the income distribution, the potential effect of such expansions on the incentive to marry, and the likely impact on take-home earnings and employment. My preferred proposal is a hybrid of two proposals, one by Edelman, Holzer, and Offner (2006) and the other by Berlin (2007). It combines an expanded credit for childless adults with a targeted liberalization of the benefi ts calculation for the poorest married couples. While the employment effects of such an ex-pansion are likely to be modest, the impact on annual income and mate-rial poverty is substantial and would go part of the way toward reducing
tb08fogjch7.indd 246tb08fogjch7.indd 246 9/10/2008 12:50:34 PM9/10/2008 12:50:34 PM
Boosting the Earnings of Low-Skilled Workers in the U.S. 247
the real decline in earnings experienced by low-skilled workers over the past three decades. Moreover, modest changes to the current system could eliminate the marriage penalty inherent in the EITC for the poor-est couples at relatively little public expense.
Second, I offer several policy proposals intended to remove some of the educational and employment barriers that hinder the reentry of former prison inmates into mainstream society. Specifi cally, I propose that
• Summary disqualifi cation of former inmates and those with fel-ony convictions from participating in federal public assistance programs and from receiving fi nancial aid for education should be reversed.
• Employment bans based on former convictions and occupational licensing restrictions should be based on the content of one’s criminal record and not applied in a blanket manner. Moreover, when used, employment bans should be based on conviction rather than arrest records. Any bans on the employment of felons mandated by law should be based on the content of one’s previ-ous behavior as well as the time that has elapsed.
• We should increase investment in labor market intermediaries that specialize in building relationships with employers willing to hire ex-offenders and in placing former inmates into sustain-able employment.
• States should incentivize desistance from criminal activity by expunging certain criminal records after a fi xed time period has elapsed.
While the challenges faced by former inmates in the legitimate la-bor market are many, these modest proposals would eliminate key bar-riers to employment that affect increasing proportions of low-skilled men, at little cost in terms of public safety.
tb08fogjch7.indd 247tb08fogjch7.indd 247 9/10/2008 12:50:34 PM9/10/2008 12:50:34 PM

248 Raphael
WHO ARE THE LOW-EARNERS IN THE UNITED STATES AND HOW HAVE THEY FARED?
Here I use data from the 1980, 1990, and 2000 Public Use Micro-data Samples (PUMS) from the U.S. Census of Housing and Popula-tion to characterize the low-wage population and to document recent trends in earnings, employment, and institutionalization rates. I restrict the analysis to adults 18 to 55 years of age that are out of school, that are not in the military, and that do not report self-employment income. I measure each person’s hourly earnings by dividing total annual wage and salary earnings by total annual hours worked (measured by weeks worked last year multiplied by usual hours worked). For those individu-als who did not work in the previous year or who are institutionalized at the time of interview, I compute hourly earnings by assigning the median hourly wage for workers in the same year, gender, race or eth-nicity, education, and labor market experience group.3 Thus, average wages for all workers in the sample measure the actual wages for some and the potential earnings of those who do not participate in the labor force, based on the earnings of comparable individuals employed at some point during the year.
An important strength of the PUMS data concerns the fact that the data covers the institutionalized population (including inmates in jails and prisons and inpatients in mental hospitals) as well as the noninsti-tutionalized. As I discuss below, the institutionalized population now makes up a sizable proportion of many demographic subgroups among the low-skilled adult population. Thus, the ability to characterize insti-tutionalization trends is central to fully comprehending the current state of the low-skilled adult population in the United States.
Who Are the Low-Earning Adults in the United States?
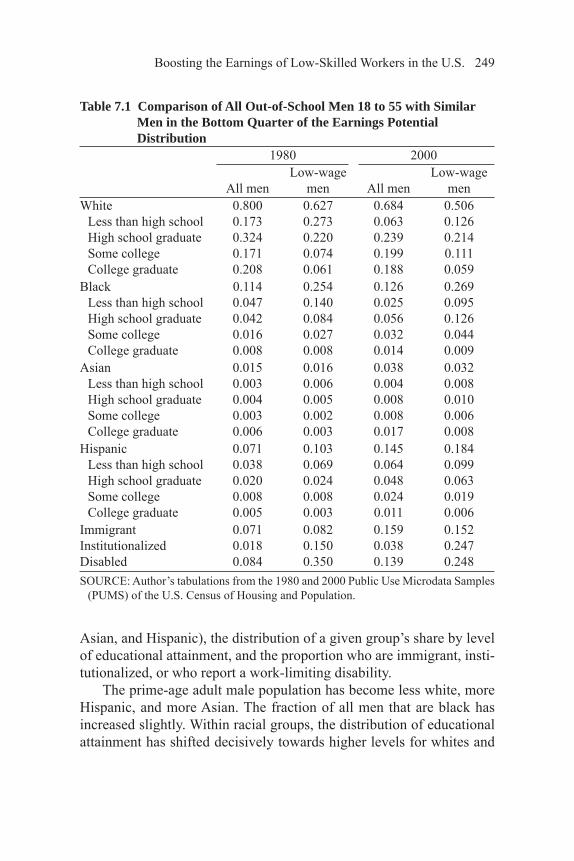
Tables 7.1 and 7.2 describe how the distributions of the male (Table 7.1) and female (Table 7.2) populations have changed between 1980 and 2000 for all adults in my sample and for adults in the bottom quarter of the earnings potential distribution. Each table presents the proportion of the population accounted for by four mutually exclusive racial or ethnic groups (non-Hispanic white, non-Hispanic black, non-Hispanic
tb08fogjch7.indd 248tb08fogjch7.indd 248 9/10/2008 12:50:34 PM9/10/2008 12:50:34 PM
Boosting the Earnings of Low-Skilled Workers in the U.S. 249
Asian, and Hispanic), the distribution of a given group’s share by level of educational attainment, and the proportion who are immigrant, insti-tutionalized, or who report a work-limiting disability.
The prime-age adult male population has become less white, more Hispanic, and more Asian. The fraction of all men that are black has increased slightly. Within racial groups, the distribution of educational attainment has shifted decisively towards higher levels for whites and
Table 7.1 Comparison of All Out-of-School Men 18 to 55 with Similar Men in the Bottom Quarter of the Earnings Potential Distribution
1980 2000
All menLow-wage
men All menLow-wage
menWhite
Less than high schoolHigh school graduateSome collegeCollege graduate
0.8000.1730.3240.1710.208
0.6270.2730.2200.0740.061
0.6840.0630.2390.1990.188
0.5060.1260.2140.1110.059
BlackLess than high schoolHigh school graduateSome collegeCollege graduate
0.1140.0470.0420.0160.008
0.2540.1400.0840.0270.008
0.1260.0250.0560.0320.014
0.2690.0950.1260.0440.009
AsianLess than high schoolHigh school graduateSome collegeCollege graduate
0.0150.0030.0040.0030.006
0.0160.0060.0050.0020.003
0.0380.0040.0080.0080.017
0.0320.0080.0100.0060.008
HispanicLess than high schoolHigh school graduateSome collegeCollege graduate
0.0710.0380.0200.0080.005
0.1030.0690.0240.0080.003
0.1450.0640.0480.0240.011
0.1840.0990.0630.0190.006
ImmigrantInstitutionalizedDisabled
0.0710.0180.084
0.0820.1500.350
0.1590.0380.139
0.1520.2470.248
SOURCE: Author’s tabulations from the 1980 and 2000 Public Use Microdata Samples (PUMS) of the U.S. Census of Housing and Population.
tb08fogjch7.indd 249tb08fogjch7.indd 249 9/10/2008 12:50:34 PM9/10/2008 12:50:34 PM

250 Raphael
blacks. Across groups, Hispanics constitute an increasing proportion of those with the lowest level of educational attainment. In addition to these changes, the proportion of immigrants among the male population has more than doubled, the proportion with a work-limiting disabil-ity has increased by over 60 percent, and the proportion in institutions has increased by over 200 percent. The change in the proportion that is institutionalized refl ects the net effect of two offsetting trends: the
Table 7.2 Comparison of All Out-of-School Women 18 to 55 with Similar Women in the Bottom Quarter of the Earnings Potential Distribution
1980 2000
All womenLow-wage
women All womenLow-wage
womenWhite
Less than high schoolHigh school graduateSome collegeCollege graduate
0.7980.1610.3870.1360.114
0.7720.2260.3670.1080.072
0.6950.0510.2300.2250.193
0.6170.0950.2400.1680.118
BlackLess than high schoolHigh school graduateSome collegeCollege graduate
0.1180.0430.0480.0170.010
0.1260.0650.0470.0110.004
0.1310.0190.0530.0410.019
0.1360.0390.0640.0270.007
AsianLess than high schoolHigh school graduateSome collegeCollege graduate
0.0170.0040.0050.0030.005
0.0170.0050.0060.0030.004
0.0430.0060.0100.0090.018
0.0520.0100.0140.0100.018
HispanicLess than high schoolHigh school graduateSome collegeCollege graduate
0.0660.0350.0210.0070.003
0.0840.0540.0220.0050.002
0.1250.0480.0410.0250.012
0.1870.1000.0580.0220.009
ImmigrantInstitutionalizedDisabled
0.0750.0040.069
0.0880.0100.131
0.1480.0050.112
0.2190.0180.143
SOURCE: Author’s tabulations from the 1980 and 2000 Public Use Microdata Samples (PUMS) of the U.S. Census of Housing and Population.
tb08fogjch7.indd 250tb08fogjch7.indd 250 9/10/2008 12:50:34 PM9/10/2008 12:50:34 PM
Boosting the Earnings of Low-Skilled Workers in the U.S. 251
proportion of the male population in mental hospitals has declined con-tinuously since 1980, while the proportion in local jails and state and federal prisons has greatly increased (Raphael and Stoll 2007).
For men in the bottom quarter of the earnings distribution there are some notable facts. In both 1980 and 2000, racial and ethnic minorities are considerably overrepresented among low earners while white males are underrepresented. Changes between 1980 and 2000 have reinforced this pattern: there has been a decline in the proportion that is white of 0.12, an increase in the proportion that is black of 0.015, an increase in the proportion that is Asian of 0.016, and an increase in the proportion that is Hispanic of 0.081. Low earners are considerably more educated on average in 2000 than they were in 1980. Roughly 49 percent of low-earning males in 1980 had less than a complete high school education, compared to 33 percent in 2000. Conversely, the proportion with a high school diploma increased from 33 to 41 percent. In contrast to the over-all trend, the proportion of low-earning workers with a work-limiting disability declined from 0.35 to 0.25.
One of the most dramatic differences between the trends for low-income men and the trends for all men concerns the large absolute in-crease in institutionalization rates. In 2000, nearly one quarter of men whose earnings potential fell in the bottom quarter of the earnings dis-tribution were institutionalized, and most of these men were in state or federal prisons or jail. This represents a nearly 10-percentage-point increase since 1980.
For women, Table 7.2 reveals that the overall distributions of the adult female population across racial or ethnic groups and levels of educational attainment are comparable to those of men (as shown in Table 7.1) in both years. For low-wage women, however, white wom-en account for much larger proportions of the low-wage population in both years as compared to men. The proportion of immigrants and the proportion of disabled increase for women overall. Among low-wage women, the proportion that is immigrant more than doubles while the proportion with work-limiting disabilities increases slightly. The most notable difference relative to men concerns institutionalization trends. There is a very slight increase from a very low level in 1980 in the over-all proportion of women in institutions (from 0.004 to 0.005). Among low-earnings women, the increase is larger (from 0.010 to 0.018), yet much smaller than that observed for men.
tb08fogjch7.indd 251tb08fogjch7.indd 251 9/10/2008 12:50:35 PM9/10/2008 12:50:35 PM

252 Raphael
Trends in Wages, Employment, and Institutionalization for Disaggregated Subgroups
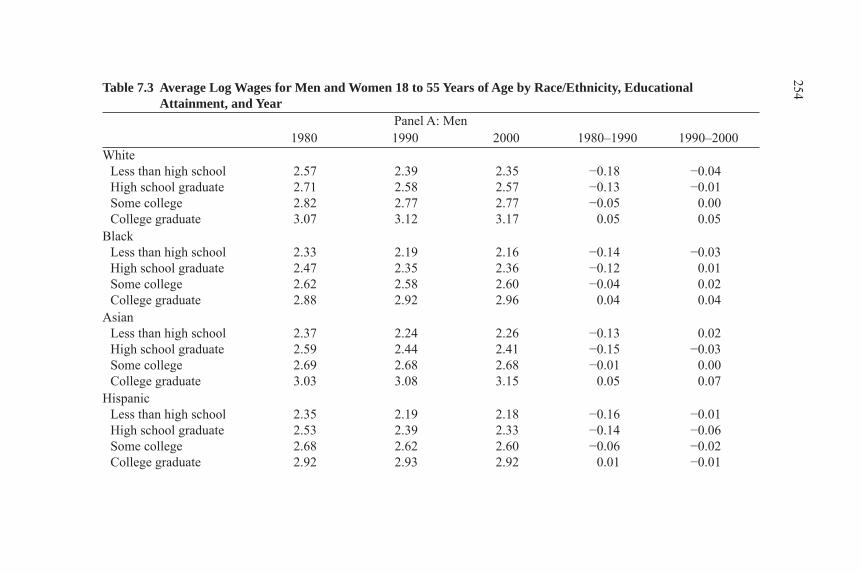
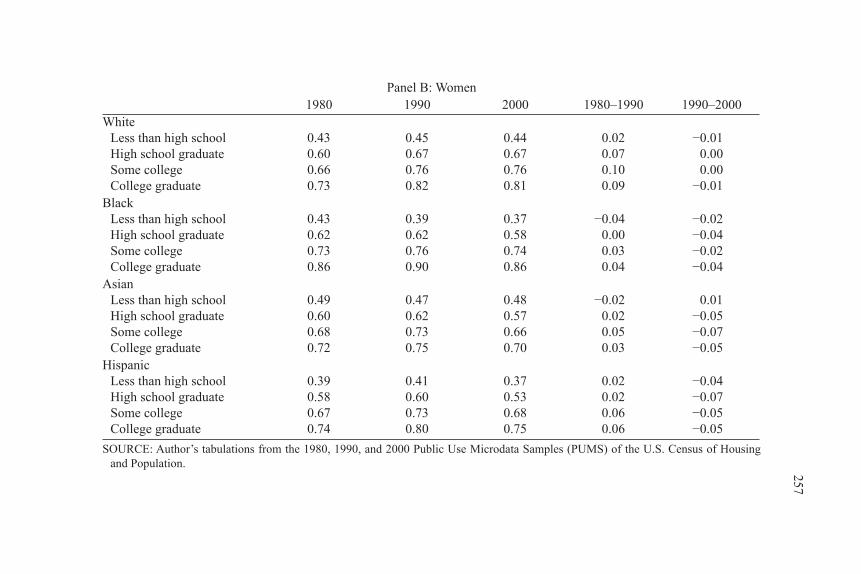
Table 7.3 presents the average log wages for men and women for 1980, 1990, and 2000 by race or ethnicity and by level of educational attainment; it also shows the change for each decade. Note that since wages are expressed in logs, the change between any two years is ap-proximately equal to the proportional change in hourly earnings. For the entire period, potential wages decline for all men who do not have a college degree or more, and the largest declines occur for men with less than a complete high school education. Among the least educated white men, wages decline by roughly 22 percent between 1980 and 2000, with most of the decline occurring during the 1980s. For black and Hispanic high school dropouts, hourly wages decline overall by 17 percent, again with most of the wage loss occurring in the earlier decade. There are also sizable declines in the hourly wages of male high school graduates. These patterns clearly reveal the growing returns to education among men and are consistent with the fi ndings of previous research.4
Wage trends for women are quite different from those for men. Per-haps the most notable differences pertain to wage levels for a given group and at a given point in time. There are large intergender disparities favor-ing males in each year within each race or ethnicity education group. However, these within-group disparities decline between 1980 and 2000.
The declines in hourly wages for women with the least skills are considerably more modest than the comparable declines experienced by men. For example, the hourly wages of white women with less than a high school diploma declined by 10 percent between 1980 and 1990 and then increased by 3 percent over the subsequent decade. The com-parable changes for similarly educated white men are declines of 18 percent between 1980 and 1990 and 4 percent thereafter. Similarly, the hourly wages of white female high school graduates increased by roughly 2 percent between 1980 and 2000 while the wages of corre-sponding white men declined by 14 percent.
Prior research on the labor supply responses of men and women suggests that declines in hourly wages should result in a decline in em-ployment among those experiencing the wage change. A decrease in wages reduces the rate at which an individual can convert his nonmar-ket time into money by supplying his time to the formal labor market.
tb08fogjch7.indd 252tb08fogjch7.indd 252 9/10/2008 12:50:35 PM9/10/2008 12:50:35 PM
Boosting the Earnings of Low-Skilled Workers in the U.S. 253
To the extent that people value their time, a decline in the wages that one’s labor will command is likely to induce one to either supply less time or withdraw from the labor force entirely.5 Thus, in conjunction with the patterns in Table 7.3, this simple theory predicts that employ-ment rates should have declined considerably for low-skilled men and less so for low-skilled women.
Indeed, employment does tend to decline for those demographic groups experiencing the largest declines in earnings. Table 7.4 presents the proportion of each group employed at the time of the census inter-view for the same race/ethnicity-education-gender groups displayed in Table 7.3. There are sizable declines in the employment rates of the least skilled male workers. Between 1980 and 2000, the employment rate for white high school dropouts declined by 14 percentage points, while employment for white high school graduates fell roughly 7 per-centage points. For black men, there are large declines in employment for all groups with the exception of college-educated black men, and there is an especially large decline (27 percentage points) for black high school dropouts. By 2000, only one-third of prime-age, black male high school dropouts were employed on a given day, compared to nearly two-thirds in 1980.
For the least skilled men the declines in employment rates during the 1990s are of equal magnitude to, or larger than, the declines ob-served during the 1980s. By contrast, nearly all of the wage losses for these groups occur during the 1980s, suggesting that factors beyond declining wages are also driving the poor employment outcomes of less-skilled men.
Low-earning women experienced smaller wage losses than men from comparable demographic groups and with similar levels of edu-cational attainment, and thus one would expect a priori that declines in employment would be more modest for women. In fact, with the excep-tion of black and Asian women having less than a high school degree, the employment rates of all groups increased during the 1980s. Juhn and Potter (2006) demonstrate that this increase in labor force participa-tion represents the tail end of a long trend towards greater participation among women of all skill levels. Between 1990 and 2000, this trend appears to have slowed, with modest to moderate declines in employ-ment among women from all racial or ethnic groups and all levels of educational attainment.
tb08fogjch7.indd 253tb08fogjch7.indd 253 9/10/2008 12:50:35 PM9/10/2008 12:50:35 PM
254
Table 7.3 Average Log Wages for Men and Women 18 to 55 Years of Age by Race/Ethnicity, Educational Attainment, and Year
Panel A: Men1980 1990 2000 1980–1990 1990–2000
WhiteLess than high schoolHigh school graduateSome collegeCollege graduate
2.572.712.823.07
2.392.582.773.12
2.352.572.773.17
−0.18−0.13−0.05
0.05
−0.04−0.01
0.000.05
Black Less than high schoolHigh school graduateSome collegeCollege graduate
2.332.472.622.88
2.192.352.582.92
2.162.362.602.96
−0.14−0.12−0.04
0.04
−0.030.010.020.04
AsianLess than high schoolHigh school graduateSome collegeCollege graduate
2.372.592.693.03
2.242.442.683.08
2.262.412.683.15
−0.13−0.15−0.01
0.05
0.02−0.03
0.000.07
HispanicLess than high schoolHigh school graduateSome collegeCollege graduate
2.352.532.682.92
2.192.392.622.93
2.182.332.602.92
−0.16−0.14−0.06
0.01
−0.01−0.06−0.02−0.01
tb08fogjch7.indd 254tb08fogjch7.indd 254
9/10/2008 12:50:35 PM9/10/2008 12:50:35 PM

255
Panel B: Women1980 1990 2000 1980–1990 1990–2000
WhiteLess than high schoolHigh school graduateSome collegeCollege graduate
2.092.242.382.68
1.992.212.412.79
2.022.262.472.87
−0.10−0.03
0.030.11
0.030.050.060.08
BlackLess than high schoolHigh school graduateSome collegeCollege graduate
2.042.212.352.75
1.962.152.372.82
2.002.192.442.86
−0.08−0.06
0.020.07
0.040.040.070.04
AsianLess than high schoolHigh school graduateSome collegeCollege graduate
2.132.292.412.69
2.072.252.492.79
2.102.262.532.91
−0.06−0.04
0.080.10
0.030.010.040.12
HispanicLess than high schoolHigh school graduateSome collegeCollege graduate
2.042.212.332.61
1.952.162.372.74
1.962.162.402.76
−0.09−0.05
0.040.13
0.010.000.030.02
SOURCE: Author’s tabulations from the 1980, 1990, and 2000 Public Use Microdata Samples (PUMS) of the U.S. Census of Housing and Population.
tb08fogjch7.indd 255tb08fogjch7.indd 255
9/10/2008 12:50:36 PM9/10/2008 12:50:36 PM

256 Table 7.4 Proportion Employed for Men and Women 18 to 55 Years of Age by Race/Ethnicity, Educational
Attainment, and YearPanel A: Men
1980 1990 2000 1980–1990 1990–2000White men
Less than high schoolHigh school graduateSome collegeCollege graduate
0.750.870.910.95
0.680.860.910.95
0.610.800.880.94
−0.07−0.01
0.000.00
−0.07−0.06−0.03−0.01
Black Less than high schoolHigh school graduateSome collegeCollege graduate
0.600.730.790.89
0.460.660.760.89
0.330.570.710.86
−0.14−0.07−0.03
0.00
−0.13−0.09−0.05−0.03
AsianLess than high schoolHigh school graduateSome collegeCollege graduate
0.750.840.910.94
0.690.830.900.93
0.630.730.800.89
−0.06−0.01−0.01−0.01
−0.06−0.10−0.10−0.04
HispanicLess than high schoolHigh school graduateSome collegeCollege graduate
0.770.830.880.92
0.730.790.860.92
0.640.690.790.86
−0.04−0.04−0.02
0.00
−0.09−0.10−0.07−0.06
tb08fogjch7.indd 256tb08fogjch7.indd 256
9/10/2008 12:50:36 PM9/10/2008 12:50:36 PM
257
Panel B: Women1980 1990 2000 1980–1990 1990–2000
WhiteLess than high schoolHigh school graduateSome collegeCollege graduate
0.430.600.660.73
0.450.670.760.82
0.440.670.760.81
0.020.070.100.09
−0.010.000.00
−0.01Black
Less than high schoolHigh school graduateSome collegeCollege graduate
0.430.620.730.86
0.390.620.760.90
0.370.580.740.86
−0.040.000.030.04
−0.02−0.04−0.02−0.04
AsianLess than high schoolHigh school graduateSome collegeCollege graduate
0.490.600.680.72
0.470.620.730.75
0.480.570.660.70
−0.020.020.050.03
0.01−0.05−0.07−0.05
HispanicLess than high schoolHigh school graduateSome collegeCollege graduate
0.390.580.670.74
0.410.600.730.80
0.370.530.680.75
0.020.020.060.06
−0.04−0.07−0.05−0.05
SOURCE: Author’s tabulations from the 1980, 1990, and 2000 Public Use Microdata Samples (PUMS) of the U.S. Census of Housing and Population.
tb08fogjch7.indd 257tb08fogjch7.indd 257
9/10/2008 12:50:37 PM9/10/2008 12:50:37 PM
258 Raphael
One interesting pattern evident in Table 7.4 concerns the within-group gender disparities in employment rates. In 1980 and 1990, men are more likely to be employed than comparable women in every group displayed in the table, with the sole exception of black college graduates in 1990. While this gender disparity varies considerably across groups, differentials on the order of 10 to 15 percentage points are typical. In the year 2000, comparable gender differences are observed among whites, Asians, and Hispanics. For blacks, however, the employment rates of males have deteriorated far enough to render the male-female employ-ment rate differentials negative for most educational groups.
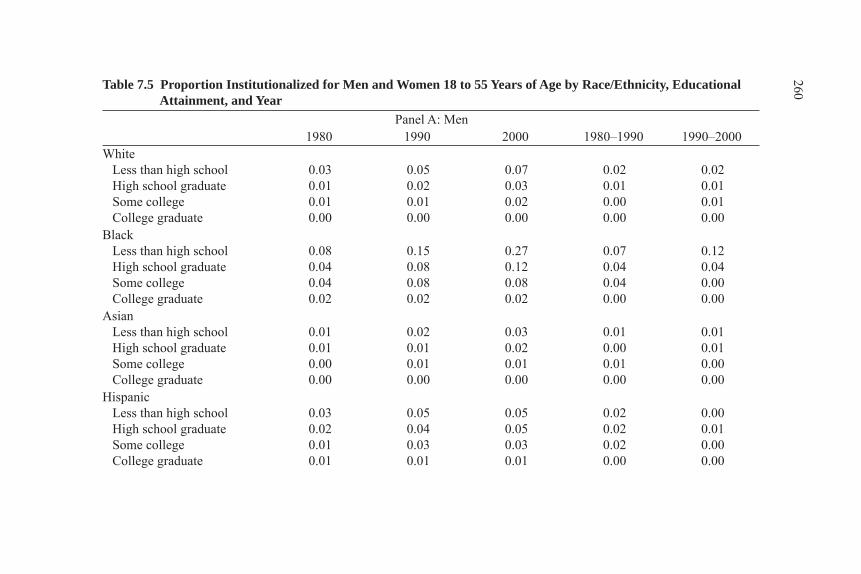
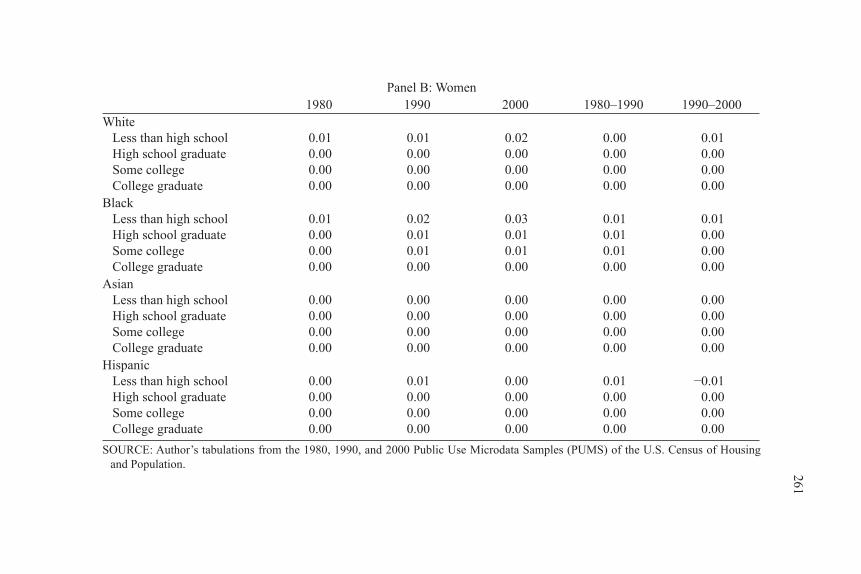
Finally, Table 7.5 presents the proportion institutionalized at the time of the census survey. The proportion institutionalized is composed disproportionately of inmates of local jails and state and federal prisons. The table reveals stark intergender, interracial, and cross-educational group disparities in the incidence of incarceration and the change in this incidence over this two-decade period. The largest increases are observed for black males with less than a high school degree. Between 1980 and 2000, the proportion institutionalized increased from roughly 8 percent to 27 percent of this population, a number similar in magni-tude to the 33 percent of this group that is employed. The incarcera-tion rate for men without a high school diploma more than doubled for whites and Asians, and nearly doubled for Hispanics, although the levels are considerably lower than those observed for blacks. The in-carceration rates for women are quite low, although the rate for black women tripled—from 0.01 to 0.03—between 1980 and 2000.
The proportion of men who have ever served time in prison is cer-tainly larger than the proportion incarcerated at any given point in time. The U.S. prison population is characterized by a high rate of turnover: nearly one-half of the population is released each year, and slightly over half is admitted (Raphael and Stoll 2007). The Bureau of Justice Statis-tics estimates that a black male born in 2001 has a 33 percent chance of serving prison time at some point in his life. The BJS also estimates that roughly 20 percent of all adult black males and 3 to 4 percent of white males have served time at some point in their lives (Bonczar 2003). In previous research on the California state prison system, I estimated the proportion of adults males by race, age, and education who had served time in the state prison system. Roughly one-third of prime-age (25 to 44) white men with less than a high school education had been through
tb08fogjch7.indd 258tb08fogjch7.indd 258 9/10/2008 12:50:37 PM9/10/2008 12:50:37 PM
Boosting the Earnings of Low-Skilled Workers in the U.S. 259
the state prison system. For black men with less than a high school edu-cation, a prior prison spell was nearly certain (Raphael 2006).
These trends indicate that to a greater extent than ever before, low-skilled men who are not institutionalized are likely to have felony con-victions and prison experience in their past. Combined with relatively easy access to criminal records and employers actively screening for this factor, this trend indicates that this particular development has be-come an increasingly important handicap for low-skilled men in the legitimate labor market.
TO WHAT EXTENT DO CHANGES IN WAGES EXPLAIN RECENT EMPLOYMENT AND INCARCERATION TRENDS?
Thus, relatively less-educated men and women have both expe-rienced declines in earnings since 1980, but men have experienced the most severe declines. These wage patterns correspond to uniform decreases in the employment rates of the least educated men, includ-ing particularly large declines for black men, and mixed patterns with regard to the changes in employment for the least educated women. Concurrently, the proportion of males incarcerated and not working has increased—by a great amount for certain subgroups (black men in par-ticular), and by a more moderate yet signifi cant amount for less-skilled men more generally.
Certainly, these changes in earnings, employment, and institution-alization rates are related, and the causality runs in multiple directions. Declining wages are likely to induce some to withdraw from the labor force. Moreover, decreases in the returns to legitimate work increase the relative returns to criminal activity, a factor that will increase the proportion of the population at risk of becoming incarcerated and, ul-timately, the incarceration rate. Finally, men fail to accumulate human capital while incarcerated (Raphael 2006), may be stigmatized by the label of ex-offender when seeking legitimate employment (Holzer, Ra-phael, and Stoll 2006, 2007; Pager 2003), and may experience an ero-sion of their legitimate work skills and an augmentation of their propen-sity to engage in crime while incarcerated. These factors are all likely to negatively infl uence employment and earnings.
tb08fogjch7.indd 259tb08fogjch7.indd 259 9/10/2008 12:50:37 PM9/10/2008 12:50:37 PM
260 Table 7.5 Proportion Institutionalized for Men and Women 18 to 55 Years of Age by Race/Ethnicity, Educational
Attainment, and YearPanel A: Men
1980 1990 2000 1980–1990 1990–2000White Less than high school High school graduate Some college College graduate
0.030.010.010.00
0.050.020.010.00
0.070.030.020.00
0.020.010.000.00
0.020.010.010.00
Black Less than high school High school graduate Some college College graduate
0.080.040.040.02
0.150.080.080.02
0.270.120.080.02
0.070.040.040.00
0.120.040.000.00
Asian Less than high school High school graduate Some college College graduate
0.010.010.000.00
0.020.010.010.00
0.030.020.010.00
0.010.000.010.00
0.010.010.000.00
Hispanic Less than high school High school graduate Some college College graduate
0.030.020.010.01
0.050.040.030.01
0.050.050.030.01
0.020.020.020.00
0.000.010.000.00
tb08fogjch7.indd 260tb08fogjch7.indd 260
9/10/2008 12:50:37 PM9/10/2008 12:50:37 PM
261
Panel B: Women1980 1990 2000 1980–1990 1990–2000
White Less than high school High school graduate Some college College graduate
0.010.000.000.00
0.010.000.000.00
0.020.000.000.00
0.000.000.000.00
0.010.000.000.00
Black Less than high school High school graduate Some college College graduate
0.010.000.000.00
0.020.010.010.00
0.030.010.010.00
0.010.010.010.00
0.010.000.000.00
Asian Less than high school High school graduate Some college College graduate
0.000.000.000.00
0.000.000.000.00
0.000.000.000.00
0.000.000.000.00
0.000.000.000.00
Hispanic Less than high school High school graduate Some college College graduate
0.000.000.000.00
0.010.000.000.00
0.000.000.000.00
0.010.000.000.00
−0.010.000.000.00
SOURCE: Author’s tabulations from the 1980, 1990, and 2000 Public Use Microdata Samples (PUMS) of the U.S. Census of Housing and Population.
tb08fogjch7.indd 261tb08fogjch7.indd 261
9/10/2008 12:50:37 PM9/10/2008 12:50:37 PM
262 Raphael
The fi rst two factors suggest that diminished wages are likely to be partially responsible for the low employment rates of low-skilled men and perhaps for their newly high incarceration rates. Put simply, if peo-ple at the bottom of the earnings distribution are not working because working pays less than it used to, and are engaging in more criminal activity as a side product, then addressing this problem requires mak-ing legitimate work pay. Tables 7.3, 7.4, and 7.5 do indeed suggest that those groups suffering the largest wage losses also exhibit the largest employment declines and the largest increases in incarceration, although the patterns across groups and the timing aren’t perfect. Hence, to the extent that society could alter existing taxes and subsidies to improve the take-home pay of low-earning workers, policymakers may be able to turn the tide on some of these more adverse developments.
In this section, I address two related questions that will provide the analytical research fi ndings to more thoroughly investigate this policy idea. Specifi cally, to what extent are recent employment trends driven by falling wages? Concurrently, how much of the increase in institution-alization rates can be attributed to poorer labor market opportunities?
Declining Wages and the Employment Rates of Low-Skilled Men and Women
To assess the extent to which declining wages drive declining em-ployment rates, one needs to assess the degree to which labor supply behavior is responsive to changes in potential earnings. The theoretical concept used by economists to describe this behavioral response is the labor supply elasticity. The supply elasticity is defi ned as the percentage change in employment among a given group caused by a 1-percentage-point change in wages.
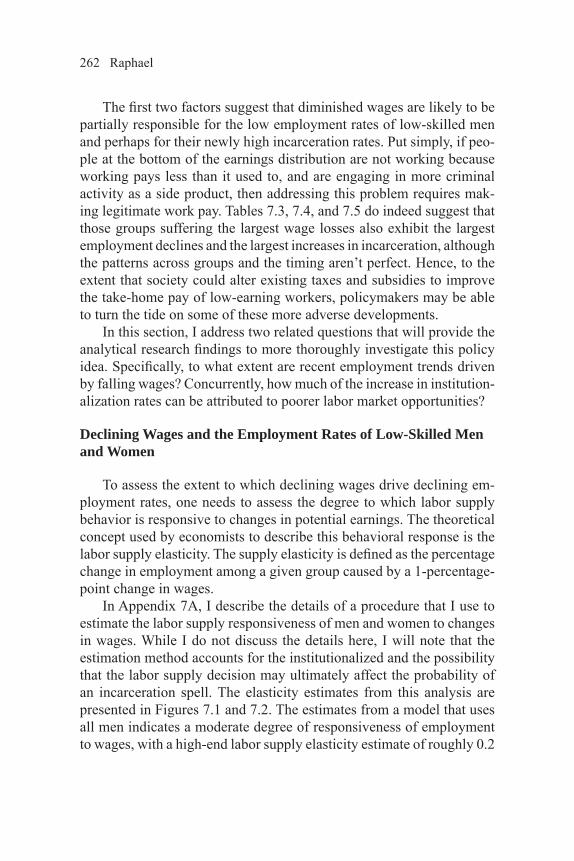
In Appendix 7A, I describe the details of a procedure that I use to estimate the labor supply responsiveness of men and women to changes in wages. While I do not discuss the details here, I will note that the estimation method accounts for the institutionalized and the possibility that the labor supply decision may ultimately affect the probability of an incarceration spell. The elasticity estimates from this analysis are presented in Figures 7.1 and 7.2. The estimates from a model that uses all men indicates a moderate degree of responsiveness of employment to wages, with a high-end labor supply elasticity estimate of roughly 0.2
tb08fogjch7.indd 262tb08fogjch7.indd 262 9/10/2008 12:50:38 PM9/10/2008 12:50:38 PM
Boosting the Earnings of Low-Skilled Workers in the U.S. 263
(indicating that a 10 percent decrease in wages would cause a 2 percent decrease in employment). Race-specifi c estimates suggest that black men are most responsive to changes in wages.
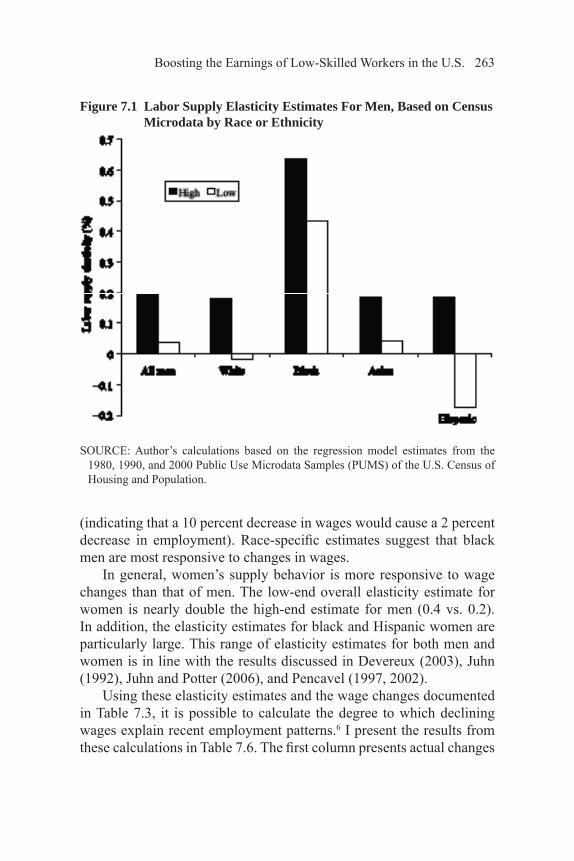
In general, women’s supply behavior is more responsive to wage changes than that of men. The low-end overall elasticity estimate for women is nearly double the high-end estimate for men (0.4 vs. 0.2). In addition, the elasticity estimates for black and Hispanic women are particularly large. This range of elasticity estimates for both men and women is in line with the results discussed in Devereux (2003), Juhn (1992), Juhn and Potter (2006), and Pencavel (1997, 2002).
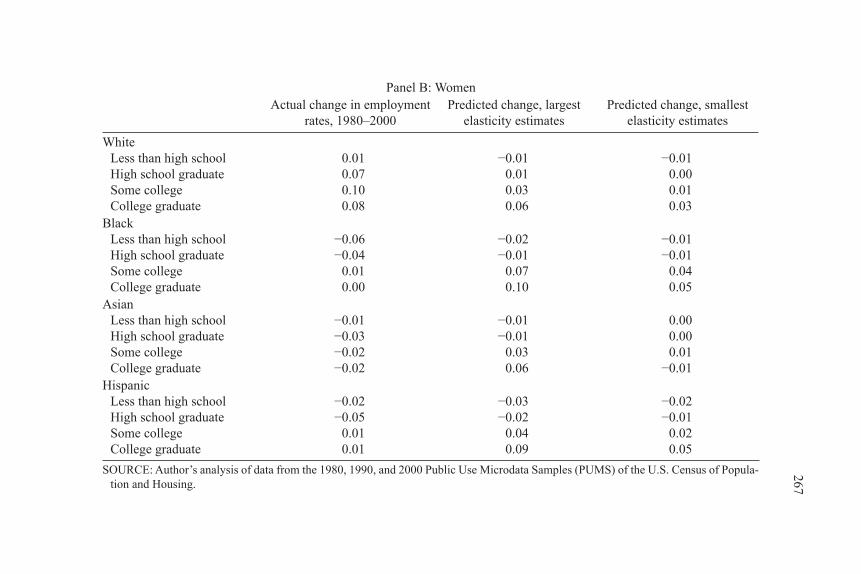
Using these elasticity estimates and the wage changes documented in Table 7.3, it is possible to calculate the degree to which declining wages explain recent employment patterns.6 I present the results from these calculations in Table 7.6. The fi rst column presents actual changes
Figure 7.1 Labor Supply Elasticity Estimates For Men, Based on Census Microdata by Race or Ethnicity
SOURCE: Author’s calculations based on the regression model estimates from the 1980, 1990, and 2000 Public Use Microdata Samples (PUMS) of the U.S. Census of Housing and Population.
tb08fogjch7.indd 263tb08fogjch7.indd 263 9/10/2008 12:50:38 PM9/10/2008 12:50:38 PM
264 Raphael
in employment rates between 1980 and 2000 for the race and education groups depicted in Tables 7.3 through 7.5. The second column pres-ents the change in employment predicted by the actual change in wages for this group using the high race-specifi c elasticity estimate from the values presented in Figures 7.1 and 7.2. The fi nal column presents a similar calculation using the low elasticity estimate for the given race and gender group.
For the least educated men, declining earnings explains relatively small, but not unsubstantial, portions of the decline in employment rates. For white men without a high school degree, the predicted changes in employment attributable to declining wages range from no change to a decline of 3 percentage points. For black men without a high school degree, 4 to 6 percentage points of the 27-percentage-point decline can be attributed to a negative supply response to falling wages, constitut-
Figure 7.2 Labor Supply Elasticity Estimates For Women, Based on Census Microdata by Race or Ethnicity
SOURCE: Author’s calculations based on regression model estimates from the 1980, 1990, and 2000 Public Use Microdata Samples (PUMS) of the U.S. Census of Hous-ing and Population.
tb08fogjch7.indd 264tb08fogjch7.indd 264 9/10/2008 12:50:38 PM9/10/2008 12:50:38 PM
Boosting the Earnings of Low-Skilled Workers in the U.S. 265
ing 16 to 22 percent of the decline. Similarly, for black men with high school diplomas (the modal category for this group of men), declining wages explain 3 to 5 percentage points of the 16-percentage-point de-cline between 1980 and 2000 (roughly 18 to 30 percent of the decline). Thus, reversing wage trends for low-skilled men would likely lead to increases in employment rates, but the increases would fall far short of undoing the employment declines witnessed in recent decades.
Among women, only black and Hispanic women experienced sub-stantial declines in employment between 1980 and 2000, and even for these groups, the declines are modest in comparison to those for men. For black women with less than a high school degree, roughly 16 per-cent of the decline in employment is attributable to declining wages. For comparable Hispanic women, however, half to all of declining em-ployment can be attributed to lower wages in 2000.
To be sure, the relative returns to work for the less skilled have been infl uenced by various policy developments over this time period that are not refl ected in their hourly wages. For poor women with children, wel-fare reform, the expansion of the EITC, Medicaid expansions, and the introduction of the State Children’s Health Insurance Program (SCHIP) have greatly increased the returns to work. In fact, with the EITC af-fecting take-home pay by as much as 40 percent for some workers, the hourly wage provides a rather imprecise measure of the marginal return to an additional hour of work for the least skilled women.
The wages of childless men as well as those of men who are non-custodial fathers have not been infl uenced by these developments. In fact, for many of these men, the marginal return to working has likely been eroded by child support policies that garnish the wages of men with arrearages and impose large marginal taxes on legitimate labor market earnings, while (in cases where their former partners and chil-dren are receiving public assistance) passing little to none of the col-lected revenues on to their dependents (Edelman, Holzer, and Offner 2006; Primus 2006). Thus, for low-skilled men as well, observable hourly wages provide a noisy and perhaps biased gauge of the after-tax rewards from work.
Nonetheless, these tabulations do indicate that the phenomenon of falling wages provides a partial explanation for the eroding employ-ment rates of the least skilled, especially for less-educated African Americans.
tb08fogjch7.indd 265tb08fogjch7.indd 265 9/10/2008 12:50:39 PM9/10/2008 12:50:39 PM

266 Table 7.6 Comparison of Actual Changes in Employment Rates to Changes Predicted by Labor Supply Elasticity
EstimatesPanel A: Men
Actual change in employment rates, 1980–2000
Predicted change, largest elasticity estimates
Predicted change, smallest elasticity estimates
WhiteLess than high schoolHigh school graduateSome collegeCollege graduate
−0.14−0.07−0.03−0.01
−0.03−0.02−0.01
0.02
0.000.000.000.00
Black Less than high schoolHigh school graduateSome collegeCollege graduate
−0.27−0.16−0.08−0.03
−0.06−0.05−0.01
0.05
−0.04−0.03−0.01
0.03Asian
Less than high schoolHigh school graduateSome collegeCollege graduate
−0.12−0.11−0.11−0.05
−0.02−0.03
0.000.02
0.00−0.01
0.000.00
HispanicLess than high schoolHigh school graduateSome collegeCollege graduate
−0.13−0.14−0.09−0.06
−0.02−0.03−0.01
0.00
0.020.030.010.00
tb08fogjch7.indd 266tb08fogjch7.indd 266
9/10/2008 12:50:39 PM9/10/2008 12:50:39 PM
267
Panel B: WomenActual change in employment
rates, 1980–2000Predicted change, largest
elasticity estimatesPredicted change, smallest
elasticity estimatesWhite
Less than high schoolHigh school graduateSome collegeCollege graduate
0.010.070.100.08
−0.010.010.030.06
−0.010.000.010.03
Black Less than high schoolHigh school graduateSome collegeCollege graduate
−0.06−0.04
0.010.00
−0.02−0.01
0.070.10
−0.01−0.01
0.040.05
AsianLess than high schoolHigh school graduateSome collegeCollege graduate
−0.01−0.03−0.02−0.02
−0.01−0.01
0.030.06
0.000.000.01
−0.01Hispanic
Less than high schoolHigh school graduateSome collegeCollege graduate
−0.02−0.05
0.010.01
−0.03−0.02
0.040.09
−0.02−0.01
0.020.05
SOURCE: Author’s analysis of data from the 1980, 1990, and 2000 Public Use Microdata Samples (PUMS) of the U.S. Census of Popula-tion and Housing.
tb08fogjch7.indd 267tb08fogjch7.indd 267
9/10/2008 12:50:39 PM9/10/2008 12:50:39 PM

268 Raphael
Declining Wages and the Increased Incarceration Rates of Men
There is now considerable evidence that economically motivated crime increases with unemployment and decreases as average wages rise, especially the average wages of low-skilled workers (Fagan and Freeman 1999; Freeman 1987; Gould, Weinberg, and Mustard 2002; Grogger 1998; and Raphael and Winter-Ebmer 2001). A higher average propensity to commit crimes will result in a larger prison population (Raphael and Stoll 2007). These two effects jointly describe the path-way between the eroding labor market position of low-skilled adults and the increase in incarceration. Simply stated, when work pays less, more people shun work and turn to crime. The more people that com-mit crimes, the higher the proportion at risk for incarceration and the greater the incarceration rate.
In Appendix 7B, I outline a strategy for estimating the effect of the decline in wages described in Table 7.3 on the increase in incar-ceration rates discussed above. The method requires drawing on exist-ing estimates of the responsiveness of criminal activity to changes in wages, estimating the risk of incarceration conditional on engaging in crime, and estimating the time one is likely to serve conditional on be-ing caught and incarcerated. The results of this exercise are presented in Table 7.7. The table presents estimates for men only, since the changes in institutionalization rates are quite modest for women. The fi rst col-umn of fi gures presents the actual change in the proportion institution-alized, the next column presents the change predicted by wage changes between 1980 and 2000, and the fi nal column presents the ratio of the predicted to the actual change. For relatively less-educated white men, declining wages predict an increase in the institutionalization rate equal to approximately 15 percent of the actual increase. By comparison, the proportion of the actual increase for low-educated black men predicted by their change in wages is quite small (on the order of 2 to 3 percent). This is driven largely by the much larger increases in institutionaliza-tion rates for black men. The fi gures for Asian and Hispanic men are more in line with those for whites. For Hispanic high school dropouts, declining wages predict roughly 18 percent of the increase in incarcera-tion rates.
These results suggest that declining earnings explain a small por-tion of the overall increase in incarceration. In previous research with
tb08fogjch7.indd 268tb08fogjch7.indd 268 9/10/2008 12:50:39 PM9/10/2008 12:50:39 PM

Boosting the Earnings of Low-Skilled Workers in the U.S. 269
Michael Stoll (Raphael and Stoll 2007), I have estimated that declining wages for low-skilled men are responsible for no more than 13 percent of the increase in incarceration rates between 1980 and 2000. Nonethe-less, small decreases in incarceration caused by, for example, a wage subsidy may generate substantial social savings. Correction expen-ditures per prison year are on the order of $35,000 a year (Donohue 2007). In 2005, there were approximately 1.5 million prison inmates. If a targeted wage subsidy were to reduce the prison population by a mod-
Table 7.7 Comparison of Actual Changes in Institutionalization Rates for Men and Predicted Changes Based on Changes in Hourly Wages
Actual change in institutionalization rates, 1980–2000
Predicted change in institutionalization
rates given wage changes
Ratio, predicted/actual
WhiteLess than high schoolHigh school graduateSome collegeCollege graduate
0.0370.0190.0080.001
0.0050.0030.001−0.002
0.1340.1660.141−2.250
Black Less than high schoolHigh school graduateSome collegeCollege graduate
0.1900.0770.0420.006
0.0040.0020.000−0.002
0.0200.032−0.011−0.300
AsianLess than high schoolHigh school graduateSome collegeCollege graduate
0.0210.0120.0070.000
0.0020.0040.000−0.003
0.1180.3380.032—
HispanicLess than high schoolHigh school graduateSome collegeCollege graduate
0.0210.0330.0160.004
0.0040.0050.0020.000
0.1820.1360.1130.000
NOTE: See text for discussion of predicted changes in institutionalization rates. The predictions make use of the absolute changes in log hourly wages between 1980 and 2000, presented in Table 7.3.
SOURCE: Author’s tabulations based on data from the 1980, 1990, and 2000 Public Use Microdata Samples (PUMS) of the U.S. Census of Population and Housing.
tb08fogjch7.indd 269tb08fogjch7.indd 269 9/10/2008 12:50:39 PM9/10/2008 12:50:39 PM
270 Raphael
est 5 percent, 75,000 fewer inmates would be incarcerated on any given day, generating savings in corrections expenditures of roughly $2.6 bil-lion. Moreover, this fi gure would increase considerably if we were to account for some of the harder-to-price social costs of incarceration (including the impact on families and public health) as well as the value in stolen goods or losses from the crimes averted. Thus, even small ef-fects such as those in Table 7.7 deserve serious consideration.
CRIMINAL RECORDS AND THE EMPLOYMENT PROSPECTS OF LOW-EARNING MALES
To be sure, the relatively poor labor market outcomes for very low-skilled men and women are driven largely by skill defi cits and a general lack of job readiness. This is true of low earners in years past as well as the present and of workers at the bottom of the earnings distribu-tion in other market economies as well as ours. Nonetheless, the recent U.S. experience is one where earnings and employment have eroded while the formal level of educational attainment among the least skilled has actually increased. These incongruous trends suggest that factors beyond skills have operated to chip away at the relative and absolute economic position of these adults.
In this section, I discuss the likely impacts of the large increases in the proportion of low-skilled men with criminal records on their employment and earnings prospects. We have already seen that male incarceration rates have increased considerably, as has the proportion of men with prison time in their past. Here, I explore the mechanisms through which a prior incarceration experience is likely to affect earn-ings and employment not only in the immediate future but throughout one’s lifetime.
Incarceration and the Accumulation of Work Experience
Serving time interrupts one’s work career. The extent of this inter-ruption depends on both the expected amount of time served on a typi-cal term as well as the likelihood of serving subsequent prison terms. The average prisoner admitted during the late 1990s on a new commit-
tb08fogjch7.indd 270tb08fogjch7.indd 270 9/10/2008 12:50:40 PM9/10/2008 12:50:40 PM
Boosting the Earnings of Low-Skilled Workers in the U.S. 271
ment faced a maximum sentence of three years and a minimum of one year—with many serving time closer to the minimum (Raphael and Stoll 2004). If this were the only time served for most, then the time interruption of prison would not be that substantial.7
However, many people serve multiple terms in prison, either be-cause of the commission of new felonies or because of violation of parole conditions after their release. A large body of criminological research consistently fi nds that nearly two-thirds of ex-inmates are re-arrested within a few years of release from prison (Petersilia 2003). Moreover, a sizable majority of the re-arrested will serve subsequent prison terms. Thus, for many offenders, the typical experience between the ages of 18 and 30 is characterized by multiple short prison spells with intermittent, and relatively brief, spells outside of prison.
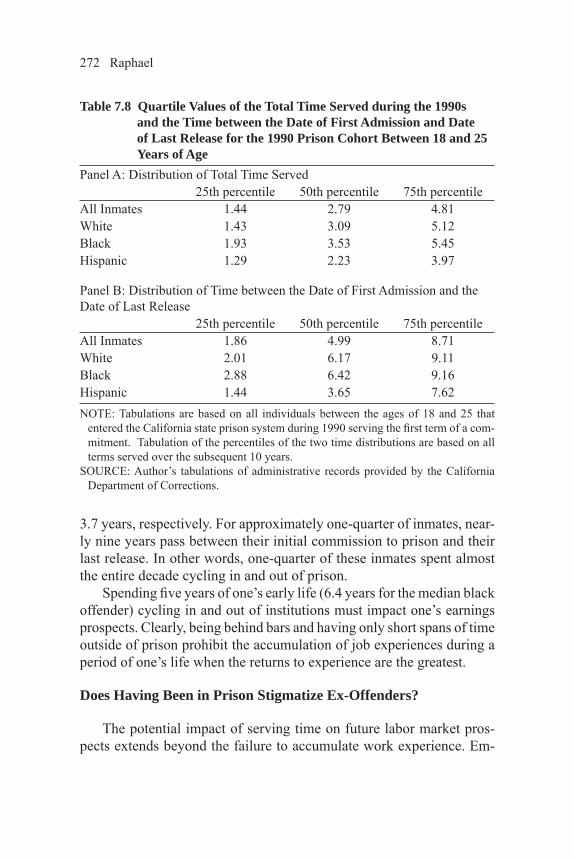
In previous longitudinal research on young offenders entering the California state prison system, I documented the degree to which prison interrupts the early potential work careers of young men. I followed a cohort of young men entering the state prison system in 1990 and gauged the amount of time served over the subsequent decade (Raphael 2006). This analysis is summarized in Table 7.8. Panel A presents esti-mates of the distribution of the total amount of time served, comprising multiple prison terms. The median inmate serves 2.79 years during the 1990s, with the median white inmate (3.09 years) and median black inmate (3.53 years) serving more time and the median Hispanic inmate (2.23 years) serving less time.8 Roughly 25 percent of inmates served at least fi ve years during the 1990s while another 25 percent served less than 1.5 years.
However, as a gauge of the extent of the temporal interruption, these fi gures are misleading. Cumulative time served does not account for the short periods of time between prison spells where inmates may fi nd employment yet are not able to solidify the employment match with any measurable amount of job tenure. A more appropriate measure of the degree to which incarceration impedes experience accumulation would be the time between the date of admission to prison for the fi rst term served and the date of release from the last term.
Panel B of Table 7.8 presents the quartile values from the distribu-tion of this variable. For the median inmate, fi ve years elapses between the fi rst date of admission and the last date of release. For median white, black, and Hispanic inmates, the comparable fi gures are 6.2, 6.4, and
tb08fogjch7.indd 271tb08fogjch7.indd 271 9/10/2008 12:50:40 PM9/10/2008 12:50:40 PM
272 Raphael
3.7 years, respectively. For approximately one-quarter of inmates, near-ly nine years pass between their initial commission to prison and their last release. In other words, one-quarter of these inmates spent almost the entire decade cycling in and out of prison.
Spending fi ve years of one’s early life (6.4 years for the median black offender) cycling in and out of institutions must impact one’s earnings prospects. Clearly, being behind bars and having only short spans of time outside of prison prohibit the accumulation of job experiences during a period of one’s life when the returns to experience are the greatest.
Does Having Been in Prison Stigmatize Ex-Offenders?
The potential impact of serving time on future labor market pros-pects extends beyond the failure to accumulate work experience. Em-
Table 7.8 Quartile Values of the Total Time Served during the 1990s and the Time between the Date of First Admission and Date of Last Release for the 1990 Prison Cohort Between 18 and 25 Years of Age
Panel A: Distribution of Total Time Served25th percentile 50th percentile 75th percentile
All Inmates 1.44 2.79 4.81White 1.43 3.09 5.12Black 1.93 3.53 5.45Hispanic 1.29 2.23 3.97
Panel B: Distribution of Time between the Date of First Admission and the Date of Last Release
25th percentile 50th percentile 75th percentileAll Inmates 1.86 4.99 8.71White 2.01 6.17 9.11Black 2.88 6.42 9.16Hispanic 1.44 3.65 7.62NOTE: Tabulations are based on all individuals between the ages of 18 and 25 that
entered the California state prison system during 1990 serving the fi rst term of a com-mitment. Tabulation of the percentiles of the two time distributions are based on all terms served over the subsequent 10 years.
SOURCE: Author’s tabulations of administrative records provided by the California Department of Corrections.
tb08fogjch7.indd 272tb08fogjch7.indd 272 9/10/2008 12:50:40 PM9/10/2008 12:50:40 PM

Boosting the Earnings of Low-Skilled Workers in the U.S. 273
ployers are averse to hiring former prison inmates and often use formal and informal screening tools to weed ex-offenders out of the applicant pool. Given the high proportion of low-skilled men with prison time on their criminal records, such employer sentiments and screening practic-es represent an increasingly important employment barrier, especially for low-skilled African American men.
Employers consider criminal records when screening job applicants for a number of reasons. For starters, certain occupations are closed to felons under local, state, and in some instances federal law (Hahn 1991). In many states employers can be held liable for the criminal actions of their employees. Under the theory of negligent hiring, em-ployers can be required to pay punitive damages as well as damages for loss, pain, and suffering for acts committed by an employee on the job (Craig 1987). Finally, employers looking to fi ll jobs where employee monitoring is imperfect may place a premium on trustworthiness and screen accordingly.
In all known employer surveys where employers are asked about their willingness to hire ex-offenders, employer responses reveal a strong aversion to hiring applicants with criminal records (Holzer, Ra-phael, and Stoll 2006, 2007; Pager 2003). For example, over 60 per-cent of employers surveyed in the Multi-City Study of Urban Inequality (MCSUI) indicated that they would “probably not” or “defi nitely not” hire applicants with criminal histories, with “probably not” being the modal response. By way of contrast, only 8 percent responded similarly when queried about their willingness to hire current and former welfare recipients.
The ability of employers to act on an aversion to ex-offenders, and the nature of the action they take in terms of hiring and screening be-havior, will depend on their access to applicants’ criminal histories. If an employer can and does access criminal records, the employer may simply screen out applicants based on their actual arrest and conviction records. In the absence of a formal background check, an employer may act on an aversion to hiring ex-offenders using perceived correlates of previous incarceration, such as age, race, and level of educational at-tainment, to attempt to screen out those with criminal histories. In other words, employers may statistically profi le applicants and avoid hiring those from demographic groups with high rates of involvement in the criminal justice system (Holzer, Raphael, and Stoll 2006).
tb08fogjch7.indd 273tb08fogjch7.indd 273 9/10/2008 12:50:40 PM9/10/2008 12:50:40 PM
274 Raphael
The audit study by Pager (2003) offers perhaps the clearest evi-dence of employer aversion to hiring ex-offenders and the stigma as-sociated with having served time in prison. The study uses male audi-tors matched on observable characteristics—including age, education, general appearance, demeanor, and race—to assess the effects of prior prison experience on the likelihood that each auditor is called back for an interview. The author fi nds consistently sizable negative effects of prior prison experience on the likelihood of being called back by the employer, with callback rates for the auditor with prior prison time one-half that of the matched coauditor.
Summary
Incarceration is likely to negatively affect the earnings and employ-ment prospects of former inmates. On the supply side, incarcerated fel-ons fail to accumulate work experience during a period of life when earnings tend to increase the fastest. The time out of the labor force while incarcerated, as well as the longer time of tenuous attachment to the labor force while cycling in and out of prison, permanently alters the lifetime earnings path of former inmates for the worse. On the demand side, employers consistently express a strong reluctance to hire workers with criminal records. This reluctance is driven in part by liability fears and by a premium placed on trustworthiness, but also by public policy that legally prohibits employers from hiring convicted felons in certain job categories. In sum, the greater incidence of involvement with the criminal justice system that has occurred over the past three decades has most certainly negatively affected the prospects of the least-skilled U.S. adults.
IMPROVING THE PROSPECTS OF LOW-SKILLED ADULTS: EXPANDING THE EITC AND REMOVING EMPLOYMENT BARRIERS FOR FORMER INMATES
I have documented a severe erosion of the earnings and employ-ment of less-skilled men in the United States and less detrimental de-velopments for less-skilled women. While the sources of these trends
tb08fogjch7.indd 274tb08fogjch7.indd 274 9/10/2008 12:50:40 PM9/10/2008 12:50:40 PM

Boosting the Earnings of Low-Skilled Workers in the U.S. 275
are certainly complex, there are direct policy levers under the control of federal and state government that could be effectively employed to reverse them. From among these, raising the minimum wage would most directly increase the earnings of the lowest-paid workers. While economists debate the likely employment effects of raising the mini-mum wage, there is solid research suggesting that modest increases have very little effect on employment while increasing the total amount of income earned by the least skilled (Card and Krueger 1994).9 More-over, the earnings of the least skilled are low primarily because of their low skills. Improving our primary, secondary, and postsecondary edu-cational systems as well as augmenting the resources devoted to work-force development would clearly benefi t our lowest earners (the topic of discussion in the chapter in this volume by Lerman).
In this section, I offer and analyze two proposals for improving the take-home earnings of the least skilled workers and for boosting the employment rates of those who should be working yet are participating in the formal labor force at historically low levels. First, I discuss sev-eral current proposals for expanding the Earned Income Tax Credit to single childless workers and offer a hybrid proposal that combines what I see as the best elements of each. Second, I discuss several steps that federal, state, and local policymakers could take to improve the chances of former inmates and convicted felons and aid the reentry of recently released inmates into conventional society.
Expanding the EITC
First introduced in the 1970s, the EITC has become one of the most important antipoverty policies in the United States. At a current cost of approximately $40 billion, the EITC distributes income to low-earning workers primarily in families with children, although there is a modest benefi t for childless workers between 25 and 65 years of age. EITC benefi ts are calculated as a fraction of annual earnings up to a maximum and are phased out at a gradual rate for income earned beyond a fur-ther threshold. For example, for a married couple with two children in 2007, the EITC provides an additional $0.40 for each dollar earned up to $11,790, totaling a maximum annual benefi t of $4,716. The benefi t level is held constant until family earnings reach $17,390 and then is reduced by $0.21 for each dollar earned above this threshold until the
tb08fogjch7.indd 275tb08fogjch7.indd 275 9/10/2008 12:50:41 PM9/10/2008 12:50:41 PM
276 Raphael
benefi t is completely phased out (which occurs at $39,783). Since ben-efi ts are conditional on having positive earnings, the EITC provides a strong incentive to participate in the labor force, although the program does provide an incentive for many workers who are already working to work fewer hours a year.10
The expansions of the EITC during the 1990s had very large im-pacts on the employment and after-tax incomes of those adults most affected (Meyer and Holtz-Eakin 2001; Meyer and Rosenbaum 2001). However, these expansions had little impact on the earnings of single noncustodial parents or childless single adults with very low earnings, as nearly all of the extra resources devoted to the program went to households with children. In light of this fact, there are several recent proposals to expand the EITC for childless adults and noncustodial par-ents (Berlin 2007; Center for American Progress 2007; Danziger and Gottschalk 2005; Edelman, Holzer, and Offner 2006).
The attractiveness of such proposals lies both in their simplicity and in their direct effect on the earnings of the least skilled. Rising earnings inequality and declining wages, driven by a host of factors, have adversely affected the material well-being and employment rates of the least skilled workers. Thus, making work pay through a wage subsidy will directly counter these trends regardless of their source, and improve the material well-being of the poor, while providing them with a strong incentive to engage in the legitimate labor market and perhaps a disincentive to engage in criminal activity. To be sure, the existing proposals vary in three ways: 1) cost, 2) the degree to which the ben-efi ts are targeted towards the lowest earners, and 3) the degree to which these expansions affect incentives in other respects, such as marriage. Moreover, along these three dimensions no one proposal dominates.
Here, I analyze several variants of two recent proposals to expand the EITC, and I fashion a simple hybrid of the two proposals that ad-dresses the marriage penalty while maintaining the well-targeted na-ture of the current EITC. The two existing plans that I analyze are as follows:
The Edelman, Holzer, and Offner (EHO) Proposal. In their book, Reconnecting Disadvantaged Young Men, Peter Edelman, Harry Holzer, and Paul Offner (2006) offer a plan for a targeted expansion of the EITC toward single childless workers and noncustodial parents.
tb08fogjch7.indd 276tb08fogjch7.indd 276 9/10/2008 12:50:41 PM9/10/2008 12:50:41 PM
Boosting the Earnings of Low-Skilled Workers in the U.S. 277
The plan calls for a 20 percent wage subsidy for the fi rst $7,500 in earnings, yielding a maximum subsidy of $1,500. Beyond earnings of $10,000, the subsidy is taxed away at the rate of $0.15 per dollar until it is completely phased out at $20,000 in annual earnings. The pro-posal also calls for disregarding one-half of the earnings of the lower-earning spouse in two-earner families for the purposes of calculating EITC benefi ts. In the analysis below, I assume that all workers aged 18 to 65 who meet the income criteria are eligible for the childless credit. Note that this proposal is quite similar to that recently offered by the Center for American Progress Task Force on Poverty.11
The Berlin Proposal. In a recent working paper, the president of MDRC, Gordon Berlin (2007), proposes a targeted expansion of the EITC singles benefi t along with a change in the manner in which fam-ily income is tabulated for the purposes of the credit. Regarding the childless credit, Berlin proposes an expansion for all adults 21 to 54 years of age who work full time, at a rate of 25 cents per dollar earned through $7,800 of earnings, with a phaseout beginning for earnings beyond $14,400 at a rate of $0.16 per additional dollar earned (with a total phaseout income level of $26,587). Berlin also proposes that EITC benefi ts be calculated based on individual income rather than family income. Thus, in a two-earner household with two children, the higher-earning worker would claim the children for the purposes of the EITC, and the benefi t attributable to this worker’s earnings would be calculated accordingly. The lower-earning worker would qualify for the childless credit.
To highlight the relative characteristics of these two proposals, I simulate the costs, impacts on the income distribution, and impacts on average earnings of these two plans (and, by extension, the likely im-pacts on employment). For the sake of simplicity, I modify the existing proposals somewhat to highlight the tradeoffs in the two approaches. Specifi cally, I apply the EHO childless credit phase-in and phaseout rates as well as the income thresholds to the Berlin plan. In addition, I assume that all workers between the ages of 21 and 54 are eligible for benefi ts under the Berlin plan irrespective of whether they have full-time or part-time status. I also consider an enhanced EHO plan that ex-tends the 20 percent earnings subsidy through $10,000 in annual earn-ings, effectively giving a 20 percent raise to a full-time minimum-wage
tb08fogjch7.indd 277tb08fogjch7.indd 277 9/10/2008 12:50:41 PM9/10/2008 12:50:41 PM
278 Raphael
worker. Finally, I consider a hybrid plan that combines elements of the EHO and Berlin proposals. Specifi cally, I combine the EHO childless credit for all workers aged 18 to 65 with the Berlin income calculation rules applied selectively to families with earnings equal to or less than $30,000 a year. For qualifi ed households with earnings above $30,000, I apply the income determination rules in the EHO proposal.12
I use the March 2006 Current Population Survey (CPS) to simulate how each of these proposals would have affected individuals’ outcomes in tax year 2005.13 Table 7.9 displays cost estimates of total EITC dis-bursements using the parameters of each of these proposals to calculate EITC benefi ts for eligible families and individuals. Before proceeding, we should note a number of qualifi cations. First, these simulations pre-dict a total cost for the current system of roughly $30 billion for tax year 2005, which is approximately $5 to $6 billion below actual costs. In isolation, this fact suggests that the costs simulated in the table may be biased downward. Biasing the estimates in the other direction, I am as-suming a 100 percent take-up rate for all available benefi ts. In practice, take-up of the EITC is not universal, especially for the childless credit, and thus this assumption is likely to bias costs upwards. Finally, the cost estimates in Table 7.9 do not account for any behavioral labor sup-ply response among potential recipients—i.e., the cost estimates simply apply the alternative benefi t formulations to those who work, without considering the likely impact of expanded employment. However, as I will discuss shortly, the employment effects of each of these proposals are likely to be quite modest, thus minimizing the importance of this particular behavioral effect on costs.
With these caveats in mind, the simulation suggests that the EHO plan would increase total EITC costs by roughly $18 billion, the en-hanced EHO plan would increase them by $35 billion, the Berlin pro-posal by $26 billion, and the hybrid proposal by $20 billion. For the Berlin proposal, my cost estimate is close to that cited by the author in the original working paper (approximately $29 billion). For the EHO proposal, my cost estimate is nearly double that cited by the authors ($9.8 billion), although this discrepancy is nearly completely accounted for by the difference in the assumed take-up rate.14 Nonetheless, the costs estimates reveal a clear ordering, with the EHO proposal the least costly, the enhanced EHO proposal the most expensive, and the Berlin and hybrid proposals at intermediate cost points. As the enhanced EHO
tb08fogjch7.indd 278tb08fogjch7.indd 278 9/10/2008 12:50:41 PM9/10/2008 12:50:41 PM

279Table 7.9 Simulated Costs of Various Proposals to Expand the Earned Income Tax Credit to Single Childless Adults
and to Mitigate the Inherent Marriage PenaltySimulated costs using the 2006 distribution of wage and salary earnings (millions of 2006 dollars)
Benefi ciary category Existing system EHO proposalEnhanced
EHO proposal Berlin proposalHybrid EHO-
Berlin proposalSingle and childless 1,269 20,062 33,878 13,840 20,062Married, no children 516 3,166 3,737 7,172 3,788Married with
children13,383 15,203 15,202 25,251 16,571
Single parents 14,315 14,615 14,615 14,615 14,615Total 29,783 53,046 67,433 60,879 55,037Difference relative
to existing18,165 35,551 25,997 20,156
NOTE: Blank = not applicable. Costs are simulated using data from the March 2006 Current Population Survey. See text for exact descrip-tion. The EHO-proposed expansion includes a 20 percent credit for single childless adults up to $7,500 in earnings that is phased out after $10,000 in earnings at a rate of 0.15. The EHO proposal also includes disregarding half of the earnings of the lower-paid spouse in calculating the EITC benefi t for married couples. The enhanced EHO proposal is similar with the exception that the 20 percent credit for a single childless adult applies to the fi rst $10,000 in earnings and is phased out after reaching $12,000. The Berlin proposal applies the single childless benefi t. The Berlin proposal uses the EHO single childless benefi t formula applied only to single adults between 21 and 55. The proposal also uses individual income rather than combined income in calculating the EITC credit for married couples. For married couples with children, the higher earner’s income is used to calculate the credit with children, while the lower earner receives the childless EHO credit. The Hybrid EHO-Berlin proposal is the EHO proposal with one modifi cation: the EITC benefi t for married couples with total wage and salary income of less than $30,000 is computed using the individual calculations in the Berlin proposal. The benefi t for married couples with higher incomes is computed using the EHO disregard.
SOURCE: Author’s tabulations from the March 2006 Current Population Survey.
tb08fogjch7.indd 279tb08fogjch7.indd 279
9/10/2008 12:50:41 PM9/10/2008 12:50:41 PM

280 Raphael
proposal would have the largest impact on the take-home pay of low-income workers, and thus the largest likely effect on employment, the cost estimates reveal the fairly obvious tradeoff between impact size and cost.
Table 7.10 investigates where in the earnings distribution the ad-ditional dollars expended under each proposal land. To construct this table, I fi rst simulated tax-paying units by assuming that all single childless adults as well as single parents fi le individual returns and that all married adults fi le joint returns. I then stratifi ed the distribution of wage and salary earnings across these tax fi ling units into 10-percent slices, or deciles, ordering them from lowest to highest. The fi gures in Table 7.10 give the percentage of the additional dollars spent under each proposal (i.e., the last row of fi gures in Table 7.9) that would ac-crue to each income decile.
The table reveals quite large disparities in how well-targeted these proposals are towards the bottom of the earnings distribution. The ad-ditional dollars spent under the EHO and the enhanced EHO propos-als are heavily concentrated in the bottom three deciles of the earnings distribution, with 91 percent of the former and 89 percent of the latter accruing to tax-fi ling units that have less than $20,000 in annual in-come. Some of the additional benefi ts do hit higher up in the income distribution, since married couples with incomes as high as $51,000 a year would qualify for benefi ts under the EHO proposal.15 However, in proportional terms, the amount accruing to units with earnings above $40,000 is trivial. For the Berlin proposal, only 49 percent of the ad-ditional dollars hit the bottom 30 percent of the income distribution, with a much higher proportion (38 percent) escaping above the median income. These fi gures suggest that there are many households where a relatively high-earning spouse is married to a relatively low-earning spouse whose income would qualify for the childless benefi t. The hy-brid proposal, on the other hand, reveals that a targeted application of the income eligibility calculations under the Berlin proposal (restricted to households with incomes below $30,000) preserves the targeting of the EHO proposal with relatively few additional benefi ts accruing to high-income households and a relatively modest increase in total costs above the base EHO proposal.
While the EHO proposal and its variants are well targeted, the Ber-lin proposal wins out in terms of the implicit marriage penalty. Table
tb08fogjch7.indd 280tb08fogjch7.indd 280 9/10/2008 12:50:42 PM9/10/2008 12:50:42 PM

281Table 7.10 Distribution of Additional Dollars Spent Above the Existing Credit by the Deciles of the Wage and
Salary Earnings of Simulated Tax-Filing Units% additional dollars going to each earnings decile under the following proposals
Deciles of the earnings distribution EHO proposal
Enhanced EHO proposal Berlin proposal
Hybrid EHO- Berlin proposal
D1: <6,000 21 13 9 19D2: 6,001–13,000 49 41 26 45D3: 13,001–20,000 21 35 14 20D4: 20,001–25,743 1 6 4 4D5: 25,744–34,000 3 2 9 7D6: 34,001–42,500 3 2 11 3D7: 42,501–55,000 1 0 13 1D8: 55,001–73,500 0 0 7 0D9: 73,501–102,000 0 0 4 0D10: 102,001 and up 0 0 3 0NOTE: The fi gures in the table give the percentage of the additional dollars spent above the current system that would accrue to tax fi ling
units of the given income class. The nature of the proposals is discussed in the notes to Table 7.9 and in the text.SOURCE: Author’s tabulations from March 2006 Current Population Survey.
tb08fogjch7.indd 281tb08fogjch7.indd 281
9/10/2008 12:50:42 PM9/10/2008 12:50:42 PM
282 Raphael
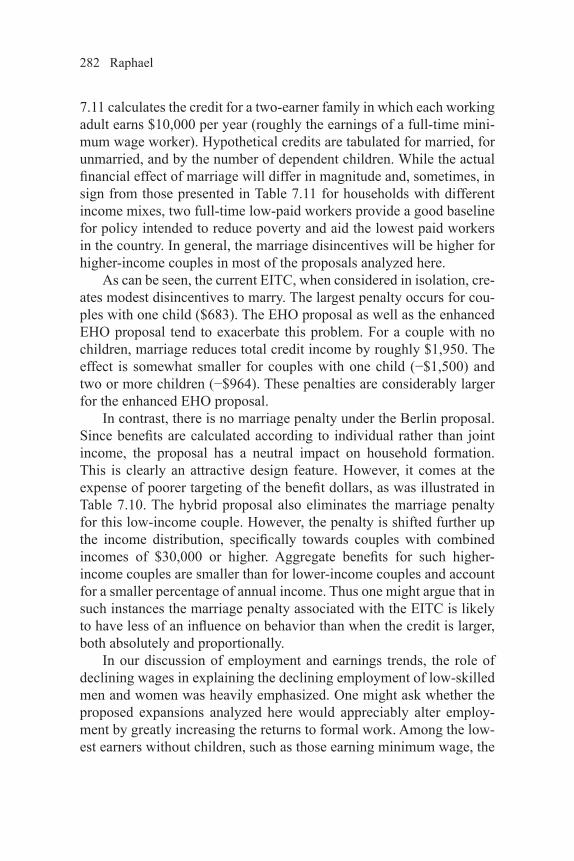
7.11 calculates the credit for a two-earner family in which each working adult earns $10,000 per year (roughly the earnings of a full-time mini-mum wage worker). Hypothetical credits are tabulated for married, for unmarried, and by the number of dependent children. While the actual fi nancial effect of marriage will differ in magnitude and, sometimes, in sign from those presented in Table 7.11 for households with different income mixes, two full-time low-paid workers provide a good baseline for policy intended to reduce poverty and aid the lowest paid workers in the country. In general, the marriage disincentives will be higher for higher-income couples in most of the proposals analyzed here.
As can be seen, the current EITC, when considered in isolation, cre-ates modest disincentives to marry. The largest penalty occurs for cou-ples with one child ($683). The EHO proposal as well as the enhanced EHO proposal tend to exacerbate this problem. For a couple with no children, marriage reduces total credit income by roughly $1,950. The effect is somewhat smaller for couples with one child (−$1,500) and two or more children (−$964). These penalties are considerably larger for the enhanced EHO proposal.
In contrast, there is no marriage penalty under the Berlin proposal. Since benefi ts are calculated according to individual rather than joint income, the proposal has a neutral impact on household formation. This is clearly an attractive design feature. However, it comes at the expense of poorer targeting of the benefi t dollars, as was illustrated in Table 7.10. The hybrid proposal also eliminates the marriage penalty for this low-income couple. However, the penalty is shifted further up the income distribution, specifi cally towards couples with combined incomes of $30,000 or higher. Aggregate benefi ts for such higher-income couples are smaller than for lower-income couples and account for a smaller percentage of annual income. Thus one might argue that in such instances the marriage penalty associated with the EITC is likely to have less of an infl uence on behavior than when the credit is larger, both absolutely and proportionally.
In our discussion of employment and earnings trends, the role of declining wages in explaining the declining employment of low-skilled men and women was heavily emphasized. One might ask whether the proposed expansions analyzed here would appreciably alter employ-ment by greatly increasing the returns to formal work. Among the low-est earners without children, such as those earning minimum wage, the
tb08fogjch7.indd 282tb08fogjch7.indd 282 9/10/2008 12:50:42 PM9/10/2008 12:50:42 PM
Boosting the Earnings of Low-Skilled Workers in the U.S. 283
proposed expansions would substantially raise earnings (by as much as 20 percent), effectively countering the ground lost between 1980 and the present. However, even among the least skilled, the proportion earn-ing the minimum wage is low, and thus for many the proposed expan-sions will only subsidize part of annual earnings, with some low-skilled workers likely to be operating within the phaseout income range.
Table 7.11 Calculation of the EITC Benefi ts for a Couple (Each of Whom Earns $10,000 per Year) When Married and When Unmarried, Under the Existing System and Under Each Proposed Expansion
Number of childrenNone One More than one
Existing systemMarriedUnmarriedPenalty
0325−325
2,2372,910−673
3,8644,197−333
EHO proposalMarriedUnmarriedPenalty
1,0503,000−1,950
2,7474,247−1,500
4,5365,500−964
Enhanced EHOMarriedUnmarriedPenalty
1,5504,000−2,450
2,7474,747−2000
4,5366,000−1,464
Berlin proposalMarriedUnmarriedPenalty
3,0003,000
0
4,2474,247
0
5,5005,500
0Hybrid EHO-Berlin
MarriedUnmarriedPenalty
3,0003,000
0
4,2474,247
0
5,5005,500
0
NOTE: Figures in the table represent the EITC benefi t, under the existing system and under each proposal, that a two-earner couple, in which each spouse earns $10,000 per year, would receive when married and when unmarried. The nature of the propos-als is discussed in the note to Table 7.9 and in the text.
SOURCE: Author’s tabulations based on the Earned Income Tax Credit (EITC) pro-gram parameters for the 2005 tax year.
tb08fogjch7.indd 283tb08fogjch7.indd 283 9/10/2008 12:50:42 PM9/10/2008 12:50:42 PM
284 Raphael
To assess the overall effects of these expansions on take-home pay and their potential to draw certain groups into the labor market, I have tabulated average annual earnings for certain subgroups of the popula-tion with extremely low employment rates and characterized the ben-efi ts under each of these proposals as a proportion of annual earnings. The proportional increase, when combined with estimates of the supply responsiveness of these groups, provides ballpark estimates of the boost to employment rates one might expect from the expansions discussed here.16
Table 7.12 presents the proportional increases in annual income that would be generated by the proposed expansions for selective groups of low-skilled males with very low employment rates. All tabulations pertain to single, childless men with the additional characteristics indi-cated in the table. The fi rst column demonstrates that the existing sys-tem has virtually no effect on earnings (less than half of a percent) and thus likely has no effect on individual decisions to work among these men. The EHO/Hybrid proposal17 provides a notable increase in annual income, ranging from 2 to 6 percent, for all groups depicted; the larg-est increase (6 percent) occurs for black high school dropouts between 18 and 25 years of age. The enhanced EHO proposal has the largest proportional effects on income; it shows increases among young high school dropouts of 8 percent for all groups with the exception of Asian men, who would see a 5 percent increase. The Berlin proposal has the smallest effect on earnings among the new proposals; its effects range from 1 to 4 percent, and most men characterized in the table experience increases on the order of 2 percent.
How much of an increase in employment might we expect from these expansions? When combined with the labor supply elasticity es-timates discussed above, the earnings increases in Table 7.12 are likely to have very modest effects on employment. For example, the EHO proposal is predicted to alter the employment rate of all black male dropouts by roughly 1 percentage point, while the larger enhanced EHO proposal might increase the employment rate of young black dropouts by as much as 2 percent. Given the lower responsiveness of less skilled men in the other racial or ethnic groups, the employment effects are likely to be even smaller.
As an overall assessment of the proposals, it is clear that no one proposal dominates, and that each has relative advantages and disad-
tb08fogjch7.indd 284tb08fogjch7.indd 284 9/10/2008 12:50:42 PM9/10/2008 12:50:42 PM
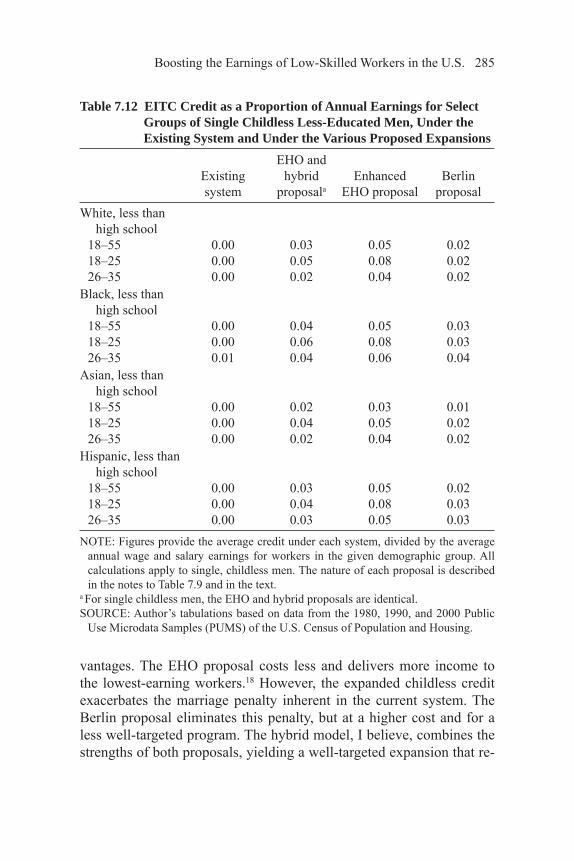
Boosting the Earnings of Low-Skilled Workers in the U.S. 285
vantages. The EHO proposal costs less and delivers more income to the lowest-earning workers.18 However, the expanded childless credit exacerbates the marriage penalty inherent in the current system. The Berlin proposal eliminates this penalty, but at a higher cost and for a less well-targeted program. The hybrid model, I believe, combines the strengths of both proposals, yielding a well-targeted expansion that re-
Table 7.12 EITC Credit as a Proportion of Annual Earnings for Select Groups of Single Childless Less-Educated Men, Under the Existing System and Under the Various Proposed Expansions
Existing system
EHO and hybrid
proposalaEnhanced
EHO proposalBerlin
proposalWhite, less than
high school18–5518–2526–35
0.000.000.00
0.030.050.02
0.050.080.04
0.020.020.02
Black, less than high school
18–5518–2526–35
0.000.000.01
0.040.060.04
0.050.080.06
0.030.030.04
Asian, less than high school
18–5518–2526–35
0.000.000.00
0.020.040.02
0.030.050.04
0.010.020.02
Hispanic, less than high school
18–5518–2526–35
0.000.000.00
0.030.040.03
0.050.080.05
0.020.030.03
NOTE: Figures provide the average credit under each system, divided by the average annual wage and salary earnings for workers in the given demographic group. All calculations apply to single, childless men. The nature of each proposal is described in the notes to Table 7.9 and in the text.
a For single childless men, the EHO and hybrid proposals are identical.SOURCE: Author’s tabulations based on data from the 1980, 1990, and 2000 Public
Use Microdata Samples (PUMS) of the U.S. Census of Population and Housing.
tb08fogjch7.indd 285tb08fogjch7.indd 285 9/10/2008 12:50:43 PM9/10/2008 12:50:43 PM
286 Raphael
duces, or for some eliminates, the disincentive to marry. While the mar-riage disincentives are pushed further up the earnings distribution, one can reasonably argue that the behavioral impact of the penalty is likely to be smaller for higher-income couples.
The small projected employment effects of these expansions are disappointing and suggest that substantially increasing employment through supply-side incentives would require a much bigger and cost-lier expansion than the proposals analyzed here. Nonetheless, the pro-posals represent considerable increases in the incomes of the workers at the very bottom of the distribution, increases that will greatly improve their material well-being and provide strong incentives for a small slice of the nation’s poorest adults to engage in legitimate work.
Policies to Remove Barriers to Employment for Ex-Offenders
Spending time in prison or having a prior felony conviction in one’s history is becoming an increasingly common characteristic of low-skilled workers, especially for low-skilled minority men. While the causes of this increased interaction with the criminal justice sys-tem are varied, the lion’s share of this development is attributable to changes in sentencing policy that have both increased the average time that an offender spends behind bars and enlarged the scope of behav-ior punished by a spell of incarceration (Raphael and Stoll 2007). My analysis of employment trends found that only a small part of the de-cline in employment rates among the least-skilled men can be explained by declining wages, suggesting the limits of policies designed to boost take-home earnings. Fully addressing the employment crises for these men requires directly addressing the barriers to employment created by one’s offi cial criminal past.
Facilitating the successful reentry of former inmates and felons into noninstitutionalized society is an extremely complex problem that will most likely require substantial investments in training, social services, employment services, and postrelease monitoring (see the discussions in Petersilia [2003] and Travis [2005]). The sheer size of this popu-lation—roughly 600,000 inmates are released each year and nearly 5 percent of the adult male population has served time—is indicative of the enormity of this challenge. Nonetheless, there are simple steps that the state and federal government could take that would not compromise
tb08fogjch7.indd 286tb08fogjch7.indd 286 9/10/2008 12:50:43 PM9/10/2008 12:50:43 PM

Boosting the Earnings of Low-Skilled Workers in the U.S. 287
public safety yet would eliminate some of the challenges that former inmates and felons face in procuring employment and avoiding extreme poverty after their release.
To begin with, the summary disqualifi cation of former inmates and those with felony convictions from participating in federal public assistance programs and from receiving fi nancial aid for education should be reversed. Currently, those with prior drug fel-ony convictions are prohibited from receiving federal fi nancial educa-tion assistance. Moreover, the 1996 Personal Responsibility and Work Opportunity Reconciliation Act made drug felons ineligible for food stamps and cash assistance for life. States could adopt the federal ban on food stamps and cash assistance as is, or pass legislation to modify or eliminate the ban. States are not authorized to eliminate the ban on fi nancial aid (Legal Action Center 2004).
The only possible rationale for such collateral punishment of drug offenders is that by enhancing punishment fewer people will engage in drug crimes. However, the deterrence effects of incarceration itself are hotly debated among those who study the determinants of crime (Lee and McCrary 2005; Levitt 1998), with much research suggesting that the likely effects are quite small. With this in mind, the deterrent effects of much more removed, and perhaps less salient, punishments such as a lifetime ban on food stamps receipt or becoming ineligible for Pell grants must certainly generate very little in the way of crime reduction. Such bans, however, do make it more diffi cult for released offenders to avoid extreme poverty and to turn their lives around. Financial aid through the Pell grant program is one of the main sources of assistance for those attending community college, an important source of training and secondary education for less-skilled adults. Food stamps very ef-fectively provide basic assistance to meet the most fundamental needs of the poor. Banning former felons from participating in these programs is frankly counterproductive. Those states that maintain complete or partial bans on participation in public assistance should drop them, and the federal governments should reverse the ban on drug offenders re-ceiving educational assistance.
tb08fogjch7.indd 287tb08fogjch7.indd 287 9/10/2008 12:50:43 PM9/10/2008 12:50:43 PM
288 Raphael
Employment bans based on former convictions and occupa-tional licensing restrictions should be based on the content of one’s criminal record and not applied in a blanket manner. Moreover, when used, employment bans should be based on conviction rather than arrest records. Any bans on the employment of felons mandated by law should be based on the nature of one’s previous behavior as well as the time that has elapsed since the felony was committed. In their analy-sis of the consideration that states give to criminal records, the Legal Action Center (2004) found that in nearly all states there is no standard or statute governing the consideration that employers and occupational licensing agencies are required to give to an employee who has a crimi-nal history. In many states, employers can fi re anyone who is found to have a criminal history regardless of the gravity of the offense, the time since conviction, or the relevance of the past behavior to one’s current job responsibility. In addition, employers are generally free to consider and discriminate based upon one’s criminal history in hiring, with most states allowing employers to consider arrests not leading to conviction.
Holzer, Raphael, and Stoll (2006) demonstrate that most employers of low-skilled labor check criminal records in some manner (either by directly asking the applicant, by paying a private fi rm, or by performing a query of the state criminal history repository), and that the proportion of employers that check has increased considerably over the decade of the 1990s. The high propensity to check, the complete discretion in considering past criminal records, and the high proportion of men with prior convictions all indicate a need for some governing standard that addresses the interests of employers but also recognizes the employ-ment needs of former inmates and those with prior convictions. With this in mind, states should prohibit fi rms from considering prior arrests that did not result in a conviction when making decisions about the hir-ing or fi ring of an employee. Moreover, publicly mandated employment bans of former felons for specifi c jobs as well as licensing bans should be based on the content of specifi c offenses or offender characteristics. In general, a more considerate and rational process for determining the suitability of former prisoners for employment in certain occupations is needed.
tb08fogjch7.indd 288tb08fogjch7.indd 288 9/10/2008 12:50:43 PM9/10/2008 12:50:43 PM
Boosting the Earnings of Low-Skilled Workers in the U.S. 289
We should invest more in labor market intermediaries that specialize in the reentry employment needs of recently released in-mates. When asked, many employers express an extreme reluctance to hire former inmates. However, a sizable minority indicate that they are indeed willing to hire offenders and actually do so, as measured by recent hiring outcomes. Governmental as well as nonprofi t entities devoted to workforce development often serve an important informa-tional role in matching clients to employers, which greatly minimizes the search costs for both parties. For a specifi c group of clients who face a stigma in searching for work, such job search assistance is likely to be particularly important.
Moreover, over time such intermediaries establish long-term rela-tionships and credibility with employers and are thus more effective in placing their clients in employment. Because over the past decade many more people have been incarcerated for relatively less serious offenses, intermediaries should easily be able to identify the most job-ready can-didates and offer up a steady supply of reentering former inmates who are prescreened and likely to be solid employees, or at least of compa-rable quality to an employer’s average hire.
Given the scale of the fl ow of inmates out of prison each year (on the order of 600,000), there is a large potential role for agencies and nonprofi ts devoted to minimizing employment search costs, prescreen-ing workers for employers, and aiding those who are reentering in be-coming ready for conventional employment.
States should incentivize desistance from criminal activity by expunging certain criminal records after a fi xed time period has elapsed. In a recent analysis, Kurlycheck, Brame, and Bushway (2006) raise the important question of whether unfettered employer access to criminal records can be justifi ed by the legitimate concerns of employ-ers and the public. They assess whether the rate at which young offend-ers desist from offending as time passes since the last offense merits limiting employer access to arrest and conviction information for suf-fi ciently distant past offenses. The authors demonstrate that for a cohort of young men in Philadelphia the likelihood of a repeat offense declines precipitously as time accrues since the last offense. This pattern is con-sistent with both a causal effect of staying clean and a remaining popu-lation of former offenders that becomes increasingly selected with time
tb08fogjch7.indd 289tb08fogjch7.indd 289 9/10/2008 12:50:43 PM9/10/2008 12:50:43 PM

290 Raphael
since the last offense (to be specifi c, selection occurs towards a low propensity to offend). For policy purposes, however, the exact source of this pattern is irrelevant. Based on this pattern, the authors argue that limiting employer access to criminal records beyond a certain time period may effectively limit the collateral consequences of prison while not necessarily exposing employers and the public to suffi ciently higher risk to warrant keeping access to the records open.
This simple proposal carries many advantages. Clearly, being able to procure and retain gainful employment is practically a necessary con-dition for the successful reintegration of former inmates into noninsti-tutionalized society. The expunging of one’s past offenses following a determined period of desistance will certainly improve the labor market prospects as well as the life prospects of former offenders. Moreover, the prospect of having one’s record wiped clean after a given period of desistance provides an incentive for former inmates to change their behavior.
Nonetheless, this proposal may have unintended negative conse-quences if employers care about prior criminal activity and engage in indirect and imperfect screening practices. In other words, limiting an employer’s ability to access criminal records or to ask about criminal convictions may not preclude employers from using potential signals of earlier run-ins with the law in making hiring and promotion deci-sions. At a minimum, employers may be able to effectively identify ex-offenders through such signals as education, where one comes from, or through unaccounted-for gaps in one’s employment history. At worst, employers may systematically discriminate against workers who come from groups that they perceive to have a high propensity to offend, such as young black men (Holzer, Raphael, and Stoll 2006). This important issue of how employers may respond to limits on access is key to de-signing a policy that not only allows employers to take into account aspects of an individual’s history that are legitimately related to assess-ing potential job performance, but also protects those who, through the passage of time, have demonstrated the irrelevance of their past infrac-tions to their future performance.
There are several key choice variables that should be considered in designing an information policy that balances the ability of employers to have access to relevant information about applicants and employees with the interests of former offenders who have managed to stay out of
tb08fogjch7.indd 290tb08fogjch7.indd 290 9/10/2008 12:50:44 PM9/10/2008 12:50:44 PM
Boosting the Earnings of Low-Skilled Workers in the U.S. 291
trouble. First and foremost among these choice variables is the length of the time limit placed on criminal history inquiries. If the limit that is set is too short, employers will not have confi dence in formal checks and thus will employ informal screens as a supplement, undoing much of the potential benefi t to ex-offenders from suppressing such informa-tion in the fi rst place. To the extent that the limit is too long, few of-fenders will benefi t and there will be little added incentive to stay clean because of the prospect of an expunged record. Kurlycheck, Brame, and Bushway (2006) focus on the seven-year limit set in the federal statute pertaining to the trucking industry. Clearly, more research on employer hiring practices with a focus on this specifi c question would greatly inform this choice.
A second choice variable concerns the starting point for the time period framing the criminal record. The authors advocate for a start date corresponding to the date of the most recent conviction, arguing that since few employers have access to incarceration information, time since incarceration is irrelevant. However, one can imagine that, with the knowledge that records are purged after seven years, employers may still downgrade applications from young men whom they suspect have served some time. Knowing that a clean criminal record check is consistent with either 1) never having offended, or 2) having offended and potentially served time but having had no contact with the criminal justice system for the past seven years, provides considerably more in-formation than the alternative of ignoring incarceration.
A third important choice variable concerns whether there are some offenses that should never be purged. One might make the argument that someone who has served time for a felony sex offense should never work with children, or that workers with prior serious violent offenses should not be placed in jobs that involve providing security. Again, a better understanding of how employers consider such mitigating fac-tors would provide useful information for forming a viable policy prescription.
Regardless, the growing numbers of noninstitutionalized felons raise important policy questions regarding reintegration and the man-ner in which society can ease and facilitate the transition of former of-fenders into productive and stable lives. Stable employment is clearly key. To the extent that we can improve the prospects of former offend-ers without substantially harming the interests of employers, and while
tb08fogjch7.indd 291tb08fogjch7.indd 291 9/10/2008 12:50:44 PM9/10/2008 12:50:44 PM

292 Raphael
providing a positive incentive to desist from criminal offending, we should do so.
CONCLUSION
The past three decades have not been kind to low-skilled work-ers in the United States. In addition to low-skilled adults experiencing substantial real declines in hourly earnings, their employment rates, es-pecially those for low-skilled minority men, have dropped to historic lows. Concurrently, the incarceration rates of these same adults have increased tremendously, to the point where for certain subgroups of the adult male population the likelihood of being institutionalized at any given point in time is nearly equal to the likelihood of being employed or the likelihood of being noninstitutionalized yet idle.
These developments are clearly related. I have demonstrated the effects of declining wages on employment and incarceration rates. There is also a growing body of research suggesting a reverse causal link from prior incarceration to employment outcomes. This line of re-search, combined with the disturbing incarceration trends that I have documented, indicates that the problems faced by ex-offenders repre-sent an increasingly important and daunting challenge to antipoverty policy in the United States.
I have offered and analyzed two sets of policy responses by state and federal policymakers to these developments: 1) expanding the EITC for childless adults and noncustodial parents, and 2) taking steps to elimi-nate some of the offi cial barriers to employment and impediments to reentry for former prison inmates and convicted felons. These clearly address only a small set of the problems faced by low-income adults. Yet action on these fronts would most certainly be helpful.
tb08fogjch7.indd 292tb08fogjch7.indd 292 9/10/2008 12:50:44 PM9/10/2008 12:50:44 PM
Appendix 7A
Estimating Labor Supply Elasticities by Race and Gender
I use data from the 1980, 1990, and 2000 census PUMS fi les to estimate the labor supply elasticities for men and women overall and for men and women by race and ethnicity. I then use these estimates to assess the degree to which changes in employment between 1980 and 2000 can be attributable to changes in wages. The supply elasticity estimates come from estimating the equation
(7A.1) Eexry = αy + βe + κx + γLnWexry + εexry ,
where Eexry is the employment rate for adults in our sample in education group e (less than high school, high school graduate, some college, college plus), in la-bor market experience group x (5 years or less, 6 to 10 years, 11 to 15 years, 16 to 20 years, 21 to 25 years, 26 to 30 years, 31 to 35 years, and 36-plus years), in racial group r (white, black, Asian, or Hispanic), and in year y (1980, 1990, and 2000), LnWexry is the corresponding average of log wages for members of this group, εexry is a mean-zero error term, αy represents a year-specifi c fi xed ef-fect, and βe represents a fi xed effect for all adults in the education group e, and κx represents a fi xed effect for experience groups. The coeffi cient γ gives the responsiveness of employment for members of the group to a change in aver-age log wages. The labor supply elasticity is defi ned by the equation
η = W ∂E = 1 ∂E . E ∂W E ∂1nW
Since γ provides an estimate of ∂E , calculating the elasticity requires dividing through by the employment rate. Since I’m dividing through by the average employment rate, the elasticity should be interpreted as the responsiveness of the group at the mean. The inclusion of year-fi xed effects as well as education- and experience-fi xed effects means that the elasticity estimates are identifi ed using variation in the changes in employment and earnings occurring within education and experience groups across racial or ethnic groups.
I estimate Equation (7A.1) separately for men and women to derive overall estimates of the responsiveness of male and female labor supply. I also esti-mate the following modifi ed specifi cation
293
tb08fogjch7.indd 293tb08fogjch7.indd 293 9/10/2008 12:50:44 PM9/10/2008 12:50:44 PM

294 Raphael
(7A.2) Eexry = αy + βe + κx + δ × Blackexry + λ × Whiteexry + η × Asianexry
+ γ0 LnWexry + γ1LnWexrt × Blackexry + γ2 LnWexry × Whiteexry
+ γ3 LnWexry × Asianexry + εexry ,
where Blackexry is a dummy variable equal to one if the group is black and zero otherwise, and Whiteexry and Asianexry are similar dummy variables indicating white and Asian demographic subgroups. This specifi cation allows the sup-ply responsiveness to changes in wages to vary by race and ethnicity. The base coeffi cient γ0 indicates the responsiveness of Hispanic labor supply (the group omitted by the dummy variables) to changes in wages. The coeffi cient on the interaction term between the black dummy and log wages, γ1, indicates the degree to which black labor supply responsiveness differs from Hispanic labor supply responsiveness. The overall responsiveness of black labor supply requires adding the based coeffi cient, γ0, and the coeffi cient on the interaction term, γ1. Similar derivations would yield the labor supply responsiveness for whites and Asians. Note that the addition of race-specifi c dummy variables indicates that supply responsiveness is being estimated using variation in the changes in employment and earnings occurring within education and experi-ence groups and within racial or ethnic groups. Again, converting the respon-siveness parameter into an elasticity estimate requires dividing by the race-specifi c mean employment rate.
Equations (7A.1) and (7A.2) are estimated using employment rates and earnings potential for all men and women, institutionalized as well as nonin-stitutionalized. Thus, any impact of wage changes on institutionalization op-erating through withdrawal from the formal labor force will be refl ected in the elasticity estimates.
Table 7A.1 presents the results of this analysis. For both men and women, I present estimation results for all adults in the sample and for adults with a high school degree or less. Parameter estimates for the coeffi cient on log wages and the interaction terms with log wages are presented in the top half of the table, while the implied elasticity estimates (the calculations represented graphically in Figures 7.1 and 7.2) are presented in the bottom half. The high elasticity estimates in Figures 7.1 and 7.2 use the largest race-specifi c estimates from the table, while the lowest are based on the smallest.
tb08fogjch7.indd 294tb08fogjch7.indd 294 9/10/2008 12:50:44 PM9/10/2008 12:50:44 PM

295Table 7A.1 Estimated Effects of Log Wages on the Likelihood of Being Employed at the Time of Interview for Men,
and the Corresponding Implied Labor Supply ElasticitiesMen Women
All menMen with a high
school diploma or less All womenWomen with a high
school diploma or less(1) (2) (3) (4) (5) (6) (7) (8)
Log wage 0.159(0.039)
0.136(0.039)
0.029(0.079)
−0.120(0.093)
0.279(0.049)
0.258(0.050)
0.449(0.083)
0.378(0.093)
Log wage × white — 0.019(0.018)
— 0.105(0.035)
— −0.104(0.024)
— −0.110(0.049)
Log wage × black — 0.265(0.023)
— 0.364(0.039)
— 0.086(0.028)
— 0.157(0.059)
Log wage × Asian — 0.019(0.032)
— 0.150(0.107)
— −0.179(0.040)
— −0.165(0.045)
Implied labor supply elasticities
OverallWhiteBlackAsianHispanic
0.196————
—0.1800.6370.1860.184
0.039————
—−0.019
0.4350.041
−0.170
0.426————
—0.2270.5480.1240.488
0.792————
—0.4491.0080.3880.816
R2 0.892 0.930 0.885 0.918 0.902 0.924 0.884 0.903N 449 449 239 239 447 447 239 239
(continued)
tb08fogjch7.indd 295tb08fogjch7.indd 295
9/10/2008 12:50:45 PM9/10/2008 12:50:45 PM
296 NOTE: Standard errors are in parentheses. Dashes indicate that the variable in question was not included in the regression specifi cation, therefore the data are not available. All models are based on regressions of the proportion of employment on average log wages based on demographic cells defi ned by year, level of educational attainment, labor market experience, and race/ethnicity. See text for the num-ber of categories within each dimension and the specifi c defi nitions. All regressions include dummies for year-fi xed effects, education group–fi xed effects, experience group–fi xed effects, and race-fi xed effects and are based on data from the 1980, 1990, and 2000 censuses. All models are weighted by the sum of the sample weights within the defi ned cells. Supply elasticities are calculated by dividing the point estimate for the effect of log wages on employment by the average employment rate for the group in question.
SOURCE: Author’s tabulations based on data from the 1980, 1990, and 2000 Public Use Microdata Samples (PUMS) of the U.S. Census of Population and Housing.
Table 7A.1 (continued)
tb08fogjch7.indd 296tb08fogjch7.indd 296
9/10/2008 12:50:45 PM9/10/2008 12:50:45 PM

Appendix 7B
Assessing the Contribution of Declining Wages to Increases in Incarceration Rates
Let c be the likelihood that an individual chosen at random commits a crime, and p be the likelihood of being caught and convicted, conditional on committing a crime. Let θ be the rate at which inmates are released from pris-on. Assume that c is a function of legitimate wages—i.e., c = c(w)—where c’(w) < 0. Raphael and Stoll (2007) demonstrate that under these assumptions the long-run equilibrium incarceration rate will be equal to
(7B.1) Inc = c(w)p . c(w)p + θ
In Equation (7B.1), incarceration increases in the transition probability from nonincarceration to incarceration (c(w)p) and decreases in the transition prob-ability out of prison (θ). Differentiating Equation (7B.1) with respect to wages yields the expression
(7B.2) ∂Inc = ∂Inc × ∂c = θ × p × ∂c , ∂w ∂c ∂w (cp + θ)2 ∂w
where the dependence of c on w is suppressed for simplicity. In practice, cp is a very small number (generally below 0.003) while θ is relatively large (around 0.5). If we set cp = 0, Equation (7B.2) is reduced to
(7B.3) ∂Inc = ∂Inc × ∂c = 1 × p × ∂c . ∂w ∂c ∂w θ ∂w
If we assume that the time-served distribution is exponential, then the fi rst term provides the expected value of time served. Thus Equation (7B.3) becomes
(7B.4) ∆Incarceration = E(T ) × p × ∆Crime . ∆1nW ∆LnW
Equation (7B.4) illustrates that the increase in incarceration caused by a de-crease in wages will operate through the product of three factors. Moving from right to left on the right hand side of Equation (7B.4), a decline in wages will
297
tb08fogjch7.indd 297tb08fogjch7.indd 297 9/10/2008 12:50:45 PM9/10/2008 12:50:45 PM
298 Raphael
increase criminal activity (that is to say, ∆Crime will be negative). This in turn ∆1nW will increase incarceration in proportion to the probability of being apprehend-ed and sentenced, conditional on having committed a crime (the parameter, p). Finally, the ultimate effect on the overall incarceration rate will be larger the longer the expected amount of time the sentenced prisoner will serve (given by E(T ) in Equation [7B.4]). Thus with estimates for each of these factors, and with the wage trends presented in Table 7.3, one could estimate the proportion of the increase in institutionalization rates depicted in Table 7.5 that can be at-tributable to declining wages.
I draw estimates for each of these factors from various sources. Grogger (1998) estimates that the effect of a change in the natural log of hourly earnings on the likelihood of engaging in income-generating activity is approximately −0.25. I use this number for the change in crime caused by a change in log wages. Based on an analysis of criminal offending and incarceration among respondents of the NLSY79 data set, and the increased risk of incarceration over the past 20 years, I estimate that the likelihood of being caught and incar-cerated among those who are actively engaged in income-generating criminal activity is 0.06 (see Raphael and Stoll [2007] for details). With regard to ex-pected time served, the median inmate in the United States serves a term of slightly more than two years on a given prison spell. However, those offenders coaxed into criminal activity by declining wages are likely to commit fewer and less serious crimes relative to those already incarcerated. Thus, here I as-sume that such marginal offenders that wind up in prison or jail serve no more than 1.5 years on average. Multiplying these three parameters suggests that the value of the derivative in Equation (7B.1) is equal to −0.0225. Multiplying this estimate by the actual change in wages for any given subgroup provides an estimate of the predicted increase in incarceration caused by the change in the group’s wages.
tb08fogjch7.indd 298tb08fogjch7.indd 298 9/10/2008 12:50:45 PM9/10/2008 12:50:45 PM
Boosting the Earnings of Low-Skilled Workers in the U.S. 299
Notes
I thank Timothy Bartik, Adam Carasso, Sheldon Danziger, Harry Holzer, Susan Houseman, Robert Reich, and Eugene Smolensky for their much-valued input.
1. Among the many explanations for the increase in earnings inequality over the past three decades, some of the most common include skill-biased technological change that has increased demand for high-skilled workers and reduced demand for low-skilled workers (Autor and Katz 1999), the erosion of the real value of the minimum wage (DiNardo, Fortin, and Lemieux 1996), increased interna-tional trade with less-developed nations (Borjas, Freeman, and Katz 1997), and increased labor market competition from low-skilled immigrants (Borjas 2003; Freeman, Katz, and Borjas 1997).
2. Between 1975 and 2005, the number of state and federal prisoners per 100,000 U.S. residents increased from 111 to 491, constituting a 342 percent increase over this time period and a ratio of 4.42 inmates in 2005 to 1 inmate 30 years earlier. Between 1980 and 2005, the number of inmates in local and county jails increased from 81 per 100,000 to 252 per 100,000, a 211 percent increase and a ratio of 3.11 inmates in 2005 to 1 inmate a quarter-century earlier. For details, see Raphael and Stoll (2007) and the Bureau of Justice Statistics (2007).
3. The computation is based on four mutually exclusive race categories (non-Hispanic white, non-Hispanic black, non-Hispanic Asian, and Hispanic), nine educational attainment groups (no schooling, fourth grade or less, fi fth through eighth grade, ninth, tenth, eleventh, and twelfth grades, one to three years of college, and col-lege-plus), year (1980, 1990, or 2000), gender, and eight potential labor market experience groups (5 years or less, 6 to 10 years, 11 to 15 years, 16 to 20 years, 21 to 25 years, 26 to 30 years, 31 to 35 years, and 36-plus years). I measure labor market experience by assuming an entry age of 16 for workers with less than a high school education, 18 for high school graduates, 20 for those with some col-lege, and 22 for college graduates. For workers who are institutionalized, I assume that they have not worked in the previous year since for many of these workers the long form of the PUMS is completed using administrative records that are likely to vary in quality across institutions (Butcher and Piehl 2006).
4. See Autor and Katz (1999) for a general discussion of wage trends in the United States. Juhn (2003) also computes wages for nonparticipants using the average wage of workers in matching demographic groups who work fewer than 13 weeks for the computation. Here I match to median wages for workers in one’s demo-graphic group without placing a restriction on weeks worked, because preliminary analysis revealed workers with unusually high wages among those working few weeks. This latter pattern most likely refl ects measurement error in the “weeks worked” variable in the IPUMS-CPS database.
5. That is to say, the substitution effect associated with a decline in wages militates towards supplying less time to the labor market. The income effect of lower wag-es, however, will in isolation induce one to supply more time to the labor market
tb08fogjch7.indd 299tb08fogjch7.indd 299 9/10/2008 12:50:45 PM9/10/2008 12:50:45 PM

300 Raphael
and consume less free time. While these two effects are offsetting and thus imply that a decrease in wages may correspond to an increase in time supplied, much of the recent empirical research on the labor supply effects of diminished low-skilled wages suggests that the net effect on labor supply has been negative (Devereux 2003; Juhn 1992, 2003; Pencavel 1997, 2002).
6. I calculate the predicted change in employment attributable to declining wages by multiplying the supply elasticity by the actual proportional decline in wages and by the base employment rate for each group in 1980.
7. Of course, I am not saying that a year in prison is not costly. However, a year’s absence from the labor market during the beginning of one’s career would have only a small effect on accumulated experience.
8. The California inmate population is roughly evenly distributed between whites, Hispanics, and blacks and is overwhelmingly male.
9. Research on the employment effects of raising the minimum wage suggests that small increases result in negligible levels of job destruction, though large increas-es do indeed reduce employment. The impact on total earnings accruing to mini-mum-wage workers depends on how sensitive the demand for labor is to changes in wages. Most research suggests that demand for low-skilled workers is relatively inelastic, and thus an increase in the minimum wage leads to a total increase in the aggregate wage bill accruing to low-wage workers.
10. In particular, for households with incomes in the region of the benefi ts schedule between the maximum benefi t threshold and the phaseout threshold, the EITC increases income without altering the marginal return to an additional hour of work. Simple economic theory predicts that such an increase in income would induce most people to work fewer hours. Workers whose income places them in the phaseout region of the benefi ts schedule have particularly strong incentives to work fewer hours, as the phaseout rate reduces the hourly wage by 21 percent while the benefi t provides a positive increase in income. Existing research sug-gests that the negative incentive effects are particularly strong for secondary earn-ings in two-parent families (Eissa and Hoynes 2004).
11. In the report, From Poverty to Prosperity: A National Strategy to Cut Poverty in Half, The Center for American Progress (2007) proposes an expansion of the EITC nearly identical to that in Edelman, Holzer, and Offner (2006), with the ad-dition that the childless tax credit be made available to all adults over age 24 and to adults between 18 and 24 who are not enrolled in school. The report also calls for an expansion of the phase-in rate for families with three or more children to 45 percent. Currently, a phase-in rate of 40 percent applies to all families with two or more children. Thus, the proposal would not affect the phase-in rate for two-child families while increasing the rate for larger families.
12. An alternative form of this hybrid would be to calculate benefi ts based on indi-vidual income for some phase-in period (say the fi rst three years of marriage as proposed in Edelman, Holzer, and Offner [2006]).
13. I use the March 2006 CPS to fi rst classify all adults by marital status and by whether they have dependents under 18. The four possibilities are then used to simulate tax fi ling units, where presumably single childless workers fi le inde-
tb08fogjch7.indd 300tb08fogjch7.indd 300 9/10/2008 12:50:46 PM9/10/2008 12:50:46 PM
Boosting the Earnings of Low-Skilled Workers in the U.S. 301
pendent returns, single parents fi le returns as a head of household, and married couples fi le joint returns.
14. Edelman, Holzer, and Offner (2006) assume a take-up rate of the childless benefi t of 0.67 and limit the credit to workers aged 21 to 64. Imposing these two restric-tions lowers my cost estimates for this plan to $8.6 billion, quite close to the $9.8 billion estimate offered by the authors.
15. Under the EHO proposal, the highest possible phaseout income would be for a married couple with two or more children. Using the 2006 EITC phaseout total, total earnings must satisfy the equation Incomeh + 0.5 × Incomel ≤ 38,348, where the fi rst term is the income of the higher-earning spouse and the second term is the income of the lower-earning spouse. The highest possible total income that is still eligible for a benefi t is approximately $51,000. However, the benefi t accruing to such a household would be miniscule.
16. This method basically ignores how the EITC affects the returns to the margin-al hour. To be sure, for many workers who receive the EITC credit, the credit increases take-home pay while providing an incentive to reduce hours worked. With this caveat in mind, the calculated employment effects are offered as base-line estimates for the purposes of bounding the employment effect from above. Nonetheless, the fact that most recipients receive the EITC as a once-per-year lump-sum payment may indicate that the connection between the benefi ts calcula-tion parameters and the returns to additional work on the margin may be blurred for most. If this is the case, these simple calculations would provide reasonable fi rst approximations.
17. For “single with no dependents under 18,” the EHO proposal and the hybrid pro-posal are identical.
18. The analysis above looks at the proportion of income accruing to the deciles of the simulated tax-fi ling units. Analysis of the absolute dollars accruing to these deciles also reveals larger absolute benefi ts for households in the bottom three deciles.
References
Berlin, Gordon L. 2007. “Rewarding the Work of Individuals: A Counterintui-tive Approach to Reducing Poverty and Strengthening Families.” MDRC working paper. New York: MDRC. http://www.mdrc.org/publications/443/workpaper.pdf (accessed July 11, 2007).
Bonczar, Thomas P. 2003. Prevalence of Imprisonment in the U.S. Population, 1974–2001. Bureau of Justice Statistics Special Report, NCJ 197976. Wash-ington, DC: U.S. Department of Justice, Offi ce of Justice Programs. http://www.ojp.usdoj.gov/bjs/pub/pdf/piuspol.pdf (accessed July 11, 2007).
Borjas, George J. 2003. “The Labor Demand Curve Is Downward Sloping: Reexamining the Impact of Immigration on the Labor Market.” Quarterly Journal of Economics 118(4): 1335–1374.
tb08fogjch7.indd 301tb08fogjch7.indd 301 9/10/2008 12:50:46 PM9/10/2008 12:50:46 PM

302 Raphael
Borjas, George J., Richard B. Freeman, and Lawrence F. Katz. 1997. “How Much Do Immigration and Trade Affect Labor Market Outcomes?” Brook-ings Papers on Economic Activity 1(1997): 1–67.
Bureau of Justice Statistics. 2007. Key Crime and Justice Facts at a Glance. Washington, DC: U.S. Department of Justice, Offi ce of Justice Pro-grams, Bureau of Justice Statistics. http://www.ojp.usdoj.gov/bjs/glance.htm#Corrections (accessed July 20, 2007).
Butcher, Kristin F., and Anne Morrison Piehl. 2006. “Why Are Immigrants’ In-carceration Rates So Low? Evidence on Selective Immigration, Deterrence, and Deportation.” Working Paper 13229. Cambridge, MA: National Bureau of Economic Research. http://www.nber.org/papers/w13229 (accessed July 11, 2007).
Card, David, and Alan B. Krueger. 1994. “Minimum Wages and Employment: A Case Study of the Fast-Food Industry in New Jersey and Pennsylvania.” American Economic Review 84(4): 772–793.
Center for American Progress. 2007. From Poverty to Prosperity: A National Strategy to Cut Poverty in Half. Report and Recommendations of the Center for American Progress Task Force on Poverty. Washington, DC: Center For American Progress.
Craig, Scott R. 1987. “Negligent Hiring: Guilt By Association.” Personnel Ad-ministrator 32(October): 32–34.
Danziger, Sheldon H., and Peter Gottschalk. 2005. “Diverging Fortunes: Trends in Poverty and Inequality.” In The American People: Census 2000, Reynolds Farley and John Haaga, eds. New York: Russell Sage Foundation, pp. 49–75.
Devereux, Paul J. 2003. “Changes in Male Labor Supply and Wages.” Indus-trial and Labor Relations Review 56(3): 409–428.
DiNardo, John, Nicole M. Fortin, and Thomas Lemieux. 1996. “Labor Market Institutions and the Distribution of Wages, 1973–1992: A Semiparametric Approach.” Econometrica 64(5): 1001–1044.
Donohue, John J. 2007. “Assessing the Relative Benefi ts of Incarceration: The Overall Change of the Previous Decades and the Benefi ts on the Margin.” Working paper. New Haven, CT: Yale University.
Edelman, Peter, Harry J. Holzer, and Paul Offner. 2006. Reconnecting Disad-vantaged Young Men. Washington, DC: Urban Institute.
Eissa, Nada, and Hilary Williamson Hoynes. 2004. “Taxes and the Labor Market Participation of Married Couples: The Earned Income Tax Credit.” Journal of Public Economics 88(9–10): 1931–1958.
Fagan, Jeffrey, and Richard B. Freeman. 1999. “Crime and Work.” Crime and Justice: A Review of Research 25(1999): 225–290.
Freeman, Richard B. 1987. “The Relation of Criminal Activity to Black Youth
tb08fogjch7.indd 302tb08fogjch7.indd 302 9/10/2008 12:50:46 PM9/10/2008 12:50:46 PM
Boosting the Earnings of Low-Skilled Workers in the U.S. 303
Employment.” Review of Black Political Economy 16 (1–2): 99–107.Gould, Eric D., Bruce A. Weinberg, and David B. Mustard. 2002. “Crime Rates
and Local Labor Market Opportunities in the United States: 1979–1997.” Review of Economics and Statistics 84(1): 45–61.
Grogger, Jeff. 1998. “Market Wages and Youth Crime.” Journal of Labor Eco-nomics 16(4): 756–791.
Hahn, Jeffrey M. 1991. “Pre-Employment Information Services: Employers Beware.” Employee Relations Law Journal 17(1): 45–69.
Holzer, Harry J., Steven Raphael, and Michael A. Stoll. 2006. “Perceived Criminality, Criminal Background Checks and the Racial Hiring Practices of Employers.” Journal of Law and Economics 49(2): 451–480.
———. 2007. “The Effect of an Applicant’s Criminal History on Employer Hiring Decisions and Screening Practices: Evidence from Los Angeles.” In Barriers to Reentry? The Labor Market for Released Prisoners in Post-Industrial America, Shawn D. Bushway, Michael A. Stoll, and David Wei-man, eds. New York: Russell Sage Foundation.
Juhn, Chinhui. 1992. “The Decline in Male Labor Force Participation: The Role of Declining Market Opportunities.” Quarterly Journal of Economics 107(1): 79–121.
———. 2003. “Labor Market Dropouts and Trends in the Wages of Black and White Men.” Industrial and Labor Relations Review 56(4): 643–662.
Juhn, Chinhui, and Simon Potter. 2006. “Changes in Labor Force Participation in the United States.” Journal of Economic Perspectives 20(3): 27–46.
Katz, Lawrence F., and David H. Autor. 1999. “Changes in the Wage Structure and Earnings Inequality.” In Handbook of Labor Economics, Vol. 3A, Orley C. Ashenfelter and David Card, eds. Amsterdam: Elsevier/North-Holland, pp. 1463–1555.
Kurlycheck, Megan C., Robert Brame, and Shawn D. Bushway. 2006. “Scarlet Letters and Recidivism: Does An Old Criminal Record Predict Future Of-fending?” Criminology and Public Policy 5(3): 483–504.
Lee, David S., and Justin McCrary. 2005. “Crime, Punishment, and Myopia.” NBER Working Paper 11491. Cambridge, MA: National Bureau of Eco-nomic Research.
Legal Action Center. 2004. After Prison: Roadblocks to Reentry, A Report on State Legal Barriers Facing People with Criminal Records. New York: Le-gal Action Center.
Levitt, Steven D. 1998. “Juvenile Crime and Punishment.” Journal of Political Economy 106(6): 1156–1185.
Meyer, Bruce D., and Douglas Holtz-Eakin, eds. 2001. Making Work Pay: The Earned Income Tax Credit and Its Impact on America’s Families. New York: Russell Sage Foundation.
tb08fogjch7.indd 303tb08fogjch7.indd 303 9/10/2008 12:50:46 PM9/10/2008 12:50:46 PM
304 Raphael
Meyer, Bruce D., and Dan T. Rosenbaum. 2001. “Welfare, the Earned Income Tax Credit, and the Labor Supply of Single Mothers.” Quarterly Journal of Economics 116(3): 1063–1114.
Pager, Devah. 2003. “The Mark of a Criminal Record.” American Journal of Sociology 108(5): 937–975.
Pencavel, John. 1997. “Changes in Male Work Behavior and Wages.” Working Paper 97-046. Stanford, CA: Stanford University.
———. 2002. “A Cohort Analysis of the Association between Work Hours and Wages among Men.” Journal of Human Resources 37(2): 251–274.
Petersilia, Joan. 2003. When Prisoners Come Home: Parole and Prisoner Re-entry. Oxford: Oxford University Press.
Primus, Wendell. 2006. “Improving Public Policies to Increase the Income and Employment of Low-Income Nonresident Fathers.” In Black Males Left Be-hind, Ronald B. Mincy, ed. Washington, DC: Urban Institute, pp. 211–248.
Raphael, Steven. 2006. “The Socioeconomic Status of Black Males: The In-creasing Importance of Incarceration.” In Public Policy and the Income Distribution, Alan J. Auerbach, David Card, and John M. Quigley, eds. New York: Russell Sage Foundation, pp. 319–358.
Raphael, Steven, and Michael A. Stoll. 2004. “The Effect of Prison Releases on Regional Crime Rates.” In Brookings-Wharton Papers on Urban Affairs, William G. Gale and Janet Rothenberg Pack, eds. Washington, DC: Brook-ings Institution, pp. 207–255.
———. 2007. “Why Are So Many Americans in Prison?” National Poverty Center Working Paper #07-10. Ann Arbor, MI: National Poverty Center, University of Michigan.
Raphael, Steven, and Rudolf Winter-Ebmer. 2001. “Identifying the Effect of Unemployment on Crime.” Journal of Law and Economics 44(1): 259–284.
Travis, Jeremy. 2005. But They All Come Back: Facing the Challenges of Pris-oner Reentry. Washington DC: Urban Institute Press.
tb08fogjch7.indd 304tb08fogjch7.indd 304 9/10/2008 12:50:46 PM9/10/2008 12:50:46 PM

A Future of Good Jobs?America’s Challenge
in the Global Economy
Timothy J. BartikSusan N. Houseman
Editors
2008
W.E. Upjohn Institute for Employment ResearchKalamazoo, Michigan
Bartik & Houseman.indb 5 2/29/2008 1:42:00 PM

Library of Congress Cataloging-in-Publication Data
A future of good jobs? America’s challenge in the global economy / Timothy J. Bartik, Susan N. Houseman, editors. p. cm. The outgrowth of a conference sponsored by the Upjohn Institute in Washington, D.C., in June 2007. Includes bibliographical references and index. ISBN-13: 978-0-88099-331-9 (pbk. : alk. paper) ISBN-10: 0-88099-331-6 (pbk. : alk. paper) ISBN-13: 978-0-88099-332-6 (hardcover : alk. paper) ISBN-10: 0-88099-332-4 (hardcover : alk. paper) 1. Labor market—United States—Congresses. 2. Labor supply—United States—Congresses. 3. Manpower policy—United States—Congresses. 4. Industrial management—United States—Congresses. 5. Occupational training—United States—Congresses. I. Bartik, Timothy J. II. Houseman, Susan N., 1956- III. W.E. Upjohn Institute for Employment Research. HD5724.F88 2008 331.10973—dc22
2008003946
© 2008W.E. Upjohn Institute for Employment Research
300 S. Westnedge AvenueKalamazoo, Michigan 49007-4686
The facts presented in this study and the observations and viewpoints expressed are the sole responsibility of the authors. They do not necessarily represent positions of the W.E. Upjohn Institute for Employment Research.
Cover design by Alcorn Publication Design.Index prepared by Diane Worden.Printed in the United States of America.Printed on recycled paper.
Bartik & Houseman.indb 6 2/29/2008 1:42:00 PM