booming market of solid state lighting - the … market of solid state lighting carl m. lampert svc...
TRANSCRIPT

18 2011 Spring Bulletin
Contributed Original Article
LED Lighting on Virgin America Airbus A320 (Source: Wikimedia Common, Albert Domasin)
Recently, you may have noticed in your favorite home store, new solid state LED lighting (SSL) to replace compact fluorescent, tube fluorescent (FL), and incandescent lighting. They may be a bit
expensive, but LEDs are here to stay and are destined to gain market share.
There has been a revolution slowly brewing in lighting. Back in the 1980-90s, we had the emergence of compact fluorescent (CFL), which quickly became the low energy leader over the incandescent lights they replaced. With the advent of flat panel displays and laptops, smaller instant-on cold cathode fluorescent lamps (CCFLs) are used as backlights in laptop displays. Fluorescent lights have often raised recycling issues because of mercury in the tubes and the current trend is to replace all of fluorescent technology with solid state LEDs. Several driving forces are fueling this change. These include: size reduction in electronics, operational lifetime, reduction of maintenance costs, higher energy efficiency, better reliability, instant-on, luminous efficacy (light/power input). Also, lack of dimability, issues with flicker, noise, slow turn-on, loss of 20-30% output over the life of the FL tube, temperature dependency, and recycling issues in fluorescent systems has caused lamp manufacturers to seek out LED technology. The comparison of lighting technology cost and performance is shown in Table 1.
The important parameters for the rating of lamps are Luminous Efficacy, ηL or lumens (light output)/applied power, watts (lumens/w); Color Rendering Index (CRI) (range from 0-100), which is an indica-tion of the warmth or coolness of objects to appear natural. The CRI is 100 for solar illumination with roughly a 6500 K blackbody. The higher the Gamut Area Index (GAI), the more vivid the color perceived. The Correlated Color Temperature (CCT) relates to the perceived color temperature of the light compared to sunlight at 6500 K. High intensity spotlights can have a CCT of 5600-5700 K. The trends over the years for Luminous Efficacy of different light sources are interesting. A lumen is a measure of luminous flux, or a measure of the power of light as per-
Booming Market of Solid State LightingCarl M. Lampert SVC Technical Director and Managing Partner, Star Science
ceived by the human eye. For example, a typical 23W CFL emits 1500-1600 lumens. There is a shift to rate light fixtures in Lumens rather than in watts. The European Union agreed to this in September 2010.
SSL Production is ramping up and this presents a sales opportunity for vacuum coating equipment and target and chemical supplier sales. Also, there is a strong drive in this manufacturing area to automate and use smart high yield manufacturing systems. This represents opportuni-ties for manufacturing plant designers to develop lower cost mass pro-duction equipment. It also opens up challenging opportunities to R&D engineers and scientists to come up with better, more stable materials and less expensive processes, especially for OLEDs.
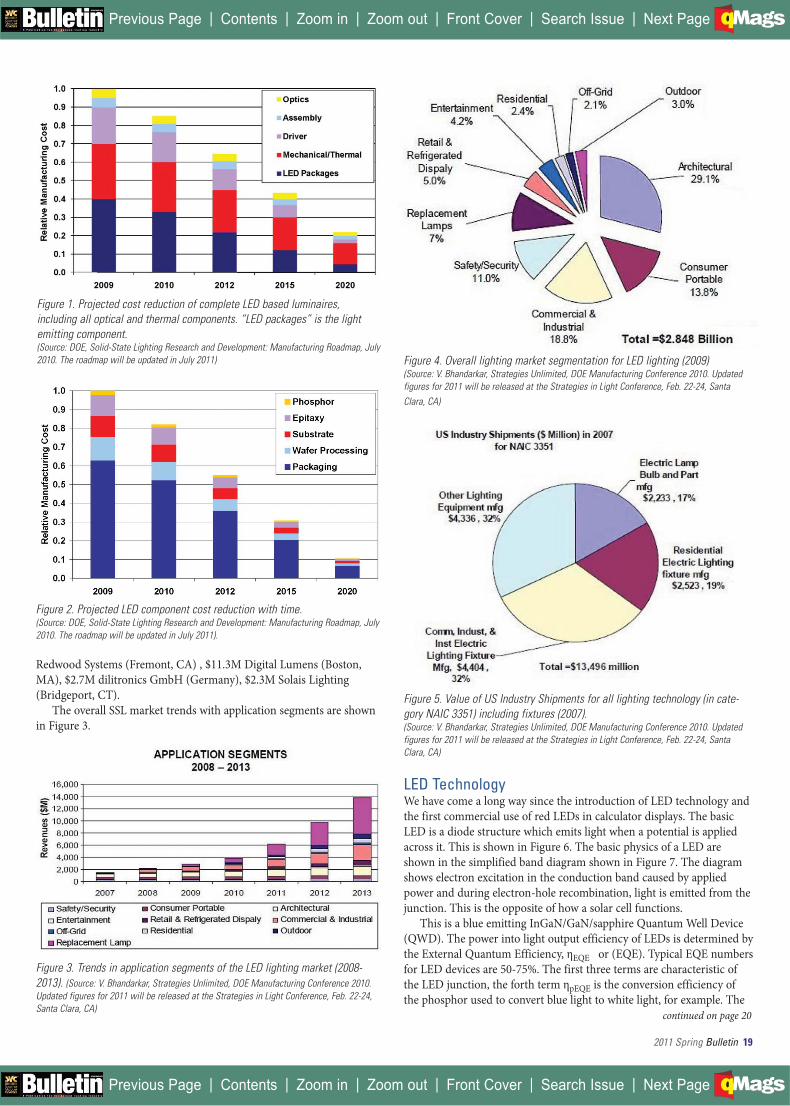
Two major directions are being followed: 1) LEDs based on GaN /GaAlAs wafer technology and, 2) OLEDs which may allow for flex-ible or roll coated illumination products. The wafer technology is a fairly mature technology that has a considerable history in the display industry. On the other hand, the OLED technology is a developing technology where much work is still going into development of more efficient materials and sealing technology. OLEDs have the potential to be the lowest price solid state illumination source. The consensus of manufacturers at the 2010 DOE Manufacturing workshop was that for LED based luminaire (light fixture) manufacturing, the projected cost track is on a cost reduction trend of 22%/yr. between 2009 and 2020. A typical LED luminaire consists of several cost components, LED package or emitter (40% of cost), optics, driving electronics, mechanical and thermal components and assembly costs. Figure 1 shows the projected cost reductions in the component parts of LED luminaire manufacturing. Figure 2 shows the projected cost reduction on the LED packaged component. It projected that wafer processing, encapsulation (packaging), epitaxial layer processing, and substrate cost will drop sig-nificantly over the next 10 years.
Investment ClimateThe investment climate is very positive, with lighting companies receiv-ing about $300M in venture capital funds in 2009 (Cleantech Group). Recent SSL venture deals of $50M Bridgelux (Livermore, CA), $37.5M Lemnis Lighting (The Netherlands), $33M QD Vision (Watertown, MA), $22M Wahan HC Semitek (China), $19M Luminus Devices (Billerica, MA), $12M Adura Technologies (San Francisco, CA), $12M,
Source Type Efficacy (lumen/Watt)
Normalized Retail Price (US $/K lumen)
Incandescent (60 W) 14 0.60
Fluorescent (40W T8) 83 0.73
HID- Metal Halide 100 1.27White LED (CCT=4746-7040K)(CRI=70-80, 35 A/cm2 @ 25C)
113 (2015 goal=215)
25 (2015 goal=2)
Table 1. Comparison of efficacy and cost of white lighting technologies. The price for the LED is projected to be 10% of the current cost by 2015. Data for White LED taken in 2009 form 1000 units of LEDs made by Cree, Lumileds and OSRAM in 2009. (Source: J. Brodrick, SPIE Denver conference, 2004, updated to 2009).
| | | | | |Previous Page Contents Zoom in Zoom out Front Cover Search Issue Next PageBA
M SaGEF
| | | | | |Previous Page Contents Zoom in Zoom out Front Cover Search Issue Next PageBA
M SaGEF
2011 Spring Bulletin 19
continued on page 20
Redwood Systems (Fremont, CA) , $11.3M Digital Lumens (Boston, MA), $2.7M dilitronics GmbH (Germany), $2.3M Solais Lighting (Bridgeport, CT).
The overall SSL market trends with application segments are shown in Figure 3.
Figure 3. Trends in application segments of the LED lighting market (2008-2013). (Source: V. Bhandarkar, Strategies Unlimited, DOE Manufacturing Conference 2010. Updated figures for 2011 will be released at the Strategies in Light Conference, Feb. 22-24, Santa Clara, CA)
Figure 4. Overall lighting market segmentation for LED lighting (2009) (Source: V. Bhandarkar, Strategies Unlimited, DOE Manufacturing Conference 2010. Updated figures for 2011 will be released at the Strategies in Light Conference, Feb. 22-24, Santa Clara, CA)
Figure 5. Value of US Industry Shipments for all lighting technology (in cate-gory NAIC 3351) including fixtures (2007). (Source: V. Bhandarkar, Strategies Unlimited, DOE Manufacturing Conference 2010. Updated figures for 2011 will be released at the Strategies in Light Conference, Feb. 22-24, Santa Clara, CA)
LED TechnologyWe have come a long way since the introduction of LED technology and the first commercial use of red LEDs in calculator displays. The basic LED is a diode structure which emits light when a potential is applied across it. This is shown in Figure 6. The basic physics of a LED are shown in the simplified band diagram shown in Figure 7. The diagram shows electron excitation in the conduction band caused by applied power and during electron-hole recombination, light is emitted from the junction. This is the opposite of how a solar cell functions.
This is a blue emitting InGaN/GaN/sapphire Quantum Well Device (QWD). The power into light output efficiency of LEDs is determined by the External Quantum Efficiency, ηEQE or (EQE). Typical EQE numbers for LED devices are 50-75%. The first three terms are characteristic of the LED junction, the forth term ηpEQE is the conversion efficiency of the phosphor used to convert blue light to white light, for example. The
Figure 1. Projected cost reduction of complete LED based luminaires, including all optical and thermal components. “LED packages” is the light emitting component. (Source: DOE, Solid-State Lighting Research and Development: Manufacturing Roadmap, July 2010. The roadmap will be updated in July 2011)
Figure 2. Projected LED component cost reduction with time.(Source: DOE, Solid-State Lighting Research and Development: Manufacturing Roadmap, July 2010. The roadmap will be updated in July 2011).
| | | | | |Previous Page Contents Zoom in Zoom out Front Cover Search Issue Next PageBA
M SaGEF
| | | | | |Previous Page Contents Zoom in Zoom out Front Cover Search Issue Next PageBA
M SaGEF

20 2011 Spring Bulletin
Solid State Lightingcontinued from page 19
phosphor is mixed with the encapsulant which protects and serves as an optical coupling medium from the LED chip.
ηEQE = ηinj x ηint x ηLext x ηpwhere:ηinj = fraction of electrons that recombine in the active region, for a QWD ≈ 1ηint = number of photons emitted from the active region per second/ number of electrons injected into the LED per second. Typically 60-95%ηLext = number of photons emitted into free space per second/ number of photons emitted from the active region per second. Typically 60-80%ηpEQE = conversion efficiency of phosphor
Figure 6. Schematic of a wafer based LED showing the basic p-n junction and InGaN/GaN quantum well layers to alter the local band gap to give blue emis-sion. In a cover (shown in Fig. 7) an encapsulant containing phosphors, this blue light is converted into white light. (Source: S. Nakamura, SSLEC, Univ. of Calif., Santa Barbara, CA)
Figure 7. LED schematic showing light emission and band diagram showing electron excitation and light emission during e--h+ recombination at the junc-tion. (Source: Wikimedia commons)
There are three methods of making white light with LEDs: 1) Blue LED with a yellow phosphor embedded in plastic cover; 2) UV LED with a RGB phosphor mixture embedded in plastic cover and, 3) three stacked LEDs red green and blue. Schematically these are shown in Figure 8.
Figure 8. Three methods of making white light with LEDs (left to right): 1) Blue LED with a yellow phosphor embedded in plastic cover; 2) UV LED with a RGB phosphor mixture embedded in plastic cover and, 3) three stacked LEDs red green and blue. The spectral response is shown for the two phosphor systems compared to sunlight (6500K) (Source: S. Nakamura, SSLEC, Univ. of Calif., Santa Barbara, CA)
Incandescents have not changed much over the years except that their lifetime has improved with better filament materials. The typical lifetimes are 1,000 hours for incandescent, 8,000 hours for CFLs and 25-30 years for LEDs. Fluorescent lamps have improved with better phosphors and sodium and HID-Halide lamps have improved with better design. In the 1990s, white LED-phosphor lights have greatly improved in luminous efficiency compared to many other types of light sources. Figure 9 illustrates the goals for the Univ. of Santa Barbara SSLEC program and the USDOE goals for LED light sources. There is currently an array of colored LEDs using a range of materials, as noted in Table 2, (page 22). The table shows quite an impressive array of LED materials and colors.
| | | | | |Previous Page Contents Zoom in Zoom out Front Cover Search Issue Next PageBA
M SaGEF
| | | | | |Previous Page Contents Zoom in Zoom out Front Cover Search Issue Next PageBA
M SaGEF

2011 Spring Bulletin 21
Figure 9. The trends in Luminous efficiency of different light sources compared to LEDs. This also illustrates the goals for the Univ. of Santa Barbara SSLEC program and the USDOE goals for LED light sources. (Source: S. Nakamura, SSLEC, Univ. of Calif., Santa Barbara, CA)
Organic LEDsOrganic LEDs or OLEDs are another devel-oping light source. They have the potential to be lower cost than wafer-based LEDs and have the ability to be made onto flexible sub-strates or float glass. However, OLEDs are a much younger technology than the wafer based LEDs and suffer from issues of length of lifetime and stability. Their organic layers are extremely sensitive to air and moisture, so this is a very critical issue with respect to encapsulation.
OLED manufacturing can be separated into 3 stages: 1) substrate preparation, which can include float glass, special glass or a flex-ible plastic; 2) deposition of active organic layers, and 3) encapsulation and panel fabrica-tion. In terms of angular illumination, OLEDs are Lambertian (emits light in all directions) compared to inorganic LEDs, which tend to emit from cone shape regions. So as a light source it is good for general lighting but not spot lighting. Glare is an issue with OLEDs, which is one more reason that luminaires be properly designed.
One of the more intriguing issues for optical and coating designers is how to out couple light from OLEDS or LEDs in the most loss-less way and still create a light that is satisfying to the user. So far the manufacturing experience with OLEDs is chiefly for displays, which cost in the range of $2,000/m2, but are more complex because of pixilation and Thin Film Transistor (TFT) drivers which are not needed for lighting. The DOE cost targets for OLEDs are $200/m2, an indication that a lot of progress is needed to get the cost down. Cost reduction can occur with substrate choice, and some processes are moving to soda-lime
glass as the substrate. Compared to specialty glass, this would show a reduction from about $50/m2 to $5/m2. Increasing substrate and depo-sition source size is another road to lower cost devices. Speeding up processing times, the use of linear sources instead of point sources has increased material utilization from 10% to 70%.[1]
Manufacturing and the U.S. Dept. of Energy Lighting ProgramAs the commercial side of SSL grows, the U.S. Department of Energy is promoting manufacturing of solid state lighting components in the U.S. We can save energy by using an 8W LED, which is equal to a 15W CFL, which is equal to a 60W incandescent light. If we deployed a 150 lm/W white LED source that replaced all of the world’s less efficient bulbs, the energy saving would be $100B/yr. (equivalent to 380 power plants). In July 2010, the DOE had a meeting that culminated in the production of the Solid State Lighting Research and Development: Manufacturing Roadmap. Updated yearly, it is designed to show the goals and where the needs of the industry are. Table 3 (page 23)shows
continued on page 22
| | | | | |Previous Page Contents Zoom in Zoom out Front Cover Search Issue Next PageBA
M SaGEF
| | | | | |Previous Page Contents Zoom in Zoom out Front Cover Search Issue Next PageBA
M SaGEF
_______________
_____________________________________________________
_____________________________________________________

22 2011 Spring Bulletin
the manufacturing priorities for LEDs. In the U.S. we have a substantial program on LED lighting. The American Recovery and Reinvestment Act of 2009 (ARRA) has a stimulus worth $787B US, and a portion of this is dedicated to lighting. Other countries such as China have a total stimulus worth $586B US for investment with $201B US earmarked for green technologies. The other G-20 countries (excluding the U.S.) have a combined stimulus of $692B US for 2009. Currently the US imports a large portion of lighting equipment as compared to exported equip-ment, shown in Figure 10. The imbalance is about 4-4.5:1 imported over exported. The world trend in fabrication facilities (FABs) is growing
very sharply outside of the Americas, especially in China and Taiwan. See Figure 11.
In the SEMI China LED Report in November 2010, the number of Fabs in China has grown to 42 with 3 pilot plants and 19 plants under construction and 4 more being planned.
Regarding item 4 in Table 3, the Epitaxial layer growth, all GaN LEDs are currently manufactured using metal organic chemical vapor deposition (MOCVD). The device structure consists of a low tem-perature nucleation layer, thick GaN buffer, and thin Multi-quantum Well (MQW) region. Equipment is available with 45 x 2” or 12 x 4” wafer capacity, but the rate of growth of the layers is very slow, gener-ally taking 5-10 hours per cycle. A faster alternative for the thick GaN buffer layter is Hydride Vapor Phase Epitaxy (HVPE); it is less suitable
Solid State Lightingcontinued from page 21
Table 2. Listing of LED by color, emission wavelength, voltage and material. Source: http://en.wikipedia.org/wiki/Light-emitting_diode
| | | | | |Previous Page Contents Zoom in Zoom out Front Cover Search Issue Next PageBA
M SaGEF
| | | | | |Previous Page Contents Zoom in Zoom out Front Cover Search Issue Next PageBA
M SaGEF

2011 Spring Bulletin 23
Figure 10. The trend in imported versus exported lighting equipment in the US. With new DOE manufacturing programs, they would like to increase the amount of manufacturing in the US of lighting equipment., thereby decreasing imports. (Source: V. Bhandarkar, Strategies Unlimited, DOE Manufacturing Conference 2010).
for the MQW layers. Active thickness control of the 460 nm MQW region is very important since 1˚C process change can shift the emission wavelength by 1.8 nm. No standard method of this process control is available.
Monitoring of wafer bow is another important parameter. Overall process efficiency such as chamber cleaning is important and substrates for manufacturing need to be better standardized. Currently a range of materials are used, including sapphire, SiC, Silicon, and GaN for example, with sapphire and SiC being the most common. Some R&D is investigating large Silicon wafers as LED substrates. However, if GaN wafers became available at reasonable cost, processing would become more simplified with no need for complicated buffering to overcome lattice and thermal mismatch. General equipment needs are for large throughput high yield manufacturing. The current process throughput is 50 wafers/hr. with a process yield of 60% and productivity yield of 50%. By 2015 the goal is to have process throughput at 100 wafers/hr. with both 90% yield for process and productivity. Binning is currently used to sort out batches of LEDs with similar CCT and luminous efficacy.
ConclusionAs one can see, there are many issues to be worked on to reduce the manufacturing cost of LEDs and make OLEDs stable and economic. LED solid state lighting is just entering the mainstream of the lighting replacement market. Coatings, materials and equipment design by a wide variety of SVC individuals and corporations will play an important role in making this happen.
References1. Uwe Hoffman, Applied Materials, SPIE 2010 Symposium, paper 46.1
1) Luminarie and LED Module ManufacturingAutomation manufacturing and Design Tools for high quality, low cost manufacturing. R&D investigation of thermal and cur-rent droop, handling thermal condcution from LED packages
2) Driver Manufacturing Improved Design to reduce parts, have flexibility and lower cost. Make compatible with dimming and light sensors.
3) Test and Inspection EquipmentHigh speed, non-distructive and standardized testing equipment for all manufacturing steps.
4) Epitaxial growth ToolsTools, processes and chemical percursers to lower cost of owner-ship, uniformity improvement.
5) Wafer processing equipmentTailored tools for the improvement of LED processing
6) LED packaging/encapsulationImprove processes and tools to optimize quality, consistancy and lower cost
7) Phosphor manufacturing and applicationDevelop high volume phosphor manufacturing and efficient materials application
Table 3. The LED Manufacturing R&D Priority Tasks as set by US Dept. of Energy and 2010 LED Manufacturing Workshop Consensus
Carl Lampert is the Managing Director at Star Science, a consulting company developing new coat-ings, especially those for energy, functional coatings and smart coatings. His clients range from start-ups to Fortune 500 companies. He works on product development, patents, business development and custom client surveys.
Formerly he was a Staff Scientist and Research Professor at the University of California-Berkeley and Lawrence Berkeley National Laboratory,
Carl Received his Ph.D., M.S. in Materials Science & Engineering, University of California, Berkeley. His B.S. is a Double Major, Electronic Engineering and Materials Science & Engineering.
He is the Technical Advisory Committee Chair for the Society of Vacuum Coaters ( SVC) in Smart Materials and Cleantech and as of February, 2009 he is the SVC Technical Director. He has organized SVC Symposia from 2003-2008. Also, he is the recipient of the IEEE Leadership Award, and is a Fellow of SPIE. He organized SPIE conferences from 1982-1992 on solar materials. Member of AVS (Vacuum), ISES (Solar Energy) ASM (Metallurgy), American Chemical Society, SIGMA XI, Eta Kappa Nu (Elect. Engin.), and Society for Information Display. He received a Fulbright Award and five ICTP--UNESCO Awards. He also received two Senior NATO Fellowships. Carl has published over 80 papers, book chapters and one book. He has worked on many international projects including several for the International Energy Agency and the UN Development Program.
He has been Editor-in-Chief of the Journal for Solar Energy Materials and Solar Cells since 1980 and the U.S. Technology Editor and Editor-in-Chief of the Journal of Displays since 1998.
For more information contact Carl Lampert at [email protected]
Carl Lampert
Figure 11. World distribution of LED Fabs (Source: SEMI OptoLED Watch Database, June 2010, SEMI).
| | | | | |Previous Page Contents Zoom in Zoom out Front Cover Search Issue Next PageBA
M SaGEF
| | | | | |Previous Page Contents Zoom in Zoom out Front Cover Search Issue Next PageBA
M SaGEF
_________