boom-bust and banking crises in finland, norway and sweden, 1984-1994: important lessons
TRANSCRIPT
Boom-bust and banking crises in Finland, Norway and Sweden, 1984-1994:
Important lessons
Main issues
• Boom-and-bust cycles• Financial liberalization and macroeconomic instability• The critical years, 1984-1992 • Financial deregulation and the lending boom • Bad banking• The boom-bust cycle and fiscal policy• Monetary policy• The asset price bubble• The government’s handling of the banking crisis• Conclusions• Lessons
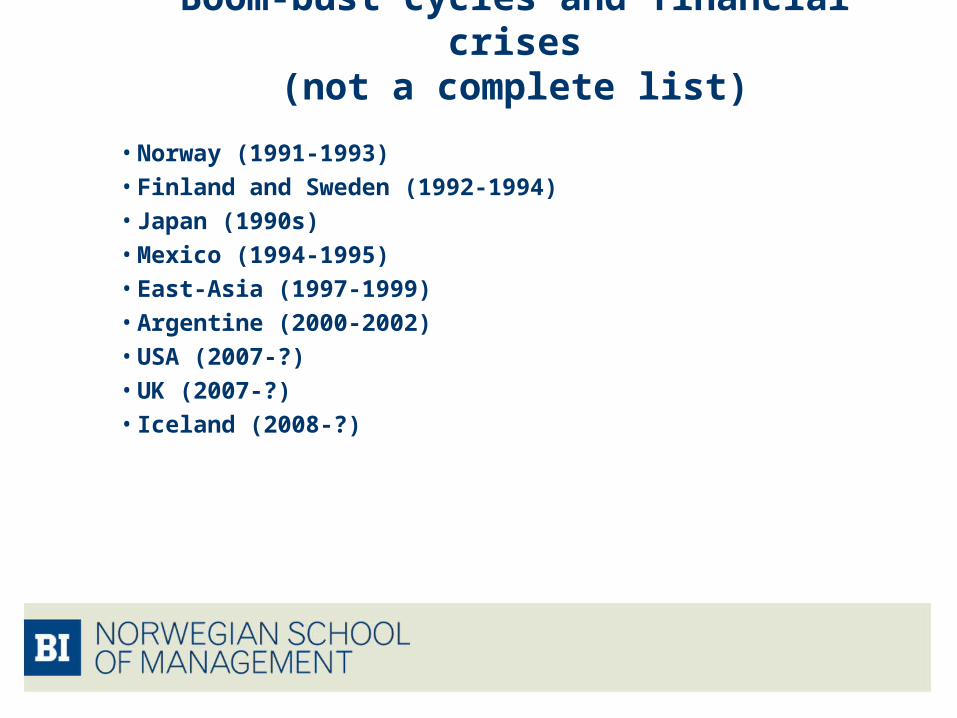
Boom-bust cycles and financial crises(not a complete list)
• Norway (1991-1993)• Finland and Sweden (1992-1994)• Japan (1990s)• Mexico (1994-1995)• East-Asia (1997-1999)• Argentine (2000-2002)• USA (2007-?)• UK (2007-?)• Iceland (2008-?)
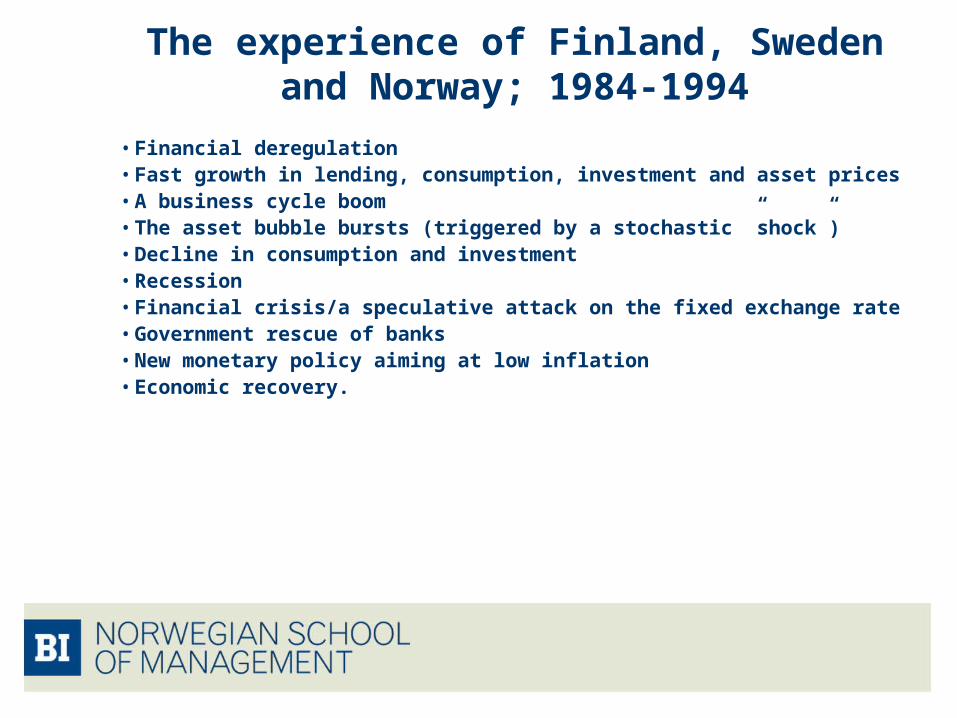
The experience of Finland, Sweden and Norway; 1984-1994
• Financial deregulation• Fast growth in lending, consumption, investment and asset prices• A business cycle boom• The asset bubble bursts (triggered by a stochastic ”shock”)• Decline in consumption and investment• Recession• Financial crisis/a speculative attack on the fixed exchange rate• Government rescue of banks• New monetary policy aiming at low inflation• Economic recovery.
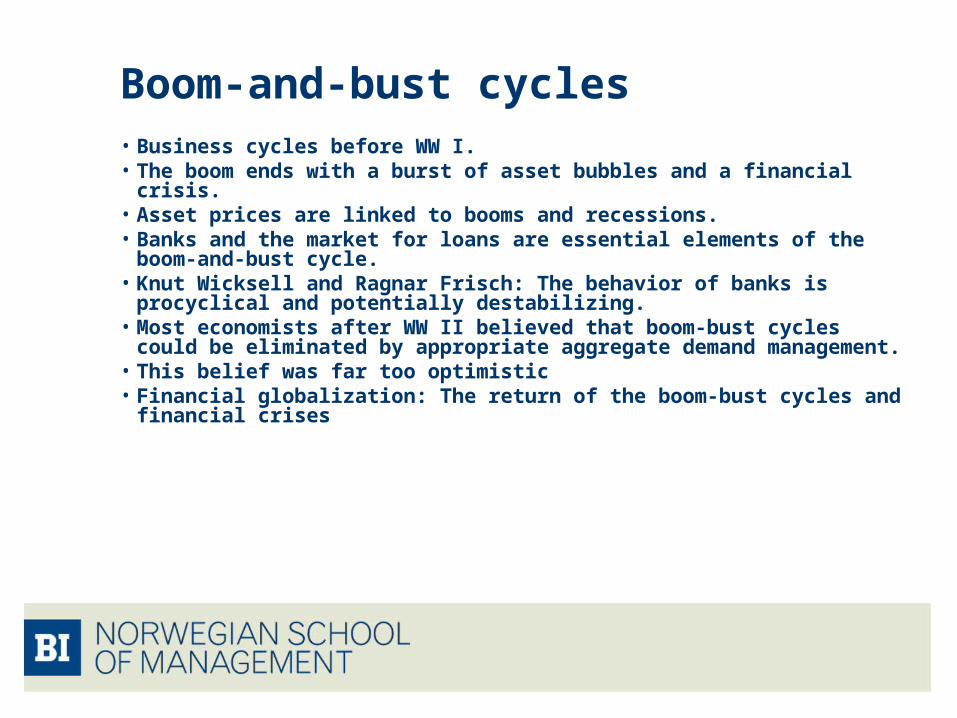
Boom-and-bust cycles• Business cycles before WW I.• The boom ends with a burst of asset bubbles and a financial crisis.• Asset prices are linked to booms and recessions.• Banks and the market for loans are essential elements of the boom-
and-bust cycle.• Knut Wicksell and Ragnar Frisch: The behavior of banks is
procyclical and potentially destabilizing.• Most economists after WW II believed that boom-bust cycles could
be eliminated by appropriate aggregate demand management.• This belief was far too optimistic• Financial globalization: The return of the boom-bust cycles and
financial crises
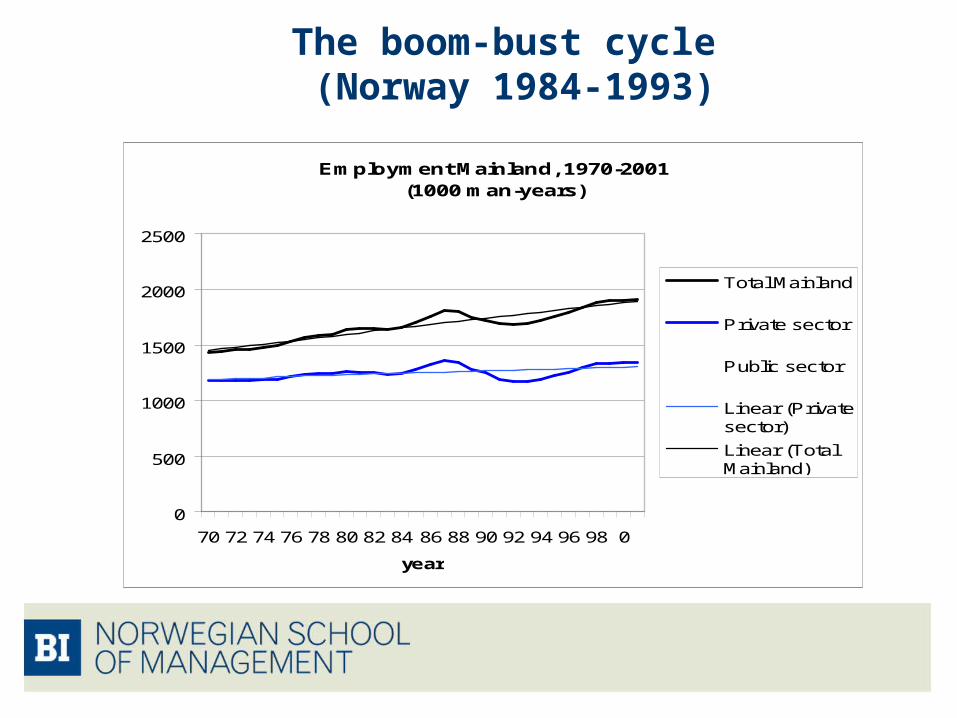
The boom-bust cycle (Norway 1984-1993)
Employment Mainland, 1970-2001(1000 man-years)
0
500
1000
1500
2000
2500
70 72 74 76 78 80 82 84 86 88 90 92 94 96 98 0
year
Total Mainland
Private sector
Public sector
Linear (Privatesector)
Linear (TotalMainland)
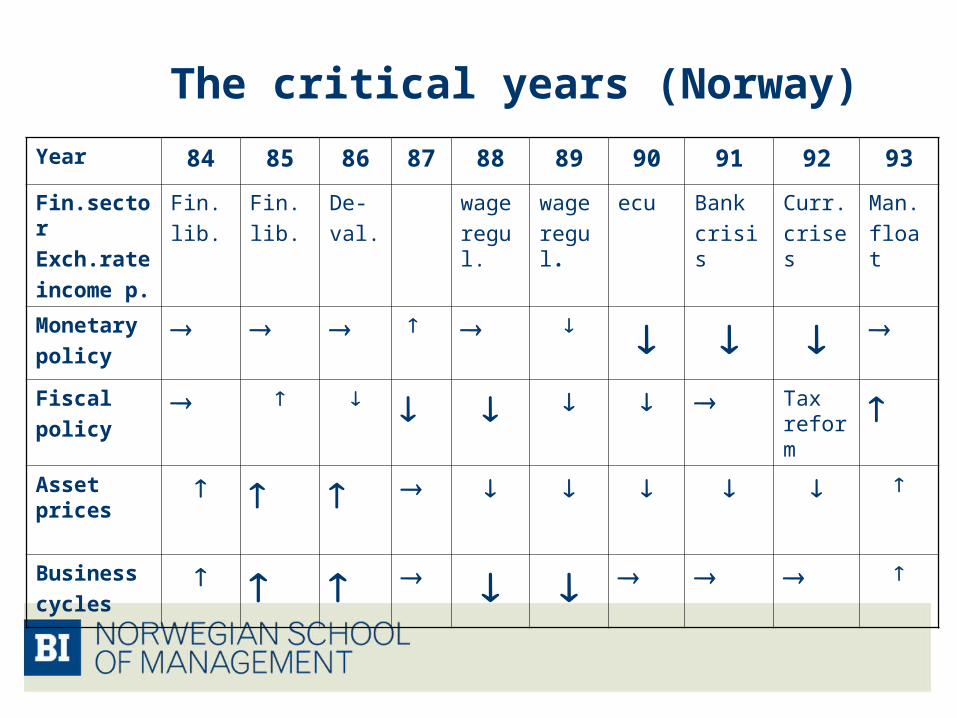
The critical years (Norway)
Year 84 85 86 87 88 89 90 91 92 93
Fin.sector
Exch.rate
income p.
Fin.
lib.
Fin.
lib.
De-
val.
wage
regul.
wage
regul.
ecu Bank
crisis
Curr.
crises
Man.
float
Monetary
policy
Fiscal
policy Tax
reform
Asset prices
Business
cycles
Important questions• Why did previously very stable Nordic countries become so
ustable?• Why did the deregulation of the credit market trigger such a great
credit supply shock?• Could the financial supervision authorities have prevented bad
banking and the banking crises?• Was fiscal policy procyclical?• How important was the exchange rate policy and monetary policy?• How well did the government handle the banking crisis?• Was there a credit crunch?• Did international business cycle impulses increase fluctuations?
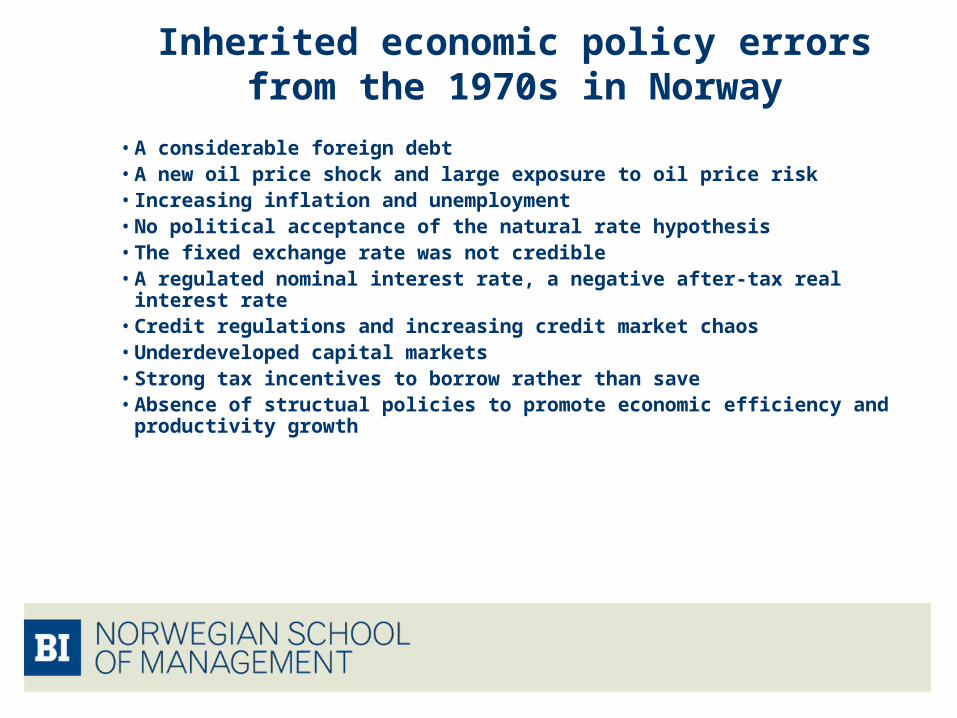
Inherited economic policy errors from the 1970s in Norway
• A considerable foreign debt• A new oil price shock and large exposure to oil price risk• Increasing inflation and unemployment• No political acceptance of the natural rate hypothesis• The fixed exchange rate was not credible• A regulated nominal interest rate, a negative after-tax real interest rate• Credit regulations and increasing credit market chaos• Underdeveloped capital markets • Strong tax incentives to borrow rather than save• Absence of structual policies to promote economic efficiency and
productivity growth
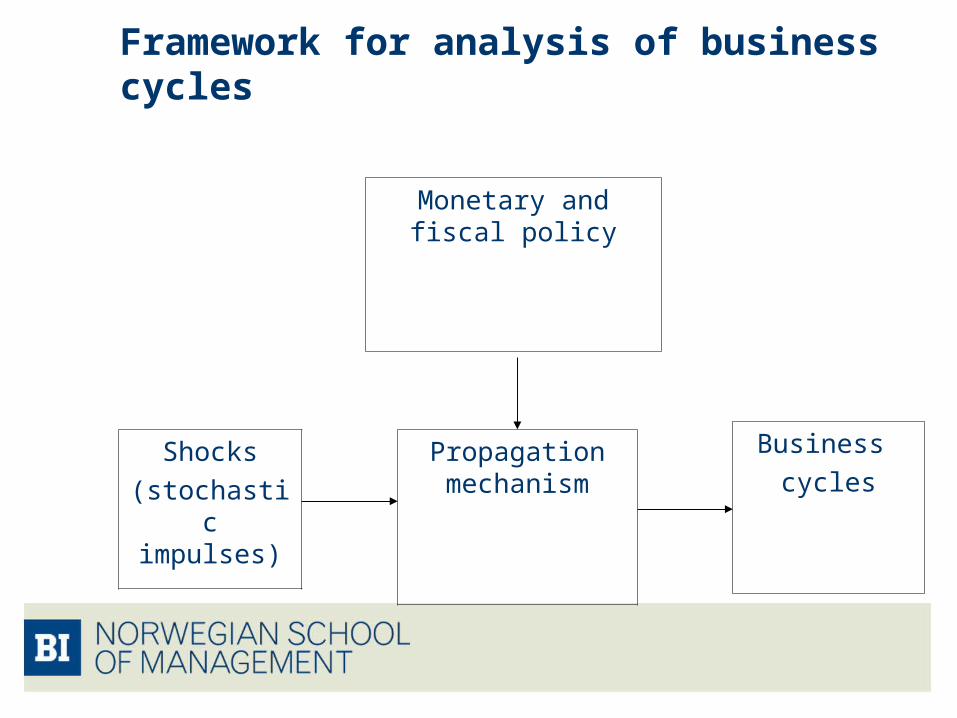
Framework for analysis of business cycles
Shocks
(stochastic impulses)
Monetary and fiscal policy
Propagation mechanism
Business
cycles
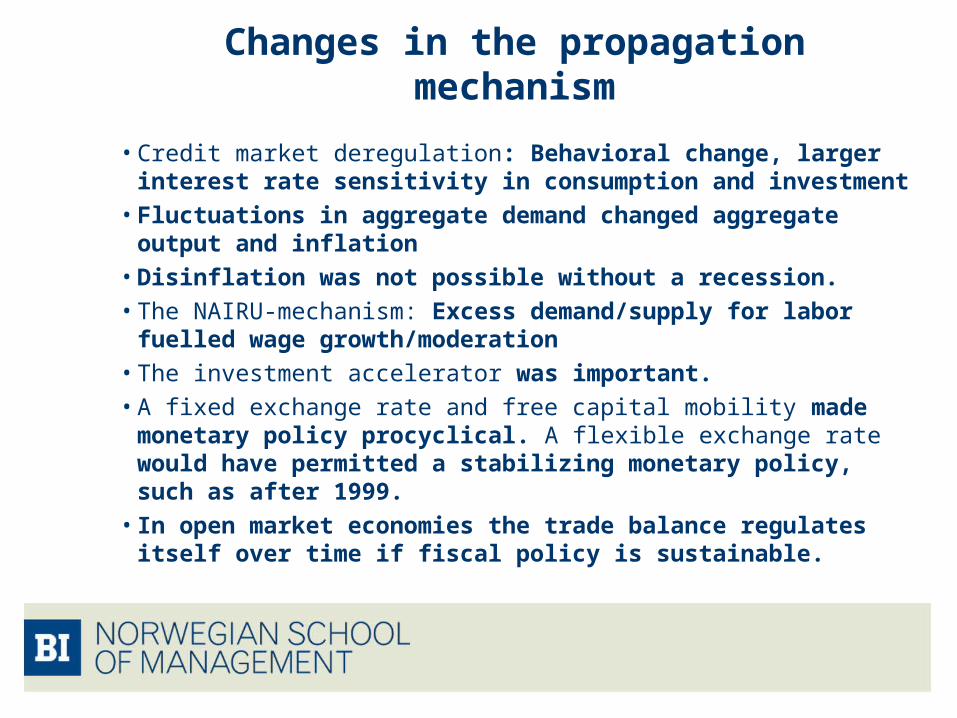
Changes in the propagation mechanism
• Credit market deregulation: Behavioral change, larger interest rate sensitivity in consumption and investment
• Fluctuations in aggregate demand changed aggregate output and inflation
• Disinflation was not possible without a recession.• The NAIRU-mechanism: Excess demand/supply for labor
fuelled wage growth/moderation• The investment accelerator was important.• A fixed exchange rate and free capital mobility made monetary
policy procyclical. A flexible exchange rate would have permitted a stabilizing monetary policy, such as after 1999.
• In open market economies the trade balance regulates itself over time if fiscal policy is sustainable.
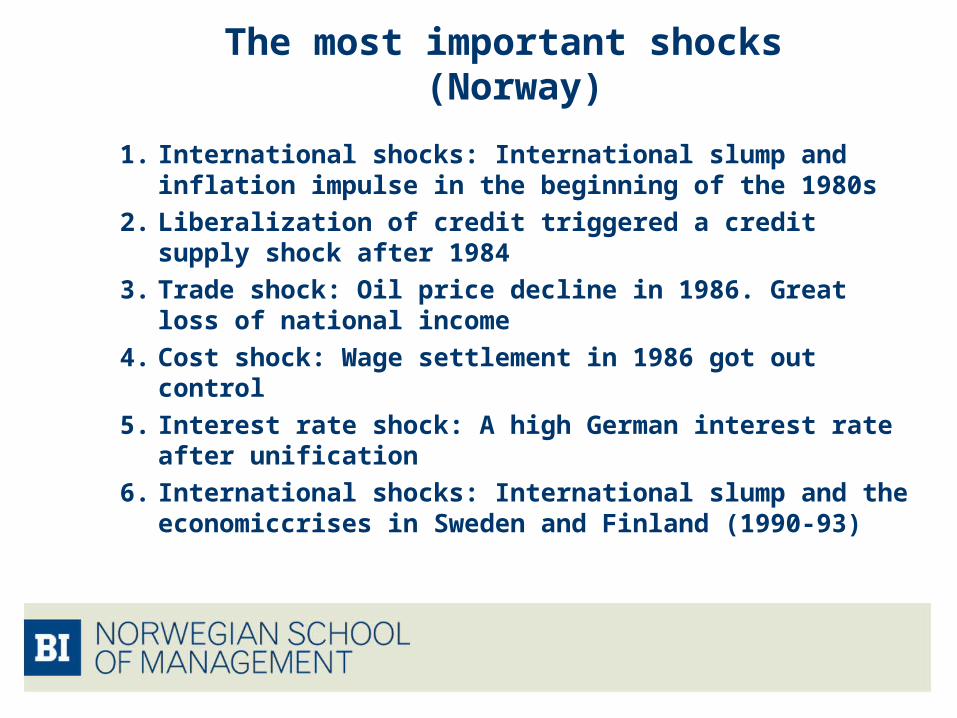
The most important shocks (Norway)
1. International shocks: International slump and inflation impulse in the beginning of the 1980s
2. Liberalization of credit triggered a credit supply shock after 1984
3. Trade shock: Oil price decline in 1986. Great loss of national income
4. Cost shock: Wage settlement in 1986 got out control
5. Interest rate shock: A high German interest rate after unification
6. International shocks: International slump and the economiccrises in Sweden and Finland (1990-93)
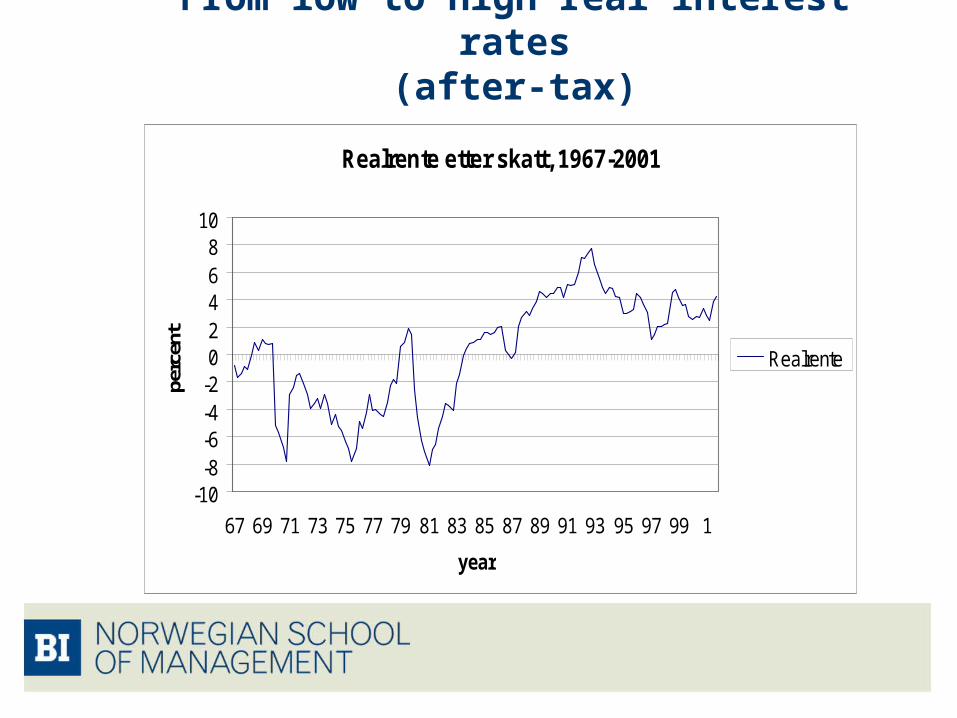
From low to high real interest rates (after-tax)
Realrente etter skatt, 1967-2001
-10-8-6-4-202468
10
67 69 71 73 75 77 79 81 83 85 87 89 91 93 95 97 99 1
year
perc
ent
Realrente
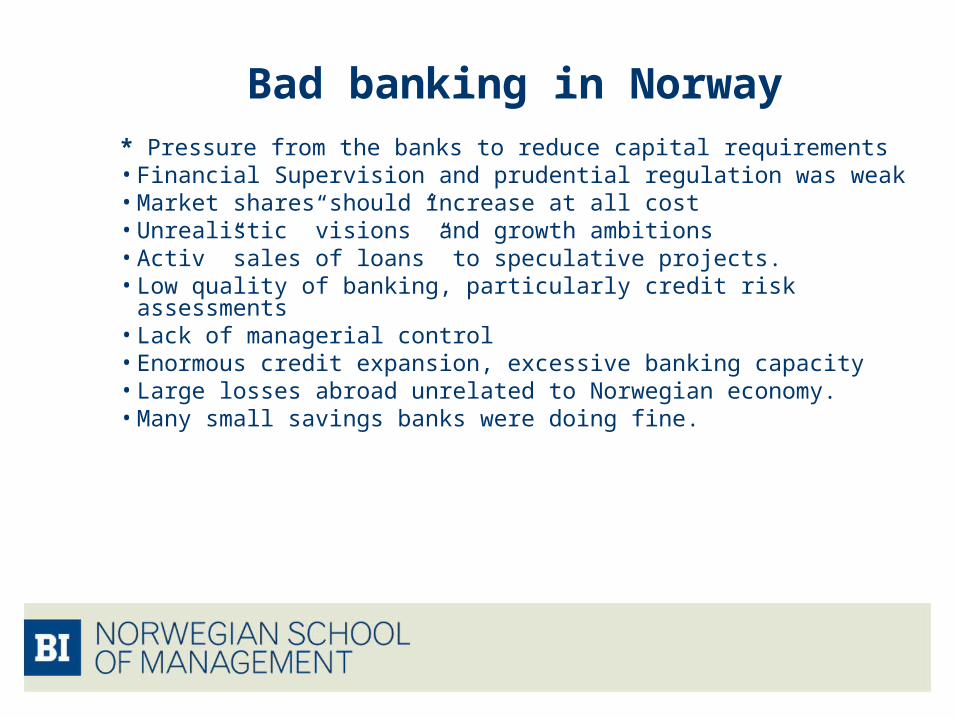
Bad banking in Norway* Pressure from the banks to reduce capital requirements• Financial Supervision and prudential regulation was weak• Market shares should increase at all cost • Unrealistic ”visions” and growth ambitions• Activ ”sales of loans” to speculative projects.• Low quality of banking, particularly credit risk assessments • Lack of managerial control• Enormous credit expansion, excessive banking capacity• Large losses abroad unrelated to Norwegian economy.• Many small savings banks were doing fine.
The growth and decline of bank credit
Growth in nominal lending by parent banks, 1981-1996 (percent per year)
-30
-20
-10
0
10
20
30
40
81 82 83 84 85 86 87 88 89 90 91 92 93 94 95 96
year
perc
ent Norway
Finland
Sweden
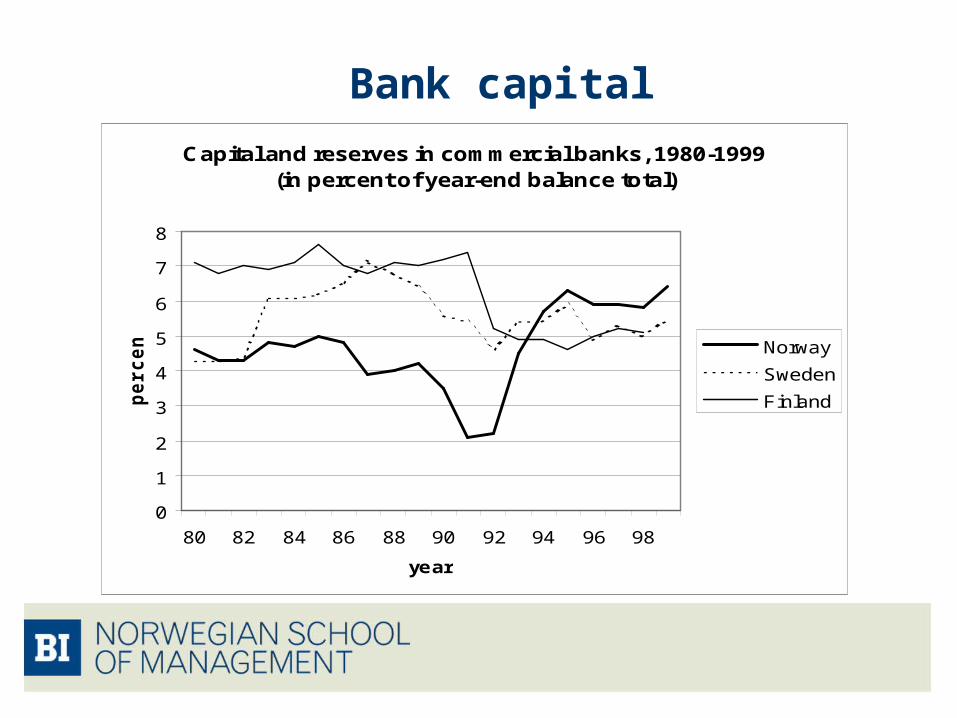
Bank capital Capital and reserves in commercial banks, 1980-1999
(in percent of year-end balance total)
0
1
2
3
4
5
6
7
8
80 82 84 86 88 90 92 94 96 98
year
pe
rce
nt
Norway
Sweden
Finland
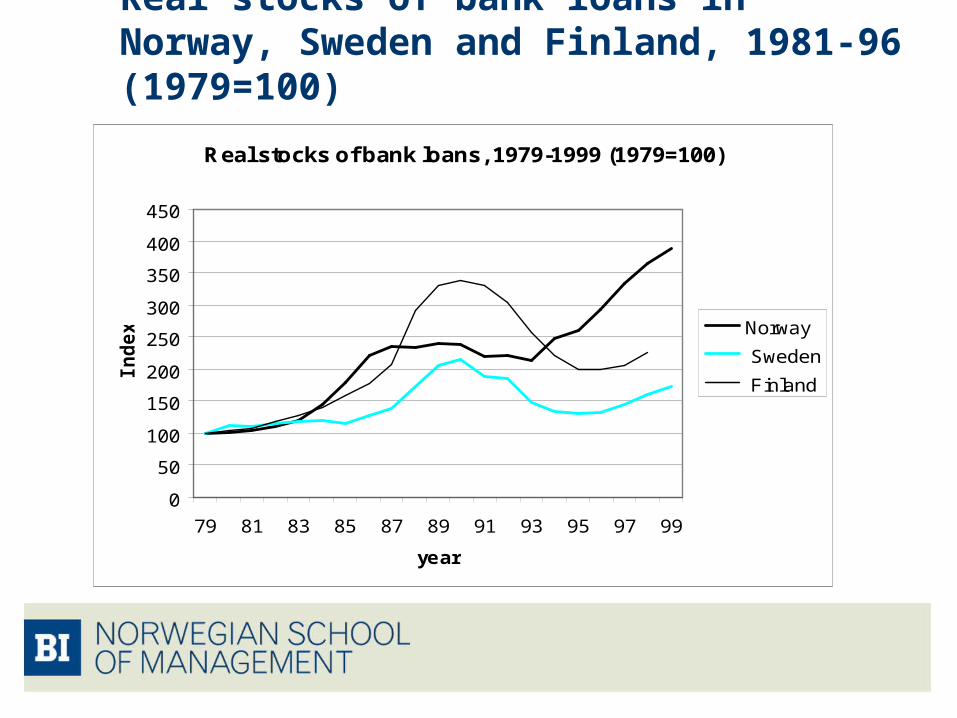
Real stocks of bank loans in Norway, Sweden and Finland, 1981-96 (1979=100)
Real stocks of bank loans, 1979-1999 (1979=100)
0
50
100
150
200
250
300
350
400
450
79 81 83 85 87 89 91 93 95 97 99
year
Ind
ex Norway
Sweden
Finland
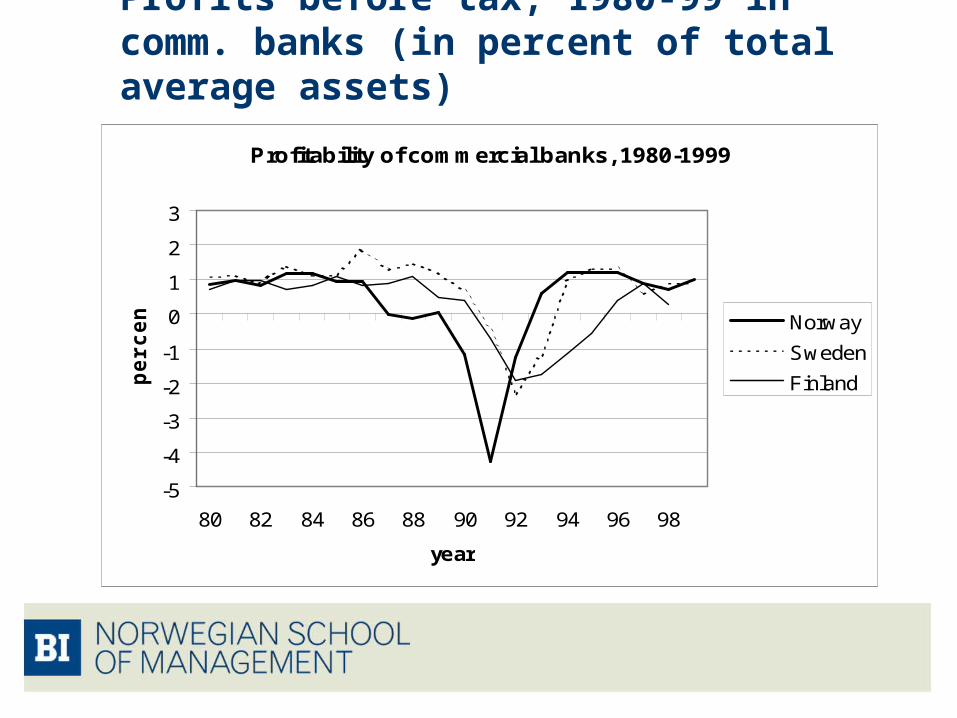
Profits before tax, 1980-99 in comm. banks (in percent of total average assets)
Profitability of commercial banks, 1980-1999
-5
-4
-3
-2
-1
0
1
2
3
80 82 84 86 88 90 92 94 96 98
year
perc
en
t Norway
Sweden
Finland
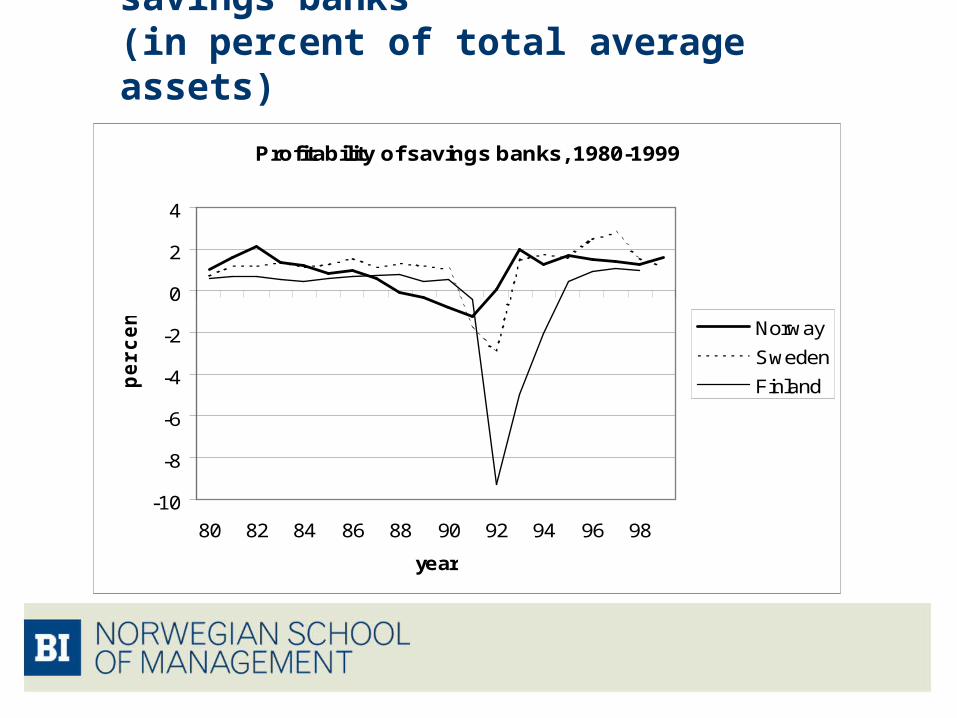
Profits before tax 1980-99 in savings banks (in percent of total average assets)
Profitability of savings banks, 1980-1999
-10
-8
-6
-4
-2
0
2
4
80 82 84 86 88 90 92 94 96 98
year
perc
en
t
Norway
Sweden
Finland
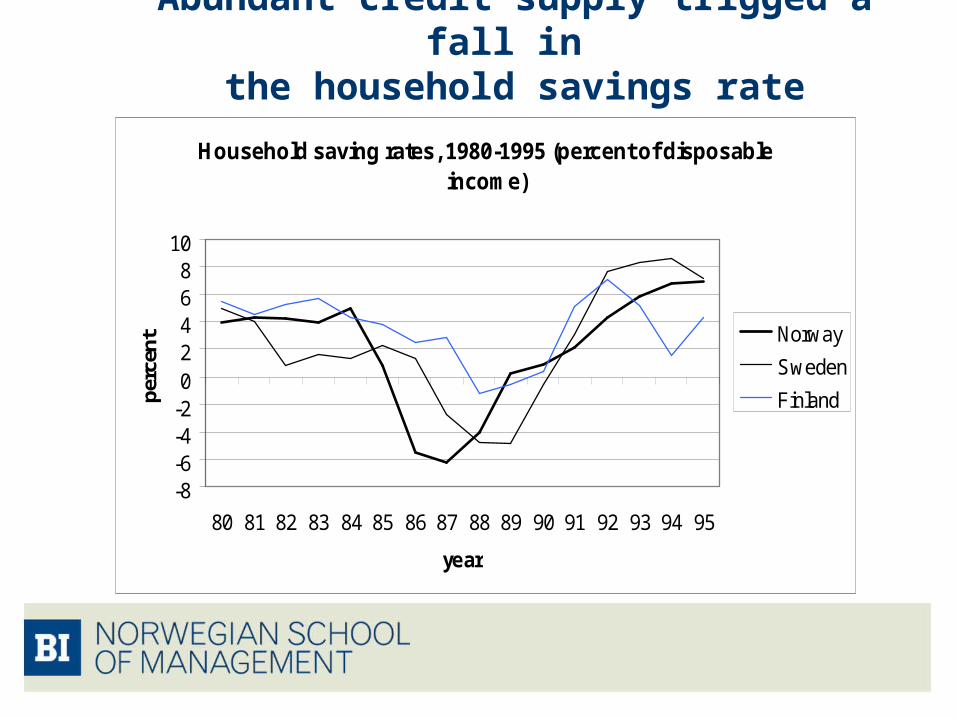
Abundant credit supply trigged a fall in the household savings rate
Household saving rates, 1980-1995 (percent of disposable income)
-8-6-4-202468
10
80 81 82 83 84 85 86 87 88 89 90 91 92 93 94 95
year
perc
ent Norway
Sweden
Finland
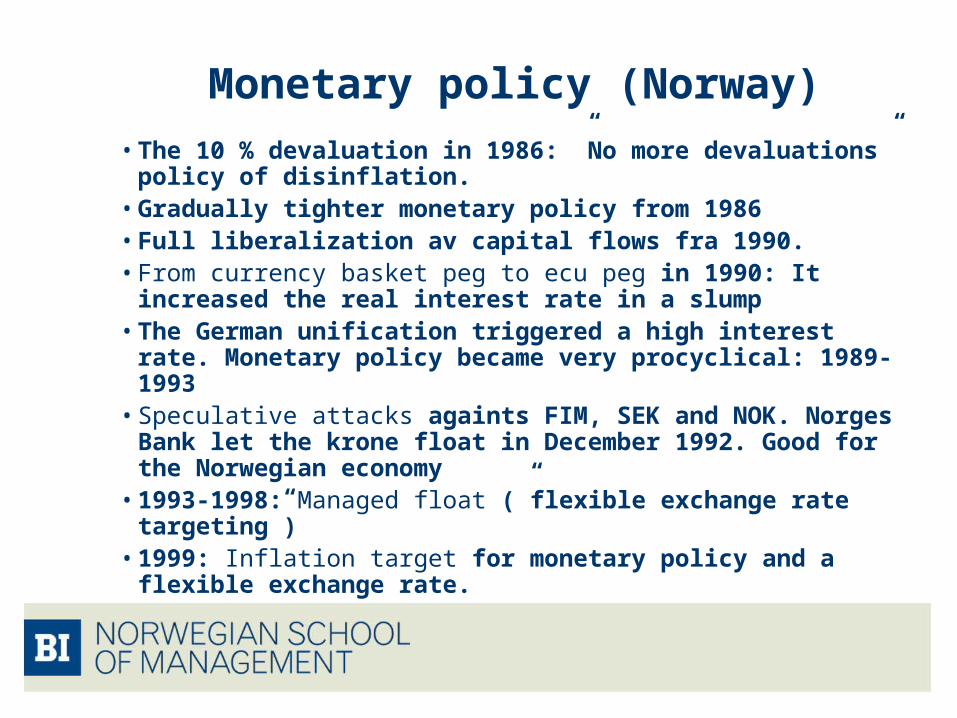
Monetary policy (Norway)
• The 10 % devaluation in 1986: ”No more devaluations” policy of disinflation.
• Gradually tighter monetary policy from 1986• Full liberalization av capital flows fra 1990. • From currency basket peg to ecu peg in 1990: It increased the
real interest rate in a slump• The German unification triggered a high interest rate.
Monetary policy became very procyclical: 1989-1993• Speculative attacks againts FIM, SEK and NOK. Norges Bank
let the krone float in December 1992. Good for the Norwegian economy
• 1993-1998: Managed float (”flexible exchange rate targeting”) • 1999: Inflation target for monetary policy and a flexible
exchange rate.
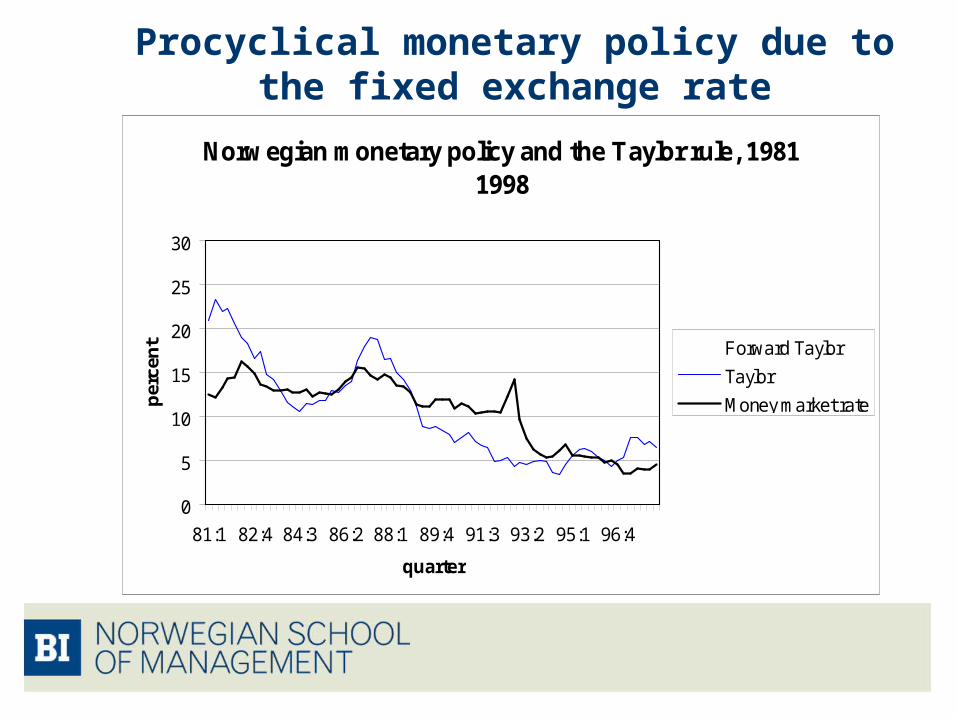
Procyclical monetary policy due to the fixed exchange rate
Norwegian monetary policy and the Taylor rule, 1981-1998
0
5
10
15
20
25
30
81:1 82:4 84:3 86:2 88:1 89:4 91:3 93:2 95:1 96:4
quarter
per
cen
t Forward Taylor
Taylor
Money market rate
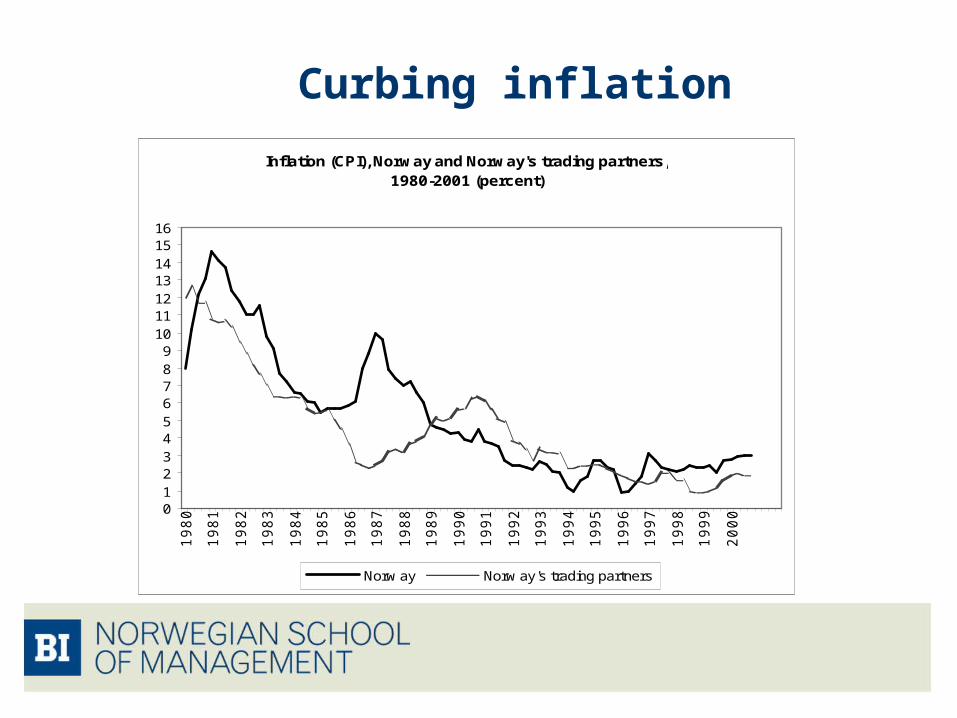
Curbing inflation
Inflation (CPI), Norway and Norway's trading partners, 1980-2001 (percent)
0123456789
10111213141516
1980
1981
1982
1983
1984
1985
1986
1987
1988
1989
1990
1991
1992
1993
1994
1995
1996
1997
1998
1999
2000
Norw ay Norw ay's trading partners
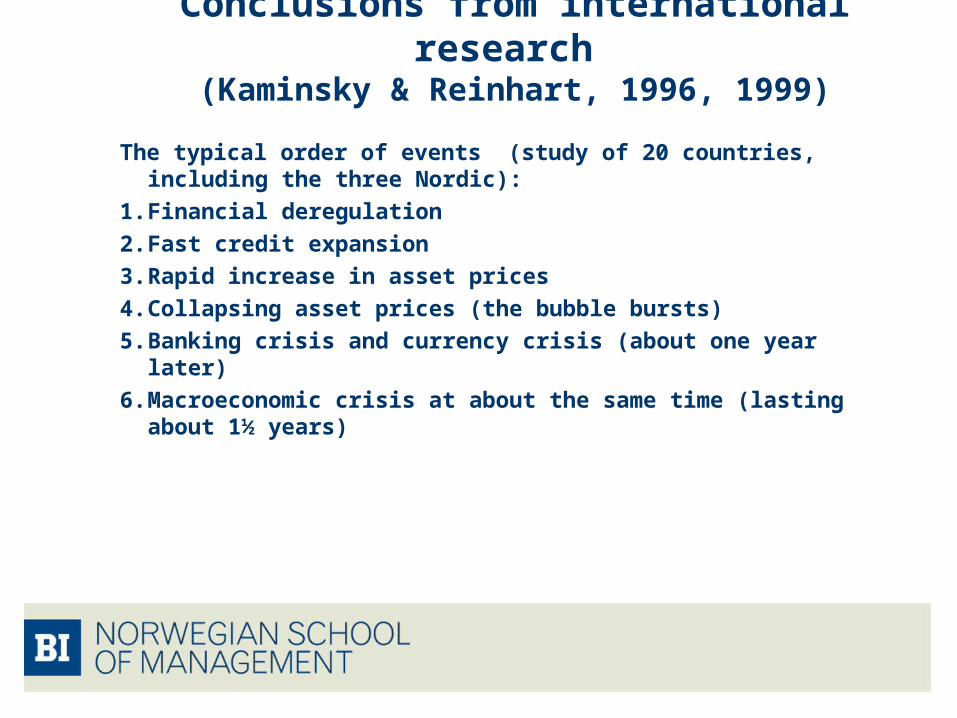
Conclusions from international research (Kaminsky & Reinhart, 1996, 1999)
The typical order of events (study of 20 countries, including the three Nordic):
1. Financial deregulation
2. Fast credit expansion
3. Rapid increase in asset prices
4. Collapsing asset prices (the bubble bursts)
5. Banking crisis and currency crisis (about one year later)
6. Macroeconomic crisis at about the same time (lasting about 1½ years)
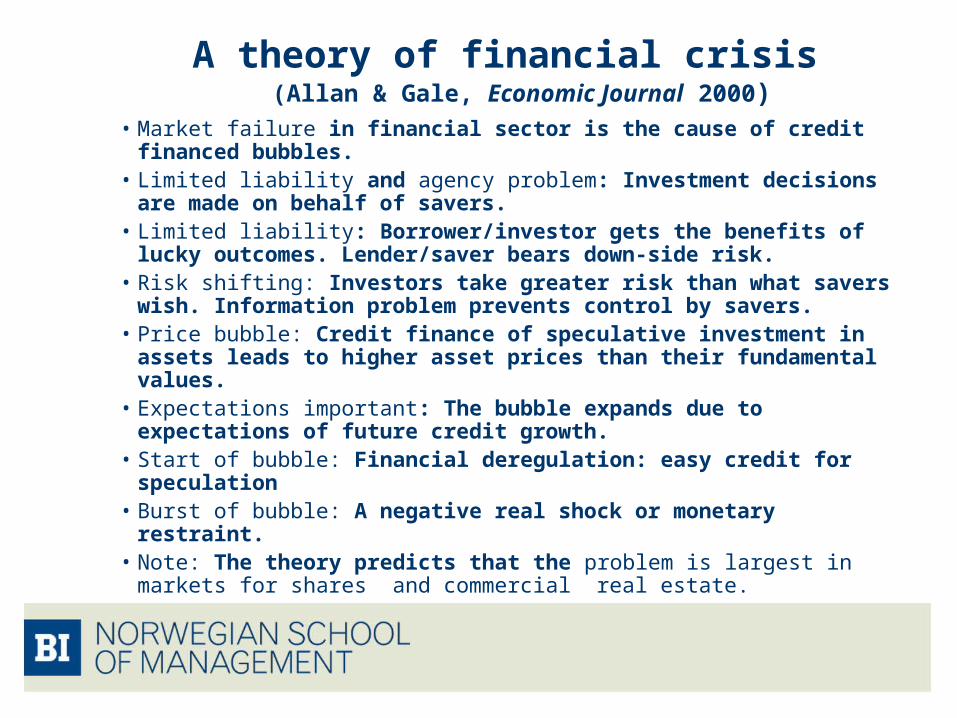
A theory of financial crisis (Allan & Gale, Economic Journal 2000)
• Market failure in financial sector is the cause of credit financed bubbles.
• Limited liability and agency problem: Investment decisions are made on behalf of savers.
• Limited liability: Borrower/investor gets the benefits of lucky outcomes. Lender/saver bears down-side risk.
• Risk shifting: Investors take greater risk than what savers wish. Information problem prevents control by savers.
• Price bubble: Credit finance of speculative investment in assets leads to higher asset prices than their fundamental values.
• Expectations important: The bubble expands due to expectations of future credit growth.
• Start of bubble: Financial deregulation: easy credit for speculation• Burst of bubble: A negative real shock or monetary restraint.• Note: The theory predicts that the problem is largest in markets for
shares and commercial real estate.

Complementary explanations of asset price bubbles
• Deposit insurance could stimulate credit financed speculation even further.
• Herd behaviour: Under limited information it could be rational to do as the other bankers do.
• Management failure: Managers of banks did not know how to manage banks in a new competitive environment.
• Non-rational behaviour: More recent research in the bordering areas of economics and psychology. A promising area of research.
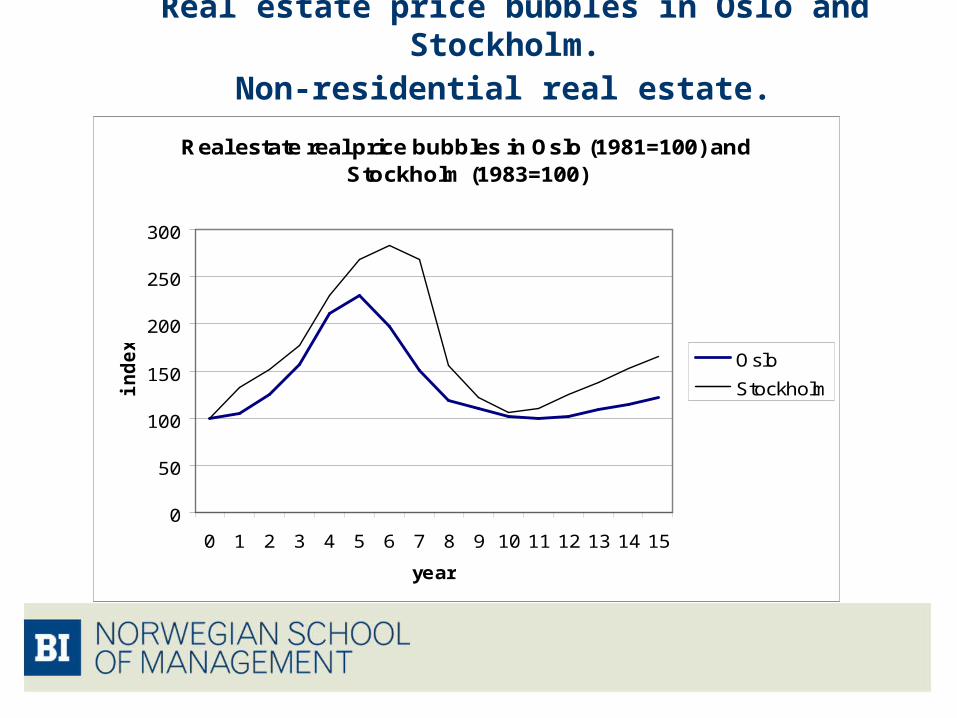
Real estate price bubbles in Oslo and Stockholm. Non-residential real estate.
Real estate real price bubbles in Oslo (1981=100) and Stockholm (1983=100)
0
50
100
150
200
250
300
0 1 2 3 4 5 6 7 8 9 10 11 12 13 14 15
year
ind
ex Oslo
Stockholm
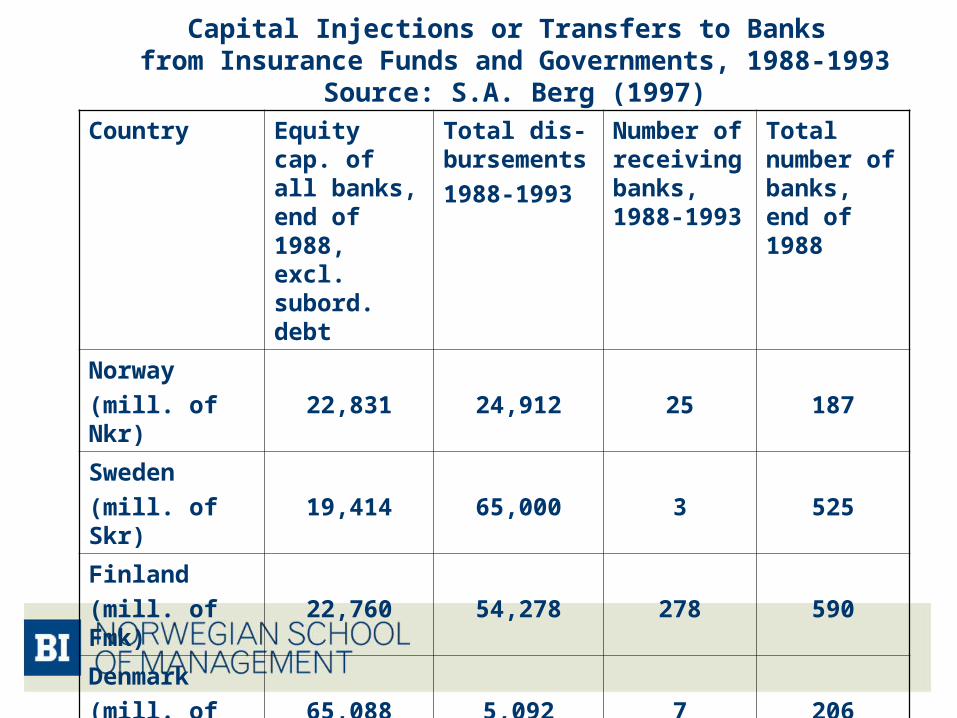
Capital Injections or Transfers to Banks from Insurance Funds and Governments, 1988-1993
Source: S.A. Berg (1997)
Country Equity cap. of all banks, end of 1988, excl. subord. debt
Total dis-bursements
1988-1993
Number of receiving banks, 1988-1993
Total number of banks, end of 1988
Norway
(mill. of Nkr) 22,831 24,912 25 187
Sweden
(mill. of Skr) 19,414 65,000 3 525
Finland
(mill. of Fmk) 22,760 54,278 278 590
Denmark
(mill. of Dkr) 65,088 5,092 7 206
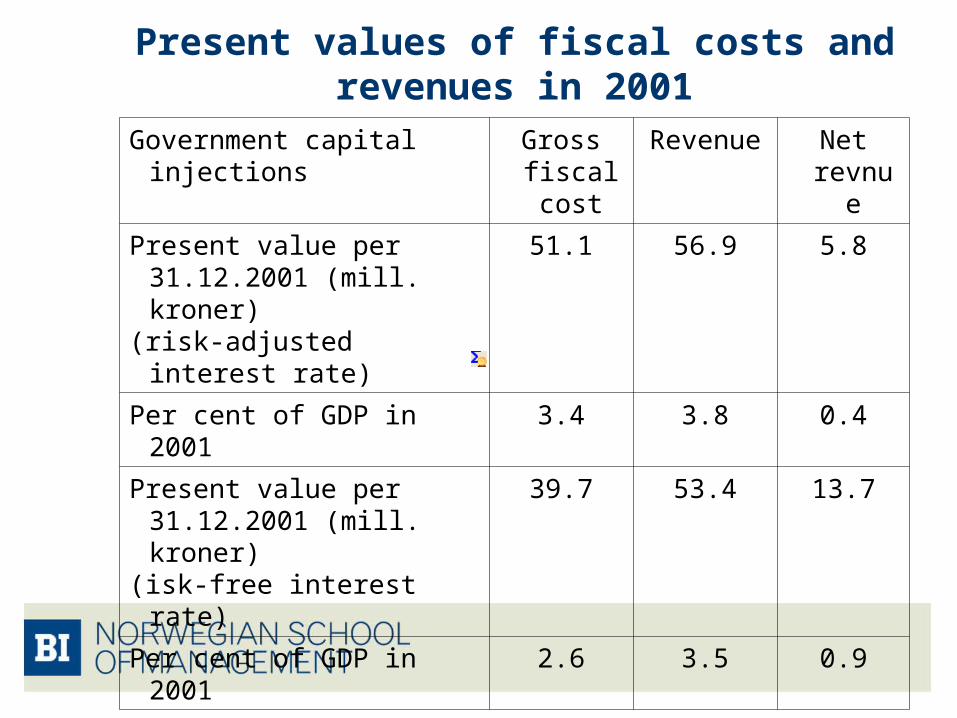
Present values of fiscal costs and revenues in 2001
Government capital injections Gross fiscal cost
Revenue Net revnue
Present value per 31.12.2001 (mill. kroner)
(risk-adjusted interest rate)
51.1 56.9 5.8
Per cent of GDP in 2001 3.4 3.8 0.4
Present value per 31.12.2001 (mill. kroner)
(isk-free interest rate)
39.7 53.4 13.7
Per cent of GDP in 2001 2.6 3.5 0.9
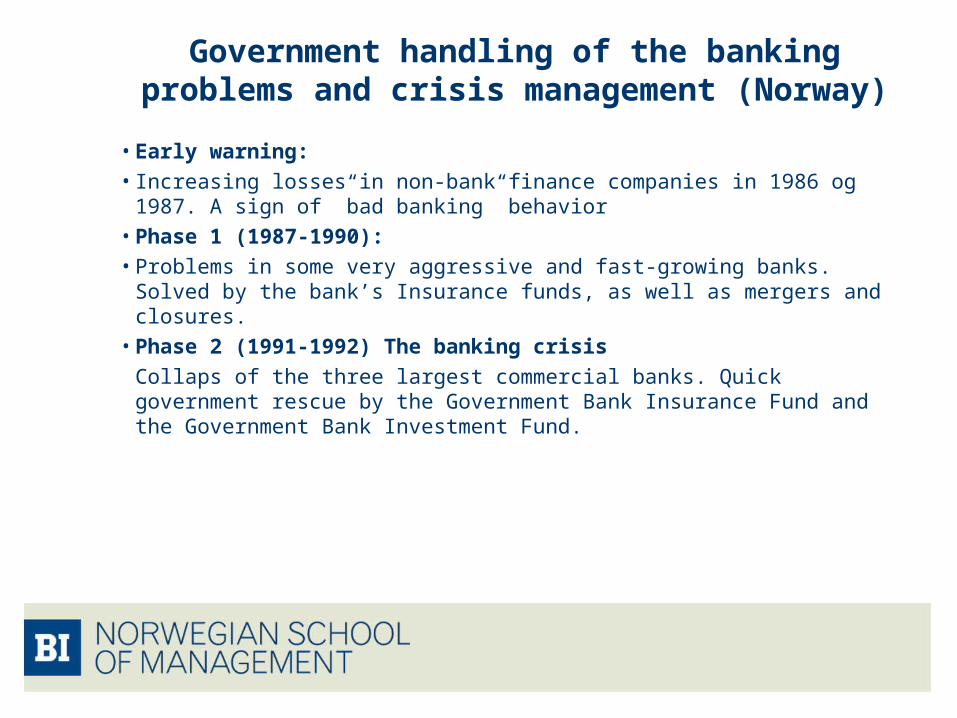
Government handling of the banking problems and crisis management (Norway)
• Early warning: • Increasing losses in non-bank finance companies in 1986 og 1987. A sign
of ”bad banking” behavior • Phase 1 (1987-1990): • Problems in some very aggressive and fast-growing banks. Solved by the
bank’s Insurance funds, as well as mergers and closures.• Phase 2 (1991-1992) The banking crisis
Collaps of the three largest commercial banks. Quick government rescue by the Government Bank Insurance Fund and the Government Bank Investment Fund.
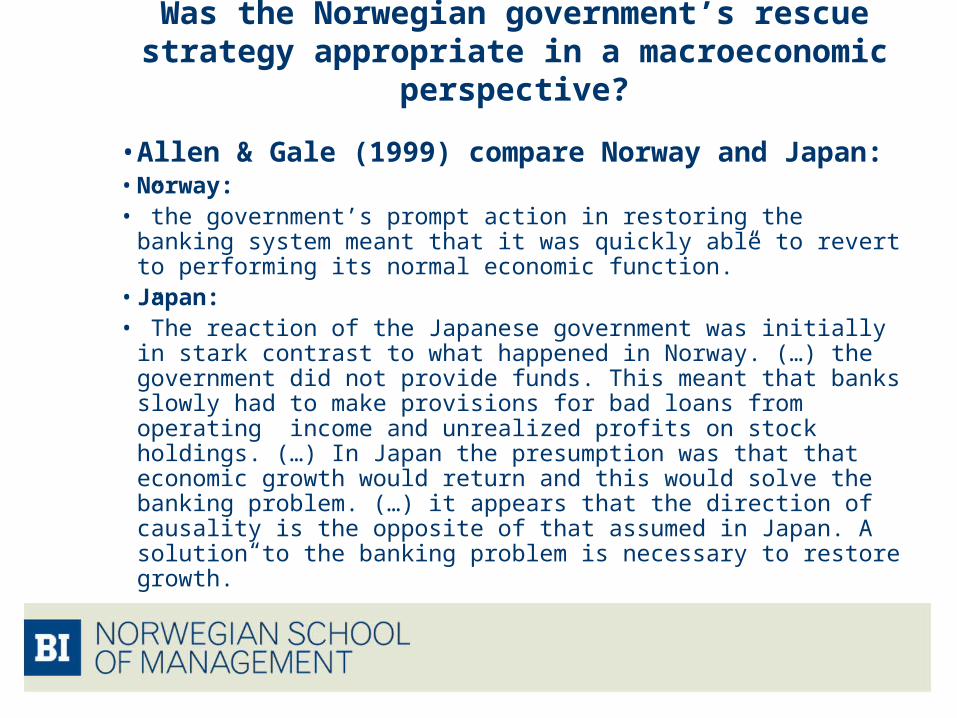
Was the Norwegian government’s rescue strategy appropriate in a macroeconomic perspective?
• Allen & Gale (1999) compare Norway and Japan:• Norway: • ”the government’s prompt action in restoring the banking system
meant that it was quickly able to revert to performing its normal economic function.”
• Japan: • ”The reaction of the Japanese government was initially in stark
contrast to what happened in Norway. (…) the government did not provide funds. This meant that banks slowly had to make provisions for bad loans from operating income and unrealized profits on stock holdings. (…) In Japan the presumption was that that economic growth would return and this would solve the banking problem. (…) it appears that the direction of causality is the opposite of that assumed in Japan. A solution to the banking problem is necessary to restore growth.”
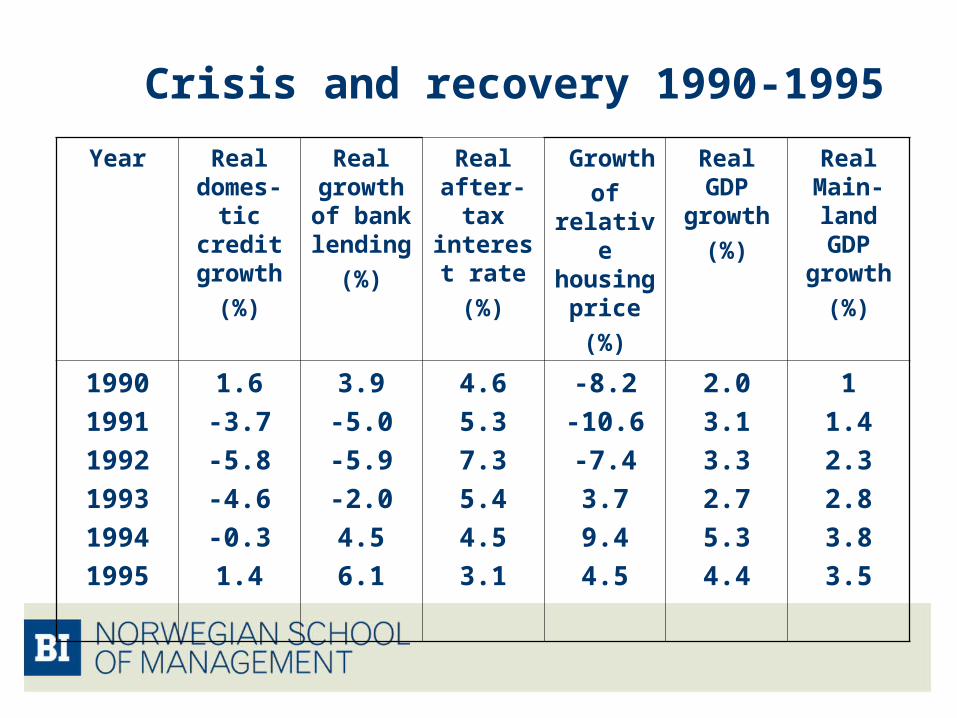
Crisis and recovery 1990-1995
Year Real domes-
tic credit growth
(%)
Real growth of bank lending
(%)
Real after-tax interest
rate
(%)
Growth
of relative housing
price
(%)
Real GDP
growth
(%)
Real Main-land GDP
growth
(%)
1990
1991
1992
1993
1994
1995
1.6
-3.7
-5.8
-4.6
-0.3
1.4
3.9
-5.0
-5.9
-2.0
4.5
6.1
4.6
5.3
7.3
5.4
4.5
3.1
-8.2
-10.6
-7.4
3.7
9.4
4.5
2.0
3.1
3.3
2.7
5.3
4.4
1
1.4
2.3
2.8
3.8
3.5
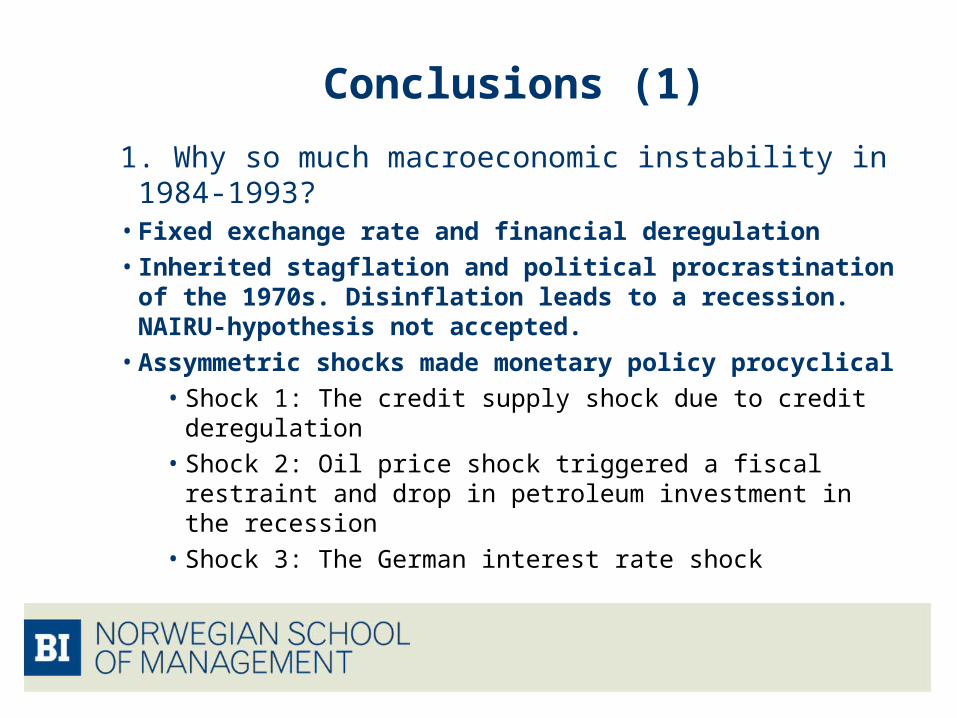
Conclusions (1)
1. Why so much macroeconomic instability in 1984-1993?
• Fixed exchange rate and financial deregulation• Inherited stagflation and political procrastination of the
1970s. Disinflation leads to a recession. NAIRU-hypothesis not accepted.
• Assymmetric shocks made monetary policy procyclical• Shock 1: The credit supply shock due to credit deregulation• Shock 2: Oil price shock triggered a fiscal restraint and drop
in petroleum investment in the recession• Shock 3: The German interest rate shock
Conclusions (2)
2. Why did the deregulation of the credit market trigger such a great credit supply shock in Norway?
• The credit regulations lost their legitimacy and had fostered cynism among banks: strong desire to grow fast before 1984.
• The credit deregulation policy increased competition very quickly.
• Inadequate capital requirements and prudential regulation• The underlying demand for credit was very strong due to the new
housing wealth created by the previous deregulation of the housing market and the booming stock market (speculative credit demand)
• High degree of forced saving in 1983-84
Conclusions (3)
3. Was fiscal policy stabilizing?
• The government was too worried about structural current account deficits after the 1986 oil shock: Fiscal restraint hitting indebted households.
• Fiscal restraint policy was continued for too long: Made the recession and stagnation worse.
• New rules for tax deduction of interest payments were badly timed.• Expansionary fiscal policy in 1991-1993 was very helpful in
boosting household income and start a new upturn.
Conclusions (4)4. Why no ex post fiscal cost of the Norwegian banking rescue in contrast
to Finland and Sweden?
• The 1986 oil price shock ended a longer-lasting boom and slowed down borrowing and investment years before the German interest rate shock. No similar ”early warning” shock in Finland and Sweden.
• Large oil revenues and low investment improved the Norwegian current account quickly, low risk premium in the interest rate.
• Expansionary fiscal policy from 1991 without credibility problems. More procyclical fiscal policy in Finland and Sweden. The aggregate demand decline was more dramatic in Finland and Sweden.
• Establishing a separate institution to handle ”bad loans” may increase the fiscal cost compared to re-capitalizations of banks by the government.
Remaining questions
1. A credit crunch in 1991-1992? • Most insiders did not think so, but lack of research leaves the
question unsettled. Macrodata looks better than in Sweden/Finland
2. Would a good prudential regulation have made a difference? • Credit financed speculation hard to detect due to information
problems. However: With todays capital requirements, the crisis would have been much smaller, may be non-existent.
3. International business cycles: Did they make things worse?• Hardly. The international impulses had marginal stabilizing
effects on Norwegian non-oil exports after 1984. 4. How important were the speculative attacks i 1992 • They permitted lower interest rates and better monetary
polices.
Main lessions
• Financial markets cannot work on their own: Government institutions and appropriate policies must be in place before ”financial liberalization”.
• Macroeconomic policy should account for that highly leveraged households and firms could amplify the crisis.
• Households and firms should not borrow in foreign currency• If banks loose confidence due to heavy losses, they should
be re-capitalized quickly, by government capital injections if necessary.
• In a banking crisis, don’t garantee all deposits independent of size. Otherwise, moral hazard could distort the money market and increase the fiscal cost of a government rescue.
• Basel II capital reqirements could amplify boom-bust cycles:• The present rules need to be reconsidered.