bookmap user guide€¦ · · 2016-12-12bookmap user guide september 22, 2016| software version 5...
TRANSCRIPT

Copyright © 2016 By Veloxpro Software Limited. All rights reserved page 1 of 89
Bookmap
User Guide
September 22, 2016| Software version 5

Copyright © 2016 By Veloxpro Software Limited. All rights reserved page 2 of 89
Table of Content
Introduction.................................................................................................................................................................................. 3
1. System Requirements ........................................................................................................................................................... 4
2. Bookmap Main Window ........................................................................................................................................................ 4
3. Running Bookmap ................................................................................................................................................................. 8
3.1 Trading Technologies Users ........................................................................................................................................... 8
3.2 CQG Users ................................................................................................................................................................... 11
3.3 NinjaTrader Users ........................................................................................................................................................ 13
3.4 TWS Users ................................................................................................................................................................... 15
3.5 S5 Trader Users ........................................................................................................................................................... 18
3.6 IQFeed Subscribers ...................................................................................................................................................... 20
3.7 Rithmic Users .............................................................................................................................................................. 22
3.8 Transact Users ............................................................................................................................................................. 24
4. Operating Bookmap ............................................................................................................................................................ 26
4.1 Bookmap Chart............................................................................................................................................................ 27
4.1.1 Order Book Heat Map .......................................................................................................................................... 27
4.1.2 Traded Volume Visualization................................................................................................................................ 38
4.1.3 Chart Synchronization .......................................................................................................................................... 43
4.1.4 Chart Refresh Rate, GPU Acceleration and Smoothing.......................................................................................... 44
4.1.5 Presentation Mode .............................................................................................................................................. 44
4.2 Bookmap Columns....................................................................................................................................................... 45
4.3 Data Recording and Data Refresh ................................................................................................................................ 53
5. Replay data / Simulated trading mode ................................................................................................................................ 55
6. Bookmap Add-ons ............................................................................................................................................................... 58
6.1 Bookmap one-click execution add-on .......................................................................................................................... 58
6.2 Large Lot Tracker ......................................................................................................................................................... 79
6.3 Imbalance Indicators ................................................................................................................................................... 81
6.4 Iceberg Detector.......................................................................................................................................................... 84
Annex I –Keyboard Shortcuts ...................................................................................................................................................... 86
Annex II –Color value names ....................................................................................................................................................... 87
Annex III – Brackets, OCO and Trailing Stop................................................................................................................................. 88
Copyright © 2016 By Veloxpro Software Limited. All rights reserved page 3 of 89
Introduction
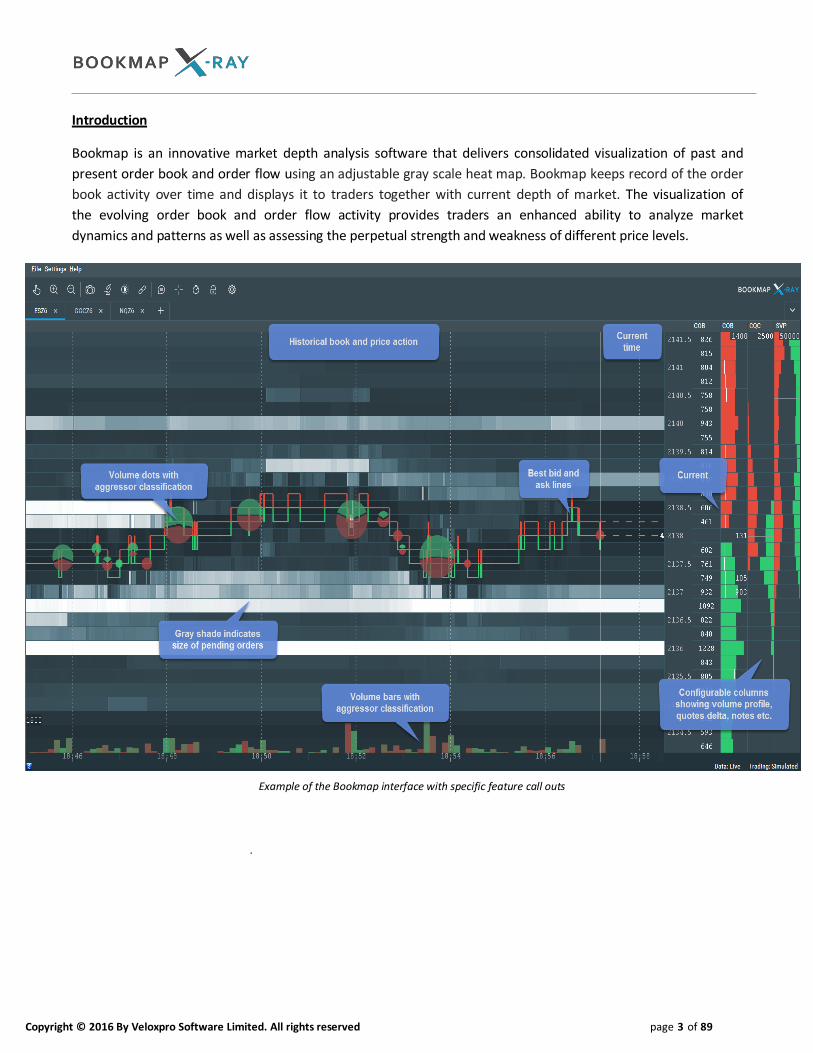
Bookmap is an innovative market depth analysis software that delivers consolidated visualization of past and
present order book and order flow using an adjustable gray scale heat map. Bookmap keeps record of the order
book activity over time and displays it to traders together with current depth of market. The visualization of
the evolving order book and order flow activity provides traders an enhanced ability to analyze market
dynamics and patterns as well as assessing the perpetual strength and weakness of different price levels.
Example of the Bookmap interface with specific feature call outs
.
Copyright © 2016 By Veloxpro Software Limited. All rights reserved page 4 of 89
1. System Requirements
The following hardware and software specifications are the minimal requirements for installing and using
Bookmap:
a) Windows 7, 8, 8.1, 10 or XP SP3.
b) Monitor with minimum resolution of 1024x768
c) Video card of minimum 516 MB memory supporting OpenGL 3 (introduced in 2008) or higher. To check
what OpenGL you can install an OpenGL extension viewer.
d) Minimum of 4GBRAM and 1 GB free disk space.
e) Intel Core 2 DUO (or equivalent), 2.0 GHz or above+
f) Stable internet connection. Minimal speed 1Mb/sec
g) A mouse with a middle button is required for the one-click trading add-on feature.
h) .NET 3.5
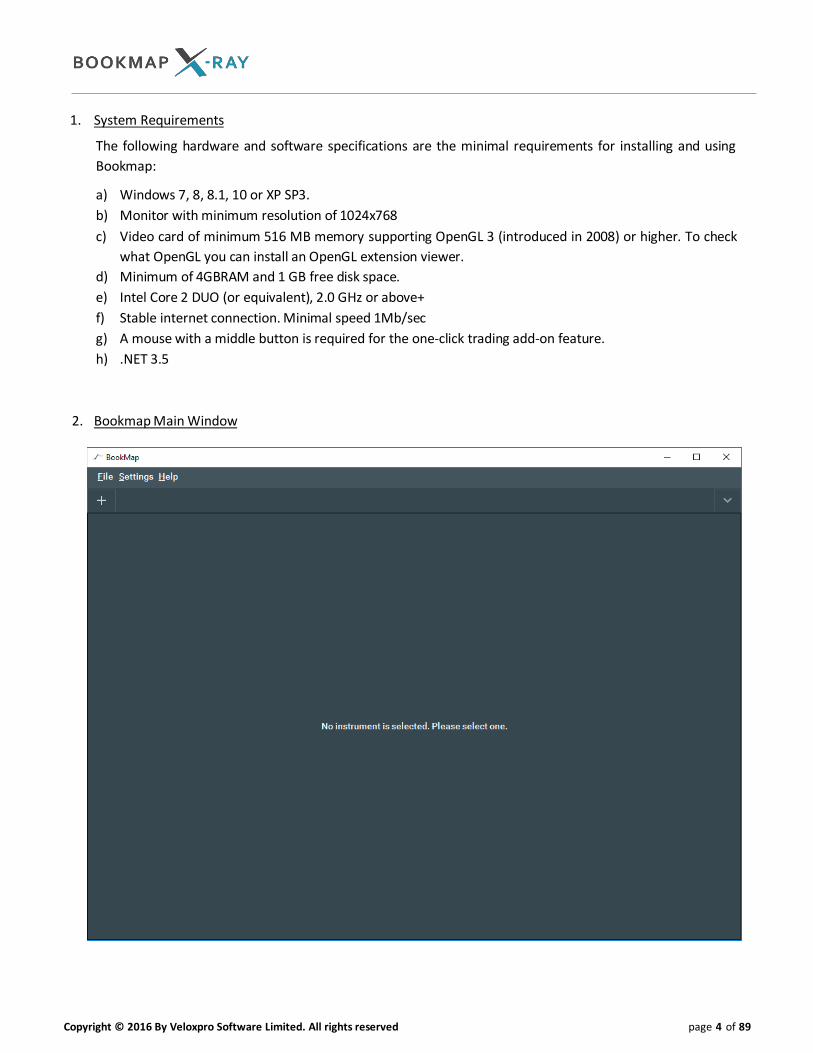
2. Bookmap Main Window
Copyright © 2016 By Veloxpro Software Limited. All rights reserved page 5 of 89
The Bookmap Main Window is where you subscribe or list the instruments to view on Bookmap. For more
details on how to run Bookmap with your platform / API and view the instruments of your choice please
refer to Section 3 “Running Bookmap”.
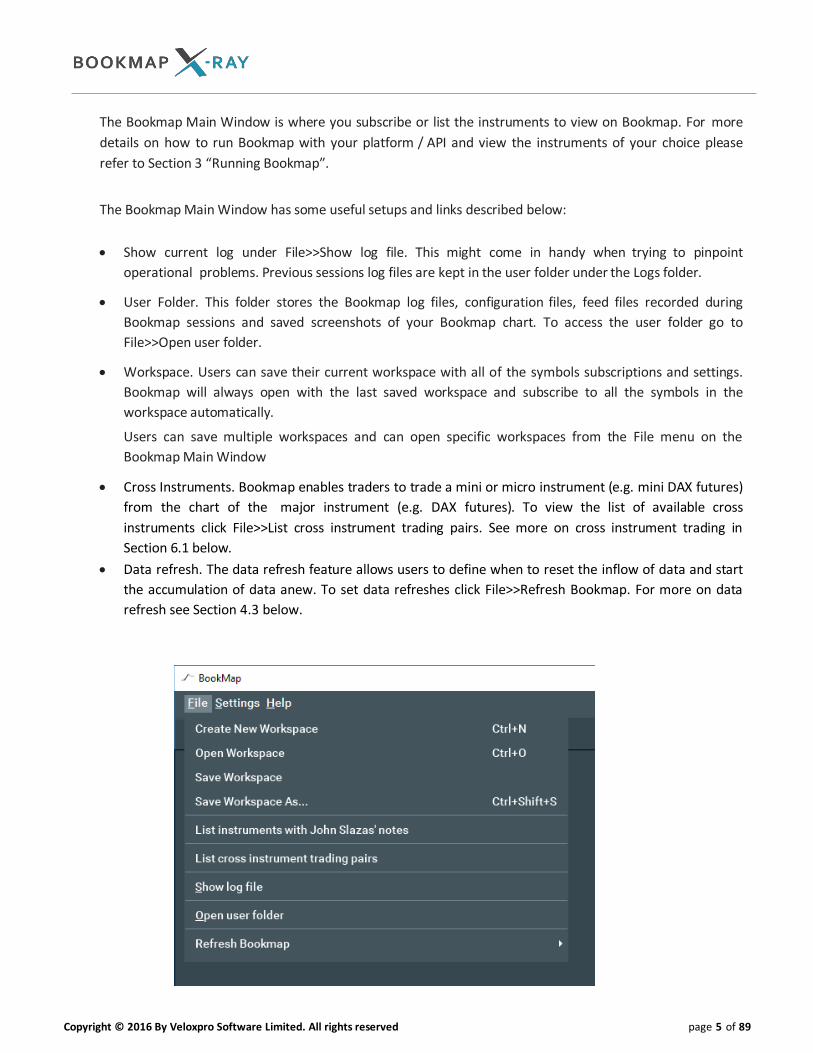
The Bookmap Main Window has some useful setups and links described below:
Show current log under File>>Show log file. This might come in handy when trying to pinpoint
operational problems. Previous sessions log files are kept in the user folder under the Logs folder.
User Folder. This folder stores the Bookmap log files, configuration files, feed files recorded during
Bookmap sessions and saved screenshots of your Bookmap chart. To access the user folder go to
File>>Open user folder.
Workspace. Users can save their current workspace with all of the symbols subscriptions and settings.
Bookmap will always open with the last saved workspace and subscribe to all the symbols in the
workspace automatically.
Users can save multiple workspaces and can open specific workspaces from the File menu on the
Bookmap Main Window
Cross Instruments. Bookmap enables traders to trade a mini or micro instrument (e.g. mini DAX futures)
from the chart of the major instrument (e.g. DAX futures). To view the list of available cross
instruments click File>>List cross instrument trading pairs. See more on cross instrument trading in
Section 6.1 below.
Data refresh. The data refresh feature allows users to define when to reset the inflow of data and start
the accumulation of data anew. To set data refreshes click File>>Refresh Bookmap. For more on data
refresh see Section 4.3 below.
Copyright © 2016 By Veloxpro Software Limited. All rights reserved page 6 of 89
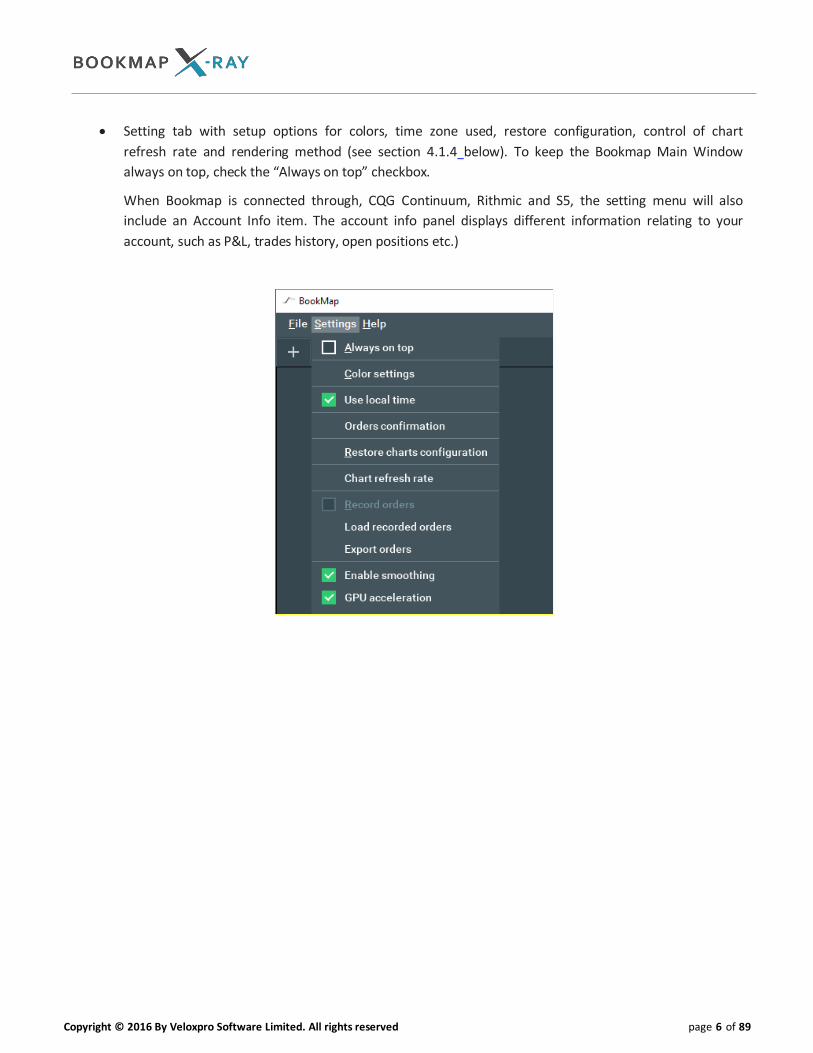
Setting tab with setup options for colors, time zone used, restore configuration, control of chart
refresh rate and rendering method (see section 4.1.4 below). To keep the Bookmap Main Window
always on top, check the “Always on top” checkbox.
When Bookmap is connected through, CQG Continuum, Rithmic and S5, the setting menu will also
include an Account Info item. The account info panel displays different information relating to your
account, such as P&L, trades history, open positions etc.)
Copyright © 2016 By Veloxpro Software Limited. All rights reserved page 7 of 89
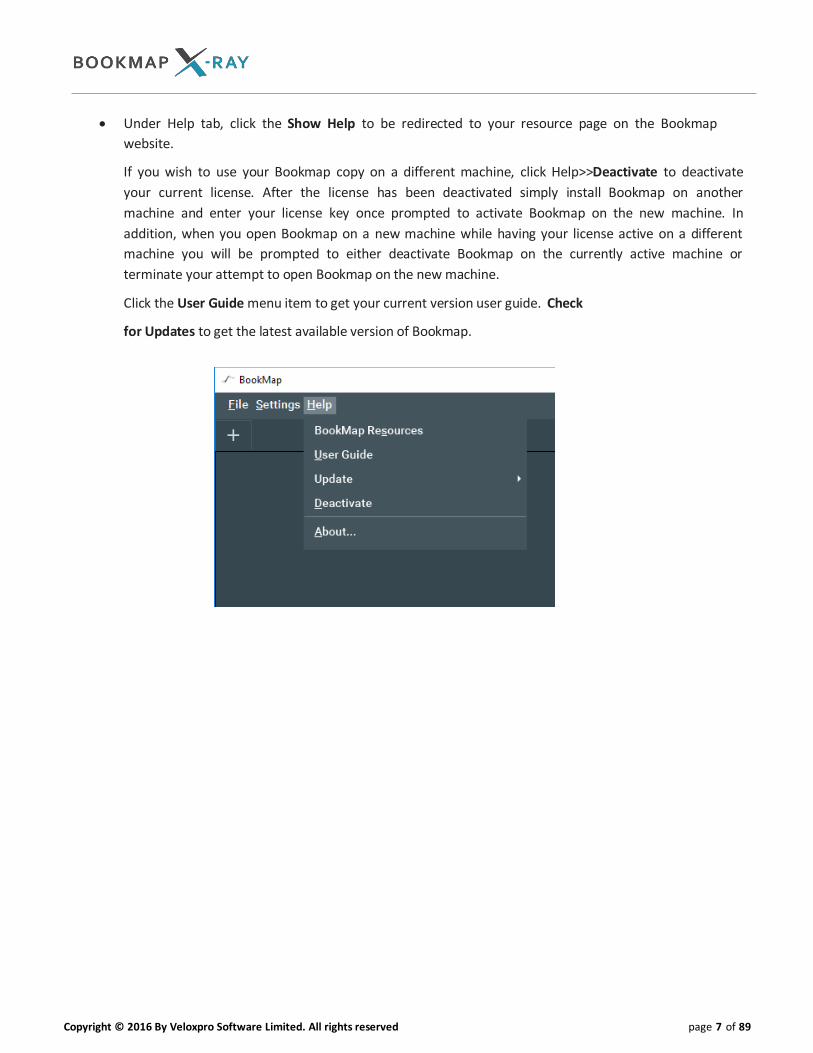
Under Help tab, click the Show Help to be redirected to your resource page on the Bookmap
website.
If you wish to use your Bookmap copy on a different machine, click Help>>Deactivate to deactivate
your current license. After the license has been deactivated simply install Bookmap on another
machine and enter your license key once prompted to activate Bookmap on the new machine. In
addition, when you open Bookmap on a new machine while having your license active on a different
machine you will be prompted to either deactivate Bookmap on the currently active machine or
terminate your attempt to open Bookmap on the new machine.
Click the User Guide menu item to get your current version user guide. Check
for Updates to get the latest available version of Bookmap.
Copyright © 2016 By Veloxpro Software Limited. All rights reserved page 8 of 89
3. Running Bookmap
Bookmap supports the following 3 modes of operation:
Replay data / Simulated trading: this mode of operation is independent of your trading platform and
operates as a standalone product. It allows you to replay market depth data files of previous live sessions
you recorded. Traders can place and execute simulated orders to evaluate how their trading decisions and
strategies fit their analysis of the market based on Bookmap insights.
Live data / Simulated trading: this mode of operation allows you to trade with internal Bookmap simulator
while acting on real time data transmitted from your supported trading platform.
Live data / real trading: this mode of operation presents real time market depth data and orders transmitted
from your supported trading platform. It also supports the transmission of limit orders to your supported
trading platform through one-click order placement directly from the Bookmap chart. This mode requires
the one-click trading add-on feature (see section0for details).
3.1 Trading Technologies Users
Bookmap connects directly to the TT API. To work with Bookmap, TT users need to download TT API 32
bit from here. After logging in to Bookmap using the X_Trader credentials, TT users can load the symbols
of their choice onto Bookmap either manually or by dragging them from their TT platform (X_Trader and
X_Trader Pro). Click here for a short video tutorial on how to run Bookmap with TT X_Trader or X_Trader
Pro.
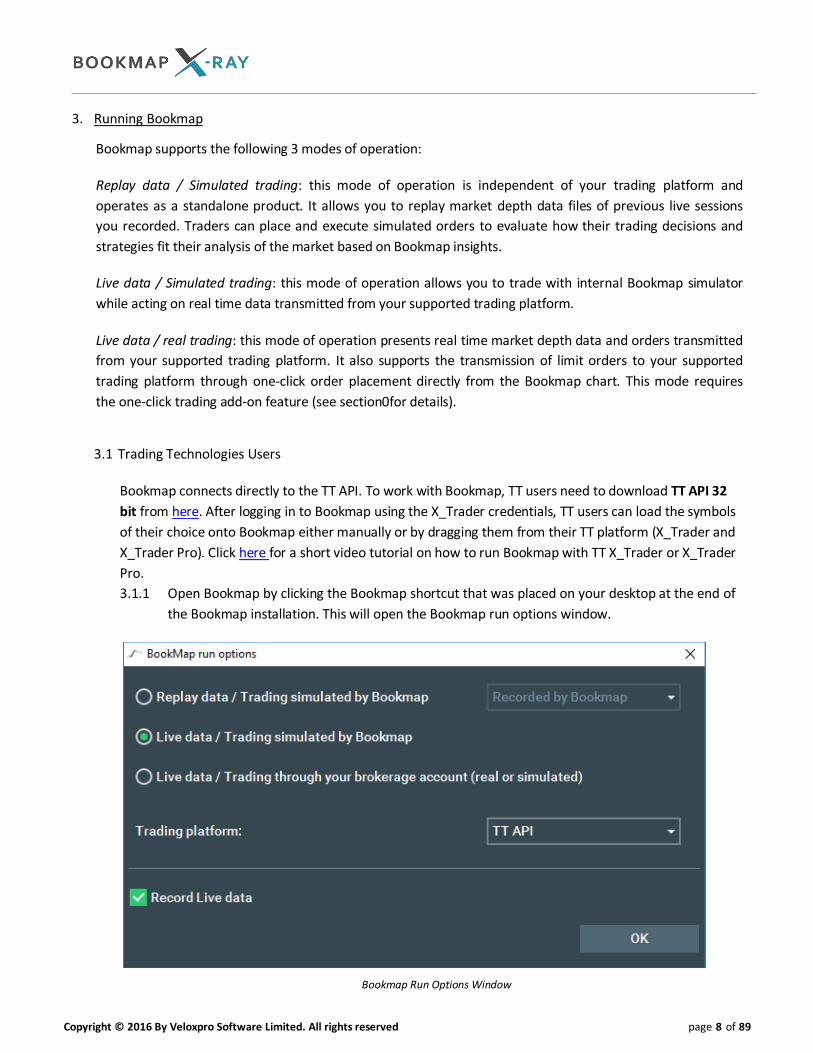
3.1.1 Open Bookmap by clicking the Bookmap shortcut that was placed on your desktop at the end of
the Bookmap installation. This will open the Bookmap run options window.
Bookmap Run Options Window

Copyright © 2016 By Veloxpro Software Limited. All rights reserved page 9 of 89
3.1.2 Choose either of the live data run options and X_Trader as your trading platform. To record live
data, click the "Record Live data" checkbox. This will record your session's data into a
proprietary formatted file which you can later replay using the Replay run mode. Click OK to
open the Bookmap for TT API login screen.
Bookmap for TT API Login
3.1.3 Enter you X_Trader credentials and login. This will open the Bookmap Main Window. Click the + sign to open the instrument subscription window.
Instrument SubscriptionWindow
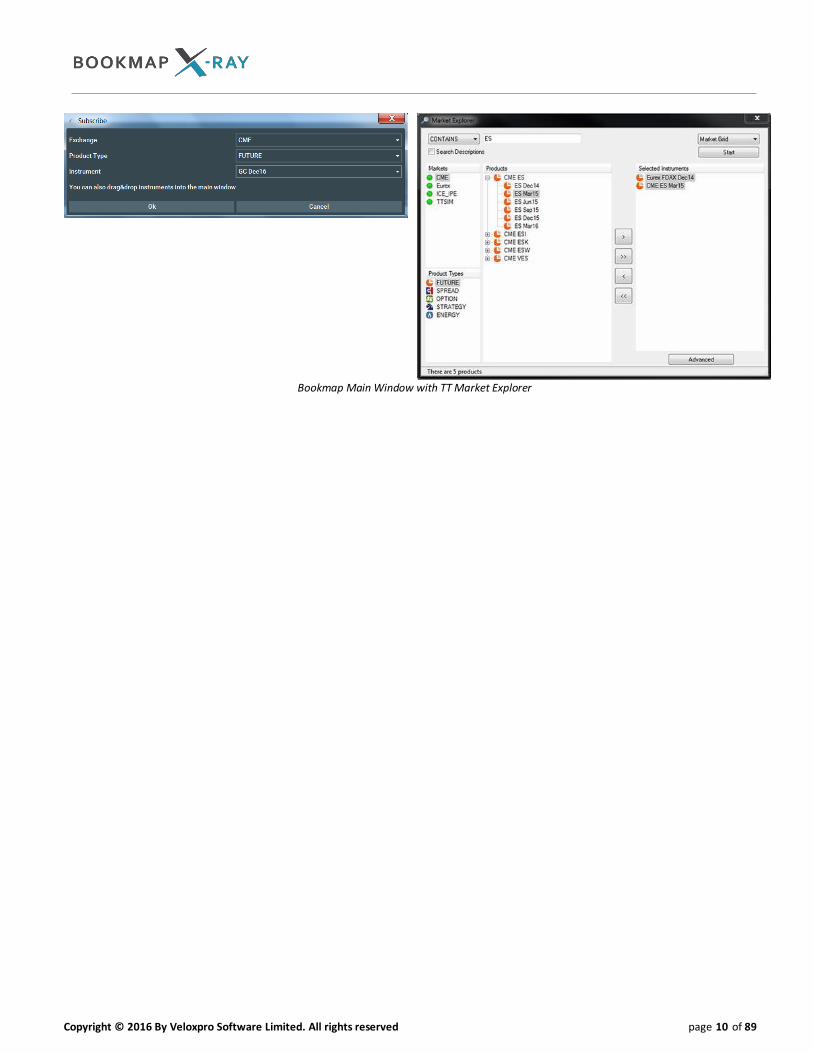
3.1.4 To add instruments to Bookmap, users can either add the symbols manually by clicking Add
and typing in the symbol name (using the exact syntax used on the X_Trader platform), or
drag and drop the symbols of your choice from the TT Market explorer on you X_Trader
platform. For the latter option, simply select the instruments of your choice and drag them
onto the Bookmap control window. The selected instruments will be displayed on the
Bookmap control panel. Initially they will be displayed with grayed out buttons, which will
become active once new trade data is received from X_Trader Pro. Once active, click any of
the active symbol button to open its respective Bookmap chart.
Note that each symbol chart can be detached from the main window by simply right click and
drag to a different location on your desktop. To reattach the chart to the main window simply
close the floating symbol chart.
Copyright © 2016 By Veloxpro Software Limited. All rights reserved page 10 of 89
Bookmap Main Window with TT Market Explorer
Copyright © 2016 By Veloxpro Software Limited. All rights reserved Page 11 of 89
3.2 CQG Users
Bookmap connects directly to CQG Continuum API. Click here for a short video tutorial on how to run
Bookmap with CQG.
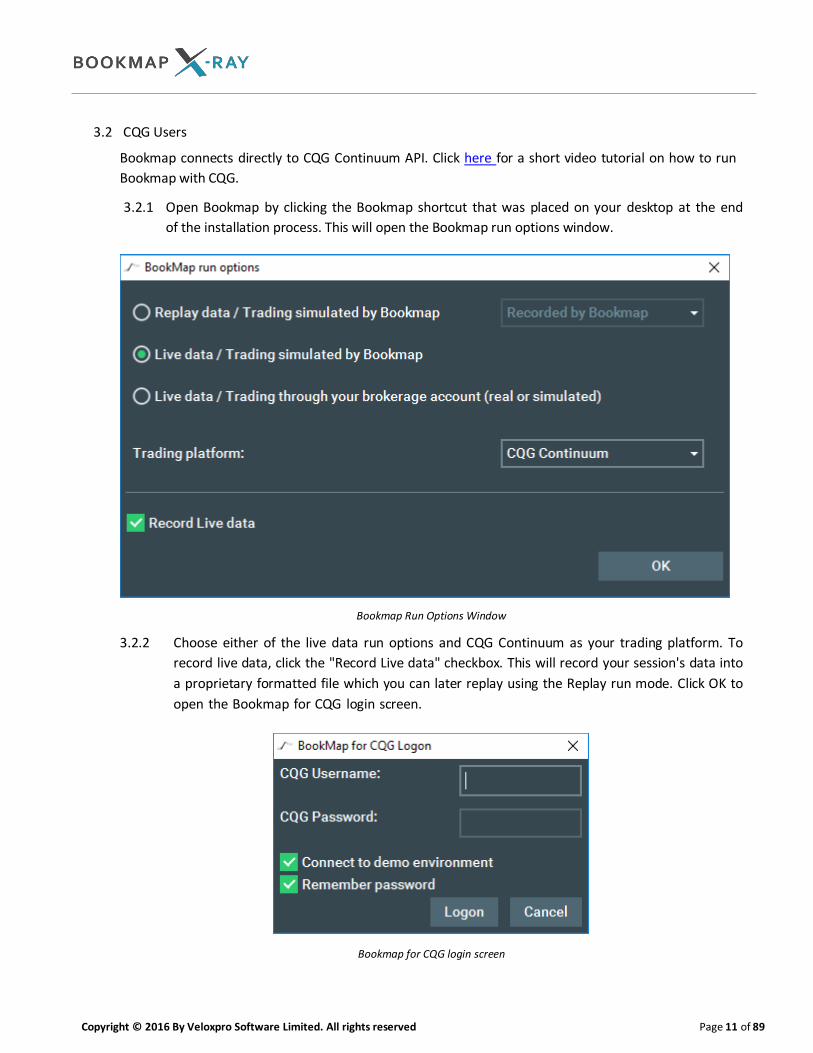
3.2.1 Open Bookmap by clicking the Bookmap shortcut that was placed on your desktop at the end
of the installation process. This will open the Bookmap run options window.
Bookmap Run Options Window
3.2.2 Choose either of the live data run options and CQG Continuum as your trading platform. To
record live data, click the "Record Live data" checkbox. This will record your session's data into
a proprietary formatted file which you can later replay using the Replay run mode. Click OK to
open the Bookmap for CQG login screen.
Bookmap for CQG login screen
Copyright © 2016 By Veloxpro Software Limited. All rights reserved Page 12 of 89
3.2.3 Enter your CQG credentials in the login screen and check the “Connect to Demo
Environment” checkbox if you are using demo credentials, otherwise leave the checkbox
unchecked. Once logged in, the Bookmap Main Window opens.
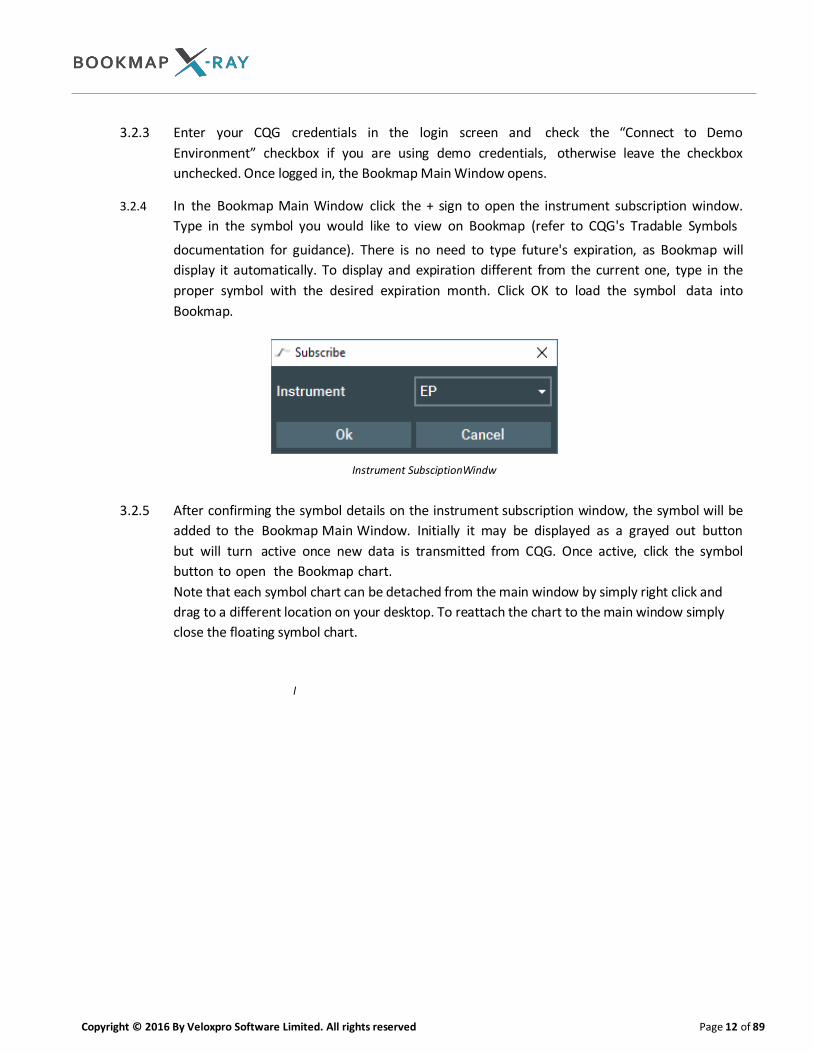
3.2.4 In the Bookmap Main Window click the + sign to open the instrument subscription window.
Type in the symbol you would like to view on Bookmap (refer to CQG's Tradable Symbols
documentation for guidance). There is no need to type future's expiration, as Bookmap will
display it automatically. To display and expiration different from the current one, type in the
proper symbol with the desired expiration month. Click OK to load the symbol data into
Bookmap.
Instrument SubsciptionWindw
3.2.5 After confirming the symbol details on the instrument subscription window, the symbol will be
added to the Bookmap Main Window. Initially it may be displayed as a grayed out button
but will turn active once new data is transmitted from CQG. Once active, click the symbol
button to open the Bookmap chart.
Note that each symbol chart can be detached from the main window by simply right click and
drag to a different location on your desktop. To reattach the chart to the main window simply
close the floating symbol chart.
l
Copyright © 2016 By Veloxpro Software Limited. All rights reserved Page 13 of 89
3.3 NinjaTrader Users
Click here for a short video tutorial on how to run Bookmap with NinjaTrader. While the method for
connecting Bookmap to NinjaTrader detailed here is by using Bookmap as an indicator inside
NinjaTrader, Ninja users can also work with Bookmap in parallel to their NinjaTrader platform by
connecting Bookmap directly to the one of the applicable data feed | transactional APIs, detailed in this
Section 3. This way, Ninja users can work with Bookmap as a standalone platform while still keeping it in
sync with their NinjaTrader platform and account.
3.3.1 Before running Bookmap live for the first time, the Bookmap script has to be imported as an
indicator to the NinjaTrader Platform. To import the Bookmap script, follow the steps below.
Please note the installation process of Bookmap in NinjaTrader is performed only once.
Afterwards, you will add Bookmap as an indicator in NinjaTrader.
3.3.2 First, delete any older installation of Bookmap. Open NinjaTrader and go to "File -> Utilities->
Remove NinjaScript Assembly. If you have an older installation of Bookmap, you will see the
Bookmapindicator and Bookmap proxy dll in the list of script assemblies. Remove first the
proxy dll and then the Bookmap indicator.
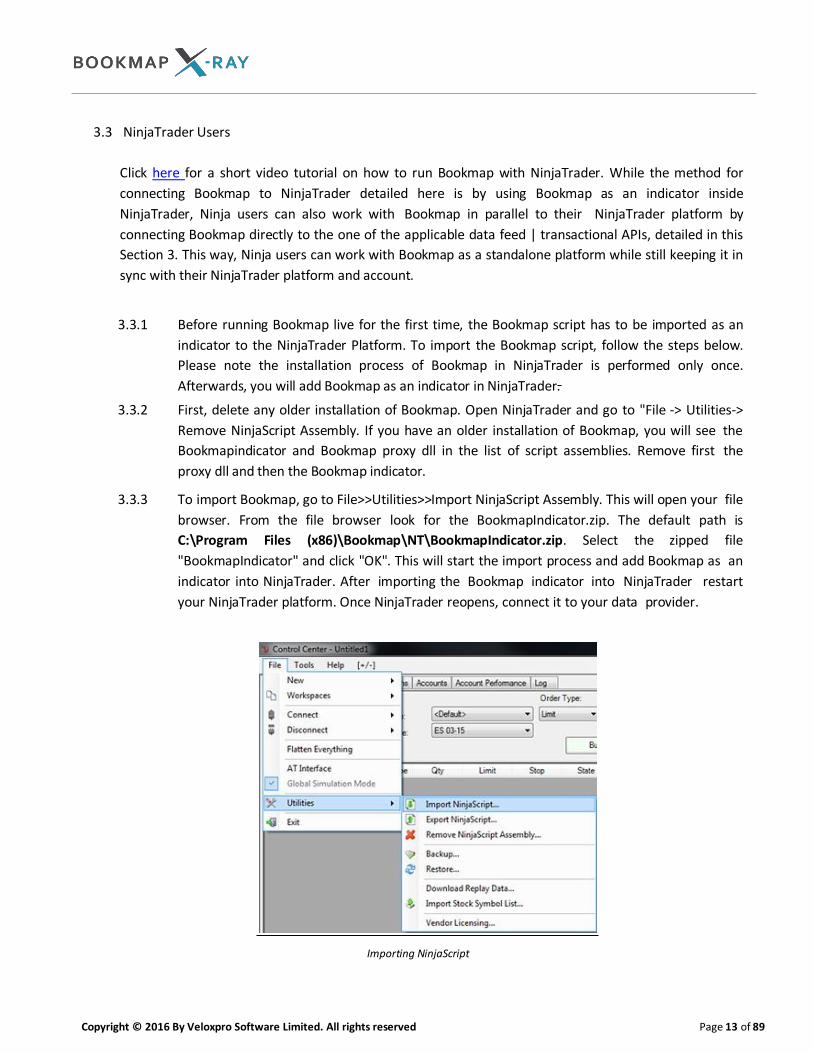
3.3.3 To import Bookmap, go to File>>Utilities>>Import NinjaScript Assembly. This will open your file
browser. From the file browser look for the BookmapIndicator.zip. The default path is
C:\Program Files (x86)\Bookmap\NT\BookmapIndicator.zip. Select the zipped file
"BookmapIndicator" and click "OK". This will start the import process and add Bookmap as an
indicator into NinjaTrader. After importing the Bookmap indicator into NinjaTrader restart
your NinjaTrader platform. Once NinjaTrader reopens, connect it to your data provider.
Importing NinjaScript
Copyright © 2016 By Veloxpro Software Limited. All rights reserved Page 14 of 89
3.3.4 Open a Ninja chart with the symbol you would like to view on Bookmap. Once the Ninja
chart is up and running, click the indicator symbol above the chart to open your available
indicators list. From the list of indicators select Bookmap xRay and click OK.
3.3.5 Bookmap Main Window will open with the symbol of your choice. To add more symbols to
Bookmap, simply open another Ninja chart with a symbol of your choice and add the Bookmap
xRay indicator to the chart. All symbols will be added to the Bookmap Main Window.
Note that each symbol chart can be detached from the main window by simply right click and
drag to a different location on your desktop. To reattach the chart to the main window simply
close the floating symbol chart.

Copyright © 2016 By Veloxpro Software Limited. All rights reserved Page 15 of 89
3.4 TWS Users
Click here for a short video tutorial on how to run Bookmap with Interactive Brokers TWS.
3.4.1 Before launching Bookmap with your TWS platform make sure that “Enable ActiveX and Socket
Clients” is checked. To activate it, go to "File>>Global Configuration>>API>>Settings" and mark the
checkbox. If it is not checked, then Bookmap will not open.
TWS API Settings Window
3.4.2 Open Bookmap by clicking on the Bookmap shortcut icon on your desktop. This will open the
Bookmap run options window. Choose either of the live data run options and TWS as your trading
platform. To record live data, click the "Record Live data" checkbox. This will record your session's
data into a proprietary formatted file which you can later replay using the Replay run mode. Click
OK

Copyright © 2016 By Veloxpro Software Limited. All rights reserved Page 16 of 89
Bookmap Run Options Window
3.4.3 Next a Connection window pops up. Click "OK". Also click "Yes" to Interactive Broker's Accept
incoming connection attempt window
Copyright © 2016 By Veloxpro Software Limited. All rights reserved Page 17 of 89
3.4.4 After connecting, the Add Instrument button on the Bookmap Live control window will become
active. Click "Add Instrument" button to open the Bookmap Subscribe window and add the
instruments of your choice. The number of instruments per session that can be added to
Bookmap is limited by TWS to three. Note that the details of the exchange and instrument of your
choice must match exactly to those used by TWS. To copy the exact instrument text in TWS, right
click on any symbol text in TWS platform and select “Contract Info>>Description”. Copy and paste
the contract info and symbol name into the respective Bookmap Subscribe window. Be sure to
copy all spaces and expiration info as well. Then click “OK”.
3.4.5 The symbol will be added to the Bookmap Main Window. Initially it will be displayed as a grayed
out button but will turn active once new data is transmitted from TWS. Once active, click the
symbol button to open the Bookmap chart.
Note that each symbol chart can be detached from the main window by simply right click and drag
to a different location on your desktop. To reattach the chart to the main window simply close the
floating symbol chart.
Copyright © 2016 By Veloxpro Software Limited. All rights reserved Page 18 of 89
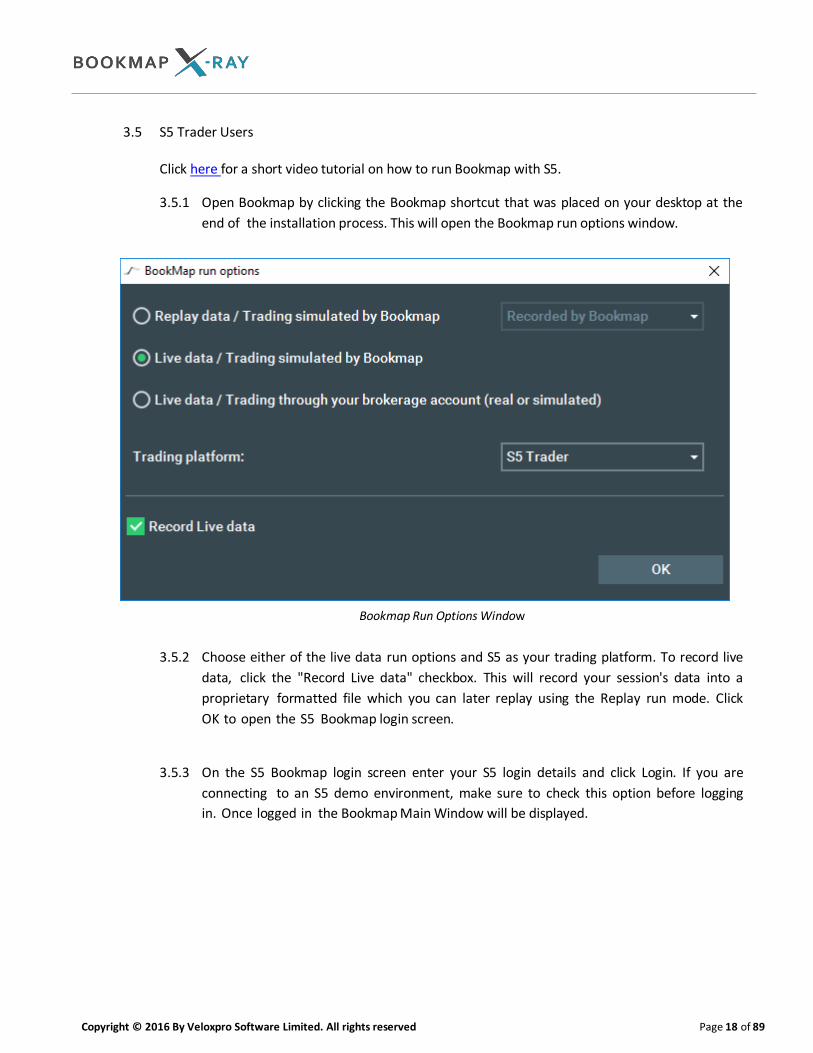
3.5 S5 Trader Users
Click here for a short video tutorial on how to run Bookmap with S5.
3.5.1 Open Bookmap by clicking the Bookmap shortcut that was placed on your desktop at the
end of the installation process. This will open the Bookmap run options window.
Bookmap Run Options Window
3.5.2 Choose either of the live data run options and S5 as your trading platform. To record live
data, click the "Record Live data" checkbox. This will record your session's data into a
proprietary formatted file which you can later replay using the Replay run mode. Click
OK to open the S5 Bookmap login screen.
3.5.3 On the S5 Bookmap login screen enter your S5 login details and click Login. If you are
connecting to an S5 demo environment, make sure to check this option before logging
in. Once logged in the Bookmap Main Window will be displayed.
Copyright © 2016 By Veloxpro Software Limited. All rights reserved Page 19 of 89
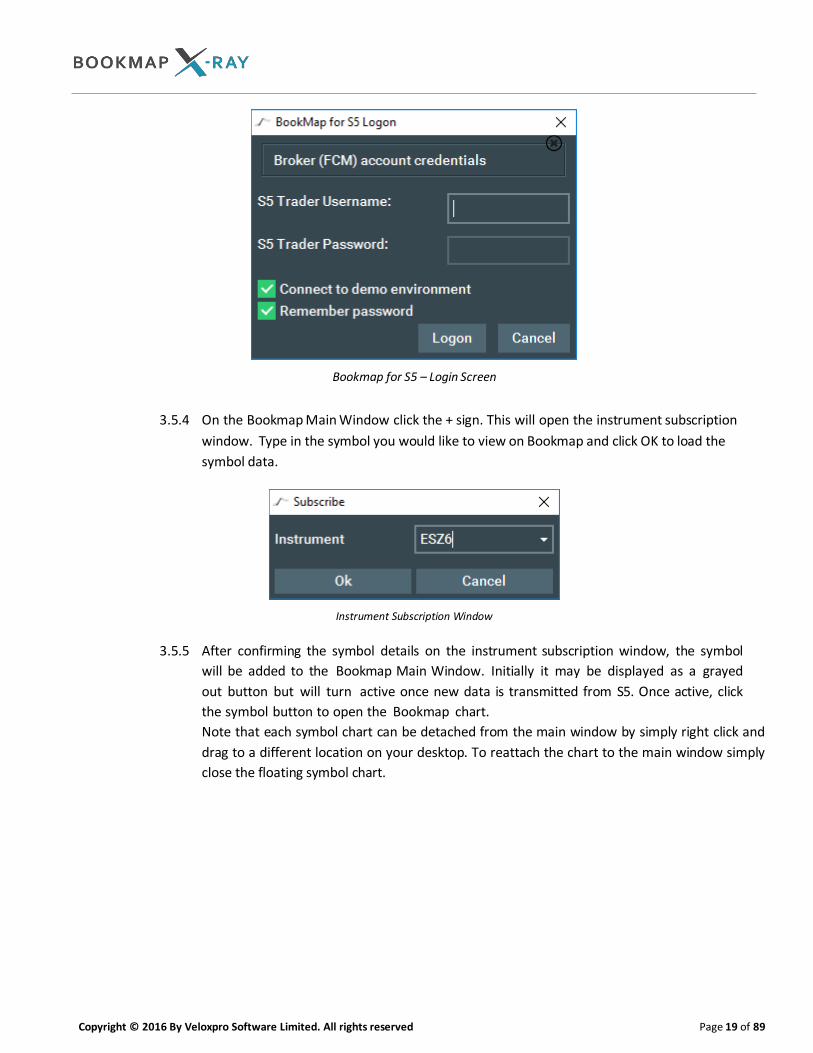
Bookmap for S5 – Login Screen
3.5.4 On the Bookmap Main Window click the + sign. This will open the instrument subscription
window. Type in the symbol you would like to view on Bookmap and click OK to load the
symbol data.
Instrument Subscription Window
3.5.5 After confirming the symbol details on the instrument subscription window, the symbol
will be added to the Bookmap Main Window. Initially it may be displayed as a grayed
out button but will turn active once new data is transmitted from S5. Once active, click
the symbol button to open the Bookmap chart.
Note that each symbol chart can be detached from the main window by simply right click and
drag to a different location on your desktop. To reattach the chart to the main window simply
close the floating symbol chart.

Copyright © 2016 By Veloxpro Software Limited. All rights reserved Page 20 of 89
3.6 IQFeed Subscribers
Bookmap can be connected directly to IQFeed data without the need to have the data streamed
through any platform.
3.6.1 Open Bookmap by clicking the Bookmap shortcut that was placed on your desktop at the end of
the installation process. This will open the Bookmap run options window.
Bookmap Run Options Window
3.6.2 Choose the Live data a/ Simulated trading run mode and select IQFeed as your trading platform.
To record live data, click the "Record Live data" checkbox. This will record your session's data
into a proprietary formatted file which you can later replay using the Replay run mode. Click OK
to open the IQFeed Bookmap login screen. Enter your IQFeed login details and click Login. Once
logged in the Bookmap Main Window will be displayed.
Bookmap for IQFeed – Login Screen

Copyright © 2016 By Veloxpro Software Limited. All rights reserved Page 21 of 89
3.6.3 On the Bookmap Main Window click the + sign. This will open the instrument subscription
window. Type in the symbol you would like to view on Bookmap and click OK to load the
symbol data. Note that the symbol name should be types in the exact format used by IQFeed.
Instrument Subscription Window
3.6.4 After confirming the symbol details on the subscribe window, the symbol will be added to the
Bookmap Main Window. Initially it may be displayed as a grayed out button but will turn active
once new data is transmitted from IQFeed. Once active, click the symbol button to open the
Bookmap chart. Note that each symbol chart can be detached from the main window by simply
right click and drag to a different location on your desktop. To reattach the chart to the main
window simply close the floating symbol chart.
Copyright © 2016 By Veloxpro Software Limited. All rights reserved Page 22 of 89
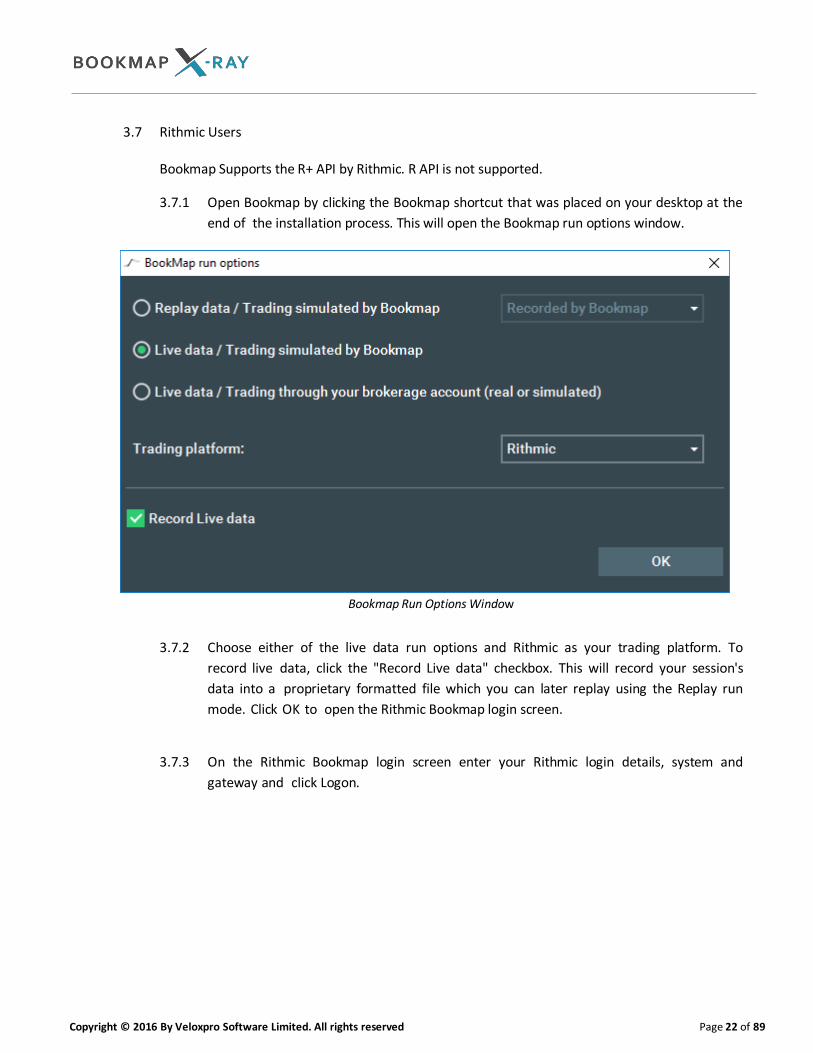
3.7 Rithmic Users
Bookmap Supports the R+ API by Rithmic. R API is not supported.
3.7.1 Open Bookmap by clicking the Bookmap shortcut that was placed on your desktop at the
end of the installation process. This will open the Bookmap run options window.
Bookmap Run Options Window
3.7.2 Choose either of the live data run options and Rithmic as your trading platform. To
record live data, click the "Record Live data" checkbox. This will record your session's
data into a proprietary formatted file which you can later replay using the Replay run
mode. Click OK to open the Rithmic Bookmap login screen.
3.7.3 On the Rithmic Bookmap login screen enter your Rithmic login details, system and
gateway and click Logon.

Copyright © 2016 By Veloxpro Software Limited. All rights reserved Page 23 of 89
Bookmap for Rithmic – Login Screen
3.7.4 On the Bookmap Main Window click the + sign. This will open the Subscribe window.
Type in the exchange and symbol you would like to view on Bookmap and click OK to
load the symbol data.
Instrument Subscription Window
3.7.5 After confirming the symbol details on the subscribe window, the symbol will be added to
the Bookmap Main Window. Initially it may be displayed as a grayed out button but will
turn active once new data is transmitted from Rithmic. Once active, click the symbol
button to open the Bookmap chart. . Note that each symbol chart can be detached from
the main window by simply right click and drag to a different location on your desktop. To
re-attach the chart to the main window simply close the floating symbol chart.
Copyright © 2016 By Veloxpro Software Limited. All rights reserved Page 24 of 89
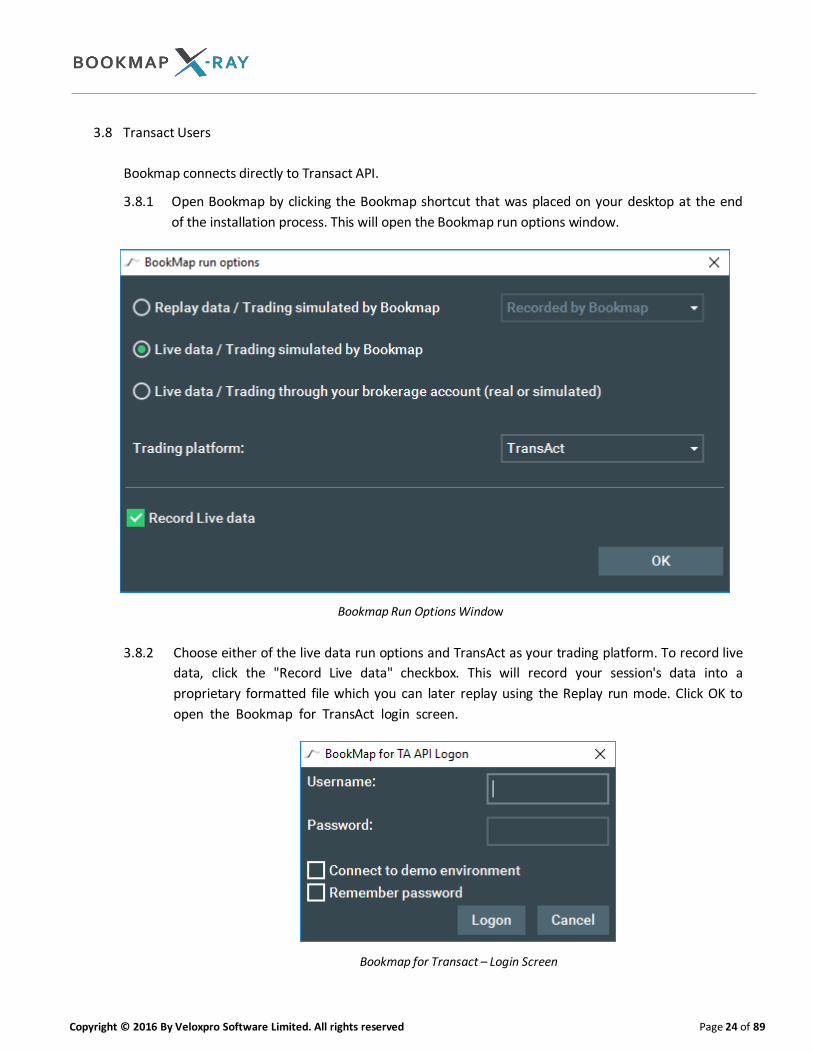
3.8 Transact Users
Bookmap connects directly to Transact API.
3.8.1 Open Bookmap by clicking the Bookmap shortcut that was placed on your desktop at the end
of the installation process. This will open the Bookmap run options window.
Bookmap Run Options Window
3.8.2 Choose either of the live data run options and TransAct as your trading platform. To record live
data, click the "Record Live data" checkbox. This will record your session's data into a
proprietary formatted file which you can later replay using the Replay run mode. Click OK to
open the Bookmap for TransAct login screen.
Bookmap for Transact – Login Screen

Copyright © 2016 By Veloxpro Software Limited. All rights reserved Page 25 of 89
3.8.3 Enter your Transact credentials in the login screen and check the “Connect to Demo
Environment” checkbox if you are using demo credentials, otherwise leave the checkbox
unchecked.. Once logged in, the Bookmap Main Window opens.
3.8.4 In the Bookmap Main Window click the + sign. This will open the instrument subscription
window. Type in the symbol you would like to view on.. Click OK to load the symbol data into
Bookmap.
Instruments Subscription Window
3.8.5 After confirming the symbol details on the instrument subscription window, the symbol will be
added to the Bookmap Main Window. Initially it may be displayed as a grayed out button
but will turn active once new data is transmitted from TransAct API. Once active, click the
symbol button to open the Bookmap chart.
Note that each symbol chart can be detached from the main window by simply right click and
drag to a different location on your desktop. To reattach the chart to the main window simply
close the floating symbol chart.
Copyright © 2016 By Veloxpro Software Limited. All rights reserved Page 26 of 89
4. Operating Bookmap
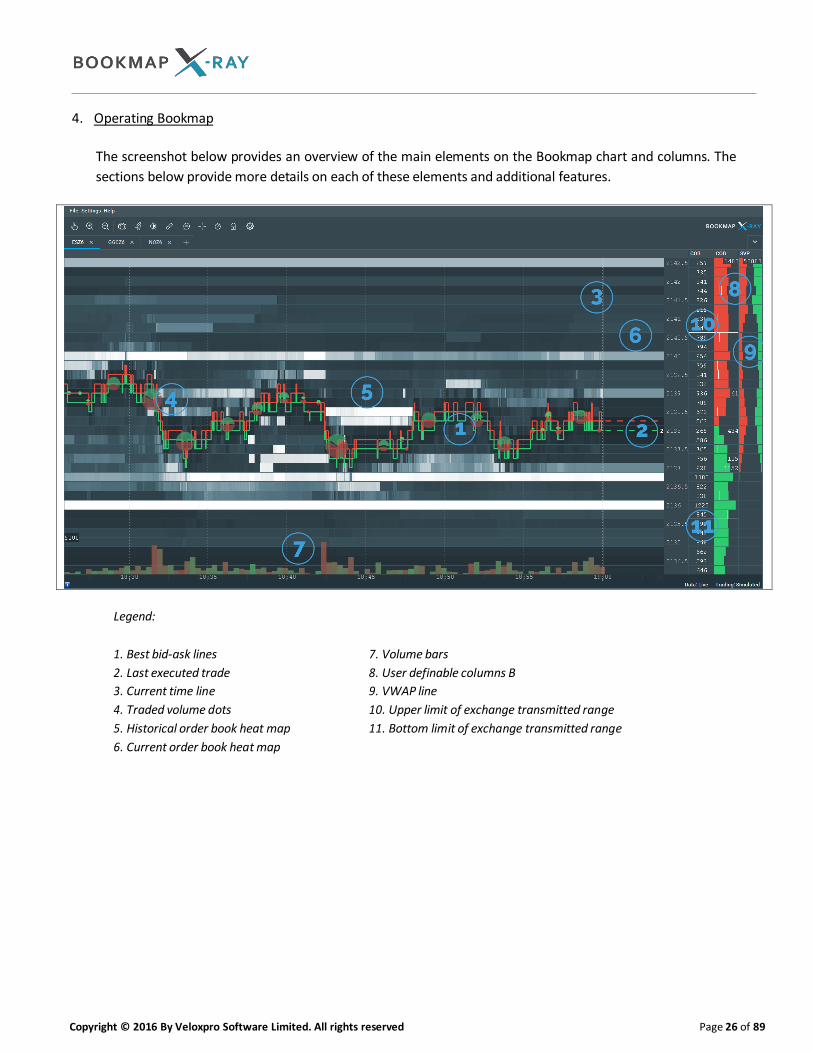
The screenshot below provides an overview of the main elements on the Bookmap chart and columns. The
sections below provide more details on each of these elements and additional features.
Legend:
1. Best bid-ask lines
2. Last executed trade
3. Current time line
4. Traded volume dots
5. Historical order book heat map
6. Current order book heat map
7. Volume bars
8. User definable columns B
9. VWAP line
10. Upper limit of exchange transmitted range
11. Bottom limit of exchange transmitted range
Copyright © 2016 By Veloxpro Software Limited. All rights reserved Page 27 of 89
4.1 Bookmap Chart
4.1.1 Order Book Heat Map
Application:
The Bookmap chart displays the best bid and ask lines on top of a gray shade heat map of the
instrument’s order book. In contrast to other order book applications, which only display the
latest instance of the order book, Bookmap record every instance of the order book and color
code it based on its relative size. This forms a heat map of the order book, which allows traders
to observe the evolution of the market depth over time and detect different patterns that may
help in anticipating short term price action.
Interpretation:
Every price level displays a gray scale based on the relative size of the pending orders resting at
that level. The gray scale ranges between complete black to complete white. The larger the
relative size of the pending orders the whiter the gray scale of that price level. The dynamic
nature of the current order book is reflected in Bookmap by the changing gray scale. In other
words, traders can gauge the variations of liquidity at each level, based on the changes of the
Bookmap gray scale. Such changes are either the result of an increase or decrease in the number
of the pending orders at that price level, or changes in the relative size of that price level
compared to the entire visible order book.
The order book heat map is divided by a vertical moving or static time line (which can also display
a configurable price ladder). Everything left of the vertical time line is a historical view of the
order book and price action, while the area right of the vertical line represent a gray shade
scaling of the current order book. The last trade size is displayed as a red number on the right
side of the vertical time line at the relevant price level. To choose between a moving time line
and static time line display click the configuration icon above the chart and check (or
uncheck) the static time line check box at the lower end of the configuration window. To choose
whether to show the prices on the time line or left of the chart click the configuration icon
and check or uncheck the “show prices on timeline” option. Users can also control the
width of the area right of the timeline by dragging the timeline left or right.
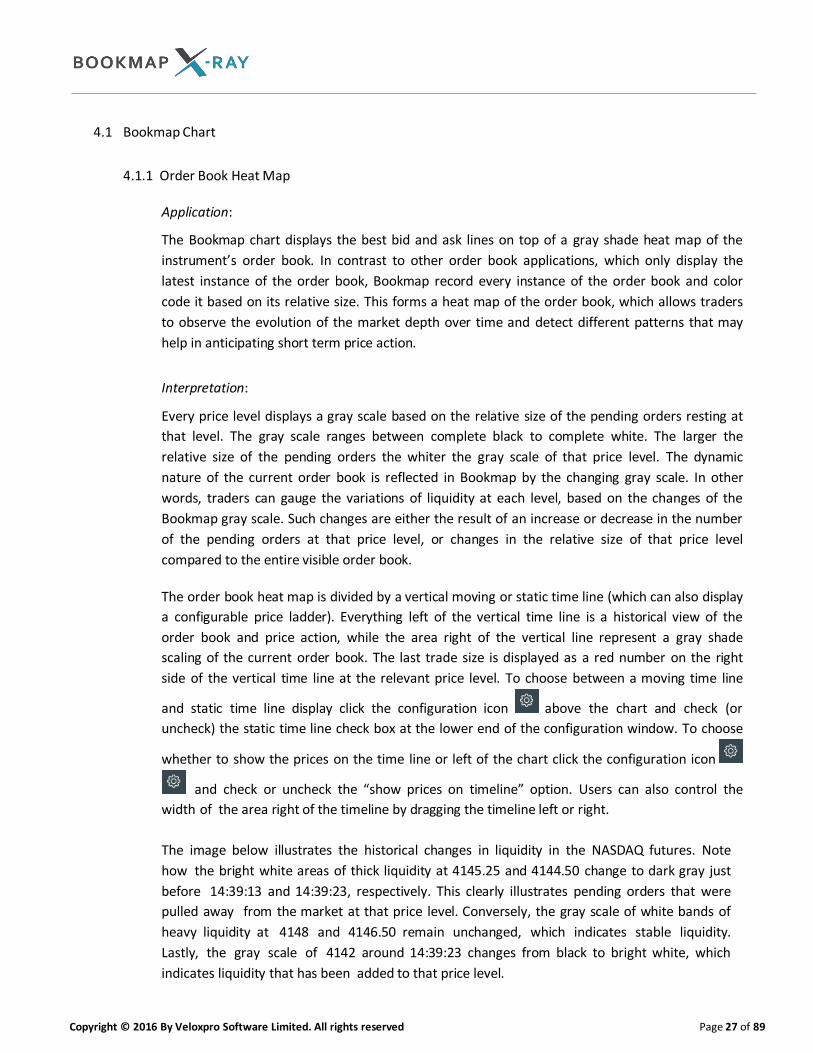
The image below illustrates the historical changes in liquidity in the NASDAQ futures. Note
how the bright white areas of thick liquidity at 4145.25 and 4144.50 change to dark gray just
before 14:39:13 and 14:39:23, respectively. This clearly illustrates pending orders that were
pulled away from the market at that price level. Conversely, the gray scale of white bands of
heavy liquidity at 4148 and 4146.50 remain unchanged, which indicates stable liquidity.
Lastly, the gray scale of 4142 around 14:39:23 changes from black to bright white, which
indicates liquidity that has been added to that price level.
Copyright © 2016 By Veloxpro Software Limited. All rights reserved Page 28 of 89
Liquidity Change
Settings and supporting features
Chart contrast
An internal algorithm automatically adjusts the contrast of the order book heat map based on the
maximum size on the order book and the distribution of pending orders at the different price
levels.
Users can also determine how often Bookmap will adjust the heat map contrast. It can be set at
predefined frequencies and at every time the chart is re-centered. To control these setting, click
the icon above the chart and check the adjustment options you want to use.
In addition, users can control the contrast and brightness of the display by using the applicable
sliders on the contrast settings window.
For more control over the heat map display user can control white and black cut off and also
define the degree of discernibility between price levels with relatively large number of pending
orders.
Copyright © 2016 By Veloxpro Software Limited. All rights reserved Page 29 of 89
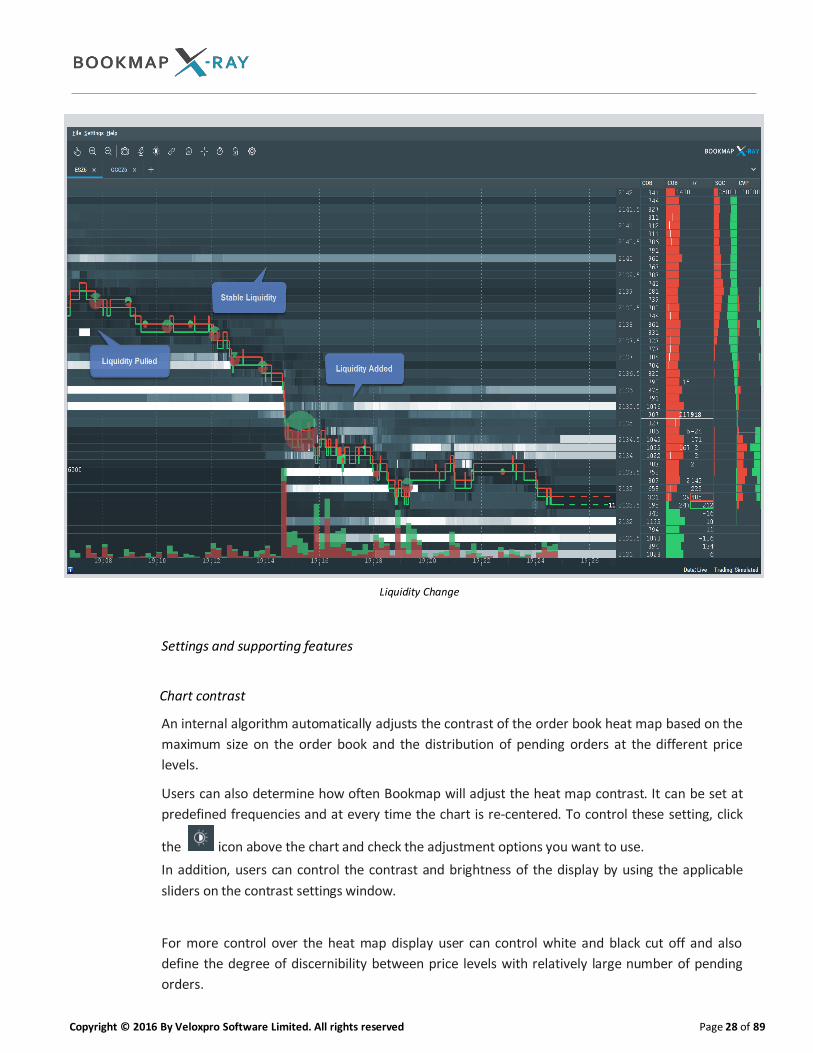
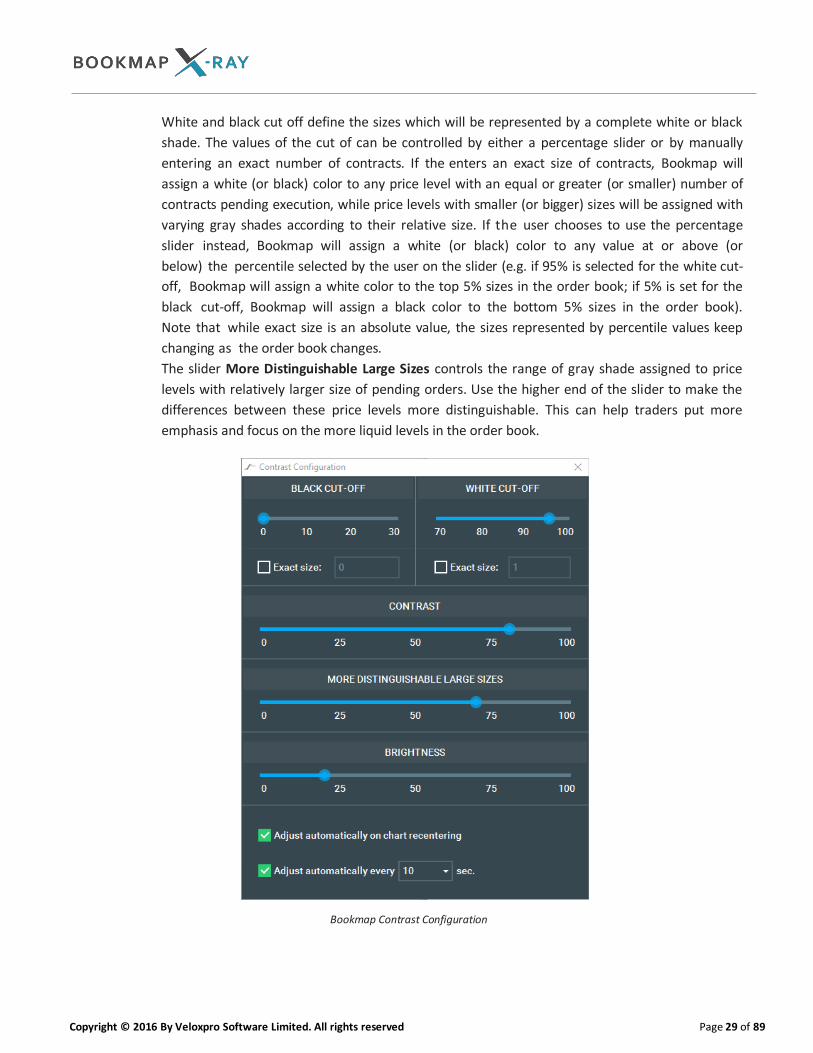
White and black cut off define the sizes which will be represented by a complete white or black
shade. The values of the cut of can be controlled by either a percentage slider or by manually
entering an exact number of contracts. If the enters an exact size of contracts, Bookmap will
assign a white (or black) color to any price level with an equal or greater (or smaller) number of
contracts pending execution, while price levels with smaller (or bigger) sizes will be assigned with
varying gray shades according to their relative size. If the user chooses to use the percentage
slider instead, Bookmap will assign a white (or black) color to any value at or above (or
below) the percentile selected by the user on the slider (e.g. if 95% is selected for the white cut-
off, Bookmap will assign a white color to the top 5% sizes in the order book; if 5% is set for the
black cut-off, Bookmap will assign a black color to the bottom 5% sizes in the order book).
Note that while exact size is an absolute value, the sizes represented by percentile values keep
changing as the order book changes.
The slider More Distinguishable Large Sizes controls the range of gray shade assigned to price
levels with relatively larger size of pending orders. Use the higher end of the slider to make the
differences between these price levels more distinguishable. This can help traders put more
emphasis and focus on the more liquid levels in the order book.
Bookmap Contrast Configuration
Copyright © 2016 By Veloxpro Software Limited. All rights reserved Page 30 of 89
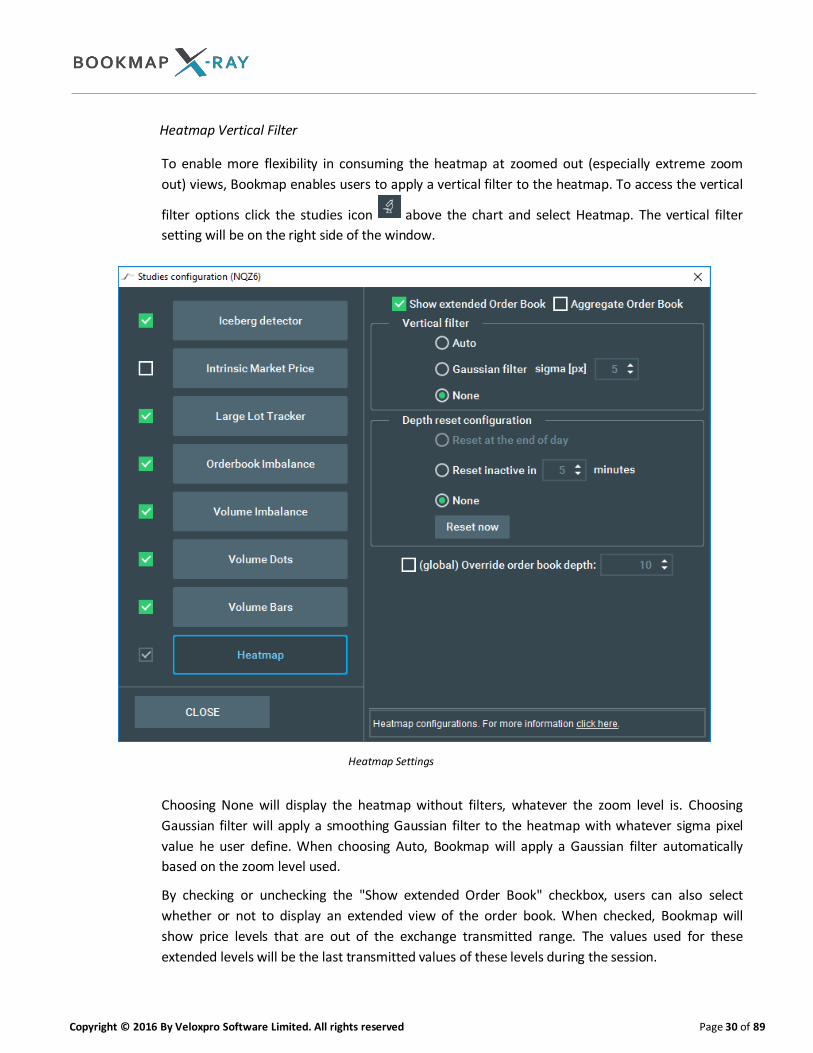
Heatmap Vertical Filter
To enable more flexibility in consuming the heatmap at zoomed out (especially extreme zoom
out) views, Bookmap enables users to apply a vertical filter to the heatmap. To access the vertical
filter options click the studies icon above the chart and select Heatmap. The vertical filter
setting will be on the right side of the window.
Heatmap Settings
Choosing None will display the heatmap without filters, whatever the zoom level is. Choosing
Gaussian filter will apply a smoothing Gaussian filter to the heatmap with whatever sigma pixel
value he user define. When choosing Auto, Bookmap will apply a Gaussian filter automatically
based on the zoom level used.
By checking or unchecking the "Show extended Order Book" checkbox, users can also select
whether or not to display an extended view of the order book. When checked, Bookmap will
show price levels that are out of the exchange transmitted range. The values used for these
extended levels will be the last transmitted values of these levels during the session.

Copyright © 2016 By Veloxpro Software Limited. All rights reserved Page 31 of 89
Normally, the heatmap will display the size of each price level separately. When checking the
"Aggregate Order Book" checkbox, the heatmap will switch to an accumulated display. Each price
level will display the aggregate number of pending orders resting at the price level and all of the
preceding price levels.
Heatmap with no vertical filter

Copyright © 2016 By Veloxpro Software Limited. All rights reserved Page 32 of 89
Heatmap with Gaussian filter
Heatmap with aggregated order book
Copyright © 2016 By Veloxpro Software Limited. All rights reserved Page 33 of 89
Depth Reset Configuration
The exchanges transmit data on limited number of price levels above and below the best ask and best bid. This is referred to as the active range. The active range varies between exchanges and symbols. Since most data providers do not transmit the value of the active range Bookmap calculates it based on the Bookmap update pattern using its own internal algorithm. In addition, in contrast to most order book applications, Bookmap keeps record of the last update of out of range price levels and displays these values on the current order book (COB column) as well as on the heatmap. This allows traders to keep record of the last known size of out of range price levels.
By using the Depth reset configuration, traders can control both the calculation of the active range and the display duration of inactive range, which will mostly be those that are out of range hence lacking exchange updates.
To access the depth reset configuration click the studies icon above the chart and select Heatmap. The configuration options will be on the right side of the window:
Choose None for no depth reset. Bookmap will keep displaying the last update of each price.
Choose Reset inactive and set the number of minutes for the reset interval. Bookmap will reset price levels out of the activae range for which no update was received during the last set number of minutes.
Choose Reset at the end of day to reset depth data at the out-of-active-range price levels at the end of the regular session. Note that this option is only available when connecting to a data provider that provides indication on the end of the trading session. Currently this applies only when Bookmap is connected to Rithmic.
Click Reset Now to manually reset price levels that are out of the current active range.
To override the Bookmap calculated value of the Exchange active range, check the Override order book depth and set a lower number of levels to be considered as the active range. The active range will be marked with 2 horizontal line on the COB column.
Drag Mode and Zoom in-out
a) To zoom in Bookmap chart, click the and buttons or use the mouse scrolling wheel.
b) Use the icon in the toolbar to scroll the chart sideways. When drag mode is active
the hand icon will have a concaved depression . To switch off drag mode and go
back to current price, click the hand icon once more to deselect it.
c) While in drag mode users can scroll back as far as the start of their Bookmap session,
depending on memory capacity. Left click and hold the mouse while scrolling left and right.
The arrows keys can also be used to scroll. Each arrow key stroke moves the chart 1 pixel in
each direction. Using the arrow keys while holding the shift key will scroll the chart 10 pixels in
the relevant direction.
While in drag mode, users can also zoom in and out to view specific details within the

Copyright © 2016 By Veloxpro Software Limited. All rights reserved Page 34 of 89
historical order book. When zooming in using the scrolling wheel Bookmap will keep the
presentation anchored to point in the chart where the mouse cursor is placed. Traders can
also use the zoom in and out icons while in drag mode. In this case Bookmap will keep the
presentation anchored to the middle point of the current chart view. To switch off the drag
mode just click again the hand icon above the chart.
d) Users can also manipulate the time and prices axis by left click and hold and moving the
mouse cursor left or right (time axis) or up and down (price axis). This action will either expand
or contract the horizontal and vertical axis of the chart to increase or decrease the visible time
and/or price level. Note that the manipulation of the vertical axis can be done by left
clicking and holding over the price axis or any of the chart columns and the manipulation of
the horizontal axis is done when hovering over the time axis only.
Time Slices
The Bookmap chart includes dotted vertical lines marking the area between major two time
stamps on the time axis. The length of time between vertical lines is dependent on the actual
time range of the chart. To quickly set the chart range, click the stopwatch icon above
the chart and choose the desired range. Note that this setting will also affect any synched charts.
Bookmap Time Slice Options
Copyright © 2016 By Veloxpro Software Limited. All rights reserved Page 35 of 89
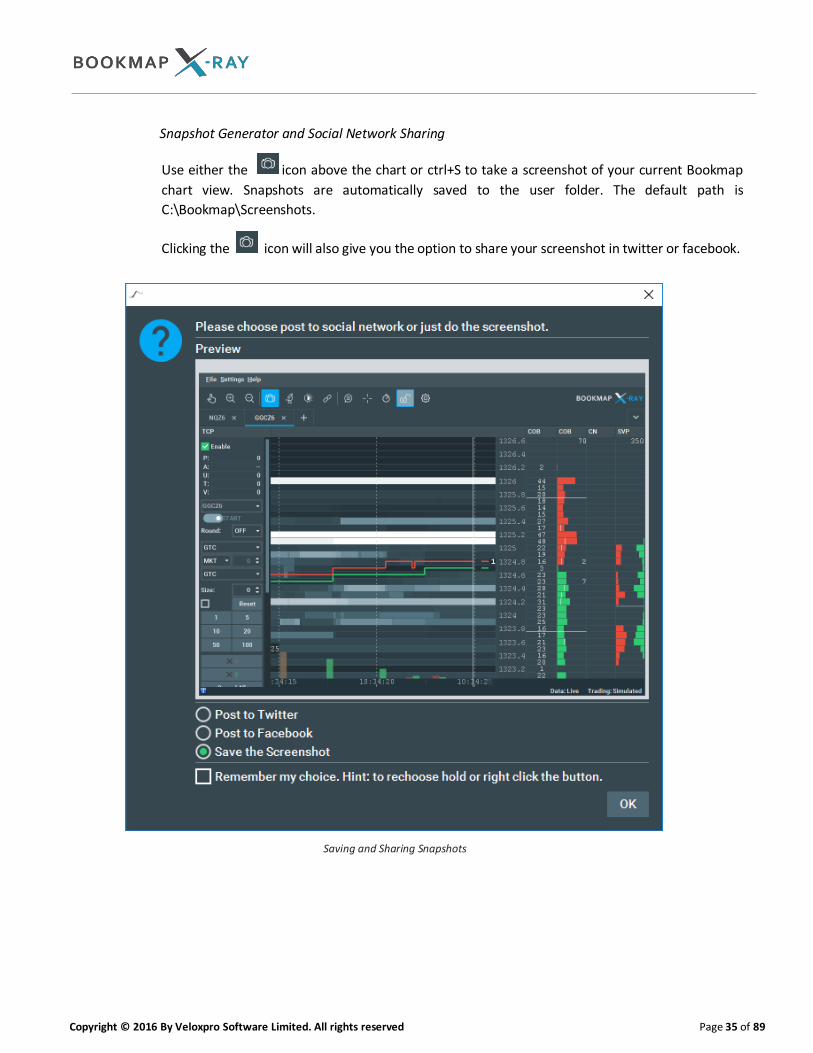
Snapshot Generator and Social Network Sharing
Use either the icon above the chart or ctrl+S to take a screenshot of your current Bookmap
chart view. Snapshots are automatically saved to the user folder. The default path is
C:\Bookmap\Screenshots.
Clicking the icon will also give you the option to share your screenshot in twitter or facebook.
Saving and Sharing Snapshots
Copyright © 2016 By Veloxpro Software Limited. All rights reserved Page 36 of 89
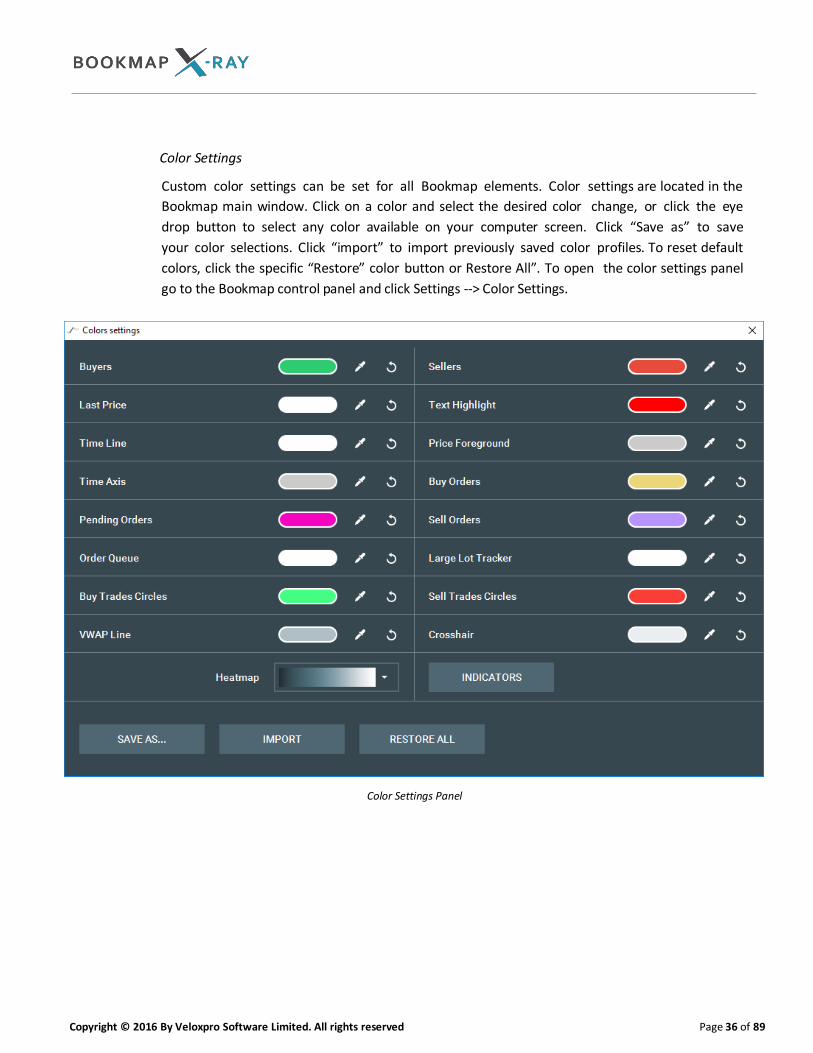
Color Settings
Custom color settings can be set for all Bookmap elements. Color settings are located in the
Bookmap main window. Click on a color and select the desired color change, or click the eye
drop button to select any color available on your computer screen. Click “Save as” to save
your color selections. Click “import” to import previously saved color profiles. To reset default
colors, click the specific “Restore” color button or Restore All”. To open the color settings panel
go to the Bookmap control panel and click Settings --> Color Settings.
Color Settings Panel
Copyright © 2016 By Veloxpro Software Limited. All rights reserved Page 37 of 89
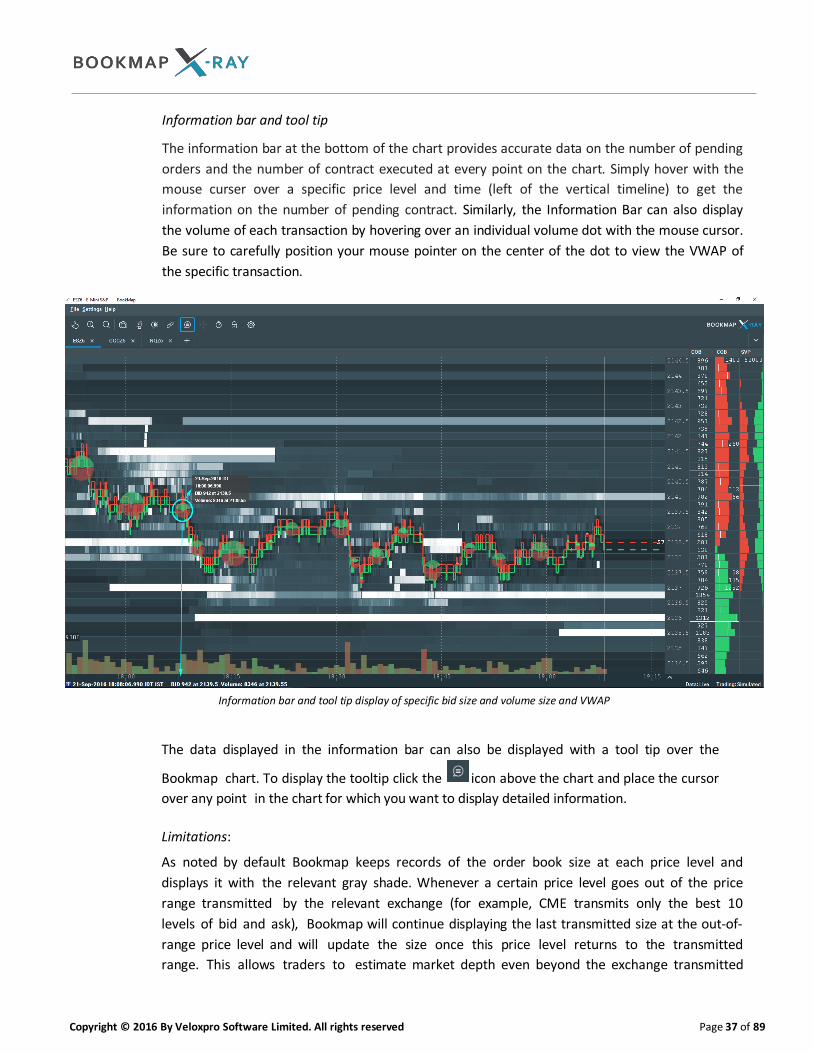
Information bar and tool tip
The information bar at the bottom of the chart provides accurate data on the number of pending
orders and the number of contract executed at every point on the chart. Simply hover with the
mouse curser over a specific price level and time (left of the vertical timeline) to get the
information on the number of pending contract. Similarly, the Information Bar can also display
the volume of each transaction by hovering over an individual volume dot with the mouse cursor.
Be sure to carefully position your mouse pointer on the center of the dot to view the VWAP of
the specific transaction.
Information bar and tool tip display of specific bid size and volume size and VWAP
The data displayed in the information bar can also be displayed with a tool tip over the
Bookmap chart. To display the tooltip click the icon above the chart and place the cursor
over any point in the chart for which you want to display detailed information.
Limitations:
As noted by default Bookmap keeps records of the order book size at each price level and
displays it with the relevant gray shade. Whenever a certain price level goes out of the price
range transmitted by the relevant exchange (for example, CME transmits only the best 10
levels of bid and ask), Bookmap will continue displaying the last transmitted size at the out-of-
range price level and will update the size once this price level returns to the transmitted
range. This allows traders to estimate market depth even beyond the exchange transmitted
Copyright © 2016 By Veloxpro Software Limited. All rights reserved Page 38 of 89
range, however please note that it is only an estimation (or more accurately, a record of the last
transmitted size)of size. Users can override this default behavior and opt to reset out of range
levels or only display depth for the active range. See section 4.1.1 above for details.
4.1.2 Traded Volume Visualization
4.1.2.1 Volume Dots
Application:
Bookmap displays transacted volume using the volume dots. Each dot represents the aggregate
volume that has been transacted during a time period that is equivalent to a single pixel slice
of the user’s screen. This time unit will change based on the level of zoom applied to your
Bookmap chart: the more zoomed in the view is the shorter the time period represented by a
single pixel slice will be, and vice versa.
The size of the volume dots circles is determined by user’s settings (as explained below) and by
an algorithm that scales the aggregated volume of executed trades at a specific pixel time unit in
relation to the instrument’s average volume.
Interpretation:
User can gauge the volume dots to gain information on the relative size of executions at specific
time and price areas and which side has been more aggressive in these transactions. The precise
location of the dot’s center is determined by time (on the X axis) and by the Volume Weighted
Average Price (VWAP) of executions at the relevant time unit (the Y axis). The identity of the
aggressor side can be determined by the color of the dot which is set on a gradient scale of 2
configurable colors representing buyers and sellers. A stronger color represents a more
aggressive action by the side associated with that color.
User can assign the colors they want for the buyers and sellers. See the Color Setting section
above for more information.

Copyright © 2016 By Veloxpro Software Limited. All rights reserved Page 39 of 89
Settings:
To display or hide the volume dots, click the studies icon above the chart and check
the volume dots option on the studies panel.
Volume Dots Configuration Panel
Various settings of the volume dots can be accessed from the studies panel when clicking the
Volume Dots item:
i. Minimum accountable dot volume: this parameter defines the threshold of aggregate volume
required to paint a volume dot.
ii. Circle sizes: defines the scaling of the volume dots.
iii. Transparency: sets the opacity level of the volume dots.
iv. Volume Dots Drawing Type: defines how the classification of aggressor side will be indicated on
the volume dot. Use Gradient to represnt the relative size of the aggressor side (buy and sell)
as a scale of the 2 colors representing buyers and sellers. Use Two Colors to represent the
relative size of the buy and sell aggressor trades as a split of two solid colors. User Sectors to
represent the relative size of the buy and sell aggressive orders as a split pie..
Copyright © 2016 By Veloxpro Software Limited. All rights reserved Page 40 of 89
v. Dots Clustering: defines whether dots are clustered or not and the method of clustering. There
are 3 clustering methods:
Smart – using an internal algorithm Bookmap aggregates together several adjacent or overlapping
dots into a single dot display that is positioned on the chart based on weighted averages of
the trades values and execution time. Use the slider to define the level of aggregation.
Volume – Bookmap will create a volume dot every set number of contracts traded . Note that the
volume dot can represent more contracts traded than the configured number in case the last
trade exceeds the configured volume size. For example, if the configured volume size is 100
but the volume dot is comprised of 2 single sequential trades of size 50 and 100, the volume
dot will show 150 contracts traded and not 100.
Time – Bookmap will paint a volume dot every configurable period of time.
Click Apply to Bars to apply the volume dots clustering settings to the volume bars or click Synchronize with Bars to give to align the volume dots clustering settings with those of the volume bars
Copyright © 2016 By Veloxpro Software Limited. All rights reserved Page 41 of 89
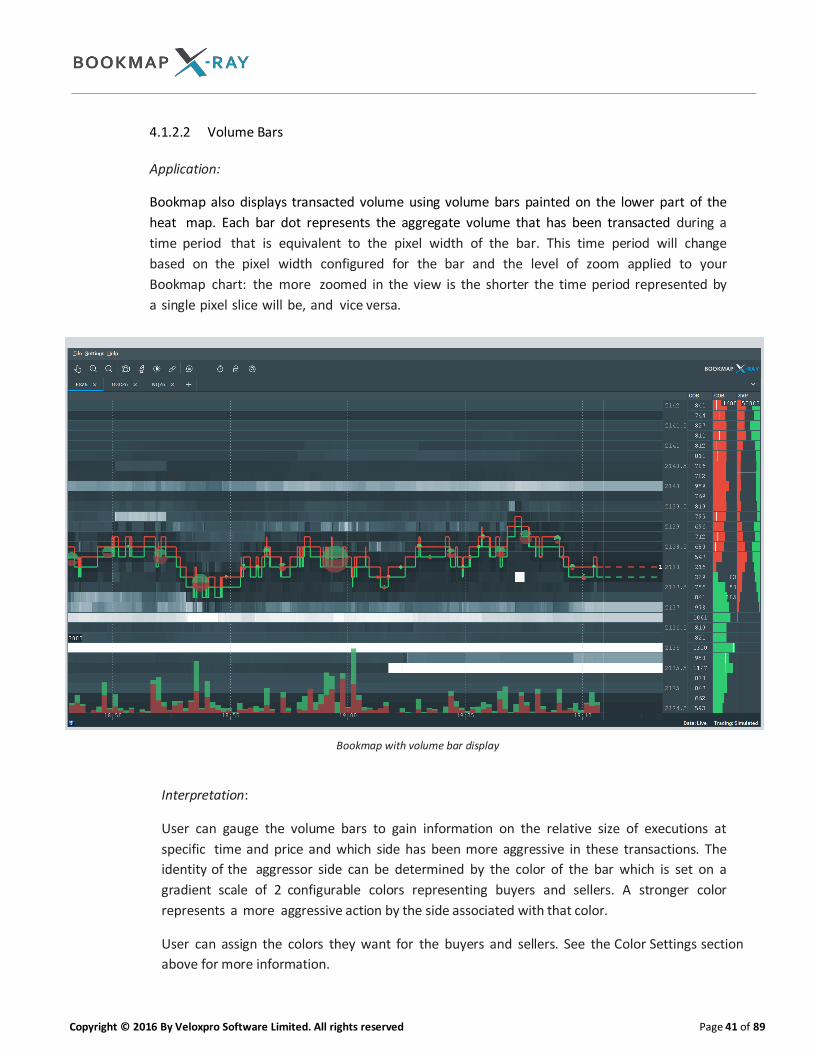
4.1.2.2 Volume Bars
Application:
Bookmap also displays transacted volume using volume bars painted on the lower part of the
heat map. Each bar dot represents the aggregate volume that has been transacted during a
time period that is equivalent to the pixel width of the bar. This time period will change
based on the pixel width configured for the bar and the level of zoom applied to your
Bookmap chart: the more zoomed in the view is the shorter the time period represented by
a single pixel slice will be, and vice versa.
Bookmap with volume bar display
Interpretation:
User can gauge the volume bars to gain information on the relative size of executions at
specific time and price and which side has been more aggressive in these transactions. The
identity of the aggressor side can be determined by the color of the bar which is set on a
gradient scale of 2 configurable colors representing buyers and sellers. A stronger color
represents a more aggressive action by the side associated with that color.
User can assign the colors they want for the buyers and sellers. See the Color Settings section
above for more information.
Copyright © 2016 By Veloxpro Software Limited. All rights reserved Page 42 of 89
Settings:
To display or hide the volume bars, click the studies icon above the chart and check
the volume bars option on the studies panel.
i. Bars Width: by default the bars width is set to 1 pixel. Use the setting window on the
studies panel to change the width of the bars up to a max width of 15 pixels.
ii. Volume Bars Drawing Type: defines how the classification of aggressor side will be indicated on
the volume bar. Use Gradient to represent the relative size of the aggressor side (buy and sell)
as a scale of the 2 colors representing buyers and sellers. Use Two Colors to represent the
relative size of the buy and sell aggressor trades as a split of two solid colors.
iii. Bars Clustering: defines whether volume bars are clustered or not and the method of
clustering. There are 3 clustering methods:
Smart – using an internal algorithm Bookmap aggregates together several adjacent bars into
a single bar positioned on the chart at the time weighted averages of executions.
Volume – Bookmap will create a volume bar every set number of contracts traded . Note that
the volume bar can represent more contracts traded than the configured number in case the
last trade exceeds the configured volume size. For example, if the configured volume size is
100 but the volume bar is comprised of 2 single sequential trades of size 50 and 100, the
volume bar will show 150 contracts traded and not 100.
Time – Bookmap will paint a volume bar every configurable period of time.
Click Apply to Bars to apply the volume dots clustering settings to the volume bars or click
Synchronize with Bars to give to align the volume dots clustering settings with those of the
volume bars
In order to set the height of volume bar display the area on the heat map, hover with the curser
over the volume bar area and drag the red line that appear to the desired height. The number on
the right represents the max volume bar value during the displayed range.

Copyright © 2016 By Veloxpro Software Limited. All rights reserved Page 43 of 89
Volume bars configuration
4.1.3 Chart Synchronization
Application:
If you have multiple Bookmap charts open, you can synchronize the charts together. One chart is
defined as a master chart and the viewing range of all other open charts is synchronized with it.
Any change applied to the chart range of the master chart will automatically be reflected in the
subordinate charts.
Interpretation:
Traders can use the synchronization feature to look for deviations in price or liquidity behavior of
correlated instruments or viewing various legs of spread trades.
Settings:
Once all relevant charts are open, click the sync icon above the chart you want to designate
as the master chart. Any change of range you make on the master chart (whether by dragging or
zooming in and out) will be reflected on the subordinated charts. Note that all charts should have
Copyright © 2016 By Veloxpro Software Limited. All rights reserved Page 44 of 89
the same size window for the synchronization to be complete. To deactivate the sync mode
simply click again the sync icon.
Limitations:
It is recommended that all synchronized charts are the same size in order to have a complete
synchronization.
All open charts are affected by the synchronization feature; one chart acts as a master chart
and the rest are subordinated to the master chart.
Dragging or zooming in and out on a subordinate chart will break the synchronization of that
specific chart in relationship to the master chart.
4.1.4 Chart Refresh Rate, GPU Acceleration and Smoothing
Bookmap utilized advanced GPU to efficiently and rapidly render the visual information on the
chart. It could be that some users’ machine will be less equipped to handle the resources
required for rapid chart refreshes, whether because of lack f advanced GPU support or low video
memory. If you experience resources burden using the default refresh rate of the Bookmap chart
(every 25 milliseconds) users can set the refresh rate higher for less resource strain on
their system. To change the refresh rate, click Setting >> Chart refresh rate from the Bookmap
control panel, and choose an in-range rate from the refresh rate setting panel.
Bookmap normally works with OpenGL 3 and above. Not all video cards support this OpenGL
version or may have outdated drivers. If you cannot update your video card to support this
OpenGL requirements Bookmap can still work with older video card but that will require more
CPU utilization. To allow Bookmap to work without GPU acceleration click the Settings menu on
the Bookmap control window and deselect the GPU acceleration option on the menu.
4.1.5 Presentation Mode
This mode is intended to improve the quality of the presentation of Bookmap with video capture
or screen sharing software. It allows recording of Bookmap sessions with video capture software
(e.g. Camtasia) or screen sharing Bookmap over Skype or similar screen sharing software, while
maintaining the original Bookmap chart frame rate instead of lower frame rate enforced by these
software.
To use this presentation mode, click Settings>>Chart refresh rate and check the
“Presentation Mode” checkbox

Copyright © 2016 By Veloxpro Software Limited. All rights reserved Page 45 of 89
4.2 Bookmap Columns
Application and Interpretation:
Bookmap displays configurable columns to right of the Bookmap chart. Each column can be configured
to display the following column types: Current Order Book, Volume, Trades Counter, Quotes Counter,
Quotes Delta and Custom Notes
Current Order Book Numerical (COB)
This column displays a graphical representation and numeric values of the pending orders of the
current book with bars (COBB). Users can interpret the size of pending orders by comparing the
relative size of the graphical bars.
Volume(CVP, SVP)
This column displays a colored volume profile. The colors represent the aggressor side (buyers or
seller). Users can interpret the aggressor trading side by looking at the colors of the volume bars.
Note the radio button choices available for volume: Session Accumulation (SVP), Chart Range
Accumulation (CVP). Session accumulation displays the volume from the beginning of the Bookmap
session. Chart range accumulation displays the volume of the only the visible data within the current
Bookmap window. If you zoom in or out, you will notice how the volume changes to the data within
the visible chart.
Trades Counter (CTC, STC)
This column displays the number of trades accumulated at each price level. The colors represent the
aggressor side (buyers or seller). Similar to volume, Trades Counter can be displayed by either
Session Accumulation or Chart range accumulation.
Quotes Counter (CQC, SCQ)
This column displays the number of quotes refreshed at each price level. The colors represent the
aggressor side (buyers or seller). Quotes Counter can be displayed by Session Accumulation (SQC) or
Chart range accumulation (CQC).
Quotes Delta(+/-)
This column displays the size of pending orders added or pulled from the active bid and ask range
(the range below and above that is transmitted by the exchange). Each price level shows the
number of contracts added or pulled from it since the last best bid or ask update. The best bid and
ask price levels are marked with a rectangular of a matching color.
Copyright © 2016 By Veloxpro Software Limited. All rights reserved Page 46 of 89
The delta number reset after each update of the best bid or ask. The top and bottom most numbers
on either side of the active range is the total sum of the delta since the last best bid or best ask
update.
Custom Notes(CN)
This column displays user notes for each price level.
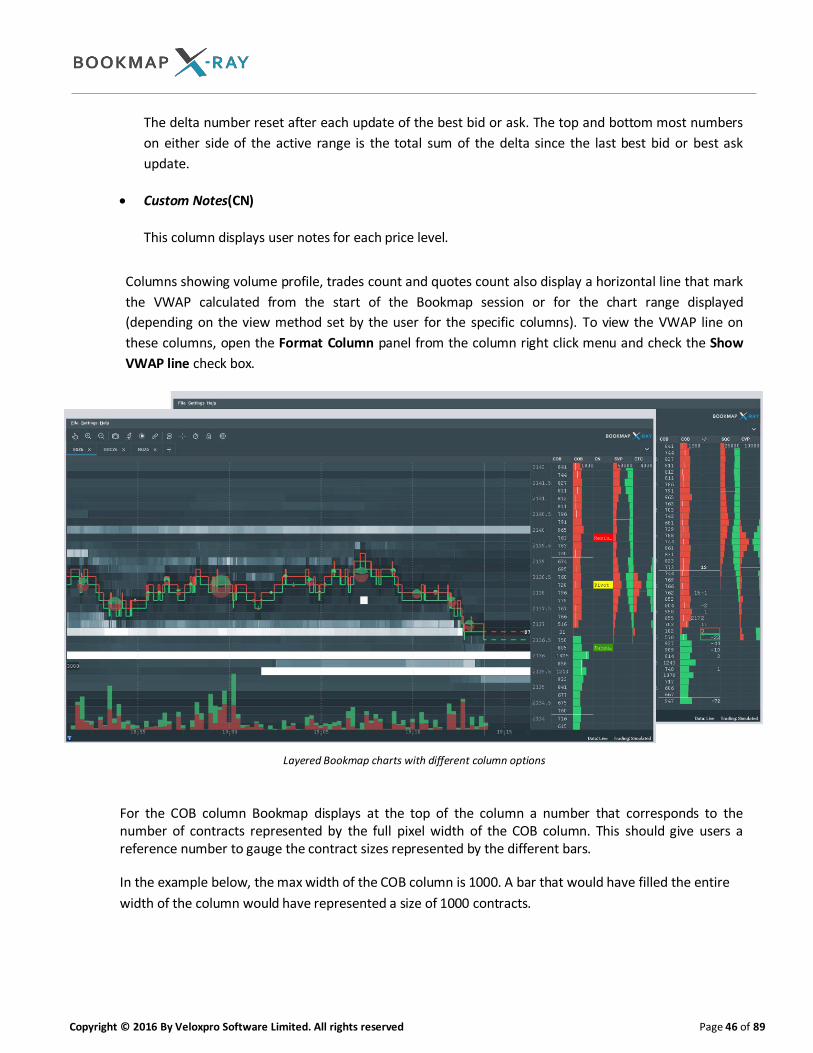
Columns showing volume profile, trades count and quotes count also display a horizontal line that mark
the VWAP calculated from the start of the Bookmap session or for the chart range displayed
(depending on the view method set by the user for the specific columns). To view the VWAP line on
these columns, open the Format Column panel from the column right click menu and check the Show
VWAP line check box.
Layered Bookmap charts with different column options
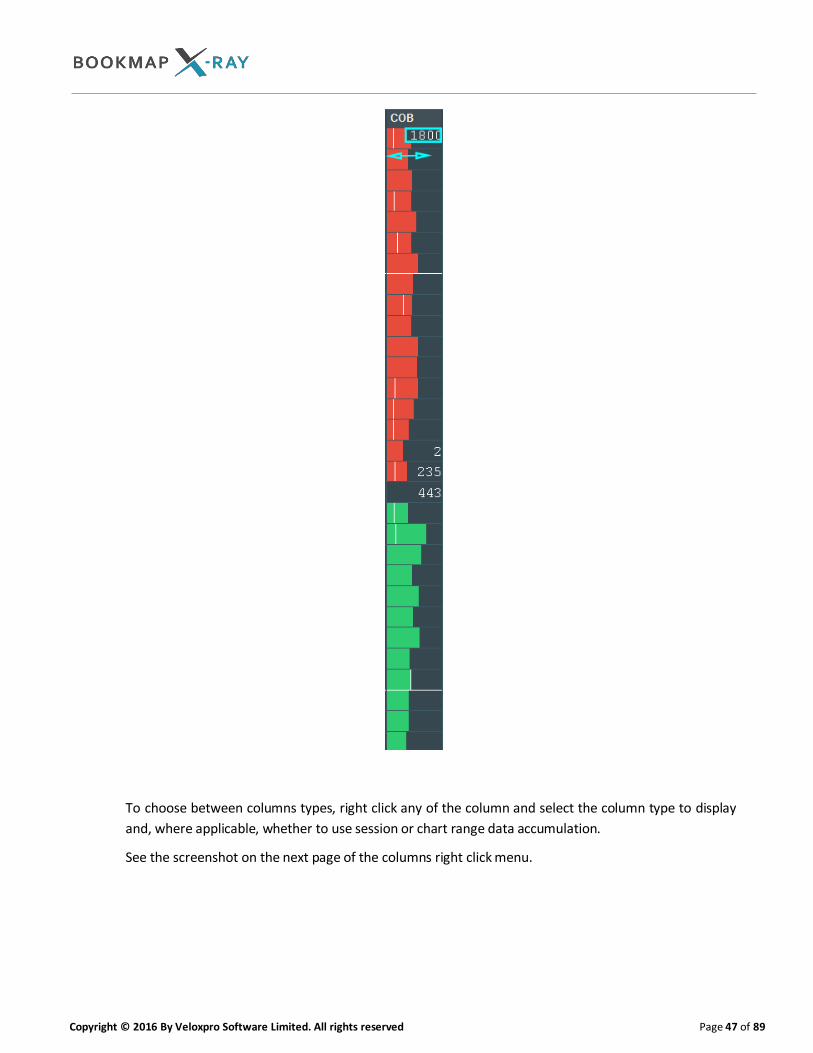
For the COB column Bookmap displays at the top of the column a number that corresponds to the number of contracts represented by the full pixel width of the COB column. This should give users a reference number to gauge the contract sizes represented by the different bars.
In the example below, the max width of the COB column is 1000. A bar that would have filled the entire
width of the column would have represented a size of 1000 contracts.
Copyright © 2016 By Veloxpro Software Limited. All rights reserved Page 47 of 89
To choose between columns types, right click any of the column and select the column type to display
and, where applicable, whether to use session or chart range data accumulation.
See the screenshot on the next page of the columns right click menu.
Copyright © 2016 By Veloxpro Software Limited. All rights reserved Page 48 of 89
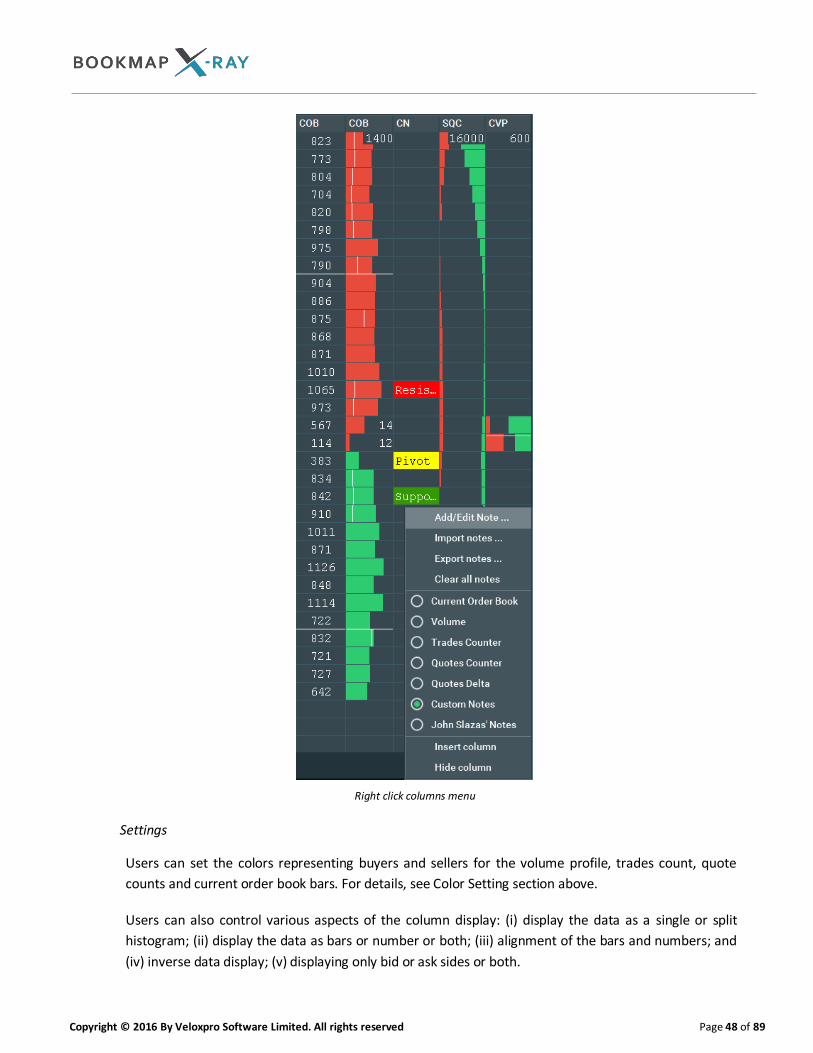
Right click columns menu
Settings
Users can set the colors representing buyers and sellers for the volume profile, trades count, quote
counts and current order book bars. For details, see Color Setting section above.
Users can also control various aspects of the column display: (i) display the data as a single or split
histogram; (ii) display the data as bars or number or both; (iii) alignment of the bars and numbers; and
(iv) inverse data display; (v) displaying only bid or ask sides or both.

Copyright © 2016 By Veloxpro Software Limited. All rights reserved Page 49 of 89
For the COB column only users can also select an aggregate display and extended displays:
Aggregate Display - Instead of presenting the size of each individual price level, each level
represents the cumulative size of its own size and the aggregate
size of preceding levels (i.e. level 3 represents the size of Level 1+2+3). When choosing aggregate view,
Iceberg and Large Lot indications will not be visible.
Extended display – user can choose to present only the active range or an extended range which will be
displayed based on the last updated size for out-of-active-range price levels.
To control all these display options, right click on the relevant column. At the top of the menu click
Format Column and set your display preferences from the format column dialogue box.
Format Column Dialogue Box
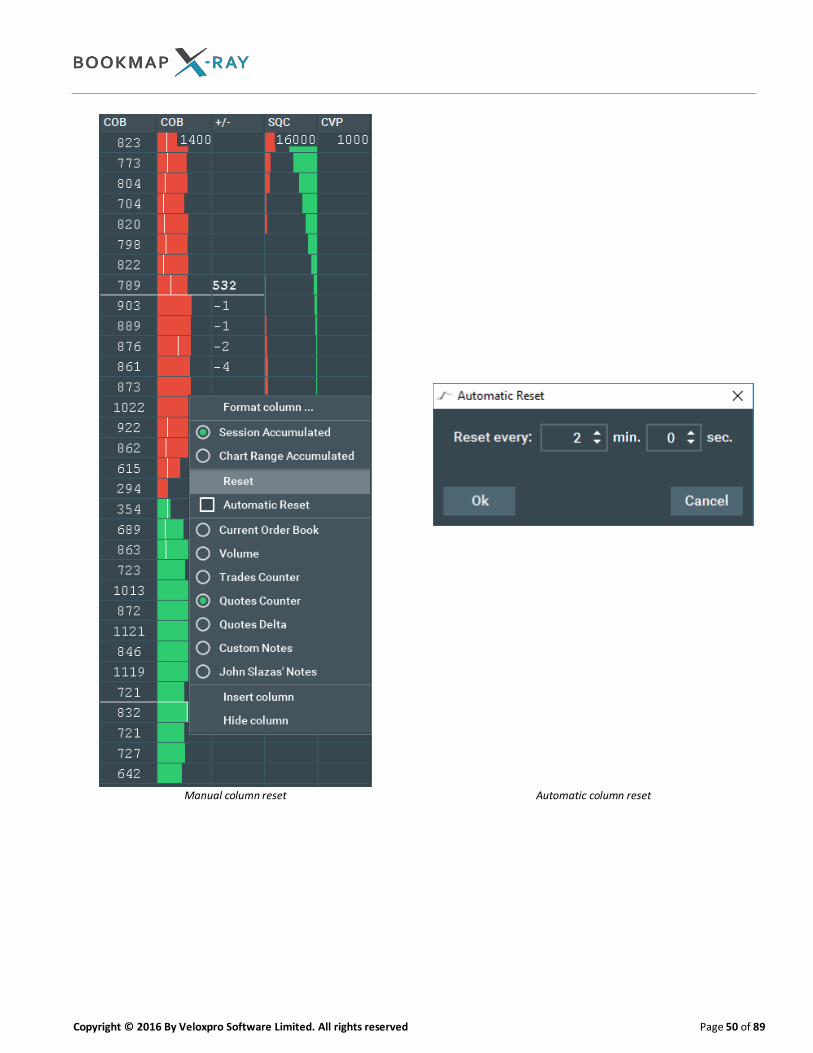
The data on the Volume, Quotes and Trades columns can be reset by the user, either manually or at
predefined frequencies. For manual reset, right click on the relevant column and click the Reset option
from the menu. For automatic reset, right click the relevant column and click the Automatic Reset
option on the menu and enter the reset frequency you want.
Copyright © 2016 By Veloxpro Software Limited. All rights reserved Page 50 of 89
Manual column reset Automatic column reset
Copyright © 2016 By Veloxpro Software Limited. All rights reserved Page 51 of 89
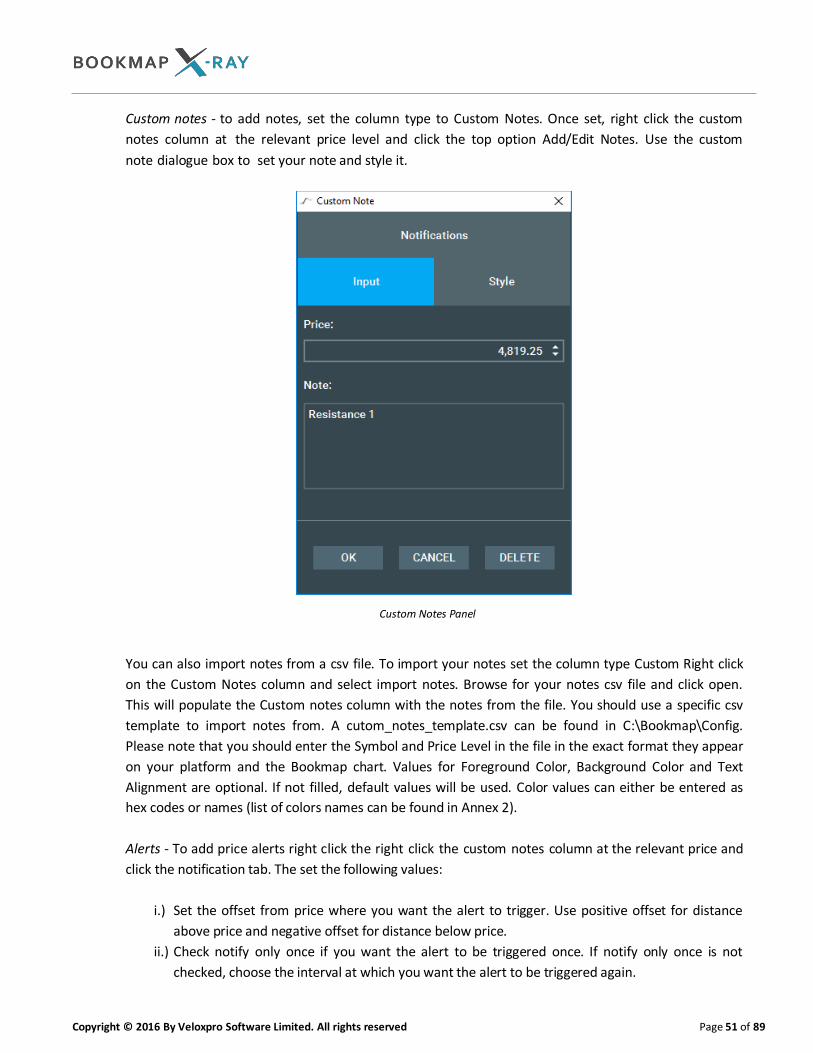
Custom notes - to add notes, set the column type to Custom Notes. Once set, right click the custom
notes column at the relevant price level and click the top option Add/Edit Notes. Use the custom
note dialogue box to set your note and style it.
Custom Notes Panel
You can also import notes from a csv file. To import your notes set the column type Custom Right click
on the Custom Notes column and select import notes. Browse for your notes csv file and click open.
This will populate the Custom notes column with the notes from the file. You should use a specific csv
template to import notes from. A cutom_notes_template.csv can be found in C:\Bookmap\Config.
Please note that you should enter the Symbol and Price Level in the file in the exact format they appear
on your platform and the Bookmap chart. Values for Foreground Color, Background Color and Text
Alignment are optional. If not filled, default values will be used. Color values can either be entered as
hex codes or names (list of colors names can be found in Annex 2).
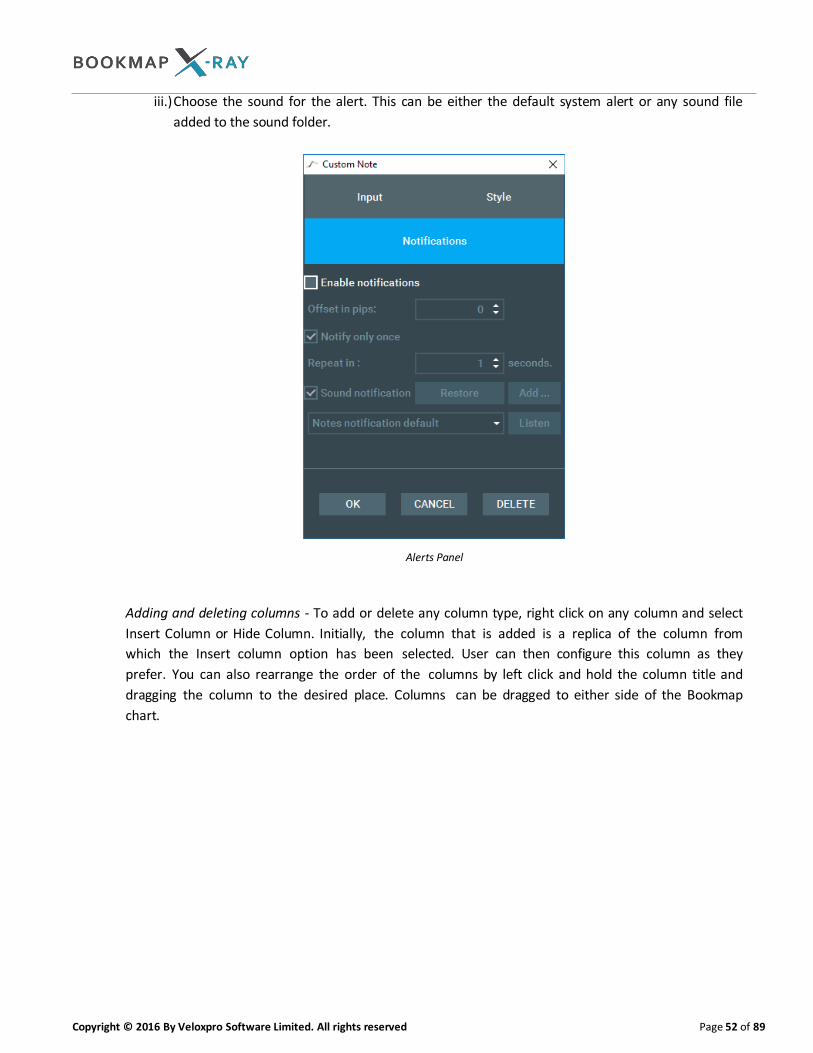
Alerts - To add price alerts right click the right click the custom notes column at the relevant price and
click the notification tab. The set the following values:
i.) Set the offset from price where you want the alert to trigger. Use positive offset for distance
above price and negative offset for distance below price.
ii.) Check notify only once if you want the alert to be triggered once. If notify only once is not
checked, choose the interval at which you want the alert to be triggered again.
Copyright © 2016 By Veloxpro Software Limited. All rights reserved Page 52 of 89
iii.) Choose the sound for the alert. This can be either the default system alert or any sound file
added to the sound folder.
Alerts Panel
Adding and deleting columns - To add or delete any column type, right click on any column and select
Insert Column or Hide Column. Initially, the column that is added is a replica of the column from
which the Insert column option has been selected. User can then configure this column as they
prefer. You can also rearrange the order of the columns by left click and hold the column title and
dragging the column to the desired place. Columns can be dragged to either side of the Bookmap
chart.
Copyright © 2016 By Veloxpro Software Limited. All rights reserved Page 53 of 89
4.3 Data Recording and Data Refresh
Data Recording
Bookmap provides the ability to record your live session's data into a file and replay it later for analysis and
training purposes using Bookmap replay mode.
With the exception of Bookmap for NinjaTrader, to record your session's data simply check the "Record Live
Data" checkbox on the Bookmap Run Options window. When you close Bookmap the data file will be closed
as well and will be ready for replay. Data files are located by default in C:\Bookmap\Feeds. See section 5 -
Replay data / Simulated trading mode5 - for further instructions on how to use Bookmap replay to view
data files.
NinjaTrader users using Bookmap as an indicator, who want to record data files, need to select "Record Data
Feed" item from the Settings on the Bookmap control window. The recording setting will take effect the next
time Bookmap is open2.
Order Recording
Users who have the one click trading addon can record their own orders and later view their trading activity
on the chart in replay mode. To record your orders make sure first to record the session by checking the
“Record Live Data” check box on the run options window. After you launch Bookmap make sure that
the “Record orders” Settings menu item is selected.
After you finish recording close Bookmap and reopen it in replay mode. Select the relevant data file you
want to replay, and make sure the “Replay recorded orders” Settings menu item is selected.
Data Refresh
The data refresh feature allows users to define when to reset the inflow of data and start the accumulation of data anew. This can be done manually or at a preset time. If the user is recording the data, each refresh will close a data file and will start recording the new data in a separate file.
To activate the refresh feature go to File>>Restart Bookmap and click either Now for an immediate manual
refresh or Schedule for an auto scheduled refresh.
2 Refreshing the NinjaTrader chat carrying the Bookmap indicator, will restart Bookmap without the need to close and
reopen Bookmap.
Copyright © 2016 By Veloxpro Software Limited. All rights reserved Page 54 of 89
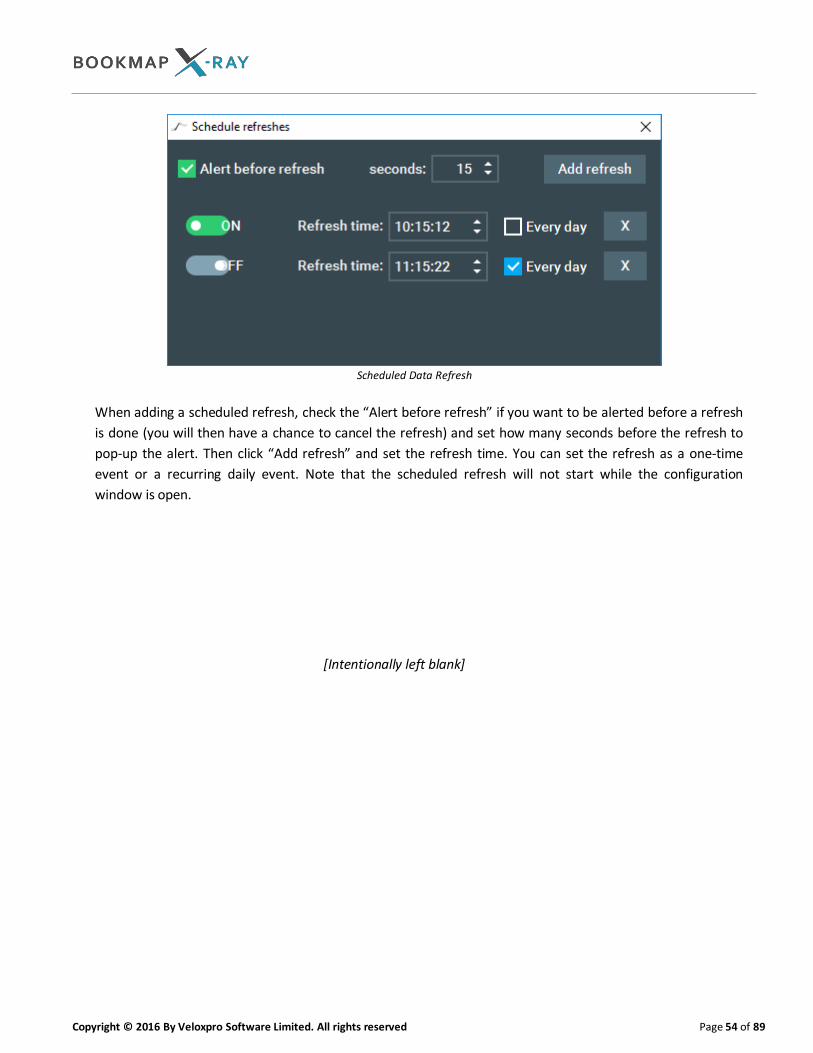
Scheduled Data Refresh
When adding a scheduled refresh, check the “Alert before refresh” if you want to be alerted before a refresh
is done (you will then have a chance to cancel the refresh) and set how many seconds before the refresh to
pop-up the alert. Then click “Add refresh” and set the refresh time. You can set the refresh as a one-time
event or a recurring daily event. Note that the scheduled refresh will not start while the configuration
window is open.
[Intentionally left blank]

Copyright © 2016 By Veloxpro Software Limited. All rights reserved Page 55 of 89
5. Replay data / Simulated trading mode
Bookmap offers the ability to replay and trade pre-recorded market data. This is a great training tool. All
settings and features are fully functional within Replay mode.
Running Bookmap in replay mode:
a.) Open Bookmap. This will open the Bookmap run options window:
Bookmap Run Options window
Choose Replay data / Simulated trading and click ok. This will open Bookmap Main Window.
Copyright © 2016 By Veloxpro Software Limited. All rights reserved Page 56 of 89
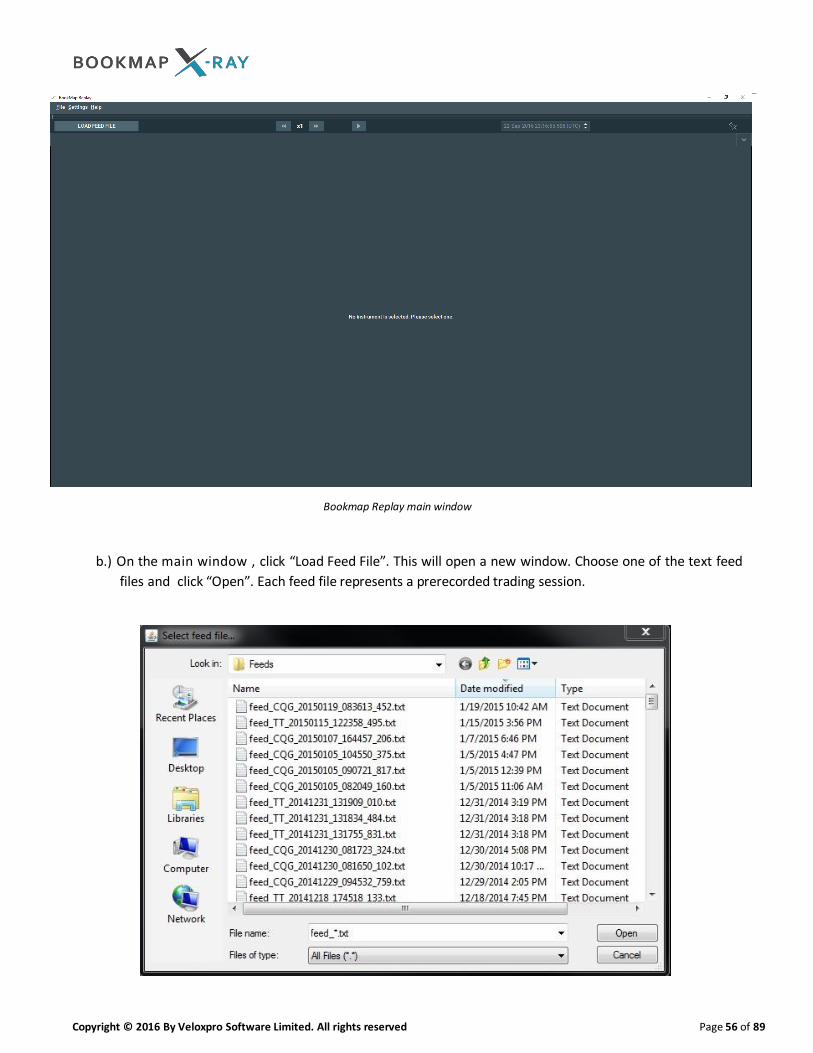
Bookmap Replay main window
b.) On the main window , click “Load Feed File”. This will open a new window. Choose one of the text feed
files and click “Open”. Each feed file represents a prerecorded trading session.
Copyright © 2016 By Veloxpro Software Limited. All rights reserved Page 57 of 89
User’s feed files directory
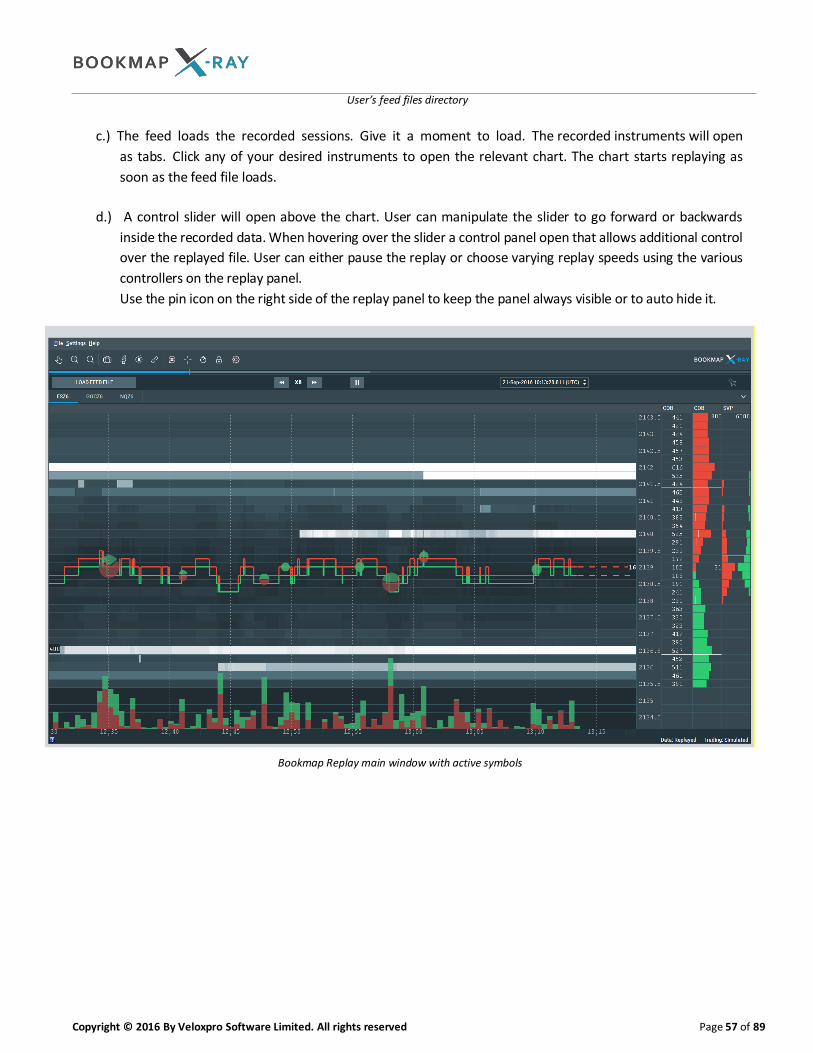
c.) The feed loads the recorded sessions. Give it a moment to load. The recorded instruments will open
as tabs. Click any of your desired instruments to open the relevant chart. The chart starts replaying as
soon as the feed file loads.
d.) A control slider will open above the chart. User can manipulate the slider to go forward or backwards
inside the recorded data. When hovering over the slider a control panel open that allows additional control
over the replayed file. User can either pause the replay or choose varying replay speeds using the various
controllers on the replay panel.
Use the pin icon on the right side of the replay panel to keep the panel always visible or to auto hide it.
Bookmap Replay main window with active symbols
Copyright © 2016 By Veloxpro Software Limited. All rights reserved Page 58 of 89
6. Bookmap Add-ons
6.1 Bookmap one-click execution add-on
This Bookmap addon enables placing limit and stop orders with one click action directly from the Bookmap
chart. This offers a tremendous advantage for pinpointing trade location and expediting trade execution.
Cyan dots mark the entry of buy orders. The cyan line extends from the entry time until the order is either
filled or cancelled. A filled buy order is marked by cyan triangle.
Magenta dots mark the entry of sell orders. The magenta line extends from the entry time until the order is
either filled or cancelled. A filed buy order is marked by magenta triangle.
It is possible to define what type of order information will be displayed on the chart. By default, pending
orders, cancelled orders, and executions are all presented on the chart. To change the default settings click
the icon for trading configurations and uncheck the relevant information on the Order Display section.
See the figure in the next page for details of the various orders markings on the chart:
[Intentionally left blank]

Copyright © 2016 By Veloxpro Software Limited. All rights reserved Page 59 of 89
Legend
1. Pending(sell) order
2. Pending (sell) stop order
3. Pending (buy) stoporder
4. Cancelled (sell) order
5. Executed(buy) order
6. Number of contracts & (Number of orders)
Copyright © 2016 By Veloxpro Software Limited. All rights reserved Page 60 of 89
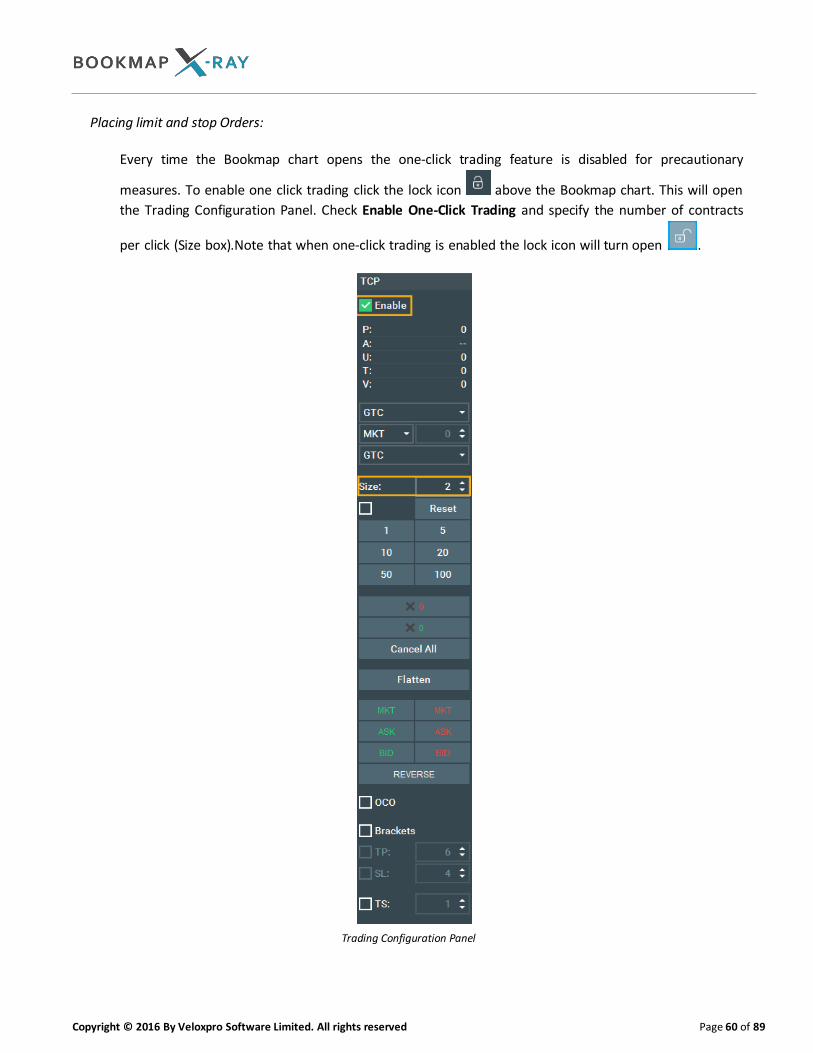
Placing limit and stop Orders:
Every time the Bookmap chart opens the one-click trading feature is disabled for precautionary
measures. To enable one click trading click the lock icon above the Bookmap chart. This will open
the Trading Configuration Panel. Check Enable One-Click Trading and specify the number of contracts
per click (Size box).Note that when one-click trading is enabled the lock icon will turn open .
Trading Configuration Panel
Copyright © 2016 By Veloxpro Software Limited. All rights reserved Page 61 of 89
To follow up on your orders, position and P&L status you can either use the Trading Configuration Panel
or the Trade Status Panel. To open or close the Trading Configuration Panel, use the lock icon above the
chart. To close or open the Trade Status Panel click the gear icon above the chart and check
/ uncheck the "Show Trade Status Panel" checkbox.
The Bookmap chart is divided into 2 areas separated by the current time line. Orders can be placed with
one click action only from the area right vertical time line. To place an order, follow the instructions
below:
a) To place a Buy Limit order, click the left mouse button at or below the current bid at the desired
price level. Note that clicking the left mouse button at or above the current ask will result in a buy
at current market price.
b) To place a Sell Limit order, click the right mouse button at or above the current ask at the desired
price level. Note that clicking the right mouse button at or below the current bid will result in a sell
at market price.
c) To place a Buy Stop order, press SHIFT + left mouse button at or above the current ask at the
desired stop price level. To place a Sell Stop order, press SHIFT+ right mouse button at or below the
current bid at the desired stop price level. Note that stop orders can be either stop market of stop
limit orders, as explained below.
d) A single mouse click places an order for the number of contracts specified by the trader in the trade
configuration settings window. Each additional mouse click will add another order for a similar
number of contracts.
Quick order entry Use the quick order entry to place market buy or sell orders or place buy or sell limit at the bid or ask.

Copyright © 2016 By Veloxpro Software Limited. All rights reserved Page 62 of 89
Quick Order Entry
Copyright © 2016 By Veloxpro Software Limited. All rights reserved Page 63 of 89
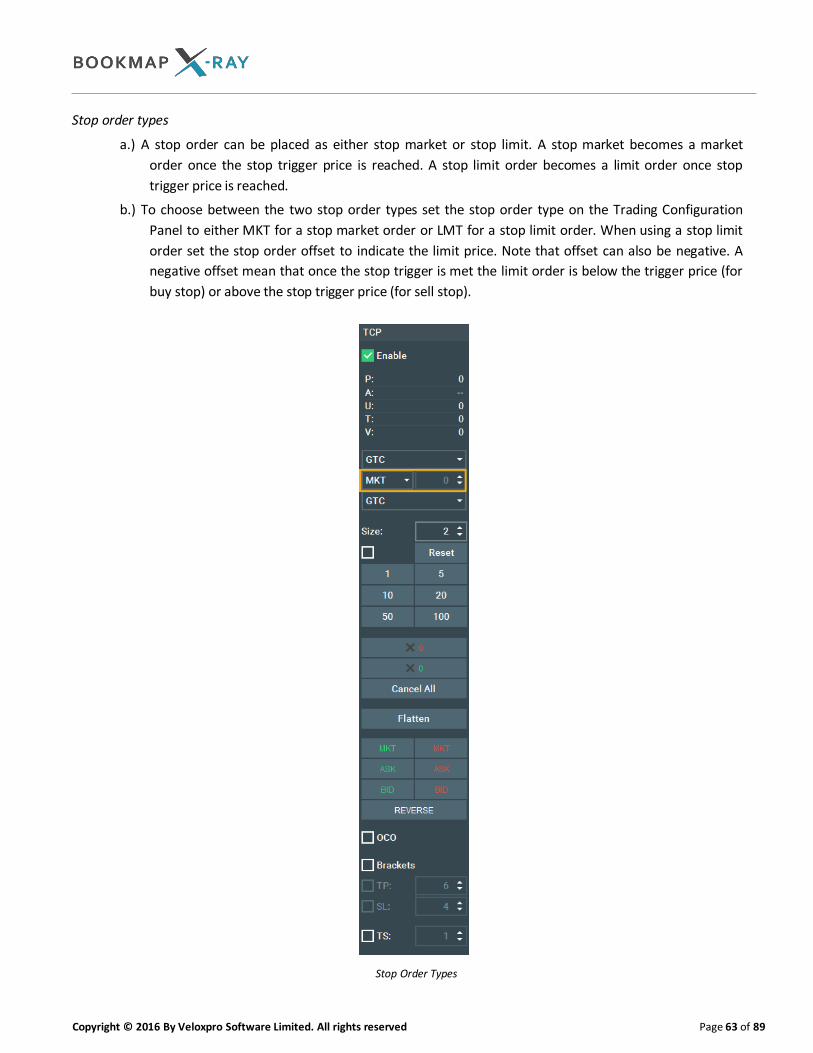
Stop order types
a.) A stop order can be placed as either stop market or stop limit. A stop market becomes a market
order once the stop trigger price is reached. A stop limit order becomes a limit order once stop
trigger price is reached.
b.) To choose between the two stop order types set the stop order type on the Trading Configuration
Panel to either MKT for a stop market order or LMT for a stop limit order. When using a stop limit
order set the stop order offset to indicate the limit price. Note that offset can also be negative. A
negative offset mean that once the stop trigger is met the limit order is below the trigger price (for
buy stop) or above the stop trigger price (for sell stop).
Stop Order Types
Copyright © 2016 By Veloxpro Software Limited. All rights reserved Page 64 of 89
Send order confirmation By default a pop confirmation window will appear after sending orders. The order needs to be confirmed before it is actually sent for execution via the connected trading platform or API. To disable the order confirmation pop up click Settings >> Orders Conformation and uncheck any order type for which you do not want to get a pop up order confirmation window. Order duration
a.) There are 4 different order duration that can be set in Bookmap through the Trading Configuration
Panel:
Day – order expires at the end of the regular session
GTC – order stays in effect until cancelled
FOK – fill or kill
IOC – immediate and cancel
b.) NOTE that order duration setup will be kept for all orders until changed or until the one-click
trading is disabled in which case the duration setup will revert to default.
c.) NOTE that stop order duration is set separately from limit order duration to allow greater flexibility.
The stop order setup will be kept for all stop orders until changed or until the one-click trading is
disabled in which case the stop order setup will revert to default.
Cancelling pending Orders and exiting all positions
Pending orders can be cancelled and open position closed either by one-click interaction on the
Bookmap chart or from the Trading Configuration Panel
Cancelling orders and closing an open position from the chart:
a.) To cancel pending orders, place the mouse pointer over the relevant price level and click the
middle mouse button. When multiple orders are placed on the same price, Bookmap will cancel
the last order placed.
b.) To delete all of the pending orders at a certain price level place the mouse pointer over the
relevant price level and press CTRL + middle mouse button.
c.) To cancel all pending orders click the Cancel All button on the Trading Configuration Panel. To cancel just buy or sell orders click the buy or sell X buttons on the Trading Configuration Panel..
d.) To exit all open positions, click the Flatten button on the Trading Configuration Panel. This will also
cancel all pending orders.

Copyright © 2016 By Veloxpro Software Limited. All rights reserved Page 65 of 89
Cancelling Orders & Closing Position
Copyright © 2016 By Veloxpro Software Limited. All rights reserved Page 66 of 89
Bracket Orders
To send bracket orders users need to check the Brackets checkbox on the Trading Configuration Panel and
check the type of orders to send as brackets and their distance in ticks from the executed price of the leading
order. Bracket orders can be either or both of take profit limit order and stop order. Note that bracket orders
will be sent for every filled order that was placed when the Bracket checkbox was already checked.
The duration and type of the stop limit bracket order will be as was set for any stop order when the leading
order was sent to the market. The duration of the take profit limit order will be the same as was set for any
limit order when the leading order was sent to the market.
Once triggered the bracket orders will function as OCO orders. The price of each OCO leg can be changed
individually1. When one leg is cancelled the other leg will be cancelled as well. Size modification of a single
leg may or may not result in a similar change of the other OCO leg, depending on the platform to which
Bookmap is connected. See Annex III for details. Note that size can only be modified downwards, i.e. can only
reduce the size of the order but not increase it.
For some of the platforms and APIs supported by Bookmap, the bracket orders are server side, i.e. the
instruction to send a bracket order following the execution of the leading order is not stored internally in
Bookmap but on the broker / execution platform side. At the same time, some other platforms and APIs do
not support server side bracketing, in which case the bracket orders will be client side, i.e. kept in Bookmap
until sent to the market. Whether bracket orders are server or client side has implications on the submission
of orders when Bookmap becomes unavailable due to loss of connection, involuntary or voluntary shutdown,
system crush or any other reason. When bracket orders are kept on the client side, they will be lost when
Bookmap becomes unavailable and will not be sent to the market when the triggering condition has been
met. Traders’ caution and discretion is advised when using client side bracket orders. See Annex III for details
on which platform / API supports server side brackets. When working with other platforms / APIs the
brackets will be client side.
OCO Orders
When OCO check box is checked, traders can enter two linked orders that will cancel each other when filled.
Once the trader designate the first OCO leg price the trader will be guided to designate the second OCO leg
price. Only when both OCO leg has been designated both OCO orders will be sent.
The price of each OCO leg can be changed individually4. When one leg is cancelled the other leg will be
cancelled as well. Size modification of a single leg may or may not result in a similar change of the other OCO
leg, depending on the platform to which Bookmap is connected. See Annex III for details. Note that size can
only be modified downwards, i.e. can only reduce the size of the order but not increase it.
1 Changing the price of a stop order to invalid price, i.e. a price that does not fit its attribute as a stop order, is not allowed
4 Changing the price of a stop order to invalid price, i.e. a price that does not fit its attribute as a stop order, is not allowed
Copyright © 2016 By Veloxpro Software Limited. All rights reserved Page 67 of 89
For some of the platforms and APIs supported by Bookmap, the OCO conditions is server side, i.e. the
condition to cancel one order when the other gets filled is not stored internally in Bookmap but on the
broker / execution platform side. At the same time, some other platforms and APIs do not support server
side OCO, in which case the OCO condition will be client side, i.e. kept in Bookmap. Whether OCO is server or
client side has implications on whether the cancelling of the relevant OCO leg will be done when Bookmap
becomes unavailable due to loss of connection, involuntary or voluntary shutdown, system crush or any
other reason. When OCO is kept on the client side, it will be lost when Bookmap becomes unavailable and an
order that should have otherwise been cancelled when the other OCO leg gets filled, will be kept in the
market. Traders' caution and discretion is advised when using client side OCO. See Annex III for details on
which platform / API supports server OCO. When working with other platforms / APIs the OCO will be client
side.
Trailing Stop
For trailing stops users need to check the TS checkbox on the Trading Configuration Panel. A trailing stop will
be executed for every stop order that was placed when the TS checkbox was already checked. The trailing
parameter controls the steps at which the stop order is updated and is measured in tick distance. Note that
stop orders placed to open a position will not be affected by trailing stop.
For some of the platforms and APIs supported by Bookmap, the trailing stop is server side, i.e. the trailing
stop instructions are not stored internally in Bookmap but on the broker / execution platform side. At the
same time, some other platforms and APIs do not support server side trailing stop, in which case the bracket
orders will be client side, i.e. kept in Bookmap. Whether trailing stop is server or client side has implications
on the trailing stop availability when Bookmap becomes unavailable due to loss of connection, involuntary or
voluntary shutdown, system crush or any other reason. When trailing stop is kept on the client side, it will be
lost when Bookmap becomes unavailable. Traders' caution and discretion is advised when using client side
trailing. See Annex III for details on which platform / API supports server side trailing stop. When working
with other platforms / APIs the trailing stop will be client side.

Copyright © 2016 By Veloxpro Software Limited. All rights reserved Page 68 of 89
Brackets, OCO and Trailing Stop
Copyright © 2016 By Veloxpro Software Limited. All rights reserved Page 69 of 89
Order modifications
Price Modifications
a.) To modify the price of an existing order hover with the mouse cursor over the order line mark at
the area left of the vertical time line. When over the order left click and drag the order marking to
the new price, then release the left click to change the order price. NOTE: order modification is
done from the area left of the vertical timeline. Performing this action from the area right of the
time line will result in a new buy limit order, which may be executed immediately.
b.) If there are multiple orders at a single price level, the order modification will apply to the newest
order at that level. To move all order resting at the same price level, hold CTRL + middle mouse
click and drag the orders to the new price.
Quantity Modifications
a.) To change the quantity of a pending order hover with the mouse cursor over the order line mark at
the area left of the vertical time line. When over the order line mark left click and release. This will
open an order size ladder. Click the new order size you want to change the order.
b.) If there are multiple pending orders at a single price level, modification will first apply to the newest
order.
c.) To change the order size of new orders either use the size box on the Trading Configuration Panel or
use the number buttons below it for a quickly adding or reducing size. When adding size simply click
the relevant size buttons; when reducing size, SHIFT+click the relevant size buttons. User can set any
preferred number on the size buttons. Simply right click any of the size button and then click
“customize sizes”. Enter any size of preference and close the customize sizes window.

Copyright © 2016 By Veloxpro Software Limited. All rights reserved Page 70 of 89
Orders Price and Size modifications
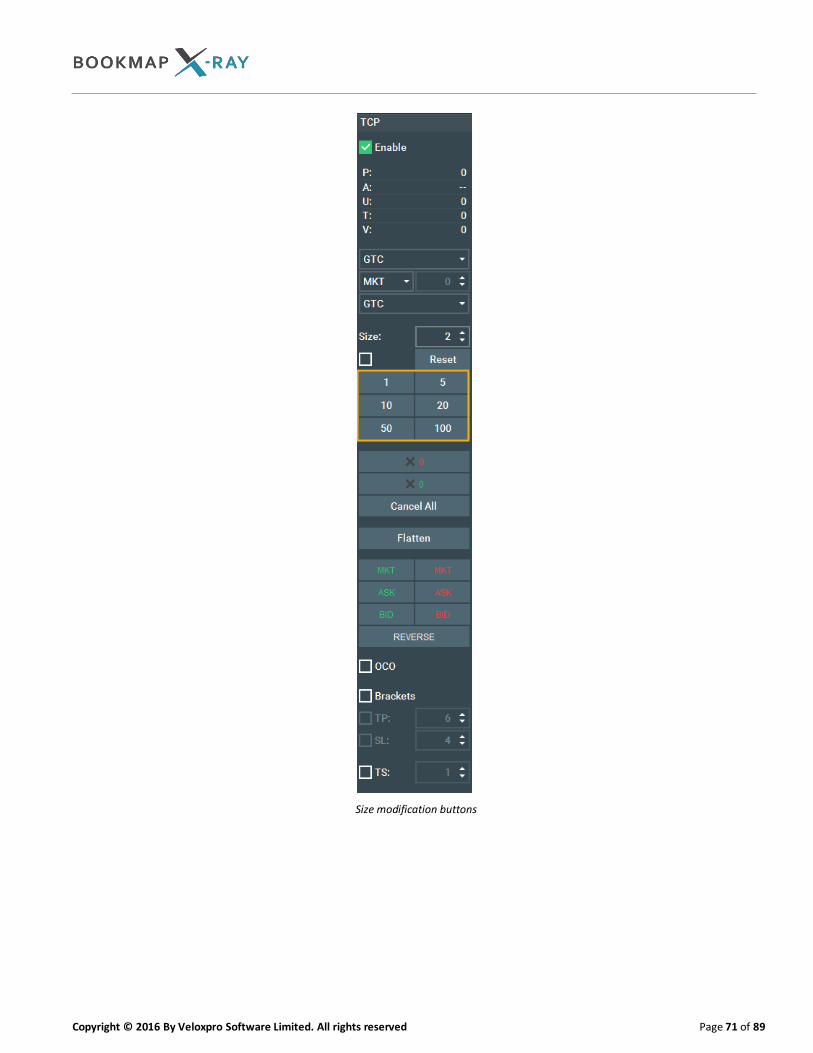
Copyright © 2016 By Veloxpro Software Limited. All rights reserved Page 71 of 89
Size modification buttons
Copyright © 2016 By Veloxpro Software Limited. All rights reserved Page 72 of 89
Cross Instrument Trading
Bookmap enables traders to trade a mini or micro instrument (e.g. mini DAX futures) from the chart of the
major instrument (e.g. DAX futures). The eligible pairs are not configured by the trader but are predefined.
In case of an eligible instrument pair, the symbol box on the Trading Configuration Panel of the major
instrument will include both the major and the mini or micro instrument. To trade the mini or micro
instrument off of the major instrument chart, the user must first subscribe to the mini (or micro)
instrument through the Bookmap control window. Once subscribed, both instruments will appear active in
the symbol box on the Trading Configuration Panel.
Once the major and mini (or micro) instruments are active, the trader needs to click the Start button in
order to trade the mini or micro instrument from the major instrument’s chart. The symbol presented in
the symbol box will be the tradable one.
Since the tick sizes of the major instrument and the mini (or micro) instrument may be different, the price
clicked on the major instrument’s chart is rounded to the next compatible value of the traded mini (or
micro) instrument. Using the Round box on the Trading Configuration Panel, traders can define whether to
round the price into the market (TO) or away from the market (OFF).
To view the available pairs for cross instrument trading click File >> List of cross instrument trading pairs

Copyright © 2016 By Veloxpro Software Limited. All rights reserved Page 73 of 89
Cross Instrument Trading Settings
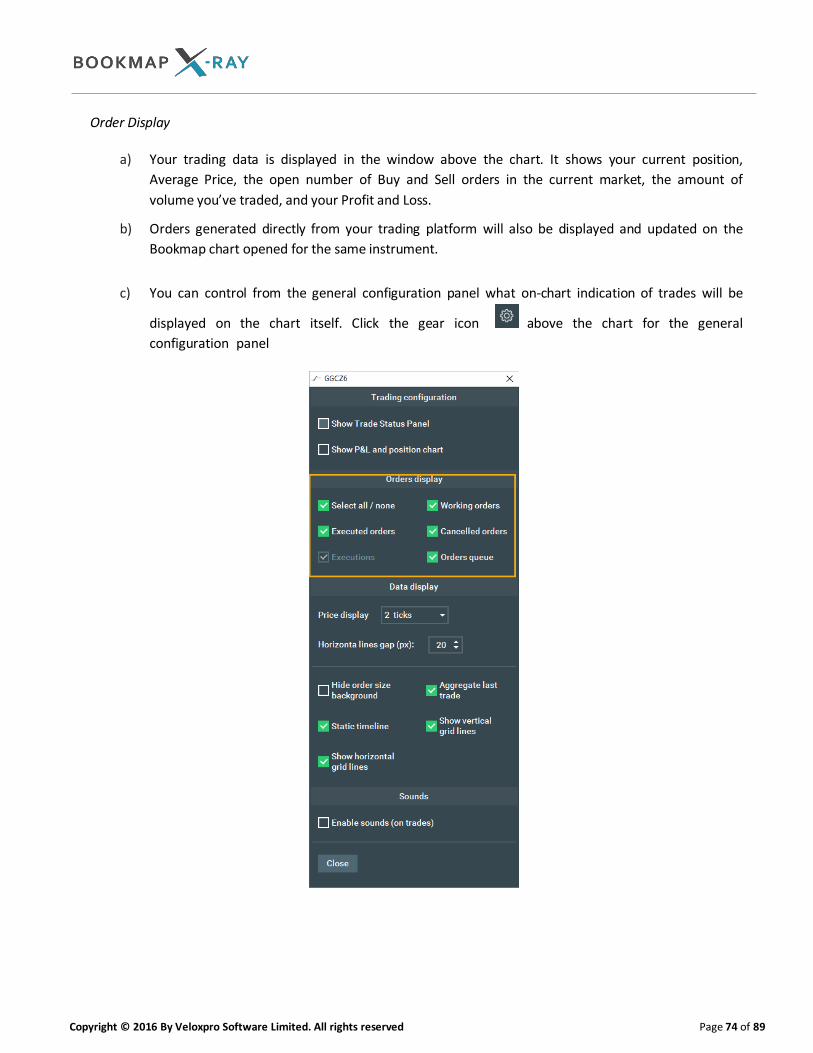
Copyright © 2016 By Veloxpro Software Limited. All rights reserved Page 74 of 89
Order Display
a) Your trading data is displayed in the window above the chart. It shows your current position,
Average Price, the open number of Buy and Sell orders in the current market, the amount of
volume you’ve traded, and your Profit and Loss.
b) Orders generated directly from your trading platform will also be displayed and updated on the
Bookmap chart opened for the same instrument.
c) You can control from the general configuration panel what on-chart indication of trades will be
displayed on the chart itself. Click the gear icon above the chart for the general
configuration panel

Copyright © 2016 By Veloxpro Software Limited. All rights reserved Page 75 of 89
Approximation of Order Queue:
When the one click trading add-on Bookmap is enabled Bookmap can display an approximation of the
position of the trader’s orders in the queue. Bookmap approximates the position in the queue according
to a FIFO matching algorithm using a more pessimistic scenario relating to cancelled orders. The ability
to display a more accurate position in the queue ultimately depends on the quality of data provided
through the trader’s trading platform.
Bookmap presents queue approximation with white vertical lines on top of the current order book
histogram. The place in the queue is illustrated by the position of the line over the bar representing the
current size of pending order at any given price level.
In order to activate the presentation of the queue approximation, click the configuration icon
above the chart and check Orders Queue.

Copyright © 2016 By Veloxpro Software Limited. All rights reserved Page 76 of 89
Trading Configuration Panel
The Trading Configuration Panel controls various settings related to trading with the Bookmap platform.
Most of these settings are detailed throughout the one-click trading addon section. The 2 figures below
details the various setting and control option on the Trading Configuration Panel. The items displayed on
the Trading Configuration Panel are customizable – by right clicking each component on the Trading
Configuration Panel, users can control which component (or component elements) to show or hide and
can rearrange the order of components by dragging and dropping them on the Trading Configuration
Panel.
1 Enable checkbox. Need to be checked to enable trading functionalities.
2 Trading information. P Current position; A Average price of the open position
(based on FIFO model); U Unrealized P&L; T Total P&L (i.e. realized + unrealized P&L);
V Total volume traded by the user
3 Size. Set the order size per click.
4 Reset. Click the reset button to set the order size to 0. If the checkbox is
checked the size will be reset to 0 automatically after an order is sent.
5 Set order duration for all orders except stop orders
6 Stop order type. Can be a stop market or stop limit, with or without an offset.
7 Set order duration for stop orders
8 Quick order size modifications. Clicking any of the numerical values will add the
relevant size to the currently set order size. Clicking SHIFT+ any numerical value will
subtract the relevant size from the currently set order size.
9 Cancel all sell orders.
10 Cancel all buy orders.
11 Cancel all orders
12 Cancel all orders and close open position (market exit).
13 Automatic bracketing. When checked, a limit order (take profit) and a stop
order (stop loss) will be automatically sent when a new order to open a position is
filled (assuming the order for opening the position has been sent after the
checkbox has been checked).
14 TP. Set the number of ticks for auto bracketing take profit.
15 SL. Set the number of ticks for auto bracketing stop loss.
16 TS. Set trailing stop in tick increments.
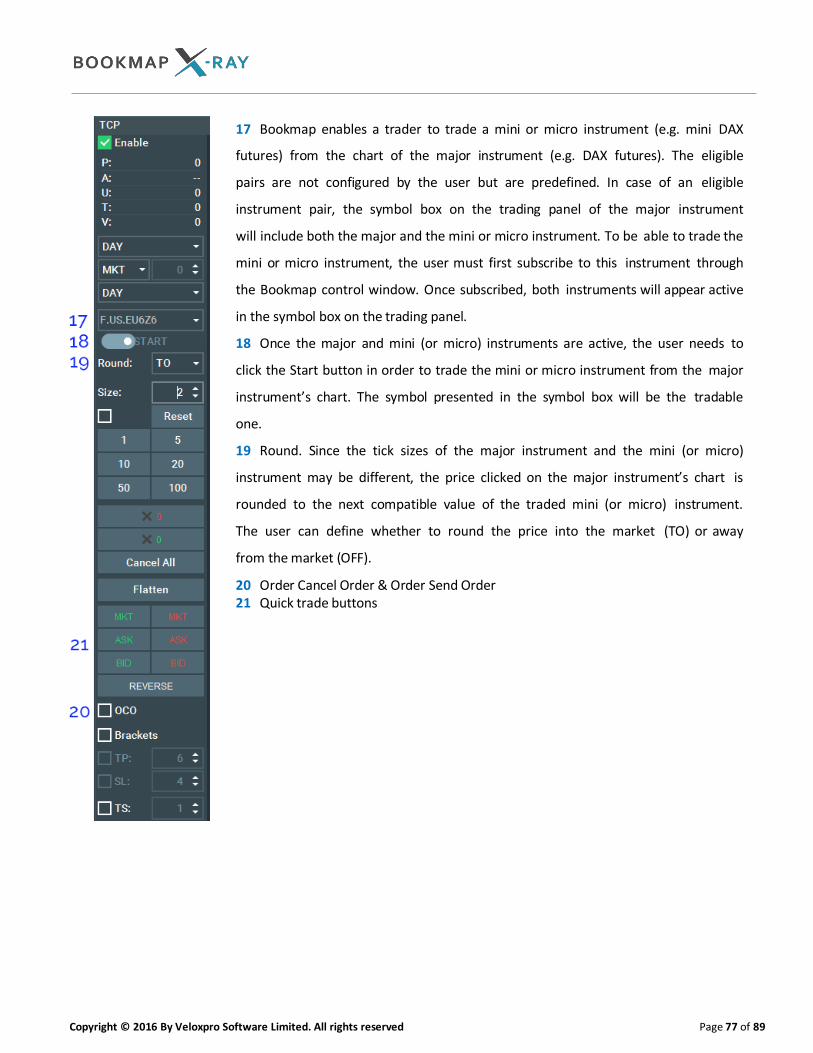
Copyright © 2016 By Veloxpro Software Limited. All rights reserved Page 77 of 89
17 Bookmap enables a trader to trade a mini or micro instrument (e.g. mini DAX
futures) from the chart of the major instrument (e.g. DAX futures). The eligible
pairs are not configured by the user but are predefined. In case of an eligible
instrument pair, the symbol box on the trading panel of the major instrument
will include both the major and the mini or micro instrument. To be able to trade the
mini or micro instrument, the user must first subscribe to this instrument through
the Bookmap control window. Once subscribed, both instruments will appear active
in the symbol box on the trading panel.
18 Once the major and mini (or micro) instruments are active, the user needs to
click the Start button in order to trade the mini or micro instrument from the major
instrument’s chart. The symbol presented in the symbol box will be the tradable
one.
19 Round. Since the tick sizes of the major instrument and the mini (or micro)
instrument may be different, the price clicked on the major instrument’s chart is
rounded to the next compatible value of the traded mini (or micro) instrument.
The user can define whether to round the price into the market (TO) or away
from the market (OFF).
20 Order Cancel Order & Order Send Order 21 Quick trade buttons

Copyright © 2016 By Veloxpro Software Limited. All rights reserved Page 78 of 89
IV. Orders Recording
a.) With the one-click trading addon you can also record your own orders and later view the in replay
mode. To record your order make sure first to record the session by checking the “record live data”
check box on the run options window. After you launch Bookmap make sure that the “Record
orders” Settings menu item is selected (it is by default).
b.) After you finish recording close Bookmap and reopen in replay mode. Select the relevant data file
you want to replay, and make sure the “Replay recorded orders” Settings menu item is selected (it is
by default).
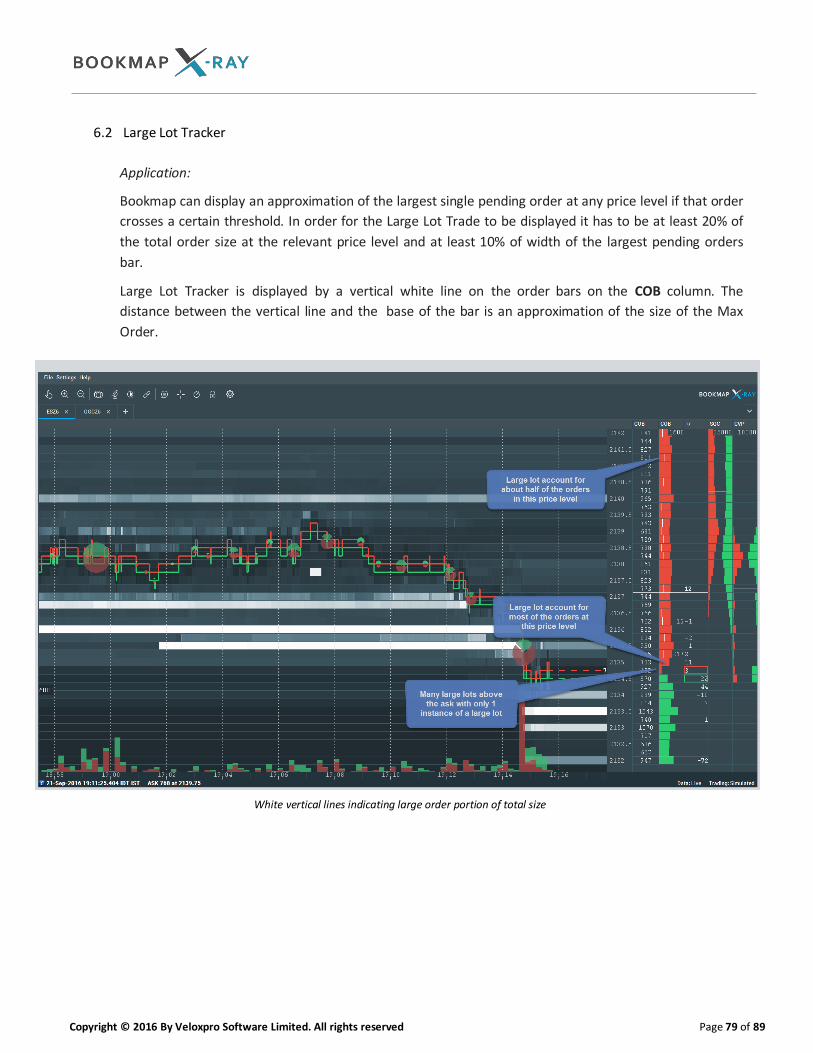
Copyright © 2016 By Veloxpro Software Limited. All rights reserved Page 79 of 89
6.2 Large Lot Tracker
Application:
Bookmap can display an approximation of the largest single pending order at any price level if that order
crosses a certain threshold. In order for the Large Lot Trade to be displayed it has to be at least 20% of
the total order size at the relevant price level and at least 10% of width of the largest pending orders
bar.
Large Lot Tracker is displayed by a vertical white line on the order bars on the COB column. The
distance between the vertical line and the base of the bar is an approximation of the size of the Max
Order.
White vertical lines indicating large order portion of total size

Copyright © 2016 By Veloxpro Software Limited. All rights reserved Page 80 of 89
Interpretation:
This feature can be utilized to identify the presence of a dominant market participant(s) at a certain
price level.
Settings:
Once enabled the Large Lot Tracker add-on is activated by clicking the studies panel icon above
the chart and checking the “Largest Lot Tracker” checkbox. User can set the thresholds a single order
must pass in order to be displayed as a large lot. There are two thresholds to pass: the size of the
order relative to the total size at the relevant price level (Minimum percentage at price level) and the
size of the order relative to largest total size at any of the visible order book levels (Minimum
percentage in Order Book)
Enabling large lot display
Limitations:
The Large Lot Tracker is not based on an exchange transmitted data but rather on an internal algorithm
that approximates the largest single order at any price level. Therefore, it is not guaranteed 100%
accuracy. It requires the COBB (current order book bars) to be defined as one of the user’s column
selections.
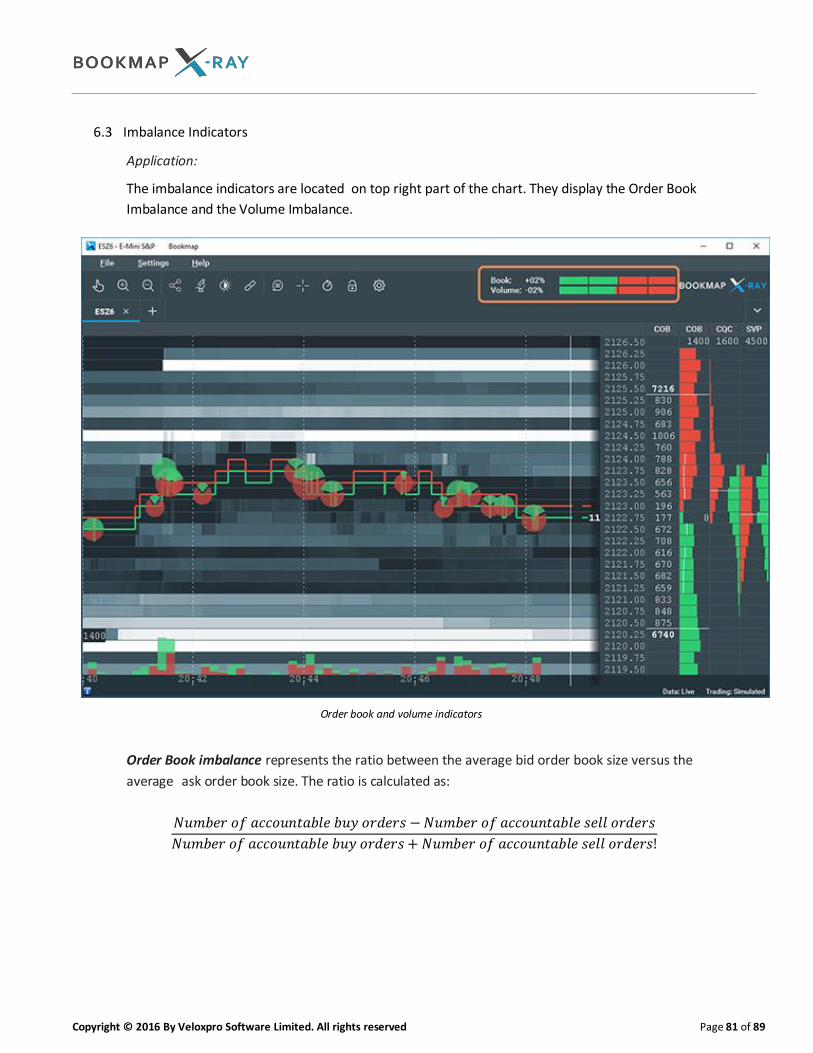
Copyright © 2016 By Veloxpro Software Limited. All rights reserved Page 81 of 89
6.3 Imbalance Indicators
Application:
The imbalance indicators are located on top right part of the chart. They display the Order Book
Imbalance and the Volume Imbalance.
Order book and volume indicators
Order Book imbalance represents the ratio between the average bid order book size versus the
average ask order book size. The ratio is calculated as:
𝑁𝑢𝑚𝑏𝑒𝑟 𝑜𝑓 𝑎𝑐𝑐𝑜𝑢𝑛𝑡𝑎𝑏𝑙𝑒 𝑏𝑢𝑦 𝑜𝑟𝑑𝑒𝑟𝑠 − 𝑁𝑢𝑚𝑏𝑒𝑟 𝑜𝑓 𝑎𝑐𝑐𝑜𝑢𝑛𝑡𝑎𝑏𝑙𝑒 𝑠𝑒𝑙𝑙 𝑜𝑟𝑑𝑒𝑟𝑠
𝑁𝑢𝑚𝑏𝑒𝑟 𝑜𝑓 𝑎𝑐𝑐𝑜𝑢𝑛𝑡𝑎𝑏𝑙𝑒 𝑏𝑢𝑦 𝑜𝑟𝑑𝑒𝑟𝑠 + 𝑁𝑢𝑚𝑏𝑒𝑟 𝑜𝑓 𝑎𝑐𝑐𝑜𝑢𝑛𝑡𝑎𝑏𝑙𝑒 𝑠𝑒𝑙𝑙 𝑜𝑟𝑑𝑒𝑟𝑠!
Copyright © 2016 By Veloxpro Software Limited. All rights reserved Page 82 of 89
Volume imbalance represents the ratio between the volume generated by buying aggressors (market
order transactions on the offer) versus the volume generated by selling aggressors (market order
transactions on the bid). The ratio is calculated as:
𝑁𝑢𝑚𝑏𝑒𝑟 𝑜𝑓 𝑎𝑐𝑐𝑜𝑢𝑛𝑡𝑎𝑏𝑙𝑒 𝑏𝑢𝑦 𝑣𝑜𝑙𝑢𝑚𝑒 − 𝑁𝑢𝑚𝑏𝑒𝑟 𝑜𝑓 𝑎𝑐𝑐𝑜𝑢𝑛𝑡𝑎𝑏𝑙𝑒 𝑠𝑒𝑙𝑙 𝑣𝑜𝑙𝑢𝑚𝑒
𝑁𝑢𝑚𝑏𝑒𝑟 𝑜𝑓 𝑎𝑐𝑐𝑜𝑢𝑛𝑡𝑎𝑏𝑙𝑒 𝑏𝑢𝑦 𝑣𝑜𝑙𝑢𝑚𝑒 + 𝑁𝑢𝑚𝑏𝑒𝑟 𝑜𝑓 𝑎𝑐𝑐𝑜𝑢𝑛𝑡𝑎𝑏𝑙𝑒 𝑠𝑒𝑙𝑙 𝑣𝑜𝑙𝑢𝑚𝑒!
The two imbalance indicators are calculated according to the current chart range. Any change to the chart range (either by dragging or by zooming in or out) will affect the readings of the imbalance indicators.
Interpretation:
Users can gauge the imbalance indicators to assess when the activity is heavily titled to a single direction
based on the order book and order flow activity. This can help in assessing momentum move or
exhaustion points.
Settings:
The Imbalance Indicator ratios are displayed on the top right side of the chart. Whenever an imbalance
ratio is equal to or greater than 10% the number will appear in the color set for the buyers. If the
imbalance ratio is equal or less than -10%, the number will appear in the color set for the sellers. To
change the color settings, please refer to the Color Settings section above.
To enable the imbalance indicator display click the studies panel icon above the chart and
check either of the two imbalance indicators. The studies panel also includes settings for the
order book imbalance as illustrated below.
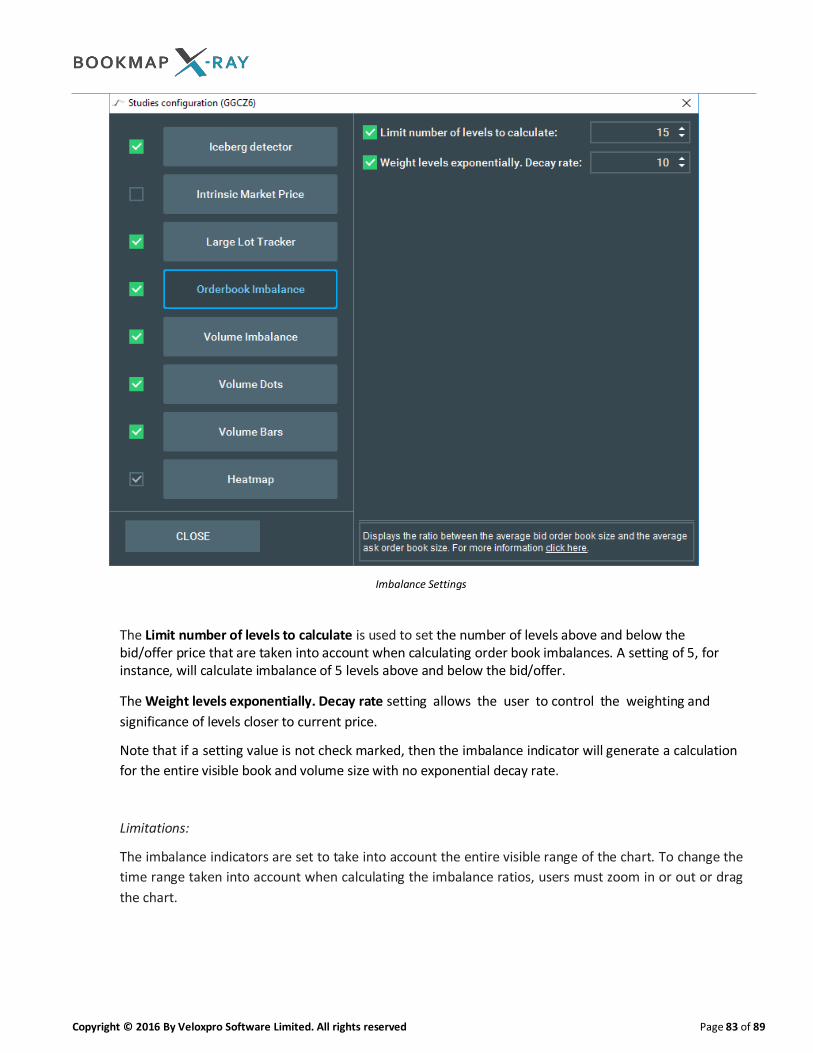
Copyright © 2016 By Veloxpro Software Limited. All rights reserved Page 83 of 89
Imbalance Settings
The Limit number of levels to calculate is used to set the number of levels above and below the bid/offer price that are taken into account when calculating order book imbalances. A setting of 5, for instance, will calculate imbalance of 5 levels above and below the bid/offer.
The Weight levels exponentially. Decay rate setting allows the user to control the weighting and
significance of levels closer to current price.
Note that if a setting value is not check marked, then the imbalance indicator will generate a calculation
for the entire visible book and volume size with no exponential decay rate.
Limitations:
The imbalance indicators are set to take into account the entire visible range of the chart. To change the
time range taken into account when calculating the imbalance ratios, users must zoom in or out or drag
the chart.
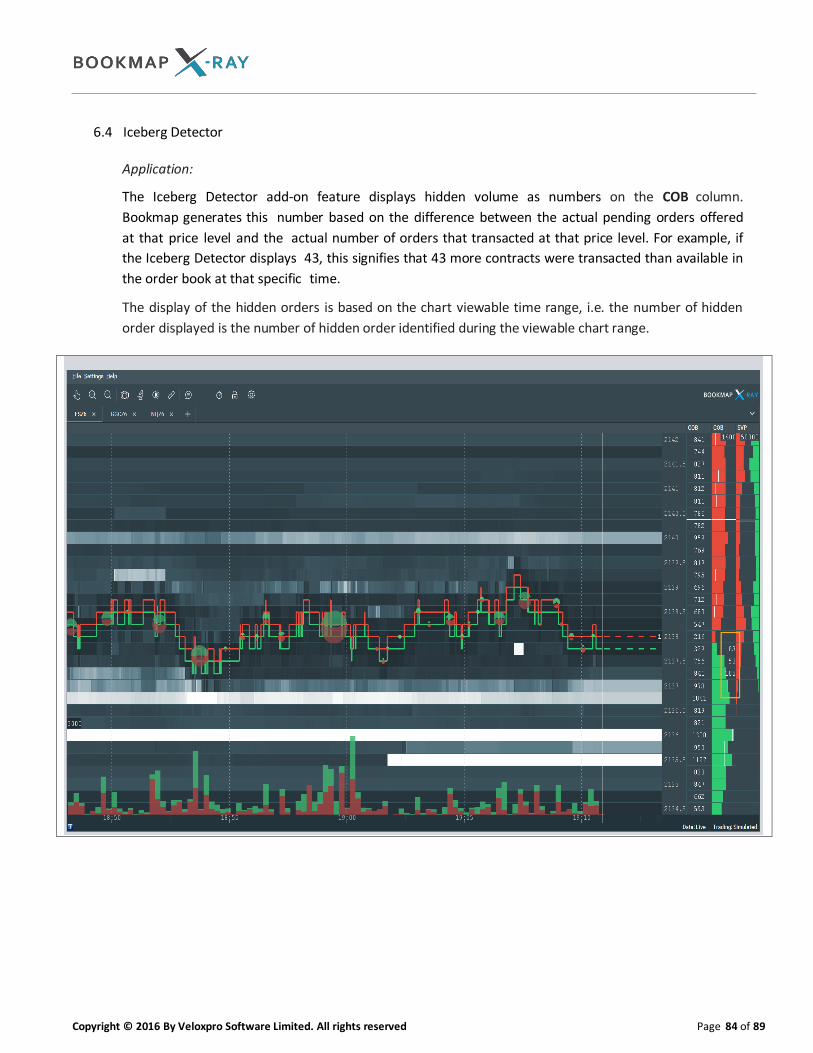
Copyright © 2016 By Veloxpro Software Limited. All rights reserved Page 84 of 89
6.4 Iceberg Detector
Application:
The Iceberg Detector add-on feature displays hidden volume as numbers on the COB column.
Bookmap generates this number based on the difference between the actual pending orders offered
at that price level and the actual number of orders that transacted at that price level. For example, if
the Iceberg Detector displays 43, this signifies that 43 more contracts were transacted than available in
the order book at that specific time.
The display of the hidden orders is based on the chart viewable time range, i.e. the number of hidden
order displayed is the number of hidden order identified during the viewable chart range.
Copyright © 2016 By Veloxpro Software Limited. All rights reserved Page 85 of 89
Interpretation:
Traders can assess the possibility of hidden liquidity at certain price levels with the Iceberg Detector.
Since hidden orders are usually associated with the activity of more sophisticated players, traders may
also use this information to assess possible short term price action and areas of resistance or support.
Settings:
There are no settings for the Iceberg Detector. To enable it click the studies panel icon above
the chart and check the Iceberg Detector check box.
Limitations:
The Iceberg Detector can only display hidden orders after the execution of those orders has taken place;
it is not forward looking. It cannot display hidden orders currently resting at specific price levels.
Copyright © 2016 By Veloxpro Software Limited. All rights reserved Page 86 of 89
Annex I –Keyboard Shortcuts
There are several keyboard shortcuts that can be used instead of mouse action in Bookmap:
1. CTRL+S to take a screenshot of the Bookmap chart.
2. ESC to hide the configuration dialogues of the chart, colors, contrast and the log window.
3. SPACE to pause/resume in Replay mode.
4. Left/Right arrows in chart drag-mode to shift the chart pixel by pixel.
5. Shift + Left/Right arrows in chart drag mode to shift the chart by 10 pixels increments.
6. Right click on an empty space of the toolbar to find main window.

Copyright © 2016 By Veloxpro Software Limited. All rights reserved Page 87 of 89
Annex II –Color value names
The following colors can be entered in the custom note import file with their names and not just their hex code:
Black White Red Yellow Green Blue Light blue Cyan Magenta Brown Gray Light gray

Copyright © 2016 By Veloxpro Software Limited. All rights reserved Page 88 of 89
Annex III – Brackets, OCO and Trailing Stop
Server-side vs Client-side
Platform Brackets Trailing stop OCO
Ninja Client side Client side Client side
TWS Client side Client side Client side
S5 Server side Server side Server side
TT Client side Client side Client side
CQG Web Server side Server side Server side
Rithmic Server side Server side Server side
Transact Client side Client side Client side
Simulator Client side Client side Client side
OCO:
For all platforms the price of a stop leg of an OCO cannot be modified to an invalid price, i.e. at or above the
offer for a buy stop or at or below the bid for a sell stop
Size increase modifications of OCO orders is not allowed across all platform connections
Allowed price changes can be done on each order individually.
Allowed size modifications (decreasing size) can either be done on each individual leg or is automatically
updated to the other leg, depending on the platform connection, as detailed below:

Copyright © 2016 By Veloxpro Software Limited. All rights reserved Page 89 of 89
Behavior Platform
Size change of one leg automatically updates the other leg S5
Each leg is modified individually, i.e. size modification of a single
leg will not automatically update the other leg
CQG
Size change of one leg automatically updates the other leg RIthmic
Size change of one leg automatically updates the other leg Ninja, TWS, TT, Transact, Simulator
Brackets:
Bracket secondary orders behave as OCO orders, as detailed above Trailing stop:
The trailing stop parameter control the tick steps at which the stop order is updated Trailing
stop will not apply to an entry stop order
Trailing stop will not apply to a leading (primary) bracket order