booklet 3 - ask pak chairul · booklet 3 covers the development of algorithms (both in pseudocode...
TRANSCRIPT

Booklet 3
This covers the following topics found in section 3 of the computer studies syllabus: Item Topic Page numbers 1 Common flowchart symbols 2 2 Writing flowcharts to solve problems 3 3 Dry running of flowcharts 9 4 Problems based on flowcharting 13 5 Pseudocode 18 6 Writing algorithms using pseudocode 20 7 Problems based on pseudocode 25 8 Introduction to logic 28 9 Description of common logic gates 28 10 Combinations of logic gates 31 11 Problems based on logic 34
1

Booklet 3 covers the development of algorithms (both in pseudocode and flowchart form) and also introduces logic gates which is a new topic from 2011. Introduction to Flowcharts This section covers the use of flow diagrams (charts) in the production of algorithms. Systems flowcharts are different and these are covered in a different section (Systems analysis). The early part of section 3.1 (i.e. top down design, structure diagrams, menus, libraries of procedures and subroutines) is covered adequately by standard text books. This section primarily covers four areas: 1 Common flow chart symbols 2 Writing flowcharts to solve problems 3 Dry running of flowcharts to determine its function and outputs 4 Exercises to test the above concepts 1 Common flowchart symbols 1.1 The start and end box:
START
END
1.2 The process box:
X = X + 1
1.3 Input/Output box:
Print X
1.4 Decision/query box:
No YesIs X > 5?
2

2 Writing flowcharts to solve problems
The following five problems are also covered in section 3.2 where the algorithms are constructed using pseudocode. Candidates may choose to answer questions using either flowcharts or pseudocode but a working knowledge of both techniques is well advised.
2.1 Example 1
A town contains 5000 houses. Each house owner must pay tax based on the value of the house. Houses over $200 000 pay 2% of their value in tax, houses over $100 000 pay 1.5% of their value in tax and houses over $50 000 pay 1% of their value in tax. All others pay no tax. Write an algorithm to solve this problem in the form of a flowchart.
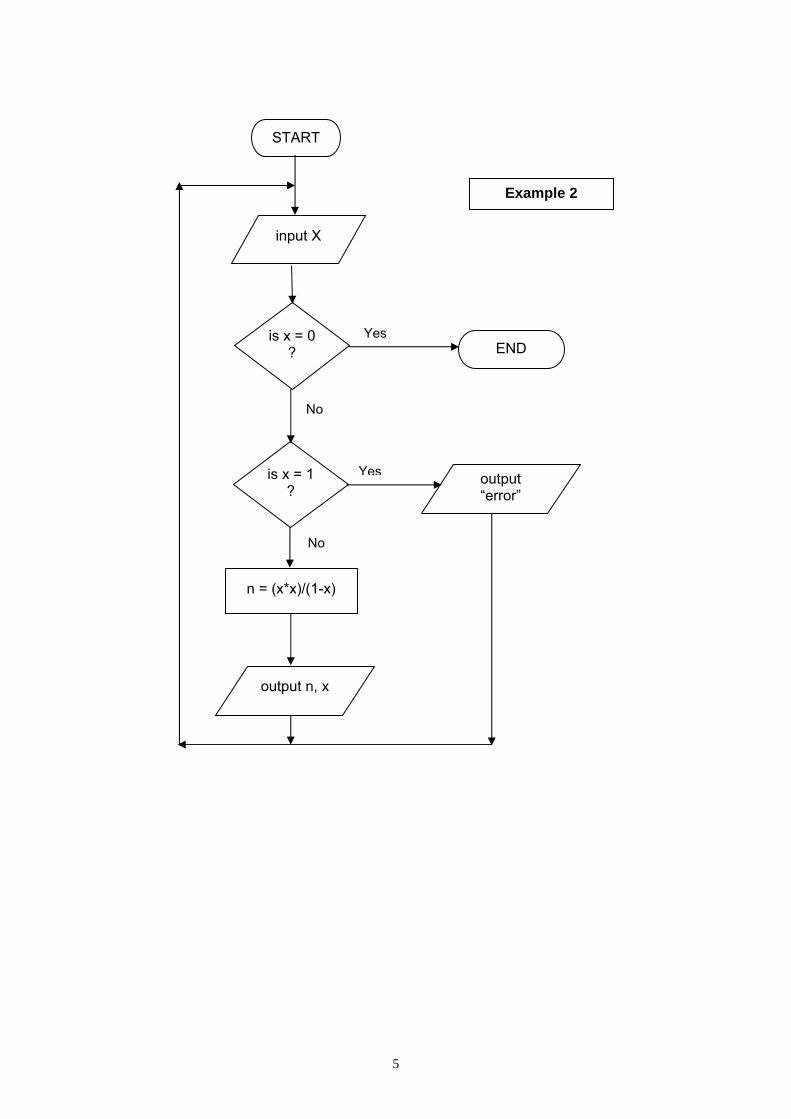
2.2 Example 2 The following formula is used to calculate n: n = (x * x)/(1 – x). The
value x = 0 is used to stop the algorithm. The calculation is repeated using values of x until the value x = 0 is input. There is also a need to check for error conditions. The values of n and x should be output. Write an algorithm to show this repeated calculation in the form of a flowchart.
2.3 Example 3 Write an algorithm in the form of a flowchart which takes temperatures
input over a 100 day period (once per day) and outputs the number of days when the temperature was below 20C and the number of days when the temperature was 20C and above.
2.4 Example 4 Write an algorithm in the form of a flowchart which:
• inputs the top speeds (in km/hr) of 5000 cars • outputs the fastest speed and the slowest speed • outputs the average (mean) speed of all the 5000 cars
2.5 Example 5 A shop sells books, maps and magazines. Each item is identified by a
unique 4 – digit code. All books have a code starting with 1, all maps have a code starting with 2 and all magazines have a code starting with 3. The code 9999 is used to end the algorithm.
Write an algorithm in the form of a flowchart which inputs the codes for
all items in stock and outputs the number of books, number of maps and the number of magazines in stock. Include any validation checks needed.
3

START
Is house> 200000
Is house> 1000000
Is house> 50000
Tax = 0
Input house
count = 1
print tax
count = count + 1
tax = house * 0.02
tax = house * 0.015
tax = house * 0.01
Is count < 50001
END
Yes
No
Yes
No
Yes
No
No
Yes
Example 1
4
START
input X
is x = 0 ?
is x = 1 ?
n = (x*x)/(1-x)
output n, x
output “error”
END Yes
No
Yes
No
Example 2
5

START
input temp
count = 1 total1 = 0, total 2 = 0
is temp < 20 ?
is temp > 19 ?
total1 = total1 + 1
total2 = total2 + 1
count = count + 1
is count < 101 ?
output total1, total2 END
Yes No
Yes
Yes
No
No
Example 3
6

7
START
fastest = 0 slowest = 1000
total = 0
count = 1
input topspeed
is topspeed >
fastest ?
is topspeed < slowest ?
fastest = topspeed
slowest = topspeed
total = total + topspeed
count = count + 1
is count < 5001 ?
average = total * 100/5000
Output fastest, slowest, average
END
Yes
No
Yes
No
No
Yes
Example 4

8

START
input code
Is code = 9999?
Is 999 < code < 2000
Is 1999 < code < 3000
Is 2999 < code < 4000
output books, maps, mags
END
books + books + 1
maps = maps + 1
mags = mags + 1
output “error”
Yes
No
Yes
No
Yes
No
Yes
No
Example 5 books = 0, maps = 0,
mags = 0
9

3 Dry running of flowcharts Dry running of flowcharts is basically a technique to:
• determine the output for a known set of data to check it carries out the task correctly
• check on the logic of the algorithm • determine the function of the algorithm
When dry running a flowchart it is advisable to draw up a trace table showing how variables change their values at each stage in the algorithm. The advantages of doing this are:
• if you make a mistake, it is easier to back track to where the error occurred rather than starting from the beginning again
• there is less chance of an error being made • encourages a more logical approach
The following three examples show all stages in the dry running for the given set of input data:
3.1 Example 1
This algorithm inputs 3 numbers, each number goes through successive division by 10 until its value is less than 1. An output is produced which contains the number input and a value generated by the flowchart processing. Data to be used: X = 85, 3190, -40
3.2 Example 2 This algorithm inputs 5 values and outputs how many input numbers
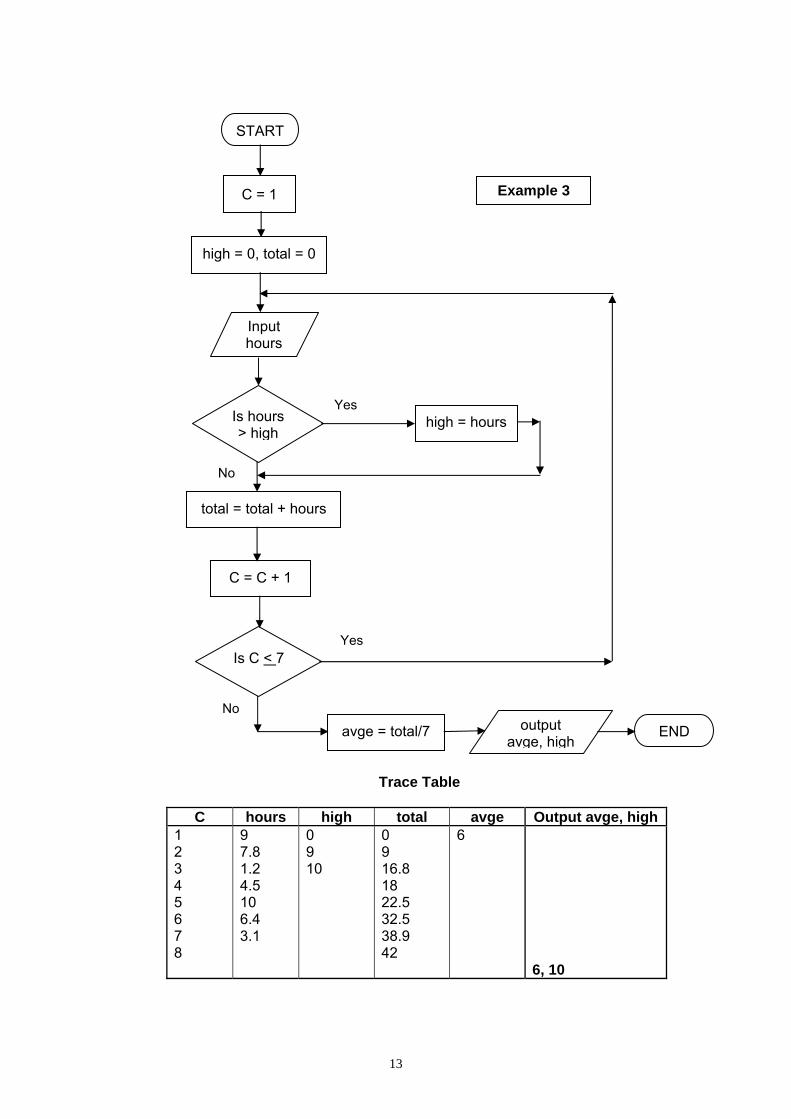
were negative and how many were positive. Data to be used: N = 1, -5, 2, -8, -7 3.3 Example 3 This algorithm inputs the number of hours of sunshine recorded each
day for a week (7 days). The output is the highest value for hours of sunshine and the average (mean) value for the numbers of hours of sunshine per day.
Data to be used: hours = 9.0, 7.8, 1.2, 4.5, 10.0, 6.4, 3.1
10

START
input X
N = 1
T = X
X = X/10
Is X < 1 ?
Output T,N END
N = N + 1
Yes
No
Example 1
Trace Table
X N T Output T, N 85 1 85 8.5 2 0.85 85, 2
3190 1 3190 2 319 3 31.9 4 3.19
0.319 3190, 4 -40 1 -40 -4 -40, 1
11

START
C = 1 neg = 0, pos = 0
Input N
Is N < 0
Is N > 0
C = C + 1
Is C < 5
output neg, pos END
neg = neg + 1
pos = pos + 1
Yes
No
Yes
No
Example 2
Trace Table
C N neg pos Output neg, pos 0 0 1 1 1 1 -5 2 2 2 2 3
3 -8 4 -7 5
6 3, 2
12
START
C = 1
high = 0, total = 0
Input hours
high = hours Is hours > high
total = total + hours
C = C + 1
Is C < 7
avge = total/7 output avge, high
END
Yes
No
Yes
No
Example 3
Trace Table
C hours high total avge Output avge, high
6 0 0 9 1 9 9 7.8 2 16.8 10 1.2 3 18 4.5 4 22.5 10 5 32.5 6.4 6 38.9 3.1 7
42 8 6, 10
13

4 Problems Questions 1 to 7 are problems which require an algorithm to be written in the
form of a flowchart. Questions 8 to 10 require a trace table to be written and find the expected output for the given set of data. The answers to these questions can be found in booklet 6.
(1) Regis lives in Brazil and often travels to USA, Europe and Japan. He wants
to be able to convert Brazilian Reais into US dollars, European euros and Japanese yen. The conversion formula is:
currency value = number of Reais X conversion rate For example, if Regis is going to USA and wants to take 1000 Reais (and the
exchange rate is 0.48) then he would input USA, 1000 and 0.48 and the output would be: 480 US dollars.
Write an algorithm, using a flowchart, which inputs the country he is visiting,
the exchange rate and the amount in Brazilian Reais he is taking. The output will be value in foreign currency and the name of the currency.
(2) As part of an experiment, a school measured the heights (in metres) of all its
500 students.
Write an algorithm, using a flowchart, which inputs the heights of all 500 students and outputs the height of the tallest person and the shortest person in the school.
(3) A geography class decide to measure daily temperatures and hours of sunshine per day over a 12 month period (365 days)
Write an algorithm, using a flowchart, which inputs the temperatures and
hours of sunshine for all 365 days, and finally outputs the average (mean) temperature for the year and the average (mean) number of hours per day over the year.
(4) A small shop sells 280 different items. Each item is identified by a 3 – digit
code. All items that start with a zero (0) are cards, all items that start with a one (1) are sweets, all items that start with a two (2) are stationery and all items that start with a three (3) are toys.
Write an algorithm, using a flowchart, which inputs the 3 – digit code for all
280 items and outputs the number of cards, sweets, stationery and toys.
14
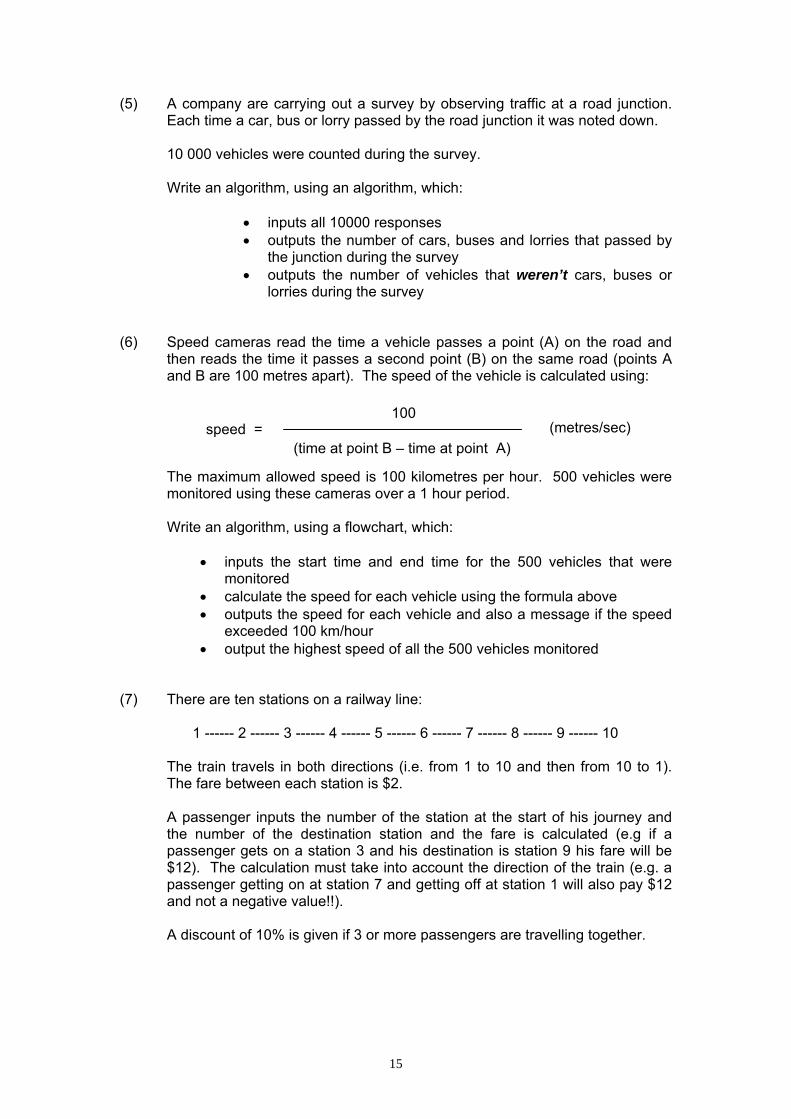
(5) A company are carrying out a survey by observing traffic at a road junction. Each time a car, bus or lorry passed by the road junction it was noted down.
10 000 vehicles were counted during the survey. Write an algorithm, using an algorithm, which:
• inputs all 10000 responses • outputs the number of cars, buses and lorries that passed by
the junction during the survey • outputs the number of vehicles that weren’t cars, buses or
lorries during the survey (6) Speed cameras read the time a vehicle passes a point (A) on the road and
then reads the time it passes a second point (B) on the same road (points A and B are 100 metres apart). The speed of the vehicle is calculated using:
100 (metres/sec) speed = (time at point B – time at point A)
The maximum allowed speed is 100 kilometres per hour. 500 vehicles were monitored using these cameras over a 1 hour period.
Write an algorithm, using a flowchart, which:
• inputs the start time and end time for the 500 vehicles that were monitored
• calculate the speed for each vehicle using the formula above • outputs the speed for each vehicle and also a message if the speed
exceeded 100 km/hour • output the highest speed of all the 500 vehicles monitored
(7) There are ten stations on a railway line: 1 ------ 2 ------ 3 ------ 4 ------ 5 ------ 6 ------ 7 ------ 8 ------ 9 ------ 10 The train travels in both directions (i.e. from 1 to 10 and then from 10 to 1).
The fare between each station is $2. A passenger inputs the number of the station at the start of his journey and
the number of the destination station and the fare is calculated (e.g if a passenger gets on a station 3 and his destination is station 9 his fare will be $12). The calculation must take into account the direction of the train (e.g. a passenger getting on at station 7 and getting off at station 1 will also pay $12 and not a negative value!!).
A discount of 10% is given if 3 or more passengers are travelling together.
15

Write an algorithm, using a flowchart, which:
• inputs the number of passengers travelling • inputs the station number of the starting point and the station number
of the destination • calculates the total fare taking into account the direction of travel • calculates any discount due • outputs the cost of the tickets and prints the tickets
(8) Draw the trace table and determine the output from the following flowchart
using the following data: number = 45, -2, 20.5
START
input number
X = 0
T = number
number = number - 10
X = X + 1
Is number
< 10
output X, number
END
Yes
No
16

(9) Draw the trace table and determine the output from the following flowchart using the following data (NOTE: input of the word “end” stops the program and outputs results of the survey):
vehicle = car, car, lorry, bus, van, van, car, car, bus, car, end
START
input vehicle
is vehicle = end
is vehicle = car
is vehicle = bus
is vehicle = lorry
output car, bus, lorry,
othersEND
car = car + 1
bus = bus + 1
lorry = lorry + 1
others = others + 1
Yes
No
Yes
No
Yes
No
Yes
No
car = 0, bus = 0, lorry = 0, others = 0
17

(10) Draw the trace table and determine the output from the following flowchart using the following data:
X = 5, -3, 0, -3, 7, 0, 6, -11, -7, 12
START
count = 1
input X
is X < 0
is X > 0
neg = neg + X n = n + 1
pos = pos + X p = p + 1
count = count + 1
is count <11
output avge1, avge2
END
avge1 = neg/n avge2 = pos/p
Yes
No
Yes
No
Yes
No
neg = 0, n = 0, pos = 0, p = 0
18

Introduction tp pseudocode This section covers the use of pseudocode in the production of algorithms. Candidates should use standard computing text books to find out information on the features of programming languages (high level and low level), interpreters, compilers, assemblers, user documentation and technical documentation. No specific programming language is referred to; development of algorithms using pseudocode uses generic descriptions of looping, branching, data manipulation, input/output, totalling and counting techniques. The section is broken down into four areas: 1 description of common pseudocode terms 2 writing algorithms using pseudocode 3 finding errors in sections of pseudocode 4 exercises 1 Common pseudocode terms 1.1 counting
Counting in 1s is quite simple; use of the statement count = count + 1 will enable counting to be done (e.g. in controlling a repeat loop). The statement literally means: the (new) count = the (old) count + 1 It is possible to count in any increments just by altering the numerical value in the statement (e.g. count = count – 1 counts backwards)
1.2 totalling To add up a series numbers the following type of statement should be used: total = total + number This literally means (new) total = (old) total + value of number 1.3 input/output Input and output indicated by the use of the terms input number, output total,
print total, print “result is” x and so on. 1.4 branching There are two common ways of branching: case of ….. otherwise …... endcase if ….. then ….. else ….. endif
19

case of if … then case number of if number = 1 then x = x + 1
1: x = x + 1 else if number = 2 then y = y + 1
2: y = y + 1 else print “error”
otherwise print “error” endif
endcase endif 1.5 loops There are three common ways of performing a looping function: for … to … next, while … endwhile and repeat … until The following example input 100 numbers and finds the total of the 100 numbers
and outputs this total. All three looping techniques are shown: for … to while … endwhile repeat … until for count = 1 to 100 while count < 101 repeat
input number input number input number
total = total + number total = total + number total = total + number
next count = count + 1 count = count + 1
print total endwhile until count = 100
print total print total
20
2 Writing algorithms using pseudocode
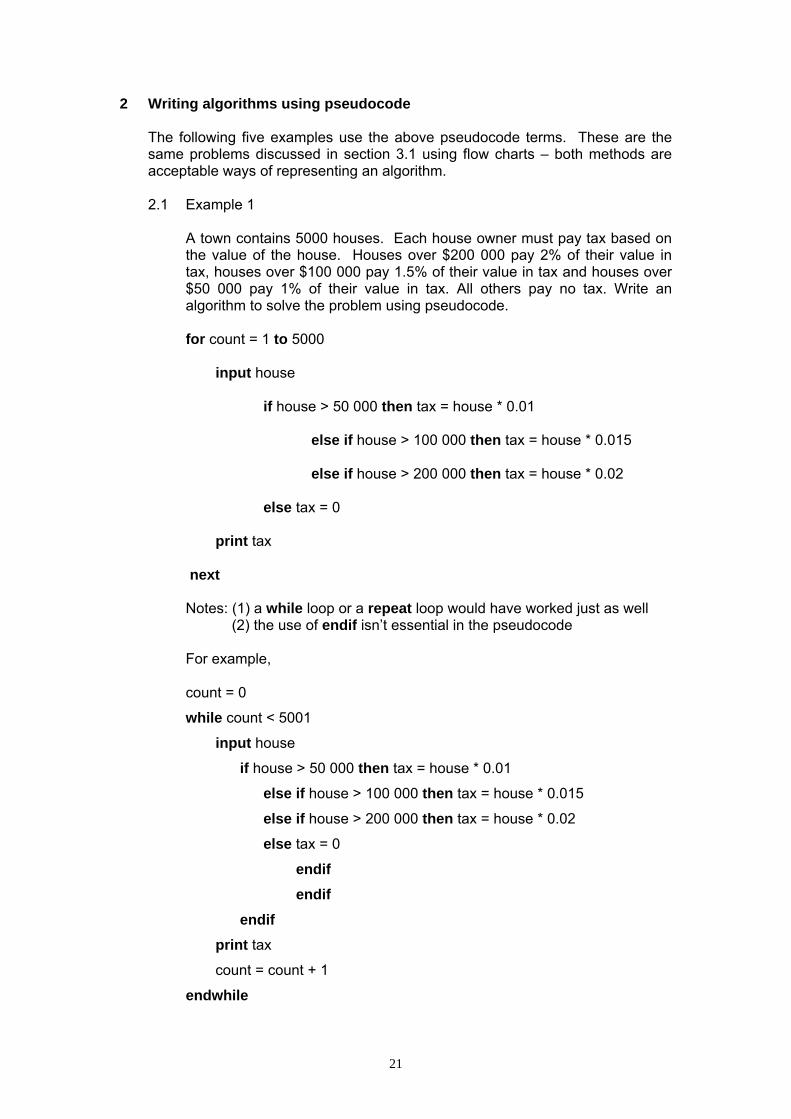
The following five examples use the above pseudocode terms. These are the same problems discussed in section 3.1 using flow charts – both methods are acceptable ways of representing an algorithm. 2.1 Example 1
A town contains 5000 houses. Each house owner must pay tax based on the value of the house. Houses over $200 000 pay 2% of their value in tax, houses over $100 000 pay 1.5% of their value in tax and houses over $50 000 pay 1% of their value in tax. All others pay no tax. Write an algorithm to solve the problem using pseudocode. for count = 1 to 5000 input house if house > 50 000 then tax = house * 0.01 else if house > 100 000 then tax = house * 0.015 else if house > 200 000 then tax = house * 0.02 else tax = 0 print tax next
Notes: (1) a while loop or a repeat loop would have worked just as well (2) the use of endif isn’t essential in the pseudocode For example, count = 0
while count < 5001
input house
if house > 50 000 then tax = house * 0.01
else if house > 100 000 then tax = house * 0.015
else if house > 200 000 then tax = house * 0.02
else tax = 0
endif endif endif print tax
count = count + 1
endwhile
21
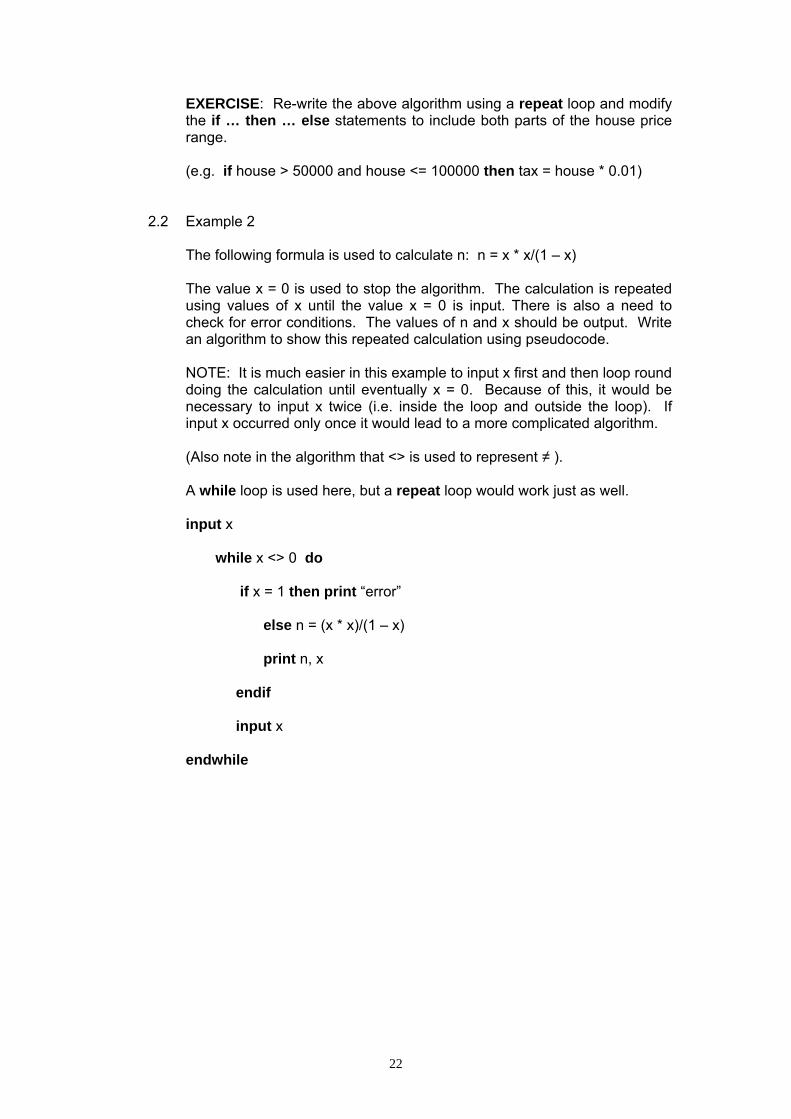
EXERCISE: Re-write the above algorithm using a repeat loop and modify the if … then … else statements to include both parts of the house price range.
(e.g. if house > 50000 and house <= 100000 then tax = house * 0.01) 2.2 Example 2 The following formula is used to calculate n: n = x * x/(1 – x) The value x = 0 is used to stop the algorithm. The calculation is repeated
using values of x until the value x = 0 is input. There is also a need to check for error conditions. The values of n and x should be output. Write an algorithm to show this repeated calculation using pseudocode.
NOTE: It is much easier in this example to input x first and then loop round
doing the calculation until eventually x = 0. Because of this, it would be necessary to input x twice (i.e. inside the loop and outside the loop). If input x occurred only once it would lead to a more complicated algorithm.
(Also note in the algorithm that <> is used to represent ≠ ). A while loop is used here, but a repeat loop would work just as well. input x while x <> 0 do if x = 1 then print “error” else n = (x * x)/(1 – x) print n, x endif input x endwhile
22

2.3 Example 3 Write an algorithm using pseudocode which takes temperatures input over
a 100 day period (once per day) and output the number of days when the temperature was below 20C and the number of days when the temperature was 20C or above.
(NOTE: since the number of inputs is known, a for … to loop can be
used. However, a while loop or a repeat loop would work just as well). total1 = 0: total2 = 0 for days = 1 to 100 input temperature if temperature < 20 then total1 = total1 + 1 else total2 = total2 + 1 endif next print total1, total2 This is a good example of an algorithm that could be written using the
case construct rather than if … then … else. The following section of code replaces the statements if temperature < 20 then …… endif:
case temperature of 1: total1 = total1 + 1 2: total2 = total2 + 1 endcase 2.4 Example 4 Write an algorithm using pseudocode which:
• inputs the top speeds of 5000 cars • outputs the fastest speed and the slowest speed • outputs the average speed of all the 5000 cars
(NOTE: Again since the actual number of data items to be input is known
any one of the three loop structures could be used. It is necessary to set values for the fastest (usually set at zero) and the slowest (usually set at an unusually high value) so that each input can be compared. Every time a value is input which > the value stored in fastest then this input value replaces the existing value in fastest; and similarly for slowest).
23

fastest = 0: count = 0 slowest = 1000 repeat input top_speed total = total + top_speed if top_speed > fastest then fastest = top_speed if top_speed < slowest then slowest = top_speed endif endif count + count + 1 until count = 5000 average = total * 100/5000 print fastest, slowest, average 2.5 Example 5 A shop sells books, maps and magazines. Each item is identified by a
unique 4 – digit code. All books have a code starting with a 1, all maps have a code starting with a 2 and all magazines have a code beginning with a 3. The code 9999 is used to end the program.
Write an algorithm using pseudocode which input the codes for all items in
stock and outputs the number of books, maps and magazine in stock. Include any validation checks necessary.
(NOTE: A 4-digit code implies all books have a code lying between 1000
and 1999, all maps have a code lying between 2000 and 2999 and all magazines a code lying between 3000 and 3999. Anything outside this range is an error)
24

books = 0: maps = 0: mags = 0 repeat input code if code > 999 and code < 2000 then books = books + 1 else if code > 1999 and code < 3000 then maps = maps + 1 else if code > 2999 and code < 4000 then mags = mags + 1 else print “error in input” endif:endif:endif until code = 9999 print books, maps, mags (NOTE: A function called INT(X) is useful in questions like this. This
returns the integer (whole number) part of X e.g. if X = 1.657 then INT(X) = 1; if X = 6.014 then INT(X) = 6 etc. Using this function allows us to use the case statement to answer this question:
books = 0: maps = 0: mags = 0
repeat input code
x = INT(code/1000) * divides code by 1000 to give a
case x of * number between 0 and 9
1: books = books + 1
2: maps = maps + 1
3: mags = mags + 1
otherwise print “error”
endcase
until code = 9999
print books, maps, mags
this is probably a more elegant but more complex solution to the problem)
25

4 PROBLEMS Questions 1 to 3 contain sections of pseudocode which contain errors. Locate the errors and suggest the correct coding. Questions 4 to 10 are problems which require an algorithm to be written in pseudocode – there is “no right answer” here; as long as the pseudocode works then the solution is acceptable. (1) The following section of pseudocode inputs 1000 numbers and then outputs
how many were negative, how many were positive and how many were zero.
Locate the 3 errors and suggest a corrected piece of code. 1 negative = 1: positive = 1 2 for x = 0 to 1000 3 input number 4 if number < 0 then negative = negative + 1 5 if number > 0 then positive = positive + 1 6 endif 7 endif 8 next 9 print negative, positive (2) The following section of pseudocode inputs rainfall (in cm) for 500 days and
outputs the average rainfall and the highest rainfall input. Locate the 3 errors and suggest a corrected piece of code. 1 highest = 1000 2 days = 1 3 while days > 0 4 input rainfall 5 if rainfall > highest then highest = rainfall 6 endif 7 total = total + rainfall 8 days = days + 1 9 average = total/500 10 endwhile 11 print average, highest (3) The following section of pseudocode inputs a number, n, multiplies together
1 x 2 x 3 x ……. x n, calculates input number/sum and outputs result of the calculation.
Locate the 3 errors and suggest a corrected piece of code. 1 input n 2 for mult = 1 to n 3 sum = 0 4 sum = sum * mult 5 result = n/sum 6 next 7 print result
26

(4) Regis lives in Brazil and often travels to USA, Europe and Japan. He wants to be able to convert Brazilian Reais into US dollars, European euros and Japanese yen. The conversion formula is:
currency value = number of Reais X conversion rate For example, if Regis is going to USA and wants to take 1000 Reais (and
the exchange rate is 0.48) then he would input USA, 1000 and 0.48 and the output would be: 480 US dollars.
Write an algorithm, using pseudocode, which inputs the country he is
visiting, the exchange rate and the amount in Brazilian Reais he is taking. The output will be value in foreign currency and the name of the currency.
(5) As part of an experiment, a school measured the heights (in metres) of all its
500 students.
Write an algorithm, using pseudocode, which inputs the heights of all 500 students and outputs the height of the tallest person and the shortest person in the school.
(6) A geography class decide to measure daily temperatures and hours of
sunshine per day over a 12 month period (365 days) Write an algorithm, using pseudocode, which inputs the temperatures and
hours of sunshine for all 365 days, and finally outputs the average (mean) temperature for the year and the average (mean) number of hours per day over the year.
(7) A small shop sells 280 different items. Each item is identified by a 3 – digit
code. All items that start with a zero (0) are cards, all items that start with a one (1) are sweets, all items that start with a two (2) are stationery and all items that start with a three (3) are toys.
Write an algorithm, using pseudocode, which inputs the 3 – digit code for all
280 items and outputs the number of cards, sweets, stationery and toys. (8) A company are carrying out a survey by observing traffic at a road junction.
Each time a car, bus, lorry or other vehicle passed by the road junction it was noted down.
10 000 vehicles were counted during the survey. Write an algorithm, using pseudocode, which:
• inputs all 10000 responses • outputs the number of cars, buses and lorries that passed by
the junction during the survey • outputs the number of vehicles that weren’t cars, buses or
lorries during the survey
27
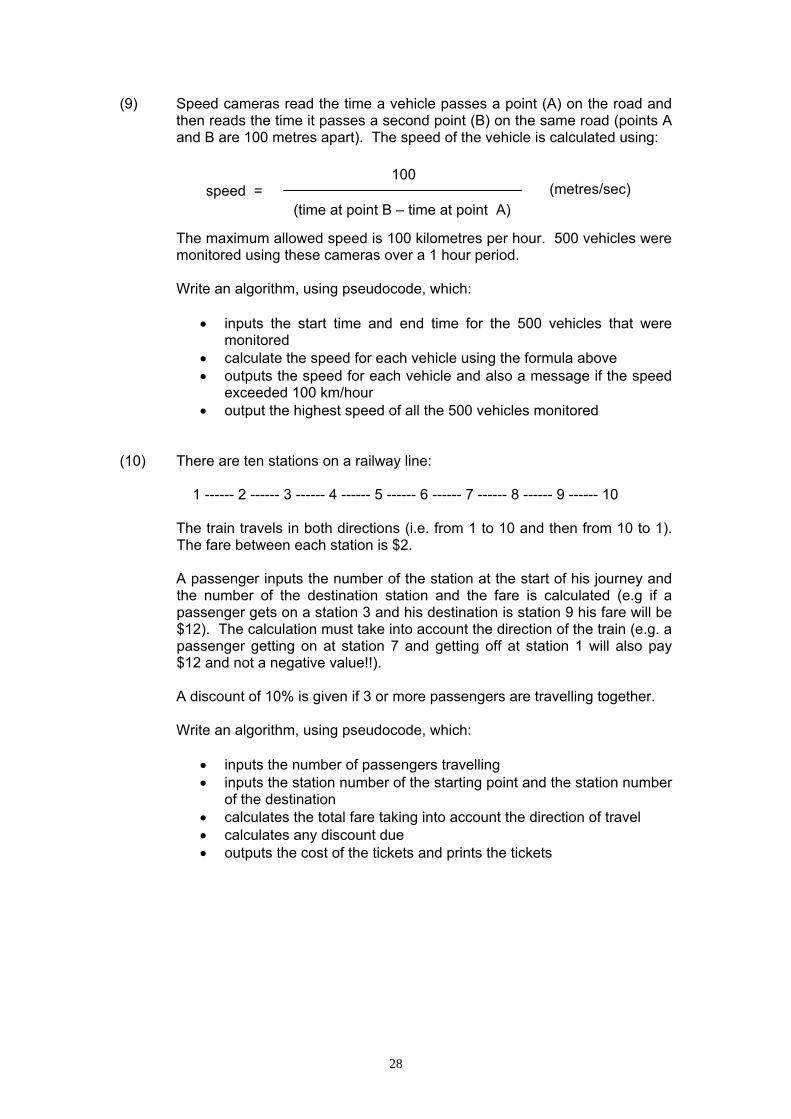
(9) Speed cameras read the time a vehicle passes a point (A) on the road and then reads the time it passes a second point (B) on the same road (points A and B are 100 metres apart). The speed of the vehicle is calculated using:
100 (metres/sec) speed = (time at point B – time at point A)
The maximum allowed speed is 100 kilometres per hour. 500 vehicles were monitored using these cameras over a 1 hour period.
Write an algorithm, using pseudocode, which:
• inputs the start time and end time for the 500 vehicles that were monitored
• calculate the speed for each vehicle using the formula above • outputs the speed for each vehicle and also a message if the speed
exceeded 100 km/hour • output the highest speed of all the 500 vehicles monitored
(10) There are ten stations on a railway line: 1 ------ 2 ------ 3 ------ 4 ------ 5 ------ 6 ------ 7 ------ 8 ------ 9 ------ 10 The train travels in both directions (i.e. from 1 to 10 and then from 10 to 1).
The fare between each station is $2. A passenger inputs the number of the station at the start of his journey and
the number of the destination station and the fare is calculated (e.g if a passenger gets on a station 3 and his destination is station 9 his fare will be $12). The calculation must take into account the direction of the train (e.g. a passenger getting on at station 7 and getting off at station 1 will also pay $12 and not a negative value!!).
A discount of 10% is given if 3 or more passengers are travelling together. Write an algorithm, using pseudocode, which:
• inputs the number of passengers travelling • inputs the station number of the starting point and the station number
of the destination • calculates the total fare taking into account the direction of travel • calculates any discount due • outputs the cost of the tickets and prints the tickets
28