book review: - lahore school of · web viewa comparison of our estimates of the elasticities...
TRANSCRIPT

THE LAHORE JOURNAL
OFECONOMICS
Lahore School of Economics
Muhammad Ali ChaudharyEconomic Analysis of Supply Response in Pakistan’s Agriculture
Omar ChaudryTowards a New Solution Mechanism for Corporate Bankruptcy
Ali AlmakkyDeviations from Market Efficiency: Behavioural Explanations and theirValidity
S. Akbar Zaidi
Mohammad H. Akhtar andPeter J. BuckleyMotives of Foreign Firms in Pakistan
Eatzaz Ahmad and Badar uz ZamanRisk, Uncertainty and Returns at Karachi Stock Exchange
S. Nazre HyderInternational Labour Standards and National Labour Laws in Pakistan
Comment:

Institutional Failure, State Failure or the Failure of ‘Civil’ Society? The RuralWater Supply and Sanitation Sector in Pakistan
Iqbal M. KhanThe Concept and Model of Small Enterprise Hub for Developing Countries
Book Review:Viqar AhmedIssues in Pakistan’s Economy
Volume 5, No.2 July-Dec, 2000

THE LAHORE JOURNALOF
ECONOMICS
Editorial Board
Mr. Viqar Ahmed - EditorMs. Nina Gera - Co-Editor
Editorial Staff: Tele. No: 5874385
Telefax: 0092 - 42 - 5714936
E-mail: [email protected]
Publisher : Lahore School of Economics, Lahore, Pakistan.
Correspondence relating to subscriptions and changes ofaddress should be sent to The Lahore Journal of Economics,105-C-2, Gulberg III, Lahore - 54660 - Pakistan
Instructions to authors can be found at the end of this issue.No responsibility for the views expressed by authors andreviewers in The Lahore Journal of Economicsis assumed by the Editor, the Co-Editor and the Publishers.Copyright by: Lahore School of Economics

52000


THE LAHORE JOURNAL OF ECONOMICSContents Vol. 5, 2000
Economic Analysis of Supply Response in Pakistan’s Agriculture 1
Muhammad Ali Chaudhary
Towards a New Solution Mechanism for Corporate Bankruptcy 19
Omar Chaudry
Deviations from Market Efficiency; Behavioural Explanationsand their Validity 37
Ali Almakky
Institutional Failure, State Failure or the Failure of ‘Civil’ Society?The Rural Water Supply and Sanitation Sector in Pakistan
71S. Akbar Zaidi
Motives of Foreign Firms in Pakistan 87Mohammad H. Akhtar and Peter J. Buckley
Risk, Uncertainty and Returns at Karachi Stock Exchange107Eatzaz Ahmad and Badar uz Zaman
International Labour Standards and NationalLabour Laws in Pakistan 127
S. Nazre Hyder
Comment:The Concept and Model of Small Enterprise HubFor Developing Countries 141
Iqbal M. Khan

Book Review:Issues in Pakistan’s Economy 149
Viqar Ahmed

Muhammad Ali Chaudhary
Economic Analysis of Supply Response in Pakistan’s Agriculture
Muhammad Ali Chaudhary*
Abstract
This study represents an attempt at estimating the farmer supply response to different economic and material incentives. Several researchers have estimated the cultivator supply response to different techno-economic factors (Cummings, 1975a and 1975b; Askari and Cummings, 1977; Cooley, 1973; Chen, Courteny and Schmitz, 1972; Ghoshal, 1975; Tweeten, 1986). However, as agriculture modernises, the relative significance of different factors affecting farm inputs and outputs changes; factors regarded as significant determinants of farmer decision at one time may not be relevant at another time. Similarly, the transformation of agriculture in the desirable direction invariably necessitates and at times renders desirable the use of new measures and policy instruments. How farmers react to changes in market forces and government measures is important to know in different ways. In fact, policy makers are interested in knowing the appropriateness, effectiveness and impact of measures for the ultimate formation or legislation of farm regulations.
Farmer supply responsiveness to changes in different factors may be ascertained from changes they introduce in their cropped area, cropping pattern, crop rotations, output, etc. Although the supply responsiveness of farmers may be measured from changes in any of these aspects of farming, this study has analysed the peasant supply response to price and non-price factors with respect to the allocation of the cultivated area among crops of wheat, cotton, rice, sugarcane and maize. Farmers in Pakistan grow some other crops as well. However, the crops considered for * Professor of Economics, Quaid-i-Azam University, Islamabad. The author is extremely thankful to Mr. Anjum Majeed for computer estimation of the model.
1

The Lahore Journal of Economics, Vol.5, No.2
this analysis account for the major proportion, 68 per cent, of the cropped area and over 90 per cent of value added of all major crops raised in the country. As such, this study has measured the area allocated to these crops by farmers in response to changes in different factors considered for analysis.Analytical Framework
The farmer supply response has empirically been estimated by following Nerlove’s partial adjustment and adaptive expectation model1. In the basic Nerlovian model, it is assumed that the area farmers desire to cultivate is a function of the expected price and some other important variables. Researchers have modified and extended the basic model to reflect specific farm and market conditions. In particular, many new variables with their current and lagged values have been included in the model to explain and measure farmer supply response (Pandey and Manocha, 1984; Sangwan, 1985; Mahend, 1970). Further, researchers have experimented with a number of alternate approaches to specification and formulation of the supply response function. For example, French and Mathews (1971) adapted the basic Nerlovian model to analyse the supply response of perennial crops, Marzuch, Weaver and Helmberger (1980) and Lee and Helmberger (1985) formulated the farmer supply response function under changing government farm programmes and policy regimes and Eckstein (1985) has applied a rational expectation model to measure the observed dynamics of agricultural supply. Similarly, Chen (1972) estimated a response function which allowed a greater degree of flexibility in the lag structure than does the Nerlovian partial adjustment model. Further, Cooley (1973) applied an adapted regression model under the 1 The basic Nerlove’s model is as follows:A*
t = a0 + a1 P*t + a2 + ut (1)
P*t = P*
t – 1 + (Pt – 1 – P*t – 1) (2)At = At – 1 + C (A*
t – 1 – At – 1) (3)WhereAt = actual area cultivated t time t,A*
t = area desired to be cultivated at time t,Pt = actual price at time t,P*
t = expected priceXt = other variables
2

Muhammad Ali Chaudhary
assumption that the disturbances are independent, rather inflexible. Nevertheless, the main adaptations relate generally to the inclusion of non-price variables in the original or the modified forms of the basic Nerlovian model (Askari and Cummings, 1977; Cummings, 1975b; Krishna, 1963; Sangwan, 1985). Although researchers have applied sophisticatedly extended specifications of supply response models to improve the predictive ability of the model, adequately deserved attention has still not been given to the expected price variable in measuring the farmer supply response. The price of a given commodity that the farmer expects to prevail in one period has invariably been assumed to be equal to its actual price in the immediate previous period (Askari and Cummings, 1977; Cummings, 1975a; Ghoshal, 1975; Sangwan, 1985). This seems to be followed more as a computational convenience than as a theoretically defensible way of identifying the relevant factors affecting the farmers supply response. This study has first generated the time series of the expected prices and then used them along with other relevant variables in estimating the overall model specified in this study. The estimation of the time series of the expected prices used of all crops considered is explained by expressing the basic Nerlovian model in general form as below:
where,
Since A*t and P*t are not directly observable, this function cannot be estimated. However, the hypotheses of the adaptive expectation and the partial adjustment may respectively be used to explain P*t and the adjustment of At to A*t. The part of the model related to the adaptive expectations part of the model, which states that the change in expectations equals some fraction of last
3

The Lahore Journal of Economics, Vol.5, No.2
period’s forecast error, may symbolically be expressed as follows:
where P*t represents the expected prices in period t, Pt represents the actual prices during period t and represents the adjustment coefficient. The last expression signifies that the expected price is a weighted sum of the actual and expected price in the last period.
It may be noted that the component of the model on adaptive expectations is convertible into its distributed lag form. Successive substitutions of the lagged values of actual prices result in expressing the expected price as a weighted sum of past and actual prices as depicted below:
The estimation of the expected prices as appears from Eq (3), requires the determination of weights. The required weights depend on the adjustment coefficient, , P*t is not directly observable. It is estimated by following such a procedure as minimises expected losses from forecast errors. This is accomplished by estimating from the following quadratic function:
The terms in the function may be restricted to a number after which the inclusion of higher lags does not improve the explanatory power of the model. Usually, restricting the terms to 3 suffices. Restricting the terms to 3 and searching the parameters space from 0 to 1 in interval, the value of may be obtained as below:
By substituting the error minimising value of , the time series of the expected price is generated from Eq (3) restricted to three terms.
4

Muhammad Ali Chaudhary
The partial adjustment part of the model may, in turn, be specified as below:
Incorporating the adaptive expectation equation and then substituting A*t from Eq (6) into Eq (1), a well distributed error is obtained as shown in the following equation2:
where L is lag operator, which, in turn, gives
So that which is the actual area cropped by the farmers is the Koych-weighted combination of current and all previously desired cropped area and the weighted sum of random disturbance terms of the current and all the previous periods.
Substituting Eq (1) into Eq (6) gives the final form of the model to be estimated as below:
Eq (8) represents variables other than price to be included in the model. There is a need to explain the variables other than price considered for this analysis. Increasing diffusion of modern technologies in the country has prompted the choice and modification of the variables used. Although the increased use of modern technologies has expanded opportunities for bigger profit, they also have significantly increased farming expenditures. Similarly, while the expanded application of modern inputs has increased yields of crops, it has also increased the risk 2 See Johnston, 1972 and Nugent, 1979 for further explanation.
5

The Lahore Journal of Economics, Vol.5, No.2
of greater variations in their prices. The modern varieties of crops compete for timely application of adequate quantities of inputs. Farmer efficiency of allocation of available resources to different crops is likely to be affected by a number of factors. Keeping in view all such considerations, the other variables used along with prices of crop outputs are as below:
where, At,At – 1 = area actually cultivated at time t and t – 1P*
t = expected price generated as explained aboveCVp = coefficient of variation of PriceCVy = coefficient of variation of yieldRs = rainfall of the sowing season of the crop
concerned in millimeters.It = irrigated area under all crops in 1000 acres.I = ratio of irrigated area of the crop concerned to
the total irrigated area under all crops.
The time series data from 1960 to 1986 used in this analysis are generally expected to suffer from the existence of autocorrelation and multicollinearity. Cochrane-Orcutt iterative process and Frischs confluence analysis were respectively applied where their existence was detected. Convergence of (rho) to 0.001 was used as a criterion to stop the iterations in the Cochrane-Orcutt method. was found to be efficient in the first autoregressive scheme, AR(1), as:
The data on prices, cropped area, rainfall and irrigated area are obtained from relevant official documents such as the Economic Survey and Agricultural Statistics of Pakistan.Empirical Results and Discussion
The estimation of the acreage response functions has revealed the existence of logical relationships among the chosen variables. A Table 1 reveals, except for the variable of yield risk, coefficients are generally consistent with prior theoretical expectations. The coefficients and
6
Muhammad Ali Chaudhary
the associated ‘t’ statistics show that the variables have a significant effect on area allocation among crops considered for analysis. The high values of the adjusted R -2
and ‘F’ indicate good fit and the overall significance of the supply response functions. More specifically, the lagged dependent variable has been found to highly significantly affect the acreage allocation among crops being considered. The significant effect of the lagged dependent variable may in part be explained by the farmer experience in a certain cropping pattern and the existence of institutional constraints, particularly of irrigation water supply. The prevalence of varied climatic conditions has led the farmers to follow specific cropping patterns in different parts of the country. As a consequence of harsh climatic conditions, irrigation is indispensable for the profitable production of farm crops. Since the expansion of resources like irrigation, which require long-term investment, occurs slowly, the cultivators continue to follow the familiar cropping pattern. Similarly, the output prices expected to prevail in the harvest period have also other significant determinants of the area planted to different crops, though not to the extent of the lagged dependent variable. It seems important to note further that the expected output prices tend to influence the acreage allocation more among the same than the different season crops. This is why the effect of the expected prices has been more pronounced in acreage allocation for cotton and sugarcane than for wheat and rice. The effect of the expected prices on acreage allocation among crops also depends on whether they are food or cash crops. Area allocation
7

The Lahore Journal of Economics, Vol.5, No.2
to food crops is in general expected to show less variations compared to that of cash crops. Wheat and, to a lesser extent, rice serve as staple in Pakistan. Thus, farmers especially subsistence farmers have inevitably to put such area under these crops as could enable them to produce food grains commensurate with their family consumption requirements. This implies that area allocation among food crops may not show wide yearly variations. Conversely, the expected prices may lead to relatively more rapid variations in acreage allocation for cash crops of cotton and sugarcane. The farmers raise these crops for the market to ultimately meet financial obligations. Since the requirements of ready cash have in the wake of modern agriculture greatly increased, the expected prices have more significantly affected the farmer supply responsiveness in respect of cash rather than food crops.
Changes in area allocation and cropping pattern involved risk. Generally, such changes give rise to two types of risks, with the first one being associated with variations in yield and the other with fluctuations in prices. How farmers have varied acreage under crops in response to the risks of variations in yield and prices is important to know. The regression results show that the acreage responsiveness has been affected more by yield than price risk. Further, the yield risk has been a more significant determinant of acreage allocation than price risk for cash crops compared to food crops, although wheat acreage has also significantly been affected by the risk of yield variations. More specifically, the increase in yield risk has positively affected area allocated to cotton and wheat whereas it has negatively affected the acreage planted to rice. The existence of the direct (indirect) relationship between yield risk and cropped area of wheat (rice) appears to be consistent with the practical conditions of these crops. In Pakistan, wheat signifies a more important staple and reveals less yield variations than rice. When high yield risk prevails, it results in opposite effects on wheat and rice. The farmers, in pursuance of avoiding shortage of wheat supplies on account of decline in yields, adjust its acreage in response to a decline in its yield to minimise cost of cultivation and probably also to make more acreage available to the following crop of wheat which, has over time become the next important crop for
8

Muhammad Ali Chaudhary
rice fields. The limited time left after harvesting of rice till sowing of wheat constituted a severe constraint and forced many bullock farms to leave rice fields uncultivated for the rest of the year. The introduction of mechanical cultivation has alleviated the constraint of the short interval between harvesting of rice and sowing of wheat and the farmers are now able to accomplish the desired preparation of rice fields for wheat. In this way, the farmers compensate the yield risk induced reduction in rice acreage by increased wheat acreage.
Of the other variables included in the regression functions, irrigated area has been found to significantly affect the farmer acreage responsiveness only in wheat and cotton. The effect of irrigated area on area allocation among crops needs to be examined in the light of the total irrigation water availability and crop consumptive water requirements. In principle, the annual acreage of high water delta crops may not show wide variations because their full potential cannot be realised without assured irrigation in adequate quantities. The crops with relatively low consumptive water requirements can, on the other hand, lend themselves for acreage adjustment more readily in response to water availability reflected in the form of total irrigated area in the country. Both wheat and cotton are not only less irrigation-intensive than rice and sugarcane but are also relatively short duration crops. This is probably why farmers have responded differently in terms of adjustment in area allocation among crops. Total irrigated area nationally has positively affected the area planted to both wheat and cotton. Since cropped area with access to irrigation reflects, as mentioned before, the extent of farm water availability, the area under irrigated crops shows a direct correspondence with total irrigated area in the country.
The effect of the supply shifters was also examined by estimating coefficients from non-linear regression functions represented in Table 2. Its comparison with Table 1 shows that the non-linear functions appear to be less superior to the linear functions except for rice in which case the former form of function has yielded more satisfactory estimates. The variables of rainfall, irrigated area and the proportion of rice irrigated area to total irrigated area in the
9

The Lahore Journal of Economics, Vol.5, No.2
country have been found to be the more significant determinants of area allocated to rice than other variables included in the function. The size of the irrigated area of sugarcane turned significant in the non-linear regression from the insignificant variable in the linear function.
Table 3 depicts the regression coefficients estimated after the data were adjusted for autocorrelation. The removal of autocorrelation has brought about a good improvement in the qualities of the coefficients of irrigated area and that of the ratio of cropped irrigated area to the total irrigated area. However, the lagged dependent variable and yield risk still remained significant determinants of acreage responsiveness in four out of five crops under consideration. Risk associated with prices has also remained, as before, more or less an insignificant determinant of the cultivator supply response. The values of the adjusted R-2 have further increased. In four out of five regression functions, its values are close to 1 which signifies a perfect fit. Similarly, the overall significance of all the functions, as indicated by the ‘F’ statistic, has remarkably improved. Although all the functions were overall highly significant when only Frisch’s confluence analysis was applied in regressions, their significance has further improved on the use of the Cochrane-Orcutt procedure in removing autocorrelation from the data set analysed.
10

Muhammad Ali Chaudhary 11

The Lahore Journal of Economics, Vol.5, No.2
Area Adjustment and Short-Run and Long-Run Elasticities
To what extent the farmers were able to adjust acreage under different crops in response to expected prices of their products and other supply shifters can be ascertained from Table 3. If the lagged dependent variable did not enter significantly, the adjustment coefficient for that crop is considered unity i.e. this crop shows full adjustment (Madhavan, 1972). With this in mind, we can judge the acreage adjustment of the crops being analysed. All the adjustment coefficients range from 0.36 for cotton to 0.74 for maize (Table 4). Alternatively, these coefficients show that the maximum adjustment has been achieved in acreage planted to maize and wheat and only moderate adjustment has been shown in the case of the remaining crops.
The short-run and the long-run acreage elasticities with respect to price have been found to be generally low. Although the elasticities are small in size, they are significant in the case of wheat, cotton, sugarcane and maize. Similarly, the elasticity coefficients of acreage with respect to yield have also been found to be significant for rice and cotton. In general, both the short-run and the long-run elasticities estimated in this study are satisfactory. The small size of the elasticities obtained are comfortably comparable with elasticities reported in similar earlier studies. A comparison of our estimates of the elasticities of acreage with respect, in particular, to price with other estimates depicted in Table 5 shows that our estimates for wheat and cotton are close to those obtained by Cummings (1975) and Tweeten (1986). However, both the short-run and the long-run estimates of this study are significantly greater in size than those of any other estimates calculated by other researchers in recent times. Similarly, the elasticity of acreage with respect to yield for sugarcane is close to what has been estimated by Sangwan (1985).
12

Muhammad Ali Chaudhary 13

The Lahore Journal of Economics, Vol.5, No.214

Muhammad Ali Chaudhary
Summary
The study attempted to examine the farmer acreage responsiveness to price and other supply shifters. The lagged dependent variable has been found to be a significant determinant of acreage under cultivation of nearly all the crops considered for analysis. The expected price and yield variables have been significant determinants in more than half the crops in their area allocation by farmers. It has also been ascertained that the risk in acreage allocation is caused more by variations in yields of crops than by changes in prices. This may be because prices have all the time been moving upwards whereas yields have revealed considerable fluctuations. The statistical estimation of the cultivator supply response has yielded coefficients consistent with theoretical expectations in most of the cases. The short-run and long-run elasticities of acreage with respect to price, yield, risk of yield and certain other supply shifters were found to be generally acceptable on theoretical considerations and comfortably comparable with the estimates calculated in other recent studies.
The main conclusion of the study is that efforts are needed to be made to enable the farmers to achieve stable yields. The significant influence of the lagged dependent variable on acreage allocation also seems to urge for measures conducive for better performance of crops in terms of productivity.
15

The Lahore Journal of Economics, Vol.5, No.2
References
Askari, Hossein and John Cummings, 1977, “Estimating Agricultural Supply Response with the Nerlove Model: A Survey”, International Economic Review, Vol. 18, No. 2, PP. 257-291.
Chen, Dean, Richard Courteny, and Andrew Schmitz, 1972, “A Polynomial Lag Formulation of Milk Production Response”, American Journal of Agricultural Economics, Vol. 54, No. 1, PP. 77-83.
Cooley, Thomas F. and Edward C. Prescott, 1973, “An Adaptive Regression Model”, International Economic Review, Vol. 14, No. 2, PP. 364-371.
Cummings, John T. “ The Supply Responsiveness of Bangalee Rice and Cash Crop Cultivators”, The Bangladesh Development Studies.
Cummings, John T. 1975a, “The Supply Responsiveness of Indian Farmers in the Post-Independence Period: Major Cereals and Cash Crops”, Indian Journal of Agricultural Economics, Vol. XXX, No. 1, PP. 25-40.
Cummings, John T. 1975b, “Cultivator Responsiveness in Pakistan: Cereals and Cash Crops”, Pakistan Development Review, Vol. XIV, PP. 261-273.
Eckstein, Zvi, 1985, “The Dynamics of Agriculture Supply: A Reconsideration”, American Journal of Agricultural Economics, Vol. 67, No. 2, PP. 204-212.
Falcon, Walter P. 1964, “Farmer Response to Price in a Subsistence Economy: The Case of West Pakistan”, The American Economic Review, Vol.54, PP.580-591.
French, Ben C. Jim L. Mathews, 1971, “A Supply Response Model for Perennial Crops”, American Journal of Agricultural Economics, Vol. 53, No. 3, PP. 478-490.
Goshal, Animesh, 1975, “The Price Responsiveness of Primary Producers: A Relative Supply Approach”, America Journal of Agricultural Economics, Vol. 57, PP. 116-119.
16

Muhammad Ali Chaudhary
Hussain, Syed Mushtaq, 1964, “A Note on Farmer Response to Price in East Pakistan”, Pakistan Development Review, Vol. IV, PP. 93-106.
Jhonston, J. 1972, Econometric Methods, 2nd Ed. New York, McGraw Hill Book Company.
Krishna, Raj, 1963 “Farmer Supply Response in India-Pakistan: A Case Study of the Punjab Region”, The Economic Journal, Vol. LXXIII, No. 29.
Lee, David R. and Peter G. Helmberger, 1985, “Estimating Supply Response in the Presence of Farm Programmes”, American Journal of Agricultural Economics, Vol. 67, No.2, PP. 193-203.
Madhavan, M. C., 1972, “Acreage Response of Indian Farmers: A Case Study of Tamil Nadu”, Indian Journal of Agricultural Economics, Vol. XXVII, No. 1, PP. 67-86.
Mahend, Reddy J. 1970, “Estimation of Farmers’ Supply Response—A Case Study of Groundnuts”, Indian Journal of Agricultural Economics, Vol. XXV, PP. 57-63.
Morzuch, B. J., R. D. Weaver, and P. G. Helmberger, 1980,“Wheat Acreage Supply Response under Changing Farm Programmes American Journal of Agricultural Economics, Vol. 62, No. 1, PP. 29-37.
Nerlove, Marc, 1958, The Economics of Supply: Estimation of Farmer Supply Response to Price, John Hopkins University Press, Baltimore.
Nugent, Jaffrey B. and Constantine Glezakos, 1979, “A Model of Inflation and Expectations in Latin America”, Journal of Development Economics, Vol. 6, No. 3, PP. 431-446.
Pandey, U. K., P. K. Sardana and Veena Manocha, 1984, “An Estimate of Demand for and Supply of Cereals, Coarse Grains, Pulses and Oilseeds in Haryana”, Indian Journal of Agricultural Economics, Vol. XXXIX, Vol. 1, PP. 84-99.
17
The Lahore Journal of Economics, Vol.5, No.2
Sangwan, S. S. 1985, “ Dynamics of Cropping Pattern in Haryana : A Supply Response Analysis”, The Developing Economies, Vol. XXIII, No. 2, PP. 173-185.
Sidhu, Surjit S. and Carlos A. Baanante, 1981, “ Estimating Farm Level Input Demand and Wheat Supply in the Indian Punjab Using a Translog Profit Function”, American Journal of Agricultural Economics, Vol. 63, No. 2, PP. 237-246.
Sherwani, Vahid, 1968, Agricultural Supply in India: Some Theoretical and Empirical Studies, Ph. D. Thesis.
Tweeten, L. 1968, Supply Response in Pakistan: Report for the Agricultural Policy Analysis Project, USAID, Washington D. C.
18

Omar Chaudry
Towards a New Solution Mechanism for Corporate Bankruptcy
Omar Chaudry*
1. Introduction
A firm may resort to leverage in its capital structure for a variety of reasons; to capture the benefits of the tax shield of debt, to signal to the market that it sees a bright future for itself, or as a commitment device to reduce financial slack. Unforeseen circumstances, however, may force the firm into a situation where it is unable to pay its debts. If the environment is such that the firm has a single creditor, emerging from a situation like this may not pose too much of a problem. However, problems are likely to arise if there are multiple creditors. A resource-wasting race is likely to ensue as the creditors try to “be first” to seize the firm’s assets (in the case of a secured loan) or to obtain a judgement against the firm (in the case of an unsecured loan). This race may lead to a dismantling of the firm’s assets, which may mean a loss in value if the firm is worth more as an entity than it is as a collection of pieces.
If such occurrences are common, debtors and creditors would certainly anticipate them while drawing up their initial contracts; it would then be reasonable to ask the question why they would not specify as part of their contracts a mechanism that would be triggered off in a state of default? If such an arrangement were possible, the state would not be required to provide a bankruptcy procedure.
The presence of transaction costs, which often prove to be too large for debtors and creditors, preclude them from designing such procedures; hence the reliance of the parties on a “standard form” bankruptcy procedure provided by the state. The role of a bankruptcy procedure is to ensure that the disposal of the assets of the distressed firm is carried out in a systematic manner.* The author is Assistant Professor of Economics at the Lahore School of Economics.
19

The Lahore Journal of Economics, Vol.5, No.2
Currently existing bankruptcy procedures in the West have undergone major criticism in the recent past, with both academics and practitioners expressing their discontent over them. Bankruptcy reform is being considered in the UK, France and the USA. Also, as the former centrally planned economies of Eastern Europe move towards capitalism, they have to make a choice about what form of bankruptcy code they will have to adopt, and this choice is by no means proving to be easy. Russia, for example has recently adopted a bankruptcy code which suffers from many of the problems that inflict such procedures in the West. Given the general discontent with bankruptcy procedures around the world, this paper attempts at ascertaining what a “good” bankruptcy procedure really is, and whether any such procedures are in existence. An alternative procedure is also suggested.
The rest of this paper is organised as follows. In section 2, the goals of a good bankruptcy procedure are identified. In section 3, an overview of currently existing bankruptcy procedures is presented and some of the problems associated with each are highlighted. Section 4 is detailed analysis of an alternative procedure, due to Aghion, Hart, and Moore (AHM). In section 5, an assessment of this procedure is made. Section 6 discusses some additional issues and some practical problems that may arise under the AHM procedure. Section 7 concludes.2. The Goals of a Good Bankruptcy Procedure
From an economic theory standpoint, any “good” bankruptcy procedure should be focused towards the achievement of certain objectives, which are as follows.
First, the procedure should achieve an ex-post efficient outcome, the rationale for this goal being the fact that more is preferred to less, ceteris paribus. If a procedure differs from another only in that it results in more being available for everyone ex-post, then providing that the priority of claims is maintained, it will make everyone better off.
Second, it should give managers the right incentives to avoid bankruptcy. This goal is linked with the ex-ante
20

Omar Chaudry
bonding role of debt. Debt, it is argued, has an important role to play in constraining managers to act in the interests of claimholders. The importance of this role is much diminished if managers are not dealt with severely enough in the case of default on debt payments. Having reviewed the bankruptcy regime in the UK, a parliamentary commission wrote:
“It is a basic objective of the law to support the maintenance of commercial morality and encourage the fulfilment of financial obligations. Insolvency must not be an easy solution for those who can bear with equanimity the stigma of their own failure or the responsibility for the failure of a firm under their management.” (Cork Report 1982, Chapter 4, at 191).
Third, it should result in an outcome that preserves the absolute priority of claims. If the priority of claims can be violated at will, then people may be reluctant to lend to the firm. Also, if the priority structure that is agreed to outside of bankruptcy is not enforced within it, then this may give certain parties incentives to bribe management to either cause bankruptcy or delay it, depending on how the party in question profits from the outcome.
Finally, the procedure should be one that puts the ultimate decision-making power in the hands of the claimants, rather than in the hands of an outside expert such as a bankruptcy judge, because it is the claimants who are affected by the outcome, and not the agent supervising the process.
We must, at this juncture, note that there are doubts about whether absolute priority should be maintained. It is argued that if equity-holders get little or nothing in a bankruptcy proceeding, then the management, acting in the equityholders’ interests, will engage in highly risky investments when the firm is close to bankruptcy because, while the equityholders enjoy all the upside potential from the project, they bear very little of the downside risk; the creditors will lose if things go badly. However, to assume that management is really acting in the interests of the shareholders may well be an abstraction from reality in the case of large, widely held companies. They can safely
21

The Lahore Journal of Economics, Vol.5, No.2
be assumed to be self-interested in such circumstances. We may thus proceed further, armed with the notion that maintenance of absolute priority is indeed desirable.
Noteworthy is the point that some of the four goals may be in conflict. For example, the achievement of ex-post efficiency may dictate that the incumbent management be retained because it has certain firm-specific skills. This however, will conflict with the second goal because if the managers know that they will not be removed, then they may not have the correct ex-ante incentives to avoid bankruptcy. In such a situation, a good bankruptcy procedure would be one that strikes a reasonable balance between these goals.3. Existing Bankruptcy Procedures: an Overview
Bankruptcy procedures can be classified as cash auctions, structured bargaining, administration, or automatic financial restructuring. Of these, the first three are procedures which are used in practice whereas the fourth is a theoretical possibility.3.1. Cash Auctions
The firm’s assets are sold, either piecemeal (in which case the firm is liquidated); or the firm is sold as a going concern. Either way, the receipts from the sale are distributed among the former claimants according to the absolute priority rule. The sale is supervised by a trustee or a supervisor. An example of a cash auction is Chapter 7 of the United States Bankruptcy Code or Liquidation in the United Kingdom.
A cash auction would be an efficient mechanism in a world of perfect capital markets. A potential bidder would be able to raise the necessary cash from a financial institution and make a bid for the distressed firm, with the aim of making it profitable again. Competition among bidders would ensure that the value-maximising outcome is achieved, i.e. that the firm is maintained as a going concern only if its continuation value is higher than its liquidation value.
22

Omar Chaudry
In practice, however, capital markets are not perfect and this may result in a lack of competition in the auction and there may be few bids to keep the firm whole. Hence, we may see a disproportionately large number of liquidations at low prices. This imperfection in the capital markets thus reduces the efficacy of the cash auction solution to bankruptcy.3.2. Structured Bargaining
Due to the growing scepticism about the cash auction alternative, another procedure that is commonplace is one that is based on the concept of structured bargaining. The underlying idea behind such a procedure is that the various claimants bargain about the distressed firm’s future. The two issues that aim to be resolved through this process are deciding whether the firm should be shut down or continued, and how its value should be divided among the various claimants. The prime example of a structured bargaining process in the West is Chapter 11 of the US Bankruptcy Code. The process of Administration in the UK, as well as procedures in France, Germany and Japan are based on similar concepts.
Chapter 11 has been subject to a great deal of criticism in the last few years. It is felt that the process is time-consuming, costly, loss-inducing (to the firm in question), not harsh enough on incumbent management and that it mixes the decision of who should get what with what should happen to the firm. Moreover, as Chapter 11 places decisions in the hands of the supervising judge, it creates agency problems. A socially efficient level of resources is thus unlikely to be devoted to the achievement of a good reorganisation plan. Empirical findings suggest that Chapter 11 judges sometimes abuse their discretionary powers.
Two major problems inherent in any structured bargaining process deserve mention. First, restructured companies do not have an objective value. A proposal for overcoming this problem has been advocated by Bebchuk (1988) and will be explained in detail in section 4. Second, there is a danger that the wrong decision will be made concerning the firm’s future. This is on account of the fact
23

The Lahore Journal of Economics, Vol.5, No.2
that voting mechanisms in most structured bargaining processes are fixed in advance; consequently, a situation may arise where people whose payoff should not be affected by the final outcome of the vote may end up controlling the pivotal votes. An example may help in clarifying the nature of this problem.
Scenario 1: Consider a firm that has entered bankruptcy. The firm owes its senior creditors £90. It has been established that if the firm were to be shut down immediately and its assets sold off, it would be worth £80 (i.e. the liquidation value of the firm). However, if the firm were to be maintained as a going concern, it would be worth £120, on average. (If things go well, it would be worth £170; if they go badly, it would be worth £70; the average is thus £120). The value-maximising choice is to keep the firm going, because £120 is greater than £80. If things go well, senior creditors get their full claim of £90, but if they do not go well, they get £70, which is less than the £80 liquidation value. So the senior creditors may vote to liquidate the firm. This is clearly the inefficient decision because if the firm is not liquidated, there would be enough value to pay off the senior creditors in full, and the junior creditors and shareholders would then vote, and make the efficient decision about the firm’s future.
Scenario 2: The liquidation value of the firm, as before, is £80, as is the value of the senior creditors’ claims (£90). However, the average going concern value of the firm is now only £70 (£110 in the good state, £30 in the bad state).
The best possible outcome in the present situation is to liquidate the firm for £80. As this is less than the senior creditors’ claim, the junior creditors and shareholders are not in the hands of the senior creditors, they would make the right decision about the firm’s future.
It is very difficult for the various classes of claimants to bargain around these inefficiencies. As there are so many claimants, the negotiation process can become very lengthy and give rise to co-ordination problems within the various classes.
24

Omar Chaudry
An agent (the administrator) is appointed, who decides, through the court, which parts of the firm should be sold off and which parts maintained as a going concern. The current French Bankruptcy System operates in this way, as did Chapter X of the old US Bankruptcy Code before 1978.
The merits of the administrative process in the UK are that it avoids many of the costs of US Chapter 11 and because the management of the distressed firm is no longer in charge, the process is not as soft on management as is US Chapter 11.
The major drawback with this procedure, however, is that it places a lot of power in the hands of the judge and the administrator, both of whom may not be suitably qualified, or possess the right incentives, to make either an accurate assessment of the prevailing conditions, or an efficient decision about the firm’s future.3.4. Automatic Financial Restructuring
This is an option that has not as yet been used in practice; it is merely a theoretical possibility. Some scholars suggest that financial distress should trigger off an automatic financial restructuring in a pre-specified manner, and the decision of what to do with the firm should then be left to the management.
The flaw with this system is that it ignores the conflict of interest between managers and shareholders. As managers enjoy private benefits of control, they will not want to shut down a firm, even if it is unprofitable. The bonding role of debt ceases to exist in a situation of this kind. 4. An Alternative Regime: The Aghion-Hart-Moore Procedure
When a firm enters bankruptcy and has to undergo a process of settlement of claims, the claimholders form a heterogeneous group, which inevitably leads to a lot of haggling.
25

The Lahore Journal of Economics, Vol.5, No.2
The idea underlying the AHM procedure is to transform this heterogeneous group, i.e. with different claims, and therefore different objectives, into a homogeneous class of shareholders, which then decides through a process of voting, on the best alternative regarding the firm’s future.
A practitioner is appointed to supervise the process that will ultimately take the firm out of bankruptcy. All the firm’s debts are cancelled, the firm is converted into an all-equity firm, and a stay is put on the creditors’ claims. A time period, usually of three to four months, is specified, within which this procedure is to be completed. There are two tasks confronting the practitioner.
Task 1
He has to solicit bids, both cash and non-cash, for all or part of the new firm. For the bidding process to work well, the practitioner must ensure that bidders are provided with accurate information concerning the firm’s prospects. A possible way to disseminate this information is to make sure that the bidders have access to the firm’s books during the three-month period.Task 2
He has to allocate rights to the equity in this new firm among the former claimholders.
The amount and priority of all claims is determined by the practitioner, employing some method outside our discussion.4.1. The framework
Assume that, prior to bankruptcy, the firm had n classes of creditors.
Class 1 having the most senior claim, is owed D1.Class 2 having the next most senior claim, is owed
D2.
26

Omar Chaudry
……………………………………………………………………..Class n, having the most junior claim, is owed Dn
The claim of the shareholders is junior to all other claims, and they constitute the (n+1)th class.
Given this priority structure, the practitioner can proceed to allocate rights to equity in the new firm. What the share of each class of claimholders would be depends on whether the value of the new firm is objectively verifiable.4.1.1. When the value of the firm, V, is verifiable
The agent will allocate rights based on absolute priority. Therefore, the most senior class of creditors, under this regime should get what it is owed, D1, or the entire value of the firm, V, whichever is smaller. If S1 denotes the share of Class 1 creditors, thenS1= min [D1,V]
Class 2 should similarly get what it is owed, or whatever is left over after class 1 has been paid off, i.e.S2= min [D2, V-S1]
We can generalise this and obtain an expression for what class i will be entitled to under this schemeSi= min [Di, V-S1-S2-...........-Si-1]
What about the equityholders? As this regime is one which preserves absolute priority, equityholders, being residual claimants, will get something only in the event that there is some value left over after all the creditors have been paid off. In that case, they will be entitled toSn+1= [V-S1-S2-.......-Sn]
4.1.2. When V is not known
In practice, V is seldom known. Given that the maintenance of absolute priority was identified as a desirable feature of a good bankruptcy procedure, how
27

The Lahore Journal of Economics, Vol.5, No.2
can the allocation of claims be consistent with it now that the value of the reorganised firm is not known?
Recourse has to be made to an ingenious scheme devised by Bebchuk (1988). The basic idea underlying the approach is as follows.
We know what the participants are entitled to as a function of the value of the reorganised firm, which itself we do not know. Based on this knowledge, it is possible to design and distribute to the participants, a set of rights concerning the units of the reorganised firm such that irrespective of the value that the reorganised firm takes, these rights would provide participants with values perfectly consistent with their entitlements. The way in which the scheme works is the following.
Class 1 creditors (the most senior class) are allocated 100 per cent of the firm’s equity. A single creditor in this class receives d1/D1 of the firm’s shares. The firm has a right to redeem this claim (buy back the equity) at a price of D1 per 100 per cent i.e. for the amount that this class is owed.
Class 2 creditors are given the option to buy the firm’s equity at a price of D1 per 100 per cent; the firm has a right to redeem this claim at a price of D2 per 100 per cent, i.e. for the amount that this class is owed.
Class 3 creditors are given the option to buy equity at a price of (D1+D2) per 100 per cent, with the firm having a right to redeem this claim at a price of D3 per 100 per cent.
Generally speaking, class i creditors are given the option to buy equity at a price of (D1+D2+......+Di-1) per 100 per cent; the firm has a right to redeem this claim at a price of Di per 100 per cent.
Finally, shareholders are given the option to buy equity at a price of (D1+.…........+Dn) per 100 per cent. This right is not redeemable by the firm.
28

Omar Chaudry
After the rights have been allocated in the manner described above, the practitioner waits for the three-month period to lapse during which he collects all the incoming bids. At the end of the three-month period, he reveals all the bids to the claimholders in the new firm. The claimholders are then given an additional month to exercise their options (if they so wish), at the end of which the firm’s future is put to a simple vote, and the firm exits bankruptcy.
The sequence of events is summarised below.
4.2. Implementation of the procedure: an example
We now consider with the help of an example how this procedure would be implemented.
A bankrupt firm is composed of four classes of claimholders.
29
MONTH ZEROBankruptcy declared
Creditors’ claims stayedInsolvency practitioner
Bids solicitedRights allocated
MONTH THREEBids announced
Options exercisedTrade in equity and
MONTH FOURVote takes place
Company exits from

The Lahore Journal of Economics, Vol.5, No.2
Class A consists of 100 senior creditors, each owed £1.
Class B consists of 100 intermediate creditors, each owed £1.
Class C consists of 100 junior creditors, each owed £1.
Class D consists of 100 equityholders, each holding one unit of equity.After the firm is declared bankrupt, and a
practitioner is appointed, the firm is divided into 100 equal units of equity. He will allocate rights to equity in the new firm as follows: 4.2.1. Suppose the value of the reorganised firm is known
The value of the firm is V per unit (of equity), which means that the total size of the reorganisation pie to be distributed is 100V. We consider four possible cases:Case 1
V=0.8, total value of the pie to be distributed=80All units in the reorganised firm are given to the
senior creditors, and divided among them pro rata. Therefore, each senior creditor gets 1 share in the new firm; the value of each share being £0.80.Case 2
V=1.5, total value of the pie to be distributed =150Senior creditors get paid in full; they receive 100/1.5
units (each senior creditor receives 0.67 units). Intermediate creditors receive the remaining value, 100(1.5)-100; they get 100-100/1.5 units. Each one of them receives 1-1/1.5 units. The junior creditors and the equityholders get nothing.Case 3
30

Omar Chaudry
V=2.5, total value of the pie to be distributed =250Senior creditors get 100 (100/2.5 units, or 1/2.5 units
each), intermediate creditors get 100 (100/2.5 units, or 1/2.5 units each), and junior creditors get what is left over, i.e. 100(2.5)-200 (100-200/2.5 units, each getting 1-2/2.5 units each). The equityholders still get nothing.Case 4
V=3.5, total value of the pie to be distributed =350Senior creditors get 100 (100/3.5 units, or 1/3.5
units each), intermediate creditors get 100 (100/3.5 units, or 1/3.5 units each), junior creditors get 100 (100/3.5 units, or 1/3.5 units each). The equityholders get the remaining value, which is 100(3.5)-300 (100-300/3.5 units, or 1-1/3.5 units each)
The allocation of rights, it can be seen, is absolutely straightforward, when we know the value of the reorganised firm. The allocation is summarised in the table below.
Distribution of Units Supposing the value of the Reorganized Firm is known
Value of V
Class of Claimant Distribution of Units
V£1 Senior Creditors 1 unit eachIntermediate Creditors
Nothing
Junior Creditors NothingEquityholders Nothing
£1<V£2
Senior Creditors 1/V units each
Intermediate Creditors
1-(1/V) units each
Junior Creditors NothingEquityholders Nothing
31

The Lahore Journal of Economics, Vol.5, No.2
£2<V£3
Senior Creditors 1/V units each
Intermediate Creditors
1/V units each
Junior Creditors 1-(2/V) units eachEquityholders Nothing
V>£3 Senior Creditors 1/V units eachIntermediate Creditors
1/V units each
Junior Creditors 1/V units each Equityholders 1-(3/V) units each
4.2.2. When the value of the reorganised firm is not known
Unfortunately, it is not common for V to be known and we have to allocate rights using some other method. In section 4.1, we outlined the Bebchuk scheme. The scheme will now be used to allocate rights to the equity in the new firm.
The classes of the claimholders and the value of their claims is the same as in section 4.2.1. above. The allocation will be carried out as under.
Senior Creditors will receive one right each, which may be redeemed by the firm for £1 (in which case they will receive the full value of their claims), or in the event of it not being redeemed, will be entitled to receive one unit of equity in the reorganised firm.
Intermediate Creditors will receive one right each, which may be redeemed by the firm for £1 (in which case they will receive the full value of their claims), or in the event of it not being redeemed will have the option to purchase one unit of equity in the reorganised firm for £1.
Junior Creditors will receive one right each, which may be redeemed by the firm for £1 (in which case they will receive the full value of their claims), or in the event of
32

Omar Chaudry
it not being redeemed will have the option to purchase one unit of equity in the reorganised firm for £2.
Equityholders will receive one right each, which may not be redeemed by the firm. They will have an option to buy one unit of equity in the reorganised firm for £3.
The entitlements of the claimholders, as a function of the value of the reorganised firm are summarised in the table below.
Claimholders’ Entitlements when the value of the Reorganised Firm is not known
V£1 £1<V£2
£2<V£3
V>£3
Senior Creditor
V £1 £1 £1
Intermediate Creditor
0 V-£1 £1 £1
Junior Creditor 0 0 V-£2 £1Equityholder 0 0 0 V-£3
TOTAL V V V VAfter the rights have been allocated and the three
month period is over, the options will be exercised (or expire unexercised), and the firm will start anew.4.3. No basis for complaint
In this framework, no class of claimholder has any basis for complaining that it is getting less than what it is entitled to. To make an assertion to this effect, a particular claimholder is, in effect, suggesting that either claimholders above him or those below him are receiving more than their rightful share.
By the very mechanics of the scheme, claimholders below the “complainant” can only be getting anything if they pay in full the value of the claims of all the classes above them, including the complainant’s own class. Hence the complaint is not justified.
33

The Lahore Journal of Economics, Vol.5, No.2
Also, if the complainant exercises his option, he will automatically ensure that those above him do not receive more than the full value of their claims. The complaint once more is not justified.4.4. Cash constraints
Note that an intermediate or a junior creditor may be cash-constrained and may thus not be able to exercise his option. What happens in such a situation? A possible recourse for him is to borrow short-term (using the equity as collateral), exercise his option, and then sell his equity at a profit. But if his creditors do not see a bright future for the firm, then he will not be able to borrow, and we will end up in a situation whereby more equity will be held by the former senior creditors than is warranted by the face value of their debt. However, unfair as this redistribution of firm value may seem, there is still no scope for ex-post bargaining, as claims have been homogenised, and the new equityholders should still vote for the best bid.5. An Assessment of the AHM Procedure
5.1. The procedure fulfils the objectives of a “good” bankruptcy procedure
In section 2, we outlined some objectives that a good bankruptcy procedure is expected to achieve. To assess the procedure explained in the previous section, we can invoke these objectives to see if they are fulfilled.
First of all the new shareholders, as owners of the reorganised firm, decide its future. Since they have an incentive to vote for an efficient outcome, we can expect a value-maximising outcome. Second, the option scheme ensures that absolute priority is preserved, and that no class of claimant can justify a complaint that some other class of claimant is getting more than its rightful share. Third, the decision-making power is indeed in the hands of the claimants, not in the hands of an outside expert. Finally, although the procedure does preserve the ex-ante bonding role of debt, managers may be able to convince shareholders that they were not responsible for financial
34

Omar Chaudry
distress and that they should hence be allowed to retain their jobs.5.2. The procedure overcomes the major problems
inherent in a structured bargaining scheme
In section 3, we saw that there were two problems associated with a structured bargaining process. The resolution of the first of these was explained in section 4, when we discussed the Bebchuk scheme. We now see how the AHM overcomes the second of these problems.
In Scenario 1, the available alternatives were to liquidate for £80 or continue for £120, and there was the possibility of an inefficient decision being made. Circumstances, now are different because the former creditors are shareholders, and they will want, through voting, to keep the firm going, since they enjoy all of the potential upside gains from continuation. Former shareholders will exercise their options by spending 0.9 and will get a share worth 1.2. The former senior creditors’ claims have been met in full by the former shareholders, and the former shareholders will then vote for a continuation of the firm.
In Scenario 2, the two available alternatives were to liquidate for £80 or to continue for £70, and it was argued that the shareholders may have inefficiently kept the firm going by preventing a liquidation. Under the present setup, however, the shareholders’ options will expire unexercised, (as spending 0.9 will only get them a share worth 0.8 at best) and the former senior creditors, who are now the shareholders in this new firm, will vote for a liquidation and close down the firm.
The final outcome in both cases is the value-maximising choice.5.3. Other Merits
The AHM procedure has a number of other strengths, which can be summarised as follows.
35

The Lahore Journal of Economics, Vol.5, No.2
By allowing both liquidation and recapitalisation/reorganisation, it presents a set of alternatives that encompasses all the options currently available under both Chapters 7 and 11.
We are aware of the fact that cash auctions may not be the best method around if raising cash for a bid proves to be a problem. The AHM procedure, to a great extent, mitigates this problem by allowing non-cash bids.
In Section 3, when automatic financial restructuring was proposed as a possible scheme, it was noted that incumbent management would be left in place unless and until it was removed. Under the AHM procedure, however, no one has the right to manage the firm unless voted in by the (new) shareholders in the reorganised firm. By not favouring the incumbent management within bankruptcy, the ex-ante bonding role of debt is preserved.
6. Additional Issues
In this section some issues that may arise with regard to the implementation of the AHM procedure are considered.6.1 Establishment of claims
Neither AHM nor Bebchuk discuss any method by which the sizes and priorities of creditors’ claims are to be established. They focus solely on the issue of reorganisation. Bebchuk admits that this process may be complex and time-consuming, and that it is only after the claims have been identified that the division process will proceed in an unimpeded manner.6.2. Claims disputes
Given that disputes may arise while identifying claims, is the proposed period of 3 months not too short to allocate shares and options? AHM propose that as long as a reasonable proportion of the claims can be established within the three months, the claims that are established should be taken, shares and options should be allocated
36

Omar Chaudry
on the basis of these claims alone, the vote should be carried out, and the firm should emerge from bankruptcy with the contentious claims still outstanding.6.3. Voting procedures
When the new claimholders in the reorganised firm vote on the future of the firm, then, in the case where there are two bids, the procedure is easy …vote for the higher one. If, however, there are more than two, then the claimholders will have to arrive at a particular decision-making rule with regard to which bid to accept. However, difficulties normally encountered in voting theory are less likely to arise because of the common objective of value maximisation.6.4. Partial bids
The AHM procedure assumes that the bids that are received in the three-month period are bids for the entire firm. However, this may not be the case. If partial bids are received, then it is up to the practitioner to deal with overlapping/inconsistent bids and assemble a menu of options to present to the claimholders. This may be a messy issue to confront.7. Concluding Remarks
Though it is widely believed that capital markets are imperfect, the magnitude of the imperfections, however, remains an issue over which there is a considerable amount of disagreement. While some believe in the negligible nature of these imperfections, and hence consider perfect capital markets to be a reasonable approximation of reality, others believe that these imperfections are significant. In order for a bankruptcy procedure to gain universal acceptability, therefore, it must work well whether or not capital markets are perfect. The virtue of the proposed procedure is that it works well, irrespective of conditions, i.e. in perfect as well as in imperfect capital markets.
The proposed AHM procedure, if implemented, is one that would meet the criteria of a “good” bankruptcy
37

The Lahore Journal of Economics, Vol.5, No.2
procedure, lead to a value-maximising capital structure for the firm, and bring about a significant reduction in the costs associated with reorganisation.
38

Omar Chaudry
References
Aghion, P., Hart, O., and Moore, J., 1992. ‘The Economics of Bankruptcy Reform’. Journal of Law, Economics and Organization, 8:523-46.
Aghion, P., Hart, O., and Moore, J., 1993. ‘A Proposal for Bankruptcy Reform in the UK’. LSE Financial Markets Group Discussion Paper 167.
Aghion, P., Hart, O., and Moore, J., 1994. ‘Improving Bankruptcy Procedure’. Washington University Law Quarterly, 72:811-827.
Bebchuk, L.A., 1988. ‘A New Approach to Corporate Reorganizations’. Harvard Law Review, 101:775-804.
Franks, J., and Torous, W., 1992. ‘Lessons from a Comparison of US and UK Insolvency Codes’. Oxford Review of Economic Policy, 8:70-82.
Gale, D., and Hellwig, M., 1985. ‘Incentive Compatible Debt Contracts: The One-Period Problem’. Review of Economic Studies, 52:647-63.
Gertner, R., and Scharfstein, D., 1991. ‘A Theory of Workouts and the Effects of Reorganization Law’. Journal of Finance, 46:1189-1222.
Hart, O., La Porta Drago, R., Lopez-de-Silanes, F., and Moore, J., 1996. ‘A New Bankruptcy Procedure that Uses Multiple Auctions’. LSE STICERD Discussion Paper 312.
Warner, J., 1977. ‘Bankruptcy Costs: Some Evidence’. Journal of Finance, 32:337-47.
Webb, D., 1991. ‘An Economic Evaluation of Insolvency Procedures in the United Kingdom: Does the 1986 Insolvency Act Satisfy the Creditors’ Bargain?’ Oxford Economic Papers, 43:139-157.
39

The Lahore Journal of Economics, Vol.5, No.2
Weiss, L., 1990. ‘Bankruptcy Resolution: Direct Costs and Violation of Absolute Priority’. Journal of Financial Economics, 27:285-314.
40

Ali Almakky
Deviations from Market Efficiency; Behavioural Explanations and their Validity
Ali Almakky*
I. Introduction
Efficiency of financial markets implies that prices fully reflect all available information rapidly and in an unbiased manner. Thus, market prices should provide an unbiased estimate of fundamental value.
Despite strong empirical evidence supporting this theory, there are questions about its validity. In recent years, a significantly large volume of empirical research has been conducted to show predictability of asset returns using publicly available information. This is popularly referred to as the anomalies literature. These studies used different explanatory variables ranging from fundamental to technical factors and showed evidence of market inefficiency. The results indicate that returns exhibit trends of momentum in the short to medium term and reversal in the long term.
This paper argues for the development of a model that captures aspects of investor behaviour, like overconfidence, in a multi-factor asset pricing model as being the best way to proceed.
This survey has been divided into seven sections. Section-II provides a brief background of market efficiency. Section-III follows with a broad survey of the anomalies literature covering the classic studies along with some very recent work. Section-IV presents the general critique of this literature. Section-V provides a brief overview of some of the key behavioural explanations for the anomalies. Section-VI provides the limitations of the models presented. And finally Section-VII concludes the proposed argument.
* The author has done a Masters in Business Administration (MBA) from the Lahore University of Management Sciences (LUMS) and recently graduated with an MSc in Finance and Economics from the London School of Economics (LSE). He has also cleared two parts of the Chartered Financial Analyst (CFA) examinations.
37

The Lahore Journal of Economics, Vol.5, No.2
II. Market Efficiency
A. Theoretical perspective
The underlying notion of market efficiency has its historic background from the concept of a fair game due to the similarities between financial markets and games of chance. The theoretical underpinnings were provided by Bachelier (1900). This concept is based on martingality, whereby conditional on current information, the expected change in prices is zero. This implies that the best predictor of tomorrow’s price based on all historic information till today is today’s price.
Since Bachelier’s (1900) paper, no theoretical framework unified the “fair game” notion to expected return models until Samuelson (1965). The paper “Proof that Properly Anticipated Prices Fluctuate Randomly” provided the sound theoretical grounding that linked market efficiency to random walk models. This connection laid the grounds for countless empirical research to follow.
Fama (1970) defines a market as efficient if prices “fully reflect” all available information. The time taken for prices to adjust to market information defines the extent of efficiency. Delays would allow market participants to make economic profits based on the information that they have obtained. Jensen (1978) provides an alternate definition: “A market is efficient with respect to information set , if it is impossible to make economic profits by trading on the basis of information set ”.
Using the definitions provided by Jensen (1978) (above) and Roberts (1967), we define:
Weak-form Efficiency: here the information set refers to historic prices or returns which implies that no economic profits can be made based solely on this information.
Semi-Strong Form: In this case includes all public information (including historic prices/returns) available to all market participants.
38

Ali Almakky
Strong Form: Here includes all information, both public and private. Hence, information monopolistically available to certain market participants does not allow them to earn economic profits.
Strong form market efficiency, however, is not empirically possible since it requires that trading and information costs are zero. This point of view was put forth by Grossman and Stiglitz (1980) in their argument for relative efficiency in financial markets. This is based on the premise that if information is costly and if markets fully reflect all information then there is no benefit from gathering information. If, however, no one obtains information then prices will not be able to reflect information. Jensen (1978) found that the empirically feasible form of efficient market equilibrium was where the marginal costs of obtaining information equals the possible benefits that can be derived from acting on that information. If prices fully reflect all available information rapidly then there is no incentive for any of the market participants to collect additional costly information.B. Implications for investing strategies:
There is a direct implication on the success of traditional trading strategies based on Technical and Fundamental analysis. Weak-form efficiency implies that there are no economic profits possible from strategies based on technical analysis and semi-strong form stipulates no gains from pure fundamental analysis. Hence, economic profits from either type of analysis will have implications about market efficiency.C. Empirical tests:
Cowles (1933) conducted the first non-parametric test for efficiency in financial markets. Subsequently a large volume of literature covering empirical tests of market efficiency has evolved based on the link between market efficiency and the Random Walk Hypotheses. This means that the more random the price changes are, the more efficient the market is. The three random walk hypotheses are based on the extent of “randomness” of price changes.
39

The Lahore Journal of Economics, Vol.5, No.2
Research by Lo and McKinley (1988) and Poterba and Summers (1988) has shown that stock prices do not follow random walk models. They show that prices exhibit positive correlation in the short term and negative correlation in the long term. Analysis using the S&P data was conducted and similar results were found. They are attached as annex 1.
The main issue in testing market efficiency is the joint hypothesis problem – testing for efficiency is not possible without assuming some form of equilibrium asset pricing model. A rejection could be due to either a rejection of market efficiency or a bad asset pricing model.
Based on this background, in the next section, an overview of some of the main literature relating to the breakdown of market efficiency is provided.III. Review of Key Market Anomalies Literature
Over the years several studies have documented empirical anomalies which imply that either markets are not efficient or the underlying asset pricing model was inaccurate. This led to detailed scrutiny of asset pricing models such as the Capital Asset Pricing Model (CAPM) by Sharpe (1964) and Lintner (1965). It also led to the development of newer models. In this section a few of the major studies detailing market anomalies are looked at and key findings referred to.A. Importance of Accounting numbers
In their seminal study, Ball and Brown (1968) sought to examine the importance of the release of accounting information (specifically earnings) on stock prices. They looked at both the content and timing of earnings announcements and their impact on stock prices. Under their null hypothesis of market efficiency; all information, like the release of earnings data should be immediately reflected in prices. They forecasted earnings based on a time series process and separated firms into “good news” (positive difference between actual and forecasted earnings) and “bad news” (negative difference) categories. They used S&P data for
40

Ali Almakky
the period 1946-66 and formed ten portfolios based on the degree or earnings surprises.
They found that about 50 per cent of all firm-specific information was contained in accounting data and between 85-90 per cent of that information was contained in prices already. Their analysis concluded that if earnings were higher than predicted (good news firms), abnormal earnings could be made. They found a low but statistically significant co-movement between earnings and stock prices. It is however difficult to conclude whether this relationship is due to a direct reliance of investors on earnings data or whether earnings are correlated with information that also affects security prices.
Most of the information contained in reported income is anticipated by the market before the annual report is released. The anticipation is so accurate that the actual income number does not appear to cause any unusual jumps in the share price in the announcement month. the drift upwards or downwards begins at least 12 months before the report is released and continues throughout the year and for approximately one month after the release of the report.
Subsequent to this study, several similar studies [e.g. Ou & Penman (1989)] have been conducted using different accounting and market based variables. They all lead to the same conclusion of the existence of a post-announcement drift implying market inefficiency.B. Price/Earning (P/E) Ratio Effect
Basu (1977) first analysed the informational content of P/E ratios. His sample included over 1400 NYSE stocks over the period 1956-71. He grouped stocks into 20 portfolios based on firms with the highest P/E and so on. He assessed portfolio performance at each year end and formed similar portfolios at the beginning of each following year.
Basu (1977) found risk adjusted returns on portfolios of low P/E stocks higher than those for high P/E stocks. He also studied incremental returns of low P/E stocks after
41

The Lahore Journal of Economics, Vol.5, No.2
adjusting for incremental search and transaction costs and differential tax rates. After these adjustments, the difference in risk adjusted returns between high and low P/E portfolios was not statistically different from zero.
He concluded that the “informational content” in P/E ratios is not “fully reflected” in security prices. This conclusion violates the efficient market hypothesis.
Other studies leading to similar results about the importance of the P/E Effect include Jaffe, Keim and Westerfield (1989), Chan, Hamao and Lakonishok (1991) and Fama and French (1992).C. Size Effect
Banz (1981) found that size, measured by the market value of a company, is an important factor in explaining returns. This study was based on NYSE data for the period 1936-75. He used firm size as an explanatory factor. The size factor was based on the difference between the firm size and the average size of a firm on the NYSE. The coefficient of the size factor was zero under the null hypothesis.
Based on the results, he rejected the null and showed size to be a pervasive factor over the entire 40 year sample period in explaining returns. The relationship between size and return is strongly negative and non-linear as the difference in return between the average and large firms was negligible. This, again, is evidence of inefficiency.D. Investor Overreaction to Information/Contrarian Strategies
DeBondt and Thaler (1985) (DT) explained market behaviour and investors’ individual decision making psychology by testing their belief that investors overreact to new information. They believe “individuals tend to overweight recent information and underweight prior data” in violation of rational views which were based on Bayes’ rule.
42

Ali Almakky
They only based decisions on past prices and returns. The two testable hypotheses formulated were (a) extreme movements in stock prices would be followed by subsequent extreme price movements in the opposite direction and (b) the more extreme the initial price movement, the greater the impact of the subsequent adjustments.
They used NYSE data between 1926-82 and divided portfolios into “winner” and “loser” portfolios based on the stock’s previous performance. They focused on stocks that experienced either extreme capital gains or losses over a period of up to 50 years. If the efficient markets hypothesis holds, there should be no excess returns from these portfolios.
Their results showed that loser portfolios outperformed winner portfolios by approximately 25 per cent over a 36 month time horizon. One noteworthy aspect of these results is that the excess returns on the loser portfolios were earned primarily between the 13th and the 36th month after formation.
Also, using stock beta as a measure of risk (i.e. assuming validity of the CAPM), loser portfolios were found to be less risky. Hence, they rejected the null hypothesis and concluded that in fact investors do overreact to information presenting a violation of weak form market efficiency. This study has been tested by several others including Chopra, Lakonishok and Ritter (1992) and has successfully stood its ground.
Similarly Lakonishok, Shleifer and Vishny (1994) (LSV) use fundamental factors to form portfolios rather than past price/returns data. They attempt to prove that “value” investing, (i.e. picking shares whose price is low relative to fundamental factors), can earn abnormal returns. They form portfolios using rankings of fundamental factors (like earnings, dividends, book value of equity and cash-flows). Those with low prices relative to fundamental factors were called “value” portfolios. Portfolios with stocks whose prices are high relative to fundamentals were called “glamour” portfolios.
43

The Lahore Journal of Economics, Vol.5, No.2
The data set used was NYSE for the period 1960-90. Portfolio returns were evaluated on over a 5-year horizon. Actual growth rates of fundamental factors were found to be lower than market expectations for glamour stocks and higher than market expectations for value stocks. Their results show value-portfolios to earn size adjusted excess returns (over glamour-portfolios) of about 10-11 per cent per annum. Value-portfolios were less risky using measures like beta and standard-deviation.
This leads us to question why returns to value strategies persist. Possible explanations are; (a) individuals actually make errors in their forecasts which they extrapolate too far into the future leading to overvalued glamour/winner stocks; (b) institutional investors prefer glamour/winner portfolios as they appear to be prudent investments making them easier to justify to clients in case of market downturn; and (c) most investors enter the market with shorter term investment horizons that the minimum required (3-5 years) for a successful value strategy.
La Porta et al. (1997) find evidence of overreaction in glamour and value-stocks defined using accounting variables. Specifically, glamour-stocks earn negative returns on the days of their future earnings announcements, and value-stocks earn positive returns. This evidence suggests that value or contrarian strategies earn excess returns as investors base their decisions by weighing recent information more heavily than past data implying market inefficiency.E. Investor Under-reaction to Information/Momentum Strategy
Seemingly contradictory results were obtained by Jagadeesh and Titman (1993) (JT). They tested an investment strategy based on buying winners (stocks that earned excess returns over the past 1 to 4 quarters) and selling losers (stocks that performed poorly over a similar period) using NYSE data for the period 1965-82. They formed zero-cost portfolios based on the difference between the winner and loser portfolios and track returns
44

Ali Almakky
over time. Under the efficient markets hypothesis the returns to these portfolios should be zero.
Their results indicate the momentum strategies earn excess risk adjusted returns over a three to twelve month period. The excess returns are reversed over the following 24 month period. This is driven by the market’s short-term failure to recognise shifting trends. JT, claim that investors following the proposed strategy cause prices to move away from their long-run values temporarily thereby causing overreaction. Alternatively, markets may be under-reacting to information about short term prospects but overreacting to information about long term prospects, presenting another violation of market efficiency.F. Importance of Book Value to Market Value Ratio (BV/MV)
Fama and French in their 1992 and 1993 papers run multi-factor models to explain stock and bond market returns over the period 1963-90. They use this data to form 25 portfolios sorted on both size and value based on the finding of low interaction between the two variables.
They conclude that used alone or in combination with other variables, beta does not have enough explanatory power. When used alone BV/MV, size and leverage have explanatory power implying that these factors capture cross sectional variation in average stock returns. Their results validate the value/glamour stock prediction.G. Informational content in analysts’ forecasts
Barber et al. (2000) provide an empirical study covering over 360,000 analyst recommendations from 269 brokerage houses over the period 1986-96. They form portfolios of stocks ranked on the average of consensus recommendations of analysts in terms of most recommended and so on. They follow a strategy of buying most recommended stocks and selling least recommended stocks and rebalancing the portfolio daily based on new recommendations.
45

The Lahore Journal of Economics, Vol.5, No.2
Their results show the possibility of earning abnormal returns (4.13 per cent, after controlling for market risk, size, book-to-market, and price momentum effects) using this strategy, but it requires high trading levels. After accounting for transaction costs the abnormal returns are not significantly different from zero. Overall their results show that there is some informational content in analysts’ recommendations leading to a violation of market efficiency.
Similarly distinguishing risk and overreaction, La Porta (1996) sorted stocks using long-term growth rate forecasts of professional analysts and found evidence that their views were excessively bullish about stocks they were optimistic about and excessively bearish about stocks about which they are pessimistic. Furthermore, stocks with high growth forecasts earn negative returns when they subsequently announce earnings, and stocks with low growth forecasts earn high returns. This points to overreaction by analysts and also in prices, implying a violation of market efficiency.H. Technical Analysis
Several studies have been conducted to analyse the usefulness of technical analysis, in effect testing the weak form efficient markets hypothesis. Initial studies indicated that wen accounting for transaction costs, technical trading rules did not produce superior returns to passive buy and hold strategies.
A study by Brock, Lakonishok and LeBaron (1992) use simple technical analysis techniques of using moving averages and trading range breaks on the Dow Jones Industrial Average data for the period 1897-1986. Moving average rules generate buy/sell signals based on when a short-period moving average exceeds/goes below the long-period moving average. Trading range breaks refer to rules that base buy (sell) signals on price going above (under) the resistance (support) level.
Their results show that using the above strategies, buy signals outperform the normal returns. Also, following a buy signal generated by these rules, the market
46

Ali Almakky
increased at an annual rate of 12 per cent whereas following a sell signal the market decreased at an annual rate of 7 per cent. They found evidence that technical rules have predictive power however they did not incorporate transaction costs in their analysis.
They concluded that there could potentially be some form of non-linear relationship between stock prices/returns over times that more complicated trading rules could exploit. Hence contradicting the efficient markets hypothesis.I. The Paradox
In trying to reconcile the results of overreaction (DT) leading to contrarian investment strategies and that of trend extrapolation [Brock Lakonishok and LeBaron (1992)] leading to positive feedback strategies, we should look at the results of JT and Poterba & Summers (1988).
As mentioned earlier, negative correlation has been documented by Lo and McKinley (1988) and Poterba and Summers (1988). Both find that returns over longer periods are negatively correlated between –0.25 to –0.40 over three to five years and returns are positively correlated over shorter time periods. Both results, however, lack statistical power but potentially indicate a violation of market efficiency. Hence, contrarian strategies work in the long term whereas the trend extrapolation strategy (momentum) works in the short term. Some of the other major related studies are listed in annex 2.J. Excessive Volatility
This argument was put forth by Shiller, R. (1981) where he compares the low volatility in fundamentals (namely dividends) to the excessive volatility of stock prices, and concludes that this is evidence of market irrationality. Defining perfect foresight prices as prices that would prevail with constant realised returns, Shiller argues that the variance of the perfect foresight price should be greater than the variance of the actual prices. This relationship implies that stock prices should be less volatile than (the appropriate transform of) fundamentals
47

The Lahore Journal of Economics, Vol.5, No.2
(i.e. dividends) as the perfect foresight price is just a smoothened version of the dividend stream.
Shiller, R. (1981) used this methodology on the US stock market. He used S&P annual data from 1871-1979. He found the standard deviation of the actual S&P price data to be 50.1 whereas the standard deviation of the perfect foresight price was 8.9. This is an unambiguous violation of the variance bound implying market irrationality. Similar methodology was used in the US, UK and Japanese markets (amongst others) and similar results of irrationality were found.
Shiller, R. (2000) echoes similar views where he compares the increases in stock markets with the changes in basic economic fundamentals such as income, GDP and corporate earnings. He provides a detailed list of the behavioural factors that have resulted in the recent exuberance in the US stock markets. These have been presented in annex 3.
In the following section I provide a review of the criticism of the above mentioned studies.IV. Anomalies Explained: Review of Critique of the Anomalies Literature
A. General Issues
Some of the main counter argument relates to the model mis-specification and the joint hypothesis problem. This problem exists for all the studies presented. The problem is exacerbated by these long term studies due to the assumption of normality of asset returns. While this is valid for short time periods, it is empirically unreasonable for long term returns as they exhibit fat fails. Another problem is the lack of validation of these asset return models over long time-periods.
One major issue relates to data snooping, wherein researchers use information from the data, to guide research, on the same or related data. This leads to results not being valid out of sample. Another issue is that of
48
Ali Almakky
survivorship bias due to data availability automatically excluding companies that fail.
Fama (1998) (detailed below) shows that by using different rational asset pricing models, like the Fama and French’s (1996) three factor model with differing factors, eliminates most of these violations. The only study found to be robust to changing asset returns models is the Ball and Brown (1968). Fama’s (1998) view is that since overreactions are as common as under reactions this implies that both over-and under-reactions are chance events and that markets are in fact efficient. A list of the major studies separated by their results of both under and overreaction are listed in annex 4.
Yet another contentious aspect is that, with a few exceptions, testable alternative hypotheses are not specified in this literature. With an ambiguous alternate hypothesis like market inefficiency, it is next to impossible to test whether for example with the overreaction anomaly, under-reaction could also result.
49
The Lahore Journal of Economics, Vol.5, No.2
B. Specific Issues
There is a vast amount of literature which followed the key studies mentioned earlier. Here, I seek to summarise some of the main concerns;
Banz, (1981) and Reinganum, (1981) find P/E to be a proxy for size and hence conclude that the P/E as a factor is not priced. This implies that low P/E firms tend to be small. An explanation for size effect is with less information available about small caps, investors require higher returns. This problem, however, is not “visible” in an asset pricing model.
Campbell, Lo and McKinley (1998) explain the success of contrarian strategies through a lead lag correlation of returns between large and small companies. They find that the correlation between current returns of small stocks and past returns of large stocks are greater than the correlation between the current returns of larger stocks and past returns of smaller stocks. This cross effect, they claim, is the cause rather than the reversal of long term returns.
A popular criticism of DT is based on closer analysis of the success of loser portfolios being concentrated in the month of January only. It is questionable that this necessarily implies investor overreaction. Fama and French (1992, 1996), on the other hand argue that using the appropriate measure of risk, glamour stocks are less risky than value stocks.
C. Multi-factor Explanations
Fama and French (1996) find that some of the anomalies listed can actually be explained through a rational asset pricing model without having to rely on behavioural explanations. In their three factor model they find that they are able to explain the anomaly of long term return reversals of DT and LSV.
The model, however, is not able to explain the short-term momentum results of JT. The factors that they
50

Ali Almakky
propose include size, earnings to price ratio, cash flow to price ratio, book value to market value ratio, past long-term returns and past short term returns.
They find priced risk factors that explain the difference between the returns of winner and loser portfolios. Hence their view is that an explanation to the entire anomalies literature can be provided through a correctly specified rational asset pricing model.D. Excess Volatility
Shiller, R. (1981) sparked a huge debate and led to significant research in the area. One criticism of his views was presented by Flavin (1983, who said that due to the higher level of auto-correlation in the foresight prices (leading to a downward bias) and the finite sample, the variance bound will be violated. Kleidon (1986) used Monte Carlo experiments and showed that the variance bound was violated in approximately 90 per cent of cases. Marsh and Merton (1986) argue that managers use dividends to signal permanent earnings and hence dividends are set based upon past prices implying a reversal of the variance bound.E. Implication for argued approach
Based on this analysis it is clear that further research needs to be targeted toward the development of better asset pricing models. This could lead to a significant reduction in the anomalies reported. Fama and French’s (1996) approach of developing multi-factor asset pricing models is a step in the right direction even though its results were found to be inconclusive.
In the following section I analyse the various behavioural models that have been developed to explain these anomalies.V. Alternate Explanations: A Look at Behavioural Models
Slovic, P. (1972), a psychologist, provided the basis of behavioural finance. He claimed that all market players
51

The Lahore Journal of Economics, Vol.5, No.2
are vulnerable to committing huge mistakes because of the way they try to predict financial outcomes. It, however, is not just that they are prone to error, but the reasons as to why they are prone to error that are important. He finds market players are likely to be overconfident in the accuracy of their own judgement. Further studies show the marginal increase in accuracy of investor forecasts with additional information to be far lower than the marginal increase in their confidence level, implying susceptibility to overconfidence.
Shefrin Hersh (1999) provides this perspective – “It is really behavioural finance that ultimately will tell you why a particular trading rule is likely to work……if you are looking for abnormal returns, then you have to be using the right technical trading strategies.”
Modern finance assumes investors to behave with extreme rationality. Empirical evidence, however, proves otherwise and deviations from rationality often seem systematic. Behavioural finance relaxes these traditional assumptions by incorporating observable systematic departures from rationality into models of financial markets. Next, some of the key behavioural models and theory in attempting to explain anomalies are presented.A. General Views about Behavioural Finance
Shefrin, H. (1999) challenged the assumptions of traditional finance and showed alternate behavioural explanations. He argued that both psychology and fundamentals have an effect on market prices and investing behaviour. He showed, contrary to common belief, that investors are not driven by greed and fear, but by hope, overconfidence and the need for short-term gratification. He claims that since it is common for humans to make mistakes, both individual and institutional investors make the same mistakes repetitively.
The following quote accurately summarises the general view about the subject – “Behavioural finance is everywhere that people make financial decisions. Psychology is hard to escape; it touches every corner of the financial landscape, and it’s important. Financial
52

Ali Almakky
practitioners need to understand the impact that psychology has on them and those around them. Practitioners ignore psychology at their peril.”
A practitioner’s viewpoint is presented in annex 5.B.Barberis, Shleiffer and Vishny (1998) –
“A model of Investor Sentiment” (BSV)
BSV attempt to explain the empirical phenomenon of over/under-reaction by investors through a model with judgement biases. The model is based on two judgement biases found in cognitive psychology;
Conservatism [Edwards (1968)]: implying a failure to accurately aggregate information in new earnings numbers with investors’ own prior information to update an earnings estimate; and
Representativeness bias of Kahneman and Tversky (1974): wherein investors disregard the fact that a history of high earnings growth is un likely to repeat and end up overvaluing.Their model is based on a single representative
consumer and a single asset that pays out 100 per cent of earnings as dividends. BSV assume earnings to follow a random walk, however, this empirically unjustified assumption does not alter their results. The investor is assumed to be unaware of the actual earnings process but believes the existence of one of two regimes, each with a different model determining earnings. Neither follows a random walk.
Regime-1: Earnings are mean-reverting-Model 1. This captures the momentum impact as documented by JT and delays in the response of stock prices to earnings announcements as shown by Ball and Brown (1968). Earnings are mean reverting and any shocks are temporary.
Regime-2: Earnings trend, i.e., after an increase further increases are likely-Model 2. This captures long-term reversals of DT and contrarian strategies of LSV.
53
The Lahore Journal of Economics, Vol.5, No.2
As underlying process is Markov, the occurrence of either regime depends only on the regime last period. Investors believe that Regime 1 is more likely to materialise than Regime 2.
For security valuation, the investor forecasts earnings based on earnings observed to date and his beliefs about which regime has generated earnings based on the regime-switching model. The investor uses the same model with the same regimes and probabilities throughout the forecast period.
Model-1: Due to the martingality of the earnings process, prices will show a delayed response and the investor will under-react to earnings changes (i.e. average return following a positive shock is greater than the average return following a negative shock) implying consistency with the conservatism bias.
Model-2: Based on earnings changes of the same sign, investors expect earnings to trend and will extrapolate this into the future causing prices to over-react which is consistent with the representativeness bias.
Based on the switching between the two regimes, the model is able to explain both anomalies of over-and under-reaction.C.Daniel, Hirshleifer, and Subrahmanyam, (1998) “A
Theory of overconfidence, self-attribution, and security market under- and over-reactions, (DHS)
DHS also uses concepts from psychology to explain investor over/under reaction. DHS divide investors into two groups – informed and uninformed. The uninformed have no biases. Informed investors have two biases namely, overconfidence and self-attribution.
In equilibrium, prices are determined by informed investors. Due to overconfidence they amplify their belief about the precision of their private estimate of stock value. Self-attribution leads them to discount public signals about value, especially when these signals oppose their own private estimates.
54

Ali Almakky
This overreaction to private information and under-reaction to public information will lead to short-term continuation and long-term reversals as public information eventually overcomes the behavioural biases over time. DHS also look at “selective events” which relate to instances where advantage can be taken of stock mis-pricing. Examples cited include announcements of a new stock issue when a stock price is high, or share repurchase when price is low. This public signal produces an immediate price reaction that absorbs some of the mis-pricing. This would lead to momentum; i.e. stock returns after an event announcement will tend to have the same sign as the announcement period return. This model also explains both anomalies of over/under-reaction.D. Hong and Stien (1998) “A Unified Theory of
under-reaction, Momentum Traidng and Overreaction in Asset Markets” (HS)
HS look at the impact of interaction between heterogeneous agents rather that the particular cognitive biases. The main assumptions behind their model are:
Only two distinct groups; namely “newswatchers” – who forecast based on private information and do not condition on prices and “momentum traders” –who condition on price history;
Agents are boundedly rational – they use only a subset of all available information; and
Private information is diffused gradually across the newswatchers.Using these assumptions DHS compare price
behaviour by analysing interaction between agents. They look at extreme cases where only newswatchers trade and conclude that prices will adjust slowly to new information and the investors will under-react. In this scenario over-reaction is not possible. Momentum traders, on the other hand, base decisions only on price history up to one period ago, causing prices to overreact. Equilibrium will occur based on trade between these two agents.
55

The Lahore Journal of Economics, Vol.5, No.2
Their results indicate both short-run continuation and long-run reversals will be more pronounced for securities for which information is disseminated more slowly (have smaller stocks or those with lower analyst coverage). Equilibrium conditions suggest that information that was initially private is more likely to cause overreaction by investors rather than public information.
HS find that the relationship between the momentum trader’s investment horizon and the pattern of return auto-correlation is that the shorter the investment horizon, the faster the auto-correlations begin to turn negative. hence, this model is consistent with the over and under reaction evidenced earlier.E. Investor Overconfidence
Barber and Odean (2000) study the differences in investing habits of men versus women. This study is based on the hypothesis that overconfident investors trade excessively. This hypothesis was tested by Odean (1998). Over-confident investors are those who overestimate the precision of their knowledge about the value of a financial security.
Rational investors are expected to trade and purchase information only if this would increase their expected utility. Overconfident investors lower their expected utility by trading more and buying more information than rational investors with the same degree of risk-aversion.
To test this they use account date for 37,664 households from a large discount brokerage and segregate investors on gender. They find that in areas like finance which are dominated by men, men are more overconfident leading them to predict that men will trade more than women. Their results show that between February 1991 and January 1997, men trade 45 per cent more than women. This excessive trading results in additional trading costs reducing men’s returns by 2.65 per cent as compared to a 1.72 per cent cost for women. They also find that women turnover their portfolio approximately 53 per cent annually versus men who
56

Ali Almakky
turnover approximately 77 per cent. Since this difference can only be explained by rationality if the men earned higher returns than the women, which they found to be untrue, hence they argue in favour of their behavioural explanation. Overall they find that individuals turnover 70 per cent annually.
Carhart (1997) finds similar results for mutual funds. Both show that individuals and mutual funds that trade most earn the lowest returns. They argue that this can only be explained by overconfidence.
Odean and Gervais (2000) layout a multi-period market model describing both the process by which traders learn about their own ability, and how a bias in this learning can lead to overconfidence. The show that both volume and volatility increase with the degree of a trader’s overconfidence and that they behave sub-optimally earning lower profits. Based on this model they show that a simple bias in self evaluation is sufficient to create equilibrium market conditions with overconfident investors.F. Institutional Investors
Institutional investors are believed, by some, to cause irrationality in prices due to herding and positive feed back trading strategies. As, in aggregate, these players hold a large proportion of the total market, the impact of such characteristics on the market could be large. According to Schwartz and Shapiro (1992) institutional investors own about 50 per cent of total equities in the US.
Herding, (correlated movement in prices across institutions), occurs because information about institutional trades is openly known amongst institutions whereas information about individuals is not freely known. Also, as money managers are evaluated against each other there is a tendency to hold similar portfolios in trying not to miss out on any opportunities others may have had. Another factor is that most institutions react similarly to market signals and hence may tend to herd. Evidence of herding per se may not necessarily imply
57

The Lahore Journal of Economics, Vol.5, No.2
price instability. Herding may help prices to adjust quicker to fundamentals. Institutional herding can also have a stabilising effect if they offset irrational decisions of individuals.
An empirical study conducted by Lakonishok, Shleifer and Vishny (1992) looks at the quarterly portfolios of 769 funds over the period 1985-89. No evidence of herding was their null hypothesis implying that changes in holdings of particular stocks would be evenly split or that a proportionate number of money managers would be buying or selling a particular security. They found that 52.7 per cent of the money managers were changing their holdings of a security in one direction and 47.3 per cent in the other. Based on tests for stocks of different sizes, they found more evidence of herding in small stocks but the overall evidence was not strong enough to reject the null.
Positive feedback trading consists of strategies of buying past winners and selling past losers. Such a strategy could destabilise prices as institutions would buy overpriced securities and sell under priced ones, causing prices to move further away from fundamental values. In the same study evidence for positive feedback trading was evaluated by comparing excess demand (purchases minus sales) for winners and losers. Results indicate positive feed back trading for smaller stocks (excess demand –18 per cent of value for losers and 3.6 per cent for winners). Similar evidence for larger stocks was not found. Hence, the null of no evidence of positive feedback could not be rejected.
58

Ali Almakky
G. Implication for argued approach
Empirical studies have found the evidence of overconfidence which casts doubt on the validity of the investor rationality assumption which cannot be ignored. Also, there are several success stories about market practitioners making long term economic profits by using behavioural strategies.
Both these findings provide evidence contrary to the approach followed by modern financial economics. This shows that, despite criticism against behavioural finance (presented in the next section), there is a need to explore this approach further.VI. Irrationality?: Assessing the Validity of Behavioural Models
Fama (1998) provide an evaluation criteria – “any new model should be judged on how it explains the big picture. The question should be: Does the new model produce rejectable predictions that capture the menu of anomalies better than market efficiency? For existing behavioural models, my answer to this question (perhaps predictably) is an emphatic no.”
Looking at the BSV and DHS models, in using judgement biases they are also assuming homogeneity among consumers in that they are unable to distinguish the extent of the judgement biases for each type of investor. This can potentially lead to investors with significantly differing degrees of risk aversion being grouped together with the same degree of judgement bias.
All three models analysed (including HS) share similar problems with respect to empirical testing. They are only able to explain the anomalies that they are designed for and do not present a general equilibrium perspective. These models and the other behavioural literature are unable to explain the size effect.
Looking at the criteria proposed by Hong & Stien (1998) stating that a model should:
59

The Lahore Journal of Economics, Vol.5, No.2
a) Be based on empirically plausible assumptions about investor behaviour;
b) Explain the existing evidence; andc) Make predictions for “out-of sample” testing.Using this criteria for both BSV and DHS models (due
to their judgement biases of conservatism and overconfidence respectively) they predict long term reversals where as the empirical evidence indicates momentum is equally likely for certain anomalies like IPO studies [Ritter (1991)]. While they explain some anomalies, they cannot explain others, hence failing on counts (b) and (c) above.
Overall the performance of behavioural finance in explaining anomalies seems to be rather selective. Some models are able to explain certain anomalies but not others. There is no model that is able to provide an overall picture for an equilibrium asset pricing relationship. Hence the crucial test for these models remains their robustness in out of sample data.VII. Conclusion
The studies covered in this paper indicate predictability of asset prices based on public information. The problem that needs to be addressed is (a) whether anomalies exist due to a bad-model and (b) whether the assumptions of rationality are too strong to explain the observed behaviour of investors.
With respect to the bad-model issue, empirical studies show that traditional models like the CAPM and ICAPM are unable to explain stock returns. This does not imply that no rational asset pricing model can explain stock returns. The work of Fama and French (1996), although not conclusive, is a clear step in this direction. It explains away certain key anomalies but fails on others.
On the other hand behavioural finance theory relaxes the traditional assumptions of financial economics incorporating departures from rationality and presents
60

Ali Almakky
intuitively appealing and in some cases interesting approaches to explaining these anomalies. These models presently provide inconclusive explanations to all the existing anomalies and fail on the same counts as the rational models (e.g. size effect). However, even if such a model is developed (which is not unlikely), its robustness in out of sample tests and its ability to address the concerns of the previous section will remain major issues. Furthermore, would such a model provide a valid asset pricing relationship? On the whole, current behavioural finance selectively provides only an interesting alternative to explaining asset pricing anomalies.
Importantly the message conveyed is that the empirical violations of rationality assumptions and those of the failure of behavioural models in explaining anomalies cannot be ignored. Based on this analysis, I argue that the only workable model will be one that incorporates investor behaviour, like overconfidence, in a multi-factor asset pricing relationship. This is an area for further research.Annex-1: Empirical Tests Results
Test for market efficiency
Background:
The random walk hypotheses imply that variance is a linear function of the time lag (q). Using this relationship, the Variance Ratio (VR) test was developed. Linearity means that, for example, the one month variance in returns is four times the weekly variance. The general q period VR test statistic is:
VR(q)
Var [ r t( q )]
q .Var[rt
]
= 1 + 2
q-1k=1
1 – kq P(k)
where rt is the log returns and p(k) is the kth order auto-correlation coefficient of rt. The null hypothesis test is that returns follow a random walk meaning that VR is not statistically different from 1.
61

The Lahore Journal of Economics, Vol.5, No.2
Test:
The sample used was S&P weekly closing data (value weighted index) for the period January 03, 1966 to June 19, 2000. Weekly data was chosen to avoid the biases caused by the bid-ask spread, non-synchronous prices and non-trading. Both weekly and monthly VRs were calculated.The results are as follows:
nNumber q of base observations
aggregated to form variance ratio2 4 6 8
VR - Weekly
1,798 1.15 1.24 1.13 1.34
Test statistics*
2.66 2.34 2.02 1.45
VR – Monthly
449 1.03 1.16 1.09 1.13
Test statistics*
1.73 0.87 0.76 0.78
*Note: Test statistic values in boldface indicate that they are statistically different from 1 at the 5 per cent level of significance. The critical value at the 95 per cent level of confidence is 1.96.
The results indicate that using weekly VR the values are all significantly different from 1 (except for q=16) indicating a departure from the random walk hypothesis. Based on the understanding that, for any stationary time series, the population value of the variance ratio statistic VR(2) is simply one plus the first-order auto-correlation coefficient as,
VR (2)= Var[rt(2)]
2 Var [rt]
=Var [rt + rt-1]
2 Var [rt]= 2 Var[rt] + 2
Cov[rt,rt-1]2 Var [rt]
= 1+ p (1)
Hence, this shows that the first order auto-correlation coefficient is approximately 26 per cent. The
62

Ali Almakky
VR is increasing in q but the test statistic values are not. This positive correlation is significant for the entire sample. Monthly numbers (VR of eight week returns to four week returns) indicate the only statistically significant value as the one month period value.Conclusion
The results indicate a rejection for the random walk hypothesis over weekly returns and acceptance over monthly periods. This is consistent with other studies such as Lo and McKinley (1988). The rejections are weaker than those found using an equally weighted index.
63

The Lahore Journal of Economics, Vol.5, No.2
Annex-2: Other Anomalies
Several other studies have been conducted which have looked at various other market anomalies. Amongst the numerous studies, listed below are some of the major ones: Asquith (1983) and Agarwal, Jaffe, Mandelker (1992)
find returns to investors from companies that merge are statistically significantly negative over a five year period following merger.
Loughran and Ritter (1995) conclude that over a five year period the returns to investors from buying share of companies that have had an initial public offering (IPO) or a seasoned equity offering (SEO) are only 70 per cent of those earned by investors following a passive buy and hold strategy on stocks of similar risk.
Mitchell and Stafford (1997) show that SEO’s have strong stock returns prior to issue.
Bhandari (1988) finds a positive relationship between return and leverage.
Litzenberger and Ramaswamy (1979) find that a significant positive relationship exists between the dividend yield and stock returns over their period 1936-77. Sorenson and Williams (1983) also find similar results.
Michaely, Thaler and Womack (1995) find firms that initiate dividends have positive abnormal stock returns while firms omitting dividends have negative abnormal return.
Rosenberg, Ried and Lanstien (1985) and Stattman (1980) provide evidence of a positive relationship between prices and book to market equity. This implies that shares with low Price to book value experience higher subsequent growth than shares with high price to book ratios.
64
Ali Almakky
Studies by Desai and Jain (1997) and Ikenberry, D. Rankine, G. Stice E. (1996) conclude that positive abnormal returns of about 7 per cent are recorded on securities that have had stock splits.
Lakonishok and Vermaelen (1990) find positive abnormal returns for companies that tender for their stock.
65

The Lahore Journal of Economics, Vol.5, No.2
Annex-3: Behavioural Explanations Exuberance in US Stock Markets
Shiller, R. (2000): Irrational Exuberance The arrival of the internet and the economic revival; the
reversal of the economy combined with the market sentiment about the impact of the internet on businesses.
Decline of foreign rivals and their systems; Break-up of Russia, failure of the communists system, the economic crash of Japan, the opening up of China leading to increased confidence in US markets.
Increase in Materialistic Values; increasing views of people equating success and happiness to money has led them to move to relatively high risk avenues of investing in stock markets rather than low yield fixed income instruments.
Cut in the capital gains tax; the recent cut and the expectation of further reductions cause investors to hold on the their realised gains for longer and not sell.
Increase in media reporting of financial news; media now closely follows financial events leading to greater information and increased awareness of consumers causing more interest in stock markets.
Increase in the optimism of analysts forecasts; Over the years analysts views about company performance have become more optimistic due to potential conflict of interest issues such as the same company not providing other forms of business or new information to the researcher subsequent to a poor review.
Increase in defined contribution pension plans; due to increases in defined contribution plans investors have had to make more active investment decision rather than leaving it to their employers. this increased interest has caused them to take a more active role in the stock markets.
66

Ali Almakky
Growth of mutual funds; subsequent to the failure of investment schemes in the crash of 1929 and their revival under the trusted name of '‘utual'’ investors have a lot more confidence in them, leading to increased interest in the market.
Decrease in inflation; has the effect of making people believe that these are “good times” leading them to be more bullish than would be.
Increase in trading volumes and declining transactions costs; with a large proportion of the public investing and innovations like internet trading is making trading both convenient and cheap leading to increase volumes.
Increased opportunities and volume of gambling; with the legalisation of gambling and the development of schemes promoting such activities, investors feel encouraged to take on games of chance including investments in the financial markets.
67

The Lahore Journal of Economics, Vol.5, No.2
Annex-4: Two Classes of Anomalies Literature
OverreactionAuthors Anomaly Reported
DeBondt & Thaler (1985) Winner v/s. Loser Portfolios
Lakonishok, Shleifer, & Vishny, (1994)
Glamour v/s. Value
Ritter (1991) Initial Public OfferingsLoughran & Ritter (1995)Loughran & Ritter (1995)
Seasoned Public Offerings
Spiess & Affleck-Graves (1995)Mitchell & Stafford (1997)Dharan & Ikenberry (1995) New Index Listings
UnderreactionAuthors Anomaly Reported
Ball & Brown (1968) Stock Prices and EarningsBernard & Thomas (1990)
Jagdeesh & Titman (1993) Momentum EffectCusatis, Miles & Woodridge (1993)
Divestiture
Desai & Jain (1997) Stock Splits
68

Ali Almakky
Annex-5: Behavioural Finance – A Practitioners Viewpoint
Excerpts from Article titled “Behavioural Finance – Institutions are human too” written in Neuberger Berman Management Inc. Research Review.
“… people base their decisions on their perceptionswhether these come from anecdotal evidence, their own experience, or “rules of thumb.” Individual perceptions are often flawed, because of something called the “framing effect.” In other words, the way in which a choice is framed influences the individual’s decision-making. Financial matters are not so different. An enlightening study in 1996 showed that people allocate their defined contribution plans between stocks and bonds depending largely on which historical information they see.
..One might expect institutional investorshighly trained professionals, often working in groupsto be more rational than individuals. To put it bluntly, they’re supposed to be the “smart money.” Think again. Shefrin and Statman noted in an article in a 1984 issue of the Journal of Financial Economics …examines a number of behavioural factors to explain the preference for dividends-for instance, the importance of self-control, …… Investors fear that once they begin selling stock to finance consumption, they will continue to sell stock until they have depleted their capital. They hope that limiting their spending to the dividend stream will help them maintain self-control.
Both growth and value investors can use behavioural finance to their benefit. Neuberger Berman’s Rick White, … says. “People tend to chronically overpay for glamour and excitement and at the same time they tend to chronically underpay for prosaic businesses over longer periods of time.” ….White sees behavioural finance as fundamental to value investing, but growth investors also use behavioural finance to their advantage. Numerous academic studies have shown the impact of human behaviour on the formation of prices for growth stocks.
69
The Lahore Journal of Economics, Vol.5, No.2
“Overall, our evidence suggests a price formation process in which the market systematically under-reacts to recent news and overreacts to longer-term (older) news,” write Cornell University professors Bhaskaran Swaminathan and Charles M.C. Using such behavioural under reaction to positive news.
Behavioural finance does not purport to explain why value stocks, growth stocks, or any other category outperform others during a given period. Behavioural observations also hold some potentially valuable lessons for how defined contribution plan sponsors can structure those plans and educate their participants. Of course, the vast majority of pension sponsors profess to be “prudent” investors, following rational, soundly thought-out strategies to achieve the highest possible returns for the least risk. Traditional economists have long argued that market psychology is largely irrelevant, because investors are “rational maximisers” who aim to maximise something-probably profits-and rationally pursue that objective.
70

Ali Almakky
References
Agarwal, A. Jaffe, Mandelker, G., 1992, “The post-merger performance of acquiring firms: a re-examination of an anomaly” Journal of Finance 47, 1605-1621.
Arbel, A., S. Carvel, and P. Strebel, 1983, “Giraffes, Institutions and Neglected Firms,” Financial Analysts’ Journal, 39, 57-63.
Asquith, P., 1983, “Merger bids, uncertainty and stock holder returns” Journal of Financial Economics 11, 51-83.
Bachelier, L., 1900, “Theory of Speculation” The Random Character of Stock Market Prices, MIT Press 1964.
Ball, R. and Brown, P., 1968, “An empirical evaluation of accounting income numbers” – Journal of Accounting Research, 159-178.
Banerjee, A. (1992) “A simple model of herd behaviour” – Quarterly Journal of Economics 107, 797-817.
Banz, R., 1981, “The relationship between return and market value of common stocks” Journal of Financial Economics 9, 3-18.
Barber, B. and Odean, T., 2000, “Booys will be Boys: Gender, Overconfidence, and Common Stock Investment”, forthcoming Quarterly Journal of Economics.
Barber, B. and T. Odean, 1999, “Trading is Hazardous to Your Wealth: The Common Stock Investment Performance of Individual Investors,” forthcoming, Journal of Finance.
Barber, B., Lehavy, R., McNichols, M. and Trueman, B., 2000, “Can Investors Profit from the Prophets? Security Analyst Recommendations and Stock
71

The Lahore Journal of Economics, Vol.5, No.2
Returns” Draft Graduate School of Management, University of California, Davis.
Barberis, N., Shleifer, A. and Vishny, R., 1988, “A model of investor sentiment” Journal of Finance 49, 307-343.
Basu, S., 1977, “The investment Performance of Common Stocks in Relation to their Price Earnings Ratios: A Test of the Efficient Market Hypothesis” Journal of Finance, 32, 663-682.
Bauman, W., Fleissner, D. and Slovic, P., 1972, “Analysing the Use of Information in Investment Decision Making: A Methodological Proposal” Journal of Business, 2, 283-301.
Bernard, V., 1992, “Stock price reactions to earnings announcements” – Advances in Behavioural Finance.
Bernard, V. and Thomas, J., 1990, “Evidence that Stock Prices Do Not fully Reflect Implications of Current Earnings for Future Earnings” – Journal of Accounting and Economics, Vol. 13, 1990.
Bhandari, L., 1988, “Debt/Equity ratio and expected common stock returns: Empirical evidence” Journal of Finance 43, 507-528.
Bikhchandani, S., Hirshleifer, D., and Welch, I., 1998, “Learning from the behaviour of others: conformity, fads and informational cascades” – Journal of Economic Perspective.
Black, F. Jensen, M. and Scholes, M., 1972, “The Capital Asset Pricing Model: Some Empirical Tests” in Studies in the theory of Capital Markets, Praeger, New York.
Blume and Friend, 1973, “A new look at the Capital Asset Pricing Model” Journal of Finance 28, 19-33.
72

Ali Almakky
Brock Lakonishok and LeBaron, 1992, “Simple Technical Trading Rules and The Stochastic Properties of Stock Returns” Journal of financial Economics, 1731-1763.
Campbell, J. and Shiller, R., 1988, “Stock Prices, earnings and expected dividends” – Journal of Finance 43, 661-676.
Campbell, Lo and McKinley, 1998, “The Econometrics of Financial Markets”.
Carhart, M., 1997, “On the persistence in Mutual Fund Performance” Journal of Finance, Vol. 52, No. 1 (March) 57 – 82.
Chan, K., 1988, “On the contrarian investment strategy” Journal of Business 61, 147-163.
Chan, L., Hamao, Y. and Lakonishok, J., 1991, “Fundamentals and Stock Prices in Japan” Journal of Finance 46, 1739-1764.
Chopra, N., Lakonishok, J. and Ritter, J., 1992, “Measuring abnormal performance: Do stocks overreact?” Journal of Financial Economics 31, 235-268.
Cowles, A., 1933, “Can Stock Market Forecasters Forecast?” Econometrica 1, 309-324.
Cusatis, P, Miles, J. and Woodridge, J., 1993, “Restructuring through spin-offs” Journal of Financial Economics 33, 293-311.
Daniel, K., Hirshleifer, D. and Subrahmanyam, A., 1998, “A theory of confidence, self-attribution, and security market under- and over- reactions” Unpublished working paper University of Michigan.
DeBondt, W. and Thaler, R., 1985, “Does the stock market overreact?” Journal of finance 40, 793-805.
73

The Lahore Journal of Economics, Vol.5, No.2
Desai, H. and Jain, P., 1997, “Long-run common stock returns following splits and reverse splits” Journal of Business 70, 409-433.
Dharan, B. and Ikenberry, D., 1995, “The long-run negative drift of post-listing stock returns” Journal of Finance 50, 1547-1574.
Edwards, W., 1968, Conservatism in human information processing. In: Kleinmutz, B. (Ed.), Formal Representation of Human Judgment. Wiley, New York.
Fama, E., 1970, “Efficient Capital Markets: A Review of Theory and Empirical Work” Journal of Finance 25, 383-417.
Fama, E., 1991, “Efficient Capital Markets II” Journal of finance 46, 1575-1618.
Fama, E., 1998, “Market Efficiency, Long term returns and Behavioural Finance” Journal of financial Economics 49, 283-306.
Fama, E. and French, K., 1992, “The Cross-section of Expected Stock Returns” Journal of Finance 47, 427-465.
Fama, E. and French, K., 1993, “Common Risk Factors in Returns on Stocks and Bonds” Journal of Financial Economics 33, 3-56.
Fama, E. and French, K., 1996, “Multi-factor explanations of asset pricing anomalies” Journal of financial Economics 51, 55-84.
Fama, E. and MacBeth, J., 1973, “Risk, Return and Equilibrium: Empirical Tests” Journal of Political Econom, 71, 607-636.
74
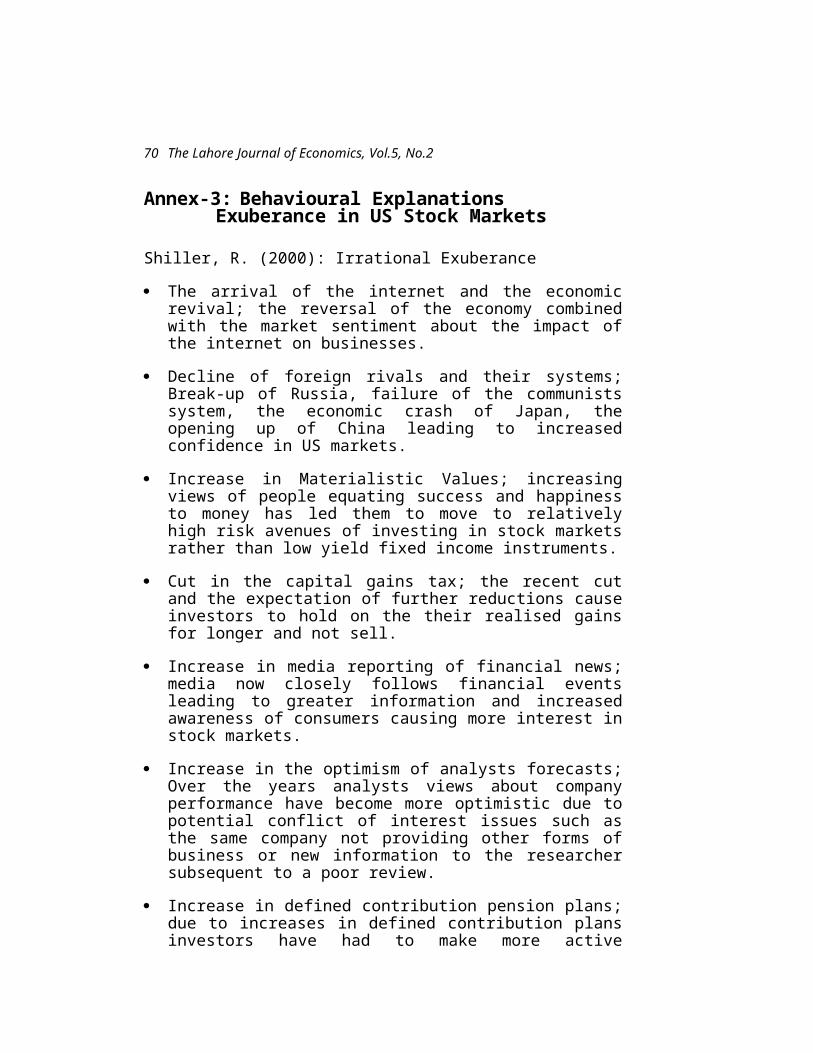
Ali Almakky
Flavin, M., 1983, “Excess Volatility in the Financial Markets: A Reassessment of the Empirical Evidence” Journal of Political Economy, 91, 929-956.
Grossman, S. and Shiller, R., 1981, “The Determinants of the Variability of Stock Market Prices (in A Critical Look at Rational Expectations in Practice)” The American Economic Review, 71, 222-227.
Grossman, S. and Stiglitz, J., 1980, “On the impossibility of informationally efficient markets” American Economic Review 70, 393-408.
Hong, H. and Stien, C., 1998, “A Unified Theory of under-reaction, Momentum Trading and Overreaction in Asset Markets” – NBER Working Paper # 6324.
Ikenberry, D. Rankine, G. Stice E., 1996, “What do stock splits really signal?” Journal of Financial and Quantitative Analysis 31, 357-377.
Jaffe, J., Keim, D. and Westerfield, R., 1989, “Earnings yields, market values and stock returns” Journal of Finance 44, 135-148.
Jagdeesh, N. and Titman, S., 1993, “Returns to buying winners and selling losers: Implications for stock market efficiency” Journal of finance 48, 65-91.
Jensen, M., 1978, “Some Anomalous Evidence Regarding Market Efficiency” Journal of Financial Economics, 6, 95-101.
Kahneman, D. and Tversky, A., 1979 – “Prospect Theory: Analysis of Decision under Risk” Econometrica, 47, 263-291.
Kliedon, A., 1986, “Variance Bound Tests and Stock Price Valuation Models” Journal of Political Economy, 94, 953-1001.
75

The Lahore Journal of Economics, Vol.5, No.2
Kothari, S., Shanken, J. and Sloan, R., 1995, “Another look at the Cross-Section of Expected Returns” Journal of finance, 50, 185-224.
La Porta, R., 1996, “Expectations and the cross-section of returns”. Journal of Finance 51, 1715-1742.
La Porta, R., Lakonishok, J., Shleifer, A., Vishny, R., 1997, “Good news for value stocks: further evidence on market efficiency” Journal of Finance 52, 859-874.
Lakonishok, J. and Vermaelen, T., 1990, “Anomalous price behavior around repurchase tender offers” Journal of Finance 45, 455-477.
Lakonishok, J., Shleifer, A. and Vishny, R., 1992, “The impact of institutional trading on stock prices” Journal of Financial Economics 32, 23-43.
Lakonishok, J., Shleifer, A. and Vishny, R., 1994, “Contrarian investment, extrapolation and risk” Journal of Finance 49, 1541-1578.
Lintner, J., 1965, “The valuation of risk assets and the selection of risky investments in stock portfolios and capital budgets” Review of Economics and Statistics 47, 13-37.
Litzenberger, R. and Ramaswamy K., 1979, “The effect of Personal Taxes and Dividends on Capital Asset Prices: Theory and Evidence” Journal of Financial Economics, 7, 163-196.
Lo, A. and McKinley, A., 1988, “Stock Prices Do not Follow Random Walks: Evidence from a simple Specification Test”, Review of Financial Studies 1, 41-66.
Loughran, T. and Ritter, J., 1995, “The new issues puzzle” Journal of Finance 50, 23-51.
Marsh, T. and Merton, R., 1986, “Dividend Variability and Variance Bounds Tests for the Rationality of Stock
76

Ali Almakky
Market Prices” American Economic Review, 76, 483-498.
Michaely, R. Thaler, R. Womack, K., 1995 “Price reactions to dividend initiations and omissions” Journal of Finance 50, 573-608.
Mitchell, M. and Stafford, E., 1997, “Managerial Decisions and long term stock price performance” Unpublished working paper. Graduate School of Business, University of Chicago.
Odean, T., 1998 “Volume, Volatility, Price, and Profit when all Traders are above average,” Journal of Finance, 6, 1887-1934.
Odean, T. and Gervais, S., 2000, “Learning to be Overconfident”, forthcoming Review of Financial Studies.
Ou, J. and Penman, S., 1989, “Financial Statements and the prediction of Stock Returns” Journal of Accounting and Economics.
Poterba, J. and Summers, L., 1988, “Mean Reversion in Stock Prices: Evidence and Implications” Journal of Financial Economics.
Reinganum, M., 1981, “The Arbitrage Pricing Theory” Some Empirical Results” Journal of Finance, 37, 27-35.
Ritter, J., 1991, “The long term performance of initial public offerings” Journal of finance 46, 3-27.
Roberts, H., 1967, “Statistical versus Clinical Prediction of the Stock Market” Unpublished manuscript, Centre for Research in Security Prices, University of Chicago, May.
77

The Lahore Journal of Economics, Vol.5, No.2
Rosenberg, B., Ried, K. and Lanstien, R., 1985, “Persuasive Evidence of Market Inefficiency” Journal of Portfolio Management 11, 9-17.
Samuelson, P., 1965, “Proof that Properly Anticipated Prices Fluctuate Randomly” Industrial Management Review 6, 41-49.
Sharpe, W., 1964, “Capital Asset Prices: A theory of market equilibrium under conditions of risk” Journal of Finance 19, 425-442.
Shefrin, H., 1999, “Beyond Greed and Fear: Understanding Behavioural Finance and the Psychology of Investing” HBS Press Book.
Shiller, R., 1980, “The use of Volatility Measures in Assessing Market Efficiency (in Are Markets Efficient? Tests of Alternative Hypotheses)” Journal of finance, 36, 291-304.
Shiller, R., 1981, “Do Stock Prices move too much to be justified by Subsequent Dividends” American Economic Review 71, 421-436.
Shiller, R., 1981, “Do Stock Prices move too much to be justified by Subsequent Changes in Dividends? Reply” The American Economic Review, 73, 236-237.
Shiller, R., 1984, “Stock prices and social dynamics” Brookings Papers on Economic Activity, 457-498.
Shiller, R., 2000, “Irrational Exuberance” Princeton.
Shleifer, R. and A. Vishny, 1997, “The Limits of Arbitrage,” Journal of Finance, 52, 35-55.
Slovic, P., 1972, “Psychological Study of Human Judgement: Implications for Investment Decision Making” Journal of Finance, 4, 779-799.
78

Ali Almakky
Smidt, S., 1968, “A New Look at the Random Walk Hypothesis” Journal of Financial and Quantitative Analysis, Vol. 3, No. 3, Special Issue: Random Walk Hypothesis, pp. 235-261.
Spiess, D. and Affleck-Graves, J., 1995, “Under performance in long-run stock returns following seasoned equity offerings” Journal of Financial Economics 38, 243-267.
Stattman, D., 1980, “Book values and stock returns” The Chicago MBA; A Journal of Selected Papers 4, 25-45.
79

S. Akbar Zaidi
Institutional Failure, State Failure or the Failure of ‘Civil’ Society?
The Rural Water Supply and Sanitation Sector in Pakistan
S. Akbar Zaidi1
[Presented at the Citizens’ Conference on ‘The Politics of Water: Perspectives and Policies’, SDPI, Islamabad, July 1, 1999].
Abstract
With only half of Pakistan’s rural population provided water through government sources, many observers may well be led to believe that this is a clear case of government failure. Yet, such conclusions ignore the way development thinking has changed over time. Currently, the new way of providing infrastructure and social services relies increasingly on communities, NGOs and the private sector, with the role of government considerably curtailed. In the Rural Water Supply and Sanitation (RWSS) sector, it is the Uniform Policy which now dominates planning and implementation Unfortunately, succumbing to donor pressure, an ill-devised Policy has been approved for the sector which requires prerequisites which are just not available. A socially sensitive engineering department, and organised and active communities, which are the cornerstone of the Uniform Policy, do not exist. Hence the failure of the new thinking in the RWSS sector. While institutional failure and government sclerosis may be amongst the more critical causes of failed service delivery, it may perhaps be more instructive to analyse such institutions in a broader political economy perspective, where reasons for the failure of the state as much as of ‘civil’ society, may provide more useful answers.
The evaluation of any institution or sector is likely to draw some, or possibly many, parallels with the overall structure within which it functions. Institutions and sectors within the confines of state and/or government are likely 1 The author is a Karachi based social scientist who does research on social, economic and development issues. He has published five books, including ‘Issues in Pakistan’s Economy’ (Oxford University Press).
71
The Lahore Journal of Economics, Vol.5, No.2
to reflect some of the qualities, good or bad, of the larger whole in which they exist. While specific sectors and institutions may possibly be at odds with the culture, or way of governing, which is considered to be the norm and convention, one can safely speculate that in a country where it is believed that the larger institutions of the state like the judiciary, police, and government are corrupt, inefficient, suffer from administrative failure, donor interference, political machinations and vested interests of the most petty kind, smaller institutions and sectors like health, education, and rural water supply, are unlikely to be very different. This paper addresses issues of institutional and policy success and failure within the context of the Rural Water Supply and Sanitation Sector (RWSS) in Pakistan, keeping in view that perhaps we are evaluating a sector within what is increasingly being called a ‘Failed State’. Equally important, is the assertion that it is not just the state which is increasingly failing, but more importantly, those sections which constitute ‘civil’ society, as well.2
The Rural Water Supply and Sanitation (RWSS) Sector in Pakistan provides coverage to, at best, around fifty percent who have access to sanitation facilities.3 With ninety million inhabitants in the rural areas, this means that around forty five million do not have access to safe drinking water, and around 76 million do not have basic sanitation facilities.4
The consequences of such a severe shortage, in terms of ill-health, disease and morbidity and mortality patterns is well reflected in Pakistan’s overall health status.
The reasons for such poor coverage include geophysical, demographic and economic factors. The government renews its pledge to provide safe drinking water to all, and currently, the Pakistan National Perspective Plan 1998-2003, has set a target of complete 2 This paper is a highly condensed version of two of my papers which appear as chapters 4 and 5 in Zaidi, S Akbar, The New Development Paradigm: Papers on Institutions, NGOs, Gender, and Local Government, Oxford University Press, Karachi, 1999; the focus of this paper, however, is considerably different from my earlier work.3 Problems of definition of coverage and of ‘safe’, are amongst the important issues which affect the sector – see below.4 These are Government of Pakistan figures taken from their National Perspective Plan 1998-2003, cited in Social Policy and Development Centre, Review of the Social Action Programme, Karachi 1997, p. 36.
72

S. Akbar Zaidi
access to drinking water for all Pakistanis, whether urban or rural; sanitation facilities are to be provided to all urban inhabitants by the end of the Plan, and to an ambitious 60 per cent of the rural sector. However, institutional and financial constraints continue to play a formidable role in making water unavailable to the majority of rural Pakistanis. In order to understand the role of institutions and policy in the RWSS sector in Pakistan, this paper briefly discusses the main social and economic features that influence the sector.5
Key Institutions and Policies
The Public Health Engineering Departments
The four provincial Public Health Engineering Departments (PHEDs) are the main providers of rural water supply in each of the provinces. Their role varies from almost complete provision of government provided water supply in the Punjab, Balochistan and the NWFP, to a very large proportion of provision in the province of Sindh – see Table-1. In comparison, the other main official source of water in the rural areas, the Local Government and Rural Development Department (LGRDD) provides very little. With the overall annual budget for water supply being almost completely taken over by the PHEDs (97 per cent), this is not surprising. Moreover, the LGRDD is expected to perform a wide variety of functions unlike the PHED, and rural water supply and sanitation are just one of the many responsibilities of the former – see below.
Table-1: Number of Rural Water Supply Schemes, June 1996
Sindh
NWFP
Balochistan
Punjab
PHED Schemes (Mechanised and Gravity)
754 2,512 1,347 2,319
Population served (in million)
0.905
10.32 3.90 11.107
LGRDD Schemes (Hand 4,39 4,000 3,700 8,0005 Far greater details are available for the interested reader in Zaidi, S Akbar, op.cit.
73
The Lahore Journal of Economics, Vol.5, No.2
pumps) 3Population served (in million)
0.527
1.20 0.45 1.60
Total rural population served
1.432
11.52 4.35 12.707
Percent of rural population served
9.12%
80.14%
62.7% 25.10%
Population reached PHED/LGRDD
63/37
90/10 90/10 87/13
In-operative PHED schemes
148 29 515 223
Percent of PHED schemes inoperative
20% 1% 38% 11%
Source: Social Action Programme Statistics 1992/93 – 1997/98Multi-Donor Support Unit, July 1997.
Note: Given the problems concerning data and definitions discussed in the text, it is very likely that Row 1 ‘PHED Schemes’, include the schemes listed as ‘In-operative’.
The Public Health Engineering Department (PHED) of the four provinces has hitherto been responsible for constructing, operating and maintaining water supply and sanitation schemes in the country. However, under the Social Action Programme (SAP) Project I (1993-96), there has been a marked change in emphasis. The principal policy reforms for the rural water supply sector under the Social Action Programme, Phase 1, have centred around the strengthening of institutional capacity to deliver services with a new approach for the provision of services, with a focus on involving communities in the development and subsequent management of the installed systems. Moreover, all the provincial governments are agreed that once completed, the schemes will incur a transfer of ownership from the government to the beneficiary community, who will be responsible for the financial and technical operation and maintenance of the rural water supply and drainage schemes – see below.
74

S. Akbar Zaidi
In the first phase of SAP, a large number of rural water supply schemes were handed over to the ‘beneficiary communities’, not all without some serious problems. Studies have found that some of these schemes have been handed over to communities despite the latter’s resistance to the idea. These communities have been ‘coerced’ into accepting these schemes rather than having been motivated by the perceived benefits of the ‘participatory’ approach. This, at a time when a large majority of households believed that a water supply system would be better managed by a government agency rather than a local political body, village water committees, or private entrepreneurs.6
The PHED in all the provinces and regions, is essentially a technical department housed by engineers and other technically skilled staff. Schemes have been constructed without any social sensitivity or social engineering, and communities have seldom, if ever, played a role in any of the stages of provision of drinking water to rural communities. Schemes have been constructed on the advice of Members of the National and Members of the Provincial Assemblies (MNAs/MPAs) or then based on some top-down assessment of need. This has led to schemes being installed in areas where it may not have been feasible to do so, or in areas where PHED schemes may already exist and/or alternative sources of water are easily and adequately available. Essentially, a non socially-sensitive technical and engineering approach has been applied to an issue which has important social and cultural ramifications and connotations. Evaluations of PHED have found that, it has neither the orientation for community mobilisation, nor any staff to undertake activity which has a social orientation. It has an engineering orientation and acts purely as a provider of services. This modus operandi has been to prepare technical feasibility reports, and construct schemes with little involvement of communities in either the construction phase (e.g. in site selection or choice of 6 For a detailed discussion and analysis of the Social Action Programme Project 1 in the Rural Water Supply and Sanitation Sector, see: Khan, Shahrukh Rafi, Handing Over of Water Supply Schemes to Communities in Northern Punjab: A Case for Collective Action, MSU/SDPI, Islamabad, 1996; and Systems (Private) Limited, Review of RWSS Sector Under SAP 1, Lahore, 1996.
75

The Lahore Journal of Economics, Vol.5, No.2
technology) or during O&M. As PHED is finding out, by not involving communities at the earliest stage of survey and planning, the current policy of handover to beneficiary communities has been made more difficult.
The mechanism of the PHED has been to involve registered contractors to build water supply schemes and use parts and pipes purchased and supplied by the department. This procedure has given rise to allegations of extreme corruption in the sector, where quality has, for the most part, been suspect, if not extremely poor. There are accusations that engineers of the PHED and contractors are in collusion, and vast sums from such projects have been pocketed by involved individuals. Sub-standard quality work resulting in over-pricing of projects and with recurring breakdowns, and the need for recurring repair and subsequent maintenance, are seen to be the hallmark of the rural water supply sector in Pakistan. This poor quality of water supply schemes has been a further serious impediment to the willingness by the community to take them over and take the responsibility for O&M.The Social Action Programme and the Uniform Policy
The Social Action Programme (SAP) Project launched in 1992-93 was meant to be a concerted effort on the part of the government to speed up the process of social development in the country. With growth rates at times amongst the highest in the world, Pakistan’s performance in the fields of health, education, family planning and access to clean drinking water and sanitation had been very inadequate. In order to address this shortcoming, SAP was designed in such a way that not only should financial allocation and commitment to the social sectors increase, but along with an increase in facilities (quantity), quality should also improve. This also required that the way social services had so far been delivered in this country needed to change radically.
In the light of these issues, it was decided that henceforth all social development in the fields of primary health, primary education and rural water supply and sanitation would incorporate the participation of the beneficiary community and the top-down approach of the
76

S. Akbar Zaidi
past would be replaced by a more conciliatory and involved approach. It was hoped that communities would actively participate in the design and delivery of these services, right from the planning stage, so that communities would be willing to take over the responsibility of operating and maintaining these schemes.
In order to address the government’s own financial burden in operating and maintaining schemes, it was felt that some cost sharing needed to take place with the community and that the government could no longer continue to subsidise the O&M costs. By involving the community from the initial stages of the project, it was hoped that the community would be more willing to take over the O&M responsibilities of the project and scheme.
Essentially, the key elements of SAP, with reference to all sectors under the programme but particularly for the PHED’s rural water supply and sanitation sectors, have involved the following three principles: to develop and apply an integrated concept for improving various related basic infrastructure facilities; to fully involve the beneficiary community in all stages of the project so that ultimately the community can take care of O&M of the improved facilities; and, to motivate communities to assume responsibility for developing and improving the basic social services in future.
A key component of SAP in fact, one on which the future of the Social Action Programme may itself rest, is the role of organised beneficiary communities. Hence, SAP’s success, and especially so in the rural water supply sector is highly dependent on the role NGOs, CBOs and Water Management Committees (WMCs) are expected to play. The relationship between formal government institutions and non-formal organisations is the key to how developments under the Social Action Programme Project 1, and particularly in the rural water supply sector take place.
In the light of these general premises of the Social Action Programme, a Uniform Policy for the rural water supply sector was developed and implemented for each province and now determines how schemes are to be
77
The Lahore Journal of Economics, Vol.5, No.2
planned, developed, implemented and handed over to the communities. The main focus of the Uniform Policy in each province is to transfer the ownership and the financial and technical O&M responsibilities of the rural water supply and drainage schemes to the concerned community.
Since the Uniform Policy has been the basic document determining policy in the sector over the last few years, and is going to do so till the year 2001, two important points about the Policy need to be emphasised. Firstly, according to the Uniform Policy, the PHED completely dominates the supply and provision of water, to the exclusion of other departments, notably the Local Government and Rural Development Department. Secondly, while the Uniform Policy is a policy for both water supply and sanitation, there is no policy on sanitation.The Local Government and Rural Development Department (LGRDD)
78
S. Akbar Zaidi
The LGRDD has a broad mandate. It covers promotion of rural development and improvement in the quality of life through provision of social and other facilities. To achieve this mandate it executes small rural works programmes (that include construction of small link roads, paved streets in villages, small bridges, community centres, etc.) and monitors and supervises development schemes initiated by local councils and provides administrative and technical support to them on these schemes. It is also responsible for implementing rural development projects on behalf of provincial line departments, e.g., it constructs primary schools for the education department and basic health units for the health department. In the sector it constructs small rural water supply and sanitation schemes involving the provision of community hand pumps and implementation of sanitation programmes. The technical capacity of the department is weak in implementing large sized and complex projects. Thus, the major development work in the rural water sector is left to the PHED – see Table 2.
LGRDD is not considered a major player in the RWSS sector, even by the LGRDD itself, although it does provide a large proportion of the rural population with low technology drinking water services. Since the department has an extensive administrative set-up right down to the markaz or Union Council level, it is felt that it is much closer to the community, and should play a role in all community related activities. On the other hand, however, studies have shown that the department lacks technical and financial capability to take on any serious projects. The donor initiatives as part of the Social Action Programme Project 1 with LGRDD have been focused upon institutional strengthening, and on the provision of hardware in the form of Afridev hand pumps and household latrines. Just at there has been some institutional restructuring in the PHEDs with Community Development Wings added on, in the LGRDD as well, such wings or sections have been added on to the department.Issues and Constraints in the Rural Water Supply and Sanitation Sector
The Lack of Adequate Date
79

The Lahore Journal of Economics, Vol.5, No.2
One of the more obvious issues and problems that face this sector is the dearth of reliable statistics in the RWSS sector. Different sources of information have different sets of data, and it is difficult to come up with one, or even a set of coherent statistics which give a true and reliable picture about the status of rural water supply in Pakistan. Moreover, basic definition about coverage, and provision, access, safe water, etc, are either non-existent, or then inadequate. Different agencies and institutions have different definitions. Clearly, before any strategy or targets can be established, there is urgent need to specify and agree to common definitions and criteria.
80

S. Akbar Zaidi 81

The Lahore Journal of Economics, Vol.5, No.2
Dearth of Water Sector NGOs
Although there are reported to be more than 15,000 NGOs/CBOs registered in Pakistan, with an equal number not registered, but supposedly operative, it has been observed that very few of these organisations claim any experience or skills in water supply and sanitation. More importantly though, of those that do claim that they are competent in this sector, surveys and studies have shown that this is far from the truth. Many NGOs/CBOs are paper organisations making claims far in excess of their abilities and capabilities. The non-existence of water supply and sanitation related organisations is the single biggest reason why the RWSS sector component in SAP has been, and is likely to continue to be an outright failure.
The NGO alternative to official development is of recent origin in Pakistan, and has grown in response to funds made available by donors. While there are some internationally acclaimed NGOs – including one urban NGO which has considerable experience in sanitation and drainage – many more are fly-by-night operations which operate on the premise that quick profits can be made in a well-funded sector. This leaves the number of ‘authentic’ and ‘sincere’ NGOs to be far too few. This is probably more so in rural areas, where lower literacy levels and less access to funds and donors has limited the formation of NGOs of any kind. Research has also shown that multi-purpose NGOs far out last single-purpose (like water) NGOs, and the few NGOs that do exist in the rural sector may include water supply and sanitation objectives and targets, as one of many.
The handful of large umbrella NGOs that do exist in the rural areas, operate usually in single provinces, working in a few select districts, with their own specific agenda, of which water and sanitation may or may not be one. These umbrella NGOs are usually foreign funded with plans about their activities drawn up well in advance over the next few years. They may not be willing to change midstream, even if new funding or opportunities arise. For example, these NGOs have not rushed forward to assist their provincial governments in handing over PHED schemes to the community even in areas where these
82

S. Akbar Zaidi
organisations have strong roots and links with the community. They have preferred to continue with their own programmes.
Hence, the quality and quantity of NGOs in Pakistan in both urban and rural areas is suspect. Moreover, while there are well-known NGOs in micro-credit, urban sanitation and drainage, and overall rural development, there is no NGO which can claim to have considerable expertise in rural water supply and sanitation in Pakistan. Some bigger umbrella NGOs do, however, have rural water supply and sanitation as one of many components. And that too, their involvement is restricted to either non-mechanised gravity schemes or smaller hand pump schemes. Clearly, expertise in this sector is lacking.Community Inability/Unwillingness
Communities have been unwilling or unable to take over schemes because they may not have the training, skills or even desire to do so. Many users feel that it is the duty of the government to operate and maintain such schemes, and they do not want to take them over. Also, many schemes have more than one source and multi-users, hence problems in management of such schemes arise. Nevertheless, if funding for SAP is to continue, as is likely, so will the implementation of the Uniform Policy. This means that whether communities like it or not and despite any reservations that they may have, the schemes are going to be dumped upon them. In the past, many communities have been coerced into taking over the schemes and it is probable that this trend will continue and become accentuated. Communities have to be willing or at least prepared for this eventuality.LGRDD’s Capacity
Although the LGRDD has a set-up which has staff at all the district, tehsil and even markaz levels, making it the government department which is technically closest to the people, the Department has been considered (not just by others, but even by itself) to be incapable and ineffective of playing a major role in the provision of non-mechanised rural water supply. Because the LGRDD is involved in numerous other activities and since it lacks
83
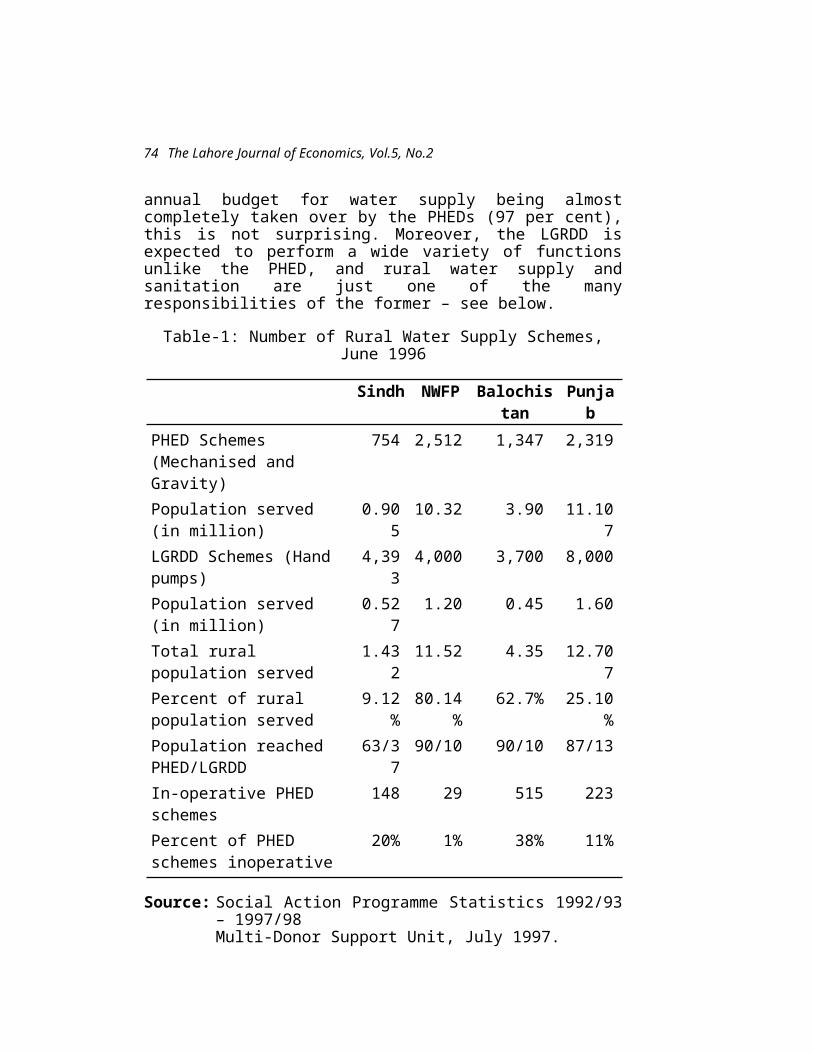
The Lahore Journal of Economics, Vol.5, No.2
technical staff, its main role has been in participating with the community in the supply and provision of hand pumps and household latrines. The Department does have a large number of male and female social organisers, who should, in theory, be able to assist communities in forming water management associations. However, both because the larger mechanised schemes are the property of PHED, and because the schemes are more complex, this community motivation role of LGRDD has been restricted to the smaller water and sanitation projects.
LGRDD is also perceived to be an institution which is more prone to corruption and manipulation by politicians. Since corruption is rampant in all government institutions, this is simply a matter of degree. However, because LGRDD has a large number of projects ongoing in different sectors, it is believed that more money is squandered away and few projects are eventually completed. In the case of other departments such as PHED, while corruption is also a major concern, the argument made is that at least projects do physically materialise. This is not necessarily so in the case of LGRDD projects.
Although the second Social Action Programme Project pays lip service to a greater role of the LGRDD in the provision of rural water supply, the original Uniform Policy undermines the position of LGRDD, making it subservient to PHED. The Uniform Policy over-emphasises the role of PHED to the exclusion of all other providers.PHED’s Capacity
PHED is a technical institution, housed mainly by engineers. Under the Uniform Policy it is being asked to play the additional role of community and social mobiliser. Various attempts at sensitising engineers by building community development wings at PHED are underway. Although a few hundred water schemes have been handed over to communities across Pakistan by PHED, in many cases communities have been forced to take over the schemes unwillingly. PHED, given its current disposition and composition, cannot behave like a community mobiliser even though such wings or units are added on.
84

S. Akbar Zaidi
There is a strong reluctance at PHED to change, for obvious reasons. The current involvement by engineers and contractors would be undermined if the Uniform Policy were followed through. Also, if as per SAP II, the community is asked to be involved in all stages of rural water supply, from design, construction and supervision to O&M, PHED employees loose their positions of control and involvement. This does not bode well for their social or financial prospects. Hence resentment, if not open conflict, with the Uniform Policy. Of all the actors involved in the sector, it is probably in the greatest interest of PHED to ensure that the Uniform Policy fails, and the scenario antes returns.Weaknesses in the Uniform Policy under the Social Action Programme
The Uniform Policy on the rural water supply sector, and the Social Action Programme, will fail because of its over reliance on the perceived benefits of community development in a country where few credible NGOs and CBOs exist. Moreover, there is no overwhelming desire by communities to take over water supply schemes, especially if alternate sources of water are available. In addition, there are thousands of schemes in the country, which are technically and financially beyond the capabilities of community organisations, and even if handed over, would fail. Community ownership and management, for most schemes, even if implemented, is not a sustainable policy. PHED does not have the sensitivity towards communities, nor the institutional support to mobilise and train communities. It is highly suspect and cynical about the role of the community and has no desire to hand over a sector through which individuals acquire huge sums of money and have made small fortunes. With rent seeking and corruption rampant in most, if not all, public sector institutions, the department responsible for the provision of rural water supply is hardly exempt.
There is also ambiguity in the Policy regarding institutional arrangements and mechanisms in respect to the roles of the public sector executing agencies, elected representatives and beneficiary communities in the scheme
85

The Lahore Journal of Economics, Vol.5, No.2
selection, planning and design process, as well as in the financial and organisation arrangement for eventual O&M activities. Moreover, significantly, the Policy is silent over how the following schemes are to be taken over by the community: (i) those with one water source providing water to more than one settlement or community (ii) a distant source of water serving a large, widespread distribution network (iii) schemes that are technically complex for smaller remote communities, and (iv) schemes where communities are unwilling to take over government schemes.
No attempt has been made to deal with the problems of revenue shortfalls in the sector and greater effort would go a long way in dealing with the resource gap faced by this, and other, sectors. Since this premise is the key to the Uniform Policy, and community development in this sector is seen merely as a means to deal with the revenue problem, if user charges can be increased and collection improved, perhaps community handover may not be necessary.
The Uniform Policy also suffers from the fact that it is too uniform. It does not allow options to the community as to how it wants to deal with the drinking water supply problem. Rather than have a time-bound policy, where schemes have to be transferred, a more open-ended policy should be devised for the future. This would mean that rather than force all communities to take over the schemes, those communities that voluntarily wish to do so, should be supported and helped, through technical assistance and any other means (legal, financial, etc.) required. If communities want to involve the private sector, they should do so; PHED could help in identifying competent firms and individuals. Effective local government also has an important role to play in the water sector, and PHED and the provincial government should consider enhancing its role, not only in the water sector, but if possible constitutionally as well. So far elected and administrative local government has not been a key player in social development, through no fault of its own. Essentially, different methods of dealing with different types of schemes and communities are required, and uniformness, in terms of policy or transfer, needs to be replaced with the
86

S. Akbar Zaidi
diversity that exists in the sector and in communities. There is also a need to share responsibilities rather than burden communities with a load which they cannot handle.
Our main conclusion is that the policy of handing over all water supply schemes to the community is a mis-conceived, ill-thought-out policy, destined for failure. It does not take cognisance of the reality of community dynamics and institutional constraints. The policy should be revised to be more accommodating and open-ended, where different options for the community and for PHED need to be devised. The option that a large number of schemes remain with PHED which improves and reforms its institutional structure, resulting in far greater revenue generation, must be at the top of the list.
In the three years of the first phase of the Social Action Programme Project, over 600 PHED schemes had been handed over to ‘the community’, not without serious problems, however. In the Punjab, for example, of the 363 handed over, over 50 had been returned to the PHED because the community could not maintain them. In Balochistan although 219 schemes had been transferred (on paper), in reality only twelve of these schemes were now operational. Studies have shown that most water management committees exist only on paper, and communities have been ‘coerced’ into taking over the schemes. The absence of any NGO willing to act as an intermediary in the handover process is well recognised by all the provincial PHEDs. Studies on the rural water supply and sanitation sector have shown that the Uniform Policy is way too ambitious with its targets and goals, and has so far achieved very little of any substance.7
Institutional Failure, State Failure or the Failure of ‘Civil’ Society?
Amongst the main issues which have been identified in the discussion above, perhaps the following stand out: the Public Health Engineering Department dominates the provision of rural water in Pakistan, and is a department like most others, which suffers from corruption, and although it may be technically competent, is not in tune 7 See especially Chapter 5 in Zaidi, S Akbar, op.cit.
87

The Lahore Journal of Economics, Vol.5, No.2
with the new means of delivering water to communities; the Local Government departments have been sidelined into providing water for a very small proportion of the rural population; the Uniform Policy of the Social Action Programme which now sets the rules for the sector, is an ill-devised policy, which seems to have been hurried through, does not take cognisance of the existing reality, and has been imposed upon an unsuspecting public and communities; and, the expectations from community organisations and NGOs are, to say the least, overly optimistic.
In this analysis of the sector of Pakistan, we have shown that the new institutional arrangements thrust upon an engineering department, have taken place not out of choice, but due to donor pressure. The World Bank and other international donors who support the Social Action Programme, have demanded that institutional arrangements that are more socially sensitive, be incorporated in this sector. These arrangements focus on the need to transform the PHED and to incorporate NGOs in the operation and maintenance of rural water schemes. We have argued that the RWSS sector has several serious problems in it, and the attempts to reform the sector or the PHED are likely to fail. In addition, the non-existence of relevant NGOs and the lack of interest by communities to take over government water schemes, will only exacerbate the extent of that failure.
Our analysis suggests that under the guidelines of the Uniform Policy, the situation in the RWSS sector is likely to worsen. It is quite possible that despite the numerous problems which did exist in the past, the means of providing water may have been appropriate for those times and those conditions. It is the new way of looking at development and the provision of infrastructure which seems to be the key issue here. In addition, elsewhere we have argued that rather than any commitment to any alternative thinking or paradigm, it was the fiscal crisis of the state which came up with the solution where communities, rather than institutions of government, were expected to take-over the considerable operation and
88

S. Akbar Zaidi
maintenance costs, the main ingredient of the Uniform Policy.8
Just as much as there is an acceptance of the fact that many state institutions have been unable to adapt and change in line with new requirements (pace the RWSS sector), with a changed demography, and social and economic structure, resulting in government and/or state failure, it should also be emphasised that in Pakistan we are witnessing an even greater failure of segments and institutions that constitute what is called ‘civil’ society. The lack of any worthwhile political, cultural or social opposition which questions the workings of the bureaucracy and of government, or the extreme intrusion of donors and the conditionalities imposed by them; an intellectual dishonesty and sycophancy of the highest order; and, an NGO culture more suited to safeguarding jobs and privileges and pleasing donors, rather than addressing the concerns of presumed and potential beneficiaries, constitute some of the key failings of ‘civil’ society and its actors.
Any analysis of the structure and issues in the Rural Water Supply and Sanitation sector in Pakistan cannot ignore the nature of the structures and issues of the state, or of ‘civil’ society. The ability of donors to enforce the Uniform Policy is a failing as much of the state and of government, as it is of ‘civil’ society. Institutional failure, whether it is in the RWSS sector or education or health, must be seen in this broader context. Likewise, any attempt at reform or solution, must necessarily take cognisance of all these issues. The mere tinkering with tariff rates, delivery mechanisms, or technology is unlikely to bring about any long lasting improvement.
References
Khan, Shahrukh Rafi, et. al, 1996, ‘Handing Over of Water Supply Schemes to Communities in Northern Punjab: A Case for Collective Action’, MSU/SDPI, Islamabad.
Zaidi, S. Akbar, 1999, ‘Institutions and Policy in the Rural Water Supply Sector in Pakistan’ in Zaidi, S. Akbar
8 Ibid.
89

The Lahore Journal of Economics, Vol.5, No.2
The New Development Paradigm: Papers on Institutions, NGOs, Gender and Local Government, Oxford University Press.
Zaidi, S. Akbar, 1999, ‘NGO Capability and Community Participation in the Rural Water Supply Sector in Pakistan’, in Zaidi, S. Akbar The New Development Paradigm: Papers on Institutions, NGOs, Gender and Local Government, Oxford University Press.
Zaidi, S. Akbar, ‘NGO failure and the need to bring back the State’, Journal of International Development, Vol. 11, No. 2, 1999.
90

Mohammad H. Akhtar & Peter J. Buckley
Motives of Foreign Firms in Pakistan
Mohammad H. Akhtar and Peter J. Buckley9
Abstract:To date no study has been made to explore the FDI
motives of foreign firms in Pakistan. An attempt has been made to rectify this position through a survey of both wholly- and majority-owned multinational enterprises (MNEs) in the economy. Market size and growth variables appear to be the most cited reasons for FDI by MNEs in the sample. The use of exploratory factor analysis (EFA) also reinforces the significance of market size as the motive for FDI in Pakistan. The other underlying factors produced by the EFA are: expansion of business, low input prices, desire to lower the transaction costs and psychic distance.1. Introduction
Whilst Foreign Direct Investment (FDI) has been discussed extensively, there seems to be no evidence of any research exclusively undertaken on the motives of foreign firms in Pakistan. Overseas investment, being significantly lower in Pakistan as compared to the economies of East Asia, has escalated in recent years. This reflects both the trends of foreign investors towards the economy and increasing commitment on the part of the government. Pakistan is adopting liberal policies to attract more and more FDI in the economy by making the policy environment more favourable towards foreign investors. The purpose of this study is to examine the determining and deterring forces that lie behind such trends in Pakistan. A survey of wholly and majority-owned subsidiaries/branches of MNEs was conducted to know about their motives for FDI in Pakistan.
9 The authors are respectively Assistant Professor of International Business and Economics, Department of Commerce, B. Z. University, Multan, Pakistan and Director, Centre for International Business, University of Leeds (CIBUL), Leeds University Business School, United Kingdom.
87
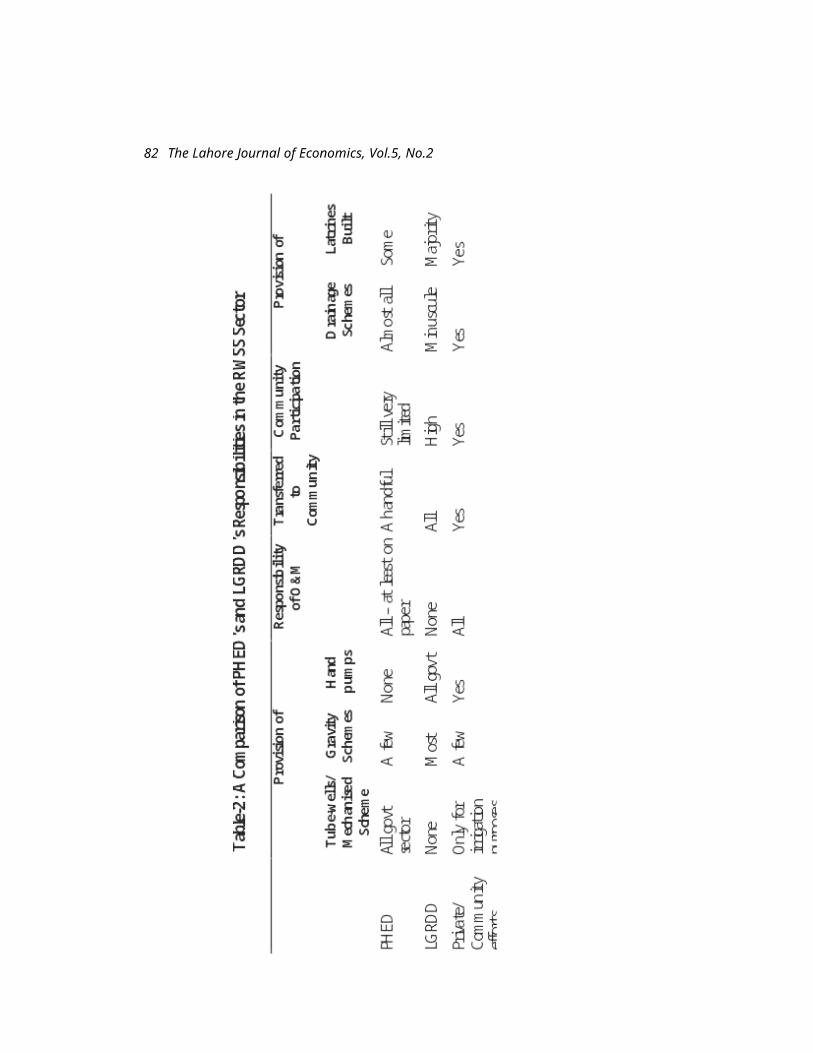
The Lahore Journal of Economics, Vol.5, No.2
The remaining part of the study is organised as under: Part 2 investigates the literature on FDI motivations of MNEs. Part 3 sets forth the details of sample selection, its features and research methodology. Detailed findings of the survey, on the motives for FDI in Pakistan are set out in part 4. Conclusions are arrived at in the final part.2. Empirical Investigation
A sizable amount of literature exists in the form of surveys and case studies to explore the factors behind FDI activity. This has been of immense value in understanding the FDI motivations of MNEs. It reveals the reasons behind policy choices for investment abroad and manifests that FDI can be activated by the ownership, location and internalisation (OLI) factors.
Ownership-specific advantages are the factors that provide some competitive edge to a firm or group of firms over the others and result from the conditions of imperfect markets. These advantages accrue to an enterprise because of the possession of intangible assets such as trademarks, patents, production management, organisation and marketing system, and research and development (R&D) capacity, etc. Such advantages are not easy to disseminate for the alleged intention of possessing firms to take maximum advantage from them. So these remain exclusive and specific to firms, at least in the short run. Such factors play a great role in motivating FDI as these could be best exploited through it rather than the other forms of servicing markets e.g. exports or licensing. Empirical support for such factors comes through the works of Wilkins (1970, 1974); Nicholas (1982); Wells (1983); Chen (1983) and Kumar and Kim (1984).
Location factors are believed to be the attributes of a location that make it more attractive and receptive to direct foreign investment. These include possession of certain natural resources, better marketing prospects, availability of cheap labour, lower production costs, better investment climate, political stability, and proximity to large potential markets, etc.. These are the L-factors of the ‘pull’ variety. Sometimes home market considerations
88

Mohammad H. Akhtar & Peter J. Buckley
such as supportive policies of the government, political risks, higher labour costs, shortage of labour, appreciation of currency etc. compel the MNEs to serve foreign markets through FDI. These are again the L-factors but of the ‘push’ type. The issue of identifying and evaluating factors which influence firms in the location of their FDI is addressed by Brash (1966); Reuber et al. (1973); Franko (1976); Lecraw (1977); Ajami and Ricks (1981); World Bank (1989); Hasan and Nishat (1989); Bürgenmeier (1991) and Hood and Taggart (1997).
Internalisation factors reflect the costs incurred and benefits not received under the market mechanism. Costs are the transaction costs incurred during the process of exchange in the international market via exporting, licensing or contracting. Such costs take the form of uncertainties in finding suppliers, costs in making and monitoring contracts, maintaining product quality, government interventions such as tariffs, quotas, price controls, tax differences and so on. Benefits include economies of scope and specialisation, horizontal and vertical integration, lower transaction costs, controlling market outlets and enjoying protected use of firm-specific factors etc. Such imperfections in markets motivate firms to undertake certain activities and transactions within their organisation (internalisation) rather than carrying on through the market mechanism. Internalisation factors make it less costly to allocate international resources internally. The contribution of such factors in motivating direct investment is reflected by the studies of Buckley and Mathew (1979); Nicholas (1982); Shepherd et al. (1985) and Artisien et al. (1991).
The existing literature provides the basis for present research aimed at developing an insight into FDI motives of MNEs in Pakistan. The focus is on the following aspects:
To explore the relative significance of OLI factors for MNEs’ investment in Pakistan in general, across their nationality and pattern of ownership.
To develop a parsimonious set of factors that lead to FDI, through the use of factor analysis.
89

The Lahore Journal of Economics, Vol.5, No.2
3. Sample and Research Methodology
3.1. Sample Selection
As it was difficult to survey the whole population of the affiliates of MNEs in Pakistan on account of time and resource constraints, the task was accomplished through a selected sample of the MNEs. The sample was expected to reflect the following broad characteristics:
To provide varied industrial coverage. Represent MNEs across different source countries. Consisting of MNEs with a share of either more than
51 per cent or 100 per cent by the parent. The reasoning for such a selection was based on extracting true information from foreign investors who are the main decision makers in the investment process.
To gain some insight into the FDI motives of MNEs in Pakistan in order to form the basis for future research.The target population of the MNEs was determined
through the Government of Pakistan (GOP) (1993). Information was obtained through Dun & Bradstreet (1996) concerning the share pattern and nationality of the MNEs in Pakistan. An initial sample of 69 of the total population of 214 companies was compiled from the GOP (1993) with the list of multinationals and companies with foreign equity in Pakistan. The majority of the MNEs in the initial sample consisted of manufacturing MNEs mostly from the UK and USA. As the primary aim of the study was to collect information from various firms across different sectors and nationalities, this led to the selection of a sample originating from the various host countries across manufacturing, trading and service sectors. Hence, a list of 43 MNEs was finalised considering that these MNEs possessed the necessary features (mentioned above) to determine a potentially useful sample for the survey. Selection of the sample can be best described as purposive sampling based on the
90

Mohammad H. Akhtar & Peter J. Buckley
judgement design. The use of such a mode of sample selection was intended to include firms from major industry groups and with a greater knowledge of the market through their longer presence in Pakistan. On the basis of available knowledge, concerning the population of MNEs in Pakistan and the nature of research objectives, such a mode of sample selection appeared to be efficient. The sample was considered to be useful in the following domains. Firstly, to provide an understanding of traits and dynamics of the various subsidiaries of MNEs. Secondly, to gain an insight into their motives for FDI in Pakistan. Thirdly, in drawing some broad conclusions and appropriate policy formulations for attracting larger inflows of FDI into Pakistan.
Table-1: Classification of the MNEs, across sectors and nationality, actually surveyed
Sectors CountriesUK USA Japan Germa
nyOther
s*Total
Manufacturing
2 2 0 5 3 12
Service 2 3 1 1 6 13Trading 2 0 3 0 2 7 Total 6 5 4 6 11 32
* Include MNEs from UAE (3), Korea (2), Netherlands (2), Australia & New Zealand (1), France (1), Switzerland (1) and Miscellaneous (1).
91

The Lahore Journal of Economics, Vol.5, No.2
Table-2: Classification of assets, sales/revenue and exports of the MNEs (No. of firms)
Value (million Rs) Assets
Sales/Revenue
Exports
Upto 50 million 4 1 351 to 100 million 3
101 to 300 million 6 2
More than 300 million 2 11
Not applicable 24
3.2. Features of the Sample Surveyed
The sample comprises the subsidiaries/branches of the MNEs in manufacturing, service and trading sectors in Pakistan. Manufacturing firms were the firms mainly involved in the production of electrical goods and appliances (3), consumer care, pharmaceutical and chemical products (6), pumps and valves (1), oil extraction (1) and the generation of electricity (1). Service companies consisted mainly of banks (10), insurance (2) and shipping companies (1). Trading companies were mainly involved in export and import merchanting (5), supplying computers and office appliances etc. (2). The responding firms are classified in Table-1 according to their nationality and industry groups. Classification of assets, sales/revenue and exports of the MNEs surveyed is also indicated in Table-210. 3.3. Data Collection
Data for the survey was collected through detailed interviews with the subsidiaries/branches of the MNEs in Pakistan, based on a structured and pre-tested questionnaire11. It was considered that data collected through detailed discussions and interviews would be more comprehensive, accurate and dependable as compared to a mailed survey. Non-response by some of the MNEs, either on account of policy matters or due to
10 The information is incomplete as some of the firms were reluctant to provide data on these fronts.11 The questionnaire is available with the author on request.
92

Mohammad H. Akhtar & Peter J. Buckley
their prior commitments, resulted in our dependence on the MNEs willing to participate in the survey.
Of the 43 MNEs contacted for an interview in Pakistan, 30 responded to the request. Among the rest, 9 companies declined to take part as it was against their policy to participate in any survey. For the rest of the 4 MNEs, questionnaires were left with them as it was difficult for them to manage time for an interview due to their prior commitments. After various reminders to these firms, two of them responded by sending back the questionnaires left with them, making a total of 32 respondent firms12. 4. Results of the Study
Detailed findings of the survey on FDI motives of MNEs in Pakistan are presented below. The results of the survey need to be viewed with caution because of the following reasons: 1)- limitations of the nonprobability sampling technique, mainly in terms of generalisability of the results; 2)- a selection bias that might have resulted from the purposive sampling technique used in selecting the sample. 3)- an interview bias resulting from the on-site visits, and finally; 4)- an eventual bias produced by non-response of some of the MNEs, affecting the overall response in a more positive or negative direction.4.1. FDI motives of the MNEs in Pakistan
This part of the paper highlights the issue of why MNEs undertake direct investment in Pakistan. The managers interviewed were not the same as those who made the initial decision to invest in Pakistan. Hence, at the time of the interview, the firms were asked to rate the factors that might have been important in the investment decisions of their parents. Each of the factors was rated on a scale of 1 to 513 where 1 represented the most important and 5 stood for insignificant. The average importance of each of the motives, perceived for FDI in Pakistan, is
12 A list of the MNEs surveyed can be obtained from the author.13 Where 1= Very important, 2= Important, 3= Adequate, 4= Indifferent and 5= Irrelevant
93

The Lahore Journal of Economics, Vol.5, No.2
presented in Table-3 below indicating the sample and sectoral ratings.
Although the degree of strength of each of the motives for FDI varies across sectors, these are not mutually exclusive within each sector as manifested by their average scores. Caution has to be taken while interpreting these results for two reasons. Firstly, the managers interviewed were not the original decision makers and secondly, their opinion is based upon subjective judgement of the factors that might have led the MNEs to invest in Pakistan.
94

Mohammad H. Akhtar & Peter J. Buckley
Table-3: Average importance of the motives for FDI in Pakistan:
Sample and sectoral averages
Rank
Motives Sample
Means
Mfg. Service
Trading
1 Market size 1.38 1.25 1.38 1.572 Market growth prospects 2.03 2.33 1.85 1.863 Higher rates of profits 3.06 3.17 2.62 3.714 Parent’s strategy 3.19 3.50 2.85 3.295 Lack of competition 3.94 3.67 3.92 4.436 Access to neighbouring
markets4.09 3.67 4.77 3.57
7 Historical links 4.13 4.50 3.77 4.148 Low labour costs 4.22 2.92 5.00 5.009 To overcome tariff barriers 4.37 3.58 5.00 4.57
10 Product diversification 4.47 4.00 4.62 5.0011 Low production costs 4.53 3.75 5.00 5.0012 Surplus labour 4.56 3.83 5.00 5.0013 Low transport costs 4.59 3.92 5.00 5.0014 To overcome non-tariff
barriers4.66 4.08 5.00 5.00
14 Cultural links 4.66 5.00 4.15 5.0014 Protection of existing export
market4.66 4.83 5.00 3.71
15 Lower costs of establishing projects
4.69 4.17 5.00 5.00
15 Geographical proximity 4.69 5.00 4.23 5.0016 Special economic zones 4.75 4.33 5.00 5.0017 Competitor’s reaction 4.78 4.83 4.62 5.0018 Special privileges by the
government4.87 4.67 5.00 5.00
18 Availability of raw materials 4.87 4.67 5.00 5.00*19 Ethnic ties 5.00 5.00 5.00 5.00*19 Problems in licensing
arrangements5.00 5.00 5.00 5.00
*19 Problems with existing agency
5.00 5.00 5.00 5.00
95

The Lahore Journal of Economics, Vol.5, No.2
*19 Lack of unionisation of labour
5.00 5.00 5.00 5.00
Notes: Mfg.= Manufacturing sector* None of the firms in the sample found these factors
as relevant.
4.1.1. Market size and Growth prospects
The definition of market size needs to be perceived in the context of the nature of business carried out by MNEs in the sample. For the manufacturing MNEs, market size represents all the segments of the population in Pakistan. But the notion of market size seems to be more restricted for non-manufacturing MNEs where it comprises mainly the upper class consumers and business community of the economy. Market size appeared as the most important factor for investing in Pakistan followed by market growth prospects. These factors had a strong pull for the firms in the sample across nationality, sectors, time of entry and ownership patterns. These findings are in agreement with the literature on market size and growth variables (Brash 1966, Wilkins 1970, Franko 1976, Reuber et al. 1973, Ajami and Ricks 1981, World Bank 1989, Artisien et al. 1991, Bürgenmeier 1991, Hood and Taggart 1997).
Table-4: Average importance of the motives for FDI in Pakistan:
by nationality
Motives UK USA Japan Germany
Others
Market size 1.17 1.20 1.25 1.33 1.64Market growth prospects 2.00 2.60 2.00 1.83 1.91Higher rates of profits 3.00 3.40 3.75 3.67 2.36Parent’s strategy 3.67 4.40 3.75 2.50 2.55Lack of competition 4.00 3.20 4.00 3.50 4.45Access to neighbouring markets
4.17 4.00 3.50 3.83 4.45
Historical links 2.00 5.00 5.00 5.00 4.09Low labour costs 4.33 3.80 5.00 3.50 4.45To overcome tariff barriers 4.50 4.40 5.00 5.00 3.73
96

Mohammad H. Akhtar & Peter J. Buckley
Product diversification 4.50 4.20 5.00 4.67 4.27Low production costs 4.17 4.20 5.00 4.33 4.82Cultural links 5.00 5.00 5.00 5.00 4.00Geographical proximity 5.00 5.00 5.00 5.00 4.09Surplus labour 4.50 4.80 5.00 4.33 4.45Low transport costs 4.50 5.00 5.00 4.33 4.45Protection of existing export market
4.17 5.00 4.25 5.00 4.73
Special economic zones 5.00 4.40 5.00 4.17 5.00Lower costs of establishing projects
4.50 4.60 5.00 4.67 4.73
Competitor’s reaction 5.00 5.00 5.00 5.00 4.36To overcome non-tariff barriers
4.67 4.80 5.00 4.50 4.55
Availability of raw materials 5.00 4.20 5.00 5.00 5.00Special privileges by the government
5.00 5.00 5.00 5.00 4.64
Ethnic ties 5.00 5.00 5.00 5.00 5.00Problems in licensing arrangements
5.00 5.00 5.00 5.00 5.00
Problems with existing agency
5.00 5.00 5.00 5.00 5.00
Lack of unionisation of labour
5.00 5.00 5.00 5.00 5.00
There were significant differences among firms in the sample across their motives to invest in Pakistan in terms of their size. For instance, MNEs having smaller size subsidiaries or branches with assets of 50 to 100 million rupees were found to be more motivated by market growth prospects followed by market size. For the MNEs with assets of 51 to 300 million rupees, market size appeared as more important rather than market growth. The significance of these motives is further strengthened by the fact that the manufacturing firms in the sample were mainly in Pakistan to serve the local market as revealed by the survey results. The results indicate that there is strong evidence to support the notion of market-seeking FDI as market size appeared to be very important to 63 per cent of the firms in the sample.
Table-5: Average importance of motives: By ownership pattern
Motives 100% 51-99%
97

The Lahore Journal of Economics, Vol.5, No.2
Market size 1.43 1.27Market growth prospects 1.95 2.18Higher rates of profits 2.95 3.27Parent’s strategy 3.14 3.27Lack of competition 4.00 3.82Historical links 4.10 4.18Access to neighbouring markets 4.38 3.55Protection of existing export market 4.57 4.82Cultural links 4.62 4.73Geographical proximity 4.67 4.73Product diversification 4.67 4.09Availability of raw materials 4.81 5.00To overcome tariff barriers 4.86 3.45Low labour costs 4.86 3.00Low production costs 4.86 3.91Competitor’s reaction 4.90 4.55To overcome non-tariff barriers 5.00 4.00Lower costs of establishing projects 5.00 4.09Ethnic ties 5.00 5.00Special economic zones 5.00 4.27Problems in licensing arrangements 5.00 5.00Problems with existing agency 5.00 5.00Lack of unionisation of labour 5.00 5.00Special privileges by the government 5.00 4.64Surplus labour 5.00 3.73Low transport costs 5.00 3.824.1.2. High rates of profits
Higher rates of profits was the next important motive for FDI in Pakistan after market size and growth factors. This motive was rated as adequately important both by the service and manufacturing MNEs. However, the service MNEs appeared to be more motivated by offensive i.e. profit-seeking reasons for FDI. Profit motive was also rated as important by firms with larger sales/revenues and fixed assets in Pakistan. The motive was found to be adequately important by the firms from the United States, group of others and those with the wholly-owned investment profile.4.1.3. Parent’s strategy
98
Mohammad H. Akhtar & Peter J. Buckley
For some of the firms (14.44 per cent), direct investment in Pakistan took place as an integral part of the overall strategy of the parents towards globalised production and sales. The parent’s strategy represents actions of the parent firms taken on the basis of certain perceived advantages, being explicit or implicit to them, of investing in Pakistan. The parent’s strategy emerged as adequately important for the service and trading firms. The MNEs investing in Pakistan after 1948 and onward found this factor to be adequately important than those entering before this period of time. This motive also captured an important place for the MNEs with small size subsidiaries and also those exporting from Pakistan. MNEs from Germany and group of others were found to be more motivated by this factor than their counterparts from Japan, UK and USA.4.1.4. Other motives
The market-seeking characteristic of all of the MNEs in the sample is also complemented by other features as well. For instance, MNEs in the manufacturing sector were more motivated by low labour costs in Pakistan than higher rates of profits. The geographical location of Pakistan was also seen as advantageous by some of the trading firms where access to neighbouring markets was deemed to be adequately important for FDI in Pakistan and for the service MNEs, higher rates of profits were found to be an adequate reason to invest. This reflects the fact that manufacturing MNEs are low cost-seeking unlike the service firms which are found to be profit-seeking. Special privileges by the government also turned out to be significantly important for one of the firms in the manufacturing sector. Such privileges mainly took the form of complete security against investment, exchange rate guarantee and zero tariff on production. The motive to overcome tariff barriers appeared to be very important for larger firms and the firms exporting from Pakistan. There appeared to be a marked difference, across motives for FDI in Pakistan, among three of the MNEs from Muslim countries in the sample and those from the rest of the world. The results of crosstabs indicated the fact that the Muslim countries’ MNEs were predominantly motivated by cultural links and factors such as market size, geographical proximity and
99

The Lahore Journal of Economics, Vol.5, No.2
parent strategy, being of the same significance, were next. In addition to that, these were the MNEs found to be motivated by psychic distance factors e.g. cultural bias, geographical proximity and historical links only. In the context of the historical links, there was also great evidence from the British MNEs investing in Pakistan on account of colonial bias.
It is evident from the analyses of Tables 3 to 5 that the most important motives, in actual practice, for FDI in Pakistan are primarily concerned with the market-seeking activity. The overwhelming significance of the factors related with the market-seeking nature of FDI in Pakistan is that of highlighting the existence of market potential in the economy. There seems to be limited evidence for the existence of potential for efficiency-seeking FDI in Pakistan as only 3 of the manufacturing MNEs were found to be exporting from Pakistan. This might be due to the protectionist policies followed by Pakistan for a long time and the existence of an anti-export bias in the trade regime resulting from such policies. However, this result needs to be viewed with caution on account of non-response by some of the MNEs. By the same token, low labour costs appeared to be important for manufacturing MNEs in Pakistan, the motive is not complemented by higher degree of significance of the motive for access to neighbouring markets. This might be an indication of the fact that the MNEs are trying to maintain/improve their competitiveness while serving the local market. Therefore, from the survey findings, it would be difficult to establish the existence of export-oriented motive for FDI in Pakistan.4.1.5. Factor analysis on the motives of FDI in Pakistan
FDI motives are seen to be varying across sectors, nationality and ownership thus, an exploratory factor analysis14 (EFA) was also conducted to detect the 14 Factor analysis is a statistical technique to represent a large number of variables into a few underlying factors. The variables, on the basis of their interrelationships, are grouped into few factors reflecting the fact that there exist some patterns in relationship among the variables. Each factor, comprising different variables is an explanation of each of the variables in that factor. Variables having a greater association with each factor appear with a high factor loading or correlation indicating the respective factor’s
100

Mohammad H. Akhtar & Peter J. Buckley
underlying factors in each category of motives for FDI in Pakistan. This is also considered useful for the reason that some of the motives ranked highly important by some of the MNEs appeared as insignificant in the overall sample. To achieve greater reliability in the analysis and for meaningful results, literature on factor analysis suggests a larger sample size than the variables to be examined in factor analysis. There is, however, no limitation on applying the factor analysis technique as long as the number of subjects is greater than the number of variates (Kline, 1994, p. 74 and Bryman and Cramer, 1997, p. 279).
The EFA was based on principal component extraction and in order to eliminate any chances of correlation among factors, varimax rotation method was employed. This initially resulted in 9 factors explaining 84 per cent of the overall variance. Table-6 shows the factors extracted with appropriate labels assigned to them on the basis of items within each factor. An examination of factor-item loadings and variances accounted for by the individual factors reveals that the uncovered structure of factors adequately captures the information contained in the variables.I. Lowering the transaction costs
The variables in factor 1, which explain 23.9 per cent of the variance, refer mainly XP lower transportation costs, lower costs of establishing projects, avail surplus labour benefit, low labour costs and overcome tariff and non-tariff barriers. This factor has high positive loadings with variables motivating the firms to lower their transaction costs. It is therefore, labelled as “lowering the transaction costs”.
score. Eigenvalues of greater than 1 are used as a criterion to select factors explaining the greater amount of variance in the data. Factor analysis is exploratory when it is used to find out if there exists any structure among a set of variables to present the data in a reduced form. In such a situation, the resulting factors are not known in advance and there are no constraints to be met, on a priori basis, by the analysis.
101
The Lahore Journal of Economics, Vol.5, No.2
Table-6: Exploratory factor analysis on the motives for FDI in Pakistan
Factors and Variables Factor-item
Correlation
Eigenvalue
Variance
Cumulative
Variance
Factor I:Lowering the transaction costs
5.25302 23.9% 23.9%
Low transport costs .90032Lower costs of establishing projects
.86147
To overcome non-tariff barriers
.79796
Surplus labour .78693Low labour costs .72107To overcome tariff barriers .65044
Factor II:Psychic distance 2.75949 12.5% 36.4%
Cultural links .95948Geographical proximity .95182
Factor III:Input prices 2.22886 10.1% 46.6%
Availability of raw materials
.94820
Low production costs .55877Factor IV:Special privileges 1.90572 8.7% 55.2%
Market growth prospects .62816Special privileges by the Govt.
.93337
Factor V:Special economic zones 1.55536 7.1% 62.3%
Special economic zones .82876Historical links .58808
Factor VI:Expansion of business 1.37737 6.3% 68.5%
Protection of existing export market
.89313
Access to neighbouring markets
.71640
Factor VII:Strategic reasons 1.24877 5.7% 74.2%
102

Mohammad H. Akhtar & Peter J. Buckley
Parent’s strategy .75737Competitor’s reaction .56361Product diversification .46124
Factor VIII:Higher profits 1.08332 4.9% 79.1%
Higher rates of profits .77796Lack of competition .76940
Factor IX:Market size 1.01012 4.6% 83.7%
Market size .92235II. Psychic distance
Factor 2 comprises two variables, cultural links and geographical proximity with the highest positive loadings and explaining 12.5 per cent of the variance. This refers to the factors that motivate MNEs to invest in Pakistan on account of cultural and geographic proximity. It is therefore, listed as the “psychic distance” factor. III. Input prices
Factor 3 indicates that the availability of raw materials for production and low production costs is another group of variables motivating these MNEs to invest in Pakistan on account of cost-effectiveness. This group of variables tends to explain about 10 per cent of the variance with high positive factor-item correlation and is identified as the “input prices”.IV. Special privileges
This factor appeared with a high positive correlation of 0.93337 with the variable “special privileges by the government”. Factor-item loading on the market growth prospects variable appeared to be negative. This factor indicates that FDI in Pakistan is motivated by the special privileges of the government and not by the market growth prospects and is therefore, designated as “special privileges”. It explains 8.7 per cent of the variance.V. Special economic zones
High and positive factor-item loading is shown by special economic zones variable, while a negative and
103
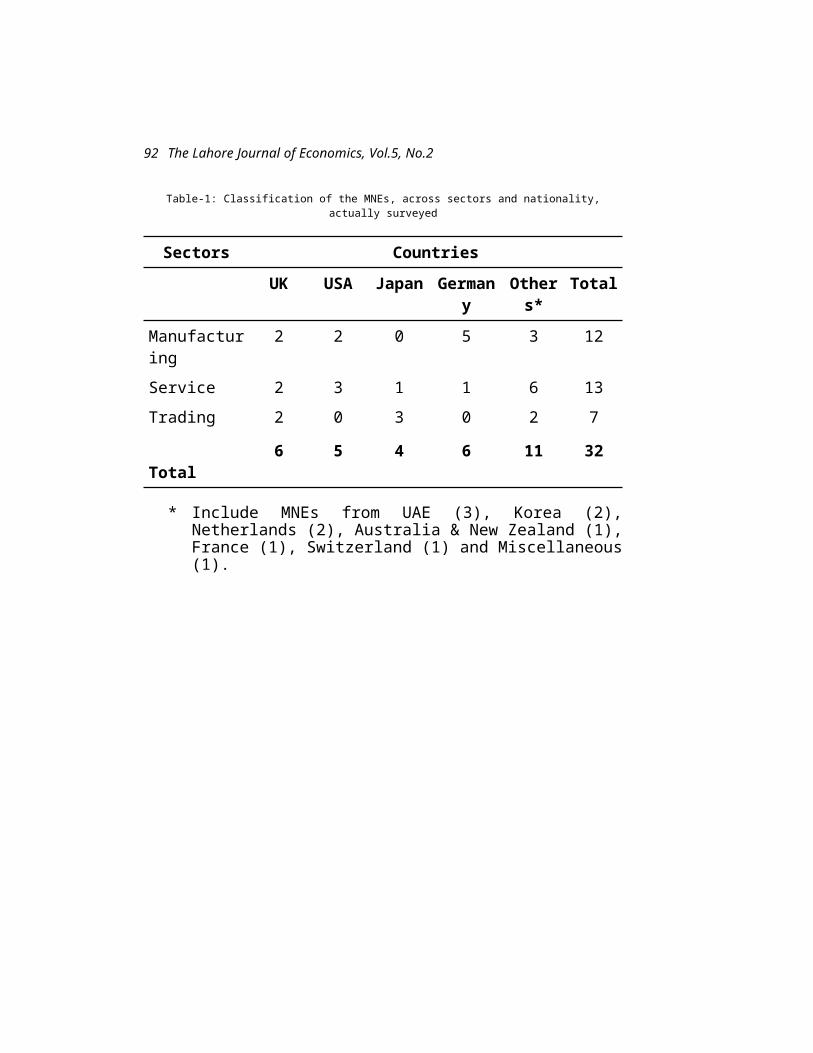
The Lahore Journal of Economics, Vol.5, No.2
relatively lower factor-item correlation exists between factor 5 and historical links variable. This shows that special economic zones in Pakistan motivate MNEs to invest and not the historical links. The factor explains 7 per cent of the variance and is branded as “special economic zones”. VI. Expansion of business
There were two variables in this group; protection of existing export market and access to neighbouring markets both with a high positive correlation with factor 6. This factor suggests the fact that localisation of production or sales by MNEs in the sample are motivated by their desire to maintain and expand their business volume. This group explains 6.3 per cent of the variance and is categorised as “expansion of business”.VII. Strategic reasons
This group comprises variables like parent’s strategy, competitor’s reaction and product diversification, which are largely related to the business strategy of MNEs. This factor explains 5.7 per cent of the variance and is termed as “strategic reasons”.VIII. Higher profits
The two variables, higher rates of profits and lack of competition, constitute this factor with positive high factor-item loadings. Lack of competition in a market strengthens the position of a firm towards earning more profits. The factor explains about 5 per cent of the variance and is classified as “higher profits”.IX. Market size
Among the nine factors produced by the factor analysis, market size appeared as a unique factor with a very high positive factor loading of 0.92235 and explaining 4.6 per cent of the variance. This factor suggests the fact that market size in Pakistan persuades the MNEs to invest there. Hence, this factor is termed as the “market size”.
104

Mohammad H. Akhtar & Peter J. Buckley
A detailed analysis of the factors, variables in the factors and factorvariable correlations, based on internal reliability analysis and alpha coefficients, was performed. Factors with low Cronbach’s alpha values, inconsistent meanings, and variables with low internal reliability were excluded from the analysis15. The remaining variables were again factor analysed. This process of factor purification produced four factors, explaining 79 per cent of the overall variance, with items loading on appropriate factor and also consistent with economic theory (Table-7).
15 Variables excluded from their respective factors were market growth prospects, historical links, lack of competition, higher rates of profits, special economic zones, product diversification, parent’s strategy, competitors’ reaction, and special privileges by the government.
105
The Lahore Journal of Economics, Vol.5, No.2
Table7: Purified factor analysis on the motives for FDI in Pakistan
Factors and Variables
Factoritem
Correlation
Alpha
Eigenvalue
Variance
Cumulative
Variance
Factor I:Lowering the transaction costs
0.88 4.65098 39% 39%
Low transport costs
0.87186
Surplus labour 0.86483To overcome non-tariff barriers
0.86433
Lower costs of establishing projects
0.80932
To overcome tariff barriers
0.72229
Factor II:Psychic distance 0.99 1.97280 16% 55%
Geographical proximity
0.98730
Cultural links 0.98724Factor III:Input prices 0.74 1.62124 13% 68%
Availability of raw materials
0.84960
Low production costs
0.79982
Low labour costs 0.61336
Factor IV:Expansion of business
0.59 1.25813 11% 79%
Protection of existing export market
0.85287
Access to neighbouring markets
0.81139
106

Mohammad H. Akhtar & Peter J. Buckley
Factor V:Market size n.a.
Market size 1.00
Notes: 1- n.a. denotes not applicable.As it is not possible to test the internal reliability of a
factor containing a single variable e. g. market size, no alpha coefficient is produced for this factor. The factor is presented in Table-7 as the fifth factor with a factor-item correlation of 1.00. The estimates of the factor-item loadings, reliability of factors (alpha values) and the variance explained by them indicate the appropriateness of results. This is also supported by the fact that although 10 out of the 22 variables are excluded from the analysis, only 5 per cent of the variance is lost. This indicates that variables included in the analysis contain most of the variance. Table-7 presents the factors finally extracted through purified factor analysis.
Simple averages indicate the market size and growth variables as the most cited reasons for FDI in Pakistan by MNEs in the sample. The use of EFA also reveals that the MNEs investing in Pakistan are motivated by market size, above all. The other important factors in order of their average importance16 are expansion of business; low input prices; desire to lower the transaction costs and psychic distance. The “expansion of business” factor signifies the growth motive of the MNEs and the “low input prices” factor alludes to the comparative cost advantage in Pakistan.5. Conclusion
Although market size and growth appear to be the most important motives for FDI in Pakistan, there seems to be a variety of other factors motivating each of the firms to invest in Pakistan. Results of the factor analysis exhibit the fact that expansion of business; low input prices; desire to lower the transaction costs and psychic distance factor are the likely explanations for FDI in Pakistan.
16 The average importance of factors is calculated by taking the average of the sample means presented in Table-3 of the variables in each factor.
107

The Lahore Journal of Economics, Vol.5, No.2
The study appraises the opinions and perceptions of the managers of MNEs in Pakistan about various aspects of FDI over there. On the whole, it emerges from the survey that there is a potential in the economy to absorb larger amounts of FDI inflows. However, to attract and entertain such inflows more appropriately, some bold reforms are needed which can help in building a better image of the economy. It can be argued that satisfaction on the part of existing MNEs in Pakistan seems to be an important determinant of FDI. There stands a need for greater efforts by the government to support and sustain the existing investments and with the prospects of more to come as well.
108
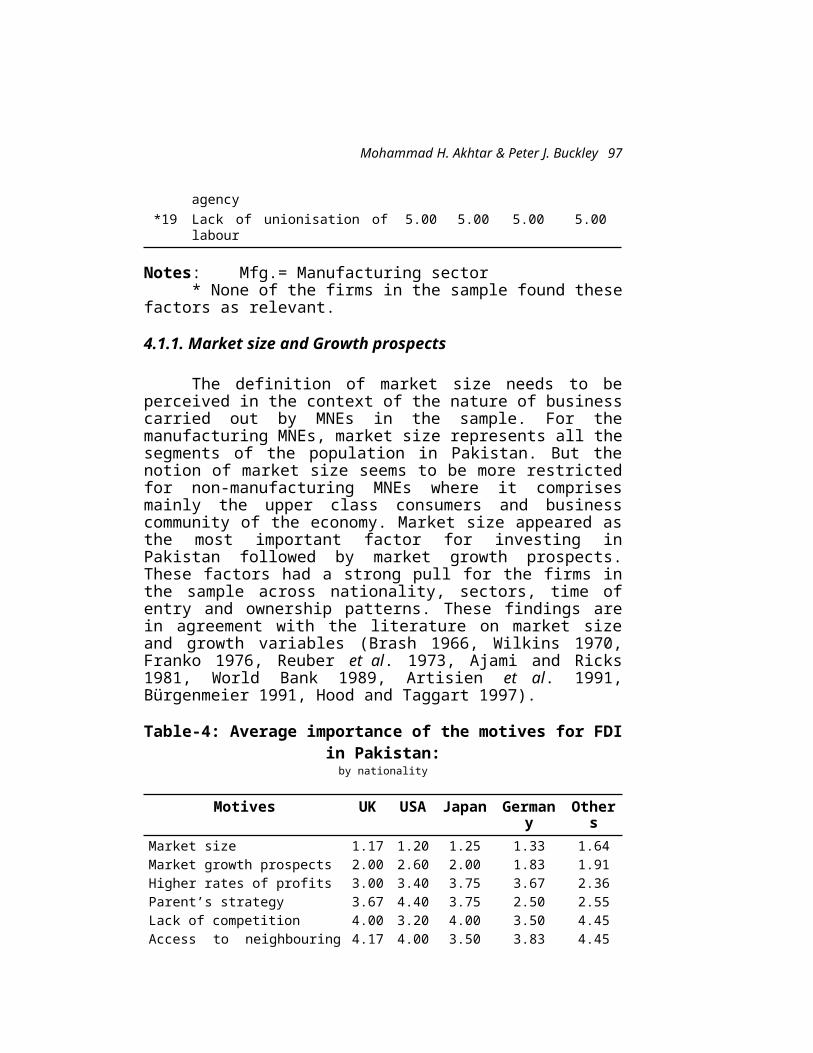
Mohammad H. Akhtar & Peter J. Buckley
References
Ajami, R. A. & Ricks D. A., 1981, Motives of Non-American Firms Investing in the United States. Journal of International Business Studies, 7: 25-34.
Artisien P., Rojec M. & Svetlicic M., 1991, Yugoslav Foreign Direct Investment in Less Developed Countries. In P. J. Buckley & J. Clegg (eds.), Multinational Enterprises in Less Developed Countries. Basingstock and London: Macmillan.
Brash O. T., 1966, American Investment in Australian Industry. Canberra: Australian University Press.
Bryman A. & Cramer D., 1997, Quantitative Data Analysis with SPSS for Windows, London: Routledge.
Buckley P. J. & Clegg J., 1991, Multinational Enterprises in Less Developed Countries. Basingstock and London: Macmillan.
Buckley P. J. & Mathew A. M., 1979, The Motivation for Recent First Time Direct Investments in Australia by UK firms. Management International Review, 19: 57-70.
Buckley P. J. & Casson M. R., 1976, The Future of the Multinational Enterprise. London: Macmillan.
Buckley, P. J., 1992, Studies in International Business. Houndmills: St. Martin’s Press.
Buckley, P. J., Newbould, G. D. & Thurwell, J. C., 1988, Foreign Direct Investment by Smaller UK Firms: The Success and Failure of First-Time Investors Abroad. London: Macmillan.
Bürgenmeier B., 1991, Swiss Foreign Direct Investment. In B. Bürgenmeier & J. L. Mucchielli (eds.) Multinational and Europe 1992: Strategies for the Future. London: Routledge.
109
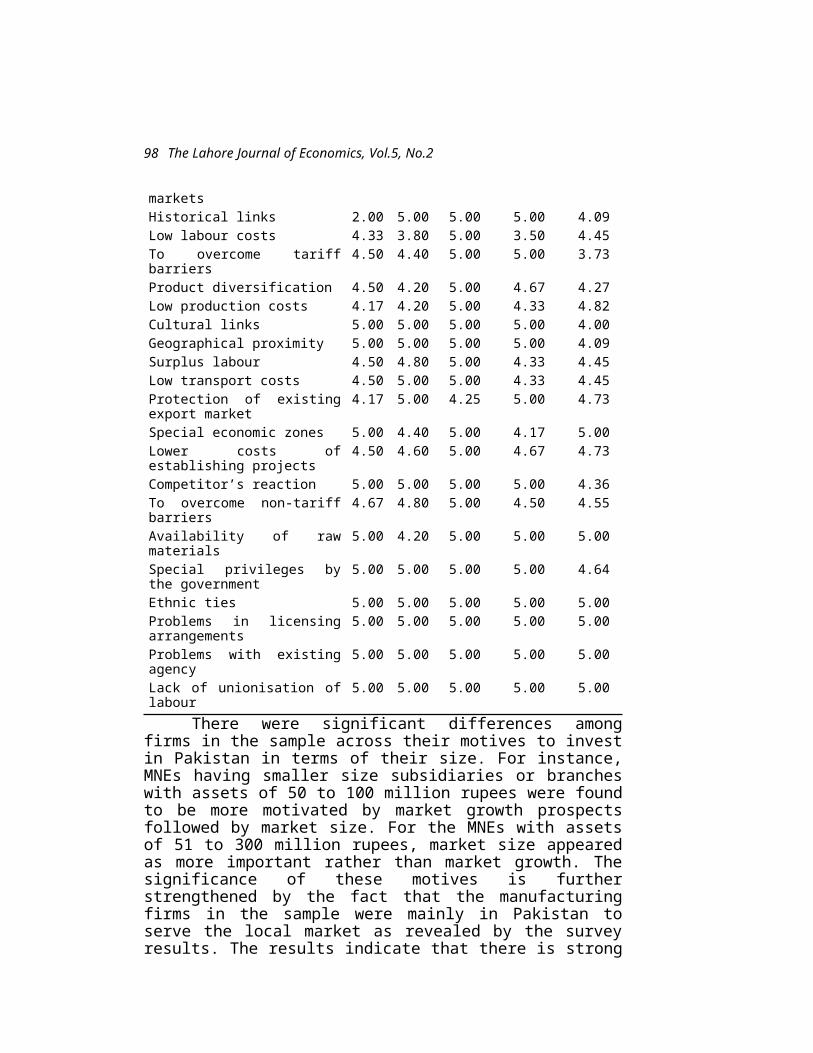
The Lahore Journal of Economics, Vol.5, No.2
Cavusgil S. T. & Zou S., 1994, Marketing StrategyPerformance Relationship: An Investigation of the Empirical Link in Export Market Ventures, Journal of Marketing, 58: 1 21.
Chen E. K. Y., 1983, Multinationals from Hong Kong. In S. Lall (ed.) The New Multinationals: The Spread of Third World Enterprises, Chichester: John Wiley and Sons.
Deshpande R., 1982, The Organisational Context of Market Research Uses, Journal of Marketing, 46: 91-101.
Dun & Bradstreet, 1996, Who Owns Whom 1995-96. London: Dun & Bradstreet.
Dunning J. H., 1986, Japanese Participation in British Industry. London: Croom Helm.
Dunning J. H. & Norman G., 1987, The Location Choice of Offices of International Companies. Environment and Planning A, 19: 613-631.
Dunning J. H., 1973, The Determinants of International Production. Oxford Economic Papers, 25 (3): 289-336.
Enderwick P., 1989, Some Economics of Service-Sector Multinational Enterprises. In P. Enderwick (ed.) Multinational Service Firms. Routledge: London.
Franko L. G., 1976, The European Multinationals: A Renewed Challenge to American and British Big Business. New York: Harper and Row.
Glaister K. W. & Buckley P. J., 1994, UK International Joint Ventures: An Analysis of Patterns of Activity and Distribution, British Journal of Management, 5: 33-51.
Glaister K. W. & Buckley P. J., 1996, Strategic Motives for International Alliance Formation, Journal of Management Studies, 33 (3): 301-332.
110
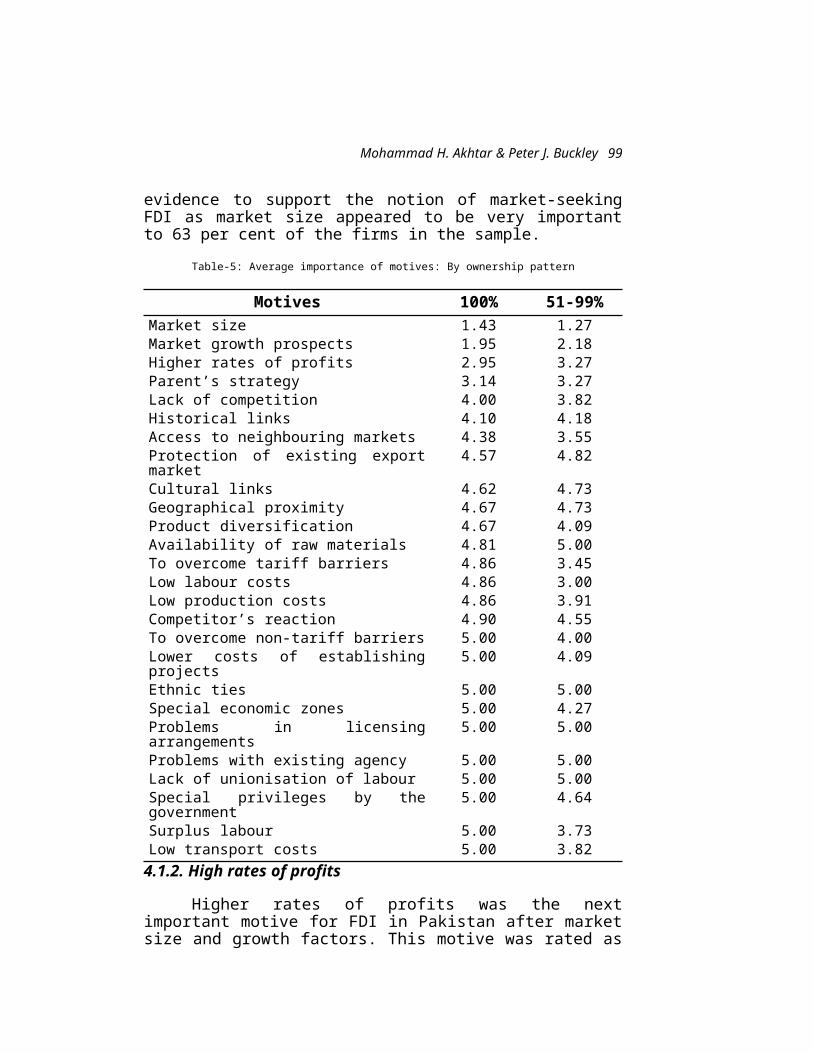
Mohammad H. Akhtar & Peter J. Buckley
Globerman S., 1994, Canadian Based Multinationals , Albertia: The University of Calgary Press.
GOP (Government of Pakistan) 1993, Pakistan Investment Guide 1992-93. Islamabad: Ministry of Industries.
Grubel, H. G., 1987, Multinational Banking. In P. Enderwick (ed.) Multinational Service Firms. Routledge: London.
Hair J. F. (Jr.), Anderson R. E., Tatham R. L. & Black W. C. 1995, Multivariate Data Analysis, Englewood Cliffs: Prentice Hall.
Hedderson J., 1991, SPSS/PC + Made Simple, California: Wadsworth.
Hood N. & Taggart J. H., 1997, German Foreign Direct Investment in the UK and Ireland: Survey Evidence, Regional Studies, 31 (2): 139-150.
Kline, P., 1994, An Easy Guide to Factor Analysis. Routledge: London.
Kumar K. & Kim K. Y., 1984, The Korean Manufacturing Multinationals. Journal of International Business Studies, 15: 45-61.
Kumar, N., 1994, Determinants of Export Orientation of Foreign Production by U.S. Multinationals: An Inter-Country Analysis, Journal of International Business Studies, 25 (1): 141-156.
Lecraw D., 1977, Direct Investment by Firms from Less Developed Countries. Oxford Economic Papers, 29, (3): 442-57.
Nicholas S. J., 1982, British Multinational Investment before 1939. Journal of European Economic History, 11: 605-630.
Reuber, G. L., Crokellel, H., Emerson, M. & Gallias-Hamono, G., 1973, Private Foreign Investment in Development. London: Clarendon Press.
111

The Lahore Journal of Economics, Vol.5, No.2
Shepherd D., Silberston A. & Strange R., 1985, British Manufacturing Investment Overseas. London and New York: Methuen.
Stopford J. M., 1974, The Origins of British-based Multinational Manufacturing Enterprises. Business History Review, 48: 303-335.
Tu J-H. & Schive C., 1995, Determinants of Foreign Direct Investment in Taiwan Province of China: A new approach and findings. Transnational Corporations, 4: 93-103.
Wilkins M., 1970, The Emergence of Multinational Enterprise: American Business Abroad from the Colonial Era to 1914. Cambridge, M A: Harvard University Press.
Wilkins M., 1974, The Maturing of Multinational Enterprise: American Business Abroad from 1914 to 1970. Cambridge, M A: Harvard University Press.
World Bank, 1989, Foreign Direct Investment from the Newly Industrialized Economies. Industry and Energy Department Working Paper, Industry Series Paper No. 22. World Bank.
112

Eatzaz Ahmad & Badar uz Zaman
Risk, Uncertainty and Returns at the Karachi Stock Exchange
Eatzaz Ahmad and Badar uz Zaman*
1. Introduction
According to the theory of risk, agents’ perceived welfare level is generally reduced when they are exposed to a more risky situation unless they are compensated for the risk. This compensation is known as risk premium. The Capital Asset Pricing Model (CAPM) proposes that the return on a risky asset over and above the return on a safe asset is a measure of risk premium. Therefore the rate of return increases with an increase in risk. This proposition has an important implication for the financial market. For example, if the excess holding period return on an asset is found to be unrelated to risk then the observed investment in the asset indicates that either the investors are risk neutral or they do not have complete information.
The main equity market in Pakistan, the Karachi Stock Exchange (KSE) has become quite active during the 1990s and has been identified as one of the twenty emerging markets by the International Financial Corporation. With the surge of activity at the Karachi Stock Exchange (KSE) since the early 1990s, a number of studies have been undertaken to analyse stock price indices in Pakistan. The first major study for Pakistan Khilji (1993) examined the time series behavior of monthly stock returns on the overall general share price index and the indices of major industries for the period July 1981 to June 1992. The beta estimates for various sectors were found to be close to one, implying that portfolios of investment diversified across industries are subject to the same amount of risk as those diversified within a particular industry. Using error correcting, first order autoregressive model, the study observed that the expected monthly returns were constant and equal to the long run expected * The authors are respectively Professor and Ph.D. student at the Department of Economics, Quaid-i-Azam University, Islamabad. They are thankful to Dr. Fazal Husain of the Pakistan Institute of Development Economics for his useful suggestions.
107

The Lahore Journal of Economics, Vol.5, No.2
return, suggesting that the financial market in Pakistan is efficient. The study also found that the distributions of returns were positively skewed, leptokertic and centered on positive means.
In a subsequent study conducted for weekly returns over the period July 1986 to June 1992, Khilji (1994) found that the majority of return series are characterised by non-linear dependence and that the expected monthly returns are time dependent.
A number of studies, e.g. Ahmed and Rosser (1995), Farid and Ashraf (1995), Hussain (1997) and Uppal (1993, 1994) analysed the volatility structure of stock return series using the ARCH family of models and examined other statistical properties. ARCH models can be used to study the patterns of volatility clusters. Furthermore the risk-return relationship can also be studied in the same framework by using ARCH-in-Mean specification, as is done in Ahmed and Rosser (1995). However, since the ARCH variance for each holding period is derived from past information on regression residuals in an estimated ARMA model, it is not based on any explicit information on variation within the holding periods. Thus the ARCH variance series is at best a crude approximation to the underlying variance.
The present study provides a systematic analysis of the relationship of stock market return with risk and uncertainty at the main equity market in Pakistan, the Karachi Stock Exchange (KSE). We postulate general forms of CAPM models to study the risk-return relationship for the overall KSE market index, the 11 sector indices and four sub-sector indices within the financial sector. The analysis is conducted for monthly returns over the period July-1992 to March-1997.
In the estimation of CAPM, the measurement of market volatility is a pre-requisite. An important aspect of this study is that volatility for each month is measured explicitly by estimating standard deviations of returns from daily data rather than relying on the implicit estimates from ARCH models or using moving samples of monthly returns as is done in Officer (1973) and Merton
108
Eatzaz Ahmad & Badar uz Zaman
(1980). Another attractive feature is that the estimated standard deviations of returns are split into a predicted component and an unpredictable volatility shock. The marginal effect of changes in the predicted component of standard deviation gives an estimate of risk premium while the effect of unpredictable shocks provides an estimate of the premium for absorbing uncertain market outcomes. In this way the study estimates the effects of both risk and uncertainty on the market returns. For further analysis we also study the relationship of sectoral returns with the risk and uncertainty in the overall stock market. Finally, to analyse market efficiency and flow of information, we also study whether the sectoral returns and volatility follow the general market trend, that is, do they rise and fall together?
The paper is organised as follows. Section 2 describes the method of analysis adopted for the application of a variety of Capital Asset Pricing Models. Data, estimation and results are discussed in Section 3 while Section 4 concludes the paper.2. Methodology
2.1. Capital Asset Pricing Model
According to the efficient market hypothesis when traders have complete information, assets’ prices are known with certainty and there are no transaction costs, the rates of return would be equalised across all assets through perfect arbitrage process. Under the assumption that financial markets are efficient, the Capital Asset Pricing Model (CAPM) explains the observed deviations from perfect arbitrage outcome on the basis of differential risks associated with different financial assets. CAPM assigns a specific meaning to the general notion of trade-off between risk and return whereby risk-averse investors holding a well diversified portfolio will be willing to invest in a risky asset when the return on this asset includes a premium that fully compensates for the systematic (non-diversifiable) risk.
Risk is conventionally measured by variance or standard deviation of return while the reward for taking
109

The Lahore Journal of Economics, Vol.5, No.2
risk is measured by excess holding period return, defined as the rate of return on the risky asset minus the rate of return on some safe asset over a specific holding period. Following French et al. (1987), we can write a simple form of CAPM as
E[(Rm – Rf )m] = m + m (m) j + m , j = 1,2 (1)where Rm is the rate of return on the market asset m, R f is a risk-free interest rate, m is the ex-ante standard deviation of the return on asset m, E is expectations operator, m and m are parameters and m is a white noise error term. The superscript j = 1 or 2 means that the excess holding period return Rm - Rf can be related to standard deviation (j = 1) or variance (j = 2).
If m = m = 0, the expected risk premium would be zero irrespective of the extent of volatility. When m 0 but m = 0, the return on the risky asset differs from the risk free interest rate, but the difference is independent of volatility. This difference could be attributed to disparity in transaction costs or in premium associated with term structure of the risky and safe assets. On the other hand m = 0 but m 0 means that the excess holding period return is related to volatility only. In case m > 0, the excess return can be interpreted as a risk premium which is proportional to standard deviation or variance. The perverse case m < 0 could imply that the market is dominated by such agents for whom increased volatility is an incentive to invest in the asset under consideration. Given the general expectation that market is dominated by risk averse investors and the safe asset has a longer maturity period, we expect that m < 0 and m > 0. Deviations from this rule are possible if market information is not perfect or transaction costs differ between the risky and safe assets.
Equation (1) has an interpretation of population regression function. In its sample counterpart population standard deviation m is replaced by the sample estimate Sm to yield
Rmt – Rf t = m + m (Smt) j + Ut , (2)
110

Eatzaz Ahmad & Badar uz Zaman
2.2. Volatility, Risk and Uncertainty
In the practical application of CAPM, measurement of volatility poses a difficult task. Officer (1973) and Merton (1980) derived the standard deviations of returns by using moving samples of monthly returns for twelve months. French et al. (1987) point out that in this approach the standard deviations for two consecutive months share eleven overlapping returns and, hence, do not show sufficient variation across months. A more serious problem is that the standard deviations measure month to month, rather than within month, variation. Thus following French et al. (1987) we use daily data to compute monthly standard deviation as follows:
Smt =Nt
i=1
(rti ) 2
½1/2½
(3)
where Nt is the number of trading days in month t, and rti is the rate of return on day i of month t. Since monthly variation is the sum of day to day variation within a month, the sum of variations is not divided by the number of trading days.
French et al. (1987) also propose the following adjustment in the standard deviation formula for serial correlation in daily returns.17
Smt =Nt
i=1
(rti ) 2
+ 2
Nt
i=1
rti rt,i-1
1/2
(4)
Following Chen et al. (1986) and French et al. (1987) we now decompose the standard deviation (or variance) into a predictable component and the prediction error using ARIMA models. Predicted standard deviation (or variance) is a measure of risk wherein the probability 17 The formulas in (3) and (4) can also be adjusted to measure deviations from mean. French et al. (1987) have shown that this adjustment does not produce any substantial difference. In (4), the presence of cross products can be troublesome as the variance may turn out to be negative and the standard deviation a complex number. If this happens in our calculation, we shall use (3) instead of (4).
111

The Lahore Journal of Economics, Vol.5, No.2
distribution of return is known but the realised outcome is not known. The prediction error in the standard deviation (or variance), on the other hand, can be regarded as a measure of uncertainty in the sense that the agents are unable even to forecast the magnitude of volatility.
For diagnosing the ARIMA process, we study autocorrelation functions of four alternative variables: standard deviations, first difference of standard deviation, log of standard deviation and first difference of log of standard deviation and another four by replacing standard deviation by variance. The results (to be discussed in Section 3) show that in all the sectors autocorrelation coefficients for the first difference of standard deviations diminish within a maximum of four months lag. Thus we specify the following integrated moving average process.
(1 – L)Smt
= m0 +
k
i=1mi Li t, (5)
where L is the lag operator and k is the order of moving average process to be determined.
To get the predicted first difference of standard deviation, we subtract the residuals in the estimated equation (5), denoted et, from observed first difference of standard deviation. Therefore
[(1 – L)Smt ] p = (1 - L)Smt - et, (6)
where the superscript P indicates the predicted value and t stands for the time period. To convert the fitted first differences into the levels, we assume that for the first period the predicted standard deviation is equal to its original value.18 For all the subsequent periods the predicted values of standard deviation are generated as follows.
18 This assumption will only change the original of the fitted standard deviation series without changing its scale or other properties.
112
Eatzaz Ahmad & Badar uz Zaman
(Smt) P
=S0
+
t
i=1[(1 – L) Smi ]P i = 1,2, …..
(7)
where S0 is the originally computed standard deviation for the first month.
Finally, the prediction error is given byPEmt = Smt – (Smt ) P (8)
2.3. Stock Return, Risk and Uncertainty
Given that the monthly standard deviation is split into the predictable and unpredictable components, the CAPM given in equation (2) can be generalised as follows.
Rmt - Rft = m + m(Smt ) P + m PEmt + ut (9)By this extension we can estimate the separate
effects of anticipated volatility and unpredictable volatility shocks on returns. One can expect as a general rule that the stock market return not only includes a risk premium against the known risk but also a compensation for uncertainty as measured by the prediction error in volatility. Thus both m and m are expected to be positive.
In another version of CAPM sectoral returns are related to the overall market volatility:
Rmt - Rft = m + bm(SGt ) P + cm PEGt + ut , (10)where (SGt)P and PEGt stand for the predicted standard deviation and the prediction error in the standard deviation, both measured from the general market index. On theoretical grounds the signs of am, bm and cm are not determined. If bm > 0, it implies that the return on the asset m increases when the overall market is subjected to increased risk. This means that asset m is hedged against the overall market risk. On the other hand, bm < 0 implies that the asset m becomes relatively less attractive during periods of high market volatility. It is obvious that bm = 0 would mean that the return on the asset m is independent
113
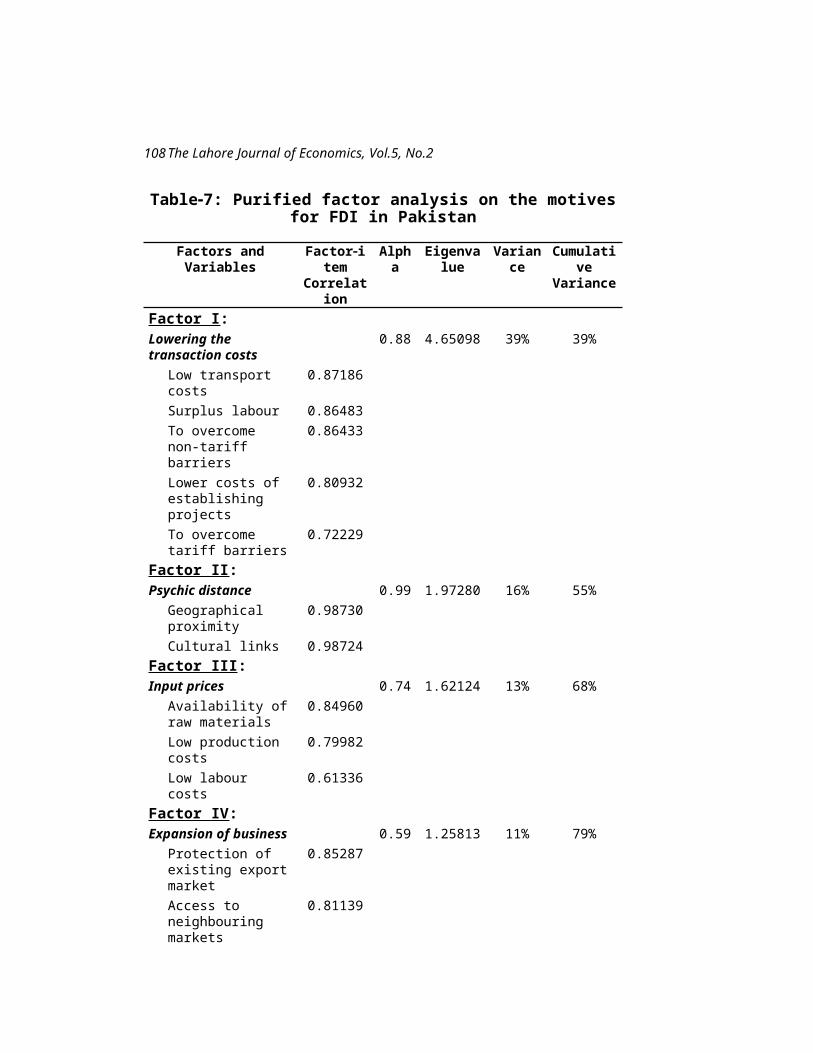
The Lahore Journal of Economics, Vol.5, No.2
of expected volatility in the overall market. The sign of cm can be interpreted likewise.
It would also be interesting to find out as to whether or not the return in a particular sector rises and falls with the overall market. This can be tested by estimating the following equation.
Rmt - Rft = m + m(RGt - Rft ) + ut (11)The final step in our analysis is to study the
relationship of volatility in a particular stock return with the overall market volatility. This relationship is given by:
Smt = m0 + ml SGt + ut , (12)This completes the theory of CAPM and we now turn
to the empirical side.3. Data, Estimation and Results
We have selected the main equity market in Pakistan, Karachi Stock Exchange (KSE), for our analysis. Stock market indices are prepared and maintained by the State Bank of Pakistan (SBP). The daily indices, available in the files of the SBP, are adjusted for capital changes (dividends, right issues, and bonus shares). The State Bank General Index (SBGI) covers all the stocks listed on the KSE. We include in our analysis the general index, all the sector indices except miscellaneous and the four sub-sectors indices in the sector ‘Banks and Other Financial Institutions’. Data on general and sector indices are taken on monthly as well as daily basis for the period July 1, 1992 to March 31, 1997. The monthly and daily rates of return are computed respectively as the month to month and day to day relative change in the stock price indices. For risk free interest rate we use the treasury bills rate because treasury bills have short-term maturity and the rate of return is fixed over the holding period.
The first step in estimation is to compute monthly standard deviation from daily return. With autocorrelation adjustment (equation (4)) the variance is estimated to be negative for some months. Therefore we shall use the
114

Eatzaz Ahmad & Badar uz Zaman
estimated standard deviation based on equation (3) only. The time series of monthly returns and standard deviations are shown in Figure 1. The month-to-month volatility can be seen from the fluctuations in monthly returns while the day-to-day volatility is implicit in the monthly standard deviations.
The graphs show that KSE has generally been a highly volatile market. Starting from relatively low rates of return in 1992-93, the market quickly picked up and the returns soared during the fiscal year 1993-94. Later on the market went into a depression with a partial recovery in early 1997. It is also noticeable that the peak period of return 1993-94 was accompanied by a high level of volatility as well. The same pattern is observed during early 1997 when the market recovered partially. This could mean that the investors are still not sure about the market trend and their confidence has not yet been restored.
115

The Lahore Journal of Economics, Vol.5, No.2116

Eatzaz Ahmad & Badar uz Zaman
The returns in financial sectors have been relatively more stable than in the other sectors. Thus the investors appear to have more confidence in the performance of this sector. The reason could be that the financial sector is dominated by publicly owned banks and other financial institutions and the investment in many cases is guaranteed by the Government of Pakistan.
To diagnose stochastic processes for the variance of returns, we computed up to twelfth-order sample autocorrelation coefficients for the level and the first difference of the variance as well as of the log of variance. The same is repeated for the standard deviation. The results show that only in the case of first difference of standard deviations, the autocorrelation coefficients diminish within four months lag. For other specifications the autocorrelation coefficients either do not converge or oscillate. This result indicates the presence of strong integrated moving average process for the standard deviations series.
Based on the study of correlograms and experiments with alternative specifications, we diagnose the appropriate integrated moving average processes of different orders for various sectors. The estimates of equation (5), reported in Table 1, show that parameters of the MA process are mostly significant. All the t-statistics exceed unity, implying that the proposed MA specifications cannot be further truncated in the light of Theil’s adjusted R2 criterion.
From these estimates we have computed the predicted standard deviations of returns and the prediction error using equations (6), (7) and (8). These estimates are then used to estimate various CAPM models.
117
The Lahore Journal of Economics, Vol.5, No.2
Table 1: Selected Integrated Moving Average Models
(Dependent Variable is the First Difference of Standard Deviation of Return)
Sector m0 m1 m2 m3 m4 R2 F-stat
s
DW-
stats
General index
0.00056
(0.18)
-0.543(-
4.51)*
-0.470(-
3.80)*
0.31 11.96*
2.17
Cotton & other textiles
0.00024
(0.01)
-0.565(-
4.18)*
-0.417(-
3.09)*
0.41 18.55*
2.70
Chemicals & pharmaceuticals
0.00037
(0.02)
-0.784(-
5.39)*
-0.207(-1.25)
0.227(1.38)
-0.226(-1.55)
0.52 14.08*
2.37
Engineering 0.00018
(0.03)
-0.596(-
4.77)*
-0.355(-
2.84)*
0.41 18.28*
2.64
Auto & allied -0.0003
4 (-0.05)
-0.750(-
5.81)*
-0.267(-1.67)
0.370(2.78)
*
0.48 15.79*
2.17
Cables & electrical good
-0.0001
7(-0.05)
-0.673(-
6.50)*
0.27 19.73*
1.83
Sugar & allied
0.00025
(0.04)
-0.962(-
15.06)*
0.50 53.00*
2.06
Paper & allied
-0.0004
8(-0.00)
-0.783(-
5.31)*
-0.217(-1.51)
0.52 28.20*
2.59
Cement 0.00072
(0.06)
-0.540(-
4.32)*
-0.407(-
3.13)*
0.31 11.89*
2.31
Fuel & energy
-0.0008
5(-0.26)
-0.541(-
4.95)*
0.19 12.77*
1.90
Transport & 0.0001 -0.644 -0.269 0.200 -0.266 0.47 11.33 2.27
118

Eatzaz Ahmad & Badar uz Zaman
communication
7(0.02)
(-4.32)*
(-1.62) (1.18) (-1.74)*
*
*
Banks & other financial institutions
0.00075
(0.07)
-0.636(-
4.61)*
-0.353(-
2.57)*
0.40 17.85*
2.46
Banks & investment companies
0.00013
(0.00)
-0.608(-
4.62)*
-0.376(-
2.80)*
0.42 18.97*
2.50
Modarabas -0.0000
0(-0.01)
-0.969(-
16.05)
0.56 69.43*
2.34
Leasing companies
0.00096
(0.03)
-0.985(-
24.68)*
0.51 56.26*
2.06
Insurance 0.00205
(0.16)
-0.631(-
4.50)*
-0.380(-
2.72)*
0.36 14.93*
2.15
Note: The statistics significant at 5 per cent and 10 per cent levels are marked by * and ** respectively.
119

The Lahore Journal of Economics, Vol.5, No.2
The results of the CAPM model given in equation (9) are presented in Table 2. These results show that all the betas associated with the predicted standard deviation as well as with the prediction error are positive and most of them are statistically significant. Thus the excess monthly returns include a premium for taking the predictable risk. Further when the observed volatility turns out to be more than what had been predicted, the investors are shocked by bad news; thus a premium is rewarded to compensate for the uncertainty or unexpected risk. Likewise the premium is adjusted downward in the light of unexpected decline in volatility.
The presence of positive risk premium as well as a reward for willingness to accept uncertain market outcomes indicates that Karachi Stock Exchange in general provides reasonable compensation for risk and uncertainty. Coupled with high rates of return during the early 1990s, this explains why during this period the Pakistani stock market had been ranked number four among the emerging markets.19 After this period though the rates of return have generally remained low.
We also observe that the risk premia are relatively higher in Cables & Electrical goods, followed by Modarabas, Leasing Companies, Auto & allied, Cement, and Transport & Communication. This means that in these sectors the amount of risk perceived by investors is likely to be more than the actual amount of risk. On the other hand, the risk premia are low in Chemicals & Pharmaceutical, Paper & allied, Fuel & Energy, and Banks & other financial institutions. In these sectors the investors’ perceived risk could be relatively low. Furthermore in general the compensation for unpredictable volatility is also higher (lower) in the sectors where the risk premium is higher (lower). Therefore the excess monthly returns adjust upward not only in response to expected increase in volatility but also in the light of unexpected volatility shocks.
19 See International Financial Corporation (1992).
120
Eatzaz Ahmad & Badar uz Zaman
Table 2: The Relationship of Excess Monthly Return with Risk and Uncertainty
Sector Intercept
Predicted
SD of return
Prediction error in SD of return
R2 F DW
General index
-0.045(-1.78)**
1.009(2.27)*
1.062(2.31)*
0.09 2.68 1.43
Cotton & other textiles
-0.034(-2.68)*
0.676(2.93)*
0.580(2.69)*
0.14 4.36* 1.52
Chemicals & pharmaceuticals
0.006(0.44)
0.189(0.80)
0.041(0.18)
0.06 1.86 1.62
Engineering -0.042(-1.86)**
1.016(2.41)*
0.726(1.86)**
0.11 3.29**
1.39
Auto & allied -0.063(-2.90)*
0.808(3.03)*
0.625(3.07)*
0.16 5.11* 1.71
Cables & electrical good
-0.116(-3.25)*
2.119(3.36)*
1.340(3.06)*
0.18 5.79* 1.75
Sugar & allied
-0.050(-2.25)*
0.614(1.68)**
0.368(0.96)
0.07 1.91 1.93
Paper & allied
-0.030(-1.15)
0.380(1.40)
0.333(1.40)
0.04 1.04 1.55
Cement -0.018(-0.46)
0.780(2.10)*
1.217(3.09)*
0.17 5.32* 1.20
Fuel & energy
0.037(0.49)
0.502(0.68)
0.443(0.83)
0.01 0.34 1.57
Transport & communication
-0.076(-2.63)*
0.779(2.57)*
0.680(2.36)*
0.11 3.32**
2.04
Banks & other financial institutions
-0.031(-1.30)
0.595(1.68)**
0.227(0.71)
0.06 1.67 1.72
Banks & investment companies
-0.037(-1.25)
0.563(2.13)*
0.401(1.61)
0.08 2.26 1.57
Modarabas -0.097(-3.55)*
1.023(3.26)*
1.030(3.40)*
0.18 5.96* 2.09
Leasing companies
-0.030(-0.98)
0.817(3.10)*
0.718(2.84)*
0.15 4.90* 1.63
Insurance -0.018 0.581 0.836 0.16 5.19* 2.10
121
The Lahore Journal of Economics, Vol.5, No.2
(-0.56) (2.38)* (3.20)*
Note: The statistics significant at 5 per cent and 10 per cent levels are marked by * and ** respectively.With only two exceptions, the alpha values are
negative. This means that if risk is not present, the excess monthly return will be negative. This is an expected result because treasury bills have a relatively longer maturity period as compared to stock market assets which are redeemable at all times. Thus the excess monthly return over the treasury-bills rate reflects term-structure; it can be regarded as a premium for the forgone liquidity.
We now study as to how the excess monthly returns in individual sectors are related to volatility in the overall stock market. The estimates of equation (10) are shown in Table 3. As before, the alpha value is negative in all but one case. The results also show that, in general, volatility and uncertainty in the overall market have a significant influence on the rates of return in the individual sectors. The betas associated with the predicted standard deviation of market return are positive. Thus the excess monthly returns include premia for the overall market risk. The betas associated with prediction error in the standard deviation of returns are also positive implying that investors are also compensated for uncertainty prevailing in the overall market.
The above result means that the investors in a particular sector interpret the increased expected volatility in the overall market as a signal for the increased risk within the sector. Therefore the assets’ demand in that sector is reduced until the risk premium in enough to cover the perceived increase in risk. Likewise an unexpected volatility shock in the overall stock market is interpreted as an increased uncertainty of return within the sector.
To study how the returns in the individual sectors relate to the overall stock market performance, we now estimate equation (11). The results presented in Table 4 show that the relationship between the return in an
122

Eatzaz Ahmad & Badar uz Zaman
individual and the overall market return is positive and significant for all the sectors. Thus the returns in the individual sectors rise and fall together.
123

The Lahore Journal of Economics, Vol.5, No.2
Table 3: The Relationship of Sectoral Excess Monthly Return
With Risk and Uncertainty in the Overall Market
Sector Intercept
Predicted SD
of return on
general index
Prediction error
in SD of return
on general index
R2 F DW
Cotton & other textiles
-0.055(-3.02)*
0.801(2.47)*
0.787(2.35)*
0.11 3.19**
1.47
Chemicals & pharmaceuticals
-0.018(-0.85)
0.611(1.69)**
0.701(1.85)**
0.07 2.03 1.62
Engineering -0.044(-
1.71)**
1.058(2.32)*
1.139(2.42)*
0.10 3.01 1.38
Auto & allied
-0.031(-1.11)
0.554(1.13)
0.588(1.16)
0.02 0.67 1.67
Cables & electrical good
-0.014(-0.52)
0.329(0.68)
0.388(0.77)
0.02 0.43 1.78
Sugar & allied
-0.045(-2.24)*
0.725(2.02)*
0.719(1.94)**
0.07 2.10 1.94
Paper & allied
-0.023(-1.15)
0.644(1.80)**
0.720(1.94)**
0.07 2.15 1.45
Cement -0.032(-0.86)
1.293(1.96)**
1.515(2.23)*
0.11 3.48**
1.09
Fuel & energy
-0.023(-0.77)
0.651(1.10)
0.679(1.11)
0.02 0.62 1.61
Transport & communication
-0.068(-
1.98)**
0.976(1.59)
0.943(1.49)
0.05 1.38 2.00
Banks & other financial institutions
-0.058(-
1.69)**
1.415(2.31)*
1.500(2.37)*
0.09 2.82 1.70
Banks & 0.052 1.198 1.254 0.05 1.50 1.59
124

Eatzaz Ahmad & Badar uz Zaman
investment companies
(1.32) (1.71)** (1.73)**
Modarabas -0.091(-2.70)*
1.523(2.54)*
1.504(2.43)*
0.11 3.33**
1.89
Leasing companies
-0.058(-1.62)
1.315(2.07)*
1.375(2.09)*
0.08 2.19 1.57
Insurance -0.077(-
1.86)**
2.657(3.61)*
2.878(3.78)*
0.22 7.43* 2.18
Note: The statistics significant at 5 per cent and 10 per cent levels are marked by * and ** respectively.
Table 4: Relationship of Sectoral Excess Monthly Return
With the Return on General Index
Sectors Intercept
Excess monthly
return on general index
R2 F DW
Cotton & other textiles
-0.0116(-2.77)*
0.604(10.67)*
0.67 113.93*
1.61
Chemicals & pharmaceuticals
0.0028(0.79)
0.737(15.43)*
0.81 238.19*
2.31
Engineering -0.0028(-0.42)
0.788(8.79)*
0.58 77.32* 1.80
Auto & allied -0.0060(-0.75)
0.691(6.30)*
0.42 39.66* 1.75
Cables & electrical good
-0.0048(-0.55)
0.591(5.04)*
0.32 25.37* 2.30
Sugar & allied
-0.0070(-1.18)
0.539(6.79)*
0.46 46.06* 2.05
Paper & allied
-0.0020(-0.36)
0.583(7.89)*
0.53 62.26* 2.07
Cement -0.0001(-0.01)
1.278(12.01)*
0.72 144.14*
1.29
Fuel & 0.0073 1.116 0.76 171.50 2.54
125

The Lahore Journal of Economics, Vol.5, No.2
energy (1.16) (13.10)* *Transport & communication
-0.0107(-1.26)
1.047(9.11)*
0.60 82.98* 2.39
Banks & other financial institutions
0.0013(0.18)
1.167(11.72)*
0.71 137.36*
2.40
Banks & investment companies
0.0034(0.58)
1.431(17.94)*
0.85 321.68*
1.95
Modarabas -0.0097(-1.20)
1.090(9.93)*
0.64 98.62* 2.04
Leasing companies
0.0015(0.23)
1.260(14.18)*
0.79 201.02*
1.95
Insurance 0.0163(1.05)
0.866(4.11)*
0.24 16.93* 2.48
Note: The statistics significant at 5% and 10% levels are marked by * and ** respectively.However, as typically happens, the day-to-day
variations in stock returns may not necessarily follow the market trend. The results, however, suggest that within a period of one month the sectoral returns catch-up with the market trend. An obvious implication of this result is that the trading activities at KSE are competitive.
Finally, we study how the volatility within a sector relates to the volatility in the overall stock market. The estimates of equation (12), presented in Table 5, show that the standard deviations of returns in individual sectors are positively correlated with the standard deviation of overall average return in the stock market and the relationship is significant in 13 out of the 15 cases. Thus volatility in the individual sectors closely follows the market trend. This means that the stock market volatility is mostly the outcome of speculative activities, which affect the market on a broad basis.
The above result, along with our conclusion that sectoral returns closely follow the market trend, implies
126

Eatzaz Ahmad & Badar uz Zaman
that the trading decision at KSE are significantly influenced by sentiments and that the market is exposed to external shocks that affect the whole stock market somewhat symmetrically. These results also indicate that dissemination of information is efficient.4. Conclusions
In this paper we have investigated the relationship between excess monthly return, risk and uncertainty at the Karachi Stock Exchange in the framework of Capital Asset Pricing Model (CAPM) using monthly data. Daily data are used to estimate volatility within the months. The analysis is conducted for the overall market at Karachi Stock Exchange, its 11 sectors and four sub-divisions of the financial sector. The study covers the period July 1992 to March 1997.
127

The Lahore Journal of Economics, Vol.5, No.2
Table 5: The Relationship of Return on Sectoral and Market Volatility
(Dependent Variable is Monthly Standard Deviation of Excess Return)
Sectors Intercept
Monthly standard
deviation of excess return
on general index
R2 F DW
Cotton & other textiles
0.0105(1.12)
0.6279(3.46)*
0.18 11.98*
1.92
Chemicals & pharmaceuticals
-0.0096(0.94)
0.6992(3.50)*
0.18 12.28 2.11
Engineering 0.0366(4.77)*
0.3301(2.21)*
0.08 4.89 2.16
Auto & allied 0.0475(3.06)*
0.1899(0.63)
0.01 0.40 2.01
Cables & electrical good
0.0228(3.35)*
0.3230(2.43)*
0.10 5.92 1.45
Sugar & allied
0.0193(2.99)*
0.3488(2.78)*
0.12 7.71 1.85
Paper & allied
0.0361(3.47)*
0.2903(1.43)
0.04 2.05 2.04
Cement 0.0109(1.31)
1.2534(7.75)*
0.52 60.10 1.35
Fuel & energy
0.0310(5.11)*
0.7190(6.10)*
0.40 37.20 1.20
Transport & communication
0.0466(3.67)*
0.9268(3.75)*
0.20 14.07 1.52
Banks & other financial institutions
-0.0045(-0.46)
1.4571(7.82)*
0.53 61.18 1.58
Banks & investment companies
0.0011(0.08)
1.9507(6.82)*
0.46 46.47 1.85
Modarabas 0.0385 0.8528 0.20 13.46 2.14
128
Eatzaz Ahmad & Badar uz Zaman
(3.23)* (3.67)*Leasing companies
0.0147(1.03)
1.2144(4.36)*
0.26 19.01 1.97
Insurance 0.0364(1.65)
0.9076(2.11)*
0.08 4.46 1.22
Note: The statistics significant at 5% and 10% levels are marked by * and ** respectively.The results indicate that the excess monthly return
in a sector depend not only on the level of volatility within that sector, but also on the overall stock market volatility. The individual sectors’ returns include risk premia that take into account the predictable risk within the sector and in the overall stock market. In addition, the sectoral rates of return adjust pro-cyclically with the unexpected volatility shocks within the sector as well as in the overall stock market. The stock price returns in various sectors generally follow a pro-cyclical trend with the overall market performance, that is the rates of return in various sectors rise and fall together in the long run. Finally, the volatility within the sectors also closely follows the market trend.
The above results have a number of implications. The presence of significant risk premia and compensation for unexpected shocks means that the majority of investors at the KSE appear to be risk averse and by and large their activities are based on rational decisions. Since the sectoral returns rise and fall together, one can conclude that the stock market is highly competitive and the trading conditions adjust in the light of expected capital gains or losses. This also means that the market trend is predominantly set by rational expectations rather than the so called ‘band-wagon effect’.
The presence of a high level of volatility across the market and the close pro-cyclical movements in the level of volatility in various sectors of the market suggest that the speculative activities are wide spread and that no sector can be regarded as immune to speculation. This means that the market is highly exposed to external shocks and the flow of information is rapid enough to
129
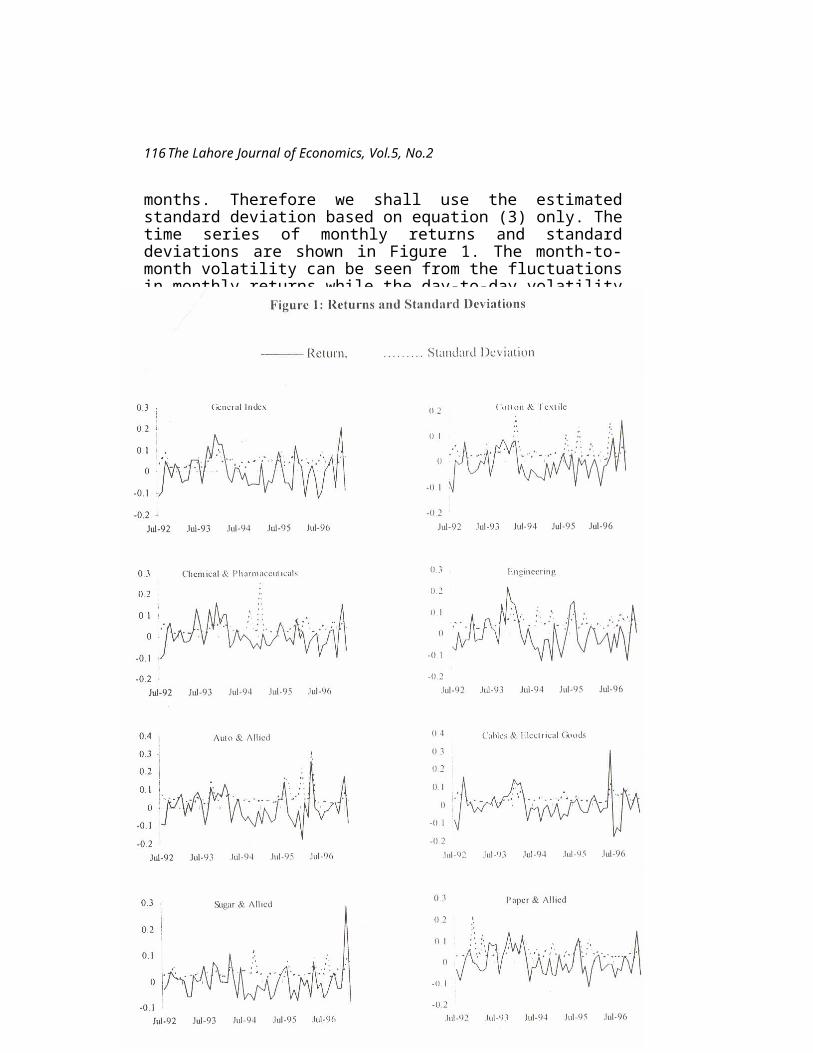
The Lahore Journal of Economics, Vol.5, No.2
produce across the board changes in market trends. We can conclude, therefore, that the Karachi Stock Exchange has matured as an active and volatile market and that the trading volume has increased extensively enough to make speculative activities visible.
130

Eatzaz Ahmad & Badar uz Zaman
References
Ahmed, E, and J. B. Rosser, Jr., “Non-linear Speculative Bubbles in the Pakistani Stock Market” Pakistan Development Review, 34:1 (1995): 25-41.
Chen, N. F., R. Roll and S. A. Ross, “Economic Forces and the Stock Market: Testing the APT and Alternative Asset Pricing Theories” Journal of Business, 59 (1986): 383-403.
French, K. R., G. W. Schwart and R. F. Stambaugh, “Expected Stock Returns and Volatility”, Journal of Financial Economics, 19 (1987): 3-29.
Hussain, F., “The Distribution of Stock Returns in an Emerging Market: The Pakistani Market”, Unpublished (1997a).
Hussain, F., “The Random Walk Model in the Pakistani Equity Market: An Empirical Investigation”, Unpublished (1997b).
Hussain, F., “The Day of the Week Effect in the Pakistani Equity Market: An Investigation”, The Lahore Journal of Economics, Vol. 5, No. 1, Jan-June, 2000 (1997c).
Hussain, F., “Stock Returns and Stock Market Volatility”, Unpublished (1997d).
Hussain, F. and J. Uppal, “Portfolio Return Behaviour in the Month of Fasting: The Ramadhan Effect”, Unpublished (1997).
International Finance Corporation (1992), Emerging Stock Markets Factbook 1992, Washington D. C.
Khilji, N. M., “The Behavior of Stock Returns in an Emerging Market: A Case Study of Pakistan”, The Pakistan Development Review, 32:4 (1993): 593-604.
Khilji, N. M., “Non-linear Dynamics and Chaos: Application to Financial Markets in Pakistan”, The Pakistan Development Review, 33:4 (1994): 1417-1429.
131
The Lahore Journal of Economics, Vol.5, No.2
Merton, R.C., “On Estimating the Expected Return on the Market: An Exploratory Investigation”, Journal of Financial Economics, 8 (1980): 323-361.
Officer, R., “The Variability of the Market Factor of New York Stock Exchange”, Journal of Business, (1973): 434-453.
Uppal, J., “The Internationalization of the Pakistani Stock Market: An Empirical Investigation”, Pakistan Development Review, 32:4 (1993): 605-618.
132

S. Nazre Hyder
International Labour Standards andNational Labour Laws in Pakistan
S. Nazre Hyder*
Introduction
The genesis of setting International Labour Standards lies in the idea that the issues related to labour and social conditions are not merely matters of state concern. The objective of establishing the International Labour Organisation in 1919 was to undertake joint international action to improve labour conditions world wide along with achieving several inter-related motives. The preamble and the first Article of the ILO’s Constitution gives expression to these ideas by the following statement:
Whereas universal and lasting peace can be established only if it is based upon social justice; and whereas conditions of labour exist involving such injustice, hardship and privation to large numbers of people as to produce unrest so great that the peace and harmony of the world are imperiled; and an improvement of those conditions is urgently required….”. Furthermore, Article I of the Constitution says that “moved by the sentiments of justice and humanity as well as by the desire to secure the permanent peace of the World and with a view to attaining the objectives set forth in the Preamble”, the founder countries agree to establish a permanent organisation to achieve its goal mainly through framing international instruments to these effects.International Labour Standards that are evolved
through adopting the ILO’s Conventions serve as
* The author is currently Director, Pakistan Manpower Institute, Ministry of Labour, Manpower & Overseas Pakistan. The views expressed in the paper in no way reflect the opinion of the organisation he is serving.
127
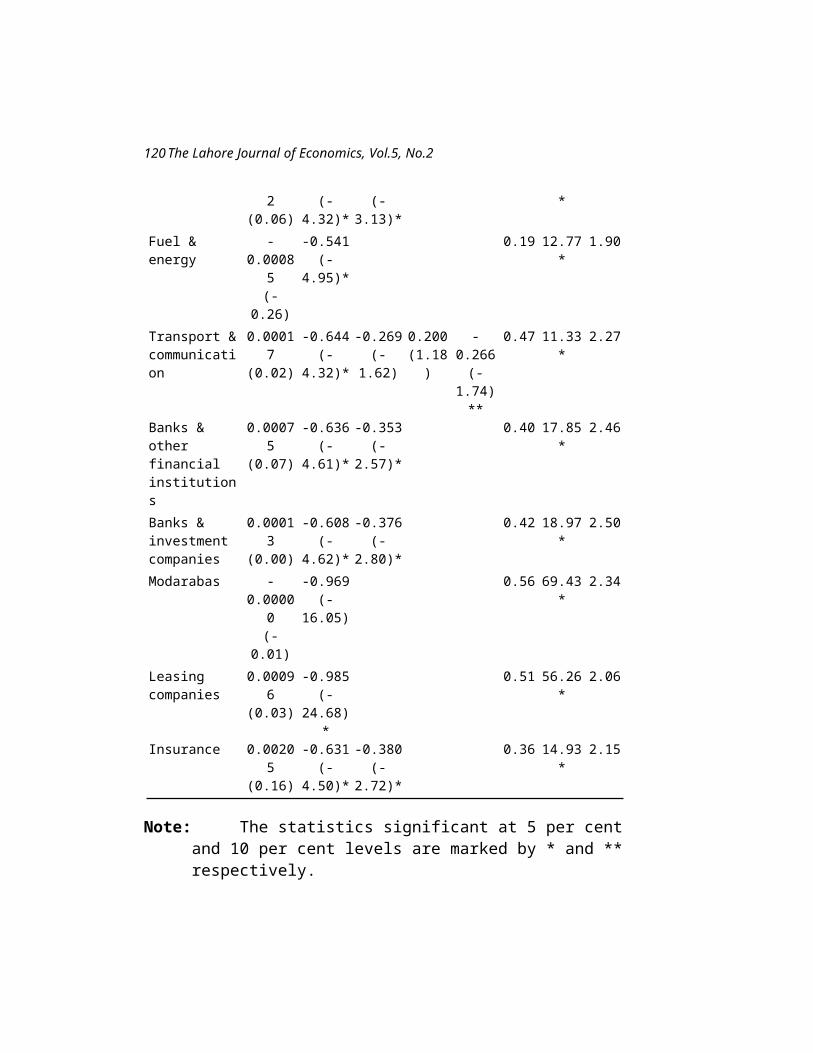
The Lahore Journal of Economics, Vol.5, No.2
guidelines for legislating labour laws by member states and on being ratified by them, these assume the force of international law on them. To date 176 Conventions have been adopted with varying rates of ratifications by the present 174 member states. The objective of the paper is to examine as to what extent the labour laws, rules and regulations in Pakistan are in consonance with the International Labour Standards. Since any comprehensive evaluation in this regard may not be possible within the limits of a relatively short article20, the following analysis is almost “impressionistic” and lays no claim to being exhaustive.Impact of International Labour Standards and Recommendations on National Labour Laws – A Review of Evidence
The labour laws, rules and regulations which existed at the time of the partition of the Indo-Pak sub-continent in 1947 were adopted by the nascent state of Pakistan. Realising the significance of promoting a healthy industrial atmosphere, it also joined the ILO shortly after its independence and the Government pledged to honour all the commitments made with them by the Government of British India. The comprehensive legal framework which Pakistan inherited was largely based on 14 Conventions of the ILO which were ratified by British India during 1921-47 (Annexure-I).
Industrial relations in Pakistan in the early days were mainly governed by rules and regulations existing at the time of independence and the laws provided under the Industrial Relations Ordinance, 1969 [Ministry of Labour and Manpower, 1978] which, to a considerable extent, were based on 14 ILO Conventions ratified by British India. However, to further improve the legal framework for protecting the rights of the workers and employers to create a better industrial climate in the country, the labour laws, rules and regulations are revised and modified in 20 In the case of Pakistan, the international instruments even if not ratified are found, in a number of cases, to be the source of reference for the harmonisation of measures taken at the national level; for example concerning employees cost of living relief; workers’ children education and institutional arrangements for the settlement of industrial disputes account should also be taken of the influence of a number of ILO’s Recommendations; for example the provisions of the Termination of Employment Recommendation, 1963 (No. 119) are clearly reflected in the labour legislation of the country but it has not been adopted.
128

S. Nazre Hyder
Pakistan, from time to time, according to the changing needs, standards and principles set out by the ILO. In order to achieve these objectives, Pakistan, as an active member of ILO ratified an additional 17 Conventions of the ILO (Annexure-I) to improve labour standards in the country through promoting tripartism, improving standards of social justice, maximising protection to workers and extending the coverage of the labour force. Moreover, the Government also adopted, from time to time, 19 ILO Recommendations (Annexure-II) to this effect.
The subjects of Conventions, ratified by Pakistan, broadly cover the areas of hours of work; freedom of association; collective bargaining; prohibition of employment of women and young persons during night hours; medical examination of young persons at sea; workmen’s compensation for injuries as a result of accidents; abolition of fee charging employment policies; discrimination on the basis of sex in employment and occupation; social security; tripartite consultation, vocational rehabilitation; abolition of forced labour, etc.
As regards the Recommendations of ILO adopted by Pakistan, they deal with areas such as vocational training of adults; collective agreements; voluntary conciliation and arbitration; cooperation at the level of undertaking; minimum age for entry into employment in coal mines; protection of workers’ health; holiday with pay; employment and occupational discrimination; communication within the undertakings; examination of grievances and a host of other welfare measures. The developments, which have taken place in the labour laws of the country and those which are in the process, are aimed at establishing the charter for harmonious industrial relations and to improve the socio-economic conditions of labour, based on the principles laid down in the relevant ILO instruments.
Recent Developments in Labour Laws in Pakistan in Relation to International Labour Standards
Five ILO Conventions numbering 29, 87, 98, 105 & 111; out of the seven “Core Conventions” i.e., 29, 87, 98, 105, 111, 118 and 159 (Annexure-I) ratified by Pakistan and
129

The Lahore Journal of Economics, Vol.5, No.2
16 Recommendations out of 19 accepted, have a human rights dimension as well as fundamental framework conditions for the exercise of labour rights, known as internationally recognised workers’ rights. Many of them are found already institutionalised through various labour laws of the country which provided a wide range of social protection by the government and mainly “so to say” by employers. As stated earlier, these included compensation to the workers for industrial accidents; education of children of workers; maternity benefits; medical care; pension and provident fund schemes; right of association; collective bargaining; institutional framework for the settlement of industrial disputes etc.
In recent years, however, there is a growing awareness of the need to provide social protection to the weaker sections of society such as disabled persons, bonded labour and children, besides specific measures adopted to protect a certain level of income of unskilled workers in industrial and commercial organisations. Some of the recent measures taken by the Government based on international labour standards as laid down by the ILO are described as under:a) Child Labour: The exploitation of child labour is one of the disturbing aspects of the international scene. Although the incidence of child labour in the country is much lower than that in many countries of even South Asia, the abolition of child labour and more generally the protection of children and young persons against work of a character or conditions unsuitable to their age has always been a serious government concern [Hyder, 1997b]. The Constitution of the country itself provided that all forms of forced labour and traffic in human beings are illegal and children below the age of 14 years are prohibited to work in any factory or mine or any hazardous activity.
A number of legislative measures were also adopted by the government to this end. The first step was taken by adopting the Minimum Age (Industry) Convention, 1919 ratified by British India which fixed the minimum age for admission of children to industrial employment at 14 years. As a consequence of this ratification, the Government enacted a number of laws to regulate
130

S. Nazre Hyder
children’s employment in several sectors. These laws included the Mines Act, 1923; the Children (Pledging of Labour) Act, 193321; the Factories Act, 1934; the Employment of Children Act, 1938 and Establishment Ordinance, 1969.
More recently in the wake of the UN Convention on the Rights of Children, the Government of Pakistan has set up a National Commission on Child Welfare and Development to look after the rights of children. As a consequence, the Employment of Children Act, 1991 [Ministry of Labour, Manpower and Overseas Pakistanis, 1991] has also been enacted which ensured the protection of children from exploitation and provided for their safety and health. It lays down that no child below the age of fourteen years shall be engaged in any factory or mine or in any hazardous employment and also specifies these occupations. The employment of a child below the age of 14 years is a cognisable offence under the Act and is punishable with imprisonment and fine. The Act also helped in removing the anomaly resulting from different age limits prescribed in different laws framed from time to time as stated above [Kemal, 1994].
A Memorandum of Understanding has also been signed in 1994 between the Government of Pakistan and the International Labour Office recognising the rights of children to be protected from economic exploitation and from performing any work that is likely to be hazardous or to interfere with the child’s education, or to be harmful to the child’s health or physical, mental and spiritual, moral or social development. It has also been re-affirmed that national efforts will be aimed at the eventual elimination of child labour. Consequently, Pakistan also joined the International Programme of Elimination of Child Labour in 1994 to achieve their goal [Hyder, 1997b].b) Bonded Labour: Realising the significance of abolition of the bonded labour system with a view to preventing the economic and physical exploitation of various oppressed sections of the labour class, the Government has enacted the Bonded Labour System (Abolition) Act, 1992 [Ministry 21 Although the Forced Labour Convention, 1930 was ratified in 1957 by the Government, the law to this effect was enacted earlier.
131

The Lahore Journal of Economics, Vol.5, No.2
of Labour, Manpower and Overseas Pakistanis, 1993]. At the commencement of this Act, the bonded labour system stands abolished and every bonded labourer has been freed and discharged from any obligation to render any bonded labour. Moreover, every obligation of a bonded labourer to repay any bonded debt has been extinguished and the possession of any property belonging to a bonded labourer or a member of his family, which was taken forcibly by any creditor for the recovery of any bonded debt, has been restored after commencement of the Act.
The Act also provided that whosoever compels any person to render any bonded labour shall be punishable with imprisonment for a term which shall not be less than two years nor more than five years, or with fine which shall not be less than fifty thousand rupees or with both. Similarly, if any person enforces any custom, tradition, contract or other instrument, by virtue of which any person or any member of his family is required to render any service under the bonded labour system, shall be punishable with imprisonment and fine.c) Minimum Wages: Partly because of the global move for equitable wages for workers and partly to cater for the escalating cost of living, the Government improved the existing legislation by enacting the Minimum Wage for Unskilled Workers (Amendment) Act, 1993 [Ministry of Labour, Manpower & Overseas Pakistanis, 1993]. It provided a hefty increase in the minimum wage to unskilled workers throughout the country. In addition to this, a cost of living allowance at the rate of Rs. 100 per month was allowed for workers with effect from 1st September, 1993 and another cost of living allowance at the rate of Rs. 50 per month was given w.e.f. 1st April, 1996 under the Employees Cost of Living (Relief) Act, 1973. Further, an ad-hoc relief of Rs. 300 per month was granted w.e.f. 1-3-1997 under the said Act. With this increase, the minimum wage of an un-skilled worker rose to Rs. 1950 per month; while in practice the wages paid to the un-skilled workers are found to be quite high in many cases.
The Government has now set up a National Minimum Wage Council, with tripartite composition to achieve
132

S. Nazre Hyder
uniformity in minimum wages for different categories of workers. It will undertake a periodic review of minimum wages for unskilled workers to make recommendations to the Government to enable it to fulfill its pledge to ameliorate the lot of workers.d) Rehabilitation of Disabled Persons: Another significant development in recent years is concerning the ratification of an ILO Convention, namely Vocational Rehabilitation and Employment (Disabled Persons) Convention, 1983 by the Government of Pakistan in October, 1994. It calls for the need to ensure equality of opportunity and treatment to all categories of disabled persons, in both rural and urban areas, for employment and their integration into the community. It further calls for following the principle of equality of opportunities and treatment for men and women while providing vocational rehabilitation and employment assistance to disabled persons, as well as measures to promote employment opportunities for them which conform to the employment and salary standards applicable to workers generally.
Moreover, in its National Social Welfare Policy also, as announced by the Government of Pakistan in 1994, special attention has been paid to disabled persons and the aforementioned Convention of ILO and Disabled Persons (Employment and Rehabilitation) Ordinance, 1981 have been made the basis for launching future government efforts to create special facilities for their education, training and rehabilitation through the provision of equal opportunities of employment to them [Government of Pakistan, 1994].Concluding Remarks
It may be noted that despite a distinct employment feature of the country characterised by a large proportion of employed labour force in agriculture and the informal sector, a substantial size of the work force is found engaged in the organised sector of the economy. It is estimated that at least 12 – 14 per cent of the labour force in Pakistan falls into the formal or organised sector which is protected by fairly comprehensive labour laws covering collective bargaining, tripartism as consultative
133
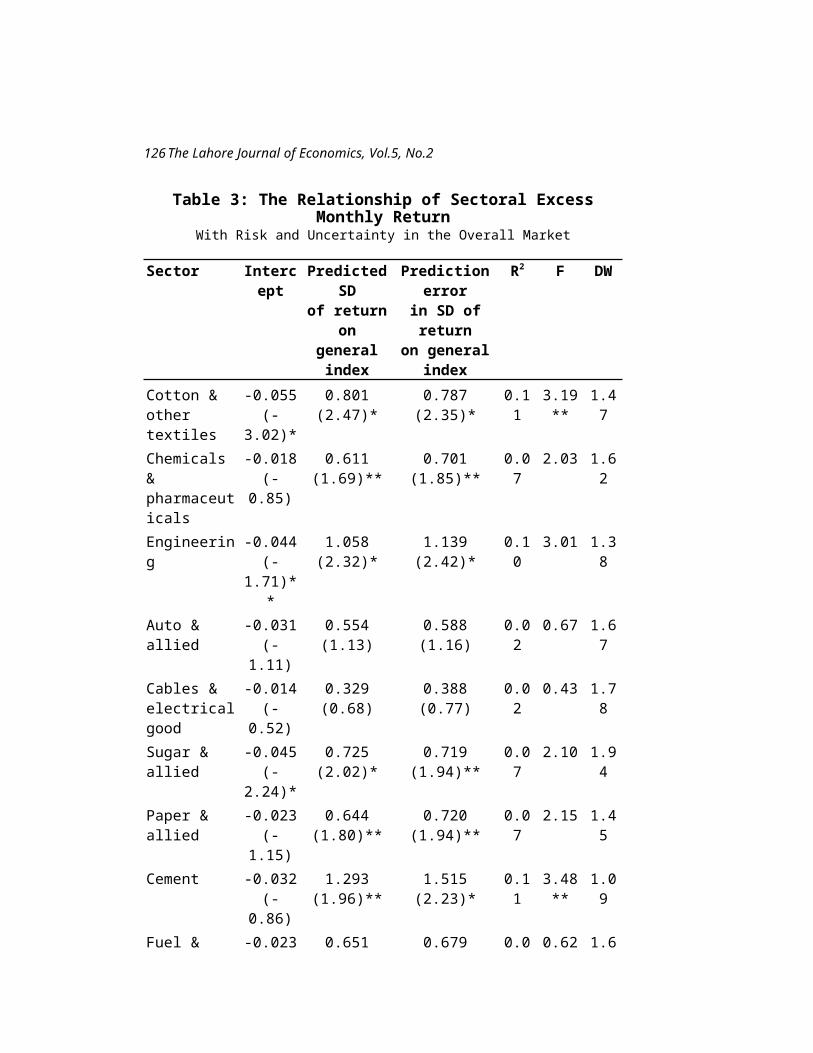
The Lahore Journal of Economics, Vol.5, No.2
mechanism, industrial disputes, unfair dismissal, trade union rights, working conditions, employees old age benefits, workmen’s compensation, health and safety etc. Restrictions on the employment of children and young persons, restrictions on night work for women, maternity benefits and social security are all covered by these laws. These facts reveal that the legal labour system in Pakistan has followed, to a great extent, the International Labour Standards (ILO Conventions and Recommendations) in shaping its industrial relations framework for the country to protect the social and economic rights of the workers and to establish a congenial industrial atmosphere.
Moreover, the new Labour Policy which is in the offing, envisages a number of dynamic provisions such as the establishment of a Commission to consolidate, simplify and rationalise labour laws, National Safety and Health Council, National Productivity Council and extension in scope and benefits under a scheme such as old age benefits for the workers and workers’ children education schemes. Also being considered is to provide protection to the rights of agricultural workers and extend welfare amenities for mine workers at par with other workers.
The Government believes that in the realisation of increased competitiveness, growth and employment in a globalised economy, a highly educated and skilled labour force has a critical and prominent role to play. Measures are being taken to expand the base of vocational and skilled training in new and multiple trades to meet the challenges of new technology and to fully benefit from developments in the field of communication and information technology.
However, an important issue that has emerged during the recent past is whether or not a social clause should be included in Multilateral Trade Agreements under the World Trade Organisation to ensure compliance with labour standards. The pressure in this regard is considered by most people in developing countries as a measure not oriented to supporting long-term structural reforms with pro-poor perspective, showing concern for human rights but to protect the interest of their own workers and the economy.
134
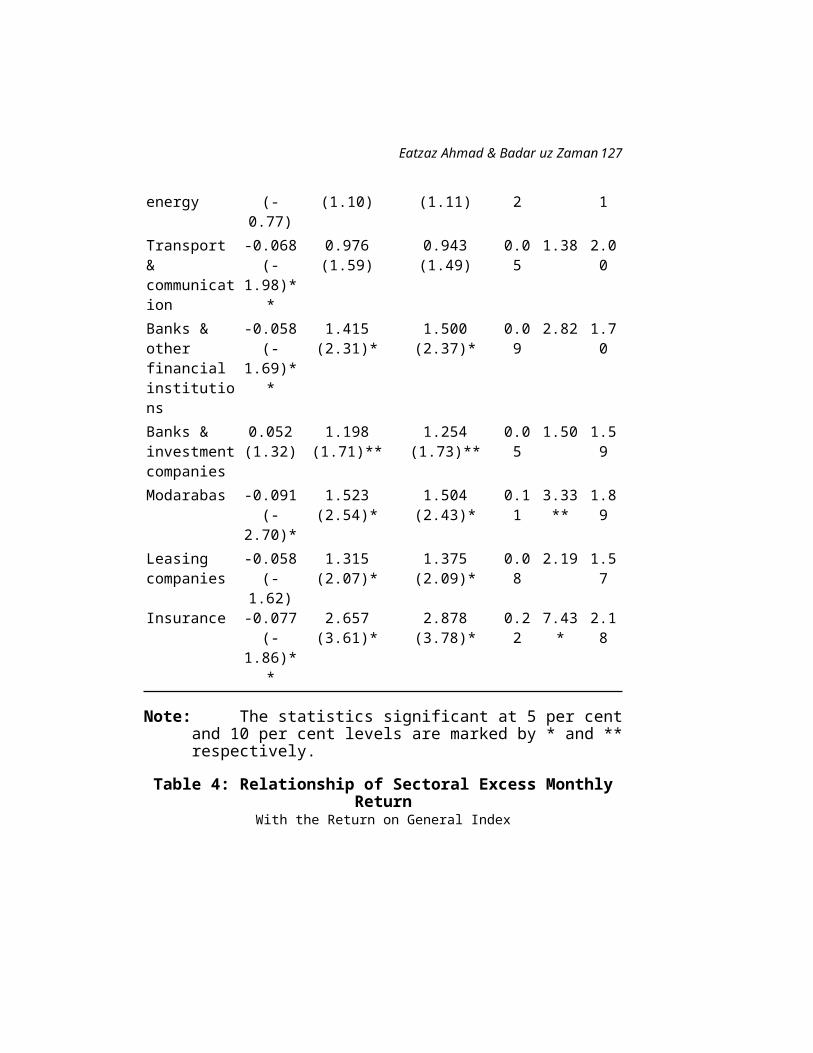
S. Nazre Hyder
It may be observed that like the provision of a social clause, environmental standards and human rights, linking labour standards with trade under WTO Agreements represents an unfair non-trade related barrier. In fact, it is considered as an effort to disallow a level playing field in trade with distinct disadvantage to Pakistan as for many other countries of the South. This kind of tainted approach at the international level, instead of solving the issues, is likely to aggravate the problems in these countries [Hyder, 1997b & 1997a].
Moreover, it is felt that the ILO, being an effective organisation at the international level to set and deal with international labour standards, is the most appropriate body to look into this aspect which has already contributed substantially in this field. Instead of linking labour standards with trade, the most appropriate approach will rather be to effectively implement ILO Conventions which should be facilitated by the ILO in terms of extending technical cooperation, provision of resources and realistic setting of labour standards. These standards should be framed taking into account the diversity in the social, economic and cultural scenario of the countries in different parts of the world to cater to their varying circumstances.
135

The Lahore Journal of Economics, Vol.5, No.2
Annexure-IList of ILO Conventions Ratified by Pakistan
S.No.
No. of Convention
Title Date of Ratification
1 2 3 401. No. 1 Hours of work
(Industry) Convention, 1919
14-07-1921
02. No. 4 Night work (Women) Convention, 1919.
14-07-1921
03. No. 6 Night work of young persons (industry) Convention, 1919.
14-07-1921
04. No. 11 Right of Association (Agriculture) Convention, 1921.
11-05-1923
05. No. 14 Weekly Rest (Industry) Convention, 1921.
11-05-1923
06. No. 15 Minimum Age (Trimmers & Stokers) Convention 1921.
20-11-1922
07. No. 16 Medical Examination of young persons (Sea) Convention, 1921.
20-11-1922
08 No. 18 Workmen’s Compensation (Occupational Diseases) Convention, 1925.
30-09-1927
09. No. 19 Equality of Treatment (Accident Compensation) Convention, 1925.
30-09-1927
10. No. 21 Inspection of Emigrants Convention, 1926.
31-10-1932
11. No. 22 Seamen’s Articles of 31-10-1932
136
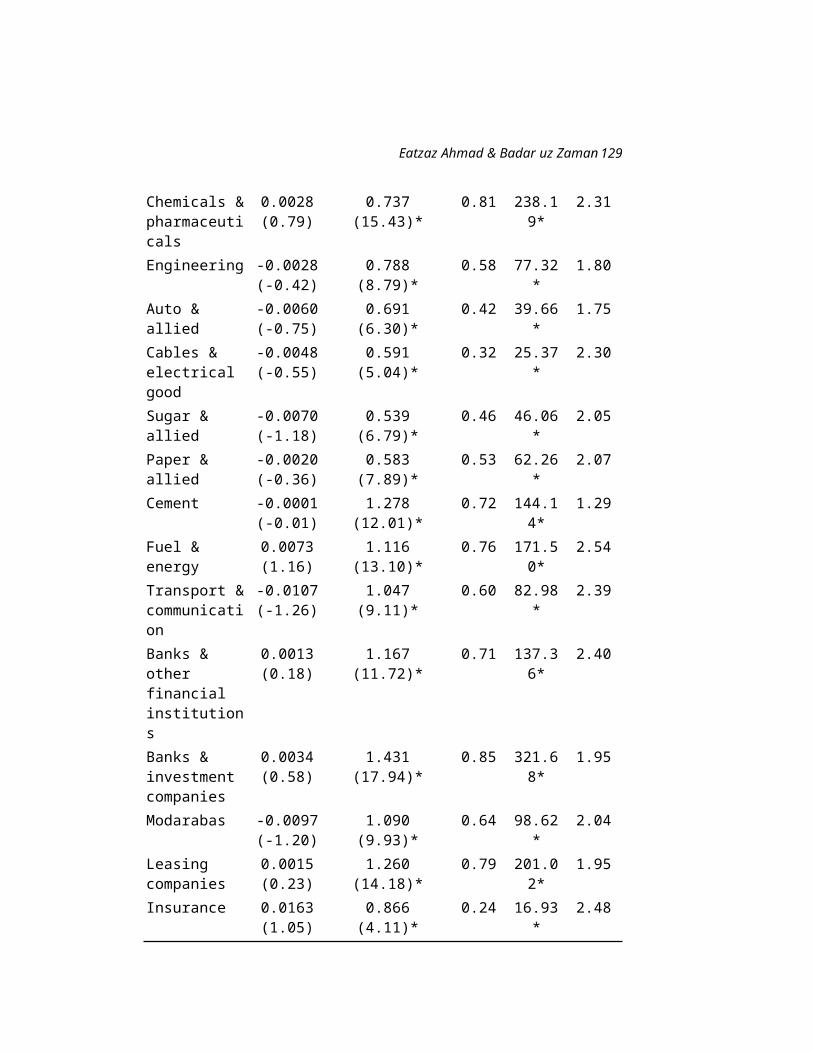
S. Nazre Hyder
Agree-ment Convention, 1926.
12. No. 27 Marking of Weight (Packages Transported by Vessels) Convention, 1929.
07-09-1931
13. No. 29 Forced Labour Convention, 1930
23-12-1957
14. No. 32 Protection against Accidents (Dockers) Convention (Revised), 1932.
10-02-1947
15. No. 45 Underground work (Women) Convention, 1935.
25-03-1938
16. No. 59 Minimum Age (Industry) Convention (Revised), 1937.
26-05-1955
17. No. 80 Final Articles Revision Convention, 1946.
25-03-1948
18. No. 81 Labour Inspection Convention, 1947.
10-10-1953
19. No. 87 Freedom of Association & Protection of the Right to organise, Convention, 1948.
14-02-1951
20. No. 89 Night Work (Women) Convention (Revised), 1948.
14-02-1951
21. No. 90 Night work of young persons (Industry), Convention (Revised), 1948.
14-02-1951
22. No. 96 Free-Charging Employment Agencies Convention (Revised), 1949.
26-05-1952
23. No. 98 Right to organise and Collective Bargaining Convention, 1949.
26-05-1952
137

The Lahore Journal of Economics, Vol.5, No.2
24. No. 105 Abolition of forced Labour Convention, 1957.
15-02-1960
25. No. 106 Weekly Rest (Commerce and Offices) Convention, 1957.
15-02-1960
26. No. 107 Indigenous and Tribal Populations Convention, 1957.
15-02-1960
27. No. 111 Discrimination (Employment & Occupation) Convention, 1958.
24-01-1961
28. No. 116 Final Articles Revision Convention, 1961.
17-11-1967
29. No. 118 Equality of Treatment (Social Security) Convention, 1962.
27-03-1969
30. No. 144 Tripartite Consultations (International Labour Standards) Convention, 1976.
25-10-1994
31. No. 159 Vocational Rehabilitation and Employment (Disabled Persons) Convention, 1983.
25-10-1994
Annexure-IIList of ILO Recommendations accepted by Pakistan since Independence (i.e. after
August, 1947)
Sr. No.
Number of
Recommen-
dations
Name of the Recommendations
Date of acceptanc
e by Pakistan
Remarks
1 2 3 4 501.
No. 88 Vocational Training (Adults)
20-10-1953
Accepted with the exception
138

S. Nazre Hyder
Recommen-dation 1950.
of its paragraphs 5(4) (b) 17:19:26:27:28:29:30:31:32:33:& 34.
02.
No. 91 Collective Agreement Recommendation, 1951
03.
No. 92 Voluntary Conciliation and Arbitration Recommendation, 1951.
04.
No. 94 Cooperation at the Level of the Undertaking Recommendation, 1952
28-08-1954
05.
No. 96 Minimum Age (Coal Mines) Recommen-dation, 1953.
20-05-1957
06.
No. 97 Protection of Workers’ Health Recommen-dation, 1953.
20-05-1997
Accepted with the exception of its paragraphs, (2)(1): 3(1)(a)(b),(c)(d),3(3) 4(1) (a),(b), & (c), 5,6 & 13. Besides this it has been specified by the Govt. of Pakistan, that the accepted provision of the Recommendation, in their
139
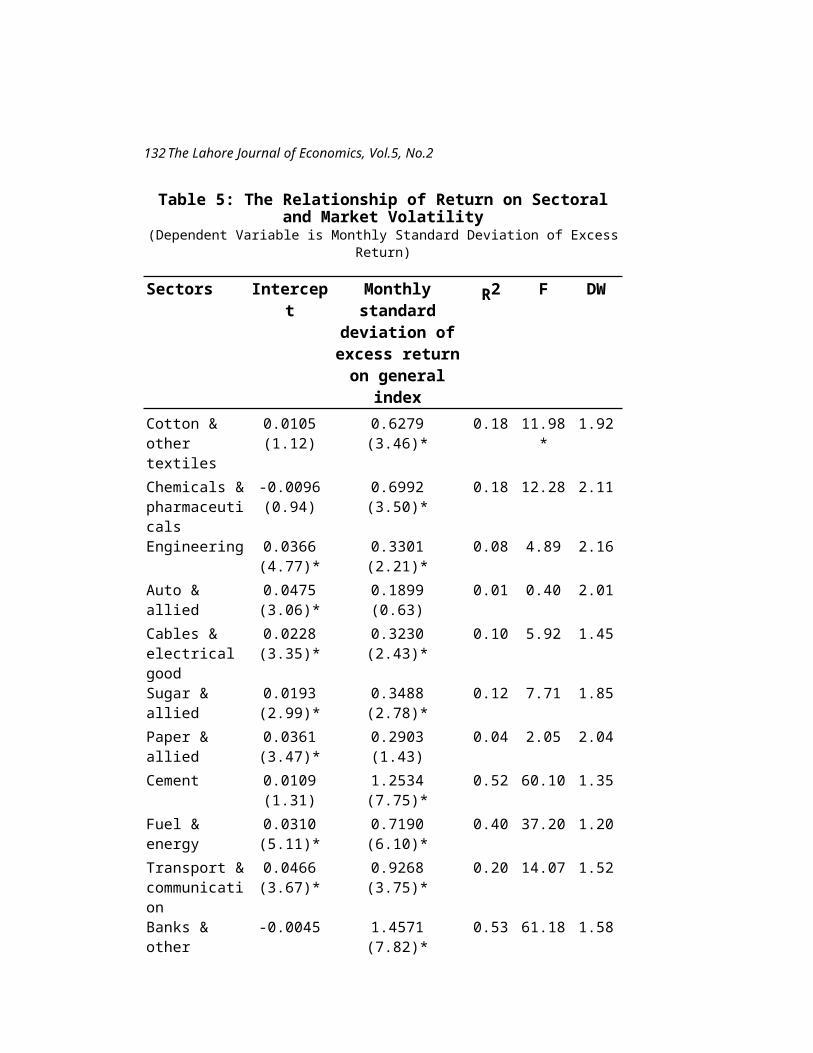
The Lahore Journal of Economics, Vol.5, No.2
application, would be limited to the places of employment covered by the existing national laws and regulations only.
07.
No. 98 Holidays with Pay Recommendation, 1954.
16-09-1959
Accepted with the exception of para-graph 14 of the Recommendation. The Govt. of Pakistan has further specified that the provision of the Recommen-dation, in their case, would be applicable to workers covered by the legislation on factories, shops and Commercial establishments.
08.
No. 102 Welfare Facilities Recommendation, 1956.
20-07-1959
Accepted with the exception of its paragraphs 10:12: 29:30:31:32:33 and 34.
09.
No. 103 Weekly Rest (Commerce &
29-12-1959
Accepted with the exception
140
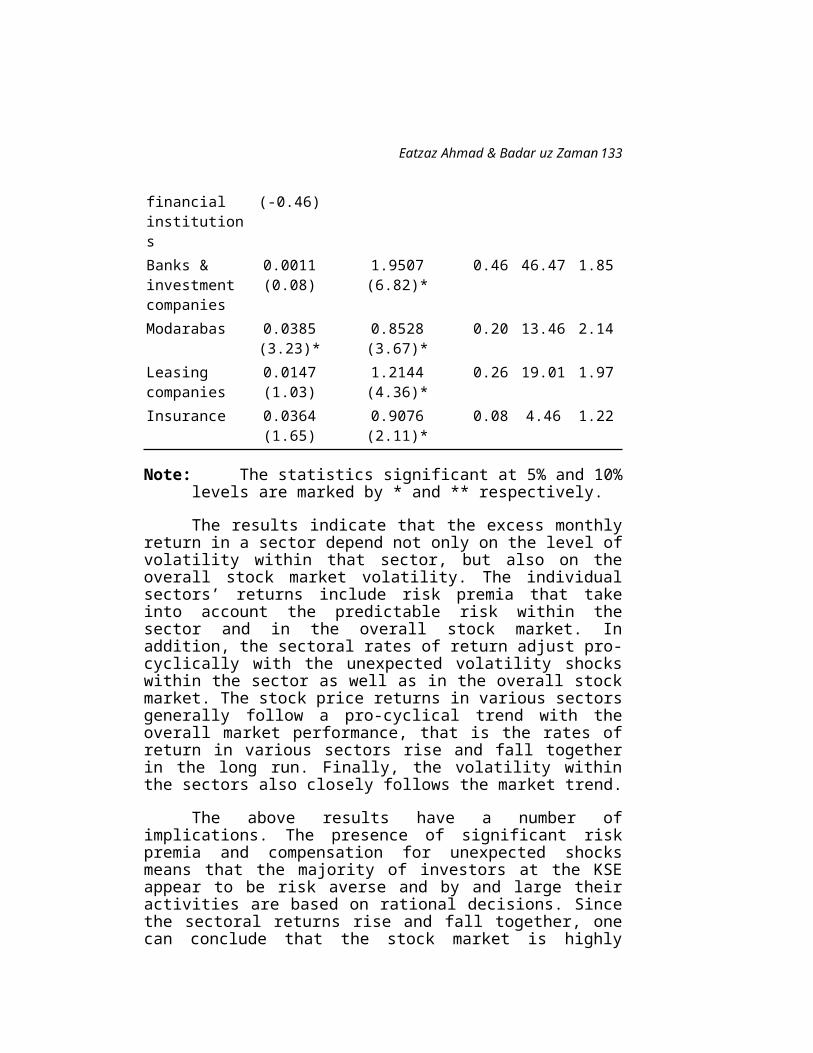
S. Nazre Hyder
Offices) Recommendation, 1957.
of its paragraphs 1:2: 4(1) and 7.
10.
No. 105 Ships Medicine Chests Recommendation, 1958.
27-02-1960
11.
No. 106 Medical advice at Sea Recommendation, 1958.
27-02-1960
12.
No. 107 Seafarers Engagement (Foreign Vessels) Recommendation, 1958.
13.
No. 108 Social Conditions and Safety (Seafarers) Recommendation, 1958.
27-02-1960
14.
No. 111 Discrimination (Employment & Occupation) Recommendation, 1958.
30-12-1960
Accepted with the exception of its paragraph 8.
15.
No. 113 Consultation (Industrial and National Levels) Recommendation, 1960.
21-03-1962
16.
No. 117 Vocational Training Recommendation, 1962.
17.
No. 129 Communications within the undertaking Recommendation, 1967.
141

The Lahore Journal of Economics, Vol.5, No.2
18.
No. 130 Examination of Grievances, Recommendation, 1967.
19.
No. 168 Vocational Rehabilitation and Employment (Disabled Persons) Recommendation, 1983.
25-10-1994
142

S. Nazre Hyder
References
Bhagwati, J.N., 1994, “Policy Perspectives and future directions : A View from Academia”, International Labour Standards and Global Economic Integration: Proceedings of a Symposium, US Department of Labour, Washington, DC.
Government of Pakistan, 1994, National Social Welfare Policy, Social Welfare and Special Education Division, Islamabad.
Hensman, R., 1996, ‘Minimum Labour Standards and Trade Agreements – An Overview of the Debate’, Economic and Political Weekly, April 20 – 27 Issues New Delhi.
Hyder, S.N., 1997a, “Globalisation of Economy – Pakistan at Crossroads”, Pakistan Banker, January – June, 1997 Issue, The Bank of Punjab, Lahore.
Hyder, S.N., 1997b, “Exploitation of Child Labour – Finding the Right Approach”, Pakistan Banker, July – December, 1997, The Bank of Punjab, Lahore.
Kemal, A.R., 1995, Child Labour in Pakistan – A Study Conducted for UNICEF and Pakistan Institute of Development Economics, UNICEF, Islamabad.
Lee, E., 1997, Globalisation and Labour Standards : A Review of Issues, International Labour Review, Vol. 136, No. 2, ILO, Geneva.
Ministry of Labour, Manpower & Overseas Pakistanis, 1978, The Pakistan Labour Code, Vol. 1, Government of Pakistan, Labour Division, Islamabad.
Ministry of Labour, Manpower & Overseas Pakistanis, 1991, Pakistan Labour Gazette, July, 1990 – June, 1991, Government of Pakistan, Labour Division, Islamabad.
143
The Lahore Journal of Economics, Vol.5, No.2
-----------------------------------------------------------------, 1993, Pakistan Labour Gazette, July, 1992 – June, 1993, Government of Pakistan, Labour Division, Islamabad.
Otting, A., 1993, ‘International Labour Standards : A Framework for Social Security’, International Labour Review, Vol. 132, No. 2, ILO, Geneva.
Pradhan, G., 1996, Social Clause in Multilateral Trade Agreements – A Paper submitted to South Asian Consultation on Social Clause in Multi-lateral Agreements, Staff College, Kathmandu, Nepal.
144
Iqbal M. Khan
Comment:
The Concept and Model of Small Enterprise Hub for Developing Countries
141

The Lahore Journal of Economics, Vol.5, No.2
Iqbal M. Khan
Background
In a rapidly changing global economy, small enterprises are increasingly a force for national economic growth. Since the 1970s, SEs and the entrepreneurs who drive them have received serious attention by planners, multilateral agencies and governments the world over. Yet there is the need for the management of the environment at the macro level to facilitate the growth of the SE sector. There is a need for setting up and managing institutions and networks which support directly, indirectly, formally, informally, the growth business at the regional and national level. This also calls for the development of entrepreneurs and their team, development of the organisation and the business.
The engine of change in all the new economies has been the small and medium enterprises (SMEs) but the growth of the sector was not a response to problems of economic crises of the 1970s and 1980s but it has been observed as a trend that emerged as a wave of change. Hence the chaos and scramble to move according to the trend. The other notable contributing factor for the emergence of Small Enterprises (SEs) is the IT business industry and the worldwide trend towards the service industry sector.
A lot of this institution building of management of the macro and micro environment of SEs has to do with scattered institutions and agencies dealing with SEs. New structures, policies and strategies are required that will help SEs start, survive and grow. In this objective the SEs must be helped and must be directed towards a one-window operation. The integrating concept is Small Enterprise Hub.
The Rationale
In developing countries the problems are even more complex because of the lack of support infrastructure. The developed world caters for research,
142
Iqbal M. Khan
capacity building, training, skill development, accreditation of certifications, standardisation, regulatory environment, fostering marriages of large and small enterprises. But such an infrastructure does not exist in developing countries. They lack the institutionalisation of experiences.
SME development would mean industrial leverage, institutional tool for economic development, employment generation, technology acquisition, internationalisation of SEs, boost to information technology and standing at par with international development. But all this needs a complete set of support institutions and the building of support institutions infrastructure for the development of SEs and integrating them into a holistic idea leading to the goals of the overall economic development plan. There is in fact an absence of comprehensive small business development policies based upon proper understanding of the contribution of SEs to the major goals of economic and social policies (other than employment creation) by the planners in the developing countries. There is little or no understanding of SEs contributing to balance of payment stability, equality and justice, price stability, and growth (Alan Gibbs).
The very concept of SEs is associated with industrial chaos, mushroom growth and clusters. To create an order out of this chaos there is a need to have support institutions: common facilities: self-help-organisations: business development services: business incubators: technology parks and technical assistance: management training, the financial support institutions. Partnership and strategic alliances. To achieve the objective for collaboration between small and large firms, we may require regulatory intervention. Small firms’ lack of resources motivates them to build mutually constructive networks of support system and resource sharing. But if the environment does not exist they will sustain losses till they find, if they find, a solution through some collaborative forces.
The rationale to have a Small Enterprise Hub for the development of SEs in the Developing countries is compelling. Absence of this will be exercises in futility.
143

The Lahore Journal of Economics, Vol.5, No.2
Objective
Therefore the objective of this Small Enterprise Hub concept is to develop infrastructure of a system of support institutions for the development and growth of SEs. In addition it will specifically work:-1. To manage better the overall environment for the
growth of the SE sector2. To manage better an institutional assistance
environment and network for growth.3. To facilitate SE business and foster growth of
entrepreneurship for business growth.4. To integrate the activities of the support institutions
in the network.5. To allow the independence of support institutions in
the Hub.6. To advocate policy intervention.The Scope
Small Enterprise Hub will cover through its support institutions:-
Institution building to implement the change which would be the foremost objective, and would be linked to the international agencies and regional forums.
Technical assistance to appraise and build capacity and capability. To tap a vast unrealised potential that can only be achieved through SEs.
The objective to be realised would be to create an infrastructure for the growth and development and support of SEs.
The Small Enterprise Hub is an idea that will bring about hectic activity for industrial growth. But without some degree of institutionalisation of small business the
144

Iqbal M. Khan
small business voice and its contribution to the economy will be weak.Definition
Therefore the definition that can be applied to the Small Enterprise Hub can be that the Small Enterprise Hub is the concept of setting up support centers and developing a framework for exploring small enterprise development practices. It will have the following:
145

The Lahore Journal of Economics, Vol.5, No.2146

Iqbal M. Khan
Table-1: This concept Small Enterprise Hub can be conceptualised on the basis of the economic context and the implementation context. The matrix below captures both contexts.
The Economic Context
The Small Enterprise Hub©
The Implementatio
n Context
Mission Statement:
Creating Support Centers for Development of Small Enterprise.
Mission Statement
Institutional Definition
The Small Enterprise Hub is the concept of setting up support centers, and developing a framework for exploring Small Enterprise Development Practices.
Definition
Public Policy
It will play the role of Small Enterprise Advocacy, lowering transaction costs and leveling the playing field for small business.
Purpose
New Economic Criteria: Public Private Partnership-Self Help Organisations
The Small Enterprise Development Practices take into account the significance of Market Economy and the framework for intervention for sustainable development. It works for the development of support centers for educational, technical, R&D, business incubation, marketing, internationalisation, HR development, cluster creation, industrial development organisations, networking, linkages and financial
Objective
147

The Lahore Journal of Economics, Vol.5, No.2
support.Institutional Initiative
It creates awareness through information, sign posting, advice, training, counseling and creating a public private partnership.
Strategy
© Iqbal Model of Small Enterprise Hub
The Hub will cater to the provision of the following support centres. It will develop a role for each support centre, giving it a mission statement and action plan. It will be the function of the Hub to appraise and evaluate the impact of the activity on the other support centres and on the network of the support centres. The purpose will also be to examine the economic criteria, the implementation criteria and the developmental criteria. The major function of the SE Hub will be to adapt to the overall national, economic development plan goals and at the same time recommend and advocate policy. It will thus monitor whether all the support centres are working according to the goals and also according to benchmarks observed and adopted. The following support centres have been identified for the small enterprise Hub as can be seen in Figure-1.1. Policy Support: There is an absence of comprehensive small business development policy based upon proper understanding of the contribution of SEs to the goals of economics and social policies. There is need to remove retardants and remove bias in favour of large firms. Hence advocacy for policy and regulatory support in favour of SEs. Through policy we seek to organise the support environment for SE. We seek to achieve “the complementary skills and resources which are essential for competitiveness and survival in world markets” Doherty 1990.2. Industry Support Services: An important part of the support network for growth is the private sector and self help organisation besides the public organisation. There is
148

Iqbal M. Khan
a tendency towards dependency and interdependency between businesses. The issues of disagregation, decentralisation and spin offs lead to transfer outs and sub-contracting. There is also a growth of interest in the issues of partnerships and strategic alliances. There is also the need to bring together, through appropriate incentives collaboration between small and big firms. Besides the policy issues to support this feature of growth, there is also the need to organise and manage an infrastructure through industrial support institutions as SIDOs & SMEDAs. There is also the need to develop feasibilities and investment guides; the need for industrial cluster mapping and to identify the industrial sectors having competitive advantage. To monitor that the support centres are working according to the goals and also according to benchmarks observed and adopted.3. HRD Support: SE creates a trend towards self-employment. The chain of HRD links the professional managers, the technology people, entrepreneurship and entrepreneurial competencies, full range of management training, and skill development etc. Special programmes will be required to cover the training of women, ethnic minorities, youth, long-term unemployed, spin offs, growth business and new technology based firms.4. Financial Support: It is evident that in a small business community there is not enough competence and momentum to mobilise the financial resources and adopt small loan practices. Such a resource deployment is necessary to carry through any major programme of support for small enterprise development. It is hence felt very necessary to have small enterprise Development Bank and other support financial institutions.5. Marketing Support: One inherent weakness in the SEs is the ability to market their products and services or to promote themselves. Hence the need to have marketing support services. This may require common facilities arrangement as a common display centre internationalisation through an export house. It would also serve the purpose of having emporiums and sales outlets.
149

The Lahore Journal of Economics, Vol.5, No.2
6. Technology Support: It will seek to support the development of technical innovation and new technology based firms. Information Technology has opened up many market niches. This enhances the role of Se Hub in designing and managing science parks, Technology Parks, Business incubators, Technology Support, Venture Capital. Similarly a sharing of information related to new technology emerging would enhance capability as most firms would not have access to new technology and would not be able to have competitive advantage without this.7. Engineering and Common Facilities Support: Common facilities in sharing the engineering and technical support would be an important requirement of SEs. To augment the effective role there may be requirements of finishing touches or to enhance usefulness or boost marketability. To meet such requirements a common facility would be provided to all by making accessible certain machinery and processes.8. International Linkages Support: In today’s globalised economy it is necessary to draw out strategies to keep pace with trends and technology and communication requirements. The SE would need support to reach out to more organisations that are looking for partnerships. It is therefore necessary for SE Hub to be linked into a network of international agencies. This would keep them outward looking and developmental for the benefit of SEs.9. Information Support: the role of information exchange is vital for the SEs e.g. In the production sector in process and product development are not accessible to the sponsors of SEs. Similarly market trends, new products, new technologies and the need for benchmarking from the point of view of productivity and pricing. Furthermore sources of financing and need to hunt for strategic alliance partners. On a regional basis it is also important to exchange experience with other SEs.Conclusion
This paper has attempted to provide a concept of a network of support institutions required for the
150

Iqbal M. Khan
development of growth of small enterprises which need hand-holding at every stage of their development. Devoid of resources and competencies available to Large Enterprises these organisations need an environment framework to re-appraise approaches for SE growth. It suggests that in developing countries there is an acute shortage of self-help organisations, regulatory environment, incentives, policies and other infrastructure required for SE growth. It has attempted to point out an innovative approach that needs more work to develop into a public policy paper for consideration.
151

Viqar Ahmed
Book Review
S. Akbar Zaidi, Issues in Pakistan’s Economy, Oxford University Press, Karachi, 1999. 462 pp. Price: Pak Rs. 450/-.
In the last five decades, Pakistan’s economy has, as they say, gone places. Undoubtedly, this economy is much more broad-based, with increases in productivity in all sectors, incomes (even if nobody believes it), trade, infrastructure, social sectors. Living standards and consumption levels and patterns are more diversified than those in the early years, though the benefits are unevenly distributed. Such disparity and imbalances created additional complications because of a rise in expectations, which is invariably faster than production capacity and income increases. Developing countries, soft societies as these are, must face problems emerging from the resulting frustrations and frictions.
Pakistan itself is a case study of the consequences of rapid growth outpaced by both frustrations (due to unequal distribution of the fruits of such growth) and friction (between regions). The decade showing the highest growth rates per annum ended with the breakup of the country, which is a reminder of the fact that growth is a mixed blessing.
There is no dearth of explanations of what went wrong with both our politics and our economy, and the mistakes committed. There are troubling questions to answer and to re-examine past policies to make sure that the same mistakes are not committed again.
S. Akbar Zaidi, one of Pakistan’s more creative intellectuals and economists, in his fourth book has undertaken the task of not only describing Pakistan’s development efforts in its totality but also rationalising why our national policies failed to hold the country together, how the social inequalities were created and also if all this was inevitable. Capitalist contradictions? But why did such catastrophes not happen in other capitalist societies?
149

The Lahore Journal of Economics, Vol.5, No.2
Zaidi’s analysis of past policies, and his appraisal of sectoral and national policies, of the nature and quality of economic development is forthright and categorical. There is no attempt to soft-pedal opinions that are likely to be challenged. He criticises Ayub Khan’s functional inequality in terms of the Marxian criticism of the capitalist system. He is also sharply critical of the structural adjustment programme of the IMF. His explanation of Bhutto’s economic difficulties as ‘bad luck’ and sympathetic treatment of his policies may not be acceptable to many people. But the author has produced impressive evidence and sufficient arguments to produce a credible case. He also decries the poor performance of the social sectors, largely because of lack of political will and commitment on the part of the ruling elite and the government. The discussion on why economic development, even at the best of times, failed to promote the growth of the social sectors is remarkable for its clarity and strength of arguments.
The author also challenges a number of ‘myths’ about Pakistan’s economy. A feudal economy? No, Pakistan is in a post-feudal situation, says the author. An illuminating analysis of feudalism, its characteristics and role is a major contribution to the debate on the subject and adds several new dimensions.
A special feature of this book is the author’s mobilisation of statistical evidence (as many as 195 tables) and strong arguments to support his conclusions. In addition, he has used box items to define and explain a number of concepts that other authors did not deem necessary. This reader-friendly approach is invaluable for the non-economists and students who should now understand such concepts as feudalism, tax elasticity and buoyancy, fiscal and budget deficits etc., more clearly. A number of controversial subjects have been dealt with in a way as to present arguments on both the sides.
The book also has a comprehensive bibliography consisting of over 150 books. Aesthetically printed, this book should be of great help to all those who would like to improve their understanding of Pakistan’s economic situation.
150

Viqar Ahmed
Lahore School of Economics Viqar AhmedLahore
151

Notes For Authors
1. Manuscripts of research articles, research notes, review articles, comments, rejoinders and book reviews - in English only - should be sent in duplicate together with floppy in MS - Word to the Editor, The Lahore Journal of Economics, 105, C-2, Gulberg-III, Lahore-54660. Each request for a book review in the journal must be accompanied by one copy of the book concerned.
2. Manuscripts will be accepted for consideration on the understanding that they are original contributions to the existing knowledge in the fields of Economics, Banking, Current Affairs, Finance, Sociology, and Economic History.
3. Each manuscript should be typed and should carry a margin of an inch and a half on the left-hand side of the typed page.
4. The first page of the manuscript should have the title of the paper, the name(s) of author(s) and a footnote giving the current affiliation of the author(s) and any acknowledgments.
5. Detailed derivations of any main mathematical results reported in the text should be submitted separately along with the articles.
6. Tables for the main text and each of its appendices should be numbered serially and separately. The title of each table should be clearly expressive of the contents. The source of the table should be given in a footnote immediately below the line at the bottom of the table.
7. Footnotes should be numbered consecutively.
8. All references used in the text should be listed in alphabetical order of the authors’ surnames at the end of the text. References in the text should include the name(s) of author(s) with the year of publication in parentheses. Attempt should be made to conform to the style of the Journal. Further information on questions of style may be obtained from the Co-Editor, The Lahore Journal of Economics, Pakistan.

9. Each author will receive three copies of The Lahore Journal of Economics with the compliments of the LJE.
10. Book Reviews should give a description of the contents of the volume and a critical evaluation of the book. It should not exceed 5 or 6 typewritten pages.

THE LAHORE JOURNALOF
ECONOMICSLahore School of Economics
105-C-2, GULBERG III LAHORE, PAKISTAN. TEL: 5874385 FAX: 5714936
SUBSCRIPTION FOR PUBLICATIONS
1. Kindly enter a subscription for the following publications of the Lahore School of Economics:
Publications Yearly subscriptionYearly subscription Period Total
(within Pakistan) (outside Pakistan) (No. of years)Payment
1. Occasional Paper Series Rs. 1200.00 US $ 200............ ............
2. Lahore Journal of Economics Rs. 600.00 US $ 100............ ............
2. The subscription is to be in the following name and address:
Name: ----------------------------------------
Address: ----------------------------------------
----------------------------------------
----------------------------------------
3. A crossed cheque/demand draft for the sum of Pakistan Rupees/US $________ is enclosed made out in the name of The Lahore School of Economics to cover the above subscription.

4. Please address your order to: Nina Gera, Publications, Lahore School of Economics, 105-C-2, Gulberg III, Lahore 54660, Pakistan.
Signature:------------------------------------
Name:-----------------------------------------
Date:------------------------------------------


The Lahore School of Economics
The Lahore School of Economics (established 1993) is one of Pakistan’s leading centres of learning for teaching and research in economics, finance and business administration. The Lahore School of Economics’ objectives include: (i). The training of young Pakistanis as professional economists, finance managers, accountants, financial analysts, bankers and business executives, and (ii). Undertaking research in economics, management, finance and banking to further deepen understanding of major economic facts, issues and policies.
The Lahore School was granted a Charter in January, 1997 by an Act of the Provincial Assembly of the Punjab: The Lahore School of Economics Act 1997 (Act II of 1997). The Charter vests the powers of an independent degree granting institution to The Lahore School.
The Lahore School has both undergraduate and graduate programmes in economics, business and finance. Its postgraduate programme leading to the MPhil degree is administered through the Lahore School’s Centre for Advanced Research in Economics and Business (CAREB). The student body and faculty comprise both national and expatriate Pakistanis and The Lahore School encourages expatriate Pakistanis to join as students or as faculty.

The Lahore School’s publication programme comprises The Lahore Journal of Economics (a bi-annual publication), a Seminar Paper Series and a Text Book Series. The Programme encourages both in-house and external contributors.
For further information, please call (Pakistan 92-42-) 5714936 or 5874385 or E Mail: [email protected]