bond university doctoral thesis feasibility analysis in
TRANSCRIPT
Bond University
DOCTORAL THESIS
Feasibility analysis in the pre-commitment stages of the property developmentprocess: An examination of uncertainty, risk and heuristic bias in managementdecision making processes during the precommitment stages of the propertydevelopment process in Australia.
Moorhead, Matthew
Award date:2019
Link to publication
General rightsCopyright and moral rights for the publications made accessible in the public portal are retained by the authors and/or other copyright ownersand it is a condition of accessing publications that users recognise and abide by the legal requirements associated with these rights.
• Users may download and print one copy of any publication from the public portal for the purpose of private study or research. • You may not further distribute the material or use it for any profit-making activity or commercial gain • You may freely distribute the URL identifying the publication in the public portal.

Feasibility Analysis in the Pre-Commitment Stages of the
Property Development Process
An examination of uncertainty, risk and heuristic bias in management decision‐
making processes during the pre‐commitment stages of the property development
process in Australia.
Presented by
MATTHEW JAY MOORHEAD
Submitted in total fulfilment of the requirements of the degree of
Doctor of Philosophy
March 2019
Faculty of Society and Design
Bond University, Australia
Professor Michael Regan and Associate Professor Lynne Armitage
This research was supported by an Australian Government Research Training Program
Scholarship.

MATTHEW MOORHEAD ii
An investment in knowledge pays the best interest.
‐ Benjamin Franklin
Sometimes we have to unlearn things before we can learn the
right things.
‐ Kenneth E. Hagin

MATTHEW MOORHEAD iii
Abstract
The current practice of real estate companies engaged in property development
is to employ industry‐accepted heuristics as target rates of return based on
benchmarks commonly expressed as hurdle rates of return (Crosby et al., a).
Hurdle rates are a minimum financial metric and are intended to include the
developer’s cost of capital and a premium commensurate with a subjective
assessment of a project’s unsystematic risk and are used to measure a potential
project’s viability through conducting a feasibility analysis and inform decision‐
making during the early stages of the undertaking. For a project and/or site
acquisition to proceed, the forecasted profitability determined through a
feasibility analysis must meet or exceed a firm’s minimum requirements. Longer‐
term investment holding periods introduce new risks and uncertainties and
require change management mechanisms which are often unidentifiable at the
preliminary stages of a project. This is particularly the case with staged
developments in many sectors, newly listed assets and infrastructure.
There were three primary aims of this research which are:
Firstly, to complete an examination of the decision‐making practices used in
determining project viability through conducting a feasibility analysis by real
estate development firms in Australia and also to obtain information regarding
hurdle rate selection and techniques commonly utilised to determine project
viability. This research investigated the drivers and decision‐making processes
of property developers in Australia and touches on the global practices of the
industry as property development becomes increasingly internationalised.
Findings indicate the majority of Australian property development organisations
do utilise specific go/no‐go hurdle rate mechanisms as a decision basis for
MATTHEW MOORHEAD iv
proceeding beyond the pre‐commitment stages of the development process.
Furthermore, few differences were found between property developers with
differing primary property types in the use of specific go/no‐go decision
processes, with the majority using a margin on development cost (MDC) or an
internal rate of return (IRR) as a minimum financial metric. Property developers
whose preferred project size is large (> AUD 50 million end value) utilise more
sophisticated methods of feasibility analysis and have a higher number of
specific hurdle rates to guide decision‐making.
Additionally, property developers who primarily undertake small project sizes
(<= AUD million end value) use less sophisticated quantitative methods of
analysis but require a higher return on equity (ROE) as a basis for project
selection. The results indicate the structure of many development projects are
complex, and the boundaries between traditional speculative development and
property investment through the use of securitisation methods have become
more difficult to distinguish. The majority of development organisations
surveyed do not rely purely on quantitative metrics for determining project
viability through feasibility analysis, but also use qualitative methods and
organisational specific structural checks as a method of managing the
organisation’s risk.
Differences were also found in the selection and use of hurdle rates based on
developer typologies; multi‐national property development organisations
operating in multiple geographic regions demonstrated a higher use of
qualitative frameworks as a decision‐making process. In terms of developer
feasibility analysis practices and the use of feasibility analysis programs, the two
most frequently used tools included Microsoft Excel and Argus Estate Master DF.
The two most frequent methods of determining site value prior to acquisition
were the residual land value and DCF methods.
MATTHEW MOORHEAD v
Secondly, this research aimed to examine the relationship between bounded
rationality, heuristic bias and management decision‐making by property
development organisations. Findings indicate the majority of developers in
Australia do not have a predetermined process and method for altering or
adapting the chosen hurdle rates and benchmarks, even in the presence of an
expected change in uncertainty and risk to a potential project. Those developers
that do alter hurdle rates do so based on three primary themes which are;
altering hurdle rates on the basis of risk analysis and forecasted market
conditions; altering hurdle rates based on qualitative frameworks or intuition;
and altering hurdle rates based on the project’s status of planning approval.
Additionally, it was found that the property developers surveyed exhibited
bounded rationality and place a heavy reliance on industry‐accepted heuristics
when both selecting and setting the specific level of hurdle rate metric and
determining a potential project’s viability.
Thirdly, this research examined the risk analysis methods used to determine a
potential project’s viability through the use of feasibility analysis. This aim
included an investigation into the use of specific techniques including Monte
Carlo simulations, Bayesian models and real option theory, finding few
development organisations surveyed used sophisticated quantitative risk
analysis methods at the pre‐commitment stages of the property development
process. Additional findings indicate property development organisations
possess a high level of confidence in their organisation’s ability in both the
identification and management of risks which may be encountered in a potential
property development project. However, this confidence is not supported in the
actual risk management processes used.

MATTHEW MOORHEAD vi
Recommendations were formulated in three principle areas by synthesising the
results of the analysis of the empirical survey and the literature review. The first
area considered the selection and use of hurdle rate metrics that form a go/no‐
go decision basis for potential projects and site acquisition. The second area
dealt with the feasibility analysis practices and methodologies adopted in
determining project viability. The final area of recommendation involved the
risk analysis techniques used by decision‐makers in property development
organisations during the pre‐commitment stages of the development process.
Consequently, the results of this study have highlighted areas which would
benefit from further research. Themes identified include the linking of
decision‐making practices and hurdle rate selection with project outcomes and
developer success ratings; the selection and use of time value of money hurdle
rate financial metrics and the use of sophisticated risk analysis methods.
Additionally, the results of this study found financial metrics were being used by
decision‐makers in a manner different than those anticipated, and the usefulness
of specific metrics in the application to decision‐making concerning potential
projects should be further investigated.
Keywords
Bounded rationality, feasibility analysis, hurdle rate, property development, real
estate development, risk analysis, scenario analysis, sensitivity analysis.

MATTHEW MOORHEAD vii
Declaration
This thesis is submitted to Bond University in fulfilment of the requirements of
the degree of Doctor of Philosophy.
This thesis represents my own original work towards this research degree and
contains no material which has been previously submitted for a degree or
diploma at this University or any other institution, except where due
acknowledgement is made.
th March
Matthew Moorhead Date

MATTHEW MOORHEAD viii
Acknowledgements
There are many people I would like to thank and acknowledge for their generous
support, encouragement and help throughout the long journey of completing
this thesis, without which it would have been impossible.
I am especially grateful for my supervisors Professor Michael Regan and
Associate Professor Lynne Armitage for their support and encouragement
throughout the years. Michael, your friendship and mentorship have meant a
great deal to me, and I will always cherish your guidance and wisdom and the
patience you graciously extended towards me. You were not able to finish this
journey with me, but I will always be appreciative for the valuable advice you so
freely gave. I so admired your remarkable knowledge and how you always strove
for excellence in all you did. I have heard many people refer to you as a true
gentleman, and never were truer words spoken. May you rest in peace. I would
also like to take the opportunity to thank Associate Professor Lynne Armitage
for stepping in to take over as my primary supervisor at a difficult time. Lynne,
you are a generous person who actively demonstrates how much you care for
your students and the educational standards of the property discipline.
Additionally, you are a gifted researcher and a fantastic supervisor. You allowed
me to see the forest and not just the trees, and also helped me discover the
beauty of written language. Your ability to simplify the complex and motivate
your research students is a great asset to the property discipline. Your emotional
support and compassion were unwavering, and you were always available when
needed.
Furthermore, I would like to send my gratitude and love to my brilliant wife
Jenny for her unwavering support, patience and encouragement throughout my
candidature. Thank you, Jenny, for all you do for our family, you are a wonderful

MATTHEW MOORHEAD ix
person with whom I am blessed to be able to share my life. Also, a special thanks
to our three wonderful children Isabella, Jemima and Charlie for forgiving me
for the absent weekends and long hours at the end of this process. I love you all
dearly and hope that this journey has taught you that if you combine
perseverance and belief, all things are possible.
I would also like to acknowledge and thank my parents, Michael and Randa, as
well as my sister Heather, for their support and encouragement throughout my
life. As a family, you imparted a strong work ethic as well as a strong foundation
of faith. You always demonstrated unwavering optimism and faith in the face of
adversity, and I want to thank you for instilling these principles in your children.
My family is also where my passion for property development and all things real
estate related began, which was nurtured and developed over the years within
the family property business. It is from this background that the drive to
understand how property developers make decisions and set there project
hurdle rates for site acquisition began.
There are many others who have given me encouragement and support over the
years. Specifically, I would like to thank Argus Estate Master for their help in the
distribution of my survey, and particular Tim Peisley and Martin Hill. I
appreciate your enthusiastic support of my research and our kindred spirit in the
love of feasibility analysis. Also, I am very grateful for the support I received from
the Deans of the Faculty of Society and Design at Bond University both past and
present. I am very grateful for Dean Raoul Mortley, Dean George Earl and Dean
Derek Carson for their assistance and understanding with my workload while
undertaking a PhD. Likewise, I would like to thank Associate Professor Darryl
McPhee, Associate Professor Dany O’Hare, Associate Dean of Research Damian
Cox and Professor Kuldeep Kumar for their support with my research
methodology and statistical analysis. Finally, I would like to thank the Office of

MATTHEW MOORHEAD x
Research Services and the many fellow PhD students and friends that have
encouraged me along the way including Amy White, Darryl Lupton, Cameron
Lydster, Johari Amar and Mundhir Al Hasani.
Thank you,
Matthew Moorhead
Researchoutputandpublicationduringcandidature
Published and presented conference abstracts
Moorhead, M. & Armitage, L. ( ), Real property development process,
history and evolution, Proceedings of the th Annual Pacific Rim Real
Estate Society Conference, Melbourne, Victoria, Australia th – th January

MATTHEW MOORHEAD xi
EthicsDeclaration
The research associated with this thesis received ethics approval from the Bond
University Human Research Ethics Committee (BUHREC). Ethics application
numbers and , and copies of the approval letters from BUHREC can
be found in Appendix C.
MATTHEW MOORHEAD xii
TableofContents
Abstract .................................................................................................................................... iii
Keywords .................................................................................................................................. vi
Declaration ............................................................................................................................... vii
Acknowledgements ................................................................................................................. viii
Research output and publication during candidature .............................................................. x
Ethics Declaration ...................................................................................................................... xi
Table of Contents ..................................................................................................................... xii
List of Figures ........................................................................................................................... xx
List of Tables .......................................................................................................................... xxiv
Abbreviations and Acronyms ............................................................................................... xxvii
Chapter 1: Introduction ............................................................................................................. 1
1.1 Purpose of the study ....................................................................................................... 1
1.2 Context and background ................................................................................................. 2
1.4 Research method summary ............................................................................................ 5
1.3 Research questions ......................................................................................................... 6
Research Aim 1: ................................................................................................................. 6
Research Aim 2: ................................................................................................................. 8
Research Aim 3: ............................................................................................................... 11
1.5 Research Structure ........................................................................................................ 13
1.6 Summary ....................................................................................................................... 15
Chapter 2: The Real Estate Development Process ................................................................. 17
2.1 Introduction .................................................................................................................. 17
2.2 Property development defined ..................................................................................... 17
2.3 The role of the developer .............................................................................................. 21
2.4 Types of property development .................................................................................... 23
2.4.1 Ownership structure – public, private or hybrid development ............................. 26
2.4.2 Speculative trader versus investor developers ...................................................... 26
2.4.3 Development management versus traditional development ................................ 27
2.4.4 Other categorical developer types ......................................................................... 28

MATTHEW MOORHEAD xiii
2.5 The Property development industry in Australia .......................................................... 28
2.6 The property development process .............................................................................. 29
2.6.1 Historical concept and evolution of the development process ............................. 29
2.7 Urban Land Institute Development Process Model ...................................................... 34
Stage I: inception of an idea ............................................................................................ 34
Stage 2: Refinement of the Development Project .......................................................... 36
Stage 3: Feasibility Analysis ............................................................................................. 38
Stages 4 and 5: Contract Negotiation and Formal Commitment .................................... 42
Stage 6: Construction ...................................................................................................... 43
Stage 7: Completion and Formal Opening ...................................................................... 45
Stage 8: Property, Asset, and Portfolio Management .................................................... 46
2.8 Recent development process model perspectives ....................................................... 47
2.10 Summary ..................................................................................................................... 50
Chapter 3: Decision Making and Determining Viability in Development Projects ................. 51
3.1 Introduction .................................................................................................................. 51
3.2 Feasibility analysis in the development process ........................................................... 51
3.3 History and evolution .................................................................................................... 55
3.4 Decision making for property development projects ................................................... 57
3.4.1 Bounded rationality and behavioural aspects of decision making in the
development process ...................................................................................................... 60
3.4.2 Feasibility analysis and the decision to proceed .................................................... 61
3.4.3 Hurdle rate selection .............................................................................................. 64
3.4.4 Commonly used hurdle rate metrics ...................................................................... 65
1. Margin on Development Costs (MDC) .................................................................... 66
2. Net Present Value (NPV) ......................................................................................... 68
3. Internal Rate of Return and Target IRR ................................................................... 71
4. Return on equity, equity internal rate of return and return on investment .......... 75
5. Payback period (PB) and breakeven ratios ............................................................. 76
6. Margin on revenue or return on revenue (ROR) ..................................................... 77
7. Weighted average cost of capital (WACC) .............................................................. 77
8. Capital asset pricing model and an allowance for risk ............................................ 78
9. Minimum financial metrics ..................................................................................... 79

MATTHEW MOORHEAD xiv
3.5 Elements of feasibility analysis within a development appraisal.................................. 80
3.5.1 Critical analysis aspect of a feasibility study .......................................................... 81
3.5.2 Determining a development project’s objectives .................................................. 81
a. Non‐Financial Development Objectives .................................................................. 83
b. Financial motivation as a property development objective ................................... 83
3.5.3 Determining a development project’s boundaries and limitations ....................... 84
a. The planning framework ......................................................................................... 85
b. Political issues ......................................................................................................... 88
c. The property market and the broader economy .................................................... 89
d. Project Finance and Capital Raising ........................................................................ 89
3.6 Feasibility methods commonly used in development appraisal ................................... 89
3.6.1 The development equation .................................................................................... 93
3.6.2 Residual land value ................................................................................................. 95
3.6.3 Discounted cash‐flow method ............................................................................... 96
3.6.3.1 Key advantages of the DCF method of feasibility analysis .............................. 97
3.6.4 Residual accumulation cash flow method ............................................................. 98
3.6.5 Market comparison method of determining land value ........................................ 99
3.7 Summary ..................................................................................................................... 100
Chapter 4: Risk & Uncertainty in Property Development Decision Making ......................... 101
4.1 Introduction ................................................................................................................ 101
4.2 History of risk management theory ............................................................................ 105
4.3 Risk management and uncertainty at the pre‐commitment stages of the development
process .............................................................................................................................. 105
4.3.1 Prospect Theory ................................................................................................... 105
4.3.2 Distinctive characteristics of property as an asset class ...................................... 107
a. The supply lag in property markets ....................................................................... 108
b. Transactions in property require large capital commitments .............................. 110
c. Indivisibility and fixed location of assets ............................................................... 110
d. High transaction costs associated with acquisition and disposal of real property assets ......................................................................................................................... 111
e. Real property asset rental yields are regulated by leases which provide an inflation hedge ......................................................................................................................... 111
4.4 Risk identification practices in property development ............................................... 112

MATTHEW MOORHEAD xv
4.4.1 An overview of uncertainty and risk in the development process ...................... 112
4.4.2 The risk analysis process in determining a property development project’s
feasibility ....................................................................................................................... 115
4.4.2 Summary of prior studies of the risk analysis practices of property developers . 118
4.5 Common methods used in feasibility analysis to address uncertainty and risk in
property development projects. ....................................................................................... 121
4.5.1 Sensitivity analysis. ............................................................................................... 122
4.5.2 Scenario Analysis .................................................................................................. 125
4.5.3 Monte Carlo Simulation ....................................................................................... 129
4.5.4 Real Option Analysis ............................................................................................. 132
4.6 Summary ..................................................................................................................... 136
Chapter 5: Research Methods ............................................................................................... 137
5.1 Introduction ................................................................................................................ 137
5.2 Research objectives ..................................................................................................... 137
5.3 Research design ........................................................................................................... 138
5.4 Survey design utilising mixed methods in parallel ...................................................... 141
5.4.1 Phase 1 – a pilot test of the survey ...................................................................... 143
5.4.2 Phase Two ‐ a quantitative and qualitative survey .............................................. 145
5.5 Sample selection ......................................................................................................... 146
5.6 Population ................................................................................................................... 149
5.7 Instrumentation .......................................................................................................... 151
5.8 Efforts to increase the response rate .......................................................................... 152
5.9 Research questions ............................................................................................... 153
5.9.1 Research Aim 1: .................................................................................................... 153
5.9.2 Research Aim 2: .................................................................................................... 155
5.9.3 Research Aim 3: .................................................................................................... 156
5.11 Data analysis .............................................................................................................. 159
5.11.1 Non‐Parametric models and Recursive Partitioning models ............................. 160
5.11.2 Decision Trees .................................................................................................... 162
5.11.3 Artificial Neural Networks .................................................................................. 162
5.11.4 Logistic regression – binary and multinomial .................................................... 163

MATTHEW MOORHEAD xvi
5.12 Research Limitations ................................................................................................. 163
5.13 Summary ................................................................................................................... 167
Chapter 6: Results and Analysis ............................................................................................ 169
6.1 Empirical Data Response Rate..................................................................................... 170
6.2 Characteristics of survey respondents (Independent Variables) ................................ 171
6.2.1 Respondent Profile ............................................................................................... 171
6.2.2 Developer Types ................................................................................................... 173
6.2.3 Respondent geographic distribution .................................................................... 176
6.2.4 Respondent ownership structure ........................................................................ 178
6.2.5 Type of development projects ............................................................................. 180
6.2.6 Experience versus novice respondents ................................................................ 182
6.2.7 Project size of respondents .................................................................................. 185
6.2.8 Educational background of respondents ............................................................. 187
6.2.9 Contribution of responses regarding the characteristics and demographics of
property developers ...................................................................................................... 189
6.3 Decision processes & hurdle rate selection (dependent variables) ............................ 190
6.3.1 Specialised decision‐making structure ................................................................. 190
6.3.2 Use of specific quantifiable go/no‐go decision processes ................................... 197
6.3.3 Hurdle Rate Selection ........................................................................................... 198
6.3.4 Determination of research question RQ 1: .......................................................... 204
Finding RQ 1: ............................................................................................................. 208
6.3.5 Determination of research question RQ 2 a. to g. ............................................... 209
RQ 2a: Projects by property types including residential, commercial, retail, industrial, retirement, infrastructure and mixed‐use projects? ......................... 209
Findings RQ 2a: .......................................................................................................... 215
RQ 2b: Projects by development company size and ownership? Publicly listed and private development companies? Large, medium‐large, medium‐small or small projects? .................................................................................................................... 216
Findings RQ 2b: ......................................................................................................... 227
RQ 2c: Projects by developer motive? Speculative or trader developers versus develop and hold/investor developers? ................................................................... 229
Findings RQ 2c: .......................................................................................................... 233
RQ 2d: Does experience influence hurdle rate selection? Test differences between experienced versus novice decision‐makers. ............................................................ 233

MATTHEW MOORHEAD xvii
Findings RQ 2d: ......................................................................................................... 236
RQ 2e: Do decision‐makers with a specific property‐related degree differ in hurdle rate selection and use? ............................................................................................. 236
Findings RQ 2e: .......................................................................................................... 237
RQ 2f: Are there significant differences in hurdle rate selection and use between the different geographic regions of Australia and New Zealand? ................................... 238
Findings RQ 2f: .......................................................................................................... 238
RQ 2g: Are there significant differences in hurdle rate selection and use between projects by multi‐national development companies operating in multiple countries? ................................................................................................................................... 239
Findings RQ 2g: .......................................................................................................... 240
6.3.6 Hurdle rate adjustment, heuristic bias and bounded rationality ......................... 240
6.3.7 Determination of research question RQ 5: .......................................................... 240
Finding RQ 5 .............................................................................................................. 248
6.3.8 Determination of research question RQ 6: .......................................................... 248
Finding RQ 6: ............................................................................................................. 249
6.3.9 Contribution of respondent organisations decision processes & hurdle rate
selection ........................................................................................................................ 250
6.4 Feasibility practices (dependent variables) ................................................................. 250
6.4.1 Variables that respondent organisations forecast in order to complete a feasibility
analysis .......................................................................................................................... 251
6.4.2 Use of proprietary feasibility analysis software programs .................................. 253
6.4.3 Determination of research question RQ 3: .......................................................... 255
The use of bespoke feasibility programs................................................................... 259
Finding RQ 3: ............................................................................................................. 259
6.4.4 Retrospective Analysis of Forecasts ..................................................................... 260
6.4.5 Determination of research question RQ 4: .......................................................... 263
Finding RQ 4: ............................................................................................................. 264
6.4.6 Contribution of respondents regarding the feasibility analysis practices of
property developers ...................................................................................................... 265
6.5 Risk analysis and cultural environment (dependent variables) .................................. 265
6.5.1 Risk appetite perception ...................................................................................... 265
6.5.1.1 Difference in risk appetite perception between developer types ................ 268
6.5.2 Project risk analysis methods ............................................................................... 269

MATTHEW MOORHEAD xviii
6.5.3 Determination of research question RQ 7: .......................................................... 273
Finding RQ 7: ............................................................................................................. 276
6.5.4 Project risk identification and risk management processes ................................ 276
6.5.5 Confidence in risk analysis and management ...................................................... 280
6.5.6 Summary of responses to qualitative questions .................................................. 282
6.5.7 Determination of research question RQ 8: .......................................................... 289
Findings RQ 8: ............................................................................................................ 289
6.5.8 Contribution of responses concerning risk analysis, risk management processes
and organisational cultural aspects of property developers ........................................ 290
6.6 Summary ..................................................................................................................... 290
Chapter 7: Recommendations and further research ............................................................ 293
7.1 Review of the literature from Chapters 2 ‐ 4 .............................................................. 294
7.2 Summary of Findings ................................................................................................... 296
7.2.1 Research Aim 1 – The role of feasibility analysis and hurdle rate selection in
management decision making and determining viability in the pre‐commitment stages
of the development process ......................................................................................... 296
7.2.2 Research Aim 2 – The relationship between bounded rationality and heuristic bias
in management decision‐making by Australian and New Zealand property development
organisations ................................................................................................................. 304
7.2.3 Research Aim 3 – Consider the use of Monte Carlo simulations, Bayesian models
and option theory, real and embedded options in long‐term property development and
investment decision making as instruments for providing flexibility and managing risk,
uncertainty and change. ............................................................................................... 305
7.3 Recommendations ...................................................................................................... 307
7.4 Contribution ................................................................................................................ 310
7.5 Further Research ......................................................................................................... 314
References ............................................................................................................................. 318
Appendix A ‐ Definitions and Terms ...................................................................................... 366
Appendix B ‐ Questionnaire Survey Instrument, Research Explanation Statement and
Participant Consent ............................................................................................................... 373
Appendix C – Ethics Clearance .............................................................................................. 385
Appendix D – Decision Tree & Random Forest Results ........................................................ 387
Appendix E ‐ Results of Artificial Neural Network Analysis ................................................... 395

MATTHEW MOORHEAD xix
Appendix F ‐Non‐Parametric Tests of Independent Samples ............................................... 403
Appendix G – T‐test of independent samples ....................................................................... 433
Appendix H – Chi Square Tests for Independence ................................................................ 442
Appendix I ‐ Results of Logistic Binary and Multinomial Regression Analysis ...................... 470
Appendix J – Analysis of Variance (ANOVA) .......................................................................... 475
MATTHEW MOORHEAD xx
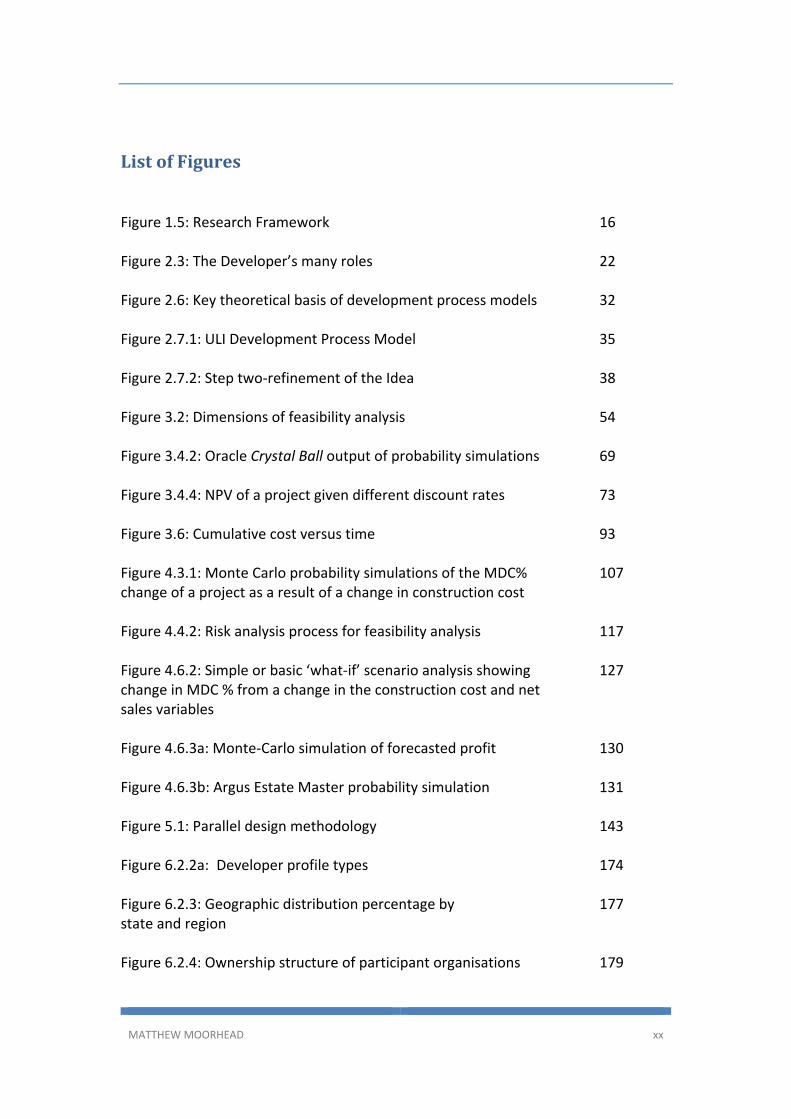
ListofFigures
Figure 1.5: Research Framework 16
Figure 2.3: The Developer’s many roles 22
Figure 2.6: Key theoretical basis of development process models 32
Figure 2.7.1: ULI Development Process Model 35
Figure 2.7.2: Step two‐refinement of the Idea 38
Figure 3.2: Dimensions of feasibility analysis 54
Figure 3.4.2: Oracle Crystal Ball output of probability simulations 69
Figure 3.4.4: NPV of a project given different discount rates 73
Figure 3.6: Cumulative cost versus time 93
Figure 4.3.1: Monte Carlo probability simulations of the MDC% 107 change of a project as a result of a change in construction cost Figure 4.4.2: Risk analysis process for feasibility analysis 117
Figure 4.6.2: Simple or basic ‘what‐if’ scenario analysis showing 127 change in MDC % from a change in the construction cost and net sales variables Figure 4.6.3a: Monte‐Carlo simulation of forecasted profit 130
Figure 4.6.3b: Argus Estate Master probability simulation 131
Figure 5.1: Parallel design methodology 143
Figure 6.2.2a: Developer profile types 174
Figure 6.2.3: Geographic distribution percentage by 177 state and region
Figure 6.2.4: Ownership structure of participant organisations 179

MATTHEW MOORHEAD xxi
Figure 6.2.5a: Distribution percentage of the type of property developed 181 Figure 6.2.6: Respondent years of experience 183
Figure 6.2.7a: Dominant preferred project size ($’s) 185
Figure 6.2.7b: Percentages of preferred project size by project cost 186
Figure 6.2.8a: Highest level of education 188
Figure 6.2.8b: Respondents who have a property‐related degree 189
Figure 6.3.1a: The company applies a consistent decision‐making 191 methodology Figure 6.3.1b: Decision Tree analysis of the use of specific 192
hurdle rates and a consistent decision‐making methodology Figure 6.3.1c: Formalised decision process 193
Figure 6.3.1d: Number of levels of approval required for project 194 commencement Figure 6.3.2: Summary of responses to go/no‐go decision process 198
Figure 6.3.3a: Responses to use of specific fixed financial‐based 200 hurdle rates Figure 6.3.3b: Percentage frequency of specific hurdle rates 201 used in project decision making of all survey respondents
Figure 6.3.4a Respondents who use go/no‐go hurdle rates as a basis 206 of decision‐making and percentage use of specific hurdle metrics Figure 6.3.4b Frequency of number specific hurdle rate metrics 207
Figure 6.3.5a: Mean minimum percentage of MDC for dominant 212 property type Figure 6.3.5b: Mean minimum percentage of IRR for dominant 214 property type
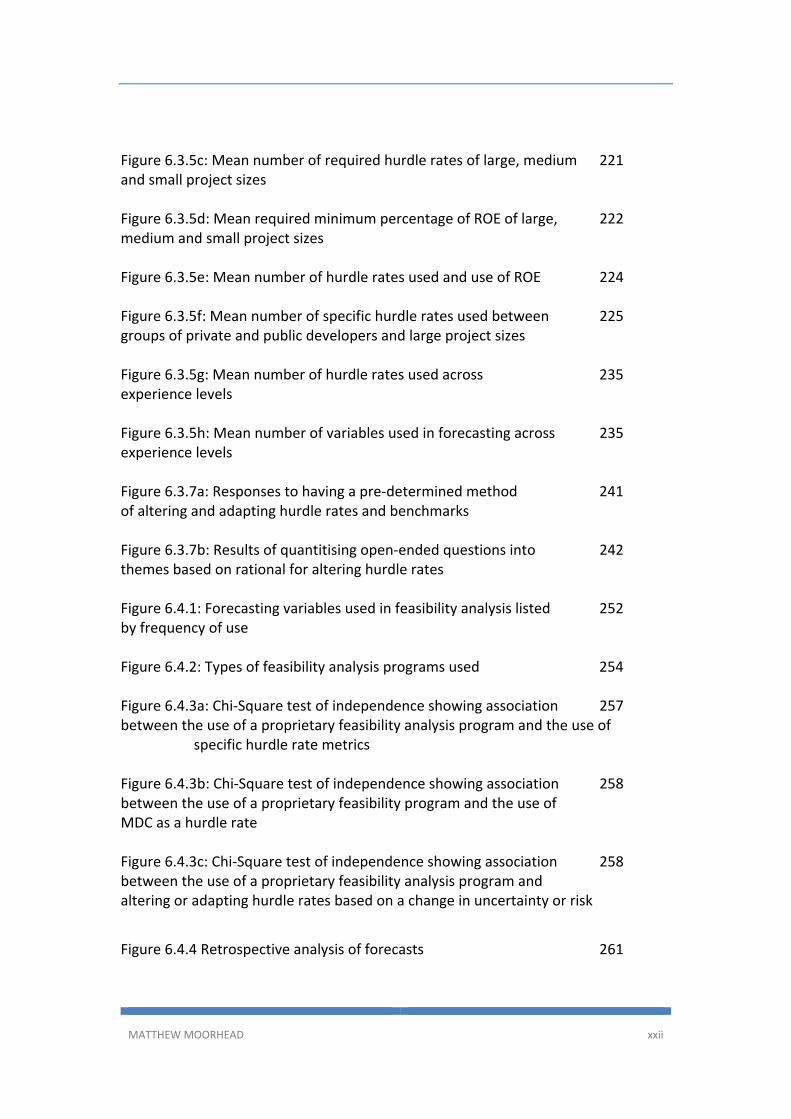
MATTHEW MOORHEAD xxii
Figure 6.3.5c: Mean number of required hurdle rates of large, medium 221 and small project sizes Figure 6.3.5d: Mean required minimum percentage of ROE of large, 222 medium and small project sizes Figure 6.3.5e: Mean number of hurdle rates used and use of ROE 224
Figure 6.3.5f: Mean number of specific hurdle rates used between 225 groups of private and public developers and large project sizes Figure 6.3.5g: Mean number of hurdle rates used across 235 experience levels Figure 6.3.5h: Mean number of variables used in forecasting across 235 experience levels Figure 6.3.7a: Responses to having a pre‐determined method 241 of altering and adapting hurdle rates and benchmarks Figure 6.3.7b: Results of quantitising open‐ended questions into 242 themes based on rational for altering hurdle rates Figure 6.4.1: Forecasting variables used in feasibility analysis listed 252 by frequency of use Figure 6.4.2: Types of feasibility analysis programs used 254
Figure 6.4.3a: Chi‐Square test of independence showing association 257 between the use of a proprietary feasibility analysis program and the use of specific hurdle rate metrics Figure 6.4.3b: Chi‐Square test of independence showing association 258 between the use of a proprietary feasibility program and the use of MDC as a hurdle rate Figure 6.4.3c: Chi‐Square test of independence showing association 258 between the use of a proprietary feasibility analysis program and altering or adapting hurdle rates based on a change in uncertainty or risk
Figure 6.4.4 Retrospective analysis of forecasts 261

MATTHEW MOORHEAD xxiii
Figure 6.4.5: Percentage usage of methods of land valuation in 264 feasibility analysis Figure 6.5.1 Perception of organisational risk appetite 266
Figure 6.5.2: Risk analysis methods used in feasibility analysis at the 272 pre‐commitment stages of the property development process Figure 6.5.4a: Project risk identification in the pre‐commitment stages 277 of the property development process Figure 6.5.4b: Risk management processes 279
Figure 6.5.5: Confidence in risk identification at the pre‐commitment 281 stages of the property development process Figure 6.5.6: Organisation change of risk management policy as a 283 result of the GFC
MATTHEW MOORHEAD xxiv
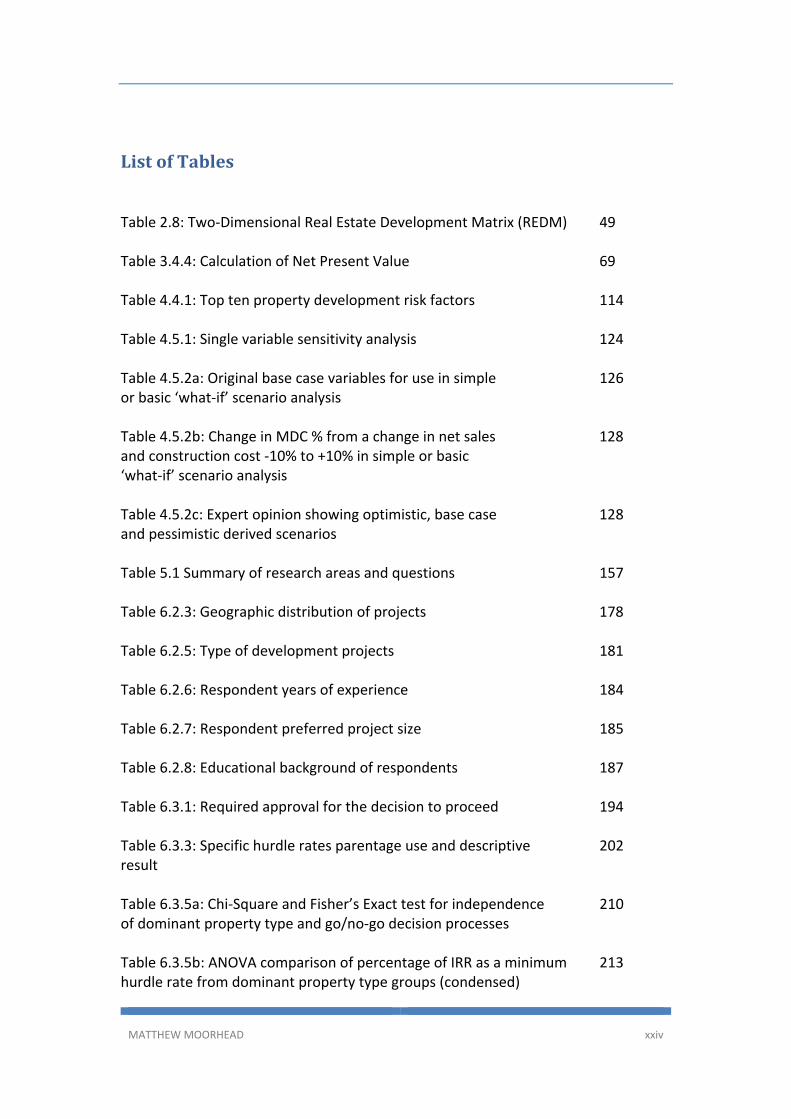
ListofTables
Table 2.8: Two‐Dimensional Real Estate Development Matrix (REDM) 49
Table 3.4.4: Calculation of Net Present Value 69
Table 4.4.1: Top ten property development risk factors 114
Table 4.5.1: Single variable sensitivity analysis 124
Table 4.5.2a: Original base case variables for use in simple 126 or basic ‘what‐if’ scenario analysis Table 4.5.2b: Change in MDC % from a change in net sales 128 and construction cost ‐10% to +10% in simple or basic ‘what‐if’ scenario analysis
Table 4.5.2c: Expert opinion showing optimistic, base case 128 and pessimistic derived scenarios
Table 5.1 Summary of research areas and questions 157
Table 6.2.3: Geographic distribution of projects 178
Table 6.2.5: Type of development projects 181
Table 6.2.6: Respondent years of experience 184
Table 6.2.7: Respondent preferred project size 185
Table 6.2.8: Educational background of respondents 187
Table 6.3.1: Required approval for the decision to proceed 194
Table 6.3.3: Specific hurdle rates parentage use and descriptive 202 result
Table 6.3.5a: Chi‐Square and Fisher’s Exact test for independence 210 of dominant property type and go/no‐go decision processes
Table 6.3.5b: ANOVA comparison of percentage of IRR as a minimum 213 hurdle rate from dominant property type groups (condensed)

MATTHEW MOORHEAD xxv
Table 6.3.5c: Ownership structure by organisation of survey respondents 218
Table 6.3.5d: Mean, standard deviation and standard error of large 220 medium and small project sizes and hurdle rates Table 6.3.5e: One‐way ANOVA of large, medium and small project 220 size and hurdle rate levels Table 6.3.5f: One‐way ANOVA of large, medium and small project size 223 and hurdle rate levels
Table 6.3.5g: Binary logistic regression as a predicter of developers 227 who undertake large project sizes Table 6.3.5h: Results of Chi‐Square test of independence of developer 230 typologies and specific hurdle rates used and using a go/no‐go decision process
Table 6.3.5i: Mean, standard deviation and standard error of 231 developer type (condensed) and hurdle rate levels and numbers used Table 6.3.5j: One‐way ANOVA of developer type (condensed) and 232 hurdle rate levels showing differences between groups Table 6.3.5k: One‐way ANOVA of developer type (condensed) and 232 hurdle rate levels showing mean, standard error and significance Table 6.3.5l: Kruskal‐Wallis H test of experience levels and hurdle 234 rate usage Table 6.3.7: Results of ANN as a predictor of altering hurdle rates 247 Table 6.4.2a: Feasibility analysis program utilisation 255
Table 6.4.4a: Change in variables forecasted in feasibility analysis 260
Table 6.4.4b: Mann‐Whitney U test of independent samples for 262 developing a bespoke feasibility analysis program (See Appendix F‐8) Table 6.5.1a: Responses of perception of organisational risk appetite 267 Wiegelmann (2012) and Moorhead (2016) compared

MATTHEW MOORHEAD xxvi
Table 6.5.1b: One‐way ANOVA of project size and risk tolerance 268 perception score
Table 6.5.1c: Mean, standard deviation and standard error of large, 268 medium and small project sizes and risk tolerance perception
Table 6.5.1d: Grouped median of developer type risk appetite perception 269
Table 6.5.2: Methods for analysing project risk 270
Table 6.5.3a: Mann‐Whitney U test between groups of respondents 274 who use Monte Carlo, Real option theory or Probability analysis/Bayesian models and variables Table 6.5.3b: T‐test of independence of use of complex quantitative 275 risk analysis methods and dependent variables Table 6.5.4: Project risk identification question comparison 278 to Wiegelmann (2012) Table 6.5.5: Confidence in risk analysis and management 282
Table 6.5.6a: Respondents organisation has a risk management plan 282
Table 6.5.6b: Categories of risk policy change 284

MATTHEW MOORHEAD xxvii
AbbreviationsandAcronyms
ABS Australian Bureau of Statistics
ANN Artificial neural networks
ANOVA Analysis of variance
API Australian Property Institute
AUD Australian dollar
BUHREC Bond University Human Research Ethics Committee
CAPM Capital asset pricing model
CART Classification and regression trees
CBOE Chicago Board Option Exchange
CFA Confirmatory factor analysis
CEO Chief executive officer
CFO Chief financial officer
DCF Discounted cash flow
DT Decision trees
DNRME Department of Natural Resources, Mines and Energy
EDQ Economic Development Queensland
EFA Exploratory Factor Analysis
FA Factor Analysis
GAV Gross Asset Value
GDP Gross Domestic Product
MATTHEW MOORHEAD xxviii
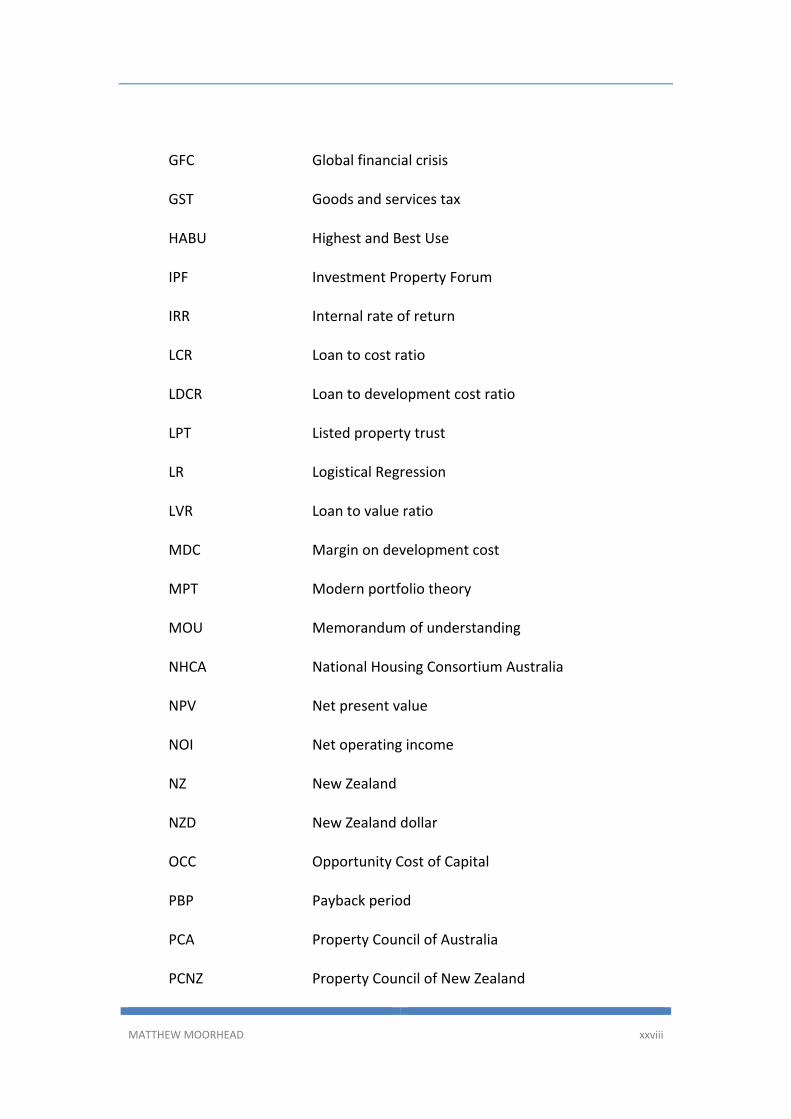
GFC Global financial crisis
GST Goods and services tax
HABU Highest and Best Use
IPF Investment Property Forum
IRR Internal rate of return
LCR Loan to cost ratio
LDCR Loan to development cost ratio
LPT Listed property trust
LR Logistical Regression
LVR Loan to value ratio
MDC Margin on development cost
MPT Modern portfolio theory
MOU Memorandum of understanding
NHCA National Housing Consortium Australia
NPV Net present value
NOI Net operating income
NZ New Zealand
NZD New Zealand dollar
OCC Opportunity Cost of Capital
PBP Payback period
PCA Property Council of Australia
PCNZ Property Council of New Zealand

MATTHEW MOORHEAD xxix
PhD Doctor of Philosophy
RACFM Residual Accumulation Cash Flow Method
REDM Real Estate Development Matrix
REIT Real estate investment trust
RF Random forests
RICS Royal Institution of Chartered Surveyors
ROE Return on equity
ROI Return on investment
ROR Return on revenue
ROS Return on sales
SD Standard deviation
SPV Special purpose vehicle
SWOT Strengths, weaknesses, opportunities and threats
TDC Total development cost
UDIA Urban Development Institute of Australia
ULI Urban Land Institute
UK United Kingdom
U.N. United Nations
USA United States of America
VRB Valuers Registration Board

MATTHEW MOORHEAD xxx
(This page was left blank intentionally.)

Chapter1:Introduction
MATTHEW MOORHEAD 1
Chapter1:Introduction
Little is known regarding either the expected or achieved rates of return for property development schemes. This lack of transparency is in contrast to the situation for investment properties where the formation of target return rates has been explored… Many participants in real estate development are not formally benchmarked and academic investigation of how developers form required rates of return is limited. (Crosby, Devaney & Wyatt, 2018a p. 1‐2)
1.1Purposeofthestudy
The basis of this research is founded upon many years of decision‐making
concerning whether to proceed or not to proceed with potential property
development projects or choosing between multiple heterogeneous projects.
Property investment/development companies engage in feasibility analysis
while conducting due diligence as a basis for the decision‐making process before
committing to the purchase of a property investment and/or development site.
The act of conducting feasibility analysis as part of a development appraisal is a
necessary and critical initial stage of the overall real estate development process.
The primary focus of this research is to examine and critically assess the methods
and processes undertaken prior to an unconditional commitment to proceed
with a property development project. The primary purposes of conducting a
feasibility analysis for a potential development project are two‐fold, firstly to
determine likely costs and income and to ascertain potential profitability and

Chapter1:Introduction
MATTHEW MOORHEAD 2
cash‐flow needs, and secondly, to analyse the uncertainty and risk associated
with the project and determine if the potential profitability is sufficient to justify
accepting the associated level of uncertainty and risk.
1.2Contextandbackground
Current practice for real estate companies engaged in property investment,
development, redevelopment, rehabilitation and advisory activities is to employ
a series of generic hurdle rates based on industry and/or company‐specific rules
of thumb and industry‐wide benchmarks commonly expressed as hurdle rates of
return (Diaz III, ; Havard, ; Sah et al., ; Rowley et al., ; Crosby
et al., a). Hurdle rates designate a minimum level of return or profitability
which is intended to include the developer’s cost of capital and a premium
commensurate with a subjective assessment of a project’s unsystematic risk. The
company and/or project defined hurdle rates are then used to measure project
viability and inform decision‐making during the pre‐commitment stages of the
development process. The various methods of determining feasibility and
project performance in use today have been developing since the s and
commonly include static residual valuation, residual accumulative cash flow
analysis and discounted cash flow (DCF) analysis in order to determine a
project’s net present value (NPV).
Common hurdle rates incorporated into static development appraisals include
margin on development cost (MDC) also known as return on cost (ROC),
internal rate of return (IRR), net present value (NPV) and/or return on equity
(ROE). There exists a large body of financial and academic literature regarding
the use and development of the aforementioned methods of assessing projects
including significant criticisms of their use. However, there remains a paucity of
research and literature in the specific aspect of the selection and application of
hurdle rates for property development projects, as demonstrated in the Crosby,

Chapter1:Introduction
MATTHEW MOORHEAD 3
Devaney & Wyatt ( a) quote given at the start of this chapter. Recent studies
have demonstrated that the use of common financial metrics from the wider
investment financial literature are being used by property developers in the
inverse of methods that would be expected (Hutchinson et al., ; Crosby et
al., a).
More recent advances in the literature have recommended the use of real option
theory as a model for valuing projects and the inclusion of Monte Carlo
simulations as a prescriptive model for assessing scenarios and possible
outcomes, but the level of uptake of these methods across the property
development industry is not known as it is not recorded.
The research also aims to examine the heuristic ‘go’ or ‘no‐go’ hurdle rate
indicators that practitioners incorporate within the decision‐making process as
well as gain an understanding of how these practitioners define, measure and/or
predict uncertainty and risk, and how that measurement feeds back into the
decision‐making process. Additionally, through the process of this analysis, it is
hoped to gain insights into property developer’s practices across different sectors
of the industry as well as to differentiate methods of decision making after
allowing for various purposes of undertaking the project. Furthermore, an
analysis was undertaken to assess the adoption of non‐conventional methods of
assessment including Monte‐Carlo simulations and probability analysis, real
option theory, Bayesian models of predictability as well as strategies that do not
fit within the normal bell curve which includes the fractal geometry of
Mendelbroit/Taleb (Makridakis & Taleb, ; Madelbrot & Taleb, ).
There is a large body of research which outlines the various stages of the real
estate development process as well as their key linkages. For examples see
Brueggeman & Fisher ( , ); Cadman & Topping ( ); Isaac et al., ( );

Chapter1:Introduction
MATTHEW MOORHEAD 4
Kohlhepp ( ); Kohlhepp & Kohlhepp ( ); Long ( ); McMahan ( );
Miles et al., ( ); Peca ( ); Peiser & Hamilton ( ); Preller & Costello
( ); Ratcliffe et al., ( ); Sims & Reed ( ); Wilkinson & Reed ( );
Woodson ( ); Wurtzebach et al., ( ); Zuckerman & Blevins ( ). The
current study, which particularly seeks to acquaint the reader with key
performance areas that make up the integrated process, conducts a critical
literature review as well as an empirical assessment of the decision process or
processes engaged within the preliminary stages of the real estate development
process. This foundation of theory will create a platform for the addition of
empirical evidence on specific decision‐making processes that are currently
being adopted within the industry through conducting an empirical analysis
from a survey of leading industry practitioners and to compile and document the
key methodologies used as well as the weight practitioners place upon them. In
the post‐global financial crisis (GFC) property development and property
investment industry, it is critical to gain further understanding of how the risks,
uncertainty and decision process are evolving to ensure a reduced likelihood of
project failure given an internal or external shock to the property market.
A complicating factor is that not all real estate development activities are short‐
term with many investors willing to assume early‐stage ownership risks to grow
value and generate a high return to equity. Longer‐term investment holding
periods introduce new risks, uncertainties and change management which are
often unidentifiable at the preliminary feasibility analysis stage of a project.
Additionally, the use of discounting methods within heuristic decision models
may lead to a bias against longer‐term projects in favour of projects which return
capital in the short term. This is particularly the case with staged developments
in many sectors, newly listed assets and infrastructure (Regan, ).

Chapter1:Introduction
MATTHEW MOORHEAD 5
1.4Researchmethodsummary
A review of relevant literature and prior studies shows there exists a gap in
knowledge regarding the selection and setting of hurdle rates and benchmarks
for Australian real estate development projects in the pre‐commitment stages of
the development process. The primary purpose of this research is to inform
regarding this gap by gaining an understanding of the decision‐making practices
utilised within the development industry in Australia. In order to achieve the
research objectives, it was essential to seek a comprehensive insight into two
major attributes of current decision‐making practices: Firstly, identifying the
practices utilised in the industry and, secondly, to explore the reasons behind
the choice of tools employed that aid decision‐making under conditions of
uncertainty.
In order to achieve this research objective, the research method adopted for the
thesis was a parallel mixed‐method design that was conducted through a single
survey, rather than through a mixed‐mode instrumental approach in order to
take advantage of the strengths of a combined instrument (Curran & Blackburn,
).
The rationale for the selection of this method is discussed below and includes
three primary reasons being: First, by having quantitative questions that were
immediately followed by qualitative questions allowed participants to respond
to questions regarding demographic characteristics and decision practices of the
property development organisation, and then expand upon the views of
decision‐makers within those organisations in qualitative open‐ended questions.
Second, the use of parallel strands within the same instrument allowed for a
much larger sample of qualitative responses than could reasonably be obtained
through other qualitative data collection methods. Third, the use of a parallel

Chapter1:Introduction
MATTHEW MOORHEAD 6
survey allowed for a far larger reach in both geographic terms and industry scope
than would have been practical using primarily qualitative data collection
approaches. Finally, the limitations of the research methodology are discussed.
1.3Researchquestions
The research questions that frame the focus of this thesis were designed to
address the gaps within the relevant literature concerning the hurdle rate
selection and decision processes of Australian property developers. The
questions were originated with the primary purpose of addressing the research
aims which are now discussed.
ResearchAim1:
Determine the role of feasibility analysis and development appraisals in
management decision‐making, the use of hurdle rate methodologies and
forecasting practices, building on decision theory and value management
knowledge frameworks. Does theory provide insights into the role of feasibility
analysis with new projects?
These broad aims were reformated to provide more specific, operationally
effective, research questions (RQ).
RQ : Do Australian property development firms use specific go/no‐go
hurdle rate mechanisms as a decision basis for proceeding beyond the pre‐
commitment stages of the development process? What are the specific
hurdle rates and benchmarks which are currently being used by Australian
property development firms?

Chapter1:Introduction
MATTHEW MOORHEAD 7
RQ : What are the differences in the hurdle rates and benchmark selections
as the basis of go/no‐go decisions based on the following factors.
a. Projects by property types including residential, commercial, retail,
industrial, retirement, infrastructure and mixed‐use projects.
b. Projects by development company size and ownership? Publicly listed
and private company structured development companies? Large,
large‐medium, medium‐small or small projects.
c. Projects by tenure, including speculative or trader developers versus
develop and hold/investor developers which is more recently referred
to as ‘build to rent’.
d. Does experience influence hurdle rate selection? Test differences
between experienced versus novice decision‐makers.
e. Do decision‐makers with a specific property‐related degree differ in
hurdle rate selection and use?
f. Are there significant differences in hurdle rate selection and use
between different geographic regions of Australia and New Zealand?
RQ : Do organisations and decision‐makers that utilise proprietary
feasibility programs differ in their feasibility practices and the selection
and use of hurdle rates from those which use Microsoft Excel or create
their own feasibility analysis program?
RQ : Do Australian development companies use the residual land value
method, discounted cash‐flow method, residual accumulation cash flow

Chapter1:Introduction
MATTHEW MOORHEAD 8
method and/or market comparison method for determining a potential
development site’s value in the pre‐commitment stages of the property
development process?
ResearchAim2:
Examine the relationship between bounded rationality, heuristic bias and
management decision‐making in the presence of volatile externalities with a
view to measuring the extent of variable interdependence over time.
a. RQ : Do development companies have a pre‐determined process and
method of altering or adapting the chosen hurdle rates and benchmarks?
How do Australian property development organisations specify and change
the required hurdle rates and benchmarks as a basis of go/no‐go decisions in
light of increased risk and uncertainty?
b. RQ : Do development companies demonstrate bounded rationality in their
decision‐making processes?
The vast majority of decision‐making models that have been developed for, and
employed by, practitioners to determine whether to proceed with an
investment/development project are predicated upon the decision‐maker being
a well‐informed rational economic man (sic) as described in Simon “A
Behavioral Model of Rational Choice” (Simon, ). Human beings are fallible
and therefore the interpretation and application of models must also be
imperfect as models are ultimately derived from human behaviour and cash
flows are created by human actions making decisions to consume space over
time (Black et al., ).

Chapter1:Introduction
MATTHEW MOORHEAD 9
However, as any individual required to make a complex decision can testify, the
volume of information available and the certainty of the forecast of future
variables is invariably limited, which thereby limits the rationality that the
decision‐maker can possess. This concept of Bounded Rationality coined by
Simon explains that ‘boundedly rational agents experience limits in formulating
and solving complex problems and in processing information’ (Simon ,
Chittenden & Derregia, ).
Feasibility analysis requires the decision‐maker to make assumptions and
forecast estimates of all the input and output variables within a project’s cash
flow. This necessitates a prediction of all internal and external constraints to the
project and encapsulates both the systematic and unsystematic risk over variable
time frames. Real estate projects are inherently complex and involve the
interdependence of many elements and project participants each with their own
agenda and decision‐making processes. The sheer magnitude of the
interdependence of the many variables makes accurate prediction highly
unlikely, conceivably approaching impossibility. Makridakis ( ), Makridakis
& Hibon ( ) and Taleb ( ) also highlighted an additional problem with
predictive models. These models show a high degree of inaccuracy in that they
can lead to an illusion that future uncertainty can be accurately assessed and
effectively controlled. They argue that we can predict using fractal geometry and
that there is a system and patterns within chaos.
For example, in order to complete an NPV calculation of a property investment
the decision‐maker is required to forecast the net operating income (NOI) over
a period of time which would normally be five to ten years. This requires the
assumption of market rent not only at the time of purchase or post‐development,
but through any possible changes in the real estate property cycle. The real
estate cycle is dependent on numerous variables including the general economic

Chapter1:Introduction
MATTHEW MOORHEAD 10
cycle, unemployment, tax policy, supply of comparable properties, the credit
cycle and countless other economic factors both locally, nationally and globally.
With the increasing interdependence of economies and capital markets, the
bounds of influence have become increasingly large and hard to define, as
experienced during the global financial crisis (GFC) and pointedly described in
Acharya & Richardson ( ).
So how does an analyst make a reliable forecast of this variable which is just one
of many? Analysts are not able to find perfect solutions based on complex models
but are looking for the best approximation they can make in order to allow them
to make a decision. The analyst does not have the luxury of not making a
decision but is forced to choose the best alternative of the many imperfect
choices and described in Diaz III ( , p. ) as follows:
There is great inefficiency in the market; there is significant friction. Because
of basic architectural limitations on human cognition real estate analysis is a
heuristic process shadowed by predictable bias and haunted by sentiment.
Furthermore, it has also been shown that reliance on heuristics increases with
experience (Sah et al., ).
Tversky and Kahneman in their work Judgement under uncertainty:
Heuristics and biases offered the idea that, in order to overcome an uncertain
outcome in the future, decision‐makers rely on heuristics or rules of thumb
(Tversky & Kahneman, , ). Within the feasibility analysis process, these
rules of thumb are often applied to the values of future variables based on
historic data or past experience Crosby et al., a, p. ). Often these rules of
thumb are incorporated into ‘go/no‐go’ hurdle rates (Hutchinson et al., ).
Havard ( , p. ) when commenting on UK property developers states “the

Chapter1:Introduction
MATTHEW MOORHEAD 11
normally accepted rules of thumb are for a per cent profit margin on costs for
speculative commercial schemes, and to per cent on residual projects.” This
research will investigate if these suggested hurdle rates are also applicable in
Australia.
Hence, more specifically, this research aims to:
To ascertain the level of heuristics prevalent within the real estate
industry and how they handle uncertainty and risk.
To examine the processes of risk definition at the preliminary feasibility
stage and how these influences risk management during the project.
To examine if there have been any significant changes in practice or
heuristics used in the decision‐making process as a result of the GFC.
To investigate how the experience of experts influences and/or changes
the usage and methods of both the use of heuristics and the decision
process when compared to educated but relatively inexperienced novices.
To trace the decision analysis process, comparing not only decision‐
makers with differing levels of experience but also between the various
sectors within the real estate property market.
ResearchAim3:
Consider the use of Monte Carlo simulations, Bayesian models and option theory,
real and embedded options in long‐term property development and investment
decision making as instruments for providing flexibility and managing risk,
uncertainty and change.
Hence, more specifically:
Chapter1:Introduction
MATTHEW MOORHEAD 12
RQ : Do Australian property development companies use sophisticated
theory‐led structured quantitative analyses in the feasibility models used in
the decision‐making processes of the pre‐commitment stages of the
development process? Do Australian development firms use Monte Carlo
simulations, Bayesian models, and/or option theory to aid decision‐making?
RQ : Are Australian property development companies confident in their
organisation’s risk identification and management practices in the decision‐
making processes of the pre‐commitment stages of the development process?
This research also aims to investigate the use of real option theory, which is
based upon the theoretical models of option theory that have been used in the
derivatives markets since the founding of the Chicago Board Option Exchange
(CBOE) in . The Black Scholes and then the Black Scholes Merton model of
valuing a derivative of an underlying asset given five key pieces of information
uses:
. Underlying price
. Strike price
. Time to expiration
. Risk‐free rate of return
. Implied volatility of the underlying asset
(Black & Scholes, ; Merton )
The subsequent addition of consistent revenue streams tied to the underlying
Merton model allowed for regular dividends to form part of the valuation
methodology.

Chapter1:Introduction
MATTHEW MOORHEAD 13
Later option theory was applied to business management decision processes as
a valuation methodology for a business or project. Real option theory has
adapted the underlying option theory as a means of valuation of the potential
for a project site or the flexibility of staging and or delaying commencement.
Over the last decade there have been numerous publications along these lines,
but most models proposed are very complex and problematic to use in daily
practice. The practices used in industry versus the techniques described in the
academic literature (known as the ‘town/gown gap’) is very wide in relation to
the application of real option theory in preliminary feasibility analysis
(Grenadier, ; Hengels, ; Bulan et al., ; Cunningham, , ;
De Neufville et al., ( ); Dong & Sing, ).
1.5ResearchStructure
This thesis has been structured along the following basis, and is also illustrated
in Figure . :
Chapter : Introduction
This chapter provides an overview of the thesis topic as well as describing the
research motivation, research methodology adopted, the research aims and
specific research questions and the overall structure of the thesis.
Chapter : The Real Estate Development Process
In order to understand the decision‐making processes of property development
organisations, it is important to understand the property development industry
and the property development process within which decisions are made.
Chapter provides an overview of the role of property development, types of

Chapter1:Introduction
MATTHEW MOORHEAD 14
property development and the history and evolution of property development
process models.
Chapter : Decision Making and Determining Viability
This chapter provides an overview of the literature from finance and related
property fields regarding the determination of viability and feasibility analysis.
Decision‐making models, as well as methods for determining project viability,
are reviewed. Additionally, the common aspects of feasibility analysis used in
industry to determine viability are discussed as well as the literature regarding
the selection and use of key hurdle rate financial metrics.
Chapter : Risk and Uncertainty in Property Development Decision
Making
This chapter provides an overview of how risk and uncertainty are present in
property development projects and outlines key literature concerning the
identification, measurement and evaluation of risk. As this research is primarily
concerned with the detection and management of potential risks at the pre‐
commitment stages of the development process, specific risk analysis methods
commonly used in feasibility analysis are reviewed. Additionally, this chapter
will provide a background to the evolution of the theory of the identification of
risk and uncertainty. Finally, methods and strategies for risk transference by
project development companies are also examined.
Chapter : Research Methods
This chapter reviews the research methodology adopted as well as identifies the
key research questions. The research method used for this thesis a parallel mixed
method design conducted through a single survey. This chapter discusses the

Chapter1:Introduction
MATTHEW MOORHEAD 15
sampling and data collection methods used as well as the statistical methods to
be applied to analyse the data and address the research questions. Finally,
consideration is given to the limitations of the research a consequence of the
selection and application of the chosen research methodology.
Chapter : Results
This chapter analyses and discusses the results of the statistical analysis
conducted on the data collected by the research instrument. Additionally, the
specific research questions addressing each research aim are addressed and
discussed.
Chapter : Recommendations and further research
This chapter provides a conclusion to the thesis and a summary of the findings
from the data analysis. Additionally, this chapter presents the key
recommendations and discusses the research contribution of the thesis and
presents recommendations for future research. This chapter is followed by the
thesis references and appendices.
1.6Summary
Chapter has provided an overview of the purpose and background of the study.
Additionally, the research questions and research methodology were discussed
as well as an outline of the structure of the thesis. The following chapter will
discuss the literature regarding the role of property development in an urban
environment as well as give an overview of the history and evolution of the real
estate or property development process.

Chapter1:Introduction
MATTHEW MOORHEAD 16
Figure 1.5 Research Structure
Source: Author ( ); derived from Cerimagic ( )
Research Aims
This research aims to broaden the knowledge base concerning the existing decision‐making processes within development companies across industry sectors, tenure and company size in Australia.
This includes gaining a greater understanding of hurdle rate selection including the various decision methods used, identifying their level of use and the importance of each method to different sectors of the property development industry
Additionally, this research aims to make a contribution to the relevant literature examining the extent of the decision‐making methodologies and the hurdle rates chosen as the go/no‐go decision triggers for project and site acquisition by property development companies in Australia.
Chapter One Introduction: Background, purpose and significance of study
Chapter Two The Real Estate Development Process
Chapter Three Decision Making & Determining Viability in Development
Chapter Four Risk & Uncertainty in Property Development Decision Making
Chapter Five Research Methods
Chapter Six Results & Analysis
Chapter Seven Recommendations & Further Research
Analysis leads to the
recommendation
The literature review informs the research
Reserarch Methods Used
Chapter2:TheRealEstateDevelopmentProcess
MATTHEW MOORHEAD 17
Chapter2:TheRealEstateDevelopmentProcess
2.1Introduction Chapter one provided a brief introduction outlining the research objectives and
key areas of literature that will be reviewed as part of this thesis. The research
questions themselves derive from activities that are found within the overall
property development process. This process will be discussed from both the
perspective of the historical evolution of the guiding principles as well as a
modern practical application. The prevailing models and steps within the
property development process will be covered in detail in this chapter. The
property development industry in Australia will be discussed and the role of the
property developer will be reviewed before moving on to the specific stages and
decision‐making processes involved in determining if a property development
project should proceed.
2.2Propertydevelopmentdefined
The real estate development process categorically describes the sequences of
steps within a project. Throughout this research, the terms property
development (used primarily in Australia and the UK) and real estate
development (used in the United States) are used interchangeably. Property
development is widely accepted as the most important activity in the generation
of the urban environment (Gillen & Fisher, ; Morgan , ).
Early attempts to define property development were task‐oriented, as is outlined
by the Pilcher Report (HMSO, ):
Chapter2:TheRealEstateDevelopmentProcess
MATTHEW MOORHEAD 18
Development comprises the following tasks:
i. The perception and estimation of demand for new buildings of different
types;
ii. The identification and securing of sites on which buildings might be
constructed to meet that demand;
iii. The design of accommodation to meet the demand on the sites identified;
iv. The arrangement of short‐ and long‐term finance to fund site acquisition
and construction;
v. The management of design and construction; and
vi. The letting and management of the completed building.
(British Property Federation, Policy for Land, )
James Graskamp (Graaskamp, , p. ) described property development as
follows:
Being like a manufactured product, and a real estate project is part of a larger
physical system programmed to achieve long‐term objectives, but each real
estate project is also a small business enterprise of its own.
Byrne & Cadman ( , p ) adopted a wider interpretation of the term to mean
a process where property development organisations, corporately or on their
own, aim to ‘secure their social and economic objectives by the improvement of
land and the construction or refurbishment of buildings for occupation by
themselves or others’.
The development process is a methodology of project analysis and
implementation. The Urban Land Institute (ULI) defines real estate development
as follows:

Chapter2:TheRealEstateDevelopmentProcess
MATTHEW MOORHEAD 19
The process of preparing raw land so that it becomes suitable for the erection
of buildings; it generally involves clearing and grading land and installing
roads and utility services. (Miles et al., , p. )
Additionally, real estate development can be described as a process that brings
built space into fruition, starting with an idea and ending with tenants and
owners occupying space (Miles et al., ). These definitions are utilitarian in
nature and fall short of capturing fully the complex social, entrepreneurial and
financial linkages involved in the activity. Property development has become an
integral part of the fabric of modern society as the trend in nations is becoming
increasingly more urban (ADB, ), and the majority of the world population
( %) is now urbanised (U.N. DESA, ). Australia and New Zealand are
among the most urbanised (approaching %) nations on earth making the
property development role highly important to the well‐being of the population.
Wilkinson and Reed ( , p ) offer a distinctly more Australian perspective by
describing property development as a ‘product of a change of land use and/or a
new or altered building in a process that combines land, labour, materials and
finance’. This definition reflects the high dependence on obtaining planning
permissions in Australia for property development projects, by referring to the
value that can be created through a change of a site’s use.
A more recent perspective on property development was offered by Drane ( ,
p ) as follows:
The particular state of transition or change in the form of real estate into a
different state with an associated change in potential or real value. For

Chapter2:TheRealEstateDevelopmentProcess
MATTHEW MOORHEAD 20
example, the rezoning of land, development application, subdivision or
construction of a title property et cetera.
Drane ( ) also argued that property development is a value arbitrage in the
transition of land from one use to another. Arbitrage value occurs when there is
value to be obtained by the change of use or the completion of a development
project on the potential site through the land planning mechanisms. When the
value of the site is such that a change of use does not increase its value from the
current use then the arbitrage ends. Kohlhepp and Kohlhepp ( , p. )
describe property development as the ‘process of adding economic value to the
real estate enterprise through various stages of development’. Drane ( ),
Miles et al. ( ), Peiser & Frej ( ) and Wilkinson & Reed ( ) all refer to
the entrepreneurial aspect of property development, describing the act of
development as an idea that comes to fruition when consumers ‐ tenants or
occupants ‐ acquire and use bricks and mortar put in place by the development
team. Value is created by providing usable space over time with associated
services. Real estate developers take the risk of the project in anticipation of
receiving economic profit sufficient to justify risk‐taking behaviour (Kohlhepp &
Kohlhepp, ) Veteran property developer Clay Emery described property
development as ‘a very simple business. You find the opportunity, evaluate the
risk and returns, and then arrange the financing’ (Kohlhepp & Kohlhepp, ,
p. ).
For the purpose of this research, property development will be defined as
a sequence of steps that take a property development project from
inception through to construction and completion including the
management of the asset over its lifecycle in order to derive value and
achieve the objectives of the project.

Chapter2:TheRealEstateDevelopmentProcess
MATTHEW MOORHEAD 21
This section gave an overview of property development and discussed its
importance in an urban environment, and the next section will describe the
many roles that the property developer must assume in order to be able to create
successful projects.
2.3Theroleofthedeveloper
The role of the property developer may be viewed as central to a process of public
and private users, of capital markets and the development team with all
participants offering and seeking varying – and often competing – inputs and
outcomes. Figure . ‘The role of the developer’ illustrates this in more detail
with the relationship of the other stakeholders mediated through specified roles.
From the public perspective, property development occurs within a large and
complex framework of the legislative process at the local council, state and
Commonwealth levels. Local planning instruments and decision processes
ultimately determine what is permissible for a potential project, but there are
many concurring agencies at the state level including permissions regarding
roads and access, environmental concerns and the registration of titles to name
a few. Ultimately the public is seeking to maximise the benefit to society at large
through sound development practices by the use of developmental control.
The property developer interacts with broader society who become the users of
the end product in the form of owner’s and tenants. Users are looking for
affordable development that meets their needs. Additionally, property
developers interact with the capital markets in the form of raising debt and
equity to fund projects. Development projects and capital facilities have
traditionally been highly geared as measured by the loan to cost ratio (LCR) due
to the large amounts of capital required (Bryant, ). Providers of capital are

Chapter2:TheRealEstateDevelopmentProcess
MATTHEW MOORHEAD 22
seeking thoroughly researched investment opportunities with an attractive
risk/return ratio based on analysed gained during due diligence. When capital
providers tighten their lending requirements, this forms a key constraint on
development and housing supply further exacerbating housing affordability
issues (Bryant, ; Sharam et al., ).
Figure 2.3: The Developer’s many roles
Source: Miles & Berens, , p.
Chapter2:TheRealEstateDevelopmentProcess
MATTHEW MOORHEAD 23
The property developer also fills the role as project manager of an often large
team of professional consultants who need to work toward a common goal in
order to create and achieve the project’s objectives. All these roles co‐exist within
an entrepreneurial framework that actively seeks to take a risk in order to create
wealth and meet the financial goals of investors.
This section described the varying roles of the property developer in general
common, and the following section will break down this role into developer
types.
2.4Typesofpropertydevelopment
Property developers can range in form and scale from an entity run by a single
individual (sole‐trader) to large public companies and multi‐national
organisations (Reed & Sims, ). This wide range of activities can make it
difficult to identify property development organisations and often the activity is
context‐dependent (Coiacetto, ). This wide spectrum of organisations
creates challenges when attempting to place boundaries around the decision‐
making characteristics of various firms (Reed & Sims, ; Wilkinson & Reed,
).
The most common approach to creating a typology of property developers is the
basis of the predominant property type that is created in their projects. It is
generally accepted that property development organisations cannot be experts
across the broad range of property types and will usually specialise in one or two
product types (Kohlhepp & Kohlhepp, ). These can be broad‐based such as
residential and commercial, or more specific such as retirement living or
childcare centres. The primary classification of developers is by property type
including residential, commercial, industrial, retail, tourism/holiday, aged‐care,
Chapter2:TheRealEstateDevelopmentProcess
MATTHEW MOORHEAD 24
land developer, infrastructure developer, institutional developer and mixed‐use
or a hybrid of the above types (Peiser & Frej, ; Peiser & Hamilton, ;
Brueggerman & Fisher, ; Kohlhepp, ).
Just as there exists a variety of property types that property development
organisations can undertake, there are a number of other characteristics that can
be attributed to property development organisations in forming developer
typologies (Isaac et al., ; Ratcliffe et al., ). An overarching definition
describing the characteristics of property developers is difficult to establish, and
therefore, it becomes necessary to create developer types based on the following
attributes :
The type of property developed
Organisational/ownership structure
The tenure of the developed product
Geographic distribution and
The overall objective of the property development project
These characteristics may have a direct impact on the decision‐making processes
and be contingent on the type of project outcome sought.
A review of the relevant literature concerning property developer typologies
demonstrates a number of different bases being adopted for this classification.
Rowley et al. ( , p. ) classified residential property developers based on the
size of the end‐value in dollars of the typical development projects which they
undertake, which being:
Low value – less than AUD million ‐ The majority of development
organisations in Australia fall into this category

Chapter2:TheRealEstateDevelopmentProcess
MATTHEW MOORHEAD 25
Medium value – between AUD million and AUD million – small and
medium scale projects are undertaken, and typically each project is
treated on its own merits and must stand alone regarding viability;
High value – above AUD million – undertake large‐scale projects and
are often national or international in scale.
(Rowley et al., , p. )
Ruming ( ) listed three generally accepted developer types in Sydney,
Australia which included the following:
Small Local – conducted by small local firms that stay within a defined
area. This group is often family‐based and generally can be referred to as
‘mum‐and‐dad’ developers
Medium Local and Regional – operate on a larger scale but generally stay
within a local area. They are better financed and undertake many medium
density projects
Large Regional – developers who often complete the large‐scale
greenfield development on city fringes. This type is often publicly listed,
has access to large amounts of financial resources and is often national or
international in scale
(Ruming, , p. )
Developers can also be classified as being a trader developer or a speculative
developer (Morely, ; Reed & Sims, ; Wiegelmann, ; Wilkinson &
Reed, , Sharam et al., ).
After reviewing the literature in the prior section, a number of classifications of
developer typologies have been adopted and are described as follows:
Chapter2:TheRealEstateDevelopmentProcess
MATTHEW MOORHEAD 26
2.4.1Ownershipstructure–public,privateorhybriddevelopment
Public – a government organisation tasked with a specific objective to
create a property for a desired end‐use.
Private – privately held or a publicly listed company that exists for the
purpose of deriving value for shareholders.
Hybrid – a mixture of public and private ownership. Such companies will
have a private legal structure, but with the majority shareholder being a
government body. The company is often directed to undertake
development to increase a specific type of property, but also has the
objective of deriving an economic profit for the government shareholder
and also to drive social outcomes. Examples of hybrid developers include
Economic Development Queensland (EDQ) in Queensland, Lancorp in
Western Australia, Landcorp in Western Australia and Urban Growth in
New South Wales. The overarching purpose of these organisations is to
facilitate government plans for urban growth and housing supply targets
(Rowley et al., ).
2.4.2Speculativetraderversusinvestordevelopers
Most property development organisations can be described as either primarily
speculative‐trader or primarily investor orientated regarding the long‐term
tenure of the projects they create (Wilkinson & Reed, ). Due to capital
budgeting and a limited resource pool of capital comprised of both equity and
debt, many smaller property developers act as traders who sell the product they
develop as they are not in a position to hold over the medium and long‐term
(Reed & Sims, ). There are primarily two areas where profits can be derived
from real property assets, including capital gains and rental income (Rowland,
; Baum ). Rental income can be either cash‐flow based or include
imputed rent as an owner‐occupier.

Chapter2:TheRealEstateDevelopmentProcess
MATTHEW MOORHEAD 27
Speculative‐trader developers initiate projects to make a profit via a capital gain
from on‐selling the completed property at a price higher than their cost base
(Geltner et al., ). Generally, these projects are of a shorter time horizon (less
than three years) and do not cross multiple property cycles. Land‐banking and
large greenfield developments are an exception as these projects can span
decades. Blocks of developed land are released in stages to the market and may
span multiple cycles (Kohlehepp, ). Investor developers initiate projects in
order to hold the completed property as an investment and derive rental income
and long‐term capital appreciation (Fisher, ). The development may become
part of acquiring a larger portfolio of properties or for using the space as an
owner‐occupier. Rental income has an advantage over speculative capital‐gains
in reducing the volatility of income streams in the company’s accounts (Baum,
). The reduced volatility leads to an altered risk outlook for a project and
often would necessitate a different decision hurdle rate for project initiation
(Ling & Archer, ). For this reason, many developers will have both
speculative and investment motivations for completing a project, and they will
be referred to as hybrid developers in this research. A common example of a
hybrid development is creating a residential high‐rise to sell as a speculative
development while retaining the ground‐floor retail space as an investment. The
decision‐making processes of trader and investor developers will be investigated
in this research.
2.4.3Developmentmanagementversustraditionaldevelopment
The above descriptions of speculative‐trader and investment‐focused developers
are examples of traditional development where the organisation acquires land to
conduct a property development project. Development management is where an
individual or organisation that possesses knowledge of the development process
acts as a project manager or consultant for a third party. This form of

Chapter2:TheRealEstateDevelopmentProcess
MATTHEW MOORHEAD 28
development is on a fee for service basis and also has a significantly reduced risk
profile. Larger specialist management consultancy agencies often fill this role
and focus on taking a project from the initial conception phases through to
project planning (Wiegelmann, ). Development managers act as consultants
and usually assume the operational risk but do not bear the major financial
capital risk of the project, which is usually born by the client and/or land‐owner
as the primary contributor of equity and the borrower for the project (Gleibner
& Wiegelmann, ).
2.4.4Othercategoricaldevelopertypes
There exist other categories for developer typology that will be investigated
further through this research as an empirical survey. As stated above, there are
many motivations for undertaking property development and for engaging in
viability studies including public organisations and semi‐public/private
developers who have varying objectives and constraints guiding their
development activity. Additionally, other professions engage in viability studies
and the determination of a development project’s feasibility including property
valuers, funds managers and financial lending institutions (Coleman et al., ).
2.5ThePropertydevelopmentindustryinAustralia
Property development is a very important part of both the Australian & New
Zealand economies. The total development sector turnover is well over $
billion annually in Australia and contributes between seven to nine per cent of
GDP annually (ABS, ; Kelly, ), and the broader property market
contributes approximately $ billion AUD comprising thirteen per cent of
Australia’s GDP and employees . million people (PCA, ). Similarly, in
New Zealand the property industry contributes approximately $ billion NZD
comprising % of New Zealand GDP and employees , people, making the
property industry the fourth largest employer in New Zealand (NZPC, ).

Chapter2:TheRealEstateDevelopmentProcess
MATTHEW MOORHEAD 29
The Australian Bureau of Statistics (ABS) defines development as including
building construction, construction services, and property operators/real estate
services. According to the ABS in February . million Australians were
employed in the development industry, including approximately . per cent of
total employment (ABS, ). The Urban Development Institute of Australia
(UDIA) describes the industry ‘as a wide range of organisations and individuals
involved in developing and operating property to meet the housing, employment
and social needs of communities’ (UDIA , as cited by Newell , p. ).
Residential property development accounts for per cent of the Australian
development gross output and large publicly listed property development
companies account for approximately per cent of the sector turnover, vastly
different to public perception (Ernst & Young, , , ). This fact is
even more surprising in Australia where traditionally oligopolies dominate many
industries (Jenny, ; Coiacetto, ). The above section has described the
categories and type of property development. The next section will discuss the
historical and current evolution of the property development process.
2.6Thepropertydevelopmentprocess
There exists a property development process that property developers follow
that has been established in the literature. The historical concepts and evolution
of this process will be discussed before examining the modern application of
models that break away from the traditional sequencing of steps.
2.6.1Historicalconceptandevolutionofthedevelopmentprocess
Property development companies engage in a development process to manage a
property project over its life cycle (Wilkinson & Reed, ). A large number of
theoretical development process models have been proposed and have evolved
since the s and involve the requirement of multi‐dimensional decision
making and include, but are not limited to, the following: Brueggeman & Fisher

Chapter2:TheRealEstateDevelopmentProcess
MATTHEW MOORHEAD 30
( , ); Cadman & Topping ( ); Isaac et al., ( ); Kohlhepp ( );
Kohlhepp & Kohlhepp ( ); Long ( ); McMahan ( ); Miles et al.,
( ); Peca ( ); Peiser & Hamilton ( ); Preller & Costello ( );
Ratcliffe et al., ( ); Sims & Reed ( ); Wilkinson & Reed ( ); Woodson
( ); Wurtzebach et al., ( ); Zuckerman & Blevins ( ). A common link
among these theoretical models includes the use of a sequence of steps that take
a development project from conception through to construction and completion
including the management of the asset over its life‐cycle (Bulloch & Sullivan,
). However, in practice, to apply theoretical models in the industry,
specifically the financial aspects and technical requirements of construction; Ball
( ) asserts that development models tend to fall within the four main
traditions of property research including mainstream economics,
power/behavioural approaches, structure‐agency institutionalism and structure
and provision theories. And more recently Drane ( , p ) affirms this
mismatch in the literature offering that the ‘complexity and scope of such
phenomena would render such models as individualistic and prospective, and
limited by both a subjective/localised theoretical framework use’.
Notwithstanding the weaknesses and problems with existing models, the
underlying principles and theories that seek to explain the development process
have changed little over time and remain relevant today. Although many of the
development process models appear to be very simple, the underlying
development tasks are often rendered highly complex as a result of the
increasing size and cost of projects which can occur over a considerable time
horizon (Peiser & Frej, ). While easy to understand conceptually,
development process models can lead to confusion, frustration, duplicity, and
extraordinary risk‐taking as the stakeholders in the process have either limited
or minimal understanding of the process (Kohlhepp, ). Byrne ( )
observes all property development process models incorporate three main areas

Chapter2:TheRealEstateDevelopmentProcess
MATTHEW MOORHEAD 31
which are acquisition and permission, production and disposal. The first area of
acquisition and permission which encompasses the decision to proceed with a
project and make a site acquisition is the primary focus of this thesis.
Additionally, the end product of the property development process frequently
possesses unique characteristics which further increase the complexity of this
process (Havard & Platts, ). Graaskamp ( , p. ) also described the
development process, and each new potential project, as a creation of the
political process where society is given a new opportunity to ‘negotiate, debate
and consider the basic issues of an enterprise economy’. This aspect of real
property assets has led to the inclination to create a ‘one size fits all’ model which
tends to be heavily weighted towards a simple residential project. Havard and
Platts ( ) noted that the continuing trend towards city‐centre living lends
itself to breaking down barriers that have long existed between commercial and
residential developers, and also advocates the splitting of residential from
commercial sectors as well as categorising the commercial sector into
developer/traders and developer/investors. Developer/investors often develop
commercial, retail and/or industrial buildings which are then transferred into a
special purpose vehicle (SPV) legal structure where the asset is securitised and
managed over its life‐cycle. An example of this practice is the modern creation
of real estate investment trusts (REITs) by publicly listed property developers
such as Mirvac, Stockland and Goodman Group.
Drane ( & ) undertook a very detailed and comprehensive theoretical
evaluation of the evolution of the development process models from the s
to more recent times. Drane ( , p ) defined a property development model
as ‘a model which creates a theoretical concept of property development practice
that is able to be generalised’. Healey ( ) and Healey & McNamara ( ) are
two important studies that have shaped research in this area and chronicled the

Chapter2:TheRealEstateDevelopmentProcess
MATTHEW MOORHEAD 32
evolution of this process, evaluating the theoretical foundations of the
development process from to the early s. Healy ( ) outlined the key
early models and their theoretical bias from – describing the categories
as theoretical assumptions, economic processes, event sequence and agency, as
shown in Figure . .
Figure 2.6: Key theoretical basis of development process models
Source: Healey,
Drane ( ) analysed articles and books relating to models of the
development process and found different development models published
from to . However, the absence of many books and articles from
to draws attention to a transition of theoretical perspectives from neo‐
classical economics and Marxist views towards the political economy and
institutional analysis (Drane, ). It should be noted that these studies did not
include Miles and Wurtzebach ( ), Miles et al., ( ) or Grasskamp ( )
whose work occurred during this period and offer views central to any discussion
of the evolution of development process models. In more recent times there has

Chapter2:TheRealEstateDevelopmentProcess
MATTHEW MOORHEAD 33
been a resurgence of interest concerning the development process (Havard, ;
Kohlhepp & Kohlhepp, ).
It is no coincidence that the largest advances in the theory dealing with the
property development process and associated decision‐making have followed
periods of dramatic volatility and economic loss, largely caused by shocks to
capital markets, property and credit cycles (Havard ). A significant
difference, occurring during the late s to the early the s in the evolution
of the theory of property development models, was an emphasis on social issues
demonstrating an urban planning perspective.
The ’s capital market crash and the subsequent global recession have been
largely accredited to a lack of economic responsibility in both fiscal and
monetary policy by governments and blatant speculation by financial
institutions and the broader business sector (Kaminsky & Reinhart, ). The
aftermath gave rise to a greater public consciousness that the needs of society
must be considered alongside individual property rights. Coiocetto ( , p. )
argued that these views are most probably presented because of the ‘underlying
assumptions, of such models are sometimes characterised by a certain naiveté in
isolation from real‐life human machinations and maneuvering’. Coiocetto ( )
further explains that it would seem that the simulations are not always wholly
distinguished from reality in such models, and they deal with developer
behaviour without actually examining how and why they behave in such a way.
Kohlhepp ( , p. ) described the development process as ‘a complex, time‐
consuming, capital‐intensive, multi‐disciplinary, externality‐generating, public‐
private endeavour’.
In the case of the GFC, renewed interest in the development process is being led
by practitioners and academics who are primarily interested in improving the
accuracy of industry analysis, practices and the quantification and management
Chapter2:TheRealEstateDevelopmentProcess
MATTHEW MOORHEAD 34
of uncertainty and risk including the following studies: Adams et al., ;
Coiacetto, ; Costello & Preller, ; Drane, , ; Havard, ;
Kohlhepp, ; Kohlhepp & Kohlhepp .
2.7UrbanLandInstituteDevelopmentProcessModel
As previously stated most proposed models follow a sequence of stages through
the life‐cycle from the initial concept of the project through to the management
of the property. A popular model used in tertiary institutions to teach the
principles of property development is the Urban Land Institute’s Eight‐Stage
Model of Real Estate Development developed by Wurtzebach et al. as
illustrated in Figure . . . For the purposes of this research, the first four stages
of this model make up the pre‐commitment stages of the property development
process and form the research primary concern. The remaining four stages
usually occur after the negotiation and formal legal commitment to acquire a
property development site and form the first major requirement for large
amounts of capital in the project. The pre‐commitment stages of the
development process are the most important, as decisions made early in the
process usually have significant impacts on the overall project success or failure
(Uher & Toakley, ). Also, it is in the pre‐commitment stages of the
development process where ‘the greatest degree of uncertainty about the future
is encountered’ (Uher & Toakley, , p. )
StageI:inceptionofanidea
The development process typically begins with a developer searching for a need
or a market gap to fill. From the utilisation of current market data and extensive
background knowledge, many ideas will be generated. Various possibilities will
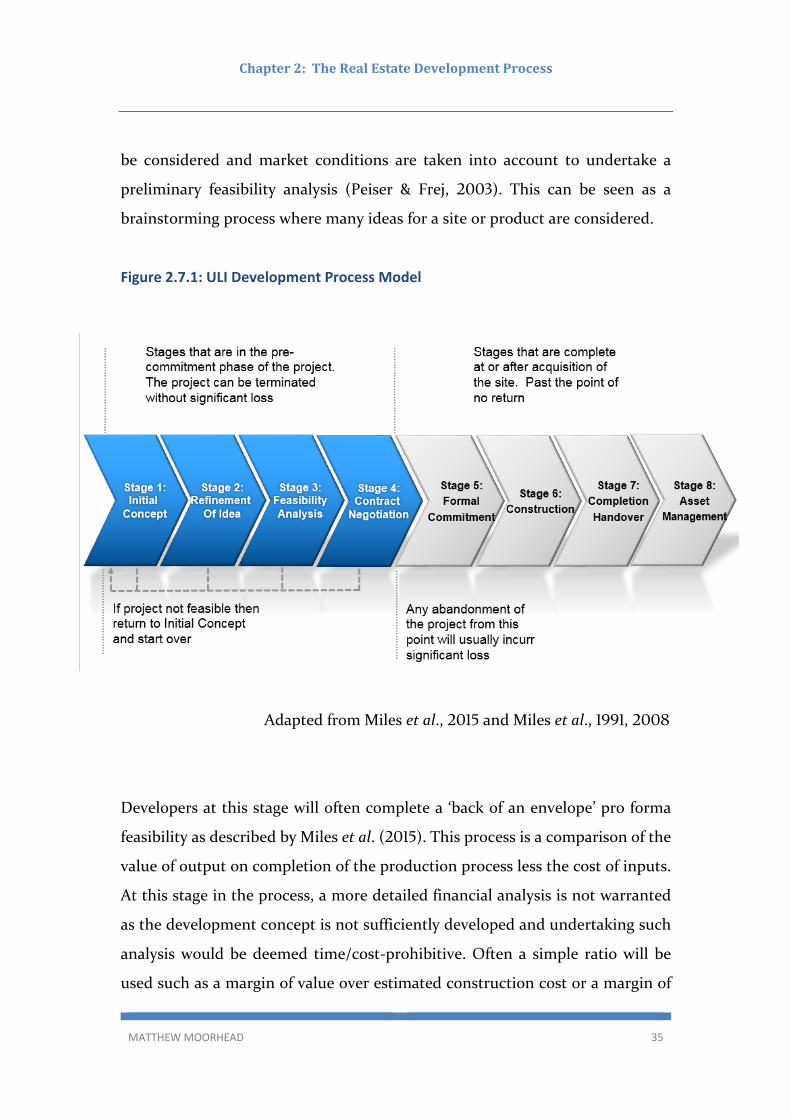
Chapter2:TheRealEstateDevelopmentProcess
MATTHEW MOORHEAD 35
be considered and market conditions are taken into account to undertake a
preliminary feasibility analysis (Peiser & Frej, ). This can be seen as a
brainstorming process where many ideas for a site or product are considered.
Figure 2.7.1: ULI Development Process Model
Adapted from Miles et al., and Miles et al., ,
Developers at this stage will often complete a ‘back of an envelope’ pro forma
feasibility as described by Miles et al. ( ). This process is a comparison of the
value of output on completion of the production process less the cost of inputs.
At this stage in the process, a more detailed financial analysis is not warranted
as the development concept is not sufficiently developed and undertaking such
analysis would be deemed time/cost‐prohibitive. Often a simple ratio will be
used such as a margin of value over estimated construction cost or a margin of
Chapter2:TheRealEstateDevelopmentProcess
MATTHEW MOORHEAD 36
value over rough anticipated costs. If the end value exceeds the cost of inputs
by an acceptable margin, the idea survives, and, if the margin of value is not seen
as acceptably high, then the concept is discarded (Byrne, ; Havard, ).
Most ideas are found to be unacceptable at this stage of the process, with this
step serving as a filtering process during which most ideas terminate with a ‘no‐
go’ decision.
Stage2:RefinementoftheDevelopmentProject
Ideas that survive an initial ‘back of envelope’ feasibility which has not been
deemed a ‘no‐go’ decision and show promising market potential are further
examined in the refinement stage of the process. This stage generally includes
the following activities:
A more detailed scanning of the environment in relation to the shortlisted
ideas,
An analysis of competitors,
An analysis of market comparables,
Compiling a list of suitable sites,
Examining a shortlist of possible market products,
Investigate planning permissions to determine what can be built and
included in initial design feasibility.
This stage of the development process may also involve:
Preliminary negotiations with vendors of potential sites.
Completion of a market disaggregation and product differentiation
concept.
Continuing refinement of the financial feasibility by periodically retesting
the back of the envelope numbers and preliminary projections of the
timing of cash flows for the development period.

Chapter2:TheRealEstateDevelopmentProcess
MATTHEW MOORHEAD 37
Review financing criteria and investigate initial financing options.
An initial risk identification and measurement exercise to test the design
or project’s preliminary feasibility discussions with professional advisors
including engineers, architects, town planners, quantity surveyors,
builders, real estate agents and possibly a preliminary meeting with
financiers concerning a project’s design and fit in the prospective tenant
market (Miles et al., ).
Another key objective is the translation of all gathered information into a
framework that highlights potential risks and rewards in relation to the
developer’s objectives. The concept of refining the idea may imply simplicity, but
it is essential that the developer’s ideas evolve towards a particular project design
and on a specific site or the idea be will be abandoned before too many resources
are expended on the project. ‘Finding and acquiring a site and making an initial
determination of legal and physical feasibility are the primary tasks in stage two’
(Miles et al., , p. ).
In the refinement of the idea stage, the developer must be convinced of the
project ’s viability. It is necessary that the developer has a degree of confidence
at this stage in order to make the commitment of resources that are now required.
The number of potential projects or development options that can be analysed
is endless. It is therefore important in the refinement of the idea stage to weed
out those ideas that do not warrant expending time and capital in completing a
full feasibility analysis in stage three of the development process. Feasibility
analysis for a development project can take place in a time frame of weeks to
months and range in cost from a few thousand dollars to millions of dollars. A
development organisation will use the ‘refinement of the idea’ stage of the
development process to select those ideas and development options which
warrant expending their limited amount of capital (Peiser & Hamilton, ).

Chapter2:TheRealEstateDevelopmentProcess
MATTHEW MOORHEAD 38
Figure 2.7.2: Step two‐refinement of the Idea
Source: adapted from Miles et al.,
Figure . adapted from Miles et al. ( ) outlines the activities involved in the
‘refinement of the idea’ stage of the development process and how they work
towards a specific go/no‐go decision point.
Stage3:FeasibilityAnalysis
The primary task in the feasibility analysis stage of the development process is
to demonstrate the viability of the project to all the vested stakeholders (Miles

Chapter2:TheRealEstateDevelopmentProcess
MATTHEW MOORHEAD 39
et al., ). This is done by producing a sound market analysis that culminates
in a projection of net operating income for the subject development project over
the relevant time frame. A market analysis is ‘a process for examining the
demand for and supply of a particular property type and the geographic market
area for that property type. This process is generally referred to in industry as a
‘use in search of a site’ (Reed, , p. ). It is at this stage that the developer
is required to commit additional capital to the project and perform a more
detailed analysis utilising several dimensions. Additionally, the developer will
experience the first ‘hurt money’ into the project. Hurt money, is an industry
term for sunk costs, and includes capital that is then expended on a project that
cannot be recouped unless the project proceeds. In the prior preliminary and
refinement of the idea stages of the development process, only minor
expenditure has been incurred on design and consultant’s reports, which enables
the project to be abandoned with little consequence. The feasibility analysis
stage of the development process marks a transition between little serious
investment at risk to a serious financial commitment.
Graaskamp ( , p. ) described a project as feasibility as follows:
A project being feasible when the real estate analyst determines that there is a
reasonable likelihood of satisfying explicit objectives when a selected course of
action is tested for fit to a context of specific constraints and limited resources.
A feasibility study is an investigation into the practicability of a project. Viability
is the determination that a development project is practicable from an economic
standpoint (Bryne et al., ). The purpose of feasibility analysis is to determine
that a project is viable financially and the risks have been mitigated to the point
that a project should be undertaken, given the assumptions made on the input
variables. Graaskamp also referred to a ‘reasonable likelihood’ as a
Chapter2:TheRealEstateDevelopmentProcess
MATTHEW MOORHEAD 40
demonstration of the high level of uncertainty that is, in many cases inherent in
forecasting. The timeframe from the feasibility study to the completion of the
project is, in many cases, over a number of years. A project with a highly
profitable forecast may still end up losing money if there is a dramatic shift in
the underlying assumptions (Coleman et al., ). Feasibility is also determined
by satisfying other explicit objectives that must be defined before initiating the
study. The selected course of action is tested for fit into a context of specific
constraints, which include all the legal and physical limitations. It is not simply
a question of whether or not an idea might work, but rather it is a question
whether a particular plan for turning an idea into a physical building is likely to
work within a specific time frame given while also satisfying all other project
constraints (Miles et al., ).
A development appraisal is a report that includes a financial analysis and also
contain additional elements including an executive summary, market study,
preliminary drivers, cost estimates, information about financing, planning
permissions, an estimate of value and an analysis of project risk (Havard, ;
Miles et al., ; Peiser & Frej, ). The following critical and analytical
issues should be considered when completing a feasibility study:
. The idea and market for the project, from the concept down to a specific
absorption schedule, then the particular market niche under current
conditions:
a. national, regional and local market outlook
b. demographic attributes of the target market
c. sales and rental comparables
d. market segmentation including the identification of key
marketability traits
e. evaluation of existing supply, and known competing proposals

Chapter2:TheRealEstateDevelopmentProcess
MATTHEW MOORHEAD 41
. Compilation and analysis
a. incorporate the assumptions into a discount cash flow model
b. perform sensitivity and/or scenario analysis
c. review risks and optimal configuration
d. confirm that the project is feasible
A detailed feasibility study or development appraisal will then often be compiled
into a report and ultimately make a recommendation as to whether the project
should proceed or not given the specific financial metrics and hurdle rates
chosen in order to make a decision. The use of the term hurdle rates implies that
there is a minimum accepted profit or return that the development project is
deemed likely to meet or exceed, given the level of risk implied within the project
(Ross et al., ). A hurdle rate can also be described as the minimum expected
rate of return an investment must return in order to be considered attractive, or
‘the risk‐adjusted return must clear the required hurdle rate benchmark for
further resources to be committed to the project’ (Kierulff, , p. ). Hurdle
rate selection and the application of feasibility analysis to the viability of specific
development projects will be discussed further in Chapter .
The development appraisal report will compile the key information concerning
the proposed project/site and generally will include the following items:
Executive Summary
Maps of the site including political and an aerial photograph
Photographs of the site from the ground and street perspective
Renderings of possible design solutions
Market study outlining both area demographics, demand and supply
attributes.
Financial analysis of the proposed development options
Monthly cashflow of proposed development options

Chapter2:TheRealEstateDevelopmentProcess
MATTHEW MOORHEAD 42
Development program or timeline outlining key milestones
Recommendation regarding proposed development options
(Miles et al., , p. )
Stages4and5:ContractNegotiationandFormalCommitment
Throughout Stage , contracts are being developed to implement the decision
to proceed; during Stage , the contracts are executed. In Stage the developer
will often seek a memorandum of understanding (MOU) or a contract subject to
due diligence (DD) (Miles et al., ). The due diligence period allows for the
completion of the Stage feasibility analysis while removing the site from the
market. A contract with a due diligence clause can be compared to having a call
option over the site, giving the developer the right but not the obligation to
purchase the site at a particular point in time and a particular price. A
memorandum of understanding has a similar effect but, since formal contracts
have not been agreed upon, it allows for the negotiation of terms to continue. In
Stage a formal commitment of an unconditional contract is entered into and
the transfer of ownership of the site is settled (Isaac et al., ).
It is at this point that the pre‐commitment stages of the development process
are at an end. If the project is found to be unfeasible at any point prior to the
formal commitment then the project is terminated. If a formal commitment to
proceed has been made then the development project has gone past the point of
no return. If the project is later found to be unfeasible or if the project is
abandoned from this point forward, significant costs will be incurred including
acquisition costs plus initial design consultant costs. Any attempt to back out of
the purchase of the site will incur damages and/or the vendor suing for specific
performance (Havard, ). Byrne ( ) described this as one of the first
Chapter2:TheRealEstateDevelopmentProcess
MATTHEW MOORHEAD 43
major points of committing capital, which acts throughout the development
process ‘like a snowball’ by accumulating interest.
Byrne ( , ) demonstrated that all development process models could be
divided into three parts which include acquisition, production and disposal. This
distinction can be seen within publicly listed development companies using
structural separation within their organisations of the three parts of the
development process: acquisition, development management and asset
management. In the pre‐commitment stages, acquisition managers are
responsible for the initial ideas, refinement of the ideas, feasibility analysis and
contract negotiation up to the formal commitment. After a formal commitment
has been made the project is handed over to a development manager who will
then proceed through the permissions, construction, and handover to the client
or possibly in‐house asset management (Guy & Henneberry, ). This
research is bounded by those decisions falling within the pre‐commitment or
acquisition stages of the development process, and the remaining stages are not
analysed further.
Stage6:Construction
Stage of the ULI development process involves the physical preparation of the
land through civil construction and, if required, the constructing of
substructures and superstructures which form the object of the development
project. The construction of the project is the first post‐commitment stage of the
development process, and abandoning the project from this point will have
substantial financial consequences (Miles et al., ). This stage differs from
the previous stages in that the effect of time compounds on multiple
uncertainties which may have a crucial impact on the financial outcome of the
project (Byrne, ). Any cost increase will have a compounding negative effect,
due to the interest cost of debt capital, on the project’s profitability as the time
value of money takes effect. Additionally, the developer’s understanding of the

Chapter2:TheRealEstateDevelopmentProcess
MATTHEW MOORHEAD 44
project composition begins to increase while the uncertainty regarding the
outcomes of the project increases. During this stage the flexibility for change
within the project is reduced, limiting the opportunity to respond to any changes
in market forces.
The highest area of uncertainty during the construction stage concerns the cost
of construction and possible cost blowouts due to unforeseen problems project
(Byrne, ). This stage also marks the second major phase of capital
commitment, after site acquisition, and often constitutes – per cent of the
total development cost (TDC). Another important factor for consideration at
this stage is the procurement method chosen for construction (Havard, ). A
further important consideration is whether the developer is also the
construction contractor. Many development organisations are also construction
contractors, and many construction organisations will engage in property
development, but it should be noted that they serve different roles. It is generally
recognised that if the development project is only feasible after adding in the
construction profit, then the project should not proceed. ‘Many projects
undertaken by developers to keep their contracting arms busy have led those
developers to bankruptcy’ (Peiser & Hamilton, , p. ). The rationale
behind this view derives from when the developer organisation is also the
construction contractor leading to the absorption of the construction risk as well
as the development risk. Developing organisations are often willing to take on
this added risk as they perceive the benefits of greater control and flexibility in
the construction process and the possibility of lower construction costs to be
worthwhile. It should be noted that many development project financiers
require an independent construction contractor whereby the financier can take
control of the construction contract via an agreement in case of default by the
developer (Hedgcock & Lynn, ). In an Australian context, the agreement is
generally referred to as a tri‐partite agreement and is routinely required by

Chapter2:TheRealEstateDevelopmentProcess
MATTHEW MOORHEAD 45
commercial lenders. Procurement methods which including tendering for a
fixed price contract and ‘design and construct’ methods give greater certainty
and reduce the overall risk of the development project (Azhar, ).
Stage7:CompletionandFormalOpening
After the construction is complete the developer will need to obtain the relevant
authority certification in order to allow for occupation. For example, in
Queensland this process includes certification of occupation, sealing of the plans
and certification of titles in order to be allowed to occupy or settle the new
property. Many planning authorities require inspections to ascertain that the
civil construction and newly constructed buildings meet the relevant building
codes, the approved development approval and are generally safe for members
of the public to use. In many development projects it is also a requirement that
concurring agencies sign off on the completed project these may include the
following:
. Obtaining Fire Authority sign off.
. Lodging applications for easements required for services and site access
for neighbouring properties.
. Sealing of the plans by the relevant local council.
. Environmental Planning Authority signing off on any relevant
development approval conditions as a concurring agency.
. Department of Main Roads signing off on any relevant development
approval conditions as a concurring agency.
. Lodgement of an application for registration of titles with the relevant
state’s authority. Department of Natural Resources, Mines and Energy
(DRNME) in Queensland for example.
. Setting up of the body corporate or community management.
. Other lesser approvals from state or council‐based authorities.

Chapter2:TheRealEstateDevelopmentProcess
MATTHEW MOORHEAD 46
Other activities in this stage include education of key personnel, connecting
services, commencing on‐site operations, finalisation of the project marketing,
formal handover, and the re‐financing from a construction debt facility to a
traditional commercial lending facility collectively constitutes stage (Miles et
al., ).
Stage8:Property,Asset,andPortfolioManagement
Stage is primarily concerned with managing the newly created property asset
over its life‐cycle. The formal development process then ends with the handover
of the new buildings/project in Stage . When the asset is sold and a property
manager and/or owner assumes responsibility for the asset, the developer often
has no further involvement in the project. This process raises an important
aspect of development project decision‐making (Ratcliffe et al., ). Do
property developers view the development process as ending upon selling and
handover of the asset? If so, will they create a project that addresses the many
long‐term considerations and needs of the building's life‐cycle? Areas of concern
include energy efficiency, alternative use, upkeep of landscaping and general
maintenance (Häkkinen & Belloni, ).
The property development process invariably results in an idea or concept being
transformed into a new physical asset. Once the construction is completed and
the project formally handed over then the responsibility for that project will
often end up the responsibility of the management components which includes
property management, asset managers and portfolio managers (Miles et al.,
).
The property management team is then responsible for the realisation of the
investment potential, imputed value to the owner and the physical asset

Chapter2:TheRealEstateDevelopmentProcess
MATTHEW MOORHEAD 47
condition to allow the long‐term value of the asset to be realised. Property
management is concerned with managing the day‐to‐day operation of the asset
including letting to tenants if needed and collection of rent and payment of
property expenses (Peiser & Frej, ). The property manager executes the
tactical objectives of the assets strategic plan as determined by the asset manager
(Peiser & Frej, ). Across all types of property investments, including
residential, commercial office, retail and industrial, larger properties will often
have a dedicated property manager on site. Smaller property assets often will be
aggregated and share a property management team.
The asset manager is often a step higher within the management hierarchy and
is concerned with a number of property assets within a property portfolio. ‘Asset
management monitors performance of property management and provides clear
guidance to allow the teams to develop strategic plans that will maximize (sic)
the asset’s values in the context of portfolio management’s objectives and capital
resources and the constraints presented by market conditions’ (Miles et al., ,
p. ). The asset manager is responsible for determining and executing the
strategic plan of the property assets within a portfolio. Asset managers are also
responsible for fulfilling the owner/investors objectives of maximising the profit
of the asset (Miles et al., ). Additionally, it is essential to have an awareness
of the market and the property cycle to judge the optimal times for acquisition
or refurbishment, holding period and disposal of the asset.
2.8Recentdevelopmentprocessmodelperspectives
A very important step in the evolution of the theory of the real estate
development process includes the Kohlhepp and Kohlhepp’s ( ) Real Estate
Development Matrix Model. First introduced in a working paper in
(Kohlhepp, ) a textbook further developing this model was published in
Chapter2:TheRealEstateDevelopmentProcess
MATTHEW MOORHEAD 48
. This section gives an overview of the unique contribution of the Real
Estate Development Matrix model to the theory concerning property
development.
Building on the work of Graaskamp (Graaskamp, , ), Miles, Berens &
Weiss ( , , ) and Miles et al. ( , ) describing a mainly linear
form of the property development process, Kohlhepp and Kohlhepp’s Real Estate
Development Matrix (REDM) adds the elements of property development tasks
and property development types in a three dimensional matrix. ‘It is a
combination of the seven stages of the real estate development process across
the horizontal axis with the eight task categories of development on the vertical
axis, thus creating the ‐cell matrix’ (Kohlhepp & Kohlhepp, , p. ). Table
. outlines a two‐dimensional matrix table showing development stages and
key development tasks.
The REDM model of the real estate development process focusses on the possible
exit strategies that exist within a typical project and requires a decision at each
stage on whether to proceed or sell the project. At each progressive stage, the
following conditions are likely to occur:
Risk and uncertainty diminish;
Additional capital is required;
Additional capital has a lower cost;
Value is created by producing a new product;
Value is created by incurring additional risks and increasing capital
exposure (Kohlhepp & Kohlhepp, , p. ).
It is anticipated that the above conditions would be accepted by professionals
working within the property development industry in Australia, though beyond

Chapter2:TheRealEstateDevelopmentProcess
MATTHEW MOORHEAD 49
the scope of this thesis, this is an area for further research. Many property
developers will focus the majority of their projects within specific stages of the
process such as land banking (Kohlhepp, ). Land banking can be defined as
“the process of acquiring and holding undeveloped or “raw” land that becomes
increasingly attractive for future development because of general and broad
market trends” (Kohlhepp & Kohlhepp, , p ).
Table 2.8 Two‐Dimensional Real Estate Development Matrix (REDM)
Source: Kohlhepp & Kohlhepp, , p.
Kohlhepp & Kohlhepp ( ) also outline three questions that a developer must
answer at each stage before advancing to the next and include the following:
Can we do what has to be done in the next stage? Do we have the skills,
resources, time, team, support and market knowledge? Can we handle
the risk of failure? (Kohlhepp & Kohlhepp, , p. )
If the property developer is not able to answer ‘yes’ to each of the above questions
in sequence, then the possibility of disposal of the project to a developer who
Development Matrix
1. Land
Banking
2. Land
Packaging3. Land
Development
4. Building
Development
5. Building
Operations
6.Building
Renovations7. Property Re‐
development
I. Acquisition I. 1. I. 2. I. 3. I. 4. I. 5. I. 6. I. 7.
II. Financing II. 1. II. 2. II. 3. II. 4. II. 5. II. 6. II. 7.
III. Market Analysis & Strategies III. 1. III. 2. III. 3. III. 4. III. 5. III. 6. III. 7.
IV. Environmental Analysis IV. 1. IV. 2. IV. 3. IV. 4. IV. 5. IV. 6. IV. 7.
V. Approvals & Permits V. 1. V. 2. V. 3. V. 4. V. 5. V. 6. V. 7.
VI. Physical Improvements VI. 1. VI. 2. VI. 3. VI. 4. VI. 5. VI. 6. VI. 7.
VII. Transportation/Accessibility VII. 1. VII. 2. VII. 3. VII. 4. VII. 5. VII. 6. VII. 7.
VIII. Sales & Disposition VIII. 1. VIII. 2. VIII. 3. VIII. 4. VIII. 5. VIII. 6. VIII. 7.

Chapter2:TheRealEstateDevelopmentProcess
MATTHEW MOORHEAD 50
has the resources, expertise and ability to advance the project should be
considered.
2.10Summary
Within the framework of this research thesis, the current chapter outlined and
described a number of development process models that illustrate the process
used by real estate development firms in order to bring a development project
from initial concept and obtaining permissions through to completion, handover
and the managing of the asset over its lifecycle. Additionally, property developer
typologies were identified and defined; types of property development projects
commonly undertaken were outlined; an overview of the Australian property
development industry given; and finally, an original definition of property
development was provided. The next chapter will focus on examining the
feasibility analysis stage of the development process and review how developers
make decisions on whether to proceed or not proceed with a development
project.

Chapter3:DecisionMakingandDeterminingViabilityinDevelopmentProjects
MATTHEW MOORHEAD 51
Chapter3:DecisionMakingandDeterminingViabilityinDevelopmentProjects
3.1Introduction
Chapter provided an overview of the recent history and evolution of the
property development process. The present chapter will be devoted to an
examination of the literature concerning feasibility analysis and the decision‐
making processes used in property development projects, both conceptually and
as a practical tool of analysis. More specifically, the techniques and decision tools
involved in the pre‐commitment stages of property development projects will be
emphasised.
3.2Feasibilityanalysisinthedevelopmentprocess
The term feasibility analysis is often used in the real estate development industry
generically to describe a report analysing the viability of a development project
which can be more accurately described as a development appraisal (Havard,
, p. ). It should also be understood that feasibility analysis may not always
be in the form of a written report and many property developers take a more
informal approach. A market study and a financial feasibility study together form
the basis of a feasibility analysis for a given project. In this thesis, the terms
feasibility analysis and development appraisal will be used interchangeably and
both refer to the process of completing a financial feasibility study as a basis for
decision‐making on whether to proceed with a property development project.
Ultimately, a feasibility analysis is concerned with making a determination of a
development project’s viability (Havard, , p. ). Throughout this thesis, the

Chapter3:DecisionMakingandDeterminingViabilityinDevelopmentProjects
MATTHEW MOORHEAD 52
term project viability refers to the outcome of a feasibility analysis forecasting
whether a potential development project is anticipated to meet or exceed the
required hurdle rates, and therefore, warrants further investigation (Havard,
). It should also be noted that project feasibility is a common term that is
used in the literature with the same meaning at project viability. (See Grasskamp
( ) for example).
As stated in Chapter , a market analysis is a ‘process where the demand for and
supply of a particular property type is examined in a geographic market area’
(Reed, , p. ). This process is sometimes referred to as a ‘use in search of
a site’ (Miles et al., ). Whereas a marketability analysis can be described as a
process where the analyst ‘investigates how a particular piece of property will be
absorbed, sold, or leased under current or anticipated market conditions’ (Reed,
, p. ).
According to Kolbe et al. ( ), when considering a potential development
project, ‘the study addresses the question of whether the relationship between
development costs and market acceptance will enable the developer to meet
minimum acceptable investment targets’ (Kolbe et al., , p. ). Technically,
the feasibility analysis section incorporates a financial analysis of variables to
determine if a project meets the required economic hurdle rates, as well as an
examination of risk for that project. A development appraisal encompasses far
more than a financial feasibility analysis and also requires compiling information
across many market considerations including site characteristics, market
analysis, planning schemes, design elements, legal challenges, cost variables,
income forecasting, project timelines and risk management principles including
mitigating strategies (Miles et al., ).

Chapter3:DecisionMakingandDeterminingViabilityinDevelopmentProjects
MATTHEW MOORHEAD 53
At this point, it is important to distinguish between the many terms used
generically in the industry for feasibility analysis and development appraisal. A
development appraisal carried out on a potential development project is
concerned with finding the value of the finished property asset and the highest
and best use, which is the use that represents the greatest economic financial
value (Messner, ). By the very nature of the definition, the practice has been
created by the valuation profession out of the need to find a project’s value or
worth as a requirement of obtaining funding. Kolbe et al. ( , p. ) described
the valuer’s or appraiser’s perspective as the following:
Identifying a set of alternatives thought to be nominally feasible: uses that
offer of a reasonable probability of meeting prevailing financial performance
standards. From this set of feasible alternatives, the analyst seeks to identify
one specific use that supports the greatest value indication for the property
(the highest and best use).
The term feasibility analysis, more often than not, refers to the perspective of the
one planning to undertake the potential project, i.e. the developer or investor.
The process is similar, but each profession will approach the process from the
perspective of the key question they are seeking to answer. To the valuer, the
question is what the property is worth now and what is it worth upon completion.
For the property developer it is will this potential project be profitable, and if so
by how much and is it worth pursuing? Regardless of the professional
perspective for which a project is approached, in order for a project to be deemed
feasible, there exists the necessity to be feasible physically, legally and financially
as shown in Figure . (Kolbe et al., ).
The ultimate result of the analysis should not just be the finding of a project
being merely feasible, nor that its end value exceeds the cost by the required
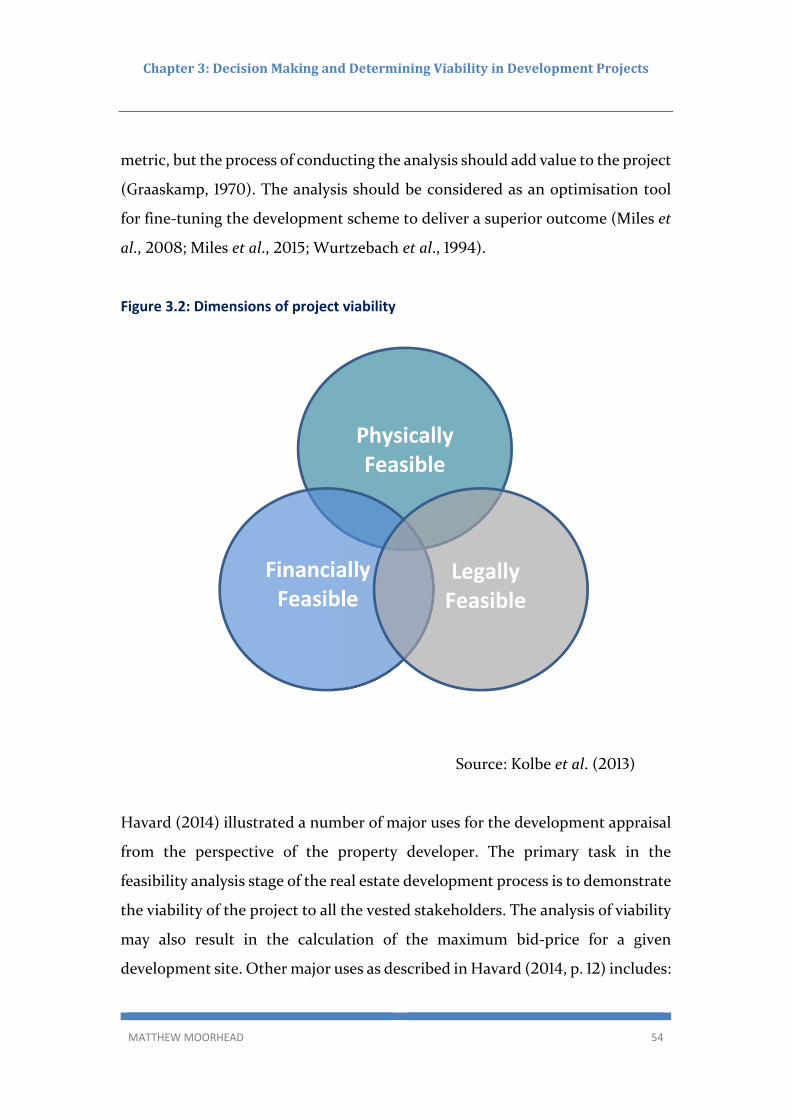
Chapter3:DecisionMakingandDeterminingViabilityinDevelopmentProjects
MATTHEW MOORHEAD 54
metric, but the process of conducting the analysis should add value to the project
(Graaskamp, ). The analysis should be considered as an optimisation tool
for fine‐tuning the development scheme to deliver a superior outcome (Miles et
al., ; Miles et al., ; Wurtzebach et al., ).
Figure 3.2: Dimensions of project viability
Source: Kolbe et al. ( )
Havard ( ) illustrated a number of major uses for the development appraisal
from the perspective of the property developer. The primary task in the
feasibility analysis stage of the real estate development process is to demonstrate
the viability of the project to all the vested stakeholders. The analysis of viability
may also result in the calculation of the maximum bid‐price for a given
development site. Other major uses as described in Havard ( , p. ) includes:
Physically Feasible
FinanciallyFeasible
Legally Feasible
Chapter3:DecisionMakingandDeterminingViabilityinDevelopmentProjects
MATTHEW MOORHEAD 55
Determination of a potential development scheme’s forecasted profit or loss in
order to determine viability, the impact of a range of variations on a project, to
test the veracity of the assumptions, as a measurement of risk, and as a tool
for raising capital in both debt and equity forms.
A development appraisal is created by producing a sound market analysis that
culminates in a projection of net operating income for the subject property over
a specific time‐frame (Phyrr & Cooper, ). It is at this stage that the property
developer is required to commit additional capital to the project and perform a
detailed analysis examining the specific timing of expenditure and revenue as
well as key debt and equity contributions. Additionally, the developer will
experience the first ‘hurt money’ involved in the project. Hurt money is capital
expended on a project that cannot be recouped unless the project proceeds. In
the prior preliminary stages of the development process, only minor expenditure
has been incurred on design and consultants’ reports, which enables the project
to be abandoned with little consequence (Kahr & Thomsett, ).
3.3Historyandevolution
Feasibility analysis for property investment/development‐based projects first
began to take its modern shape through the evolution of cost‐benefit analysis
(CBA) being applied to the Urban Renewal movement of the s in the USA
and UK (Baldwin, ; Messner, , ; Prest & Turvey, ). The
principles of CBA were also alluded to in deciding between a ‘moral or prudential
algebra’ in Benjamin Franklin’s letters to Joseph Preistley, who was an English
political theorist and minister, in and just prior to the decision to declare
independence for the American colonies (Franklin, ). CBA was more
formally developed by Jules Dupuit and officially published by Alfred Marshall
in (Wiener, ). Cost‐benefit analysis can be defined as a systematic

Chapter3:DecisionMakingandDeterminingViabilityinDevelopmentProjects
MATTHEW MOORHEAD 56
approach to ‘estimating the strengths and weaknesses of alternatives, and it is
used to determine options that provide the best approach to achieve benefits
while preserving savings’ (Mishan & Quah, , p. ). Modern‐day feasibility
analysis has partially evolved from this analytical body of work, although it has
been adapted to determine the highest achieving development scheme among a
number of development options (Pagourtzi et al., ).
The application of modern quantitative feasibility analysis to development
projects, including the use of DCF methodologies in the pre‐commitment stages
of the development process, was advanced by James Graaskamp, who described
project feasibility or viability as follows:
Being feasible when the real estate analyst determines that there is a
reasonable likelihood of satisfying explicit objectives when a selected course of
action is tested for fit to a context of specific constraints and limited resources.
(Graaskamp, , p. )
The purpose of the feasibility analysis is to determine that a project is feasible
financially and the risks have been mitigated to the point that a project should
be undertaken (Graaskamp, ). Graaskamp also referred to a reasonable
likelihood as a demonstration of the high level of uncertainty that is, in many
cases, inherent in forecasting. The timeframe from the feasibility study to the
completion of the project is in many cases completed over several years
(Graaskamp, , ). A project with a high degree of forecasted profit may
still end up losing money if there is a dramatic shift in the underlying
assumptions from which the forecast was made (Coleman et al., ).
Therefore, a project that has been deemed feasible does not give certainty as to
the outcome but is reflective of a reasonable weighing of the most probable
outcome given the assumptions of input variables. Additionally, for a project to

Chapter3:DecisionMakingandDeterminingViabilityinDevelopmentProjects
MATTHEW MOORHEAD 57
be considered feasible, it must be feasible within the limits of the resources, both
in terms of financial and human capital, that a development organisation is
willing or able to commit within a given timeframe (Peiser & Frej, ).
Feasibility is also determined by satisfying explicit objectives that must be
defined before initiating the study (Geltner et al., ). The selected course of
action is tested for fit into a context of specific constraints, which include all the
legal and physical limitations. It is not simply a question of whether or not an
idea might work, but rather it is a question whether a particular plan for turning
an idea into a physical asset is likely to work within a specific time frame (Miles
et al., ). The primary objective of undertaking feasibility analysis on a given
project is to answer the question, ‘Will the development scheme work?’ or ‘Is the
development scheme likely to meet the development objectives?’, and determine
the degree of confidence the property developer has in going forward (Kolbe et
al., ).
3.4Decisionmakingforpropertydevelopmentprojects
At this point, it is advantageous to review the decision‐making processes
involved in the property development process before further investigating the
mechanics of conducting a feasibility study. Decision theory is the ‘study of how
people model ‘judgement’ and, from that, how they determine their choice’
(Atherton et al., , p. ). These may be probability‐based models, loss
function models or other forms of statistical representations of judgements
(French, ). Decision‐making within the concept of property development
bears similarity to the literature on decision‐making for investment purposes
whereby the investor commits resources in anticipation of receiving future
income streams (Bazerman & Moore, ). From a property‐specific context,
decision theory is an attempt to provide a framework by which investors are able

Chapter3:DecisionMakingandDeterminingViabilityinDevelopmentProjects
MATTHEW MOORHEAD 58
to make a decision that maximises their wealth (Hargitay & Yu, , ; Paul
et al., ).
Though there is evidence that many decision‐makers in the property
development industry do not strictly follow models based on observations in
industry practice, it is important to understand the theoretical basis for decision‐
making models (Crosby et al., b). A review of the literature has found that
firms often divert away from a theoretical established model to make decisions
in another manner (Atherton et al., ; Arnold & Hatzopoulos, ; Geltner,
; Baldwin and Clark, ; Investment Property Forum, ). In their
pioneering work on decision models Tversky, Bell and Raiffa ( ) described
three primary decision‐making interactions which can be classified as
descriptive, normative and prescriptive. Atherton et al. ( ) described their
application in a property development context below:
. Descriptive analysis: models which purport to describe how we do decide.
Descriptive models do not seek to aid people in making ‘rational’
decisions.
. Normative analysis: models which suggest how we should decide.
‘Usually based on mathematical axioms, which define rational behaviour’.
‘The decision‐maker believes A and b then should do X and Y. However,
the additional element that is critical in the development process is time’.
(Atherton & French, , p. ; Bell et al., )
. ‘Prescriptive analysis: models which use normative models to guide the
decision‐maker within other limiting cognitive parameters’ (Atherton et
al., , p. ).
From these descriptions, it can be ascertained, that a feasibility analysis is a
rational normative approach. A descriptive model does not aim to make rational

Chapter3:DecisionMakingandDeterminingViabilityinDevelopmentProjects
MATTHEW MOORHEAD 59
decisions and does not look to reduce bias in the choices made as a normative
model would do. If the analyst believes in the likelihood that the input
assumptions will be accurate, then they should choose those projects that pass
their pre‐determined project hurdles and benchmarks (Atherton et al., ).
Most earlier literature (circa s to ) regarding decision‐making in
property investment and/or development projects focused on a set of rules
which were often based on mathematical models to guide the decision‐maker
on the correct decision to be made. Key research such as Anderson and Settle
( ), Farragher and Kleiman ( ), Graaskamp ( ), Roberts and
Henneberry ( ), Sharkawy ( ), Wurtzebach et al. ( ) and Miles ( )
demonstrated that this was often the case as part of setting the early foundations
of applied normative models in the appraisal or assessment method.
However, in some situations, a developer may decide not to proceed with a
project in which a normative model deems feasible, as they are concerned with
the possibility of the assumed input variables turning out to be incorrect in the
future, or there exists an alternative rationale for completing the subject project.
But it is fair to say that normative models do influence decision making. Adair
et al. ( ) found that decisions concerning property investment projects did
proceed more often in areas where the input variables were more likely known
and where uncertainty was reduced. French ( ) and Atherton et al. ( )
found that in Europe developers’ and/or investors’ behaviour often did not line
up with the normative models applied. It is likely that this pattern of decision
making will hold true with Australian property developers’ decision‐making
processes. This research will further investigate this aspect in the decision to
proceed with a project beyond the pre‐commitment stages of the development
process that will be outlined in in the research questions in Chapter .

Chapter3:DecisionMakingandDeterminingViabilityinDevelopmentProjects
MATTHEW MOORHEAD 60
Prescriptive decision models ‘seek to guide decision‐makers toward consistent
rational choices while recognising their cognitive limits’ (Bell et al., , p. ).
Additionally, this type of decision model utilises descriptive theories of how
decision‐makers do make decisions in order to comprehend how cognitive
processes are used, while also using ‘normative theories of decision making as
the ideal way to make decisions’ (Bell et al., , p. ). Prescriptive theories try
to guide the decision‐maker in making the best possible rational choice. It is
logical to assume that the evolution of feasibility analysis within the framework
of a development appraisal has been moving from a normative model approach
to a more prescriptive model. One explanation for this change is the lessons from
the global financial crisis, as discussed in Chapter , and the levels of input
uncertainty are better understood. In relation to prescriptive models and
determining a projects financial viability it has been noted by McAllister ( )
that the very nature of financial viability appraisals are inherently uncertain and
there are clear incentives for property developers to bias calculations to clear the
minimum hurdle metric. This research will aim to gain an understanding of how
feasibility analysis, particularly fixed‐hurdle rates, are incorporated into the
decision process to proceed beyond the pre‐commitment stages of the property
development process. This section detailed the foundational basis of decision
processes in property development projects and the following section will review
the concepts of bounded rationality and the behaviourist approach in decision
making in the development process.
3.4.1Boundedrationalityandbehaviouralaspectsofdecisionmakinginthedevelopmentprocess
When reviewing the literature, it can also be noted that there have been a
number of studies focused upon the behavioural aspects of decision‐makers and
specifically if bounded rationality and heuristic bias is present in the decision
process. Particularly, in regard to the valuation of property assets and

Chapter3:DecisionMakingandDeterminingViabilityinDevelopmentProjects
MATTHEW MOORHEAD 61
development projects research such as Diaz ( a, b, , ); Diaz III
( , ); Fainstein ( , ); Gallimore ( , ); Gallimore et al.
( ); Goldberg ( ); Busenitz & Barney ( ); Paul et al. ( ); Robinson
& Robinson ( ); Diaz & Hansz ( ); Gallimore & Wolverton ( ); and
Diaz & Wolverton ( ); Tan et al., ( ). These studies are among those that
aimed at examining the overall impact of the behaviourists’ approach to
decision‐making in property feasibility analysis and have made a valuable
contribution to the more normative models that had been put forth in prior
decades. The behaviourists’ view can be described in that the decision‐makers in
organisations are human and, as such, are guided by human behaviour. Research
shows that development managers have a high level of autonomy in
development firms when deciding whether to proceed and are not bound by
purely normative models (Hutchison et al., ; Crosby et al., a & b;
Weigelmann, ; Fanstein, , ; Whitehead, ). This research will
aim to gain an insight into this process as well as to the existence of heuristic
normative approaches in Australian development firms’ decision‐making
processes.
3.4.2Feasibilityanalysisandthedecisiontoproceed
The property developer ‘needs to question the assumptions that underpin the
analysis which form the key indicators of uncertainty pertaining to a given
project’ (French & Loizou, , p. ). Uncertainty, risk and instability are
common characteristics of property development and are an integral part of a
development appraisal (Campbell, ; Coiacetto, ). The difference
between risk and uncertainty will be explored in greater detail in Chapter , but
the main difference is that risk is the potential occurrence of a future event that
may produce an outcome different from that anticipated and that the outcome
can be measured, whereas uncertainty deals with an outcome that is either
unknown or cannot be measured (Regan, ; Langlois & Cosgel, ).

Chapter3:DecisionMakingandDeterminingViabilityinDevelopmentProjects
MATTHEW MOORHEAD 62
Therefore, it is important to ‘know which variables give rise to the largest effect
on a change of outcome, thus, where the risk is the highest’ (French & Loizou,
, p. ). This analysis creates the opportunity to attempt to decrease the
risks that are viewed as too high. This process is, in large part, subjective and is
subject to the current risk appetite of the decision‐maker and their desire to
maximise utility at the time of site acquisition (Camerer, ; Kahneman et al.,
; Von Neumann & Morgenstern, ).
Historically, developers have relied upon static single point development
appraisal models as opposed to cash‐flow approaches such as DCF or NPV most
often used today (Atherton et al., ). The variables that form inputs in a
project’s feasibility appraisal are made up of revenue and costs that have a degree
of uncertainty, but the outcome of this analysis is usually given as a single value
without a margin of error (Savvides, ). Traditional models have been
enhanced and modified to allow the developer to quantify the risks they are
modelling. This means moving from the idea of a best and worst estimate to a
range of outcomes and a distribution (Byrne, , ). More recent decision
models presented in literature incorporate new techniques and argue that a
developer can easily move away from fixed‐point analysis and incorporate
uncertainty in their models, which are discussed in more detail in Chapter
section . (Atherton et al., ; French & Gabrielli, , ; Loizou &
French, ).
Static point development appraisal can be considered as a rational normative
model in practice, as the outcome generates a ‘go’/’no‐go’ signal suggesting what
the decision‐maker should do (Byrne and Cadman, ). If the analyst believes
in the accuracy of the assumption inputs, then they will decide upon
commencing a project based on the pre‐determined benchmarks of acceptability

Chapter3:DecisionMakingandDeterminingViabilityinDevelopmentProjects
MATTHEW MOORHEAD 63
(Atherton et al., ). The input values become the driving force of the decision
making. The inputs should be the basis for the time and effort spent thinking
about decisions (Keeney, ).
With the inclusion of probability generation and Monte Carlo simulations, a
range of outcomes can be presented in a prescriptive approach facilitating the
decision maker’s ability to have a greater understanding of the process by
allowing amendments to the assumptions (French & French, ; Kelliher &
Mahoney, ). Atherton et al. ( , p. ) described a prescriptive
approach as ‘one that uses normative models to guide the decision‐maker within
other limiting cognitive parameters. The traditional static single point models
use elicitation procedures, sensitivity analysis and remodelling to gain a better
understanding of the inputs and uncertainty present in each variable (Kelliher &
Mahoney, ).
Figure 3.4.2: Oracle Crystal Ball output of probability simulations
Source: Atherton et al. ( , p. )

Chapter3:DecisionMakingandDeterminingViabilityinDevelopmentProjects
MATTHEW MOORHEAD 64
Figure . . illustrates an example presented by Atherton et al. ( , p. )
demonstrating the use of Oracle Crystal Ball to run probability simulations on a
property development financial feasibility analysis. In this example, the mean
profit was found to be € , which is significantly less than the € ,
which resulted from the traditional DCF methodology. The original figure is the
best estimate available from the analyst entering in the input variables to the
best of their knowledge, and the output of the simulations adds statistical
significance to the estimates which has been shown to be more reliable
(Dietterich, ). Another significant point of demonstrating the outcome of
feasibility analysis in this manner is the psychological outcome of not fixating on
a single profit figure but looking at a typically Gaussian distribution.
At this point, it is helpful to review the inputs and elements within a feasibility
analysis of a development appraisal before outlining the specific methods used
for determining go/no‐go decision criteria through the use of hurdle rates.
3.4.3Hurdlerateselection
In the preceding sections, the basis of decision making in property development
has been discussed and an overview of the history and evolution of feasibility
analysis has been provided. One of the key elements of determining whether to
proceed with a potential property development project is the choice of hurdle
rate that the project must exceed to be considered feasible or viable. As
discussed in Chapter , the term hurdle rate implies that there is a minimum
accepted profit or return that the development project must meet or exceed,
given the level of anticipated risk in the project (Geltner et al., ). A hurdle
rate can also represent the minimum expected rate of return an investment must
generate to compensate for the risk‐adjusted undertaking, or the return must
clear the cost of capital and other financial benchmarks set for the project (Ross

Chapter3:DecisionMakingandDeterminingViabilityinDevelopmentProjects
MATTHEW MOORHEAD 65
et al., ). The RICS reports The Valuation of Development Land ( , p. )
makes the following suggestion concerning the choice of hurdle rate.
The nature of the development, and the prevailing practice in the market for
the sector, helps to determine the selection of the profit margin or rate of
return and the percentage to be adopted varies for each case.
A report by the Investment Property Forum (IPF) describes a hurdle rate as
follows:
A required rate of return or an economic profit that a potential project would
need to generate for the property developer to be willing to proceed. From a
property investment decision, ‘hurdle rates’ are linked to capitalisation rates
and investment yields in capital budgeting decisions, or a required return less
the forecasted long‐term growth in income after allowing for depreciation.
(Hutchison et al., , p. )
The IPF report also found that among the investment managers, large‐scale
property investors and developers surveyed that % of respondents used
specific hurdle rates in decision‐making processes either explicitly ( %) or
implicitly ( %).
3.4.4Commonlyusedhurdleratemetrics
This section will provide an overview from the literature of the commonly used
financial metrics used as hurdle rates for property investment and/or
development projects and discuss the suitability of each to the pre‐commitment
stages of the development process. It is a key goal of this research to conduct an
investigation and exploratory analysis regarding both the hurdle rates selected
and the application of such in the early stages of the development process. An

Chapter3:DecisionMakingandDeterminingViabilityinDevelopmentProjects
MATTHEW MOORHEAD 66
understanding of hurdle rate selection is important not only for considering
current industry practice but also to measure the extent to which literature and
industry diverge. It is also anticipated that a recommendation will be offered on
best practice for the selection of hurdle rates for property development projects
in the future.
1.MarginonDevelopmentCosts(MDC)
The hurdle rate metric that is most widely referred to in the literature regarding
property development decision‐making is the margin on development cost
(MDC) which can also be referred to as return on cost (ROC) (Havard, ;
Isaac et al., , ; Miles et al., ; Miles et al., ; Peiser & Hamilton,
; Reed & Sims, ; Wilkinson & Reed, ; Crosby et al., a & b).
Within the context of property investment the WACC is the primary form of
hurdle rate. From an Australian perspective, Costello and Preller ( ) surveyed
Queensland property developers and found development yield (another term for
MDC or ROC) as the second most common financial metric used to determine
feasibility (> %) after all respondents indicated using internal rate of return
(IRR). MDC is an estimate of a development profit margin based on revenue less
costs, including interest for a development project. The literature states that a
linear relationship exists between perceived risk and the rate of required MDC.
A higher anticipated risk to the project, therefore, would require a corresponding
increase in the required MDC percentage the project must achieve to warrant
proceeding beyond the pre‐commitment stages of the development process
(Wilkinson & Reed, ; Reed & Sims, ).
Havard ( ) suggests a number of steps that need to be taken in order to
estimate the MDC or ROC for a project:
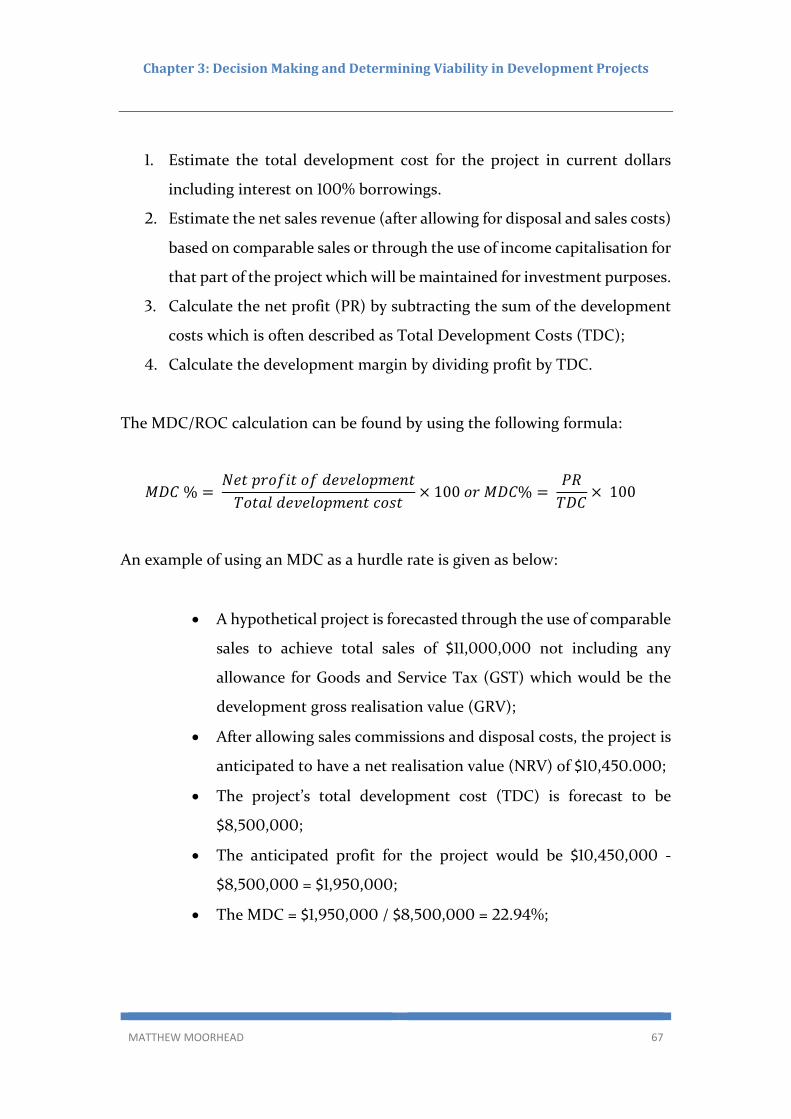
Chapter3:DecisionMakingandDeterminingViabilityinDevelopmentProjects
MATTHEW MOORHEAD 67
. Estimate the total development cost for the project in current dollars
including interest on % borrowings.
. Estimate the net sales revenue (after allowing for disposal and sales costs)
based on comparable sales or through the use of income capitalisation for
that part of the project which will be maintained for investment purposes.
. Calculate the net profit (PR) by subtracting the sum of the development
costs which is often described as Total Development Costs (TDC);
. Calculate the development margin by dividing profit by TDC.
The MDC/ROC calculation can be found by using the following formula:
𝑀𝐷𝐶 % 𝑁𝑒𝑡 𝑝𝑟𝑜𝑓𝑖𝑡 𝑜𝑓 𝑑𝑒𝑣𝑒𝑙𝑜𝑝𝑚𝑒𝑛𝑡
𝑇𝑜𝑡𝑎𝑙 𝑑𝑒𝑣𝑒𝑙𝑜𝑝𝑚𝑒𝑛𝑡 𝑐𝑜𝑠𝑡100 𝑜𝑟 𝑀𝐷𝐶%
𝑃𝑅𝑇𝐷𝐶
100
An example of using an MDC as a hurdle rate is given as below:
A hypothetical project is forecasted through the use of comparable
sales to achieve total sales of $ , , not including any
allowance for Goods and Service Tax (GST) which would be the
development gross realisation value (GRV);
After allowing sales commissions and disposal costs, the project is
anticipated to have a net realisation value (NRV) of $ , . ;
The project’s total development cost (TDC) is forecast to be
$ , , ;
The anticipated profit for the project would be $ , , ‐
$ , , = $ , , ;
The MDC = $ , , / $ , , = . %;

Chapter3:DecisionMakingandDeterminingViabilityinDevelopmentProjects
MATTHEW MOORHEAD 68
If the development project had a required hurdle rate of % MDC,
then this project is expected to clear the hurdle rate and should be
investigated further.
One of the main advantages of using the MDC or ROC method (also known as a
reverse feasibility) is that it is very easy to use and calculate and can also be used
for the comparison or ranking of different projects. The main weakness with this
method of determining a projects hurdle rate is that it does not adequately
account for a more complex pattern of income and expenditure over longer time
horizons or for the time value of money (Isaac et al., ). With the advent of
more complex calculations utilising spreadsheets and proprietary feasibility
programs, NPV, DCF and Internal Rate of Return (IRR) have become more
prominent in the literature (Havard ; Isaac et al., , ; Reed, ;
Reed & Sims, ; Wilkinson & Reed, ; Squires & Heurkens, ).
However, the MDC method for determining a potential development projects’
minimum profitability benchmark is still valid for projects of three years or less
(Havard, ). It is anticipated that the majority of speculative based
development projects would fall within this time frame and will be further
investigated in the empirical survey.
2.NetPresentValue(NPV)
The NPV of a project is the estimated present value of future cash flows minus
the present value of the investment made to have the right to receive the future
cash flows (Ross et al., ). For a property investment decision, this is a fairly
straightforward concept of finding the present value of the expected future net
cash flows or net operating income (NOI) and subtracting the present value of
the cost of purchasing the property. The following equation describes the NPV
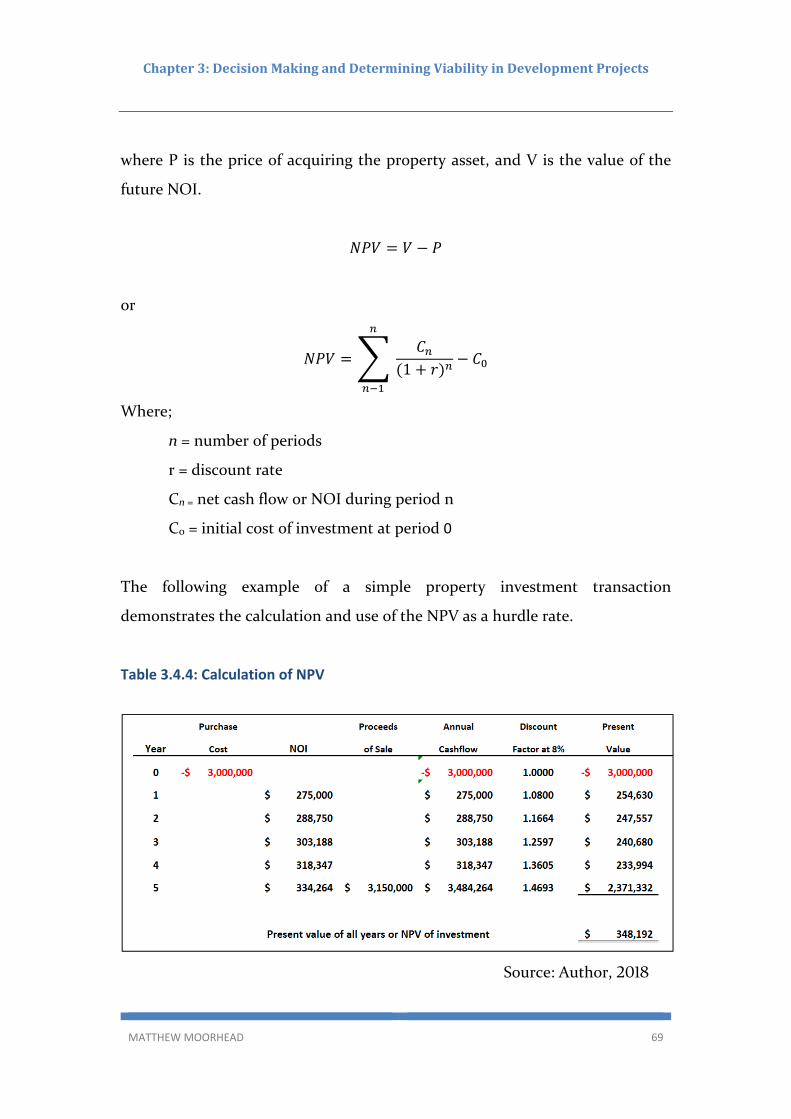
Chapter3:DecisionMakingandDeterminingViabilityinDevelopmentProjects
MATTHEW MOORHEAD 69
where P is the price of acquiring the property asset, and V is the value of the
future NOI.
𝑁𝑃𝑉 𝑉 𝑃
or
𝑁𝑃𝑉 𝐶
1 𝑟𝐶
Where;
n = number of periods
r = discount rate
Cn = net cash flow or NOI during period n
Co = initial cost of investment at period 0
The following example of a simple property investment transaction
demonstrates the calculation and use of the NPV as a hurdle rate.
Table 3.4.4: Calculation of NPV
Source: Author,

Chapter3:DecisionMakingandDeterminingViabilityinDevelopmentProjects
MATTHEW MOORHEAD 70
An industrial property is purchased as an investment for a total cost of
acquisition of $ , , . This property is already tenanted on a long‐term
lease and will receive NOI annually in arrears of $ , increasing by % per
annum for five years, and the tenant will pay all outgoings on the property. The
property will be sold for a % capital value increase after disposal costs at the
end of year . The NPV of the investment, given an % discount rate to account
for the risk‐free rate and a market‐based risk premium, is calculated in Table
. . . As the NPV is a positive number, the building exceeds the desired return
given all the assumptions and the chosen discount rate. A discount rate is
commonly comprised of three different measures including an allowance for the
time value of money, and inflation premium and a risk premium (Rowland, ,
p. ‐ ) The elements of the discount rate are important in that they have a
large influence on a potential project’s forecasted NPV.
When looking at a property development project, the ‘concept becomes more
involved with the addition of the time to build the project, construction loans
and debt facilities as well as phased risk regimes’ (Geltner et al., , p. ).
Traditional property investment has typically involved a large outlay of capital
at the outset in order to receive periodic cash flows from the NOI of the asset
over its effective life. Likewise, with property development, large capital outlays
to acquire a site are made early in the project with additional costs often spread
out across the project timeline and revenues often being received at the end of a
project (Havard, ). This pattern of cash flows often necessitates discounting
each outflow back to the present value to account for the time value of money.
The construction stage of the development process usually involves debt funding
of all or most of the construction costs including the interest capitalised within
the facility. This funding arrangement also gives rise to the advantage that
(construction and interest cost) outflows do not affect the cash position of the
Chapter3:DecisionMakingandDeterminingViabilityinDevelopmentProjects
MATTHEW MOORHEAD 71
property developer until the end of the project. The effect of utilising a different
funding arrangement leads to property development projects having a very
different economic opportunity cost of capital (OCC) than that of traditional
property investment due to the different phases of the development process
(Geltner et al., ).
Brealey et al. ( ) found that for property investment‐based decisions about
whether to include property in a fund’s core portfolio, the NPV is the most
beneficial hurdle rate that can be selected and is superior to using IRR (Brealey
et al., ). However, the IPF research on hurdle rate selection and decision
making for selecting property investment and/or development assets found that
the IRR was the most common hurdle rate selected by European firms with %
of respondents ranking this indicator as the most important (Hutchison et al.,
). In fact, this research report found the use of NPV ranked fourth behind
IRR, return on invested capital and income on cost‐ which can be compared to
MDC or ROC in Australia. Additionally, when the decision processes of property
developers were examined in the IPF report, it was found that hurdle rate metrics
were the primary means of decision making, rather than a portfolio theory
approach adopted by funds managers who select assets for investment purposes.
In the Australian context, Costello and Preller ( ) found that NPV was the
third most used financial indicator for determining feasibility by Queensland
property development firms. From the perspective of property developments in
Australia, New Zealand and internationally, it has been found that organisations
determine feasibility on a project by project basis rather than incorporating NPV
into a portfolio of projects (Hutchison et al., ).
3.InternalRateofReturnandTargetIRR
The internal rate of return (IRR) is a metric used in capital budgeting that
measures the profitability of potential investments. An IRR is the discount rate

Chapter3:DecisionMakingandDeterminingViabilityinDevelopmentProjects
MATTHEW MOORHEAD 72
that leads to the NPV from all cash flows from a particular project being equal
to zero. IRR calculations rely on the same formula used to determine NPV
(Altshuler & Schneiderman, ; Baker & Filbeck, ). When an IRR is used
as a required or forecasted hurdle rate in project decision‐making, a target
internal rate of return (TIRR) is used. Using the NPV equation above to calculate
the IRR, the value of the IRR is equal to r which would give an NPV of 0:
𝑁𝑃𝑉 𝐶
1 𝑟𝐶
This equation is illustrated in Figure . . where an increase in the discount rate
steadily decreases the NPV of an investment until it becomes negative. The IRR
is found by trial and error and through the use of iterations of higher and lower
discount rates and is the value of the discount rate that intersects the line where
NPV is $0.
Discounting is the process of determining the present value (PV) of a cashflows’
inflows and outflows by taking into account the time value of money of future
value (FV) inputs (Baroni et al., ). The time value of money refers to the
phenomenon that a dollar today (PV) has an inherent value greater than a dollar
in the future (FV) due to the risk of not receiving the forecasted amount.
‘Investors expect a return simply because, having time up money, they have
foregone the pleasure of spending it’ (Rowland, , p. ). It is the rate of
return expected if there was no risk of default. A discount rate is a required rate
of return on a real estate investment/development based on its risk when
compared with returns earned on competing investments and other capital
market benchmarks (Rowland, ). A discount rate will often include a
summation of the risk free rate (Government yr treasury yield), an allowance

Chapter3:DecisionMakingandDeterminingViabilityinDevelopmentProjects
MATTHEW MOORHEAD 73
for inflation and a risk premium commensurate with the perceived risk of the
future income streams (Fisher, ; Baum & Crosby, ). For many analysts
within the property development industry, the discount rates is set to a target
rate of return (Regan, ). In the NPV example given in Figure . . , the IRR
would be equal to . % which would be the discount rate that gives an NPV
of $ .
Figure 3.4.4: NPV of a project given different discount rates
Source: Author,
As stated above, in a number of prior studies it has been found the IRR to be the
preferred hurdle rate when making property investment‐based decisions. When
employing an IRR as a hurdle rate for decision making it is important for the
organisation to set a target internal rate of return (TIRR). A TIRR is a required
IRR set by the decision‐maker as a minimum hurdle rate to which a project’s
forecasted return must be equal or greater than, and a TIRR converts an IRR
from a measure of expected return to a ‘go’ or ‘no‐go’ decision criterion. When
10.83%
$0
IRR
Discount Rate
NPV $
Chapter3:DecisionMakingandDeterminingViabilityinDevelopmentProjects
MATTHEW MOORHEAD 74
this indicator is used, a ‘go’ decision is triggered when the IRR exceeds the TIRR,
or when the discount rate applied to future cash inflows and outflows is greater
than the required return on funds. For speculative development in Australia, the
MDC is the most preferred hurdle rate as found in Preller and Costello ( )
followed by the IRR. Hutchison et al. ( ) found that most survey respondents
did not base their required rate of return on accepted finance theory but applied
a risk‐free rate (usually based on government bond rates) plus a risk premium
that is often formed from an in‐house view to come up with a minimum
acceptable IRR in a methodology similar to the Capital Asset Pricing Model
(CAPM). This finding is consistent with Crosby et al. ( a) which found that
when an IRR was applied to UK based development viability studies, the actual
return was the inverse to what would be expected from the financial literature.
Longer‐term projects actually produced lower IRR returns and shorter projects
higher returns which runs counter to widely accepted investment decision‐
making theory. They argue this is due to the residual land value calculations and
the point in time expenditure in the project is incurred. IPD ( ) as quoted in
Crosby et al. ( a) reviewed , UK based development appraisals and
found that average return as measured by IRR was % over the period –
. This return was hardly more than that which could reasonably be
expected from other passively held investments over this period, with a lower
level of expected risk.
Crosby et al. ( a) also offer the view that property developers may be using
the IRR and other time value of money measures in ways that are not addressed
in the wider financial literature. Within this risk premium, there were a number
of approaches from ‘rules of thumb to complex, layered models and pro‐forma
approaches with an absence of textbook models’ (Hutchison et al., , p. ). It
is anticipated that when Australian property development firms are surveyed
that the result will be similar to that found by Crosby et al. ( a). An
Chapter3:DecisionMakingandDeterminingViabilityinDevelopmentProjects
MATTHEW MOORHEAD 75
interesting outcome of the IPF report was the finding that % of respondents
applied a specific hurdle to each project or investment.
4.Returnonequity,equityinternalrateofreturnandreturnoninvestment
The return on equity (ROE) and return on investment (ROI) indicators are
profitability ratios used by investors to determine how much an investment will
return from either earnings or capital gains/losses from changes of asset value
(Adelman & Marks, ). This indicator is used among others ‘to gauge the
initial attractiveness of a development proposal which must be met or exceeded
to sustain interest in a project’ (Nachem, , p. ). Equity internal rate of
return (EIRR) ‘is used when a project is funded using a mix of equity and debt
and the investor would like to estimate the rate of return on equity, after debt
costs and payments are removed’ (Rowley et al., , p. ). This hurdle rate is
an important financial metric in property development as there is a high usage
of debt funding in the Australian industry. Additionally, this indicator is the
leveraged version of the IRR hurdle rate metric, and when the EIRR exceeds the
project IRR it indicates the project IRR exceeding the WACC (Rowley et al., ).
Equity may be defined as ‘the proprietor’s capital investment in an enterprise or
undertaking that is generally unsecured, high risk and illiquid’ (Regan, , p.
). The ROE for a development project can be found by dividing the net profit
of the development by the average equity investment from the developer over
the life of the project. From the perspective of an investor investing funds into
a development project, the same equation can be used to determine the ROI.
The ROE or ROI achieved by a project for a development organisation or investor
determines what each dollar of equity invested generates in terms of net income.
The formula for determining ROE is:

Chapter3:DecisionMakingandDeterminingViabilityinDevelopmentProjects
MATTHEW MOORHEAD 76
𝑅𝑂𝐸 % 𝑁𝑒𝑡 𝑃𝑟𝑜𝑓𝑖𝑡 𝑜𝑓 𝐷𝑒𝑣𝑒𝑙𝑜𝑝𝑚𝑒𝑛𝑡
𝐴𝑣𝑒𝑟𝑎𝑔𝑒 𝑂𝑤𝑛𝑒𝑟′𝑠 𝐸𝑞𝑢𝑖𝑡𝑦 𝑖𝑛 𝑝𝑟𝑜𝑗𝑒𝑐𝑡100
(Source: Reed, )
This ratio is important for most development firms as the use of debt and
leverage are commonly used and can be used to determine the return on the
property developer’s funds invested in the project. Preller ( ) found that
approximately % of developers surveyed calculated the ROE and used it in
decision making.
5.Paybackperiod(PB)andbreakevenratios
The payback period is an example of a breakeven ratio which can include other
measures such as sales breakeven ratio, operating breakeven (BE) ratio and
expense ratio (Nachem, ). A payback period is a period of time required in
order to recover the initial outlay from profits or savings (Brealey et al., ).
All else being equal, when comparing potential projects, the shorter the payback
period the less the investor is exposed to the investment (Reed, ). The
payback period is a measure of risk and success of a project. The payback period
can be calculated by the following formula (Zuckerman & Blevins, ):
𝑃𝐵 𝐸𝑞𝑢𝑖𝑡𝑦 𝐶𝑎𝑝𝑖𝑡𝑎𝑙 𝐼𝑛𝑣𝑒𝑠𝑡𝑒𝑑
Average Annual Project Cashflow
When a project’s cash flow is not represented in ‘annualised figures, such as from
property development activities, then the equity cash flows must be added until
they equal the sum of the equity capital invested’ (Reed, , p. ).

Chapter3:DecisionMakingandDeterminingViabilityinDevelopmentProjects
MATTHEW MOORHEAD 77
6.Marginonrevenueorreturnonrevenue(ROR)
A margin or return on revenue is similar to the MDC or ROC calculation
mentioned above, with the same advantages and weaknesses, with the exception
that the total gross realisation (GR) or gross development value (GDV) of a
project is used as the denominator rather than the TDC being so used. The return
on revenue (ROR) is found by dividing the expected profit by the GDV or GR as
demonstrated in the following formula:
𝑅𝑂𝑅 % 𝑁𝑒𝑡 𝑃𝑟𝑜𝑓𝑖𝑡 𝑜𝑓 𝐷𝑒𝑣𝑒𝑙𝑜𝑝𝑚𝑒𝑛𝑡
Gross Development Value100 𝑜𝑟 𝑅𝑂𝑅%
𝑃𝑅GDV
100
(Source: Reed, )
A survey conducted by the Royal Institution of Chartered Surveyors found that
the MDC or ROC method is much more common than the ROR for development
appraisals in the UK. ‘The latter derives from the traditional financing of
commercial developments where the completed property is sold to a long‐term
investor’ (RICS, , p. ).
7.Weightedaveragecostofcapital(WACC)
A WACC can be used as a hurdle rate to determine a development project’s
break‐even point and the level of value the project derives in excess of the firm's
cost of capital. Often used in as a determinate in identifying an investment’s net
present value, a WACC is simply the product of the annual interest rate
associated with each form of capital used in project and the respective
percentage weighting (Chen, ; Modigliani & Miller, ). Alternatively, the
WACC can have an inbuilt requirement for a particular return on equity (ROE)
which is used as a risk premium that is required to justify the organisation

Chapter3:DecisionMakingandDeterminingViabilityinDevelopmentProjects
MATTHEW MOORHEAD 78
investing their own equity capital into a project (Geltner, ). In this situation
the WACC would be equal to the TIRR.
8.Capitalassetpricingmodelandanallowanceforrisk
The capital asset pricing model or CAPM was originally developed by Sharpe
( ) and Lintner ( ) as a means of decision‐making given an investment’s
expected return and risk. CAPM builds upon modern portfolio theory developed
by Markowitz ( ) and aims to discount future cash flows by a minimum
market return and a risk‐premium commensurate with the expected volatility of
returns. CAPM was modified and applied to real estate transactions by Jud and
Winkler ( ). The use of CAPM has the effect of restricting the number of
projects an organisation can undertake, a concept that is generally known as
capital rationing. Capital rationing is defined by Beraldi et al. ( , p. ) as:
The act of limiting an organisation's potential number of projects, as capital is
not infinite, and concerns the selection of a portfolio of investment projects
with the aim of maximizing the total value while satisfying the capital budget
constraints imposed over the planning horizon.
The limiting factor of CAPM is achieved by requiring a higher cost of capital to
permit only those projects to proceed that have a higher return on capital
(Dayananda, ). Therefore, projects with the highest NPV will proceed and
will have the effect of maximising the firm's profitability and put a restraint on
the over‐commitment of capital (Beraldi et al., ; Antle & Eppen, ).
Recent studies have cast doubt upon the application of CAPM and other
popularly accepted investment‐oriented capital budgeting methods to property
development projects (Crosby et al., a; IPD, , ). CAPM requires a
reliable industry‐based market return in order to determine the appropriate

Chapter3:DecisionMakingandDeterminingViabilityinDevelopmentProjects
MATTHEW MOORHEAD 79
CAPM rate, but no such reliable measure for property development exists, and
the high level of heterogeneity of property development projects makes the
creation of such a measure problematic. Developers do utilise DCF methods but
employ other methods for the determination of an acceptable project discount
rate.
9.Minimumfinancialmetrics
It is commonly understood within the industry that many property development
firms set a minimum financial metric as a hurdle rate which must be met or
exceeded. These are simple ratios such as a minimum dollar amount of profit
that must be achieved, a minimum profit dollar/per unit or dollar per square
metre, or a minimum dollar amount of the project size or revenue (Gau &
Kohlhepp, , Costello & Preller, ). These measures are very simple to
calculate but can be highly useful. For example, a property development
organisation sets its minimum project size to be $ million based on GR. This
minimum size is a valid hurdle rate because the organisation's experience using
a % MDC required profit yields their minimum acceptable profit given their
staff resources and company overheads. Development feasibility and the
financial metrics associated with hurdle rates are a project‐specific exercise that
usually does not take into account the company’s project portfolio or the
company overheads associated with running the project (Bulan et al., ). A
minimum dollar amount is a valid screening tool to avoid utilising resources on
projects that are not value accretive to the company as a whole (Holland et al.,
). Surveys conducted with property developers as respondents such as
Hutchison et al. ( ), Crosby et al., ( a & b), Preller ( ) Costello &
Preller ( ) and Weigelmann ( ) found that many property developers
utilise other simple financial metrics. One explanation for the heavy reliance on
simple financial ratios is offered by Crosby et al. ( ) in that the more popular

Chapter3:DecisionMakingandDeterminingViabilityinDevelopmentProjects
MATTHEW MOORHEAD 80
quantitative techniques used in longer‐termed property investment do not
accurately reflect the risk/reward realities of property development projects.
One such example includes the accepted axiom that the longer a
project/investments time horizon, the higher the discount rate required to
compensate for the greater levels of uncertainty and risk in the future. Therefore,
risk and time are linear. In regards to property development projects, this is often
inverse to reality, as in the example of some long‐term land development
projects (Crosby et al., a).
3.5Elementsoffeasibilityanalysiswithinadevelopmentappraisal
A feasibility analysis includes a financial analysis but will contain additional
elements including an executive summary, market study, preliminary drivers,
cost estimates, photographs and map information for the site, information about
financing, planning permissions, an estimate of value and an analysis of project
risk (Havard, ; Greer et al., ; Miles et al., ; Rowley et al., ).
Additionally, an analytical section should include the following areas:
Sensitivity analysis with an evaluation of each component and variation
of the plan, to move from feasible to optimal;
A review of risks in the optimal configuration, with appropriate risk
management techniques; and
Confirmation that the project is feasible for each participant. (Miles et al.,
, p. )
A range of critical and analytical issues have been identified from the literature
which should be considered when completing a feasibility study from where the

Chapter3:DecisionMakingandDeterminingViabilityinDevelopmentProjects
MATTHEW MOORHEAD 81
following aspects have been collated and include Havard, ; Wilkinson &
Reed, ; Reed & Sims, ; Miles et al., ; Miles et al., ; Peiser & Frej,
; Rowley et al., ).
3.5.1Criticalanalysisaspectofafeasibilitystudy
. The conceptual idea and market for the project, from the concept down
to a specific absorption schedule, then the particular market niche under
current conditions:
a. national, regional and local market outlook,
b. demographic attributes of the target market,
c. sales and rental comparables,
d. market segmentation including the identification of key
marketability traits,
e. evaluation of existing supply.
. Compilation and analysis
a. incorporate the assumptions into a DCF model,
b. perform sensitivity and/or scenario analysis,
c. review risks and optimal configuration,
d. confirm that the project is feasible.
The completion of the conceptual market information early in the life of a
development project, as well as the completion of a thorough financial feasibility
analysis, are considered essential for informed management decision‐making in
the pre‐commitment stages of the development process.
3.5.2Determiningadevelopmentproject’sobjectives
Before undertaking a feasibility analysis for a development project, it is
important to identify clearly the key objectives that the project needs to fulfil. In

Chapter3:DecisionMakingandDeterminingViabilityinDevelopmentProjects
MATTHEW MOORHEAD 82
order to delineate objectives within the project, the feasibility problem needs to
be defined (Kolbe et al., ). The required development objectives should be
determinable and establish the basis for determining hurdle rates and inform
the ‘go/no‐go’ decision output of the financial analysis. The development
objectives must also be able to be measured and a judgement made on whether
they can or will be achievable (Havard, ).
As all projects are unique, the reasons for undertaking a project often differ
requiring specific objectives to be set for each one. The viability analysis will
determine if the minimum hurdle benchmarks have been satisfied and, if so, will
result in a ‘go’ decision and help guide the decision‐maker as to ‘when to go’
(Mayer & Sommerville, ).
It is imperative that the decision‐makers deciding whether to proceed with a
project have a clear idea of what they want their project to achieve prior to
undertaking the feasibility analysis of a development appraisal (Havard, ).
In relation to financial gain, it is important to distinguish the goals of the trader‐
developer verses the investor‐developer. The trader developer will primarily
create real assets for the purpose of on‐selling at a higher price than the cost to
complete the project, therefore, deriving an economic profit. An investor‐
developer will generally have a longer investment horizon and will be looking at
the value of longer‐term income streams that have been discounted from the
future value to present value. The difference in primary development objective
will determine which hurdle rates and financial performance metrics are utilised
in the feasibility analysis and ultimately which development sites and projects
will proceed past the go/no‐go decision point.

Chapter3:DecisionMakingandDeterminingViabilityinDevelopmentProjects
MATTHEW MOORHEAD 83
a.Non‐FinancialDevelopmentObjectives
Most trader and investor developers prioritise economic profit as the primary
objective for initiating a project but many projects are undertaking for additional
reasons (Earl, ; Jones, Bell, & Earl, ). Feasibility analysis can also be
used for projects where the primary objectives are not financial gain with the
addition of techniques such as cost‐benefit analysis (Aye et al., ). Wilkinson
et al. ( . p. ) described the traditional approach to determining viability as:
Under the paradigm of conventional project appraisal, the assumption is made
that the object of carrying out development is to achieve a ‘single bottom line’
profit. No account is taken of external costs of the development carried by the
community or other stakeholders.
With governments that are looking at infrastructure and other projects where
social value is the main objective, the social benefits will far outweigh the
project’s IRR (Regan, ; Smith, ). Public and quasi‐private/public
organisation may not state that deriving economic profit is their primary
objective, but often there exists the impetus of accountability in their allocation
of resources and so will need to strive to obtain the maximum benefit/social
value return (Smith, ). To determine which projects are to proceed, these
organisations need to undertake a development appraisal which includes
financial feasibility analysis. Social objectives may include providing land supply,
increasing housing affordability, regional economic stimulus, transportation
and/or meeting other community objectives for example.
b.Financialmotivationasapropertydevelopmentobjective
Both traditional trader‐developers and investor‐developers usually will have
their primary development objective to derive economic profit and the

Chapter3:DecisionMakingandDeterminingViabilityinDevelopmentProjects
MATTHEW MOORHEAD 84
management of risk (Havard, ). Ultimately, this goal aims to obtain the
highest risk‐adjusted profit possible when choosing between possible projects.
Economic profit is usually measured as a surplus of revenue to costs or an
allowance for the time value of money such as an NPV.
3.5.3Determiningadevelopmentproject’sboundariesandlimitations
Now that the primary and secondary development objectives have been
determined and the purpose for development defined, it is important to examine
the boundaries constraining the project and other limitations that could restrict
the project from achieving its objectives. Project constraints exist that may place
a ‘complete bar on the development taking place at all, but most will establish
the limits of the development – the physical limits, the legal limits and the
market limits’ (Havard, , p. ). There are many areas of limitations and
boundaries placed upon a project, but they can generally be sorted into the
following categories: Site availability and restrictions, permissions and planning,
legal and contractual, market factors including supply and demand, broader
economic climate, financing and the availability of capital, and political issues
(Armitage, ; Havard, ).
There is a common misperception that design consultants or architects are the
primary drivers in determining what should and can be developed on a particular
site (Havard, ). Usually, this process is well advanced before any consultants
are engaged, and the developer will have a good understanding of what can and
should be developed in order to meet the project’s objectives. The breadth of
limitations imposed upon a development project goes far beyond just the legal
restrictions imposed by planning instruments, and it is the development
appraisal which plays an integral role in defining this process (Havard ). The
five principle external considerations that need to be evaluated include the

Chapter3:DecisionMakingandDeterminingViabilityinDevelopmentProjects
MATTHEW MOORHEAD 85
planning framework, political issues, the property market, project finance and
legal issues are discussed in turn.
a.Theplanningframework
Urban planning is primarily concerned with shaping the urban landscape of the
future (Ward, ). The shaping is primarily done through the development
control process which can be described as ‘a process by which society,
represented by locally elected councils, regulates changes in the use and
appearance of the environment’ (Audit Commission, as quoted in Carmona
& Sieh, , p. ).
The value of a real estate development project or a development site is
intrinsically linked with the planning and permission instruments placed upon
and governing the possible development schemes or options. Ricardo’s Law of
Rent states that the ultimate value of a property is derived from the rents that
can be obtained from that property or, in modern terminology, the Net
Operating Income (NOI) that can be derived (Ricardo, , ). The NOI of a
property or a completed development project can be ascertained by a study of
market rents for comparable properties. Milton Freidman’s Efficient Market
Hypothesis is demonstrated in the determination of market rents and the
combined market transactions in a particular area will influence the potential
NOI of a project (Friedman, ).
Microeconomic theory identifies that the price of a property is the result of the
interaction of supply and demand and hence will determine a market rent
(Barras, ). The supply of land or property is rarely a determinant of the
actual amount of physical land in an area (Exceptions exist, e.g. Singapore or

Chapter3:DecisionMakingandDeterminingViabilityinDevelopmentProjects
MATTHEW MOORHEAD 86
Monaco where there is a fixed amount of land that can be used.) Australia is a
large continent that is mostly uninhabited and contains vast expanses of vacant
land, but the physical supply of the land does not form the supply that
determines the value of a particular property or development site. The available
supply of developable land is determined by the planning mechanisms and the
physical infrastructure that will allow the creation of NOI from the use of a site
(Hilber & Vermeulen, ; Albouy & Ehrlich, ). An example of this limit to
supply would be the area of land allocated to retail shopping centre use and
development. Planning schemes purposefully limit the provision of retail
shopping centres to allow for existing centres to adequately provide for the
population and to allow for businesses to be able to succeed (Guy, ). Too
much retail space and businesses will not be able to draw enough customers to
be successful; too little, and the customers will have to travel a long way (England,
). The supply of retail shopping centres is scarce, which allows existing
centres to achieve an increased level of NOI that corresponds to an increased
valuation than would be possible if the supply was less scarce. Residential
property is much more abundant in Australian cities. Therefore, the NOI and
values of residential property are lower per m than what would be expected for
retail shopping centres.
As the supply of any allowable use for property development is fixed and scarce,
the developer can generate an economic profit from increasing the supply
permissible on a given development site by applying for a change of use or
increasing floorspace density (Gyourko & Molloy, ). For example, in
Queensland Australia a material change of use (MCU) is the common
terminology for this process and is defined by the Planning Act (Qld) , p.
as the following:

Chapter3:DecisionMakingandDeterminingViabilityinDevelopmentProjects
MATTHEW MOORHEAD 87
The start of a new use of the premises; (or) the re‐establishment of the premises
of a use that has been abandoned; (or) a material increase in the intensity or
scale of the use of the premises.
Seeking appropriate development approvals is a vital task within the
development process and will form a significant boundary to the potential
project. As noted above in Queensland, a property developer can seek to have
the planning scheme governing their site amended through application for an
MCU. This process can be either impact assessable or code assessable in
Queensland as defined by the Planning Act (Qld) as follows:
Code assessment – an assessment that must be carried out only against the
assessment benchmarks in a categorising instrument for the development; and
having regard to any matters prescribed by regulation… (Planning Act QLD,
, p. ).
Impact Assessment is an assessment that must be carried out against the
assessment benchmarks in a categorising instrument for the development; and
having regard to any matters prescribed by regulation may be carried out
against, or having regard to, any other relevant matter, other than a person’s
personal circumstances, financial or otherwise (Planning Act QLD, , p.
).
Code assessment based MCUs are typically easier to obtain and present a lower
level of risk to a project than having to obtain an impact assessable MCU where
the project must be advertised and objections can be made to the proposed
development scheme. The planning limitations of a development project present
a major limitation and also present one of the key risks to a project. Furthermore,
the time period to obtain development project planning approval poses a

Chapter3:DecisionMakingandDeterminingViabilityinDevelopmentProjects
MATTHEW MOORHEAD 88
significant risk to a project and can have a negative impact on the required TIRR.
Newell and Steglick ( ) surveyed Australian property developers and found
that approval or planning risk was the second‐highest risk category a project
faces after environmental risks. They also found that property development
firms employ a number of risk minimising strategies concerning planning and
permissions including analysing if extra approvals are needed before acquiring a
site, investigating the level of development approval conditions and
contributions and actively meeting and communicating with local government
councils (Newell & Steglick, ). Property development project risk and
uncertainty will be further examined in Chapter .
b.Politicalissues
Housing affordability, negative gearing, foreign investors, capital gains tax
concessions and environmental concerns have become regular topics of interest
in the political and media landscapes in both Australia and New Zealand. The
manner in which governments, at the federal, state and local levels, respond to
the above issues can have a dramatic impact on development projects. A change
in policy from the Foreign Investment Review Board (FIRB) could immediately
impact most of the projects potential buyers and could turn an otherwise
successful development into a disaster. This particular situation has recently
impacted on planned Australian property development projects do to a change
in policy in (Ciesielski, ). The potential for political interference has
the potential to increase as society has increasingly viewed housing affordability
and the taxation of property investments as issues that could have a major
impact on society. Additionally, the balance of society’s views on the right of the
individual and their landholdings versus the rights of society to impose control
over the individual’s rights has increasingly shifted towards the benefits to
society at (Platteau, ). It is now more important than ever to consider

Chapter3:DecisionMakingandDeterminingViabilityinDevelopmentProjects
MATTHEW MOORHEAD 89
changes in political issues and how that could impact on a development project
meeting its key objectives.
c.Thepropertymarketandthebroadereconomy
There are many economic factors that influence a development project and may
place limits on the development that is deemed feasible. Growth in disposable
income, employment levels, inflation and monetary policy are some of the
economic indicators which influence the optimal development matrix and the
speed and size of a project. Supply and demand factors play a major role in the
determination of the price, profitability and the absorption of a development
project into the market (Baum, ).
d.ProjectFinanceandCapitalRaising
Project funding has a major impact on how a developer determines which
projects are feasible and should be undertaken. The ease and price of capital in
both debt and equity forms is often the determining factor in the optimum size
of development projects (Rowley et al., ). The process of completing a
feasibility study to determine if a project is viable will usually start long before
there is any contractual relationship with a site or a project.
3.6Feasibilitymethodscommonlyusedindevelopmentappraisal
The primary methods of determining feasibility in development appraisal are
derived from Ricardo’s Law of Rent and are based on the premise that the value
of a development project or site is taken as the residual amount after all costs
and required profit are accounted in the development equation (Baum & Crosby,
). The development equation is primarily used in two ways in the pre‐

Chapter3:DecisionMakingandDeterminingViabilityinDevelopmentProjects
MATTHEW MOORHEAD 90
commitment stages which include the residual land value method and when a
land price is entered and the residual profit is determined. There are numerous
examples of development equation models, but all have in common the
underlying principles which include:
Value of the completed development project (Gross Realisation)
Less –
All cost inputs including design, permissions, consultants, construction (both
civil and structural), sales and marketing, government fees and taxes
Less –
The required profit for the project given the risk associated with the project as
specified by Hurdle Rate or Target Return
Equals –
Residual Land Value, is the maximum amount that can be paid for the site or bid
at auction after the costs associated with acquiring the site are allowed (Havard,
, Isaac et al., )
When examining an asking price for a potential development site the above
equation can be re‐arranged as follows in order to see if the profitability of the
project will clear the required hurdle rates:
Value of the completed development project (Gross Realisation)

Chapter3:DecisionMakingandDeterminingViabilityinDevelopmentProjects
MATTHEW MOORHEAD 91
Less –
All cost inputs including design, permissions, consultants, construction (both
civil and structural), sales & marketing, government fees and taxes
Less –
Residual Land Value, which produces the maximum amount that can be paid for
the site or bid at auction after the costs associated with acquiring the site are
allowed
Equals –
The required profit for the project given the risk associated with the project as
specified by Hurdle Rate or Target Return
(Sources: Isaac & O’Leary , ; Isaac et al., , ; Havard, )
The above equations are very simple, but the complexity in preparing a
development appraisal comes from the accuracy that must be used to determine
the input variables in both price and timing. The project analyst is forced to
forecast many variables possibly for ten years or more, which creates a great deal
of uncertainty in the process. The forecasting of development variables of both
cost and revenue can be demonstrated in the waterfall of risk (Leinberger, ).
The waterfall of risk refers to the payout schedule within a cashflow typical of
many property development projects. Project expenses or outflows progress
from the start of the project up until the end of the construction and registration
periods where income in the form of sales and/or rents can be received
(Gimpelevich, ). When the next expenditure and receipts in a project are
illustrated graphically, projects typically demonstrate a steady decline in the net

Chapter3:DecisionMakingandDeterminingViabilityinDevelopmentProjects
MATTHEW MOORHEAD 92
funds received until the end of the project with a rapid influx of capital. The
shape of this typical cashflow often will illustrate a waterfall.
Havard ( ) describes steps in completing a feasibility analysis for a potential
project as follows:
. First, determine the inputs: This includes making an assessment of the
input costs which may include land and acquisition, building costs,
professional fees, statutory charges as well as forecasting sales and
revenue.
. Determine the length of the project: This step includes estimating how
long each stage of the development process will take and assigning inputs
to specific time periods. The timing of cost outlays and revenue inputs is
illustrated in Figure . . It should be noted that Figure . illustrates the
sales settlements occurring at one point at the end of the project rather
than over a period of time.
. Determine the effect of time on interest and finance charges
. Determine the residual amount (FV)
. Discount the future value residual land and profit value back to present
value (PV)
The determination of profit and/or residual land value through a development
equation is a common component of determining project viability. More
complex quantitative analysis within feasibility programs still aims to solve the
basic equation described above and seek to provide an answer to the go/no‐go
decision point in justifying if the forecasted profit is sufficient given the
identified risk of the proposed development project (Currie & Wesley, ).

Chapter3:DecisionMakingandDeterminingViabilityinDevelopmentProjects
MATTHEW MOORHEAD 93
Figure 3.6: Cumulative cost vs time
(Source: Havard, , p. )
3.6.1Thedevelopmentequation
The basic process of development appraisal is to calculate the development
equation and to determine either a project’s potential profit or the residual land
value as a method of valuing a development site’s maximum contract price. The
equation is a step in validating all the revenue and costs associated with a
proposed property development project although, in practice, is not formatted
as an algebraic equation (Robinson, ).
𝑃𝑅 1 𝑖 𝑉 𝐷𝐶 𝐿
Where:
L = residual profit allowed for risk valued at time t =
i = the discount rate which includes the developer’s weighted average
cost of capital (WACC) + a risk premium
t = development period
V = estimate of the development value on completion
Time
Cumulative C
ashflo
w $
Time Net Surplus

Chapter3:DecisionMakingandDeterminingViabilityinDevelopmentProjects
MATTHEW MOORHEAD 94
l = estimated purchase price of the development site plus all
acquisition costs associated in procuring the site, of Profit and Risk
allowance determined by selected benchmark or hurdle rate
PR = The required profit for taking on the project risk
DC = development costs excluding land and acquisition costs.
The following equation is a highly simplified version of the residual land
calculations expressed in numerous valuation texts (Havard, ; Isaac et al.,
; Ratcliffe et al., ; Wilkinson & Reed, ):
V = B + F + MS + PR + L
or
L = V ‐ (B + F + MS + PR)
Where:
L = residual land value
V = project gross realisation
B = building and development costs
F = finance and capital costs
MS = marketing and sales costs
PR = required profit for taking on project risk.
Kolbe et al. ( , p. ) offers the following observations on the property
development process:
Property developers and investors are effectively placing their equity at risk
based on a set of assumptions about the development scheme’s ability to
generate the anticipated revenue in the future. Feasibility analysis addresses
the likelihood that the project’s objectives will be achieved.

Chapter3:DecisionMakingandDeterminingViabilityinDevelopmentProjects
MATTHEW MOORHEAD 95
The simplicity of the development equation belies the complexity of factors that
influence the input assumptions and further exacerbates the difficulty in
accurate forecasting. Therefore, the development equation is a summation of the
forecast of a series of future uncertain events (Havard, ).
3.6.2Residuallandvalue
Development sites or vacant land need to be analysed for a potential
development project which has no inherent intrinsic value at this stage, but a
determination of value can be made by examining the potential uses for which
the site can be developed. The latent value of a site is known as a residual land
value (Harvard, ). The term residual refers to the portion of the value in a
project that is left over after allowing for all the cost inputs and a pre‐determined
profit figure and subtracting this from the forecasted net revenue. This
remaining residual value is a determinant of land value (FV); this value can then
be discounted back to the PV in order to allow for landholding costs across the
development period. (See Isaac et al., , p. and Havard, , p. for
specific calculations demonstrating that the residual amount of the equation is
a future value of the land that should then be discounted back to present value.)
The traditional use of the RLV is a static calculation that does take into account
the time value of money (Havard, ). Each specific development scheme or
development option will have a unique residual land value, and property
developers will frequently evaluate many potential schemes in order to compare
residual land values. The theory of site value necessitates two pre‐conditions
(Fraser, ) before a project can commence based on the given assumptions
that the motive for undertaking property development is to derive economic
profit. These pre‐conditions are:

Chapter3:DecisionMakingandDeterminingViabilityinDevelopmentProjects
MATTHEW MOORHEAD 96
a) The expected value of the completed development must exceed the cost
of the site and all development costs, including a sufficient level of profit
for the developer.
b) The value of the site for development purposes must match (or exceed)
its value for an existing use. (Fraser, , p. )
When a development site has been placed on the market, competing firms will
undertake the development appraisal process and will determine the residual
land value for various schemes in order to ascertain the maximum bid price they
are willing to offer. This process of scheme evaluation will result in a range of
values, and the vendor will usually sell to the highest bid that a prospective
developer can make while still achieving their target return (Havard, ). The
analyst at this stage crosses over to the area of valuation and development
appraisal and seeks to answer the question of the value of a specific site. A
number of development options or schemes can be put forward by the analyst
and through the process of completing a feasibility analysis each development
option will end up with a unique value (Isaac et al., , Ratcliffe et al., ).
The iterative nature of this process should lead the analyst to development
options that have a higher residual land value and therefore towards the highest
and best use (from an economic profit perspective) for a site (Jefferies, ,
Wilkinson & Reed, ).
3.6.3Discountedcash‐flowmethod
The equation below demonstrates the calculations required when the
discounted cash flow (DCF) method is used to determine residual land value.
Rather than a simple rough estimate of finance charges, revenue and expenditure
are broken up into even time events (usually monthly or quarterly) and finance
charges are calculated on the cumulative cash‐flow at that point. Cash flow

Chapter3:DecisionMakingandDeterminingViabilityinDevelopmentProjects
MATTHEW MOORHEAD 97
methods differ from the static RLV method in that the method is dynamic. The
net cash‐flow in each time period is then discounted by the appropriate discount
factor.
𝐿 𝑅 𝑅
1 𝑖
𝑉1 𝑖
Where:
L = residual land value
R = project gross realisation
R = b
V= f
n = periods in the cash flow
(Havard, )
As discussed in section . . discounting is the process of determining the
present value (PV) of a cashflows’ inflows and outflows by taking into account
the time value of money of future value (FV) inputs (Baroni et al., ). In the
DCF method of feasibility analysis, each net cash flow of a project’s inputs and
outputs during a given cashflow period (e.g. months or quarters) is discounted
from a FV to a PV, usually using the WACC or TIRR for the project (Havard,
). The PV for each cashflow period are then summed to determine the PV
of the development project over the project’s development term.
3.6.3.1KeyadvantagesoftheDCFmethodoffeasibilityanalysis
A key advantage of both the DCF and residual cashflow accommodation method
over the traditional static traditional residual land value approach is that the
addition of the element of time to the analysis allows for more accurate

Chapter3:DecisionMakingandDeterminingViabilityinDevelopmentProjects
MATTHEW MOORHEAD 98
estimation and forecasting of project inflows and outflows. Additionally, they
give the analyst the ability to answer the question of when capital is likely to be
needed or received (Havard, ). A severe limitation of the traditional static
residual land value approach is the inability to forecast interest payments within
a project and necessitated the utilisation of an approximation method which
could be inaccurate.
A limitation of the use of the DCF method of feasibility analysis includes the FV
periodic cash flow being discounted to PV using the WACC. The result of the
discounting does not allow for the calculation of forecasted interest payable over
the development project’s cash flow, and creates a limitation on the practical use
of a DCF methodology in determining a projects’ future cashflow requirements
(Havard, ). Specifically, this problem arises because the WACC is used as
the discount rate and is not entered as a specific project cost. Additional
limitations are offered by Gimpelevich ( ), Atherton et al. ( ) and Young
( ) which include the difficulty in determining and selecting an appropriate
discount rate as well as the difficulty in determining future income and expenses
and also estimating an appropriate terminal value. Often the shortcoming of the
DCF method are addressed through the extensive use of sensitivity analysis
(Gimpelevich, ). The DCF method represents a quantifiable method of
determining a site or project’s value, but ultimately ends up in an intuitive
judgement as the key discount rate is chosen based on the analyst's experience
(Baroni et al., ).
3.6.4Residualaccumulationcashflowmethod
The residual accumulation cash flow method (RACFM) is similar to the DCF
method but differs in when and how discounting occurs and the calculation of
interest (Havard, , p. ). It should be noted that the specific term of
residual accumulation cash flow feasibility method is rarely used in practice, but

Chapter3:DecisionMakingandDeterminingViabilityinDevelopmentProjects
MATTHEW MOORHEAD 99
accurately describes the process a method of determining project viability. This
method may falsely be ascribed as the DCF method, but significant differences
exist. Finance charges are calculated on the cumulative cash‐flow at for each
period based on the project’s expected weighted average cost of capital (WACC)
and expected loan to value ratio (LVR) or in the case of property development
projects the Loan to development cost ratio (LDCR) (Havard, ; Isaac et al.,
, ). The FV residual value at the end of the cash‐flow is then discounted
back to a PV using the appropriate discount factor.
An advantage of the RACFM method is that it allows the project analyst to make
a more accurate estimation of project cashflows in specific cash flow periods and
estimate the projects capital requirements (Havard, , p. ). The DCF
method often assumes full borrowings and discounts the cash flow by the
projects WACC, where the RACFM method allows for the provision of specific
debt and equity arrangements to be modelled (Havard, ). It should also be
noted that both cash flow methods can be calculated in a single Microsoft Excel
worksheet. The DCF method allows for the determination of a project NPV,
while the RACFM allows for the forecasting of inflows and outflows for each
specific cash flow period. As discussed in Chapter in the research questions,
this research aims to assess the level of adoption of the different feasibility
methods and particularly the use of specific land valuation methods.
3.6.5Marketcomparisonmethodofdetermininglandvalue
An additional method of determining the value of a proposed site (or land) for a
potential property development project is the market comparison method. This
method relies on the substitution effect inherent as an economic process of
knowledgeable individuals choice in order to create an efficient market (Wyatt,

MATTHEW MOORHEAD 100
). This method can be defined as ‘selecting comparable properties on the
basis of their elements of comparison which includes key transaction
information such as date, price paid, market rent, and yield’ (Wyatt, , p. )
Decision‐makers involved in the acquisition stage of the development process
may choose to examine multiple sales of similar property development
transactions in order to help guide their view regarding a site’s value. This thesis
will investigate the use of the market comparison method of determining site
value in an empirical survey.
3.7Summary
The purpose of this chapter was to provide a review of the literature and theory
regarding the practice of determining project viability in property development
projects through the use of feasibility analysis. The recent history and evolution
of feasibility analysis practices for property development were also discussed.
The practical aspects of completing a feasibility analysis for a project has also
been addressed. Decision methods and hurdle rate selection were discussed and
past research concerning the application and use of hurdle rates in decision
making literature was reviewed. Particular methods of determining site value
were discussed including the traditional static residual land value method, the
dynamic methods of discounted cash flow and the residual accumulation cash
flow method and the market comparison method. Chapter will review risk and
uncertainty in relation to property development projects and Chapter will
discuss the research methodology.

Chapter4:Risk&UncertaintyinPropertyDevelopmentDecisionMaking
MATTHEW MOORHEAD 101
Chapter4:Risk&UncertaintyinPropertyDevelopmentDecisionMaking
4.1Introduction The prior chapters have explained the development process and examined the
role of feasibility analysis in property development decision‐making. This
chapter will provide an overview of how risk and uncertainty are present in
property development projects and outline key literature concerning the
identification, measurement and evaluation of risk. As this research is primarily
concerned with the detection and management of potential risks at the pre‐
commitment stages of the development process, specific risk analysis methods
commonly used in feasibility analysis will be reviewed. Additionally, this chapter
will provide a background of the evolution of the theory of the identification of
risk and uncertainty. Finally, methods and strategies for risk transference by
project development companies will also be considered.
In order for a property development project to be considered successful, the
project must meet key objectives, and development managers must be prepared
to assume risks and face uncertainty. Risk identification, measurement and
management practices in the area of property development practice have
increasingly become more significant as a result of past financial crises and the
rising complexity of the property market (Weigelmann, ). Risk management
as a practice includes the undertaking of risk identification, measurement of the
outcome of identified risks, transfer of risk to others when feasible and the
costing and management of risks that are retained and cannot be transferred

Chapter4:Risk&UncertaintyinPropertyDevelopmentDecisionMaking
MATTHEW MOORHEAD 102
(Regan et al., ). Leading property developers in Australia have
acknowledged that ‘improving risk identification and management practices are
essential to maintaining their discipline while bidding for work and undertaking
projects’ (Newell & Steglick, , p. ). In fact, the ability to recognise,
measure and manage the risk of a project and plan for uncertainty in the
development process are essential for effective decision making as the benefits
of decisions are weighed against the costs related to bearing and managing them
(Rodger & Petch, ).
Before delving into the processes of risk identification and management
practices within the property development industry, it is important to explore
the roots of risk management theory and explain the differences between risk
and uncertainty. The concept of risk is often bound up with the term uncertainty,
and it is necessary to separate the terms. Risk can be defined as an occurrence of
a future event that may produce an outcome different from what was anticipated
(Regan, ). Both risk and uncertainty highly influence a development
project's success or failure, so it is imperative that decision‐makers have the
ability to be able to identify and manage risk and use quantitative tools, such as
probability analysis, to give some predictability to key variables (Csiszar, ).
Uncertainty cannot be managed but can be planned for in many circumstances.
In relation to identified risks, in most applications, these can be predicted with
accuracy, but sample size and limited data will compromise the outcome (Regan
et al., ; Mintah et al., ).
Frank Knight in his work entitled Risk, Uncertainty, and Profit made a key
distinction between risk and uncertainty in considering whether the likely
occurrence of an event can be measured. This idea of separating those events
where a probability of occurrence can be assigned from those that cannot
created a key milestone in risk management theory. Though Knight’s works are
Chapter4:Risk&UncertaintyinPropertyDevelopmentDecisionMaking
MATTHEW MOORHEAD 103
often debated in relation to their true meaning, it is often interpreted to be that
risk is an event where the outcome can be measured, whereas in uncertainty the
outcome of the event cannot be directly measured (Friedman, ). In this view,
risk applies to situations where the outcome is unknown, but we can accurately
calculate the event’s likely occurrence (Knight, ; Langlois & Cosgel, ;
Friedman, ).
Another common interpretation of Knight’s work is that the distinction between
risk and uncertainty arises not because there is no basis for assigning
probabilities to events, but because there is not a reasonable way of classifying
the likely outcomes of the event (Langlois & Cosgel, ). Taking this
interpretation of Knight’s work, a risk to a development project can be described
as whether a project meets the targeted income, cost and timing variables by an
anticipated date. The outcomes of this event are known, either the forecasted
variable was achieved and, if not, then the consequences are known and can be
measured in terms of financial gain or loss. A specific example that is often
considered critical to a project’s success would be achieving the required pre‐
sales percentage level required for institutional funding before the construction
phase of the development cycle. The result of failing to achieve the desired pre‐
sales results in the project not procuring the finance needed to commence
construction and this outcome can be specifically measured. As the outcome can
be measured, the probability of a risk event can generally be ascertained using
statistical and actuarial estimation methods (Regan, ; Coiacetto & Bryant,
).
The example above of a risk event can be contrasted with an example
demonstrating uncertainty, where the outcome categories are unknown. Risk
can be distinguished from uncertainty which can be described as the occurrence
of an unexpected event. Examples of uncertainty include civil unrest(in some

Chapter4:Risk&UncertaintyinPropertyDevelopmentDecisionMaking
MATTHEW MOORHEAD 104
countries), natural disasters and political upheaval, where it is not possible to
undertake reasonable probability estimation (Regan, ). In such a scenario,
the outcome of the project as a result of the uncertain event remains unknown
and unmeasurable (Langlois & Cosgel, ). The distinction between risk and
uncertainty emphasises a very important aspect of property development and
feasibility analysis, being that of distinguishing between variables that represent
risk and variables that represent uncertainty. Often uncertainty arises out of
having partial knowledge, which could be attributed to many variables in a
property development project and needs to be addressed (Langlois & Cosgel,
; Knight, ).
In cases of uncertainty, decision‐makers in property development projects are
required to fall back on judgement and intuition as well as information at hand.
French and Loizou ( ) argued that even when development appraisers utilise
quantitative methods of analysis such as Monte Carlo simulations to put
boundaries around the consequences of risk, they are based on the analyst’s
heuristic intuition. Additionally, it is recognised that increases in uncertainty
can affect the behaviour of the decision‐maker, making them less likely to begin
a new project (Bloom, ), and can cause a downturn in the construction and
development industry (Bloom et al., ).
The difference between judgement and intuition can be described, in relation to
a property development organisation’s decision structure, as a process of ‘logic
by recognizing that the former is not reasoned knowledge, but judgement,
common sense or intuition’ (Knight, , p. ). Byrne ( ) describes
uncertainty, as separate from risk, in that it is anything that is not known about
the outcome of a venture at the time when the decision is made. When risk is
taken to be the measurement of a loss, identified as a possible outcome of the
decision (Byrne, ). The separation of the two terms allows for the isolation

Chapter4:Risk&UncertaintyinPropertyDevelopmentDecisionMaking
MATTHEW MOORHEAD 105
of variables that have a degree of uncertainty from the overall riskiness of the
project from the perspective of the decision‐maker.
4.2Historyofriskmanagementtheory
When looking at the foundations of risk theory, one is taken on a journey
through human history and soon comes to the understanding that this topic is
central to people’s most primal beliefs. The origins of risk theory are found in
the transition from a fatalist’s view to that of a reasoned understanding of the
sovereignty of humankind and to that of being in control of one’s destiny
(Bernstein, a). Prior to this understanding, it was generally believed that
the locus of control lied with a great power and the outcome of events were pre‐
ordained. From the understanding that events can be either random or under
the control of people to an understanding of probability and utility theory
emerging (Bernstein, b).
4.3Riskmanagementanduncertaintyatthepre‐commitmentstagesofthedevelopmentprocess
This section provides an overview of the application of risk management theory
and specifically risk identification practices as well as the planning for project
uncertainty during the pre‐commitment stages of the property development
process discussed in Chapter as well as a discussion of Prospect Theory.
4.3.1ProspectTheory
A key distinction between risk and uncertainty was introduced by Tversky and
Pollatsek in a Theory of Risk, where risk is regarded as a characteristic of options
or events which can be meaningfully ordered for riskiness. Prospect theory states
that the risk of an event is related to the variance of its outcomes (Pollatsek &
Tversky, , p. ). Prospect theory is distinct from Coombs’ theory which
postulates that individuals have an ideal risk level and that when choosing

Chapter4:Risk&UncertaintyinPropertyDevelopmentDecisionMaking
MATTHEW MOORHEAD 106
between equal probability events, the individual selects the event that is closer
to their ideal risk level (Coombs, ).
It is generally accepted that Tversky and Pollatsek are demonstrating that risk is
not simply intuitive or a perception which is closer to what would be referred to
as uncertainty but is mathematically quantifiable and able to be measured and
ordered as the probability of occurrence of a series of options. Since risk can now
be quantified, it can then be applied to risk management techniques to deal with
the probable quantifiable outcomes of a risk event. Total risk can also be defined
in the following formula:
.
𝑅𝑡 𝑅𝑓 𝑅𝑝
Where:
Rt = total risk
Rf = risk‐free rate of return
Rp = risk premium
(Regan, )
An example of the quantification of risk to a property development feasibility
analysis would be the defining of a probability of a change in a forecasted
variable and measuring the impact of this change once applied to the project.
Another key factor affecting the developer is the aspect of time which further
changes the probability of specific events happening (Dixit & Pindyck, ).
Figure . . illustrates the outcome of running , Monte Carlo simulations
using Oracle’s Crystal Ball on the forecasted construction costs of a development
project and the impact of this change on the projects MDC percentage.
The construction costs were forecasted using a log‐normal distribution as
construction costs are more likely to run overbudget than underbudget on
development projects (Mbachu & Cross, ; Larsen et al., ). The mean

Chapter4:Risk&UncertaintyinPropertyDevelopmentDecisionMaking
MATTHEW MOORHEAD 107
forecasted MDC percentage for this project was approximately % but ranged
from % ‐ % with the distribution tails having a very low probability of
occurring. This analytical exercise helps to put boundaries around the outcome
of a project given a risk event occurring.
Figure 4.3.1: Monte Carlo probability simulations of the MDC% change of a project as a result of a change in construction cost
(Source: Author, )
4.3.2Distinctivecharacteristicsofpropertyasanassetclass
To investigate the decision‐making processes of property developers and how
they address both uncertainty and risk, it is important to have an understanding
of some of the unique characteristics that make real property assets different
from other asset classes, and how these characteristics influence the levels of risk
in property development projects.

Chapter4:Risk&UncertaintyinPropertyDevelopmentDecisionMaking
MATTHEW MOORHEAD 108
In regards to influencing the property development process and decision making,
there are a number of important and unique attributes of real property that
distinguish this asset class which includes interalia,
1. Long‐term supply lag in the creation of improvements to real
property.
2. Large capital expenditure is usually a requirement.
3. The presence of externalities including the indivisibility and fixed
location of assets.
4. High transaction costs associated with the acquisition, disposal
and permissions required in many jurisdictions.
5. Due to the lease provisions common in renting real estate,
income is highly correlated with inflation, thereby creating a
hedging effect.
6. Regarding large commercial, retail and industrial assets,
infrequent valuations and a small number of sales transactions
have the effect of smoothing prices and understating volatility.
7. Improvements on land are a depreciating asset with a limited life
that gives rise to certain taxation and capital characteristics.
8. Diversification benefits of property and REITs.
(Baum, 2012, 2015)
a.Thesupplylaginpropertymarkets
The development process including obtaining permissions, design and
documentation and the construction of buildings is a complex set of activities
that are also highly labour intensive (Reed & Sims, ). Due to these factors,
the timeframe for a development project can often extend for many years.
During the market analysis stage of the property development process, the

Chapter4:Risk&UncertaintyinPropertyDevelopmentDecisionMaking
MATTHEW MOORHEAD 109
developer is actively trying to forecast the demand many years into the future
and trying to bring on specific supply to meet the forecasted demand. The
vulnerability of this process to changes in the market, oversupply from other
players in the industry, internal and external economic shocks, and legislative
and political currents often leads to an imbalance in supply and demand (Isaac
et al., ). This imbalance is a major contributor to the property cycle as the
market fluctuates from undersupply to oversupply in response to the broader
economic environment and the credit cycle. The supply of real property is highly
inelastic whereas the demand for real property is highly elastic (Baum, b;
Baum. ).
The supply lag combined with the highly elastic demand curve for real property
greatly increases the risk inherent in property development projects. A major
question property developers must answer is will the demand for which you are
designing a project for today be dramatically changed when the project is
delivered to the market (Havard, )? The transference of this risk is possible
in some forms of development where a buyer is sourced for the completed
product before the commencement of a project (Staiger, ). In residential
speculative property development, this would involve the requirement to
achieve a fixed percentage of pre‐sales that would be targeted before receiving
construction funding. Many funders in Australia require % of the debt
funding to be covered by pre‐sale contracts to transfer risk away from the
developer to the buyer (Bryant, ). A primary purpose for the requirement of
pre‐sales includes the mitigation or transfer of risk prior to financiers making a
formal commitment.

Chapter4:Risk&UncertaintyinPropertyDevelopmentDecisionMaking
MATTHEW MOORHEAD 110
b.Transactionsinpropertyrequirelargecapitalcommitments
The large amounts of either equity and/or debt capital required to transact
property assets are often many times larger than any other asset class (Rowley et
al., ; Miles et al., ). Share markets, bond market, derivatives,
commodities, interest‐bearing securities and other asset classes often have the
inherent advantage of being highly divisible and intangible as a physical asset
that can make the transaction process much easier. Commercial and retail
properties can in many instances exceed a billion dollars in a single transaction.
In an attempt to transfer the increased risk to large capital commitments and
the lack of liquidity in real property, developers have adopted the use of strata
titling and asset securitisation to try and overcome some of these disadvantages,
but the vast majority of real property is transacted under a single title.
Additionally, ‘development is all about risk and return; debt finance helps reduce
the risk for the developer and allows those without the upfront capital to
undertake projects’ (Rowley et al., , p. ).
c.Indivisibilityandfixedlocationofassets
Real property assets have a fixed location (except in rare circumstances such as
moving a house on stilts) that cannot be moved to a more advantageous location.
Despite the more recent rise in the securitisation of real property assets, the legal
and regulatory requirements in accessing this form of legal structure render the
cost and ability beyond most investors and developers do to the licensing and
compliance requirements. The risk inherent to a specific market often cannot be
diversified away due to the capital limitations of firms, and the labour intensity
of their projects render this impossible (Baum, ). So, with specific risk
among other types of risk being very high, the decision process and selection of
projects becomes even more significant.

Chapter4:Risk&UncertaintyinPropertyDevelopmentDecisionMaking
MATTHEW MOORHEAD 111
d.Hightransactioncostsassociatedwithacquisitionanddisposalofrealpropertyassets
The process of acquisition and disposal of land and any improvements has a high
level of associated costs (Ibbotson & Siegel, ). For example, in Queensland
Australia, the acquisition perspective, purchasing property development sites in
Australia will commonly incur costs of approximately % ‐ % of the contract
price (McCluskey & Franzsen, ). This cost primarily comprises stamp duty
and includes site inspection, legal fees and conveyancing.
The disposal cost of real property assets including sales commissions, marketing
and legal costs is generally accepted to be in the range of % to % of the contract
price. With high entry and exit costs in the property market, the risks associated
with making a poor decision, or a change of mind regarding the acquisition of a
development site, are increased beyond the risks associated with transacting
other assets classes such as shares, bonds or cash.
e.Realpropertyassetrentalyieldsareregulatedbyleaseswhichprovideaninflationhedge
The process of having a well‐defined body of legislation and a long history of
common law adds a unique aspect to real property. Leases specify the amount,
periodicity and time frame for rental income which smooths out the volatility of
investment yields. Particularly for commercial, retail and industrial property
leases, there is often a clause enabling increasing rental income in line with
inflation. ‘Real estate yields are thought to reflect risk‐free rates of return, a risk
premium and expected growth in cash flows’ (Baum et al., , p. ). Research
has shown that property values are ultimately linked to the rental income
derived from the property, and this then gives rise to real property having an
inbuilt inflation hedge (Baum, ). This aspect of property as an asset class
gives lenders a higher level of confidence into the serviceability of debt over
Chapter4:Risk&UncertaintyinPropertyDevelopmentDecisionMaking
MATTHEW MOORHEAD 112
property and also contributes to the low cost and relatively high levels of
leverage available for property acquisition (Huston, ). The well‐defined
body of law that govern the income streams of property helps transfer the risk of
a project by allowing for pre‐leasing activities before project commencement
(Fuerst & Matysiak, ; Leiser & Groh, ).
4.4Riskidentificationpracticesinpropertydevelopment
4.4.1Anoverviewofuncertaintyandriskinthedevelopmentprocess
The property development process is inherently risky and therefore requires a
correspondingly high reward in the form of profit for decision‐makers to make
a formal commitment (Byrne, , ; Havard, ; Miles et al., ;
Newell & Steglick, , Gehner, ; Rowley et al., ). When examining
the past returns of property development projects, profit levels and return on
equity can range from incredibly high profits to very large losses, making the
standard deviation of returns exceptionally wide (Havard, ). There are a
number of reasons given in the literature that offer explanation for this
phenomenon including the long supply lag in the built environment requiring
long forecasting of many variables, the sensitivity of the financial outcome of a
project to key input variables and the scale and complexity of inputs to many
projects (Cadman & Topping, ; Havard, , Gehner, ).
There are some aspects of uncertainty that are, to an extent, within the
developer’s control, and can be identified, measured and contained. Others are
much more difficult to control and analyse and must be accepted as part of the
risk of development (Byrne, ). Time is another major factor influencing the
uncertainty and risk in development projects. It is a commonly accepted part of
the development process that as a project proceeds from one stage to another
the degree of certainty increases while the freedom for making changes is

Chapter4:Risk&UncertaintyinPropertyDevelopmentDecisionMaking
MATTHEW MOORHEAD 113
reduced (Byrne, ; Newell & Steglick, ). The simplest and shortest
development projects rarely involve a timeframe of less than six months but
most projects involve many years. Greenfield land subdivision projects, for
example, can often spread over many years. A small number of projects will span
decades, with a local example being Stockland Ltd.’s Aura development in
Caloundra, Queensland; which has a development timeline of approximately
‐ years (“Stockland starts construction of Aura,” ( ).
Feasibility analysis during the pre‐commitment stages of the development
process occurs at the beginning of this time frame yet necessitates the
assumption and use of variables across the entire development timeline. These
variables have a high degree of uncertainty and are much more difficult to
control and analyse and must be accepted as part of the risk of development
(Byrne, ; Uher & Toakley, ). Also, due to the inelasticity of supply and
development time lag between the conception of the project and its completion,
property development is especially vulnerable to changes to social, economic
and financial factors (Baum, ; Byrne, ). Newell & Steglick ( ) also
identified the top ten development risk factors ranked in a survey of publicly
listed Australian property developers which are identified in Table . .
If there existed a hypothetically perfect development project that would improve
the environment, cure all social problems in the locality, create a high level of
economic profit for the developer and also enjoys complete political and
community support there would still be a high degree of uncertainty and risk
involved in such a project. By adding the elements of time, there is the risk of a
change in the assumption variables such as market price and/or construction
cost which could cause this project to fail. The occurrence of an economic shock
during the development process, once a formal commitment has been made and
the project commenced, means it is increasingly difficult to make changes to the

Chapter4:Risk&UncertaintyinPropertyDevelopmentDecisionMaking
MATTHEW MOORHEAD 114
project (Herring & Wachter, ; Hilbers et al., ). An example of this
occurring in the Australian market, is Juniper Development’s Soul project
situated on the Gold Coast Queensland, where the pre‐commitment stages of
the development process occurred prior to the GFC, the construction occurred
during the downturn in the property cycle and the final stages of the
development process occurred during the recovery in the property cycle. Such a
situation arises when new supply comes onto the market at a time when the
demand characteristics that justified the project at the beginning of a
development timeline have changed, exacerbating the effects of the property
cycle in line with the boom/bust nature of property development (Baum, ,
; Key, ). By selecting those elements which a developer has some
control over regarding uncertainty, the analysts can be in a better position to
make informed decisions (Byrne, ).
Table 4.4: Top 10 property development risk factors
(Source: Newell & Steglick, , p. )

Chapter4:Risk&UncertaintyinPropertyDevelopmentDecisionMaking
MATTHEW MOORHEAD 115
4.4.2Theriskanalysisprocessindeterminingapropertydevelopmentproject’sfeasibility
Savvides ( ) outlined a risk analysis process for feasibility analysis and project
appraisal which is illustrated in Figure . . . The first step is ‘the requirement
for a robust model capable of predicting correctly if fed with the correct data’
(Savvides, , p. ). It is worth noting that all future based data will be a
forecast in nature and therefore, will have a margin of error. This step requires
the analyst to prepare a traditional feasibility analysis using expert opinion,
known revenue and costs and the analyst’s experience as the best estimate of the
input variables for the project. The output of the traditional feasibility analysis
will give either a fixed dollar profit for the project or result in a residual land
value if the analyst is choosing to determine site value.
The second step is to complete a single variable sensitivity analysis on key
variables where a change in the variable has a large impact on the overall
outcome of the project. This may include sales value projections and
construction costs, which are two key input variables that are known to have a
significant impact on a project’s overall profitability (Crudden, ; Havard,
). Sensitivity analysis is used to ‘identify the most important variables in a
project and measures the responsiveness of the project result by a fixed deviation’
(Savvides, , p. ). A key limitation of sensitivity analysis is that the
percentage of deviation of each variable is subjective to the opinion of the analyst.
The third step in the process is to complete the probability distribution and
define the limits or ranges of the key variables. During the third stage it is
important to limit the probability analysis to only the most important variables
as described by Savvides ( , p. ).

Chapter4:Risk&UncertaintyinPropertyDevelopmentDecisionMaking
MATTHEW MOORHEAD 116
The reason for including only the most crucial variables in a risk analysis
application is twofold. First, the greater the number of probability
distributions employed in a random simulation, the higher the likelihood of
generating inconsistent scenarios because of the difficulty in setting and
monitoring relationships for correlated variables.
Another requirement at this stage is to estimate the range of uncertainty
regarding the key variables that will be tested in the probabilistic simulations.
This can be obtained by either expert opinion or by analysis of past projects. At
this point in the development process, some inputs may have reduced
uncertainty as they may be governed by contractual relations. For example,
construction costs being locked in a fixed‐priced method of procurement will
reduce the level of uncertainty regarding the cost and profitability of the project.
Additionally, other costs can be locked into a project early on in the development
process. Other methods of obtaining the range of uncertainty within variables
include the use of the Delphi Method or relying on external research and advice
(Hughes, ; Crudden, ).
The fourth step is to make an allocation of probabilities to the chosen key
variables in the analysis. The figures used in the traditional feasibility analysis
are often the starting point at this stage as described below by Crudden ( , p.
):
Since there is a ‘most likely’ outcome for a variable (this will be the single value
used in deterministic analysis), it follows that other ‘less likely’ outcomes must
have a lower probability of occurring. Ascribing probabilities to these
outcomes is what differentiates stochastic analysis from the conventional,
single number, deterministic approach.

Chapter4:Risk&UncertaintyinPropertyDevelopmentDecisionMaking
MATTHEW MOORHEAD 117
Each value within the predetermined range of variable outcomes has an equal
chance of occurrence. Probabilities are allocated to fit a distribution curve within
that range. The curve may be log‐normal as in the case of sales values per m
when the likely hood of a decrease is greater than that of an increase and where
the value cannot go below zero. Other types of distribution curves include
normal Gaussian, triangular, uniform, discrete or binary (Doucet et al., ).
The outcome of this stage is essentially that ‘distribution profiles are used to
express quantitatively the beliefs and expectations of experts regarding the
outcome of a particular future event’ (Savvides, , p. ).
Figure 4.4.2: Risk analysis process for investment appraisal
Source adapted from: Savvides ( , p. ) and Crudden ( , p. )
Chapter4:Risk&UncertaintyinPropertyDevelopmentDecisionMaking
MATTHEW MOORHEAD 118
The fifth step in the risk analysis process is to identify correlations between key
variables. Two or more variables can be considered to be correlated if the
variance of their values moves together in a systematic manner (Savvides, ).
The problem with the correlation between variables in feasibility analysis and
probabilistic simulations is that such correlations violate the required principle
of randomness. For example, the sales commission paid on residential real estate
transactions is often based on a percentage of the contract price and therefore
would be highly correlated with the sale revenue forecasted in feasibility analysis.
The inclusion of highly correlated variables can lead to ‘a biased and distorted
outcome that is off‐target’ (Savvides, , p. ). Where possible, it is best to
avoid such correlations and combine variables that may be highly correlated
before running the simulations.
The sixth step is to run Monte Carlo stochastic simulations to determine the
probability of the outcomes for the key variables and also the impact on the
project’s required hurdle rates. Finally, step seven involves analysing the results
and cumulative probabilities of different outcomes for the project. This allows
the decision‐maker to move away from fixed‐point profit and hurdle rate
outcomes and look at the results as a range with associated probabilities.
The most commonly used risk analysis methods utilised within the property
development industry will be discussed in section . after a discussion of risk
attitudes and mitigation strategies in section . . .
4.4.2Summaryofpriorstudiesoftheriskanalysispracticesofpropertydevelopers
Prior studies have surveyed the risk management attitudes and the risk analysis
tools used by those in the property industry. Newell and Steglick ( )
surveyed leading property development companies listed on the Australian

Chapter4:Risk&UncertaintyinPropertyDevelopmentDecisionMaking
MATTHEW MOORHEAD 119
Stock Exchange (ASX), finding that ‘property developers use a range of
sophisticated quantitative and qualitative procedures to assess the various
elements of property development risk’ (Newell & Steglick, , p. ). Their
research also found the use of standardised risk analysis techniques being used
in decision‐making by Australian developers included preparing a financial
feasibility model ( %), the use of specific financial hurdle rates ( %), the
use of sensitivity analysis ( . %), the use of DCF models ( %), the use of
probability models ( . %), and the use of risk simulations ( %) (Newell &
Steglick, , p. ).
Wiegelmann ( ) and Gleibner & Wiegelmann ( ) analysed the results of
a survey of European property development firms concerning their risk
management processes and attitudes. This research found the use of
standardised quantitative risk assessment methods included sensitivity analysis
( . %), scenario analysis ( . %), Monte‐Carlo simulations ( . %) and the
value at risk method ( . %). Additionally, this research found European
developers typically used a largely intuitive approach to risk assessment and did
not necessarily stick to rigid structures of analysis. Finally, the results of the
survey revealed that decision‐makers in European development organisations
viewed their firm as having a similar to slightly risk‐averse risk tolerance
perception in relation to their competitors.
Lyons and Skitmore ( ) surveyed project risk management practices in the
Queensland engineering and construction industry which included a small
number of property developers. This research found, among property developers,
a high level of risk tolerance, very high levels of intuition and judgement in risk
analysis and high levels of quantitative risk analysis methods. Additionally, a
sensitivity analysis was the predominant method used with lower levels of usage
for Monte‐Carlo simulation and probability analysis.

Chapter4:Risk&UncertaintyinPropertyDevelopmentDecisionMaking
MATTHEW MOORHEAD 120
Uher and Toakley ( ) surveyed the risk management practices in the
conceptual phase of commercial development construction projects. Their
research focused on stakeholders involved in the construction and development
industry in Australia, of which of the respondents were property
developers, with the majority of respondents being construction managers,
quantity surveyors or government employees. The survey found property
developers had a higher level of risk‐taking than other stakeholders in relation
to attitudes to risk which is higher than that found in other studies. It should be
noted that the different periods of time of various studies may account for the
difference in risk attitude and perception.
Gehner ( ) researched a number of Dutch real estate development
organisations and found that developers knowingly take risks in projects and
that the core of their business is making decisions by taking on risks to derive a
return. Additionally, this research described a justifiable investment decision as
‘taking a risk in the context of real estate development is achieved by following
a procedural rational decision process, which results in a timely, justifiable and
accountable investment decision’ (Gehner, , p. ).
As described in Chapter , Preller ( ) surveyed Queensland property
development organisations about their decision‐making and feasibility practices
in the preliminary stages of the development process. This research found that
% of respondents completed sensitivity analysis and some form of risk
analysis in their feasibility analysis.
Hutchison et al. ( ) conducted a survey of UK property development and
property investment organisations and found that few respondents had risk
analysis embedded in their decision‐making process. However, this research
found that most respondents utilised some form of sensitivity analysis, and many

Chapter4:Risk&UncertaintyinPropertyDevelopmentDecisionMaking
MATTHEW MOORHEAD 121
incorporated some form of scenario analysis with a particular focus on downside
risk. Additionally, they found only one respondent regularly used Monte Carlo
approaches and a few had tried stochastic simulation techniques but had
abandoned their use in favour of more informal techniques. This research found
‘no use of (and little awareness of) real option approaches’ in decision making
(Hutchison et al., , p. ). This report also investigated the use of
quantitative probabilistic frameworks in project risk analysis, with more reliance
on experience and judgement for setting variable parameters and also the use of
qualitative frameworks and investment committees (Hutchinson et al., ).
Another important observation from this research was the finding that larger
organisations were more likely to have robust risk analysis systems in place and
smaller firms were more reliant on informal approaches. This result will also be
investigated from the Australian perspective in this research.
This section has reviewed prior research concerning the risk analysis methods
used by property development organisation, and the following section will
provide an overview of common risk analysis methods used by property
developers in the industry.
4.5Commonmethodsusedinfeasibilityanalysistoaddressuncertaintyandriskinpropertydevelopmentprojects.
Developers need to question the input assumptions that are used to determine
the potential project’s viability. Opera ( ) argued that it is these assumptions
which underpin the very basis of viability and form the key indicators of
uncertainty for a given project. French and Loizou ( ) found that uncertainty
is an integral part of the overall development process and also needs to be
reflected in the development appraisal. As traditional feasibility analysis models
in the property development industry focus on a fixed‐point method of
determining viability, it is necessary to explore how changes to these variables
Chapter4:Risk&UncertaintyinPropertyDevelopmentDecisionMaking
MATTHEW MOORHEAD 122
would affect the outcome of the project. Without this process, if the developers’
forecasts are over‐optimistic, then the residual value of the land and the
expected profitability of the project will be overestimated, thereby reducing the
expected risk in the project (MacFarlane, ). Methods commonly used to
help assess the impact of a change in variables include single variable sensitivity
analysis, multiple variable scenario analysis and Monte Carlo simulations
(Khumpaisal & Abdulai, ).
4.5.1Sensitivityanalysis.
The recognition of sensitivity implies an acknowledgement of uncertainty. The
development process involves dealing with many uncertainties that are
problematic when approached from the standard industry‐accepted feasibility
analysis methods. Commonly accepted models give equal weighting to the
importance and impact of different variables and are deterministic in nature
(Byrne, ). A complete analysis would include a thorough investigation of
the level of uncertainty inherent in each of the input variables that were used to
determine project viability. These can include income variables such as market
capitalisation rates, net operating income, sales forecasts and costs inputs
including financing (French & Loizou, ). Projects often have a high degree
of sensitivity to a small change in key variables as each possesses a degree of
uncertainty. Havard ( , p. ) offered an explanation for such high sensitivity
to changes in input variables in the following:
The reason for this is that the outcome of the development appraisal is actually
the marginal difference in the ratio between costs and value. A slight change
in this ratio can cause a major percentage difference in this marginal outcome.

Chapter4:Risk&UncertaintyinPropertyDevelopmentDecisionMaking
MATTHEW MOORHEAD 123
The occurrence of a risk event may be measurable and the likelihood of
occurrence very small, but the impact of the event can have a major impact on
the key project hurdle rates (Havard, ; Huston, ). This effect is also
magnified by the heavy use of leverage in development projects due to the
characteristic of very high capital costs involved (Rowley et al., ; Bryant,
). Property development projects are subjected to inputs with a high level
of variance such as rents, yields, sales $ per square metre which have a
disproportionate impact on a project’s gross realisation (Havard, , Baum et
al., ).
Development appraisals are prepared on the basis of estimates because actual
figures are not available and external information is sought regarding variables
to reduce the levels of uncertainty as much as possible. All development
appraisal is an act of forecasting which cannot be avoided and all forecasts have
a degree of uncertainty and error (Byrne, ). The process of determining the
assumption variables is deterministic and that the analyst must choose the best
estimates available. Often this information comes from current prices and sales
available today and then a form of escalation is applied until the point in time
when the cost or income will likely be incurred (Havard, ).
A sensitivity analysis can be defined as changing a variable singularly by a set
percentage that is often incremental and determining the impact of this change
on the key financial metrics of the project (Havard, , p. ). In relation to
the pre‐commitment stages of the development process, the chosen project
hurdle rates that are used for determining the go/no‐go decision are used as the
financial metric. This process will give the analyst the ability to determine which
key input variables will have the greatest influence on the decision to proceed.
Additionally, the break‐even point for a project is often measured to determine
the impact of pre‐determined percentage changes in key variables before the

Chapter4:Risk&UncertaintyinPropertyDevelopmentDecisionMaking
MATTHEW MOORHEAD 124
project would become unprofitable. Common variables chosen for sensitivity
analysis include sales rates $ per square metre, rental $ per square metre, yields,
capitalisation rates, construction costs, interest rates and residual land values
(Havard, ; Miles et al., ).
Sensitivity analysis aims to identify the key variables that will most affect the
outcome of the project, the dual purpose being:
. To place these variables clearly before the decision‐maker so that, as and
if the development proceeds, these critical variables can be particularly
watched for changes which may affect overall viability.
. To enable the values of the variables put into the model to be considered
more carefully so that as far as possible their values are ‘best estimates’ of
their performance. (Byrne, , pp. ‐ )
Table 4.5.1: Single variable sensitivity analysis
Source: Author,
Original VariablesSales Value $5,500,000
Profit (FV) $907,911
Cost of Capital ‐$61,315
Construction Cost ‐$1,733,550
Development Cost Including Interest ‐ Ex Land & Acquisition ‐$2,517,089
Development Cost Inc Interest + Including Land & Acquisition ‐$4,092,089
Gross Realisation $5,000,000
Land Value including Acquisition ‐$1,575,000
Change in Sales Value
$ Sales Value $ GST $ Net Sales % Change $ Development Cost $ Profit MDC %$5,775,000 $525,000 $5,250,000 5.00% ‐$4,092,089 $1,157,911 28.30%
$5,720,000 $520,000 $5,200,000 4.00% ‐$4,092,089 $1,107,911 27.07%
$5,665,000 $515,000 $5,150,000 3.00% ‐$4,092,089 $1,057,911 25.85%
$5,610,000 $510,000 $5,100,000 2.00% ‐$4,092,089 $1,007,911 24.63%
$5,500,000 $500,000 $5,000,000 0.00% ‐$4,092,089 $907,911 22.19%
$5,390,000 $490,000 $4,900,000 ‐2.00% ‐$4,092,089 $807,911 19.74%
$5,335,000 $485,000 $4,850,000 ‐3.00% ‐$4,092,089 $757,911 18.52%
$5,280,000 $480,000 $4,800,000 ‐4.00% ‐$4,092,089 $707,911 17.30%
$5,225,000 $475,000 $4,750,000 ‐5.00% ‐$4,092,089 $657,911 16.08%
$4,501,298 $409,209 $4,092,089 ‐18.16% ‐$4,092,089 Breakeven 0.00%

Chapter4:Risk&UncertaintyinPropertyDevelopmentDecisionMaking
MATTHEW MOORHEAD 125
Table . . demonstrates a simple single‐variable sensitivity for a hypothetical
project analysing a change in sales from ‐ % to + % in pre‐determined . %
increments. This sensitivity analysis demonstrates that the hypothetical project
demonstrates that even a relatively small change in the sales values forecasted
would have a significant effect on the profitability of the project in units of
MDC %. Additionally, this sensitivity illustrates that the breakeven point for the
project would be a fall in projected sales values of per cent. If the required
hurdle rate for this project was % MDC, then a % drop in the forecasted sales
values would deem the project unacceptable. In order to improve the outcome
of the sensitivity analysis, the analyst will often include a more dynamic form of
modelling with the use of ‘what‐if’ scenarios and probability distributions of key
variables.
4.5.2ScenarioAnalysis
Scenario analysis takes sensitivity analysis one step further in order to address
‘what‐if’ questions. By allowing multiple variables to be changed the analyst is
able to address the interdependence of many input variables. It is generally
accepted that there are two types of scenario analysis commonly used in the
development industry and these are simple or basic what‐if scenarios and
probability linked scenarios (Mun, ). Basic scenarios attempt to measure the
impacts of two variables which may move together, upon the project’s
profitability or residual land value and also measure the variables’ influence on
the required project hurdle rates. Basic scenario analysis is illustrated in Figure
. . and Tables . . a and . . b. Common variables for basic scenario analysis
include sales value, sales time‐period, construction cost, construction time‐
period, land acquisition and the weighted average cost of capital.

Chapter4:Risk&UncertaintyinPropertyDevelopmentDecisionMaking
MATTHEW MOORHEAD 126
In probability‐linked scenario analysis, the analyst attempts to assign a
probability to the likelihood of a given scenario occurring (Havard, ). A
common output of probabilistic scenario‐analysis is to generate an estimate of
three outcomes which are optimistic, neutral and pessimistic for the
development project (Mun, ). These probabilities and scenarios are usually
subjectively based on the analyst’s intuition but are a useful tool for decision‐
makers (Havard ). A probability‐linked scenario can also be used as an
additional analysis to add depth to feasibility analysis or as a method of input
variable generation when high levels of uncertainty are present which will
feedback into the standard appraisal (Byrne, ).
Table 4.5.2a: Original base case variables for use in simple or basic ‘what‐if’ scenario analysis
Source: Author,
In the case of adding depth to a variable calculation in a traditional feasibility
analysis, expert opinion is sought to estimate probabilities of the likelihood of a
fixed change from an input variable that has already been calculated. For
Simple 'what if' scenario analysis
Original Variables
Gross Income (inc GST) 5,560,000$
GST 478,182$
Net Income (after GST) 5,081,818$ + ‐ 10% Construction Cost
Construction Cost 3,173,288$
Land Cost (Asking Price) 525,000$ and/or
Interest Cost 108,031$
Professional Fees 150,750$ + ‐ 10% Net Sales Income
Marketing & Other Costs 255,000$
Total Development Cost 4,212,069$
Profit 869,749$
MDC % 20.65%
Variables to change in
scenario analysis:
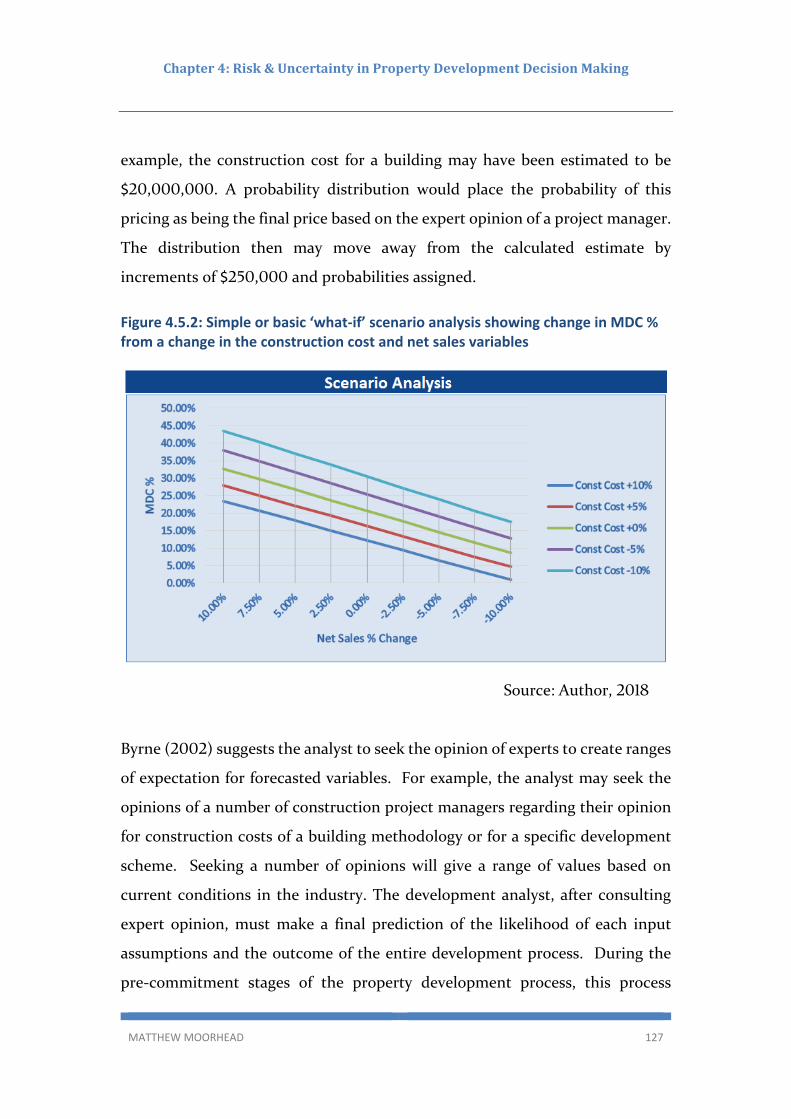
Chapter4:Risk&UncertaintyinPropertyDevelopmentDecisionMaking
MATTHEW MOORHEAD 127
example, the construction cost for a building may have been estimated to be
$ , , . A probability distribution would place the probability of this
pricing as being the final price based on the expert opinion of a project manager.
The distribution then may move away from the calculated estimate by
increments of $ , and probabilities assigned.
Figure 4.5.2: Simple or basic ‘what‐if’ scenario analysis showing change in MDC % from a change in the construction cost and net sales variables
Source: Author,
Byrne ( ) suggests the analyst to seek the opinion of experts to create ranges
of expectation for forecasted variables. For example, the analyst may seek the
opinions of a number of construction project managers regarding their opinion
for construction costs of a building methodology or for a specific development
scheme. Seeking a number of opinions will give a range of values based on
current conditions in the industry. The development analyst, after consulting
expert opinion, must make a final prediction of the likelihood of each input
assumptions and the outcome of the entire development process. During the
pre‐commitment stages of the property development process, this process

Chapter4:Risk&UncertaintyinPropertyDevelopmentDecisionMaking
MATTHEW MOORHEAD 128
requires forecasting to the end of the project creating further complexity in the
analysis (Thekdi & Lambert, ). Table . . c illustrates the use of expert
opinion‐based scenario analysis.
Table 4.5.2b: Change in MDC % from a change in net sales and construction cost ‐10% to +10% in simple or basic ‘what‐if’ scenario analysis
Source: Author,
Table 4.5.2c: Expert opinion showing optimistic, base case and pessimistic derived scenarios
Source: Author,
% Value % Value
Variables Original Base Case Optimistic Optimistic Pessimistic Pessimistic
Gross Income (inc GST) 12,122,500$ 3.00% 12,486,175$ ‐5.00% 11,516,375$
GST 1,052,045$ 1,135,107$ 1,046,943$
Net Income (after GST) 11,070,455$ 11,351,068$ 10,469,432$
Construction Cost 7,058,483$ ‐5.00% 6,705,559$ 7.00% 7,552,577$
Land Cost (Asking Price) 550,000$ ‐5.00% 522,500$ 10.00% 605,000$
Acquisition Costs 27,500$ 0.00% 27,500$ 0.00% 27,500$
Markeing $ Sales 482,205$ 0.00% 482,205$ 0.00% 482,205$
Interest Cost 135,906$ ‐5.00% 129,111$ 10.00% 149,497$
Professional Fees 494,094$ ‐5.00% 469,389$ 10.00% 543,503$
Contingency Allowance 352,924$ 0.00% 352,924$ 0.00% 352,924$
Infrastructure & Other Costs 831,278$ 0.00% 831,278$ 15.00% 955,969$
Less: GST Input Credits 765,701‐$ 728,189‐$ 811,928‐$
Total Development Cost 9,166,689$ 8,792,277$ 9,857,247$
Profit 1,903,765$ 2,558,791$ 612,185$
MDC % 20.77% 29.10% 6.21%

Chapter4:Risk&UncertaintyinPropertyDevelopmentDecisionMaking
MATTHEW MOORHEAD 129
4.5.3MonteCarloSimulation
A Monte Carlo simulation is a quantitative technique used in many decision
analysis models that takes the probability‐linked scenario analysis further as a
quantitative technique (French and Loizou ). Even with the use of expert
opinions, the scenario analysis as a group of ‘what‐if’ outcomes, is still based on
an educated guess and does not offer any statistical validity. As stated above,
high levels of uncertainty exist in many input assumptions in a financial
feasibility analysis for a property development project.
Risk analysis through the use of Monte Carlo stochastic simulations can be
defined as the following:
Risk analysis or ‘probabilistic simulation’ based on the Monte‐Carlo
simulation technique is a methodology by which the uncertainty
encompassing the main variables projected in a forecasting model is processed
in order to estimate the impact of risk on the projected results. (Savvides, ,
p. )
Monte Carlo simulation incorporates the identified inputs that represent key
risk and completes a large number of iterations to give a comprehensive
probability distribution of the expected change in key project hurdle rates by
changes in the key inputs (Savvides, ). In order to incorporate statistical
validity, dynamic modelling of the outcome of key variables in conditions of
uncertainty can be created using stochastic processes which seek to model the
uncertainty in specific variables over time (PfnÜr & Armonat, ). Monte Carlo
simulation iterations can be used when uncertainty is high in order to provide
boundaries on the expected outcome of a variable. A property development
project will create a complex set of cash‐flows that are influenced by a number

Chapter4:Risk&UncertaintyinPropertyDevelopmentDecisionMaking
MATTHEW MOORHEAD 130
of risk factors, many of which will be correlated (Tziralis et al., ). This
complexity can be addressed by using stochastic processes and estimation
generated by Monte Carlo simulations (Baroni et al., ).
Monte Carlo simulations have been shown in the literature to be useful in
estimating uncertain cash‐flows and thereby land value in a development
appraisal (Quigg, ; Li, ; Glicksman & Greden, ; Baroni et al., ).
Historically, Monte Carlo simulations have not been not readily available in
many of the proprietary feasibility analysis software programs and were usually
found by installing Excel‐based add‐ins such as Oracle Software’s Crystal Ball or
Palisade Software’s @RISK (Byrne, ; Havard, ; Atherton et al., ).
In more recent times Argus Estate Master has added Monte Carlo simulations to
their software platform. Figure . . b shows a Monte Carlo simulation of
probabilities from Argus Estate Master’s DF which likewise shows the probability.
Figure 4.5.3a: Monte‐Carlo simulation of forecasted profit
Source: Author,

Chapter4:Risk&UncertaintyinPropertyDevelopmentDecisionMaking
MATTHEW MOORHEAD 131
Figure 4.5.3b: Argus Estate Master probability simulation
Source: Author,
Figure . . a illustrates the use of Oracle software’s Crystal Ball on a hypothetical
development project that was originally presented in the scenario analysis in
Table . . b in section . . Scenario analysis. The probability distribution
places the originally forecasted $ , , profit as having the highest
probability of being achieved but through the simulation of , stochastic
processes calculated a series of probabilities around achieving a more pessimistic
or optimistic outcome.
Figure . . a also indicates another important behavioural aspect of feasibility
analysis in allowing the analyst to move away from a fixed‐point feasibility model
and to view potential outcomes in a broader sense as discussed in section . . .
The historical use by developers of static single point development appraisal
models, when the input variables determining the feasibility of a project contain
a degree of uncertainty, can give a false sense of security where the analysis’s
margin of errors is not easily apparent (Atherton et al., ; Savvides, ).
The use of Monte Carlo probability iterations allow for more traditional models

Chapter4:Risk&UncertaintyinPropertyDevelopmentDecisionMaking
MATTHEW MOORHEAD 132
to be modified to give the developer the ability to quantify the risks, and also
allows moving from the idea of a best and worst estimate to a range of outcomes
and a distribution (Byrne, , ; French & Gabrielli, , ; Loizou &
French, ). Benefits that can be obtained through the use of this technique
include gaining a better understanding of key project risks, measure the effect of
risk events on the project outcome, quantify the probability of risk events and
allow for a better comparison of potential projects (Savvides, ).
This research being undertaken for this thesis will attempt to ascertain the level
of adoption of the various risk management analysis tools used by Australian
property development firms. It is anticipated that, without ready access to such
tools, the adoption of modern quantitative analysis techniques within the
industry will have limited adoption.
4.5.4RealOptionAnalysis
Real option theory is based on theoretical models that have been used in
derivative markets since the founding of the Chicago Board Options Exchange
(CBOE) in . Real options are different from financial market options but are
derived from the Black‐Scholes option theory. The main area of difference is that
financial options are based on a derivative of a security and a real option is based
on a physical asset. Black & Scholes ( ) formulated the Black‐Scholes option
pricing model for valuing options on common stock that was then expanded
upon by Merton ( ) to allow for dividend payments or regular income from
an asset.
The Black‐Scholes‐Merton option model of valuing a derivative security requires
five key pieces of information:
. An asset value or price
Chapter4:Risk&UncertaintyinPropertyDevelopmentDecisionMaking
MATTHEW MOORHEAD 133
. A price at which the parties agree to exercise the option which is called
the strike price
. Option term (fixed time‐frame)
. A risk‐free rate of return
. Implied volatility of the underlying asset (Black & Scholes, ; Merton,
).
Financial option models assume a geometric Brownian motion or ‘random walk’,
as described by Malkiel ( ), for an asset value with fixed volatility as a
constant. By making an assumption about future risk or volatility, a prediction
of the future value of an asset can be made (Teneng, ). Markets use these
models to price derivatives, and the derivative pricing can be used to determine
the probability of an asset achieving a target price by a given date. The
subsequent addition of consistent revenue streams tied to the underlying
Merton model allowed for regular dividends to form part of the valuation
methodology. Later, Cukierman ( ), Greenley, Walsh and Young ( ) and
Bernanke ( ) adapted option theory to the application of business
management decision processes as a valuation methodology for a business or
project. Any action a decision‐maker makes that has the effect of adjusting a
project’s uncertainty and/or mitigate risk has an embedded real option
(Schwartz and Trigeorgis, ). In Titman ( ) real option theory was further
adapted as a means of valuation of the potential for a proposed project site or
the flexibility of staging and or delaying commencement.
Further development of real option theory as applied to property development
projects was developed by Williams ( ) to examine strategies to exercise call
options on development projects in markets in equilibrium. Grenadier ( )
investigated market conditions where it is advantageous for developers to enter
the market even in the face of high competition in a cascading strategy.

Chapter4:Risk&UncertaintyinPropertyDevelopmentDecisionMaking
MATTHEW MOORHEAD 134
Grenadier found that in markets where demand volatility is high and is prone to
market shocks have the highest levels of development concentration which may
lead to dramatic market cycles. Often irrational levels of development can be
explained by developers trying to anticipate well‐forecasted increases in demand.
The application of these findings highlights the increased risk to development
projects the further out in time from the start of a demand cycle (Grenadier,
).
In the application of real option theory to property development decision
making, the option to commence a development project is treated as the
developer holding a call option over the site, the construction/development
costs equalling the strike price and the finished building/s as the underlying
asset (Leahy, ; Grenadier ).
Real options provide a framework for analysing the flexibility in development
projects by analysing the decision maker’s ability to adapt to uncertainty
replicating a call option over an asset. A development site’s value incorporates
the potential of the site, and the feasibility of a project is dependent on both land
use and density (Geltner et al., ). The greater the degree of flexibility, the
more a property developer is able to influence risk (Huchzermeier and Loch,
). Additionally, the type of product to be constructed, such as residential,
commercial, industrial or retail real estate, is commonly referred to as a
development parcel’s site usage and the density refers to the intensity of the
physical and economic activity of the project or a project’s density yield. The
potential for a change of use and the increase in density is equivalent to a call
option over the site and was valued in models introduced by Williams ( ),
Capozza and Li ( ) and Geltner et al. ( ).

Chapter4:Risk&UncertaintyinPropertyDevelopmentDecisionMaking
MATTHEW MOORHEAD 135
The valuation of land has a much longer history in the literature including
(Quigg, ) and (Sing & Patel, ). The application to the staging of more
complex mixed‐use development is more recent with academic literature
producing many models including but not limited to the following:
The use of decision trees in Kang ( )
Microsoft Excel‐based models for complex property development
projects by Hengels ( ), Barman and Nash ( )
The application of Monte Carlo simulations to real option theory
for use in engineering projects including De Neufville et al. ( ),
Cardin ( )
Cunningham ( , ) found that increases in volatility of one
standard deviation reduced development activity by . %. This
finding was repeated by Bulan, Mayer and Sommerville ( )
who examined , residential development projects in Canada
and found and increases in systematic and idiosyncratic risk
caused property developers to delay the commencement of
projects
Blind, Castello & Leishman ( ) applied real option theory to the
Australian market in order to value development land in Western
Australia
Zhi and Sing ( ) found that stronger developers with lower
marginal costs have the ability to exercise options much earlier in
the cycle and therefore gain an advantage over weaker/smaller
developers
Mintah, Higgins & Callanan ( ) found that using real option
theory in relation to the staging of development projects was able
to represent project uncertainties to a higher degree of accuracy

Chapter4:Risk&UncertaintyinPropertyDevelopmentDecisionMaking
MATTHEW MOORHEAD 136
than would the use of a traditional DCF methodology. Additional
findings suggest the staging of development projets offers
decision‐makers the option of abandoning unprofitable projects at
several points and reduces unprofitable projects.
Over the last decade there have been numerous publications along this line, but
most models proposed are complex and problematic to use in daily practice. As
stated above, Hutchison et al. ( ) investigated the use of real option theory
in decision‐making by UK property development and investment firms finding
no adoption of this technique. It is anticipated that there is an increasing
divergence between academic theory and industry practice in relation to the
application of real option theory in preliminary feasibility analysis (Barman &
Nash ). This research aims to investigate the adoption and use of real option
theory‐based models in the go/no‐go decisions of property developer’s in the
pre‐commitment stages of the development process.
4.6Summary
Within existing academic literature there remains a scarcity of understanding
and analyses concerning the uptake and acceptance of the various risk
measurement and mitigation techniques applied by property developers in the
Australian markets. This research aims to investigate which techniques are
being incorporated into the decision‐making process during the pre‐
commitment stage of the development process and how property developers
adjust their decision‐making processes in light of a predicted change in project
risk. The following chapter will examine the research methodology of this
research and the key questions that will be addressed.

Chapter5:ResearchMethods
MATTHEW MOORHEAD 137
Chapter5:ResearchMethods
5.1Introduction
A review of relevant literature and past studies shows there exists a gap in
knowledge regarding the selection and setting of hurdle rates and benchmarks
for Australian real estate development projects in the pre‐commitment stages of
the development process. The primary focus of this research is to inform in
relation to the gaps identified by gaining an understanding of the decision‐
making practices utilised within the development industry in Australia. In order
to achieve the research objectives, it was essential to gain a comprehensive
insight into two major attributes of current decision‐making practices. Firstly,
identifying the practices utilised in the industry, and secondly, to explore the
reasons behind the choice of tools employed that aid decision‐making under
conditions of uncertainty.
5.2Researchobjectives
A review of the current literature has identified a small number of studies that
have sought to make a thorough survey of the practices used within the
development industry. Surveys conducted include Newell and Steglick ( ),
Civan ( ), Atherton et al. ( ), Costello & Preller ( ), Loizou & French
( ), Wiegelmann ( ), Coleman et al. ( ), Crosby et al. ( ), Garner
( ), Hutchison et al. ( ) and Crosby et al. ( a & b) outlined key
decision hurdle rates and identified new practices that have been developed
including the use of Monte‐Carlo simulation and Bayesian models.

Chapter5:ResearchMethods
MATTHEW MOORHEAD 138
However, these studies did not identify the level of adoption or use of these
methods within the development industry. Weigelmann ( ) analysed risk
management within European development companies but did not fully
examine how these models are used in decision‐making processes. Other studies
within Australia have been narrow in focus, surveying only one sector of the
industry or one geographical area. For example, Preller ( ) surveyed
Queensland residential developers, and Newell & Steglick ( ) sampled
publicly‐listed developers. There exists a gap in the literature examining the
extent of the decision‐making methodologies and the hurdle rates chosen as the
go/no‐go decision triggers by property developers in the pre‐commitment stages
of the development process. This research aims to broaden the knowledge base
concerning the existing decision‐making processes within development
companies across industry sectors, ownership structure and company size.
5.3Researchdesign
Research in the social sciences is predominantly quantitative or qualitative in
nature (Neuman, ). Quantitative research enquiry originates with a specific
plan, a set of detailed questions and/or hypothesis followed by data collection
from which the hypothesis can be sustained consisting of primarily numerical
results from surveys, tests and experiments (Creswell & Creswell, ). The
process of following this formula for carrying out quantitative research is
referred to as logical positivism (Stainback & Stainback, , p. ). The
gathering of quantitative empirical evidence using such a formula facilitated
comparison of the decision tools used in feasibility analysis in the various sectors
of the property industry and various company types. It also facilitated the testing
and application, if any, of theory in praxis in the Australian property
development industries.

Chapter5:ResearchMethods
MATTHEW MOORHEAD 139
Qualitative research is based on the philosophical orientation of phenomenology
that focuses on people’s experience from their individual perspective (Lewis,
; Collis & Hussey, ). Enquiry begins with a specific plan – a set of
detailed questions about the area under investigation (Tashakkori & Teddlie,
). Qualitative research is more likely to incur bounded rationality due, in
part, to a lack of information, experience, cognitive ability and impaired
judgement. Quantitative research is less likely to demonstrate bounded
rationality due to the survey design (Baxter & Jack, ). The use of qualitative
methods in this research will allow for a deeper investigation into the existence
of and/or causes of bounded rationality and heuristic decision tools within the
feasibility analysis and development appraisal process.
Conducting mixed methods research involves the use of strands which represents
those components of the study that encompass the basic process of conducting
quantitative or qualitative research: posing a question, collecting data, analysing
data, and interpreting results based on that data (Teddlie & Tashakkori, ).
Mixed methods studies meeting the definition of mixed methods research
include at least one quantitative strand and one qualitative strand (Johnson et
al., ).
Quantitative and qualitative methods in research practice each exhibit
distinctive strengths and weaknesses (Morgan, ). Mixed method design
studies incorporate the use of quantitative and qualitative methods in a pre‐
determined and planned structure as part of the research process (Creswell &
Clark, ). Tashakkori & Creswell ( ) advise the use of combining these
two methods into a single study to allow the strengths of each method to be
utilised and exploited while moderating and minimising the weaknesses
inherent in the alternative research design. The methodological perspective on
mixed methods holds that one cannot separate methods from the larger process

Chapter5:ResearchMethods
MATTHEW MOORHEAD 140
of research of which it is a part. Any discussion of a mixed‐method methodology
‘should focus on the entire process of research, from the philosophical
assumptions, through the questions, data collection, data analysis, and on the
interpretation of findings’ (Tashakkori & Creswell, , p. ).
Mixed methods research was defined by Tashakkori and Creswell ( , p. )
as follows:
Research on which the investigator collects and analyses data,
integrates the findings, and draws inferences using both qualitative and
quantitative approaches or methods in a single study or program of
enquiry.
Greene ( ) expressed the view that the principal reason for combining
methods using a mixed‐method design allows the researcher to make sense of
the world from multiple standpoints. In consideration of the need to minimise
the weaknesses inherent in these types of research methods, the mixed methods
design was adopted for this research. The rationale for adopting mixed methods
design was outlined by Greene et al. ( ) to include triangulation,
complementarity, development, initiation and expansion. Additionally, this
research aims to ‘assess trends and relationships with quantitative data but also
be able to explain the mechanism or reasons behind the resultant trends’
(Creswell & Clark, , p. ). In consideration of Bryman’s ( ) findings
regarding mixed methods design the reasons identified for the use of mixed
methods in this research include the following:
Completeness – refers to the notion that the researcher can bring together
a more comprehensive account of the area of inquiry by using both
quantitative and qualitative methods.

Chapter5:ResearchMethods
MATTHEW MOORHEAD 141
Process – refers to when quantitative research provides an account of
structures in social life, but qualitative research provides a sense of
process.
Explanation – refers to when one is used to help explain the findings
generated by the other.
(Bryman , p. – as cited in Bryman )
5.4Surveydesignutilisingmixedmethodsinparallel
The choice of research design for this thesis was originally a mixed‐method
explanatory sequential design where a quantitative survey would be conducted
then followed up with qualitative interviews. Explanatory sequential design
typically occurs in two distinct interactive phases and involves the use of both
post‐positivist and constructivist paradigm foundations (Creswell & Clark, ,
p. ). Explanatory sequential design uses sequential implementation
commencing with quantitative (or qualitative) data collection and analysis in
phase one followed by qualitative (or quantitative) data collection and analysis
in phase two. The results of the quantitative strand are used to make decisions
about qualitative research questions, sampling, data collection and participant
selection in the second qualitative phase. The primary point of interface for
mixing is at data collection, and a quantitative emphasis on the strands subsists.
The research design was later refined to allow for a parallel mixed method design
to be conducted through a single survey rather than through a mixed‐mode
instrumental approach to take advantage of the strengths of a combined
instrument (Curran & Blackburn, ). The rationale for the change in
methodology was based on three primary reasons. First, by having quantitative
questions to be immediately followed by qualitative questions allowed

Chapter5:ResearchMethods
MATTHEW MOORHEAD 142
participants to respond to questions regarding demographic characteristics of
the property development organisation and the decision‐makers within those
organisations, hurdle rate selection and usage and then be allowed to
immediately reflect or give a reason for their choice of hurdle rate in a qualitative
open‐ended answer. Second, the use of parallel strands within the same
instrument allowed for a much larger sample of qualitative responses that could
reasonably be obtained through other qualitative data collection methods such
as interviews, focus groups or the Delphi technique. Third, the use of a parallel
survey allowed for a far larger reach in both geographic terms and industry scope
than would have been practical using primarily qualitative data collection
approaches. A limitation to the combined strands in one survey instrument
included allowing a significant amount of time for respondents to complete the
survey. This aspect was addressed in the pilot test survey.
Figure . illustrates the research design which includes the quantitative and
qualitative data strands being collected in a single‐mode instrument. Where
possible the qualitative data is analysed and quantitised into codes that can be
analysed statistically with the quantitative data (Saunders et al., ). The final
step in the process is to compare and relate the two types of data collected and
then interpret the results (Cresswell, ).
This research was conducted by implementing the strands in two distinct phases.
First, a pilot study was administered to collect data and feedback on the research
design that then was used to influence the design of the second strand which
includes a quantitative survey as well as open‐ended questions that were more
qualitative in nature. The initial quantitative section of the survey gave a
snapshot of the current practices within the Australian development industries
including the use and choice of hurdle rates and benchmarks in decision
processes during the pre‐commitment stage of the development process.

Chapter5:ResearchMethods
MATTHEW MOORHEAD 143
Figure 5.1: Parallel design methodology
Source: Adapted from Creswell ( , p. ) and Saunders et al. ( , p. )
5.4.1Phase1–apilottestofthesurvey
The first phase of the research included the design and implementation of a
survey pre‐test which was conducted to assess the viability and practicality of
the survey design. Prior to formal pre‐testing, potential survey questions were
subjected to cognitive testing as described by Beatty & Willis ( ) to assess
the measurability of questions and eliminate problems in survey design prior
formally collection of data.
Approximately industry practitioners and academics working in related fields
tested draft versions of the survey, and their feedback was incorporated into
subsequent versions. The purpose of a pre‐test is to gauge the effectiveness of a
surveys design and test the data collection protocols in realistic conditions
(Fowler Jr, ). The pre‐test sought to provide clarification on issues including
time to complete the survey, verification of the questions, pre‐set answers and
the flow of questions given the different path the survey can take depending on
the choices made in the decision tree.

Chapter5:ResearchMethods
MATTHEW MOORHEAD 144
The pilot test resulted in a number of pathway problems within the decision
structure of the survey, allowing for rectification. Additionally, the pilot test
highlighted a concern from industry participants in relation to the disclosure of
project‐specific financial information and outcomes as this could be a violation
of common workplace confidentiality agreements generally prevalent in the
industry. Taking into consideration the desired sample size and the primary
research focus to uncover decision and hurdle rate selection practices, specific
project financial disclosure was omitted from the final survey. The pre‐test also
confirmed that a motivated respondent would be able to complete the
questionnaire in to minutes depending on which sections needed
completing.
This initial phase of the research generated a comprehensive review of the tools
currently being employed in the industry and allowed for a comparison to the
past in order to help understand the evolution of feasibility analysis. The
postpositivist paradigm foundation utilised in phase one allowed the research to
make claims for knowledge based on four areas as identified by Slife & Williams
( ).
Determinism or cause‐and‐effect thinking
Reductionism by narrowing and focusing on selected variables to
interrelate
Detailed observations and measures of variables
The testing of theories that are continually refined.

Chapter5:ResearchMethods
MATTHEW MOORHEAD 145
5.4.2PhaseTwo‐aquantitativeandqualitativesurvey
The phase two strand of the research incorporated a survey which included both
quantitative and qualitative questions that were given to industry decision‐
makers involved in the pre‐commitment go/no‐go decision‐making process
within the overarching development process. The purpose of this survey was to
gain an understanding of the key feasibility analysis decision matrix being
incorporated and applied. The empirical data generated from the survey
provided insight into the practices being used by property development
organisations, as there is very little research demonstrating how different sectors
of the industry select and incorporate hurdle rates into the pre‐commitment
stages. In addition to the property type, the survey allowed for an examination
based on company type being public or private, as well as, investigating the
difference in the size of the development company and the ownership structure
used, for example, the speculative developer or property investors/developer.
An understanding of current practice facilitates answering research questions
about bounded rationality and what heuristic models and/or rules of thumb are
currently being applied. Additionally, phase two of the research provided a
sector by sector analysis of the property development industry, which to the
author’s knowledge, has not been undertaken to differentiate the models used
by residential, industrial, commercial, retail, infrastructure, tourism and mixed‐
use developers. The post‐positivist paradigm foundation adopted in phase two
allowed for ‘the progression from theory to hypotheses to data; to add or
contradict theory’ (Creswell & Clark, , p. ).
Additionally, within the second phase of the research qualitative open‐ended
questions allowed participants to expand upon the methods used to determine
project viability and assess the risk of a project. The purpose of the qualitative
Chapter5:ResearchMethods
MATTHEW MOORHEAD 146
questions was to look for where key industry stakeholders and decision‐makers
believe their models can be improved and where they see the decision‐making
process leading to in the future.
In the survey instrument, qualitative questions based on constructivism were
adopted to gain an understanding or meaning of phenomena through the
participant’s subjective views. Researching from the bottom up to understand
individual perspectives that lead to identifying broad patterns and then
ultimately coming to broad understandings (Creswell & Clark, ). Bryman
( , p. ) identified the three main methodological challenges presented by
using a qualitative approach to collecting data which included the following:
Gathering enough data to address the research question, dealing with
the enormous quantity of qualitative data that results from a thorough
investigation and sorting and interpreting data to give meaning.
(Bryman, , p. )
‘Qualitative and quantitative approaches in a single study complement each
other by providing results with greater breadth and depth’ (Roberts, , p. ).
Combining findings with supported reasoning adds strength and detail to the
explanation of the data. Quantitative methods will be used ‘to summarise large
amounts of data and reach generalisations based on statistical projections’
(Roberts, , p. ). The qualitative research derived input from the
participant's point of view and provides a more detailed description than what
is possible through a quantitative instrument alone (Roberts, ).
5.5Sampleselection
Sampling as a process is defined by Kumar and Phrommathed ( , p. ) as:

Chapter5:ResearchMethods
MATTHEW MOORHEAD 147
The process of selecting a sample from the sampling population which
will work to become the basis for estimating or predicting the prevalence
of an unknown piece of information, situation or outcome of the larger
population.
The credibility of a study relies on the quality of the procedures used to select
the sample and determines the generalisability of the research findings.
Sampling can be guided by the following three principles:
. In the sampling process, there will be a difference between the sample
statistics and the true population mean which is attributable to the
selection of units in the sample.
. The greater the sample size, the more accurate will be the estimate of the
true population.
. The greater the difference in the variable under study, the greater will be
the difference between the sample statistics and the true population
mean. (Yin, ; Kumar & Phrommathed, )
The use of a mixed‐method design requires the researcher to consider the
sampling principles for both the quantitative and qualitative strands (Koerber &
McMichaels, ). Qualitative research is most often concerned with achieving
forms of generalisability or transferability whereas quantitative research strives
to be statistically representative of the total population (Kumar & Phrommathed,
). The steps in sampling apply to both quantitative and qualitative research.
However, there exist fundamental differences in how they are addressed,
specifically regarding the sampling approach and the sample size (Creswell &
Clark, ).

Chapter5:ResearchMethods
MATTHEW MOORHEAD 148
Kumar ( ) advises the use of purposive sampling when research aims to
describe a phenomenon or develop something about which little is known. Here
the primary factor is the researcher making judgements to identify who can
provide the best information to accomplish the objectives of the research.
Research is focused on those individuals selected who are likely to have the
required information and be willing to share it. May ( ) advised that an
opportunistic sampling strategy is not appropriate in qualitative strands, but
rather the sample needs to relate in some systematic manner to the social world
and phenomena that the study seeks to enlighten. Here the criterion most
commonly proposed for sampling is diversity, where researchers seek to recruit
‘participants who represent a variety of positions in relation to the research topic,
of a kind that might be expected to throw light on meaningful differences in
experience’ (King & Horrocks, , p. ).
In consideration of the literature, non‐random probability sampling methods
adopting quota and homogenous sampling methods were adopted. The terms
purposeful and theoretical sampling are often defined synonymously and used
interchangeably in many research studies (Coyne, ; Charmaz & Belgrave,
). Purposeful sampling in quantitative and qualitative research means that
‘researchers intentionally select participants who have experienced the central
phenomenon or key concept being explored in the study’ (Creswell & Clark,
, p. ).
Homogenous sampling involves studying individuals who have membership in a
subgroup with distinctive characteristics (Patton, ; Teddlie & Yu, ).
Both homogeneous and purposeful sampling were applied to this research by
approaching decision‐makers within property development companies as a basis
of selection to be participants in the survey. As both the sample size and

Chapter5:ResearchMethods
MATTHEW MOORHEAD 149
population are small, stratified sampling will further improve the analysis of the
data collected. The sample population was stratified along the following basis:
Geographic areas including New Zealand, South‐East Queensland,
Northern‐Queensland, Sydney, Melbourne, Adelaide, Canberra, Darwin
and Perth
Property type including residential, commercial, retail, industrial,
tourism, aged care, childcare and mixed‐use development
Size – large, medium‐large, medium‐small and small developers as
discussed in Chapter (Note: in some statistical analysis in Chapter the
large and medium‐large categories are condensed)
Developer motive – speculative developer and developer/investor
Company type ‐ publicly listed versus private ownership
Specialised versus diversified developers
5.6Population
The population consisted of decision‐makers within property development
companies that conduct development appraisal and feasibility analysis to
determine the viability of a potential project, as well as the site acquisition in the
pre‐commitment stages of the development process. There is a significant
emphasis in this research on the Australian property development industry, but
as property developers are becoming increasingly international, other
geographical areas were also included (Squires & Heurkens, ). The
population of decision‐makers is unknown and an estimate determined by
evaluating the client sizes of leading proprietary feasibility software companies
and allowing for at least % industry use of bespoke models gives a population
of approximately , development companies within Australia, with an

Chapter5:ResearchMethods
MATTHEW MOORHEAD 150
unknown number of decision makers. ABS data for the category of Land
Subdivision and Development included development companies having an
annual turnover greater than $ million (ABS, ). The reliability of this
information is questionable, as many property developers have a construction
division and may be listed in the Construction categories within the ABS data.
The phase two strand of the research achieved a sample size of . Achieving
the sample size desired necessitated the assistance of industry organisations
such as Estate Master, now owned by Altus Group, which assisted with the
distribution of the survey to property developers at training sessions and
facilitated in the collection of surveys or approximately % of the total
responses. Additionally, participants were purposefully sampled by utilising the
author's contacts, searching via LinkedIn Premium and through attending
property industry events. The purposeful sampling was both highly selective and
labour intensive, contributing to the nine‐month time frame for data collection.
Each of the potential participants received either a covering letter or a landing
page that outlined the following information:
Purpose of the research and the aims sought from the research project
Who was conducting the research and how to get in contact with the
researcher
An explanation of the ethics approval and how to contact the University
if they have any questions or complaints
A statement on participant confidentiality and the right to withdrawal
without jeopardy
An estimate as to the amount of time required to complete the survey
instrument
Instructions for completing the survey instrument,
A consent form for participating in the research.

Chapter5:ResearchMethods
MATTHEW MOORHEAD 151
5.7Instrumentation
The research instrument includes the mechanism for the collection of data and
needs to be appropriate in terms of both validity and reliability. Validity is the
degree to which the instrument accurately measures the variables that were
intended to be measured. Reliability, is where ‘the degree to which the
instrumentation consistently measures a variable and is repeated over multiple
periods’ (Roberts, , p. ). The design of the survey instrument included
questions with response categories including rating scales, checklists and
ranking, as well as open‐ended questions to allow participants to provide
subjective interpretation. The initial questions in the survey were used to
determine consent to participation in the research project and also to qualify
respondents that they are involved in the decision‐making process of selecting
and acquiring property development projects. Within the online survey
instrumentation, potential respondents that did not meet the minimum qualifier
requirements were thanked for their time and were not permitted to begin the
survey questions. This qualifying question was designed to minimise the
potential of recording responses that would not be meaningful to the results of
the research project.
The instrumentation of the survey was administered in two different formats
during the period of October to June . The first was an online survey
facilitated by the Qualtrics Survey Platform where respondents completed
the survey. The second method was a paper form that was given out at Estate
Master training sessions (as described above) where respondents completed
and submitted the written survey. First, the survey instrument included
demographic questions designed to measure characteristics of decision‐makers
and the organisation in which they are employed. These included questions
regarding geography, experience, educational level, job‐role, organisational
Chapter5:ResearchMethods
MATTHEW MOORHEAD 152
structure, developer type, property types developed, project size and developer
motive. Second, respondents were asked questions regarding their organisation’s
decision structure and project selection including the specific hurdle rates
utilised, the choice of financial metrics for project evaluation, the methods of
changing project hurdle rates and structural issues in the decision process. Third,
participants were asked about their practices regarding the mechanics of
feasibility analysis including the tools utilised to determine project viability as
well as what variables are forecasted. Fourth, respondents were asked questions
regarding common risk analysis methods used in industry including attributes
and their perception of risk tolerance/aversion.
5.8Effortstoincreasetheresponserate
Strategies adopted to increase the instrument response rate included the
following methods:
Preparation of the explanatory statement and landing page described
above. This letter gave potential participants an overview of the research
objectives and the value and benefits that potentially could be derived
from the completed project.
A prize inducement offer that gave participants the possibility of winning
an Apple Ipad. The respondents had the option of opting into the prize
draw. The prize draw was administered by a representative of the Office
of Research Services at Bond University in accordance with the approved
Human Research Ethics Committee at Bond University ethics application
number . One respondent was drawn out and had their prize
delivered by registered mail.
Chapter5:ResearchMethods
MATTHEW MOORHEAD 153
Two weeks after initial contact, potential participants received one follow
up email or call to ask if they would complete the survey instrument.
Potential participants were also asked if they had any questions regarding
the research or had any difficulty while completing the survey. The online
survey was available on either a website via a PC or through their smart‐
phone or tablet device.
The strategies to increase the survey response rate were effective in achieving
responses out of the property developers approached leading to an
overall response rate of . %. This result is particularly positive as surveys of
property development organisations have generally had low response rates. The
response rate and the composition of respondents in the survey will be discussed
further in section . .
5.9 Researchquestions
A primary aim of this research was to explore the various decision methods used,
identify their level of use and the importance of each method to different sectors
of the industry. Additionally, this research aimed to make a contribution to
inform regarding the gaps within the literature and other prior studies. The
research questions were designed to address each of the research aims,
originating from both the literature review and the author’s experience in the
field and are listed as follows:
5.9.1ResearchAim1:
Determine the role of feasibility analysis and development appraisals in
management decision‐making, the use of hurdle rate methodologies and

Chapter5:ResearchMethods
MATTHEW MOORHEAD 154
forecasting practices, building on decision theory and value management
knowledge frameworks. Does theory provide insights into the role of feasibility
analysis with new projects?
RQ : Australian property development firms use of specific go/no‐go hurdle
rate mechanisms as a decision basis
a. Do Australian property development firms use specific go/no‐go
hurdle rate mechanisms as a decision basis for proceeding beyond the
pre‐commitment stages of the development process?
b. What are the specific hurdle rates and benchmarks which are
currently being used by Australian property development firms?
RQ : What are the differences in the hurdle rates and benchmarks selection
as the basis of go/no‐go decisions based on the following factors:
a. Projects by property types including residential, commercial, retail,
industrial, retirement, infrastructure and mixed‐use projects?
b. Projects by development company size and ownership? Publicly listed
and private development companies? Large, medium‐large, medium‐
small or small projects?
c. Projects by developer motive? Speculative or trader developers versus
develop and hold/investor developers?
d. Does experience influence hurdle rate selection? Test differences
between experienced versus novice decision‐makers.

Chapter5:ResearchMethods
MATTHEW MOORHEAD 155
e. Do decision makers with a specific property‐related degree differ in
hurdle rate selection and use?
f. Are there significant differences in hurdle rate selection and use
between different geographic regions of Australia and New Zealand?
RQ : Do organisations and decision‐makers that utilise proprietary
feasibility programs differ in their feasibility practices and selection and
use of hurdle rates from those which use Microsoft Excel or create their
own feasibility program?
RQ : Do Australian development companies use the residual land value
method, discounted cash‐flow method, residual accumulation cash flow
method and/or market comparison method for determining a potential
development site’s value in the pre‐commitment stages of the property
development process?
5.9.2ResearchAim2:
Examine the relationship between bounded rationality, heuristic bias and
management decision‐making in the presence of volatile externalities with a
view to measuring the extent of variable interdependence over time.
RQ : Development company processes and methods for altering and
adapting hurdle rates and benchmarks.
a. Do development companies have a pre‐determined process and
method of altering or adapting the chosen hurdle rates and benchmarks?
Chapter5:ResearchMethods
MATTHEW MOORHEAD 156
b. How do Australian property development organisations specify and
change the required hurdle rates and benchmarks as a basis of go/no‐go
decisions in light of increased risk and uncertainty?
RQ : Do development companies demonstrate bounded rationality in their
decision‐making processes?
5.9.3ResearchAim3:
Consider the use of Monte Carlo simulations, Bayesian models and option theory,
real and embedded options in long‐term property development and investment
decision making as instruments for providing flexibility and managing risk,
uncertainty and change.
RQ : Australian property development companies use of sophisticated
theory led structured quantitative analysis in the feasibility models used in
their decision‐making processes in the pre‐commitment stages of the
development process.
a. RQ a: Do Australian property development companies use
sophisticated theory led structured quantitative analysis in the
feasibility models used in the decision‐making processes in the pre‐
commitment stages of the development process?
b. RQ b: Do Australian development firms use Monte Carlo
simulations, Bayesian models, and/or option theory to aid decision‐
making?
Chapter5:ResearchMethods
MATTHEW MOORHEAD 157
RQ : Are Australian property development companies confident in their
organisation’s risk identification and management practices in the decision‐
making processes of the pre‐commitment stages of the development process?
In order to accomplish the research aims and address the research questions, it
was necessary to gather empirical evidence regarding the current practices used
within the major property sectors and company types within the Australian
property development industries. This empirical quantitative data was useful in
making comparisons between the theoretical models and processes and actual
industry practice. Table . summarises the key research aims, questions and
hypotheses that were tested in the phase two research strand.
Table 5.1: Summary of research aims and questions
TITLE Feasibility Analysis in the Pre‐Commitment Stages of the Development Process
DESCRIPTION An examination of uncertainty, risk and heuristic bias in management decision making processes during the pre‐commitment stages of the real estate development process in Australia
RESEARCH AIM
A primary aim of this research was to explore the various decision methods used, identify their level of use and the importance of each method to different sectors of the industry. The research questions were designed to address each of the research aims, originating from both the literature review and the author’s experience in the field and are listed as follows:
AIM 1
Determine the role of feasibility analysis and development appraisals in management decision‐making, the use of hurdle rate methodologies and forecasting practices, building on decision theory and value management knowledge frameworks. Does theory provide insights into the role of feasibility analysis with new projects?
RQ1 Australian property development firms use of specific go/no‐go hurdle rates mechanisms as a decision basis for proceeding beyond the pre‐commitment stages of the development process.
RQ 1a Do Australian property development firms use specific go/no‐go hurdle rates mechanisms as a decision basis for proceeding beyond the pre‐commitment stages of the development process?

Chapter5:ResearchMethods
MATTHEW MOORHEAD 158
RQ 1b And if so, which hurdle rates and benchmarks are currently being used by Australian development firms.
RQ2 What are the differences in the hurdle rates and benchmarks selection as the basis of go/no‐go decisions based on the following factors:
RQ 2a Projects by industry types including residential, commercial, retail, industrial, retirement, infrastructure and mixed‐use projects?
RQ 2b Projects by development company size and ownership? Publicly listed and private development companies? Large, medium‐large, medium‐small or small projects?
RQ 2c Projects by developer motive? Speculative or trader developers versus develop and hold/investor developers?
RQ 2d Does experience influence hurdle rate selection? Test differences between experienced verses novice decision‐makers.
RQ 2e Do decision‐makers with a specific property‐related degree differ in hurdle rate selection and use?
RQ 2f Do significant differences in hurdle rate selection and use between different geographic regions of Australia and New Zealand?
RQ 3
Do organisations and decision‐makers that utilise proprietary feasibility programs differ in their feasibility practices and selection and use of hurdle rates from those which use Microsoft Excel or create their own feasibility program?
RQ 4
Do Australian development companies use the residual land value method, discounted cash‐flow method, residual accumulation cash flow method and/or market comparison method for determining a potential development site’s value in the pre‐commitment stages of the property development process?
AIM 2 Examine the relationship between bounded rationality, heuristic bias and management decision‐making in the presence of volatile externalities with a view to measuring the extent of variable interdependence over time.
RQ5a Do development companies have a pre‐determined process and method of altering or adapting the chosen hurdle rates and benchmarks?
RQ5b How do Australian property development organisations specify and change the required hurdle rates and benchmarks as a basis of go/no‐go decisions in light of increased risk and uncertainty?
RQ6 Do development companies demonstrate bounded rationality in their decision‐making processes?

Chapter5:ResearchMethods
MATTHEW MOORHEAD 159
AIM 3
Consider the use of Monte Carlo simulations, Bayesian models and option theory, real and embedded options in long‐term property development and investment decision making as instruments for providing flexibility and managing risk, uncertainty and change.
RQ7 Australian property development companies use of sophisticated theory led structured quantitative analysis in the feasibility models used in their decision‐making processes in the pre‐commitment stages of the development process.
RQ 7a Do Australian property development companies use sophisticated theory led structured quantitative analysis in the feasibility models used in the decision‐making processes in the pre‐commitment stages of the development process?
RQ 7b Do Australian development firms use Monte Carlo simulations, Bayesian models, and/or option theory to aid decision‐making?
RQ8 Are Australian property development companies confident in their organisation’s risk identification and management practices in the decision‐making processes of the pre‐commitment stages of the development process?
5.11Dataanalysis
The questions within the survey instrument were carefully designed to address
the research questions and hypothesis listed above. According to Yin ( , p.
) ‘data analysis consists of examining, categorising, tabulating, testing, or
otherwise combining both quantitative and qualitative evidence to address the
initial propositions of the study’. The data collected via the survey instrument
was analysed with the use of Microsoft Excel, Qualtrics Survey Platform, Salford
Software CART and the Statistical Package for Social Sciences (SPSS) version .
The research questions were addressed through the use of statistical tests
including factor analysis, decision trees, artificial neural networks, binary and
multivariate regression analysis and non‐parametric techniques which are
summarised in the following sections.
Chapter5:ResearchMethods
MATTHEW MOORHEAD 160
5.11.1Non‐ParametricmodelsandRecursivePartitioningmodels
The analysis of the data from the phase two survey strand of the research used
both parametric and non‐parametric statistical techniques. Parametric tests are
designed to make an ‘assumption about the population from which the sample
has been drawn’ (Pallant, , p. ). Parametric tests also often require an
assumption regarding the existence of a normal distribution in the dispersion of
the data in question (Kothari, ). This technique is useful with data variables
represented as continuous numbers where the distance between numbers has a
specific meaning and value. An example of a continuous data variable from this
research where the distance between numbers is meaningful is when
respondents indicated the specific IRR percentage they use as a minimum
financial metric hurdle rate for project selection. The distance between % and
% is meaningful and can be measured. However, an example of a data variable
for which the distance between numbers is not equally meaningful would be the
use of a Likert scale where respondents indicated their confidence in their
organisation to identify project risks. When using Likert scales and categorical
data non‐parametric tests are preferable (Norman, ).
Non‐parametric techniques do not place the same demands for the distribution
of the data but do have the requirements of random samples and independent
observations. Additionally, this technique is useful when data is measured in
nominal and ordinal ranked scales as well as categorical variables (Pallant, ).
Additionally, non‐parametric techniques make no assumptions about the
population from which the sample has been drawn. Examples of non‐parametric
tests used in this research include tests of independent samples such as the
Pearson Chi‐Square test, the Mann‐Whitney U test and the Kruskal‐Wallis
analysis of variance (ANOVA).

Chapter5:ResearchMethods
MATTHEW MOORHEAD 161
The Pearson Chi‐square test of independence is ‘used when you wish to explore
the relationship between two categorical variables’ (Pallant, , p ). Chi‐
square tests are useful in determining if there is a statistically significant
association between two variables, but this technique cannot be used as a
predictor of a variable. The primary use of Chi‐square tests in this research was
as a preliminary search for statistically significant associations between variables
that were then further investigated with other techniques.
Mann‐Whitney U Test is useful for examining the differences between two
independent groups on a continuous measure and is the ‘non‐parametric
alternative to the t‐test for independent samples’ (Pallant, , p. ). An
advantage of this technique when grouping data by a categorical variable is the
examination of median values rather than a mean. This statistical technique was
used extensively in this research to analyse the various grouping of developers
against criteria such as hurdle rate selection and use. The Kruskal‐Wallis Test is
the non‐parametric alternative to a one‐way ANOVA between groups, and also
allows for comparison of scores on continuous variables across three or more
groups (Pallant, ).
The use of recursive partitioning is a statistical method that can be used to
conduct multivariate analysis. Recursive partitioning models as a statistical
technique provide a substitute to and often a superior outcome to traditional
parametric regression models by dividing data sets into groups based on the
relationships of nodes (Zhang & Singer, ). Examples of techniques that use
recursive partitioning models include Stochastic Gradient Boosting,
Classification and Regression Trees (CART) and Decision Trees including
Random Forests (Halteh et al., ). Halteh et al. ( , p. ) cited Gepp ( )
stating that the increasing popularity and use of non‐parametric models can be
explained as:

Chapter5:ResearchMethods
MATTHEW MOORHEAD 162
Due to their recent invention—relative to parametric models—they are
naturally less occurrent in the literature, however, they are slowly
gaining traction due to their superior predictive capabilities.
5.11.2DecisionTrees
Decision Trees (DT) (sometimes referred to as classification trees) are binary
trees that split pre‐defined categorical data into two groups (Gepp et al., )
DT is a stochastic statistical technique that runs repeated iterations of splitting
variables into two categories given a set of defined splitting rules. ‘DTs offer an
easy to interpret and implement non‐parametric model that still has the power
of a multivariate approach and is able to model interactions between variables’
(Gepp et al., , p. ). A major advantage in the use of DT is that the
statistical technique is non‐parametric, which removes the requirement of not
violating the distribution assumptions. DTs are also able to ‘handle missing
values and qualitative data, as well as easily be represented in a graphical format’
(Kumar et al., ). DTs are used within the statistical analysis of this research
to make predictions of independent variables given a dependent variable and
also are used to inform which variables should be used in binary and multinomial
linear regression.
5.11.3ArtificialNeuralNetworks
Artificial Neural Networks or ANNs are based on the biological networks that
exist within the human brain and were introduced by Mculloch and Pitts ( ).
ANNs were later shown to have been a useful technique for testing the
relationship between independent variables (Lippmann, ; Demyanyk &
Hasan, ). ANNs have also been shown as a valuable technique for predicting
variables when there are many groups (Lapedes & Farber, ), and also as a

Chapter5:ResearchMethods
MATTHEW MOORHEAD 163
predictor of commercial property values (Connellan & Howard, ). ANN
analysis using Multilayer Perceptron is used within this research to determine
key differences among respondent attributes, and specifically in relation to
predictors of hurdle rate selection.
5.11.4Logisticregression–binaryandmultinomial
Logistic regression (LR) in both binary and multinomial calculations allow for
the use of categorical dependent variables and is often used in literature when
dealing with firm decision models (Cybinski, ). Additionally, this statistical
method is being used more frequently in recent times as it often produces
superior results to traditional regression methods when describing the
relationship between response variables and one or more explanatory variables
(Hosmer et al., ). The binary form is used to predict a categorical variable
with only two possible outcomes. The multinomial form of LR is used when
there are more than two possible outcomes (Anderson et al., ). In statistics,
logistic regression can be used as a classification method in order to fit
categorical data to a logistic function. “It is used for predicting the outcome of a
categorical criterion variable based on one or more predictor (independent or
explanatory) variables” (Liu & Liang, , p. ). Another advantage of logistic
regression is the removal of the requirement of the assumption of normality and
linearity within the distribution of independent variables that is present in
discriminant based linear regression. Logistical regression was used to predict
the classification of the dependent variable in testing the null hypotheses
described in section . .
5.12ResearchLimitations
Limitations are factors that prevent findings being claimed as true for all people
in all times and places (Roberts, ). A limitation can be defined as a
‘systematic bias that the researcher did not or could not control and which could
Chapter5:ResearchMethods
MATTHEW MOORHEAD 164
inappropriately affect the results’ (Price & Murnan, , p. ). For the
quantitative study, these are the factors that limit generalisation. For the
qualitative study, these are the factors that limit the relevance of the study to
other populations or individuals (Roberts, ). ‘Generalisation means the
sample results accurately represent the results of what you would get if you were
able to assess the entire target population’ (Price & Murnan, , p. ). Also,
a ‘study design must be internally valid to be externally valid and to produce
accurate findings’ (Fink, , p. ).
Examples of typical limitations include ‘sample size, methodology constraints,
length of the study and the response rate’ (Roberts, , p. ). An example
from this research where generalisation may not be possible includes the fact
that respondents were primarily Australian property developers and the results
of the analysis may not be applicable in other geographic areas. However, as
discussed in Chapters and , the results of surveys of property development
organisations of other regions have demonstrated a common approach to
decision‐making and hurdle rate selection across multiple nations.
It is necessary to establish limits and parameters defining the boundaries of the
research. An important difference between the public and private development
market is the criteria used to measure performance with public projects valued
against time and cost performance benchmarks and the economics determined,
prima facie, on the social rate of return (Campbell, ). This research is
primarily focused on the go/no‐go decision making hurdle rates incorporated in
speculative based development projects and limits the participants to be
decision‐makers and/or development companies whose activities and primary
reason for undertaking development projects is to derive maximum economic
gain/profit as determined by the theoretical principle of highest and best use.
For this reason, purposeful sampling was adopted and through the qualifying

Chapter5:ResearchMethods
MATTHEW MOORHEAD 165
questions with the requirement of respondent property development
organisations having, and using, pre‐determined financial metrics for project
selection and the determination of the go/no‐go decision.
There exist several additional significant questions regarding property
development and development projects as to whether they should proceed or
not proceed which are not based on economic profit. These additional
considerations may include the project's impact on environmental, social, public
benefit, longevity and macroeconomic aspects and particularly the relationship
between development and the business and property cycles (Wilkinson et al.,
). Each of these considerations is important in its own right and may impact
the decision to proceed as well as answer ethical questions regarding if a project
is the best‐suited development scheme to benefit society. As important as these
considerations are, they are not the primary focus of this research which, in
principle, is focused on looking at how uncertainty is addressed by businesses in
the pre‐commitment development appraisal stage of the overall property
development process discussed in Chapter .
Results of the study will also be limited to the demographic characteristic of the
respondent organisations including the types of property developed, the
developer typologies discussed in Chapter , the ownership structure of the
respondent organisations as well as the distinct geographical areas of operation
of the participants in the study. However, it is anticipated that the results will
give rise to a better understanding of how the decision‐making processes of
property development organisations, in choosing to commence projects, has
changed as a result of the GFC and how different property types and/or
development objectives give rise to different priorities or hurdle rates in the
decision process.

Chapter5:ResearchMethods
MATTHEW MOORHEAD 166
This research makes no attempt to develop a universal model or
recommendation of the best method for project evaluation or of the optimal rate
to be chosen. However, insights into the evolution of the decision‐making
processes of successful developers and property investors may provide lessons
for wider application. The investigation of uncertainty and forecasting in
decision‐making processes in complex development and investment projects
gives rise to a large number of dependent and independent variables so that it is
not possible to fully investigate them all. Investigation of macro and
microeconomic factors, including the impact of severe supply restrictions in
property markets within Australia, which influence the property and/or real
estate market have only been considered at the secondary level. It is considered
that an independent examination of these factors would not lead to a
significantly better decision‐making process.
This study has attempted to identify the key decision‐making processes and
hurdle rates used in development companies and within a number of geographic
locations within Australia and New Zealand, but may not be representative of all
development companies within these nations. A number of different types of
property development projects have been investigated including residential land
subdivision, residential built form, office, retail, industrial, tourism and mixed‐
use, and it is recognised that this may not be indicative for all forms of property
development projects.
The survey instrumentation was based on a purposeful sample of data that was
cross‐sectional in nature and conducted over a specific period of time.
Additionally, the survey instrument is limited to the self‐reported perceptions,
beliefs and experiences of decision‐makers within property development
organisations who primarily conduct projects in Australia. Furthermore,
approximately % of the survey responses received were sourced by Argus

Chapter5:ResearchMethods
MATTHEW MOORHEAD 167
Estate Master at a feasibility analysis training event. Although, these specific
responses did not demonstrate any significant statistical difference in response
to their choice, usage or alteration of hurdle rates in relation to the % of
responses sourced from other means (See Appendix G). Therefore, the possibility
exists of bias by research participants because of their employment within the
property development industry and/or their participation in an Argus Estate
Master Training event. A particular area that may incur bias is in the traditional
methods of decision‐making and hurdle rate selection that have long been
established rules of thumb. The survey respondents were also self‐selecting and
were required to demonstrate their willingness to participate in the research in
the qualifying questions.
5.13Summary
The purpose of this chapter was to provide an overview of the research aims,
objectives and the methodology adopted in the design of this thesis to address
the research questions. A parallel mixed method design methodology was
adopted to undertake the data collection and analysis in a single‐mode survey
instrument. The literature review conducted in Chapters , and
demonstrated that there has been limited research conducted outlining the
hurdle rate selection and decision processes used by property developers in the
pre‐commitment stages of the development process. The research methodology
and design was chosen in order to gain insights into property developers
selection and use of hurdle rates in decision‐making and how these are adjusted
or adapted in the presence of a perceived change in risk or uncertainty.
Chapter presents the results of the empirical survey, a summary of the
demographic characteristics of the survey respondents and the findings of the
statistical analysis used to address the research areas and specific questions.

Chapter5:ResearchMethods
MATTHEW MOORHEAD 168
(This page was left blank intentionally)

Chapter6:ResultsandAnalysis
MATTHEW MOORHEAD 169
Chapter6:ResultsandAnalysis
As identified in Chapter , the primary aim of this research is to examine the
feasibility analysis decision‐making practices of real estate development firms in
Australia and obtain information regarding hurdle rate selection and techniques
commonly utilised to determine project viability. It is common practice for
decision‐makers to use generic hurdle rates and industry rules of thumb and
benchmarks when deciding to proceed with a project in the pre‐commitment
stages of the property development process (Diaz III, ; Sah et al., ;
Rowley et al., ; Crosby et al., a). The pre‐commitment stages refer to the
stages in the development process prior to a go/no‐go decision point and before
site acquisition or project commencement. It is this point in the development
process that marks a key milestone where significant capital must be committed
to the project.
It is important to ascertain which hurdle rates are currently being used by
industry, and what are the minimum financial metrics incorporated into
decision processes. Hurdle rate selection is commonly believed to include an
allowance for the developer’s cost of capital over time as well as a premium
commensurate with a subjective assessment of a project’s unsystematic risk
(Sharpe, ). This research examines the current levels of specific hurdle rates
being utilised by industry participants and also seeks insight into how hurdle
rates are modified given a perceived change in the risk and uncertainty in a
potential project.
This chapter presents the findings of the empirical survey phase of the research
design containing the results of both the quantitative and qualitative questions.
Chapter6:ResultsandAnalysis
MATTHEW MOORHEAD 170
Survey question response rates and descriptive statistics demonstrating the
characteristics of the sample are outlined below. This chapter has been
structured on the basis of describing the demographic characteristics of
participants in the empirical survey, the respondent organisations’ decision‐
practices and hurdle rate selection, the feasibility practices of respondents, the
risk analysis practices and organisational cultural environment and the specific
research questions this research aims to address which were outlined in section
. of Chapter .
6.1EmpiricalDataResponseRate
The data collection for the quantitative and qualitative empirical survey, as
described in section . , began in October and concluded in June .
Over this period, purposeful homogenous sampling was incorporated to increase
the response rate. During the data collection period, individuals were
contacted/approached and invited to participate in the quantitative survey. Of
those approached, potential participants were contacted via telephone or
email, with completing the survey yielding a . % response rate. This
response rate is considered high in terms of survey participation. Baruch &
Holtom ( ) found the average organisational response rate to be . %, and
Dillman ( ) found online survey formats typically are much lower.
Additionally, a representative of Estate Master invited potential participants
at training sessions to complete the survey, of whom participants submitted
completed written surveys yielding a . % response rate. Overall of the
potential participants approached, completed the quantitative survey which
yielded an overall response rate of . % which is above the minimum
recommended response rate as suggested by Cook et al., ( ) and Roth &
BeVier ( ) to reduce non‐response bias. It should also be noted that the
organisation of the questionnaire through the use of an electronic survey

Chapter6:ResultsandAnalysis
MATTHEW MOORHEAD 171
platform allowed for a different pathway flow through the survey depending on
the answers given in prior questions. For this reason, not all questions would
have been answered by all respondents.
6.2Characteristicsofsurveyrespondents(IndependentVariables)
The following section summarises the results of the demographic and descriptive
questions within the survey instrument. As discussed in Chapter , questions
one to three of the survey were qualifying questions that sought to gain the
respondent’s consent for participation in the research and to determine
respondent eligibility. For respondents to be eligible to participate in the
research and complete the survey, it was important to qualify their role within
the organisation where they are employed. The purposeful sampling aimed to
select potential participants who are involved in the design, preparation or
utilisation of feasibility analysis, site valuation or the decision‐making processes
in relation to their firm's or client’s property development projects. Additionally,
a qualifying question at the beginning of the survey required participants to
indicate that they do meet the specified requirements, with regard to their role
within the organisation they are employed. It should also be noted that in several
questions within the survey, the comparison is made to surveys that covered
similar subject areas including Costello and Preller ( ) and Wiegelmann
( ).
6.2.1RespondentProfile
The organisation of the survey included questions designed to classify the
structure and motivation types of the organisations in which the respondents
are employed. These questions included developer profile, ownership structure
and also included the type and size of development projects preferred. Further
questions categorised the respondents as decision‐makers based on their role

Chapter6:ResultsandAnalysis
MATTHEW MOORHEAD 172
within the organisation for which they are employed and also classified the
internal decision‐making processes adopted.
The term real estate development was previously defined in Chapter as the
‘product of a change of land use and/or a new or altered building in a process
that combines land, labour, materials and finance’ (Wilkinson & Reed, , p.
). Additionally, Drane ( , p. ) argued that property development was a
‘value arbitrage in the transition of land from one use to another’. Arbitrage value
occurs when there is value to be obtained by the change of use or the completion
of a development project on the potential site through the use of regulatory land‐
use planning systems. When the value of the site is such that a change of use
and completion of a property development project does not increase its value
from the current use, then the arbitrage ends. Miles et al. ( ) described the
entrepreneurial aspects of property development and described the process of
development as taking an idea through to fruition when consumers ‐ tenants or
owner‐occupants ‐ acquire and use buildings put in place by the development
team. These definitions of property development are limited in that they have
regard to the development process but not to the ultimate purpose for
development in the first place. The act of construction and the completion of
buildings come together to create a structure or space that will benefit the
ultimate end‐user across the structure's lifecycle, but these definitions are
limited in describing the various motivations behind a project being undertaken
(Miles et al., ).
Therefore, it was important to ascertain from respondents their primary
motivation for assessing feasibility and hurdle rate selection by categorising their
motivation by Developer Type. Section . in Chapter demonstrated that
property development organisations could be classified, and the types of
developers described in that section were adopted in the survey instrument.

Chapter6:ResultsandAnalysis
MATTHEW MOORHEAD 173
Respondents were asked to classify their developer type, and all participants
responded to this question.
6.2.2DeveloperTypes
Developer Category: Which of the following best describes your
company's business activities?
Participants were asked to provide details of the type of business activity in
which the organisation where they are employed is engaged. The possible
answers to this question included the following:
Trader Developer ‐ development of a product to on‐sell
Investor Developer ‐ development to retain ownership
Development Management ‐ development on behalf of a client
Valuation Firm
Other, please specify.
Figure . . a demonstrates the distribution profile of the Developer Type of
respondents. Within the survey, the two most frequent responses included %
identifying their organisation as a ‘Trader Developer’ and % as Development
Management. The combined % total comprising these two developer types
demonstrates a predominate motivation for engaging in property development
activity to derive economic profit, and the majority of development activity
undertaken also being of a speculative nature. The ‘Investor Developer’ type at
% of responses also includes the motivation of economic profit, but the
difference being the intention to derive cash flows from collecting rent and with
the secondary goal of obtaining capital gains over a longer time horizon.

Chapter6:ResultsandAnalysis
MATTHEW MOORHEAD 174
Figure 6.2.2a: Developer profile types
Source: Author,
As indicated in section . . , the two main methods of deriving economic profit
from property development activities include obtaining a capital gain through
speculation and receiving rental income through property investment.
‘Valuation Firms’ as respondents constituted % of survey responses and are
included in this survey because these firms are involved in actively facilitating
an important link in the procurement of capital for development firms to
undertake projects and also form an integral part of the decision to commit to a
project. Development finance lenders require independent valuation firms to
prepare a feasibility analysis report on a proposed development project prior to
a project’s commencement and generally determines the loan gearing on a Loan
to Cost Ratio (LCR) (Bryant, ). Therefore, it is important to gain an
understanding of the views of valuation firms which have a major impact on
whether development projects ultimately proceed. Additionally, valuation firms

Chapter6:ResultsandAnalysis
MATTHEW MOORHEAD 175
were included to gauge their required hurdle rates and risk perceptions in
comparison to the property developers whose projects they are analysing. It
should also be noted that financial institutions who provide capital for property
development firms give instructions to valuation firms which may influence the
hurdle rate used as a basis for feasibility analysis (RICS Valuation of development
Land, ).
It is important to understand the motivation of the respondent in relation to
their developer type. It was found that % of respondents indicated they work
for a government‐owned entity, charity or other organisation. There exist wholly
and partially government‐owned development companies. These companies
may require economic profit as an over‐arching objective but, often, have other
objectives as the primary motivations for engaging in real estate development
projects (Wilkinson et al., ). As discussed in section . . EDQ is an example
of a Queensland government‐owned organisation which regularly conducts real
estate development projects. EDQ specifies which their organisational purpose
is:
Engaging with state and local government, the development industry and the
public to identify, plan, facilitate and deliver property development and
infrastructure projects to create prosperous, liveable and connected
communities. (Department of Infrastructure, )
Additionally, EDQ views creating land supply and key infrastructure projects as
important in generating employment opportunities in key areas.
Further analysis concerning the differences between developer types regarding
the selection and use of specific hurdle rate metrics are given in the

Chapter6:ResultsandAnalysis
MATTHEW MOORHEAD 176
determination of research question RQ c in section . . and are also
summarised in the presentation of the key findings in section . .
6.2.3Respondentgeographicdistribution
In which countries do you conduct property development projects?
Table . . identifies the respondent organisations’ global geographic
distribution of projects. A total of different participants indicated the
geographic areas in which their organisation conducts property development
projects. Some respondents represent valuation firms or other organisations that
do not directly undertake projects, therefore not indicating a geographic region.
The rate of internationalisation of property development organisations has been
increasing over the past decade and respondents were able to choose more than
one geographic area in which they conduct property development projects
(Squires & Hutchinson, ). A total of % of respondents indicated they
operate in multiple countries and, as multiple responses were possible, there was
a total number of responses of . As this research is primarily concerned with
the practices of property development organisations in Australia, these areas
were specifically targetted in the selective purposeful sampling process
described in Chapter . In total, of respondents indicated that they conduct
development projects in Australia, and respondents indicated New Zealand
as a geographic area making up the second‐largest country in terms of
representation. A combined % (n = ) of respondents indicated they operate
in the Antipodean region.
Respondents were also asked to break down the geographic percentage by the
dollar value of their organisation's development projects along the basis of New

Chapter6:ResultsandAnalysis
MATTHEW MOORHEAD 177
Zealand, Australian states and territories and/or other nations. Figure . .
demonstrates that many property development organisations operate across
several regions with a relatively small percentage (< % ) of their projects by
dollar value being conducted in different areas.
Figure 6.2.3: Geographic distribution percentages of property development projects (AUD end value) by state and region
Source: Author,
It is interesting to note that the dispersion distribution for smaller (by
transaction volume) markets attract more of a local focus, and the larger more
economically complex markets demonstrate a more diverse distribution of
activity. Further analysis concerning the differences between developers in
different geographic areas and the selection and use of specific hurdle rate
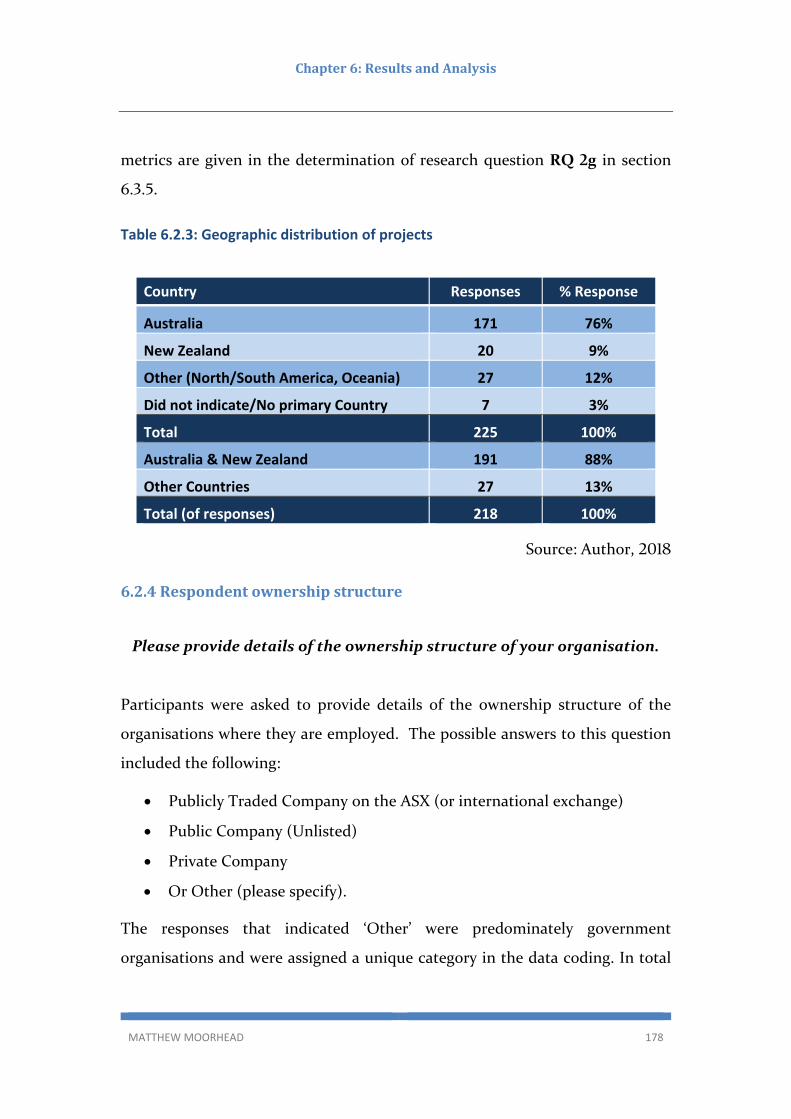
Chapter6:ResultsandAnalysis
MATTHEW MOORHEAD 178
metrics are given in the determination of research question RQ g in section
. . .
Table 6.2.3: Geographic distribution of projects
Country Responses % Response
Australia 171 76%
New Zealand 20 9%
Other (North/South America, Oceania) 27 12%
Did not indicate/No primary Country 7 3%
Total 225 100%
Australia & New Zealand 191 88%
Other Countries 27 13%
Total (of responses) 218 100%
Source: Author,
6.2.4Respondentownershipstructure
Please provide details of the ownership structure of your organisation.
Participants were asked to provide details of the ownership structure of the
organisations where they are employed. The possible answers to this question
included the following:
Publicly Traded Company on the ASX (or international exchange)
Public Company (Unlisted)
Private Company
Or Other (please specify).
The responses that indicated ‘Other’ were predominately government
organisations and were assigned a unique category in the data coding. In total
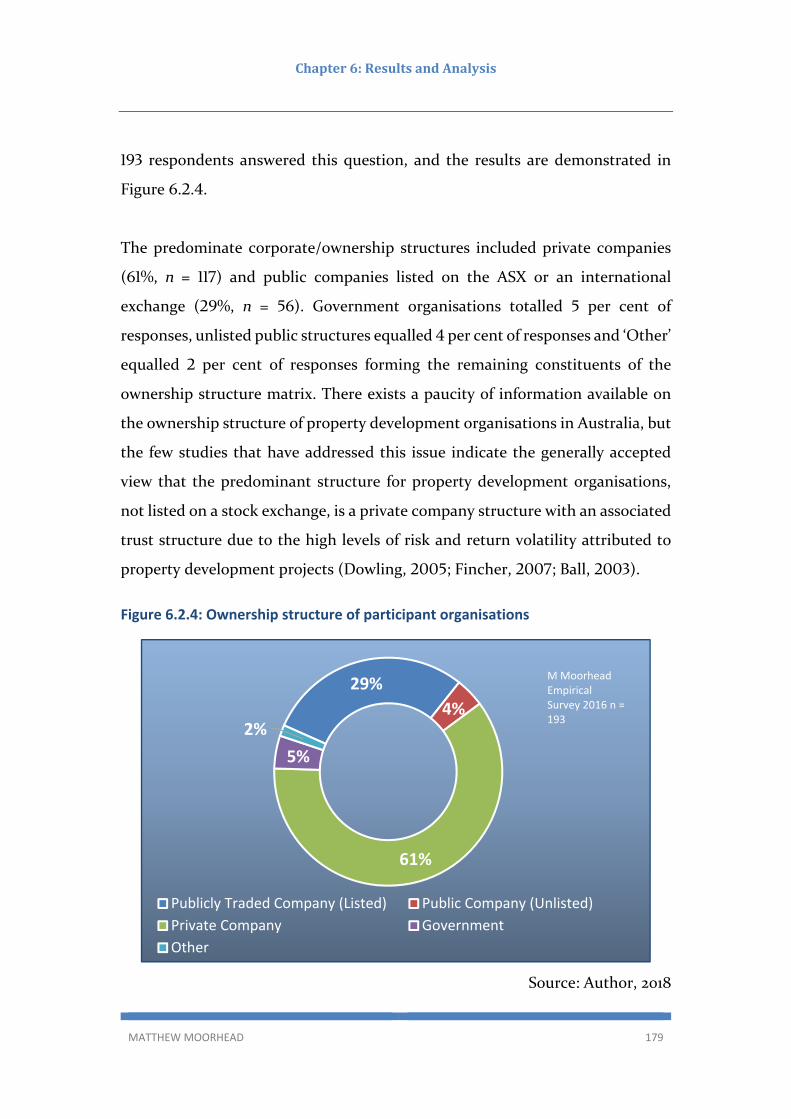
Chapter6:ResultsandAnalysis
MATTHEW MOORHEAD 179
respondents answered this question, and the results are demonstrated in
Figure . . .
The predominate corporate/ownership structures included private companies
( %, n = ) and public companies listed on the ASX or an international
exchange ( %, n = ). Government organisations totalled per cent of
responses, unlisted public structures equalled per cent of responses and ‘Other’
equalled per cent of responses forming the remaining constituents of the
ownership structure matrix. There exists a paucity of information available on
the ownership structure of property development organisations in Australia, but
the few studies that have addressed this issue indicate the generally accepted
view that the predominant structure for property development organisations,
not listed on a stock exchange, is a private company structure with an associated
trust structure due to the high levels of risk and return volatility attributed to
property development projects (Dowling, ; Fincher, ; Ball, ).
Figure 6.2.4: Ownership structure of participant organisations
Source: Author, 2018
29%
4%
61%
5%
2%
Publicly Traded Company (Listed) Public Company (Unlisted)
Private Company Government
Other
M Moorhead Empirical Survey 2016 n = 193
Chapter6:ResultsandAnalysis
MATTHEW MOORHEAD 180
This result is similar to the results other studies reported and reflected the
generally accepted belief regarding property development organisational
structure. For example, Preller ( ) found per cent of respondents
(Queensland property developers) were publicly listed and Wiegelmann ( )
found per cent of European property developers surveyed were publicly listed.
Further analysis concerning the differences between developers with differing
ownership structures regarding the selection and use of specific hurdle rate
metrics are given in the determination of research question RQ b in section
. . .
6.2.5Typeofdevelopmentprojects
Please provide the property type distribution percentage based on
the monetary value of your organisation’s property development
projects.
Figure . . a gives an overview of the percentage of each type of property
representation which respondents indicated their organisation undertake within
the overall level of development projects. Table . . illustrates the dominant
type of property that a respondent’s company undertakes for their property
development projects. A property development type category was defined as
dominant if that company completes at least % of their projects in a single
property type. Many companies did not have a dominant property type ( % of
respondents) and were then classified as a mixed‐use developer. The largest
classification of property type was residential developers, constituting % of
respondents. This result was as expected given that the majority of buildings
constructed in Australia ( . % in the year to June ) and New Zealand ( . %

Chapter6:ResultsandAnalysis
MATTHEW MOORHEAD 181
in the year to September ) where residential in character (ABS, b;
Statistics New Zealand, ).
Figure 6.2.5a: Distribution percentage (AUD end value) of the type of property developed
Source: Author,
Table 6.2.5: Type of development projects
Column1 Responses Response %
Residential Majority 98 39%
Commercial Majority 16 6%
Retail Majority 27 11%
Industrial Majority 27 11%
Tourism Majority 9 4%
Mixed‐Use or No Dominant 53 21%
Other, Childcare, Retirement, Infrastructure 19 8%
Total 249 100%
Source: Author,

Chapter6:ResultsandAnalysis
MATTHEW MOORHEAD 182
Retail and Industrial as a dominant development type each made up % of
responses with the Childcare/Other forming % of responses and the surprise
being that only % of respondents indicated the commercial type of property as
dominant, but these organisations tended to undertake larger sized projects. It
should be noted that % of respondents listed commercial property as a non‐
dominant property type of development project completed. The majority of
these non‐dominant commercial property developers listed residential
development as their majority property type.
Further analysis concerning the differences between the development of
different property types and the selection and use of specific hurdle rate metrics
are given in the determination of research question RQ a in section . . .
6.2.6Experienceversusnovicerespondents
Please indicate your level of experience in the decision‐making process
where you are involved in determining to proceed or not proceed with
potential property development projects.
Respondents were asked to indicate the number of years of experience they had
in the decision‐making process of whether to proceed with potential projects
and the results are summarised in Figure . . and Table . . . A total of
( %) of participants responded to this question in the survey.
The sample characteristics indicate an even spread across the experience
brackets with per cent of the respondents having more than ten years’
experience, per cent having five to ten years’ experience, per cent having
two to five years’ experience and per cent with relatively little experience
fewer than two years. The years of experience does not indicate workforce or

Chapter6:ResultsandAnalysis
MATTHEW MOORHEAD 183
industry experience but is concerned with the experience in the decision‐making
process of deciding whether to proceed with potential projects. Many project
managers in the property development industry will have many years of industry
experience before being placed in a position to decide on which projects the
organisation will pursue.
Figure 6.2.6: Respondent years of experience
Source: Author,
Just over half of respondents ( %) had five or more years’ experience with %
having significant experience of ten or more years. Within the structural
framework of property development companies, it is common for development
managers to assess the feasibility of a development project early in their career.
The qualitative structures in place will allow a site that passes a particular level
53
4349
4328%
23%
26%
23%
10 + years
5 ‐ 10 years
2 ‐ 5 years
1 ‐ 2 years
M Moorhead Empirical Survey 2016 n = 188
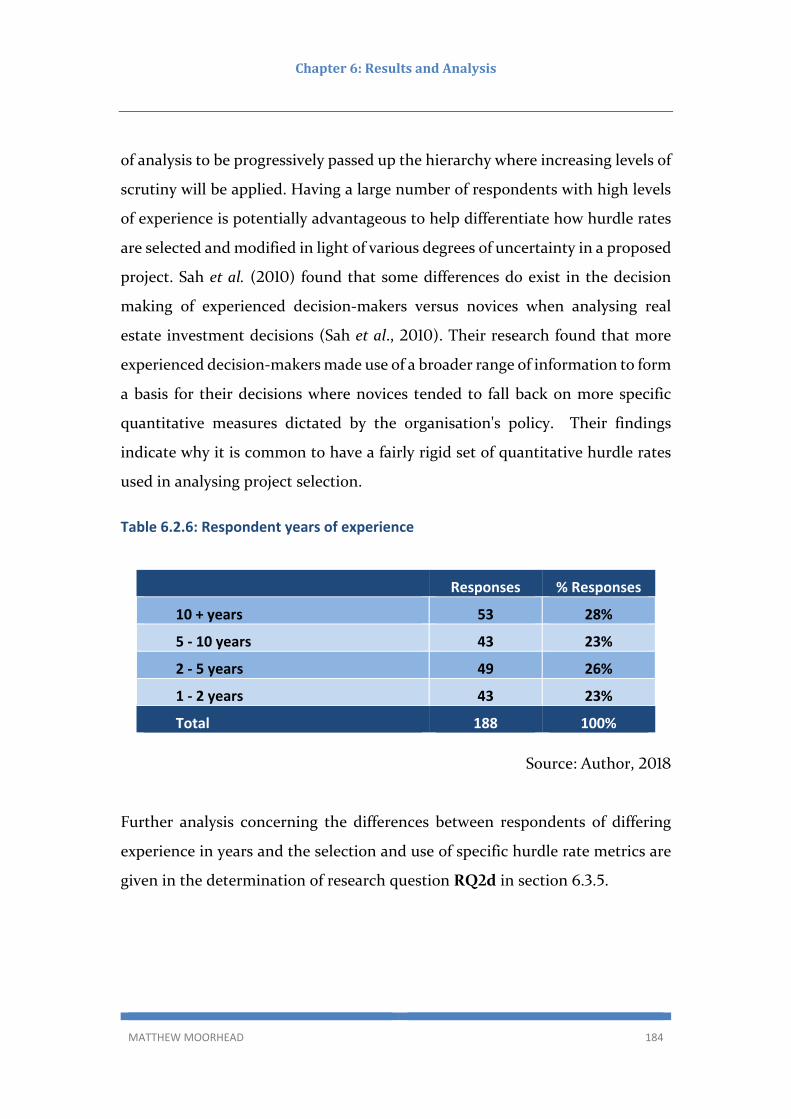
Chapter6:ResultsandAnalysis
MATTHEW MOORHEAD 184
of analysis to be progressively passed up the hierarchy where increasing levels of
scrutiny will be applied. Having a large number of respondents with high levels
of experience is potentially advantageous to help differentiate how hurdle rates
are selected and modified in light of various degrees of uncertainty in a proposed
project. Sah et al. ( ) found that some differences do exist in the decision
making of experienced decision‐makers versus novices when analysing real
estate investment decisions (Sah et al., ). Their research found that more
experienced decision‐makers made use of a broader range of information to form
a basis for their decisions where novices tended to fall back on more specific
quantitative measures dictated by the organisation's policy. Their findings
indicate why it is common to have a fairly rigid set of quantitative hurdle rates
used in analysing project selection.
Table 6.2.6: Respondent years of experience
Respondent Years of Experience Responses % Responses
10 + years 53 28%
5 ‐ 10 years 43 23%
2 ‐ 5 years 49 26%
1 ‐ 2 years 43 23%
Total 188 100%
Source: Author,
Further analysis concerning the differences between respondents of differing
experience in years and the selection and use of specific hurdle rate metrics are
given in the determination of research question RQ d in section . . .
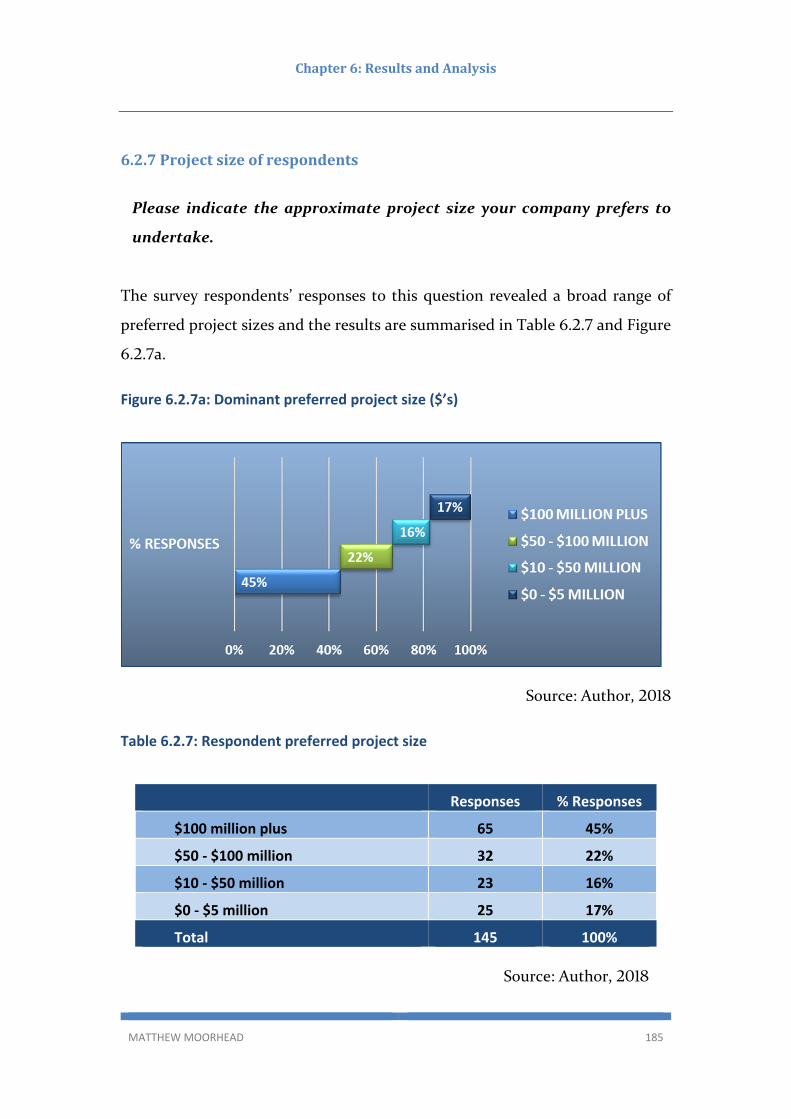
Chapter6:ResultsandAnalysis
MATTHEW MOORHEAD 185
6.2.7Projectsizeofrespondents
Please indicate the approximate project size your company prefers to
undertake.
The survey respondents’ responses to this question revealed a broad range of
preferred project sizes and the results are summarised in Table . . and Figure
. . a.
Figure 6.2.7a: Dominant preferred project size ($’s)
Source: Author,
Table 6.2.7: Respondent preferred project size
Respondent Preferred Project Size Responses % Responses
$100 million plus 65 45%
$50 ‐ $100 million 32 22%
$10 ‐ $50 million 23 16%
$0 ‐ $5 million 25 17%
Total 145 100%
Source: Author,

Chapter6:ResultsandAnalysis
MATTHEW MOORHEAD 186
The project sizes were chosen to classify respondents as either small, small‐
medium, medium‐large or large developers regarding the size of projects that
they prefer to undertake. Figure . . b breaks down project size by the
percentage of the projects undertaken by the property development organisation
in terms of AUD end value. The chosen sizes are also an indication of the type of
funding required and the difficulty faced by developers in funding projects of a
larger size. In total, survey participants responded to this question, and just
under half of the respondents ( %) can be placed in the large developer
category with preferred projects over $ million.
Figure 6.2.7b: Percentages of preferred project size by project cost (AUD end value)
Source: Author,
Prior surveys of property developers in Australia have tended to focus on the
larger developers (see Newell & Steglick, and Preller, ), but the break‐
up of respondents into the small and medium sizes allows for analysis of the
differences in hurdle rates of development companies based on size. Very little

Chapter6:ResultsandAnalysis
MATTHEW MOORHEAD 187
is to be found in current literature on the decision processes of small property
developers.
The distribution frequency of Figure . . b demonstrates that larger property
development projects are generally taken on by larger property development
organisations and smaller property development projects are more likely to
undertake smaller development projects.
6.2.8Educationalbackgroundofrespondents
Please indicate the highest level of education you have completed.
Respondents were asked to indicate the highest level of education completed
and also whether they have a formal qualification in a property‐related course.
Table . . and Figure . . a summarise the results:
Table 6.2.8: Educational background of respondents
Education Level of Respondents Responses % Responses
Doctorate or Professional Degree 4 2%
Master’s Degree 61 32%
Post Graduate Diploma 18 10%
University Bachelor’s Degree 91 48%
Diploma or Trade Certificate 8 4%
High School or Equivalent 6 3%
Total 188 100%
Source: Author,
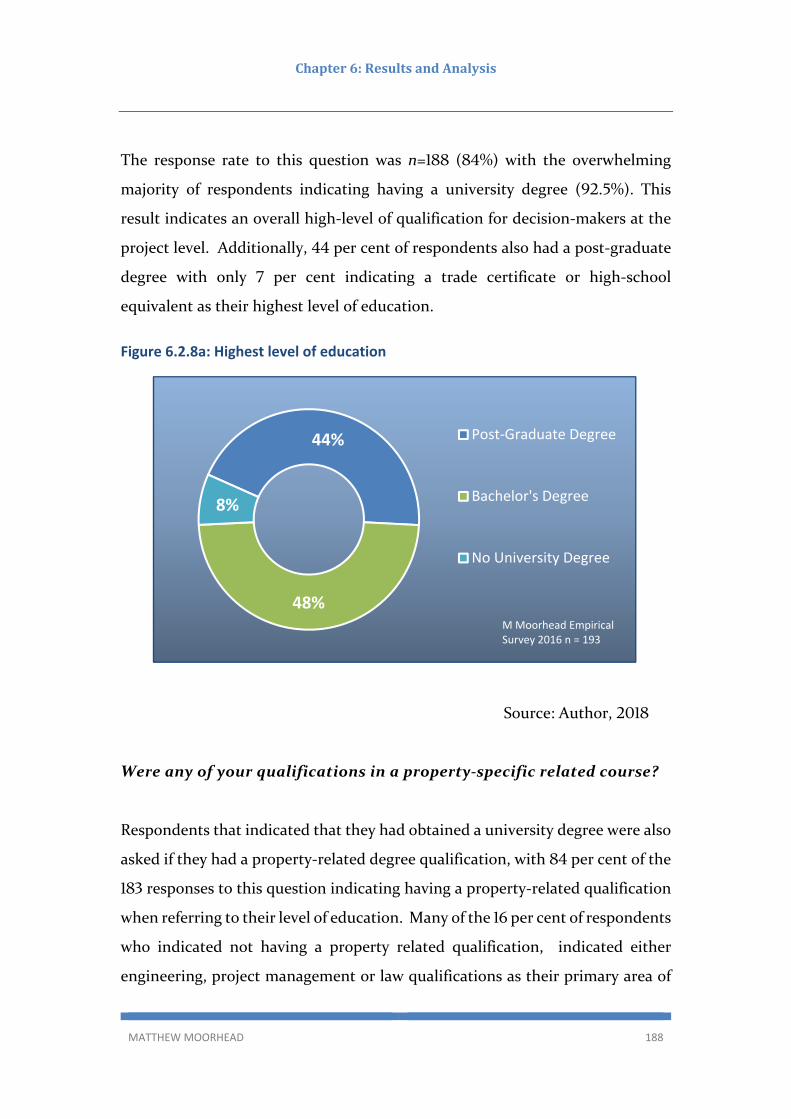
Chapter6:ResultsandAnalysis
MATTHEW MOORHEAD 188
The response rate to this question was n= ( %) with the overwhelming
majority of respondents indicating having a university degree ( . %). This
result indicates an overall high‐level of qualification for decision‐makers at the
project level. Additionally, per cent of respondents also had a post‐graduate
degree with only per cent indicating a trade certificate or high‐school
equivalent as their highest level of education.
Figure 6.2.8a: Highest level of education
Source: Author,
Were any of your qualifications in a property‐specific related course?
Respondents that indicated that they had obtained a university degree were also
asked if they had a property‐related degree qualification, with per cent of the
responses to this question indicating having a property‐related qualification
when referring to their level of education. Many of the per cent of respondents
who indicated not having a property related qualification, indicated either
engineering, project management or law qualifications as their primary area of
44%
48%
8%
Post‐Graduate Degree
Bachelor's Degree
No University Degree
M Moorhead Empirical Survey 2016 n = 193
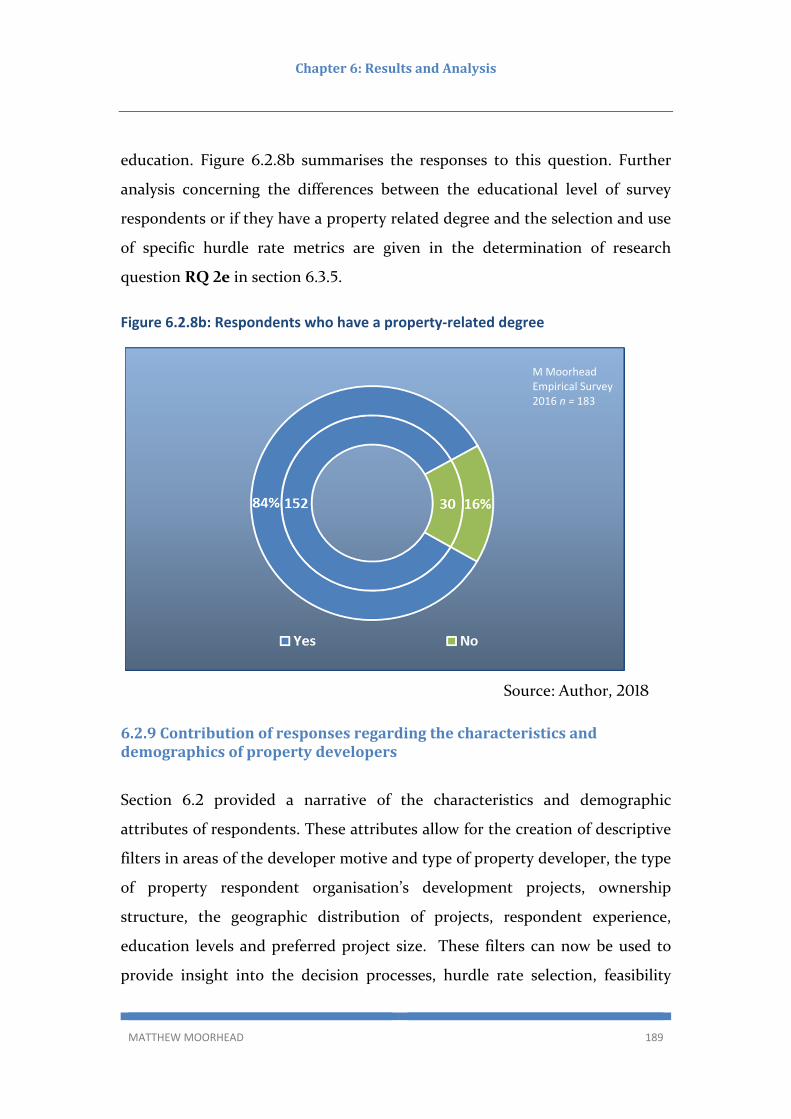
Chapter6:ResultsandAnalysis
MATTHEW MOORHEAD 189
education. Figure . . b summarises the responses to this question. Further
analysis concerning the differences between the educational level of survey
respondents or if they have a property related degree and the selection and use
of specific hurdle rate metrics are given in the determination of research
question RQ e in section . . .
Figure 6.2.8b: Respondents who have a property‐related degree
Source: Author,
6.2.9Contributionofresponsesregardingthecharacteristicsanddemographicsofpropertydevelopers
Section . provided a narrative of the characteristics and demographic
attributes of respondents. These attributes allow for the creation of descriptive
filters in areas of the developer motive and type of property developer, the type
of property respondent organisation’s development projects, ownership
structure, the geographic distribution of projects, respondent experience,
education levels and preferred project size. These filters can now be used to
provide insight into the decision processes, hurdle rate selection, feasibility
M Moorhead Empirical Survey 2016 n = 183

Chapter6:ResultsandAnalysis
MATTHEW MOORHEAD 190
practices, risk analysis practices as well as the management culture of
respondent property development organisations.
6.3Decisionprocesses&hurdlerateselection(dependentvariables)
This section is seeking to understand the organisational decision‐making
processes of survey respondents in deciding whether to proceed with a property
development project in the pre‐commitment stages of the development process.
A primary aim of this research is to explore the various decision methods used,
identify their level of use and the importance of each method to different sectors
of the industry. An analysis was conducted on respondent organisations
decision‐making structures including the approval process within the
organisation, the use and selection of project hurdle rates and specific
mechanisms for the adjustment of project hurdle rates. The following sections
provide a narrative into how respondent property development decision‐makers
choose, utilise and adjust specific project hurdle rates as well as the composition
and function of their organisational structure in regards to conducting viability
studies and choosing to proceed with projects beyond the pre‐commitment
stages of the development process.
6.3.1Specialiseddecision‐makingstructure
In the pre‐commitment stage of the project development process, the
company applies a consistent decision‐making methodology.
Respondents were asked to indicate if they strongly agree, agree, disagree or
strongly disagree with the statement that the company they work for applies a
consistent decision‐making methodology. The results of this question, shown in
Figure . . a, indicate that the majority of respondents either strongly agree
( %) or agree ( %) with the statement that there is a consistent methodology
applied throughout the company, versus respondents that either disagree ( %)

Chapter6:ResultsandAnalysis
MATTHEW MOORHEAD 191
or strongly disagree ( %). The responses demonstrate a high level of confidence
that the organisation for which they are employed is consistent in its decision‐
making methodology. This question was also coded into an additional variable
where those that either strongly agree or agree ( %) were combined and those
that either disagree or strongly disagree ( %) were combined to allow for
further analysis.
Figure 6.3.1a: The company applies a consistent decision‐making methodology
Source: Author,
A decision tree analysis was conducted as a preliminary investigation to find
strong predicters regarding the decision‐making methodology of survey
respondents. This analysis revealed a strong association with the use of the MDC
hurdle rate with a consistent decision‐making methodology and the CHAID
model was also able to predict . % of cases as demonstrated in Figure . . b,
see Appendix D‐ .
23%
58%
18%
1%
Strongly Agree Agree Disagree Strongly Disagree
M Moorhead Empirical Survey 2016 n = 170

Chapter6:ResultsandAnalysis
MATTHEW MOORHEAD 192
Figure 6.3.1b: Decision Tree analysis of the use of specific hurdle rates and a consistent decision‐making methodology
Classification
Observed
Predicted
No Yes Percent Correct
No 0 42 0.0%
Yes 0 145 100.0%
Overall Percentage 0.0% 100.0% 77.5%
Growing Method: CHAID
Dependent Variable: Q19 Company uses specific hurdle rates
Source: Author,

Chapter6:ResultsandAnalysis
MATTHEW MOORHEAD 193
Is there a specialised board, senior management or committee that must
approve the decision to proceed beyond the pre‐commitment stages of
the development process?
If yes, what is the type of specialised board, senior management or
committee that must approve the decision to proceed beyond the pre‐
commitment stages of the development process?
Figure 6.3.1c: Formalised decision process
Source: Author,
Figure . . c demonstrates that % of the respondents who answered this
question indicated that the organisation they work for had a formalised structure
for deciding to proceed with a project beyond the pre‐commitment stages of the
development process. This decision structure would generally be utilised at the
completion of a due diligence period, hence before site acquisition.
Figure . . d demonstrates that % (n = ) of responses indicate a single level
or point of project decision approval. Respondents with multiple levels of
required approval were equal to % of responses, and % of respondents did
YES82%
NO18%
M Moorhead Empirical Survey 2016 n = 188

Chapter6:ResultsandAnalysis
MATTHEW MOORHEAD 194
not indicate a level of required approval to proceed beyond the pre‐commitment
stages of the development process. Table . . breaks down the responses on the
required specific types of approval.
Table 6.3.1: Required approval for the decision to proceed
Required Approval for Decision to Proceed Responses % Responses
Company Board 106 56%
General Manager 47 25%
Financial Controller 17 9%
Senior Development Manager 18 10%
Risk Officer or Risk Committee 11 6%
Investor's Approval 15 8%
Total 214
*more than one response is possible
Source: Author,
Figure 6.3.1d: Number of levels of approval required for project commencement
Source: Author,
Chapter6:ResultsandAnalysis
MATTHEW MOORHEAD 195
Respondents were also given the opportunity to describe their approval process
and indicate other methods of obtaining approval to proceed with the following
question:
If you selected 'other' in the question above. Please describe the process
that occurs in order to approve the decision to proceed or not proceed
with potential property development projects.
The results indicate the majority ( %) of respondent organisations require a
company board to approve site acquisitions. followed by % of respondent
organisations requiring the sign‐off by a specific General Manager. This process
of seeking board or the General Manager’ approval, as indicated by the open‐
ended responses, typically involves the preparation of a feasibility analysis and
other supporting information to put forward a business case in support of the
purchase of the site and for undertaking the project. The board may consist of
senior development managers, risk officers, executive management/directors or
non‐executive directors who review the material submitted by acquisition staff
and make a decision on what is best for the organisation at a strategic level.
There was a total of thirteen responses to the open‐ended questions which
indicated the organisation for which they are employed has an approval system
different to the choices available. The responses can generally still be classified
as having an approval process similar to the available choices, but they differed
due to corporate structural issues or having to seek approval through a structure
of grouped investors. These open‐ended answers give insights into how the
process of board approval and/or investor approval operates. Specific examples
of comments provided include the following:

Chapter6:ResultsandAnalysis
MATTHEW MOORHEAD 196
Example : High‐level overview of the business case and financial model for the
development including indicative plans etc, which are used to confirm whether
there is the support to proceed (or amend as required).
(Senior Development Manager / Medium‐Large Project Size/ Primary
Retail Type/ Publicly Listed Company/ + years experience)
Example : Initial site feasibility is generally prepared by the Acquisition team
in consultation with the Development Manager to ensure costs estimates are
accurate. This feasibility is then presented to the two owners of the business,
who will decide about whether they wish to proceed with the purchase of the
site.
(Development Manager / Medium‐Small Project Size/ Primary
Residential Type/ Private Company/ ‐ years experience)
Example : We have a unique structure where we have an
acquisition/development company that sits separately to a property trust. %
of sites that we find will inevitably be 'developed' and owned by the property
trust and the acquisition company has a separate childcare operations
company that operate all sites that we find and develop. The other % of sites
may be leases or are developed by other companies under our supervision, so
we get the exact product at the end that we want, with the long‐term intention
that we have a long‐term lease on the property. All site acquisitions come down
to the acquisition company and where they sit in terms of ongoing building
ownership is what varies.
(Development Manager / Small Project Size/ Other Development Type/
Private Company/ ‐ years experience)
Example : Generally, a decision is made by the investors. Typically, there are
to investors that put money up for the development and ultimately make a
decision on everything.

Chapter6:ResultsandAnalysis
MATTHEW MOORHEAD 197
(Senior Development Manager / Medium‐Small Project Size/ Primary
Residential Type/ Private Company/ ‐ years experience)
These examples indicate that the structure of many development projects appear
complex and the boundaries between traditional speculative development and
property investment through the use of securitisation methods are becoming
more difficult to distinguish. Additionally, the results highlight that the majority
of development organisations in this survey do not rely purely on quantitative
metrics of project viability to make a decision, but use qualitative methods and
organisation structural checks and balances as a method for managing the
organisations’ risk.
Even though the majority of responses indicate that development organisations
rely on a single level of approval, the nature of that approval is at the corporate
board or executive level rather than at the level of project management. Smaller
development companies that do not have boards or a formal risk management
process are more likely to require the approval of the General Manager.
6.3.2Useofspecificquantifiablego/no‐godecisionprocesses
Does your company use a specific quantifiable go/no‐go decision process
in order to decide whether to proceed with a development project? This
may be pre‐set requirements such as forecasted profitability meeting a
return on cost (ROC) of X% for example.
Respondents were asked if they utilise a specific go/no‐go decision process in
deciding to proceed with a project beyond the pre‐commitment stages of the
development process. The results are summarised in Figure . . with the

Chapter6:ResultsandAnalysis
MATTHEW MOORHEAD 198
majority of respondents, %, indicated that the organisation in which they are
employed does utilise a specific go/no‐go decision process in decision‐making,
and % of respondents indicated that the company they work for does not. This
result is in line with the results of other surveys such as Hutchison et al. ( )
which found % of property investors and developers surveyed in the UK used
a specific hurdle rate as a decision metric applied to each project or investment.
Additionally, the result is also similar to that found by Preller ( ) and Crosby
et al. ( a; b) indicating that property development organisations
typically incorporate specific go/no‐go decision processes.
Figure 6.3.2: Summary of responses to go/no‐go decision process
Source: Author,
6.3.3HurdleRateSelection
Does your company incorporate specific fixed financially based hurdle
rates as a basis for project decisions? (Example: IRR, NPV, MDC or ROC)
135 5372% 28%
Yes No
M Moorhead Empirical Survey 2016 n = 188
Chapter6:ResultsandAnalysis
MATTHEW MOORHEAD 199
Please nominate the specific fixed financially based hurdle rates used
and a rough guideline of the required financial metric for project
decisions your company uses? (Example: IRR, NPV, MDC or ROC)
Respondents were asked if they incorporate specific financially based hurdle
rates to decide whether to proceed with a development project. A large majority
( %) of responses indicated that they do use specific financial hurdle rates and
% indicated that they do not as shown in Figure . . a. The % of
respondents who indicated the use of specific fixed financial‐based hurdle rates
were then asked to specify which hurdle rates they use and give an indication of
the minimum financial metric value they typically adopt. Respondents were also
given the opportunity to specify additional hurdle rates and discuss their use in
an open‐ended question. Figure . . b and Table . . demonstrate the level of
use of common hurdle rates in the sample of the property development industry,
and it should be noted that more than one response was possible. The results
are broadly in line with what was expected and in comparison to the relevant
literature on hurdle rates usage in property development (Costello and Preller,
; Wiegelmann, ; IPD ( ), Crosby et al., a; Hutchison et al., ).
The most commonly used hurdle rate, at % usage, was MDC which can also
be referred to as return on cost (ROC). The values specified by respondents
ranged from % to % with respondents able to indicate a lower and higher
percentage range for their projects. The results also indicated a median MDC
percentage at % and the mean at . %. The median value demonstrates, as
discussed in Chapter , the ubiquitous belief in the Australian and New Zealand
property development industries that a project should achieve a minimum MDC
of % in order to justify the risk of undertaking that project. Additionally, the
majority ( %) of respondents who use MDC as a hurdle rate indicated that they
use exactly % as the minimum MDC percentage acceptable for a project. This
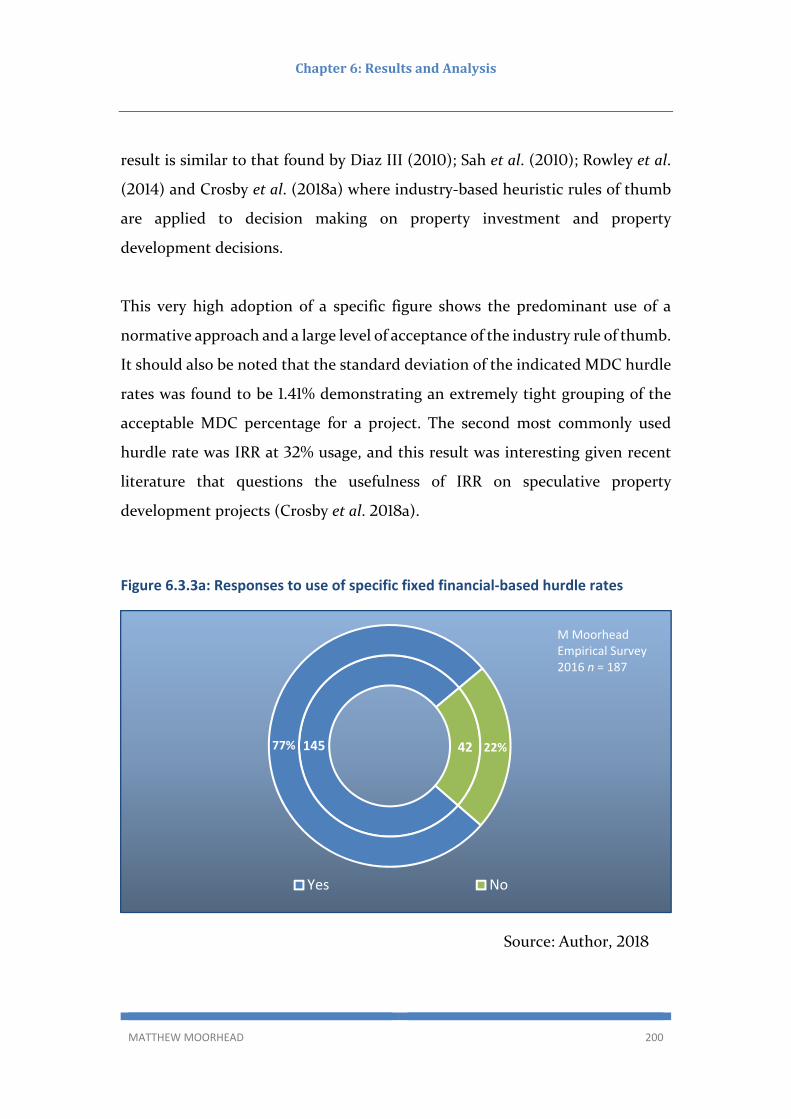
Chapter6:ResultsandAnalysis
MATTHEW MOORHEAD 200
result is similar to that found by Diaz III ( ); Sah et al. ( ); Rowley et al.
( ) and Crosby et al. ( a) where industry‐based heuristic rules of thumb
are applied to decision making on property investment and property
development decisions.
This very high adoption of a specific figure shows the predominant use of a
normative approach and a large level of acceptance of the industry rule of thumb.
It should also be noted that the standard deviation of the indicated MDC hurdle
rates was found to be . % demonstrating an extremely tight grouping of the
acceptable MDC percentage for a project. The second most commonly used
hurdle rate was IRR at % usage, and this result was interesting given recent
literature that questions the usefulness of IRR on speculative property
development projects (Crosby et al. a).
Figure 6.3.3a: Responses to use of specific fixed financial‐based hurdle rates
Source: Author,
145 4277% 22%
Yes No
M Moorhead Empirical Survey 2016 n = 187

Chapter6:ResultsandAnalysis
MATTHEW MOORHEAD 201
The mean minimum acceptable IRR percentage for a project was . %, and the
median was %. The minimum IRR percentage indicated was % and the
maximum was %, and the standard deviation was a very narrow . %. This
result was similar to the MDC/ROC result in that industry decision‐makers
demonstrate a very narrow range of acceptable IRR percentages and adoption of
the industry ‘rule of thumb’ in relation to the use of IRR.
Figure 6.3.3b: Percentage frequency of specific hurdle rates used in project decision making of all survey respondents
Source: Author,
A surprising result was the relatively low‐level usage of NPV as a project decision
hurdle rate at %, given the ability within many proprietary feasibility analysis

Chapter6:ResultsandAnalysis
MATTHEW MOORHEAD 202
programs to calculate this financial metric using the DCF method of feasibility
analysis. Respondents indicated % usage of hurdle rates that are not specific
financial metrics and will be defined in this research as a Qualitative Approach
hurdle rate.
Table 6.3.3: Specific hurdle rates parentage use and descriptive result
Source: Author,
Respondents indicated the usage of a target internal rate of return (TIRR) at %.
A TIRR is often used when there is a requirement for the use of residual land
value calculations at the site acquisition stage of a project. The project analyst
will calculate the required profit on a project and solve the development
equation to determine the residual land value using one or more of the methods
described in Chapter . If an IRR is used as the project hurdle rate, then the
desired project IRR is set as a target internal rate of return (TIRR) which must
be given to calculate the maximum bid price for the land. However, it should be
Hurdle Rates % Use Mean Median Minimum Maximum
Standard
Deviation
Margin on Development
Cost/Return on Cost
(MDC/ROC)
40% 19.30% 20.00% 10.00% 30.00% 1.41
Internal Rate of Return (IRR) 32% 18.17% 18.00% 10.00% 30.00% 4.85
Qualitative Approach 16%
Target Internal Rate of Return
(TIRR)15% 19.93% 20.00% 15.00% 30.00% 4.03
Return on Equity (ROE) 10% 36.67% 25.00% 10.00% 100.00% 25.56
Net Present Value (NPV) 7%
Minimum $ Project Size 5% 46,777,778$ 20,000,000$ 2,000,000$ 300,000,000$ 78,103,742
Return on Investment (ROI) 5% 26.67% 20.00% 10.00% 80.00% 21.65
Minimum $ Profit 4% 3,162,500$ 1,000,000$ 300,000$ 10,000,000$ 4,235,542
Minimum Payback Period 3% 8.33 5.00 5.00 20.00 6.05
Margin on Revenue (MOR) /
Return on Revenue (ROR)2% 25.00% 25.00% 25.00% 25.00% 0.00

Chapter6:ResultsandAnalysis
MATTHEW MOORHEAD 203
noted that when a project manager is forecasting an IRR in a feasibility analysis
for a potential project the IRR and TIRR are essentially the same. Both MDC and
TIRR are common methods used in residual land value calculations. Similar to
the IRR and MDC results, the standard deviation was . % with the mean
minimum TIRR of . % and the median at . % with the range of minimally
acceptable TIRR at % and the maximum at %.
Other hurdle rates utilised by respondent development organisations included
ROE at % usage, minimum dollar project size and ROI at % usage, minimum
dollar profit on the project at %, minimum payback period at % usage and
margin on revenue or MOR at % usage. Table . . gives the respondent
responses regarding hurdle rate usage including the mean, median, minimum,
maximum and standard deviation of results.
If you selected 'other' in the question above. Please list and describe
additional hurdle rates used in order to approve the decision to proceed
or not proceed with potential property development projects.
There was a total of eight responses to the open‐ended questions asking
respondents to list additional hurdle rates used to make a decision to proceed or
not proceed with a project. The responses which allowed respondents to list and
describe hurdle rates different to those described in Figure . . b were
predominately focused on the needs of clients of Developer Managers who are
undertaking investment development projects, or for not‐for‐profit
organisations where economic profit is not the primary project objective.
Specific examples of comments provided include the following:
Example : For commercial assets, the key returns are average fund
distributions as well as average total distributions (income and any capital
value, e.g. cap rate compression on exit). Different funds may focus on IRR,
Chapter6:ResultsandAnalysis
MATTHEW MOORHEAD 204
Annual distributions or total annual distributions depending on their
investment mandate. For example, a client looking for core income producing
properties with a long‐term hold will likely focus on average annual
distribution.
(Development Manager / Large Development Project Size/ Primary
Commercial Type/ Publicly Listed Company/ – years experience)
Example : Peak Equity / Debt plus a project’s required to deliver a target
margin with minimal to zero price escalation. Peak equity and peak debt are
large considerations to equity investors.
(Senior Development Manager / Large Development Project Size/ Primary
Residential Type/ Private Company/ – years experience)
Example : Not‐for‐profit organisations receive donations/grants etc. which
determines the allocation of investment. If any metrics are used it’s an 'on
going' analysis of operational costs that gets calculated.
(Development Manager / Medium‐Small Development Project Size/ Primary
Other Development Type (non‐profit)/ Private Company/ – years
experience)
The results of section . . indicate that the majority of property developers
surveyed that utilise specific hurdle rates use a set of common industry accepted
minimum financial metrics.
6.3.4DeterminationofresearchquestionRQ1:
RQ : Do Australian and New Zealand property development firms use
specific go/no‐go hurdle rate mechanisms as a decision basis for
proceeding beyond the pre‐commitment stages of the development
process? What are the specific hurdle rates and benchmarks which are

Chapter6:ResultsandAnalysis
MATTHEW MOORHEAD 205
currently being used by Australian and New Zealand property
development firms?
The majority ( %) of Australian and New Zealand development firms surveyed
directly use specific hurdle rates as a decision‐making tool in choosing whether
to proceed with a project beyond the pre‐commitment stages of the
development process. Of those developers who do use specific go/no‐go hurdle
rates, approximately half ( %) use the Margin on Development Cost (MDC) as
a decision‐making hurdle rate as illustrated in Figure . . a.
A Chi‐square test of independence was conducted and demonstrated at the %
statistical significance level that there is an association between respondents
who use hurdle rates as a decision tool and the use of MDC as a basis of that
decision, 𝜒 ( , n= ) = . , p<. ; (see Appendix H‐ ). The second most
frequently used ( %) metric for go/no‐go hurdle rates was the Internal Rate of
Return (IRR). Like the MDC, a Chi‐square test of independence was conducted
and demonstrated at the % statistical significance level that there is an
association between respondents who use hurdle rates as a decision tool and the
use of IRR, 𝜒 ( , n= ) = . , p<. ; (see Appendix H‐ ).
Additional tests were conducted regarding the use of specific hurdle rate metrics
to gain insights into their use by survey respondents. Specifically, a number of
Mann‐Whitney U tests were conducted and found a significant difference in the
median response for the use of a number of key hurdle rates. Firstly, the use of a
minimum dollar project size requirement for projects was tested and found, at
the % statistical significance level, that private company structured
development organisations were more likely to use this hurdle rate (Md = . ,
n = , U = . , z = ‐ . , p = . , r = . ) versus other forms of organisational
structure (Md = . , n= ). Secondly, a further Mann‐Whitney U test found,
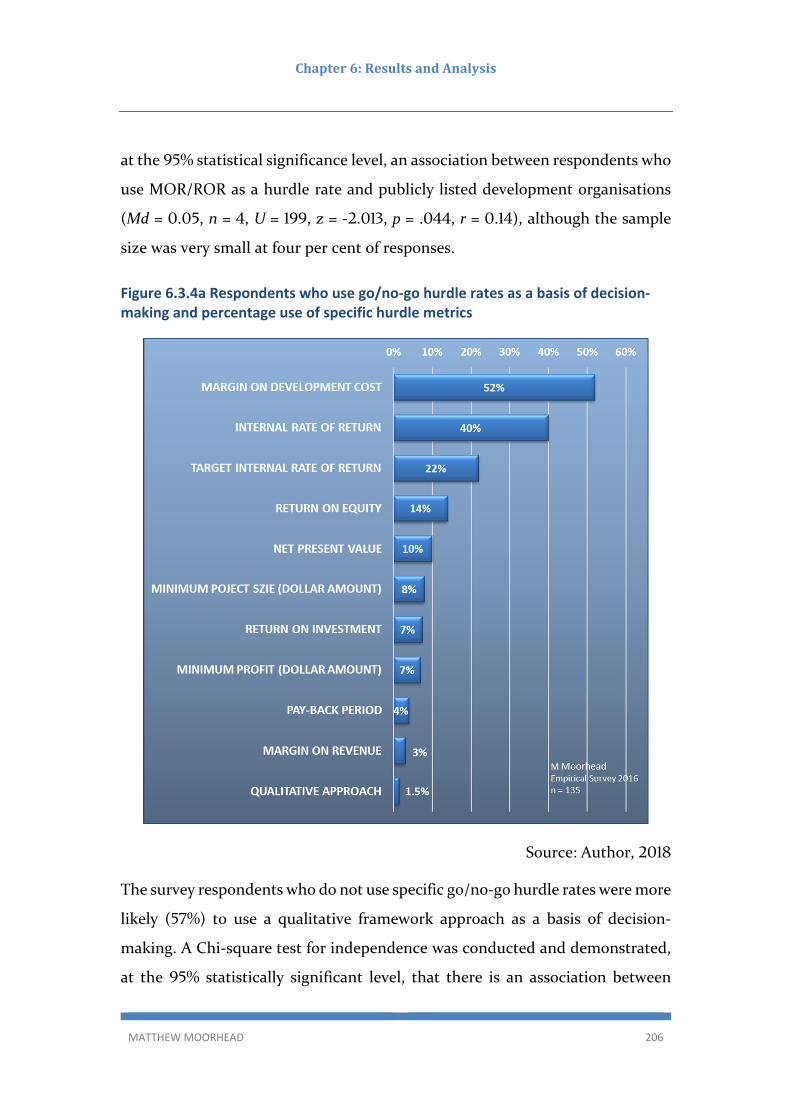
Chapter6:ResultsandAnalysis
MATTHEW MOORHEAD 206
at the % statistical significance level, an association between respondents who
use MOR/ROR as a hurdle rate and publicly listed development organisations
(Md = . , n = , U = , z = ‐ . , p = . , r = . ), although the sample
size was very small at four per cent of responses.
Figure 6.3.4a Respondents who use go/no‐go hurdle rates as a basis of decision‐making and percentage use of specific hurdle metrics
Source: Author,
The survey respondents who do not use specific go/no‐go hurdle rates were more
likely ( %) to use a qualitative framework approach as a basis of decision‐
making. A Chi‐square test for independence was conducted and demonstrated,
at the % statistically significant level, that there is an association between

Chapter6:ResultsandAnalysis
MATTHEW MOORHEAD 207
respondents who do not use hurdle rates as a decision tool and the use of a
qualitative framework as the basis of decision‐making, 𝜒 ( , n= ) = . ,
p<. ; (see Appendix H‐ ).
Figure 6.3.4b Frequency of number specific hurdle rate metrics
Source: Author,
The responses of participants from Australia were compared with those from
New Zealand to determine if any statistically significant differences exist in their
choice of hurdle rates and the number of hurdle rates used in decision‐making.
A Chi‐square test of independence was conducted which indicated there were
minimal differences in the choice, use and number of hurdle rates between
respondents who conduct property developments in the respective national
markets. It should be noted that the sample size of New Zealand organisations
was small ( ) and imposes a limitation upon the result. The only statistically
significant results, between New Zealand and Australian based organisations,
were found in that New Zealand respondents are more likely to use the Minimum
Profit dollar amount and Minimum Project Size dollar amount than were
46%
25%
20%
9%
USE OF SINGLE HURDLE RATE IN DECISION MAKING
USE OF TWO HURDLE RATES IN DECISION MAKING
USE OF THREE HURDLE RATES IN DECISION MAKING
USE OF FOUR OR MORE HURDLE RATES IN DECISION MAKING
M MoorheadEmpirical Survey 2016 n = 142

Chapter6:ResultsandAnalysis
MATTHEW MOORHEAD 208
Australian based respondents. (Minimum Profit; 𝜒 ( , n= ) = . , p<. ;
Minimum Project Size 𝜒 ( , n= ) = . , p<. ; see Appendix H‐ ).
Figure . . b represents the frequency of the number of specific hurdle rate
metrics used by respondent organisations in their deciding whether to proceed,
or not proceed, with projects beyond the pre‐commitment stages of the
development process. The majority ( %) of respondents who utilise hurdle
rates in decision‐making use either one or two specific hurdle rate metrics, with
% using only one and % using two. Few ( ) survey participant developers
indicated they use four or more specific hurdle rate metrics.
FindingRQ1:
Australian and New Zealand based property development organisations do
utilise specific go/no‐go hurdle rates mechanisms as a decision basis for
proceeding beyond the pre‐commitment stages of the development process.
Specifically, Australian and New Zealand property developers use MDC and IRR
as specific hurdle rate metrics to determine the go/no‐go decision to proceed
with a project beyond the pre‐commitment stages of the development process.
The majority ( %) of respondent property developers use either one or two
specific hurdle rate metrics as a basis of decision making, and very few ( %) use
four or more. For respondent organisations which do not use specific hurdle
rates for go/no‐go decision‐making, they are more likely ( %) to use qualitative
frameworks as a decision‐making method. The results of the survey demonstrate
little difference between the choice, use and the number of specific hurdle rates
employed in decision‐making between New Zealand and Australian based
respondents.

Chapter6:ResultsandAnalysis
MATTHEW MOORHEAD 209
6.3.5DeterminationofresearchquestionRQ2a.tog.
RQ : What are the differences in the hurdle rates and benchmarks
selection as the basis of go/no‐go decisions based on the following
factors:
RQ 2a: Projects by property types including residential, commercial, retail,
industrial, retirement, infrastructure and mixed‐use projects?
As stated in section . . , survey responses were examined along the basis of
whether developers demonstrate a dominant property type in the projects they
undertake. Responses were analysed from two aspects in order to address the
question of whether differences exist in the selection and use of hurdle rates by
developers of differing dominant property types. First, each dominant property
type developer category was analysed to determine whether they use specific
hurdle rates as part of a go/no‐go decision basis. Second, the use of specific
hurdle rates was examined as well as the specific minimum financial metric used
for each respective hurdle rate.
The categories of property developers with a dominant property type were first
tested for an association between the dominant property type and the use of a
specific quantifiable go/no‐go decision process. A Chi‐Square test for
independence was conducted and found that there were numerous violations of
the assumption of not having less than an expected frequency of five responses
for each category. Each dominant development property type category was then
tested independently using either Chi‐Square or Fisher’s Exact to accommodate
for any small expected frequencies. The results of the analysis are presented in
Table . . a and found no association between dominant property type

Chapter6:ResultsandAnalysis
MATTHEW MOORHEAD 210
developer categories and having a go/no‐go decision process (see Appendix H‐
).
This result demonstrated that the various dominant property type categories of
survey respondents had no significant impact on whether they use a primarily
quantitative or qualitative basis for project decisions at the acquisition or
commencement stages of the property development process. The dominant
property type categories were then condensed to allow for residential,
commercial, retail, mixed‐use and other property categories to be tested for
association using a Chi‐Square test for independence regarding the use of key
hurdle rate metrics including MDC, IRR, ROE and NPV. The reduction of
industrial and other dominant developer types was due to the small sample size
of these development types which were in violation of the test assumptions.
Table 6.3.5a: Chi‐Square and Fisher’s Exact test for independence of dominant property type and go/no‐go decision processes
Chi-Square Test for Independence p-
value df n =
Residential Dominant Developer Type 0.563 Chi-square no association 1 188
Commercial Dominant Developer Type 0.240 Fisher's Exact no association 1 188
Retail Dominant Developer Type 0.777 Chi-square no association 1 188
Industrial Dominant Developer Type 0.405 Fisher's Exact no association 1 188
Tourism Dominant Developer Type 0.713 Fisher's Exact no association 1 188
Mixed-Use Dominant Developer Type 0.271 Chi-square no association 1 188
Other Property Type 0.165 Chi-square no association 1 188
Source: Author,
The Chi‐Square tests of independence were then completed with the condensed
variable and indicated that there exists a significant association for residential
developers and the use of MDC but not IRR, ROE and NPV; 𝜒 ( , n= ) =

Chapter6:ResultsandAnalysis
MATTHEW MOORHEAD 211
. , p<. . Within the survey results, residential dominant property
developers are more likely to use MDC as a hurdle rate in decision making than
other dominant property types. No other associations were found between other
dominant property type developer categories and the use of MDC, IRR, ROE or
NPV (see Appendix H‐ ).
Respondent developers who indicated that they utilise a specific go/no‐go
decision process and also specific hurdle rates were asked to indicate the
minimum acceptable project hurdle rate for each of the metrics listed in section
. . and Figure . . . The specific minimum percentage as a financial metric of
the key hurdle rate metrics of MDC and IRR were investigated in regards to
significant differences of respondents on the basis of dominant property type
groups.
Comparison between‐groups of dominant property type categories and MDC percentage.
A one‐way analysis of variance (ANOVA) was conducted between‐groups to
investigate the required level of MDC percentage between different categories of
dominant property type. There was found to be no statistically significant
difference between the differing dominant property type categories: F( , ) =
. , p = . (see Appendix J‐ ). Figure . . a: illustrates the mean specified
MDC percentage for each dominant property type category.
The mean levels of the percentage of MDC used by the residential, commercial,
retail, mixed‐use and other categories of dominant property type were very close
to the industry standard % MDC hurdle rate discussed in section . . . Only
the industrial dominant property type category had a mean that differed
considerably at %, but was not found to be significant in the one‐way ANOVA.
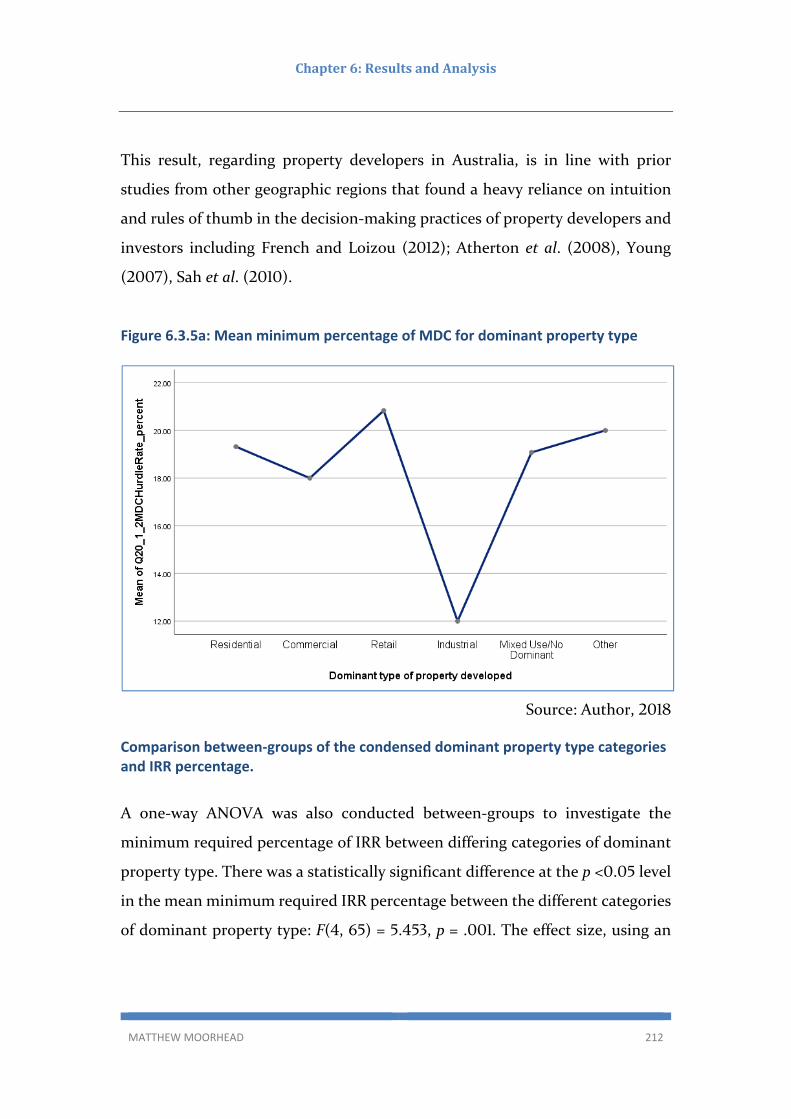
Chapter6:ResultsandAnalysis
MATTHEW MOORHEAD 212
This result, regarding property developers in Australia, is in line with prior
studies from other geographic regions that found a heavy reliance on intuition
and rules of thumb in the decision‐making practices of property developers and
investors including French and Loizou ( ); Atherton et al. ( ), Young
( ), Sah et al. ( ).
Figure 6.3.5a: Mean minimum percentage of MDC for dominant property type
Source: Author,
Comparison between‐groups of the condensed dominant property type categories and IRR percentage.
A one‐way ANOVA was also conducted between‐groups to investigate the
minimum required percentage of IRR between differing categories of dominant
property type. There was a statistically significant difference at the p < . level
in the mean minimum required IRR percentage between the different categories
of dominant property type: F( , ) = . , p = . . The effect size, using an

Chapter6:ResultsandAnalysis
MATTHEW MOORHEAD 213
eta squared calculation, was equal to . , and according to Cohen ( , p. )
represents a large effect as it is greater than . (See Appendix J‐ ).
Table 6.3.5b: ANOVA comparison of the percentage of IRR as a minimum hurdle rate from dominant property type groups (condensed)
Tukey’s HSD Comparisons
Group n Mean SD Residential Commercial Retail Mixed-
Use
Residential 36 19.85 4.56 .004 .027
Commercial 3 15.67 4.04
Retail 8 13.69 3.65 .004
Mixed-Use 11 15.36 3.44 .027
Other 8 20.12 4.48 .030
The mean difference is significant at the 0.05 level
The posthoc analysis using Tukey’s HSD comparisons shows that the mean
required IRR percentage for the residential dominant category to be higher than
that of the retail and mixed‐use dominant categories. Additionally, the other
property dominant type category which included both industrial and childcare
developer respondents was higher than that of retail and was very close to the
%, as was the mean result of the residential dominant category. These results
demonstrate that the respondent developer’s perception that residential, mixed‐
use and the other property type categories should have a higher IRR return as a
benchmark for proceeding with a project and reflect a higher required
risk/reward trade‐off than for retail and commercial property development
projects. Figure . . b illustrates the mean IRR percentages required by each
dominant property type category. One possible explanation for retail property
developers having a lower required IRR is due to the propensity of these projects

Chapter6:ResultsandAnalysis
MATTHEW MOORHEAD 214
lasting longer than other property type development projects. The longer time‐
frames would lower the IRR of many projects.
Figure 6.3.5b: Mean minimum percentage of IRR for dominant property type
Source: Author,
Artificial Neural Network (ANN) as a predictor of hurdle rate section of dominant property type groups
An ANN analysis was conducted on the data set using Multilayer Perceptron to
analyse predictors of survey respondents hurdle rate section based upon
dominant property type groups. The ranking of the importance of variables and
the classification table for the training and testing of the model can be found in
Appendix E‐ . The results included the the variables that are the best predictors
includes the decision‐makers job role, the use of qualitative frameworks as a
hurdle rate, the level of experience of the decision‐maker, the use of specific risk‐
analysis methods, the educational level of the decision‐maker and also whether
the firm utilises a specific mechanism as the basis of a go/no‐go decision in the
pre‐commitment stages of the development process.

Chapter6:ResultsandAnalysis
MATTHEW MOORHEAD 215
FindingsRQ2a:
Differences between dominant property type categories for Australian and New
Zealand property development organisations were examined across a number of
dependent variables to determine differences in hurdle rate usage and
specification. No significant results were found among respondents when
dominant property type categories were investigated for differences in whether
the category used a specific go/no‐go decision process. This result demonstrated
that the various dominant property type categories of respondents had no
significant differences in the adoption of primarily quantitative or qualitative
methods for making project decisions at the acquisition or commencement
stages of the property development process. Specific hurdle rate metrics
including MDC, IRR, ROE an NPV were tested to ascertain if significant
differences existed in their usage among the categories of dominant property
type categories. A significant difference was found in that the residential
dominant developer category was more likely to use MDC as a hurdle rate metric,
and no other significant results were found among the remaining dominant
property type categories and the use of IRR, ROE and NPV. For those
respondents who do utilise these specific financial metrics in decision‐making,
the actual specific minimum percentages and levels used were examined to see
if significant differences exist. The results indicated there was no statistically
significant difference between the differing dominant property type categories
and the specific percentage of MDC adopted with a median level of %. This
result is in line with prior relevant studies and demonstrates that the surveyed
Australian and New Zealand property developers reliance on an industry rule of
thumb.
However, an examination between groups regarding the specification of the
percentage of IRR demonstrated that the mean required IRR percentage for the

Chapter6:ResultsandAnalysis
MATTHEW MOORHEAD 216
residential dominant category to be higher than that of the retail and mixed‐use
dominant categories. Additionally, the ‘other’ property dominant type category
which included both industrial and childcare developer respondents was higher
than that of retail and was very close to the % mean result of the residential
dominant category. These results demonstrate the respondent developers’
perception that residential, mixed‐use and the other property type categories
should have a higher IRR return as a benchmark for proceeding with a project
and reflect a higher required risk/reward trade‐off than what is required for retail
and commercial property development projects. A possible explanation for the
lower required IRR for retail projects is due to the extended project timeframes
in comparison to the other property types thereby lowering the IRR.
RQ2b:Projectsbydevelopmentcompanysizeandownership?Publiclylistedandprivatedevelopmentcompanies?Large,medium‐large,medium‐smallorsmallprojects?
The hurdle rate selection and usage practices of respondent developers were
examined in regards to their preferred project size and ownership structure. A
number of tests were conducted using either a one‐way ANOVA or a two‐way
ANOVA between groups to investigate the differences in hurdle rates practices
for public versus private respondent developers and also along the basis of
respondent developers’ preferred project sizes. As discussed in Chapter , large
project sizes are defined as those where the end value or gross realisation is
greater than fifty million dollars (the large and medium‐large projects were
condensed for statistical analysis) and small project sizes are defined as less than
or equal to five million dollars in end value. Medium‐sized projects have an end
value between that of the large and small project sizes. The hurdle rates practices
investigated included the use of NPV as a hurdle rate, the specific number of
hurdle rates used as a project go/no‐go decision basis as well the specific
percentages of MDC, IRR and ROE adopted.

Chapter6:ResultsandAnalysis
MATTHEW MOORHEAD 217
Comparison between‐groups of public versus private structured development
organisations
The different types of ownership structure were analysed to determine if there
are significantly different practices in the selection of hurdle rate, go/no‐go
decision processes and the risk analysis techniques adopted in determining
which projects should proceed beyond the pre‐commitment stages of the
development process. Specifically, the practices of private company developers
will be characterised against development organisations which are publicly
listed on an exchange.
It was anticipated that the publicly listed organisations would have more robust
decision‐making practices when selecting property development projects due to
the larger size, access to more resources, higher reporting requirements and
market scrutiny. Table . . c lists the response numbers and percentages of each
ownership category of survey respondents. For the purposes of statistical
analysis this variable was also condensed into an alternative variable, entitled
Condensed Ownership Structure, by combining the public unlisted and
government categories with the other category in order to increase the minimum
number of responses for each category and focus on the differences between
property developer organisations which use a public or private structure. As the
majority of respondents ( %) were private companies, the results may
demonstrate a bias towards less sophisticated decision‐making methodologies
as discussed in Chapter section . . Hutchison et al. ( , p. ) found that, in
organisations in the UK, larger publicly listed organisations were more likely to
use IRR and NPV hurdle rates and smaller private companies relied more ‘on
subjective criteria and ‘gut feel’’. Preller ( ) found a similar result with the
majority of respondents indicating the use of MDC, IRR and NPV by a sample of
Queensland property developers, most of which were large organisations.

Chapter6:ResultsandAnalysis
MATTHEW MOORHEAD 218
Table 6.3.5c: Ownership structure by the organisation of survey respondents
Column1 Responses Response %
Publicly Traded Company (Listed) 56 29%
Public Company (Unlisted) 8 4%
Private Company 117 61%
Government 9 5%
Other 3 2%
TOTAL 193 100%
Source: Author,
A similar result was found for the use of IRR as a hurdle rate for decision‐making
in the pre‐commitment stages of the development process, but not for the use
of NPV by publicly listed developers. A Mann‐Whitney U test was performed
and this test confirmed a statistically significant difference ( %) for the use of
IRR as a hurdle rate for publicly listed developers (Md = . , n = ) than for
non‐publicly listed property developers (Md = . , n = , U = , z = ‐ . ,
p = . , r = . ; see Appendix F‐ ).
Inversely, when private company structured property development
organisations were analysed it was found that there exists a statistically
significant difference ( %) for the use of IRR as a hurdle rate for non‐private
company developers (Md = . , n = ) than for private company structured
property developers (Md = . , n = , U = , z = ‐ . , p = . , r = . ),
indicating private company structured developers are less likely to use IRR as a
decision‐making hurdle rate. Additionally, it was found that private company
structured companies were also less likely to incorporate specific hurdle rates in
general than for non‐private structured companies. This result is in line with
that found by Hutchison et al. ( ) in that small and private companies were
more likely to rely on subjective criteria. The result of the Mann‐Whitney U

Chapter6:ResultsandAnalysis
MATTHEW MOORHEAD 219
tests found, at the % statistically significance level, private companies have a
lower use of specific hurdle rates in decision making (Md = . , n = , U =
, z = ‐ . , p = . , r = . ; see Appendix F‐ ).
As discussed in section . . it was anticipated that the use of NPV as a decision‐
making hurdle rate would be high due to the prevalent recommendation and use
of this financial‐metric in the financial investment literature as discussed in
Hutchison et al. ( ). However, the use of NPV was found to be only per
cent of survey respondents. An investigation was conducted to analyse if there
was a significant difference in the use of NPV based on preferred project size and
on ownership structure. Due to the small number of respondents indicating the
use of NPV as a hurdle rate, the project size variable was limited to medium and
large project sizes and a Fisher’s Exact test was utilised to test between groups.
The results indicate there was no significant association between respondents’
preferred project size and the use of NPV as a hurdle rate, 𝜒 ( , n = ), p = . ;
see Appendix H‐ . Likewise, a Chi‐square test of independence was performed,
with the result indicating no significant association between the use of NPV as a
hurdle rate and a condensed ownership variable including public, private or
other structures, 𝜒 ( , n = ) = . , p = . ; see Appendix H‐ . The
ownership variables were condensed by combining the small number of public
unlisted as a category with the other to aid in the statistical analysis.
The specific levels used for MDC, IRR and ROE as well as the number of hurdle
rates used in decision‐making were also tested to determine differences along
the basis of preferred project size. The results of these tests are presented in
tables . . d and . . e respectively. A statistically significant difference was
found between groups for the number of specific hurdle rates used, and also for
the percentage level of ROE adopted. The percentage level specified for MDC
and IRR was not statistically significant.

Chapter6:ResultsandAnalysis
MATTHEW MOORHEAD 220
Table 6.3.5d: Mean, standard deviation and standard error of large medium and small project sizes and hurdle rates
Source: Author,
Table 6.3.5e: One‐way ANOVA of large, medium and small project size and hurdle rate levels
Source: Author,
Small 25 1.40 1.26 0.25
Medium 60 1.17 1.20 0.15
Large 97 1.81 1.54 0.16
Total 182 1.54 1.42 0.11
Small 12 19.00 2.89 0.83
Medium 25 20.28 3.98 0.80
Large 43 18.79 2.97 0.45
Total 80 19.29 3.34 0.37
Small 7 18.57 3.82 1.45
Medium 11 17.05 5.31 1.60
Large 47 18.37 4.94 0.72
Total 65 18.17 4.85 0.60
Small 3 75.00 25.00 14.43
Medium 6 42.50 29.79 12.16
Large 12 24.17 9.00 2.60
Total 21 36.67 25.56 5.58
Number of specific hurdle
rates
MDC percentage
IRR percentage
ROE percentage
N Mean
Std.
Deviation Std. Error
Sum of
Squares df
Mean
Square F Sig.
Between Groups 16.16 2 8.08 4.14 0.02
Within Groups 348.99 179 1.95
Total 365.15 181
Between Groups 36.23 2 18.12 1.65 0.20
Within Groups 844.16 77 10.96
Total 880.39 79
Between Groups 16.96 2 8.48 0.35 0.70
Within Groups 1,490.68 62 24.04
Total 1,507.64 64
Between Groups 6,487.50 2 3,243.75 8.87 0.00
Within Groups 6,579.17 18 365.51
Total 13,066.67 20
Number of specific hurdle
rates
MDC percentage
IRR percentage
ROE percentage
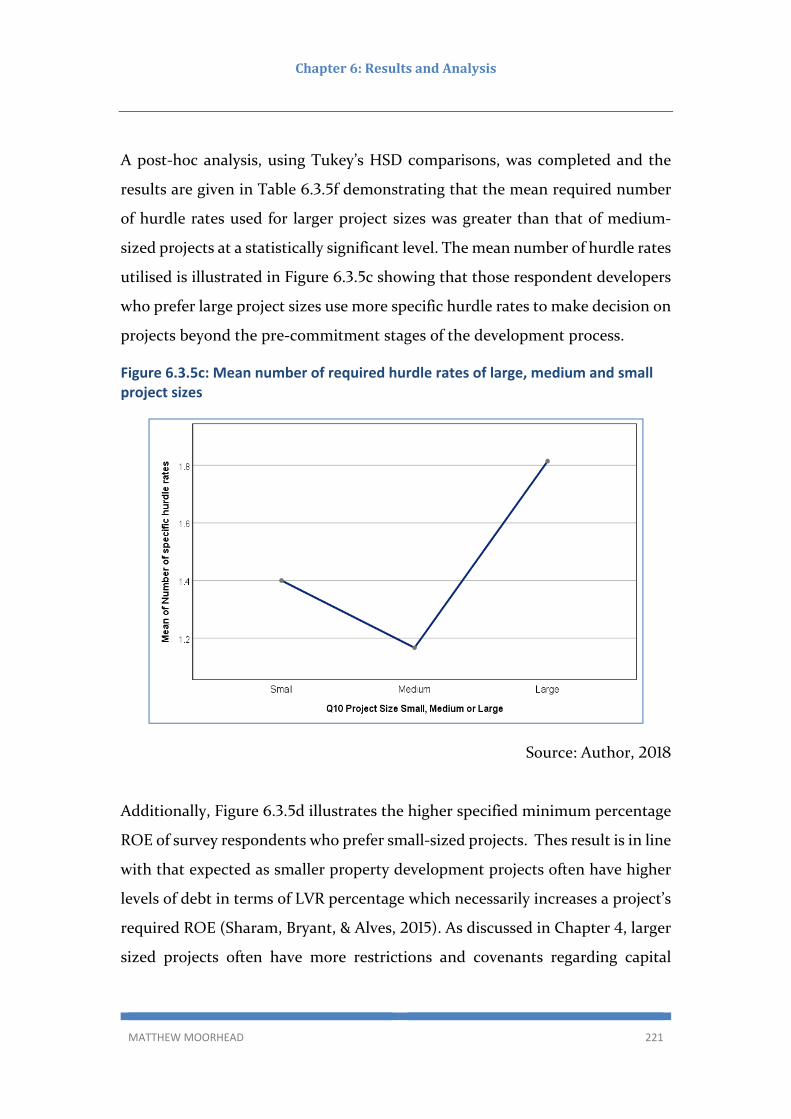
Chapter6:ResultsandAnalysis
MATTHEW MOORHEAD 221
A post‐hoc analysis, using Tukey’s HSD comparisons, was completed and the
results are given in Table . . f demonstrating that the mean required number
of hurdle rates used for larger project sizes was greater than that of medium‐
sized projects at a statistically significant level. The mean number of hurdle rates
utilised is illustrated in Figure . . c showing that those respondent developers
who prefer large project sizes use more specific hurdle rates to make decision on
projects beyond the pre‐commitment stages of the development process.
Figure 6.3.5c: Mean number of required hurdle rates of large, medium and small project sizes
Source: Author,
Additionally, Figure . . d illustrates the higher specified minimum percentage
ROE of survey respondents who prefer small‐sized projects. Thes result is in line
with that expected as smaller property development projects often have higher
levels of debt in terms of LVR percentage which necessarily increases a project’s
required ROE (Sharam, Bryant, & Alves, ). As discussed in Chapter , larger
sized projects often have more restrictions and covenants regarding capital

Chapter6:ResultsandAnalysis
MATTHEW MOORHEAD 222
facility providers than those placed over smaller projects where more funding
opportunities exist (Sharam, Bryant, & Alves, ). One explanation for this
result is smaller projects have more access to debt capital which would
necessarily drive up the ROE percentage required given the use of other hurdle
rates such as MDC and IRR which are not as heavily influenced by project gearing.
A one‐way ANOVA was also conducted between‐groups to investigate the
minimum required percentage of ROE and the specific number of hurdle rates
used by respondents in decision‐making. A statistically significant difference was
found, at the p < . level, in the mean minimum required ROE given differing
levels of hurdle rates used: F( , ) = . , p < . See Appendix J‐ . For
respondents who use ROE, the mean number of specific hurdle rates was equal
to . versus . for respondents who do not use this metric as illustrated in
Figure . . e
Figure 6.3.5d: Mean required minimum percentage of ROE of large, medium and small project sizes
Source: Author,

Chapter6:ResultsandAnalysis
MATTHEW MOORHEAD 223
Table 6.3.5f: One‐way ANOVA of large, medium and small project size and hurdle rate levels
Tukey HSD Comparisons
Dependent Variable Mean
Difference Std. Error Sig.
Number of specific hurdle rates
Small Medium 0.23 0.33 0.76
Large ‐0.41 0.31 0.38
Medium Small ‐0.23 0.33 0.76
Large ‐.648* 0.23 0.01
Large Small 0.41 0.31 0.38
Medium .648* 0.23 0.01
MDC percentage Small Medium ‐1.28 1.16 0.52
Large 0.21 1.08 0.98
Medium Small 1.28 1.16 0.52
Large 1.49 0.83 0.18
Large Small ‐0.21 1.08 0.98
Medium ‐1.49 0.83 0.18
IRR percentage Small Medium 1.53 2.37 0.80
Large 0.20 1.99 0.99
Medium Small ‐1.53 2.37 0.80
Large ‐1.33 1.64 0.70
Large Small ‐0.20 1.99 0.99
Medium 1.33 1.64 0.70
ROE percentage Small Medium 32.50 13.52 0.07
Large 50.83* 12.34 0.00
Medium Small ‐32.50 13.52 0.07
Large 18.33 9.56 0.16
Large Small ‐50.83* 12.34 0.00
Medium ‐18.33 9.56 0.16
*The mean difference is significant at the 0.05 level
Source: Author,

Chapter6:ResultsandAnalysis
MATTHEW MOORHEAD 224
Figure 6.3.5e: Mean number of hurdle rates used and use of ROE
Source: Author,
A two‐way ANOVA between groups was conducted to examine the difference in
the number of hurdle rates used as a project go/no‐go decision basis for public
versus private developers as well as whether they undertake large project sizes
(> million dollars). The interaction effect between respondent developers
who undertake large project sizes and whether they are public or private in
nature was not statistically significant, F( , ) = . , p = . (See Appendix
J‐ ). However, a statistically significant result was found, at the p < . level, for
developers who undertake large projects and the use of a higher number of
hurdle rates as a basis for proceeding with a project, but the effect size was
considered small, F( , ) = . , p = . , partial ETA Squared = . (See
Appendix J‐ ). Figure . . f: illustrates the mean number of specific hurdle rates
used between groups of both public and private respondent developers and large
project sizes.

Chapter6:ResultsandAnalysis
MATTHEW MOORHEAD 225
Figure 6.3.5f: Mean number of specific hurdle rates used between groups of private and public developers and large project sizes.
Source: Author,
As discussed in section . . , there has been very little research conducted
regarding the decision‐making practices of small property development
organisations. One‐way ANOVA’s were conducted to test for differences
between groups of small developers (project size <= million dollars) and the
specific use and percentage level applied of MDC, IRR and ROE, with no
statistically significant results found at the p < . level (See Appendix J‐ ).
Direct binary logistic regression was also conducted to ascertain the impact of
key variables on the likelihood that respondent developers who undertake larger
projects would incorporate more sophisticated and complex quantifiable
decision‐making methodologies for deciding whether to proceed with a project.
The model contained ten independent variables (Q Specialised Board or Other
must approve all decisions to commit to a project; Q Specific Go /No‐Go
Chapter6:ResultsandAnalysis
MATTHEW MOORHEAD 226
Processes; Q Utilises Specific Hurdle Rates; Q a Number of Hurdle Rates
Incorporated; Q _ Utilises Qualitative Frameworks; Q _ ‐ Types of
Feasibility Methods Adopted; Q Number of Risk Analysis Methods; Q Risk
Tolerance Scale). The model was completed over steps to incorporate all the
predictors, χ ( , N = ) = . , p < . , indicating that the model was
statistically significant and was able to distinguish between developers that
undertake large projects (>= $ million) and developers whose projects are
smaller (< $ million). The model as a whole explained between . % (Cox
and Snell R square) and . % (Nagelkerke R Squared) of the variance in
developer project size, and correctly classified . % of cases.
As demonstrated in Table . . g and in Appendix I‐ , of the independent
variables made a unique statistically significant ( % confidence level)
contribution to the model (Q Specific Go‐No Go Processes; Q _ No Decision
Maker; Q _ Other Approval Type; Q _ Board Approval; Q Utilises Specific
Hurdle Rates; Q _ Utilises Qualitative Frameworks; Q _ Feasibility
Method – residual accumulation cash flow method). All but one of the significant
variables had a positive B value, except the for use of the residual cash flow
accumulation method indicating that larger project developers are less likely to
use this indicator. The strongest indicator as a predictor of larger project size
was whether board approval is required to commit to a project ( . odds ratio)
indicating just under times more likely, controlling for all other factors in the
model. An additional strong indicator included whether the organisation
utilised qualitative frameworks as a decision‐making requirement ( . odds
ratio) indicating just under twelve times more likely to undertake large projects
(> $ million), controlling for all other factors in the model. It is also notable
that property developers that undertake larger projects are four times ( .
odds ratio) more likely to have a formalised go/no‐go decision‐making process.

Chapter6:ResultsandAnalysis
MATTHEW MOORHEAD 227
Given the overall significance of the model at the % confidence level, the
results demonstrate property developers who undertake larger projects have
more complex and sophisticated decision‐making systems and utilise more
complex and robust feasibility methods.
Table 6.3.5g: Binary logistic regression as a predicter of developers who undertake large project sizes
Binary Logistic Regression ‐Variables in the Equation
B S.E. Wald df Sig. Exp(B)
Step 5e Q18 GO/NO‐GO Decision Basis 1.417 .707 4.014 1 .045 4.125
Q14_1BoardorOther_R 14.370 2 .001
Q14_1BoardorOther_R(1) 2.025 .746 7.376 1 .007 7.576
Q14_1BoardorOther_R(2) 2.548 .682 13.939 1 .000 12.780
Q19 Specific hurdle rate use 1.358 .554 6.012 1 .014 3.889
Q20 ‐11 Qualitative Hurdle Rate Approach
2.464 .837 8.656 1 .003 11.748
Q23‐Residual Cashflow Accumulation Method
‐1.605 .753 4.547 1 .033 .201
Constant ‐4.561 1.053 18.751 1 .000 .010
e. Variable(s) entered on step 5: Q18 GO/NO‐ GO Decision Basis.
Source: Author,
FindingsRQ2b:
The results of the analysis demonstrate that developers who undertake large
project sizes do utilise more sophisticated methods of feasibility analysis and
have a higher number of specific hurdle rates as a basis for project selection and
proceeding beyond the pre‐commitment stages of the development process. The
result is in line with what was expected, as those that undertake larger projects
typically have more capital at risk and it was anticipated that more resources
would be dedicated to the determination of project viability. However,
ownership structure, and particularly public versus private structures, did not
influence the respondent developers’ choice and the number of hurdle rates used

Chapter6:ResultsandAnalysis
MATTHEW MOORHEAD 228
as a decision basis. It was anticipated that publicly listed developers would use
more specific financial metrics, both in number and complexity, in order to
determine project viability, but this was not found to be true for the survey
respondents. The results also demonstrate that developers who undertake
smaller projects adopt a higher percentage of ROE as a hurdle rate. One
explanation for this result is that smaller projects have more access to debt
capital which would necessarily drive up the ROE percentage required given the
use of other hurdle rates such as MDC and IRR that are not as heavily influenced
by project gearing. Additionally, a strong association was found between the use
of ROE as a hurdle rate and using multiple hurdle rates in decision‐making,
indicating this was a secondary hurdle rate metric in addition to the use of MDC
or IRR. For respondents that use ROE, the mean number of specific hurdle rates
was . versus . for respondents who do not use this metric.
The results found only a small incidence of use of NPV as a project decision‐
making hurdle rate, and preferred project size and ownership structure had no
significant association with the use of this hurdle rate. This result was surprising
given the prominence of NPV in the financial decision‐making academic
literature.
Project size also influenced the respondent developer’s use of IRR as a hurdle
rate, although preferred project size and ownership structure had no significant
association on the specific percentage level adopted. No association was found
between preferred project size and ownership structure, as well as the use and
specific percentage level of MDC as a hurdle rate.

Chapter6:ResultsandAnalysis
MATTHEW MOORHEAD 229
RQ2c:Projectsbydevelopermotive?Speculativeortraderdevelopersversusdevelopandhold/investordevelopers?
As discussed in section . it is common to separate developers into typologies
based upon the primary rationale for undertaking a project. The developer types
discussed in section . . were condensed to remove the effect of valuation firms
and other organisations leaving the typologies of trader developer, investor
developer and development managers. The developer typologies were also
investigated to ascertain key differences in the number of hurdle rates used and
the use of use of MDC, IRR and ROE as well as the specific percentages adopted.
Table . . h lists the results of thirteen Chi‐Square tests for independence which
were conducted to test for association between developer typologies and the use
of specific hurdle rates as well as the use of go/no‐go decision making. The
results demonstrate the following aspects (See Appendix H‐ ):
Trader developers have a statistically significant higher usage of MDC as
a hurdle rate and also are more likely to use specific hurdle rates as part
of a decision process whether to proceed with a project.
Development managers have a statistically significant higher usage of
MDC as a hurdle rate than do investor developers.
Investor developers have a statistically significant higher usage of
payback period as a hurdle rate than do trader developers and
development managers.
These results are not surprising, as it was expected that developer typologies
which are more speculative in nature would rely on simpler ratios of profit to
cost and investor developers would use hurdle rates that account for the time
value of money.
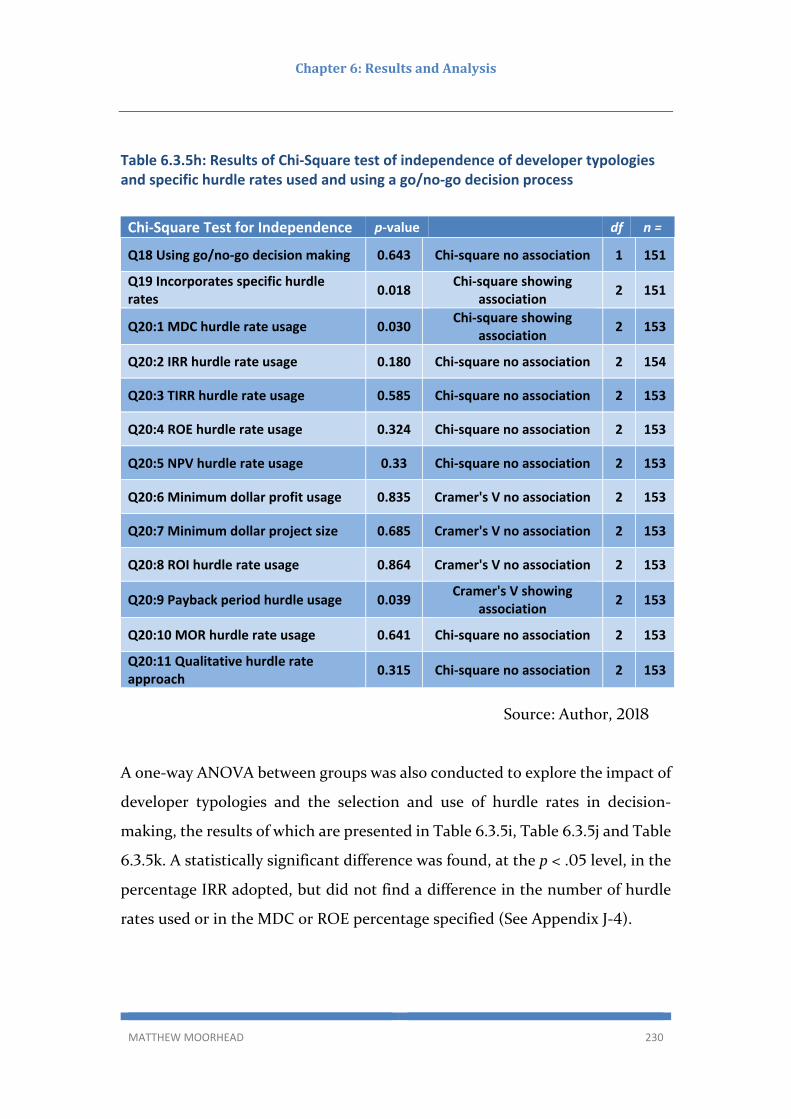
Chapter6:ResultsandAnalysis
MATTHEW MOORHEAD 230
Table 6.3.5h: Results of Chi‐Square test of independence of developer typologies and specific hurdle rates used and using a go/no‐go decision process
Chi‐Square Test for Independence p‐value df n =
Q18 Using go/no‐go decision making 0.643 Chi‐square no association 1 151
Q19 Incorporates specific hurdle rates
0.018 Chi‐square showing
association 2 151
Q20:1 MDC hurdle rate usage 0.030 Chi‐square showing
association 2 153
Q20:2 IRR hurdle rate usage 0.180 Chi‐square no association 2 154
Q20:3 TIRR hurdle rate usage 0.585 Chi‐square no association 2 153
Q20:4 ROE hurdle rate usage 0.324 Chi‐square no association 2 153
Q20:5 NPV hurdle rate usage 0.33 Chi‐square no association 2 153
Q20:6 Minimum dollar profit usage 0.835 Cramer's V no association 2 153
Q20:7 Minimum dollar project size 0.685 Cramer's V no association 2 153
Q20:8 ROI hurdle rate usage 0.864 Cramer's V no association 2 153
Q20:9 Payback period hurdle usage 0.039 Cramer's V showing
association 2 153
Q20:10 MOR hurdle rate usage 0.641 Chi‐square no association 2 153
Q20:11 Qualitative hurdle rate approach
0.315 Chi‐square no association 2 153
Source: Author,
A one‐way ANOVA between groups was also conducted to explore the impact of
developer typologies and the selection and use of hurdle rates in decision‐
making, the results of which are presented in Table . . i, Table . . j and Table
. . k. A statistically significant difference was found, at the p < . level, in the
percentage IRR adopted, but did not find a difference in the number of hurdle
rates used or in the MDC or ROE percentage specified (See Appendix J‐ ).

Chapter6:ResultsandAnalysis
MATTHEW MOORHEAD 231
Table 6.3.5i: Mean, standard deviation and standard error of developer type (condensed) and hurdle rate levels and numbers used
N Mean Std.
Deviation Std. Error
Number of specific hurdle rates
Trader Developer 71 1.66 1.07 0.127
Investor Developer 31 1.71 1.87 0.335
Development Manager
51 1.22 1.47 0.206
Total 153 1.52 1.41 0.114
MDC percentage
Trader Developer 40 19.93 3.81 0.602
Investor Developer 12 18.67 3.77 1.089
Development Manager
17 18.71 1.99 0.483
Total 69 19.41 3.45 0.416
IRR percentage
Trader Developer 31 19.48 4.93 0.885
Investor Developer 11 15.23 4.36 1.313
Development Manager
13 17.96 4.82 1.338
Total 55 18.27 4.99 0.673
ROE percentage
Trader Developer 8 39.38 27.05 9.564
Investor Developer 5 34.00 31.50 14.089
Development Manager
3 41.67 24.66 14.240
Total 16 38.13 26.39 6.597
Source: Author,
The results demonstrate a statistically significant difference, at the p < . level,
in the percentage of IRR adopted by Trader Developers as being higher than that
of Investor Developers or Development Managers. The adopted percentage of
MDC, ROE and the number of specific hurdle rates used in decision‐making was
not statistically significant.

Chapter6:ResultsandAnalysis
MATTHEW MOORHEAD 232
Table 6.3.5j: One‐way ANOVA of developer type (condensed) and hurdle rate levels showing differences between groups
ANOVA
Sum of Squares df
Mean Square F Sig.
Number of specific hurdle rates
Between Groups 7.27 2 3.63 1.86 0.16
Within Groups 292.90 150 1.95
Total 300.17 152
MDC percentage Between Groups 25.67 2 12.83 1.08 0.35
Within Groups 784.97 66 11.89
Total 810.64 68
IRR percentage Between Groups 148.75 2 74.38 3.23 0.05
Within Groups 1196.65 52 23.01
Total 1345.41 54
ROE percentage Between Groups 135.21 2 67.60 0.09 0.92
Within Groups 10308.54 13 792.96
Total 10443.75 15
Source: Author,
Table 6.3.5k: One‐way ANOVA of developer type (condensed) and hurdle rate levels showing mean, standard error and significance
Tukey HSD
Dependent Variable Mean
Difference Std. Error Sig.
IRR percentage
Trader Developer Investor Developer 4.26* 1.68 0.038
Development Manager
1.52 1.59 0.605
Investor Developer Trader Developer ‐4.26* 1.68 0.038
Development Manager
‐2.73 1.97 0.353
Development Manager
Trader Developer ‐1.52 1.59 0.605
Investor Developer 2.73 1.97 0.353
*The mean difference is significant at the 0.05 level.
Source: Author,

Chapter6:ResultsandAnalysis
MATTHEW MOORHEAD 233
FindingsRQ2c:
The results of the analysis demonstrate that differences exist among survey
respondents in the selection and use of hurdle rates along based on developer
typologies. Investor Developers are more likely to use the payback period as a
hurdle rate and Trader Developers and Development Managers are both more
likely to use MDC and also to use specific hurdle rates as a part of a go/no‐go
decision. Additionally, Trader Developers surveyed adopt a higher percentage
of IRR as a metric than do the other key developer typologies which may reflect
the higher level of risk inherent in the more speculative nature of the
development process for Trader Developers than for Investor Developers. It is
also relevant to note that Trader Developers deviated further from accepted
financial theory in hurdle rate selection than did Investors Developers.
RQ2d:Doesexperienceinfluencehurdlerateselection?Testdifferencesbetweenexperiencedversusnovicedecision‐makers.
As discussed in section . . , further analysis was conducted concerning the
differences between respondents of differing experience in years and the
selection and use of specific hurdle rate metrics. The four levels of experience as
shown in Table . . included respondents having more than ten years’
experience, having ‐ years’ experience, having – years’ experience and
having fewer than two years’ experience. The years of experience does not
indicate workforce or industry experience but is concerned with the experience
in the decision‐making process of deciding whether to proceed with potential
projects. It was anticipated that experience would demonstrate a significant
difference among respondents in their choice and specific levels of hurdle rates
adopted. Due to the experience levels being divided into four groups, a non‐
parametric Kruskal‐Wallis H test was performed, and this test revealed no
statistically significant difference between groups based on the respondent’s

Chapter6:ResultsandAnalysis
MATTHEW MOORHEAD 234
experience levels and whether they use a go/no‐go decision basis, the use of
specific hurdle rates or in the usage of the MDC, IRR, or ROE hurdle rates as
shown in table . . l (See Appendix F‐ ).
Table 6.3.5l: Kruskal‐Wallis H test of experience levels and hurdle rate usage
Variable Tested 1‐2 years
2‐5 years
5‐10 years
+10 years
Kruskal‐Wallis H
df p‐value
Q18 go/no‐go decision basis
n = 43 n = 49 n = 43 n = 53 4.38 3 0.223
Q19 Use of specific hurdle rates
0.00 0.000 0.000 0.00 0.42 3 0.935
MDC Usage 0.00 0.000 0.000 0.00 1.44 3 0.697
IRR Usage 0.00 0.000 0.000 0.00 1.63 3 0.652
ROE Usage 0.00 0.000 0.000 0.89 0.78 3 0.855
Total n = 188
Source: Author,
Additional tests were conducted using a series of one‐way ANOVAs to determine
if there were significant differences in respondents experience levels and the
number of variables forecasted, the specific number of hurdle rates used as well
as the specific levels adopted for each. The results of the analysis demonstrate
that respondent developers did not demonstrate significant differences along
the basis as illustrated in Figure . . g and Figure . . h showing the mean
number of hurdle rates used as well as the mean number of variables forecasted
across different experience levels changed by only . and . respectfully across
levels (see Appendices J‐ ).
This result is different to that which was found by Sah et al. ( ) which found
significant differences between decision‐making practices of respondents setting
property investment hurdle rates, and particularly a large difference in the

Chapter6:ResultsandAnalysis
MATTHEW MOORHEAD 235
number of variables forecasted to aid in the decision‐making process. This result
may indicate that property development organisation respondents have a
defined method of conducting a feasibility analysis and making decisions in a
prescriptive manner. This is an area that should be investigated in further
research.
Figure 6.3.5g: Mean number of hurdle rates used across experience levels
Source: Author,
Figure 6.3.5h: Mean number of variables used in forecasting across experience levels
Source: Author,

Chapter6:ResultsandAnalysis
MATTHEW MOORHEAD 236
FindingsRQ2d:
The results of the analysis demonstrate that respondent developers did not differ
between groups of experienced versus novices in their use of go/no‐go hurdle
rates, the usage or specific levels of key hurdle rates, the number of hurdle rates
used or in the number of variables forecasted to aid in decision making based on
their experience levels. These results were different from that which was
anticipated and is an area for further research.
The results of the analysis demonstrated, among survey respondents, that there
were no differences between experienced versus novices in terms of their use of
go/no‐go hurdle rates, the usage or specific levels of key hurdle rates, the number
of hurdle rates used or in the number of variables forecasted to aid in decision‐
making based on experience levels. These results were different from those
anticipated and is an area for further research.
RQ2e:Dodecision‐makerswithaspecificproperty‐relateddegreedifferinhurdlerateselectionanduse?
The decision‐making practices which includes using a consistent go/no‐go
decision basis, the use of specific hurdle rates in decision making as well as the
usage of MDC, IRR and ROE were tested for association between respondents
who have a property qualification and those who do not by using a Chi‐Square
test for independence. The results of the analysis demonstrated no association,
at the p < . level, of the dependent variables between respondents who do or
do not have a property qualification (see Appendix H‐ ). However, an
association was found, at the p < . level, between groups of survey respondents
with a property qualification, demonstrating they are more likely to use specific
hurdle rates to make project decisions, 𝜒 ( , n= ) = . , p=. , (see Appendix
H‐ ).

Chapter6:ResultsandAnalysis
MATTHEW MOORHEAD 237
The linkage between education level, experience and having a property related qualification
An investigation was made to determine if there was a significant association
between survey respondents’ education level and having a property related
qualification. A Chi‐square test for independence was conducted and
demonstrated, at the p < . level, an association between education level and
obtaining a property degree qualification, 𝜒 ( , n= ) = . , p<. ; (see
Appendix H‐ ). The analysis demonstrates that decision‐makers for potential
projects within property development organisations who do have a university
degree are more likely to have a property‐specific qualification. This result would
support the common industry view, held over the past two decades, that the
emergence of property related degrees has created the primary pathway to
project management within property development organisations. Additionally,
a non‐parametric test of two independent samples was conducted to determine
if a significant difference exists in the mean years of experience between survey
respondents having a property degree qualification and those without. The
result of the test revealed no statistically significant result, at the p < .
confidence level (p = . ; See Appendix G‐ ).
FindingsRQ2e:
The results of the analysis demonstrate that, that in terms of hurdle rate
selection and usage, there was little difference in respondent developers who
have a property qualification and those who do not, except for being more likely
to use specific hurdle rates in their decision‐making processes. A statistically
significant result was found between survey respondents education level and
having a property qualification. Likewise, the association between the mean
years of experience and having a property related qualification found no
significant association.
Chapter6:ResultsandAnalysis
MATTHEW MOORHEAD 238
RQ2f:AretheresignificantdifferencesinhurdlerateselectionandusebetweenthedifferentgeographicregionsofAustraliaandNewZealand?
A series of Chi‐Square tests for independence were conducted to determine if
there was an association in the decision‐making processes and hurdle rate usage
of Australian versus New Zealand respondent property developers. The results
of the analysis demonstrate that there were no significant differences between
property developer respondents from Australia and New Zealand along the
following basis (See Appendix H‐ ):
Go/no‐go decision processes
Use of specific hurdle rates
Number of hurdle rates used
Number of variables forecasted in the decision process
Use and specific level of MDC
Use and specific level of IRR
Use and specific level of ROE.
FindingsRQ2f:
Only a small number of respondents (n = ) from New Zealand indicated that
they use specific hurdle rates as part of their decision process, but the small
sample size has been addressed through the statistical methods adopted.
However, this result is in contrast to Australian developer respondents (n= )
where the majority do use specific hurdle rates Additionally, the results of the
analysis demonstrated that for those in Australia and New Zealand who do use
specific hurdle rates in decision‐making, significant differences were not found
with the exception of New Zealand based property developers who were more
Chapter6:ResultsandAnalysis
MATTHEW MOORHEAD 239
likely to use the Minimum Profit dollar amount and Minimum Project Size dollar
amount than were Australian based property developers.
RQ2g:Aretheresignificantdifferencesinhurdlerateselectionandusebetweenprojectsbymulti‐nationaldevelopmentcompaniesoperatinginmultiplecountries?
Survey respondent development organisations which operate projects in
multiple countries were examined in relation to their hurdle rate selection and
usage. A non‐parametric Mann‐Whitney U test was conducted on this group
with test variables that included all hurdle rates presented in the survey as well
as differing feasibility analysis methods as dependent variables. The results of
the tests found a lower usage of MDC as a project hurdle rate for multinational
developers (Md = . , ) than for developers who operate in a single nation
(Md = ‐ . , n = , U = , z = ‐ . , p = . , r = . ). As discussed in
Chapter , the MDC or ROC has been found to be the most common hurdle rate
used for project evaluation in many prior studies including Crosby et al. ( a),
Hutchison, , IPD ( ), Costello and Preller ( ).
Additionally, it was found that multinational developers were more likely to
utilise a qualitative hurdle rate approach (Md = . , n = ) than for developers
who operate in a single nation (Md = ‐ . , n = , U = , z = ‐ . , p = . ,
r = . ). The usage of all other hurdle rates and feasibility methods were not
found to be different at the % statistically significant level. This result
demonstrates that those firms that operate across multiple‐national markets
need to incorporate more flexible and complex decision‐making practices than
the simpler MDC rule that is often applied to domestic developers (see Appendix
F‐ ).

Chapter6:ResultsandAnalysis
MATTHEW MOORHEAD 240
FindingsRQ2g:
Survey respondents that represent multi‐national property development
organisations operating in multiple geographic regions demonstrated a higher
use of qualitative frameworks as a decision‐making process and a lower use of
MDC as a hurdle rate. This result is the opposite of that given by Australian and
New Zealand survey respondents operating in their domestic markets.
Additionally, this result demonstrates that those firms that operate across
multiple‐national markets need to incorporate more flexible and complex
decision‐making than developers operating in a single market.
6.3.6Hurdlerateadjustment,heuristicbiasandboundedrationality
Research questions RQ and RQ examine the relationship between the
choices and selection of hurdle rates and the methods respondents use to alter
these hurdle rates as well as exploring the notion of heuristic bias and bounded
rationality in decision practices. Due to the subject matter of these questions,
they will be discussed in section . prior to considering research questions RQ
and RQ which are addressed in section . and examine the feasibility
practices of respondent organisations.
6.3.7DeterminationofresearchquestionRQ5:
RQ : Do development companies have a pre‐determined process and
method of altering or adapting the chosen hurdle rates and benchmarks?
How do Australian and New Zealand property development
organisations specify and change the required hurdle rates and
benchmarks as a basis of go/no‐go decisions in light of increased risk and
uncertainty?

Chapter6:ResultsandAnalysis
MATTHEW MOORHEAD 241
The two questions represented in RQ were designed to gain an understanding
of how property developers in Australia change specific hurdle rates or alter the
financial metric used, and also to gain insights into how they may do so in light
of an increase in uncertainty for a proposed project. The majority ( %) of
Australian and New Zealand development firms surveyed indicated that they do
not have a pre‐determined process or method of altering or adapting hurdle
rates and benchmarks and % indicated that they do have a pre‐determined
process as illustrated in Figure . . a.
Survey respondents who indicated that they specify and change the required
hurdle rates and benchmarks as a basis of a go/no‐go decision in light of
increased risk and uncertainty were asked to specify the mechanisms used for
altering financial‐based hurdle rates in their decision‐making practices. There
was a total of responses to this open‐ended qualitative question, out of a
possible seventy‐one responses, asking respondents to describe the process or
method of altering or adapting the chosen hurdle rates and benchmarks which
represents a % response rate.
Figure 6.3.7a: Responses to having a pre‐determined method of altering and adapting hurdle rates and benchmarks
Source: Author,
71 11039% 61%
Yes No
M Moorhead Empirical Survey 2016 n = 181

Chapter6:ResultsandAnalysis
MATTHEW MOORHEAD 242
As discussed in section . and described in Sunders et al. ( ) the qualitative
open‐ended responses were quantitised into themes to allow for quantitative
analysis to be conducted. Three main themes emerged which were coded as the
following:
Alters hurdle rates on the basis of risk analysis and market conditions
Alters hurdle rates on the basis of qualitative frameworks or intuition
Alters hurdle rates on the basis of the status of planning approvals or
geographic regions.
Figure 6.3.7b: Results of quantitising open‐ended questions into themes based on the rationale for altering hurdle rates
Source: Author,
ALTERS BY RISK AND/OR MARKET
CONDITIONS
65%
ALTERS BYN QUALITATIVE FRAMEWORKS OR INTUITION
19%
ALTERS BY STATUS OF PLANNING
APPROVALS OR GEOGRAPHY
16%
M Moorhead Empirical Survey 2016 n = 81
*Note: 10 responses fell in two categories
Chapter6:ResultsandAnalysis
MATTHEW MOORHEAD 243
Figure . . b illustrates the percentage frequency of each of the three main
identified themes. The largest theme ( %) was based on the results of the risk
analysis methods or in light of an expected change in market conditions. This
theme was anticipated in the results and is considered to be one of the primary
purposes of conducting a risk analysis as part of the feasibility analysis process
for determining project viability.
Specific examples of responses found within this theme are given as follows:
Example : In terms of risk:
) If pre‐sales are in place at the time of acquisition, sales risk is lower
and therefore a lower ROC could be approved.
) Higher return on cost (on longer projects) could result in approving
a lower project IRR as your risk profile is reduced.
(Senior Development Manager / Large Development Project Size/
Primary Residential Type/ Private Company/ + years experience)
Example : We use PERT risk profiling (statistical analysis and Monte
Carlo profiling with frequent updates across the project lifecycle.
(General Manager / Large Development Project Size/ Mixed‐Use
Development Type/ Private Company/ + years experience)
Example : During uncertain economic times or difficult development
scenarios, we aim for a higher POC. We also produce a table to compare
various scenarios i.e. if back end sales drop $ /sqm, $ /sqm or
$ /sqm, or similarly, if the build cost blows out, and make an
informed decision accordingly.
(Development Manager / Medium‐Large Development Project Size/
Primary Residential Type/ Private Company/ < years experience)

Chapter6:ResultsandAnalysis
MATTHEW MOORHEAD 244
Example : Anticipated changes in market conditions may alter our
specific return requirements for the project. This is project and
outcome‐specific however and would not be as relevant in a single‐stage
short‐term development. Our return requirements are also dependent
on the length of planned asset ownership. In any event, all of our hurdle
rates are decided on a project‐specific basis according to the level of de‐
risking available for that project.
(Senior Development Manager / Medium‐Large Development Project
Size/ Primary Retail Type/ Private Company/ + years experience)
Example : Dependent on investor return requirements and elements
such as liquidity, forecast market growth, investment hold period, entry
and exit strategy. We work with an independent Risk and Quantitative
analysis team who would assist in setting the thresholds of this
alteration.
(Development Manager / Large Development Project Size/ Primary
Commercial Type/ Publicly Listed Company/ – years experience)
The second most used theme ( %) was altering hurdle rates as part of an
iterative qualitative process or on the decision‐makers intuition. This result is
also not surprising. As identified in Chapter , intuition is a common method of
decision‐making in the property development industry, and organisations often
have a qualitative iterative process of reviewing potential project acquisitions by
senior managers, company boards and risk committees as part of their approval
process for progressing beyond the pre‐commitment stages of the development
process.
Specific examples of responses found within this theme include:

Chapter6:ResultsandAnalysis
MATTHEW MOORHEAD 245
Example : We typically take a subjective risk view of the markets. Eg.
Do we feel the markets will soften at all (sales rates or revenues per
product)? If so, we will increase our hurdles to try and mitigate the
perceived risks.
(Senior Development Manager / Medium‐Large Development Project
Size/ Mixed‐Use Development Type / Private Company/ + years
experience)
Example : Yes, we will alter financial base rates and have in the past
proceeded with projects providing sub % returns, if we perceive the
project to be particularly low risk. For example, if it is a small project
that we know we can sell quickly, has relatively straightforward
planning requirements and can be completed in a short space of time
(i.e., months from site identification to settling down a completed
stock), then we will often be willing to accept lower returns. As in all
business, the level of return must correlate directly to the level of risk,
and the same applies to property development.
(Development Manager / Medium‐Small Development Project Size/
Primary Residential Type/ Private Company/ ‐ years experience)
Example : We adopted a layered approval process where decisions are
made to reduce or increase metrics depending on project specifics.
(Development Manager / Large Development Project Size/ Primary
Commercial Type/ Publicly Listed Company/ + years experience)
The third most used theme ( %) was altering hurdle rates on the basis of the
status of the project’s development approval or on a geographic basis. This result
was unexpected and demonstrates that the emergence of planning risk is a basis
for setting project parameters.

Chapter6:ResultsandAnalysis
MATTHEW MOORHEAD 246
Specific examples of responses found within this theme include:
Example : A change in zoning or delivery of infrastructure that delivers
project certainty and de‐risks project assumptions will be used as a basis
for reviewing hurdle rates.
(Senior Development Manager / Large Development Project Size/
Primary Residential Type/ Publicly Listed Company/ + years
experience)
Example : Hurdle rates are dependent on risk and if planning permits
are in place at the time of acquisition a lower return on cost could be
approved.
(Senior Development Manager / Large Development Project Size/
Primary Residential Type/ Private Company/ ‐ years experience)
Example : Development approval status and market justification for a
change of rate supported by external feasibility reports.
(Development Manager / Medium‐Small Development Project Size/
Primary Residential Type/ Private Company/ ‐ years experience)
Example : Adopting lower hurdle rates dependent on the status of
approvals, the volume of pre‐sales, completed stages/balance land etc.
When the risk profile falls, then it is reasonable for the risk premium
applied to a financial model to also fall.
(General Manager / Large Development Project Size/ Residential
Development Type/ Private Company/ + years experience)

Chapter6:ResultsandAnalysis
MATTHEW MOORHEAD 247
Artificial Neural Network (ANN) as a predictor of respondents use of a mechanism for adjusting hurdle rates
An ANN analysis was conducted on the data set using Multilayer Perceptron to
analyse predictors of survey respondents who use a specific mechanism for
altering or adjusting hurdle rates given a change in expected uncertainty across
many of the key survey demographic variables and the ranking of the importance
of variables and the classification table for the training and testing of the model
can be found in Appendix E‐ . The results indicate that the most important
variables as predictors of having a specific mechanism for altering hurdle rates
includes the developer type, type of property developed, education level and
whether the respondents use MDC and IRR as a hurdle rate, and the normalised
importance of each of these variables is given in Table . . .
Table 6.3.7: Results of ANN as a predictor of altering hurdle rates
Independent Variable Importance
Importance Normalized Importance
Q5_Developer_Type 0.076 100.00%
Dominant type of property developed condensed
0.061 80.00%
Q12_Edcucation_Level_R 0.059 78.50%
Q20_2_1IRR_Usage 0.057 75.20%
Q20_1_1MDC_Usage 0.056 74.40%
Source: Author,
As demonstrated in Appendix E‐ , . % of cases used to create the ANN model
were classified correctly and . % of cases used in the training model were
classified correctly, corresponding to . % incorrect predictions as shown in
the model summary. When controlling for the developers who do not alter or

Chapter6:ResultsandAnalysis
MATTHEW MOORHEAD 248
adjust their hurdle rates, the model accuracy improves to . % correct
predictions which can be considered a good model.
FindingRQ5
The majority of respondent developers ( %) do not have a pre‐determined
process and method of altering or adapting the chosen hurdle rates and
benchmarks, even in the presence of an expected change in uncertainty and risk
to a potential project. Of the % of survey respondents who do alter their
hurdle rates, the primary basis for that change can be considered under three
themes which are altering hurdle rates on the basis of risk analysis and
forecasted market conditions, altering hurdle rates based on qualitative
frameworks or intuition, and altering hurdle rates based on the project’s status
of planning approvals or along the lines of altering hurdle rates for specific
geographic regions. The most important variables in predicting whether survey
respondents alter their hurdle rates included the developer typology, type of
property developed, education level and whether the decision‐maker uses MDC
or IRR as a hurdle rate.
6.3.8DeterminationofresearchquestionRQ6:
RQ : Do development companies demonstrate bounded rationality in
their decision‐making processes?
The analysis of the data collected in the survey demonstrates that developers rely
heavily upon intuition and individual experience rather than upon more
sophisticated quantitative and qualitative methods to make decisions on
whether to proceed with a project. Additionally, the quantitative analysis
methods incorporated are predicated upon the decision‐maker determining an
appropriate hurdle rate for project selection. The results demonstrate bounded
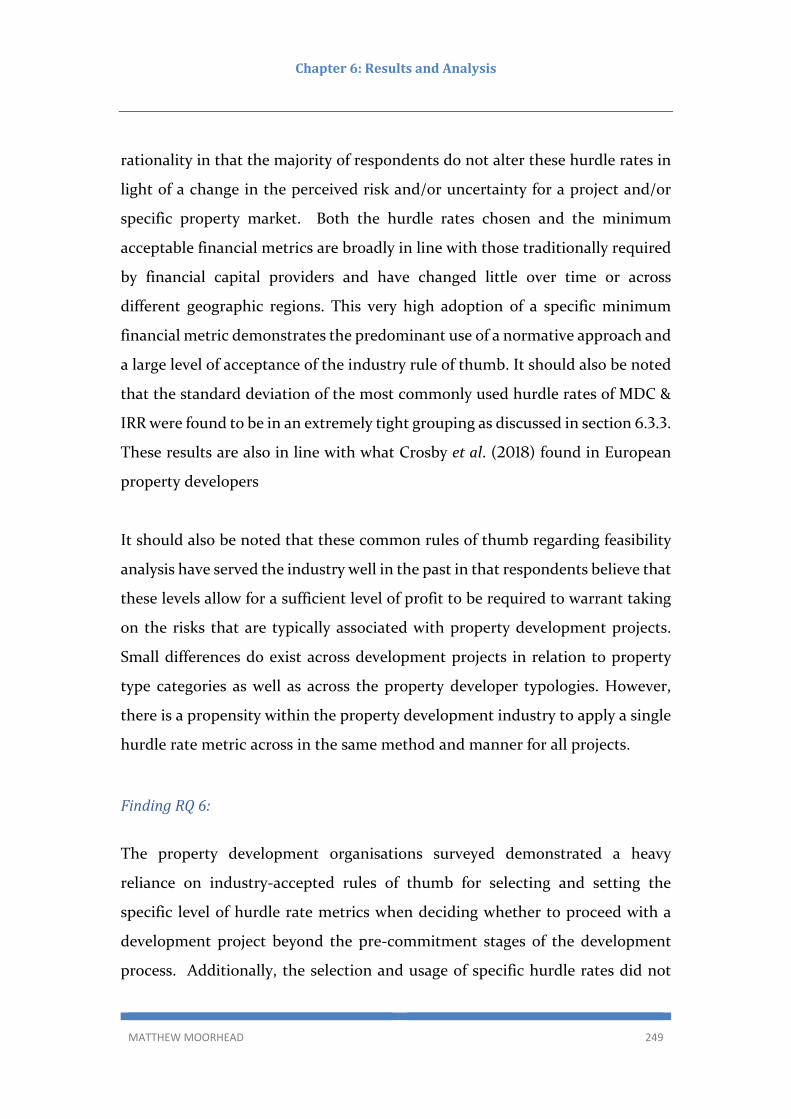
Chapter6:ResultsandAnalysis
MATTHEW MOORHEAD 249
rationality in that the majority of respondents do not alter these hurdle rates in
light of a change in the perceived risk and/or uncertainty for a project and/or
specific property market. Both the hurdle rates chosen and the minimum
acceptable financial metrics are broadly in line with those traditionally required
by financial capital providers and have changed little over time or across
different geographic regions. This very high adoption of a specific minimum
financial metric demonstrates the predominant use of a normative approach and
a large level of acceptance of the industry rule of thumb. It should also be noted
that the standard deviation of the most commonly used hurdle rates of MDC &
IRR were found to be in an extremely tight grouping as discussed in section . . .
These results are also in line with what Crosby et al. ( ) found in European
property developers
It should also be noted that these common rules of thumb regarding feasibility
analysis have served the industry well in the past in that respondents believe that
these levels allow for a sufficient level of profit to be required to warrant taking
on the risks that are typically associated with property development projects.
Small differences do exist across development projects in relation to property
type categories as well as across the property developer typologies. However,
there is a propensity within the property development industry to apply a single
hurdle rate metric across in the same method and manner for all projects.
FindingRQ6:
The property development organisations surveyed demonstrated a heavy
reliance on industry‐accepted rules of thumb for selecting and setting the
specific level of hurdle rate metrics when deciding whether to proceed with a
development project beyond the pre‐commitment stages of the development
process. Additionally, the selection and usage of specific hurdle rates did not

Chapter6:ResultsandAnalysis
MATTHEW MOORHEAD 250
change given a perceived change in the risk and uncertainty of a project. The
rationale for the choosing and setting of minimum hurdle rate metrics is based
largely on experience, intuition and the minimum accepted benchmarks set by
providers of capital finance to the property development industry. Residential
developers and the typology of Trader Developers were more likely to rely on a
narrow range of MDC (median % and standard deviation of . %) and IRR
(median % and standard deviation . %) percentages.
6.3.9Contributionofrespondentorganisationsdecisionprocesses&hurdlerateselection
Section . provided an explanation and interpretation of the decision process
of property development organisations when deciding to proceed with a
potential project beyond the pre‐commitment stages of the development
process. Respondent selection and use of hurdle rates, project approval processes
and the adjustment of decision‐making mechanisms were described. Hurdle rate
selection and use was also investigated across a number of respondent developer
characteristics including property developer typologies, property types, size and
motive of the development organisations, respondent education levels,
experience and qualifications. The following section outlines the analysis which
was completed regarding the practices and methods used by respondent
developers in undertaking feasibility analysis and determining the value of
potential sites for acquisition.
6.4Feasibilitypractices(dependentvariables)
This section will outline the frameworks of the feasibility analysis practices of
respondent property development firms and decision‐makers. Additionally, an

Chapter6:ResultsandAnalysis
MATTHEW MOORHEAD 251
examination of forecasted variables, methods of determining viability and
aspects of the practical execution of viability studies is discussed.
6.4.1Variablesthatrespondentorganisationsforecastinordertocompleteafeasibilityanalysis
The variables used as inputs in conducting feasibility analysis are highly
important in understanding the outcome regarding the viability of a project.
Figure . . displays information concerning key variables (including frequency
of use) that respondents indicated their organisation commonly utilise in
determining a go/no‐go decision for a potential property development project.
In relation to the context of the pre‐commitment stages of the property
development process, Figure . . ranks the frequency of use of forecasted
variables of respondent organisations in the decision‐making process. An
analysis of variables that are ‘always’ or ‘very often’ forecasted demonstrates the
priority of the projection of project revenue followed by variables for comparable
properties and rental yields which are ‘often used’ as a basis for determining
project value on completion. It should be noted that the forecasting of variables
as inputs into feasibility analysis is not an exact science and is prone to error.
Variables including gross sales in dollar per square metre ( . %, n = ),
supply of comparable property (sales value) ( . %), yield of comparable
properties ( . %), the percentage market capture of sales (demand) ( . %),
capitalisation rates ( . %) and interest rates ( . %) are the most frequent
variables forecasted. These variables are followed by other indicators concerning
rental and sales characteristics within the micro‐property market within which
the potential project is competing. Additionally, the frequency of usage of
variables indicates information that is either from the past, such as comparable
sales or leasing data, or variables that give a reflection of the current state of the
market.
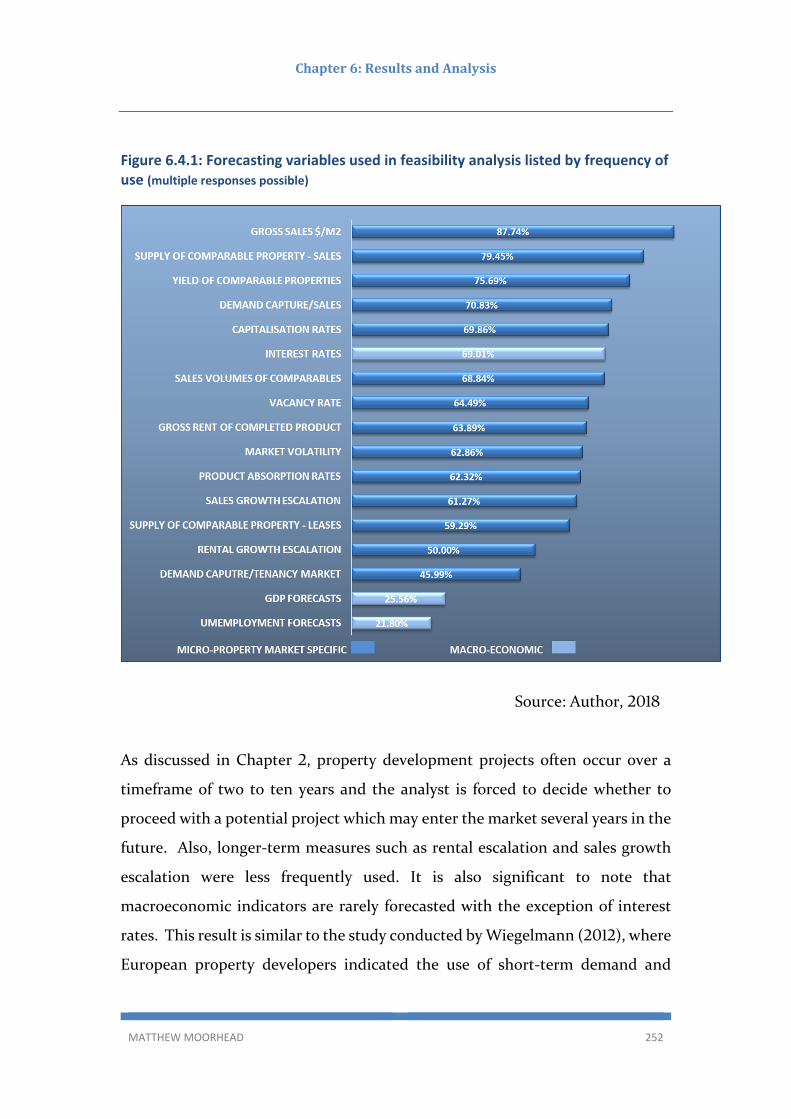
Chapter6:ResultsandAnalysis
MATTHEW MOORHEAD 252
Figure 6.4.1: Forecasting variables used in feasibility analysis listed by frequency of use (multiple responses possible)
Source: Author,
As discussed in Chapter , property development projects often occur over a
timeframe of two to ten years and the analyst is forced to decide whether to
proceed with a potential project which may enter the market several years in the
future. Also, longer‐term measures such as rental escalation and sales growth
escalation were less frequently used. It is also significant to note that
macroeconomic indicators are rarely forecasted with the exception of interest
rates. This result is similar to the study conducted by Wiegelmann ( ), where
European property developers indicated the use of short‐term demand and

Chapter6:ResultsandAnalysis
MATTHEW MOORHEAD 253
supply information most frequently. The results indicated the use of DCF and
capital budgeting measures as a primary means of decision making.
6.4.2Useofproprietaryfeasibilityanalysissoftwareprograms
Does your company use a proprietary development feasibility program
for decision‐making in choosing whether to proceed with property
development projects?
An objective within this research was to ascertain the practice and frequency of
use of proprietary feasibility analysis software programs that are commonly used
within the industry. Participants were asked to provide details of their use of
proprietary property development feasibility programs to aid in the decision‐
making process in the organisation where they are employed. % (n = ) of
respondents indicate they use proprietary feasibility analysis software and %
indicated that their organisation did not. It is generally accepted within the
property development industry that a feasibility study is conducted with the aid
of Microsoft Excel, proprietary feasibility analysis software or, on the rare
occasion as a manual calculation. Participants who indicated they do not use
proprietary feasibility analysis programs were then directed to the following
question:
If you answered No in the question above, please specify how feasibility
analysis is completed. (Example, Microsoft Excel)
The responses to this question were open‐ended to allow respondents to give
greater detail of how they practically complete a feasibility analysis. The
responses were then coded into the three categories including Microsoft Excel,
their organisation having developed a custom model, or the reliance on outside
consultants to complete a feasibility analysis for their organisation. The
Chapter6:ResultsandAnalysis
MATTHEW MOORHEAD 254
frequency of responses are included in Table . . below. Participants that
indicated that they utilise proprietary feasibility analysis software programs were
then directed to indicate which programs they use, and the possible answers
included the following:
Figure 6.4.2: Types of feasibility analysis programs used
Source: Author,
Please specify which proprietary development feasibility program/s are
used for decision‐making in whether to proceed with property
development projects?
The results of these questions are displayed in Table . . and Figure . . and
demonstrate that Microsoft Excel is the most commonly used software for the
completion of feasibility analysis with % of responses, followed by Estate
ESTATE MASTER DF37%
ESTATE MASTER IA1% ARGUS
DEVELOPER5%
ARGUS DCF2%
FEASTUDY3%
SAGE TIMBERLINE
1%
DEVELOPED OWN
PROGRAM5%
MICROSOFT EXCEL46%
M Moorhead
Empirical Survey 2016 n = 197
*Multiple responses possible

Chapter6:ResultsandAnalysis
MATTHEW MOORHEAD 255
Master DF (development feasibility) with % of responses and % of
respondents using both.
Table 6.4.2: Feasibility analysis program utilisation
Type of Development Feasibility Program Used Responses % Responses
Microsoft Excel 90 46%
Estate Master DF 73 37%
Argus Developer 9 5%
Developed Own Program 9 5%
Feastudy 6 3%
Argus DCF 4 2%
Estate Master IA 3 2%
Sage Timberline 3 2%
Total 197
*more than one response is possible
Source: Author,
6.4.3DeterminationofresearchquestionRQ3:
RQ : Do organisations and decision‐makers that utilise proprietary
feasibility programs differ in their feasibility practices and selection and
use of hurdle rates from those which use Microsoft Excel or create their
own feasibility program?
The feasibility practices of survey respondents were analysed to test if there is a
significant difference between those who use proprietary feasibility programs
from the respondents who use Microsoft Excel, have their own bespoke program
or use another method of conducting a feasibility analysis. A number of

Chapter6:ResultsandAnalysis
MATTHEW MOORHEAD 256
statistical tests were conducted including independent‐sample t‐tests, Chi‐
Square tests of independence and Mann‐Whitney U tests of independence.
A series of independent‐sample t‐tests were conducted to compare the mean
score of respondents who use or do not use proprietary feasibility software for
the number of specific hurdle rates used, the specific percentage of MDC, IRR
and ROE adopted, the number of variables forecasted, the number of levels of
approval required to proceed with a project and the years of experience of survey
respondents (See Appendix G‐ ). A significant difference was found at the at the
p < . level in in the mean number of specific hurdle rates used in decision‐
making at the pre‐commitment stages of the development process for those who
use proprietary feasibility analysis software (M = . , SD = . ) and those who
do not (M = . , SD = . ; t ( ) = ‐ . , p = . , two‐tailed). Proprietary
feasibility software usually will have a number of key industry‐accepted hurdle
rate metrics that are automatically calculated. This result is not surprising as
decision‐makers would have these metrics readily available and would not need
to specifically calculate the result. Also, it was found that there was a statistically
significant difference, at the at the p < . level, in the mean level of the specific
IRR percentage adopted between those who use proprietary feasibility software
(M = . , SD = . ) as higher than those who do not (M = . , SD = . ; t
( ) = ‐ . , p = . , two‐tailed). The other variables that were tested include
the specific percentage of MDC and ROE adopted as a minimum financial metric,
the number of input variables used in forecasting a potential project’s cash flow,
the number of approval levels within the organisation required to proceed and
the mean years of experience of decision‐makers; these variables were not found
to be significant. The results of the analysis can be found in Appendix G‐ and
is illustrated in Figure . . a.
.

Chapter6:ResultsandAnalysis
MATTHEW MOORHEAD 257
Figure 6.4.3a: Chi‐Square test of independence showing association between the use of a proprietary feasibility program and the use of specific hurdle rate metrics
Source: Author,
A number of Chi‐Square tests of independence were conducted to assess the
association between the use of proprietary feasibility programs and the use of
specific hurdle rate metrics including MDC, IRR and ROE. An association
between the use of a proprietary feasibility program and Q regarding the use
of specific hurdle rates as part of a decision‐making process was demonstrated
at the % statistical significance level, 𝜒 ( , n= ) = . , p<. ; (see
Appendix H‐ ) and is illustrated in Figure . . a. Additionally, an association
with the use of MDC as a hurdle rate was demonstrated, 𝜒 ( , n= ) = . ,
p<. ) which is illustrated in Figure . . b.
Figure . . c illustrates an additional association at the % statistically
significance level that was demonstrated by a Chi‐Square test of independence
between those who use a proprietary feasibility program and adapting or altering
hurdle rates based on a change in uncertainty or risk, 𝜒 ( , n= ) = . , p<. ;
(see Appendix H‐ ). This result is interesting, as the advent of proprietary
feasibility analysis software has led to the process of completing a feasibility
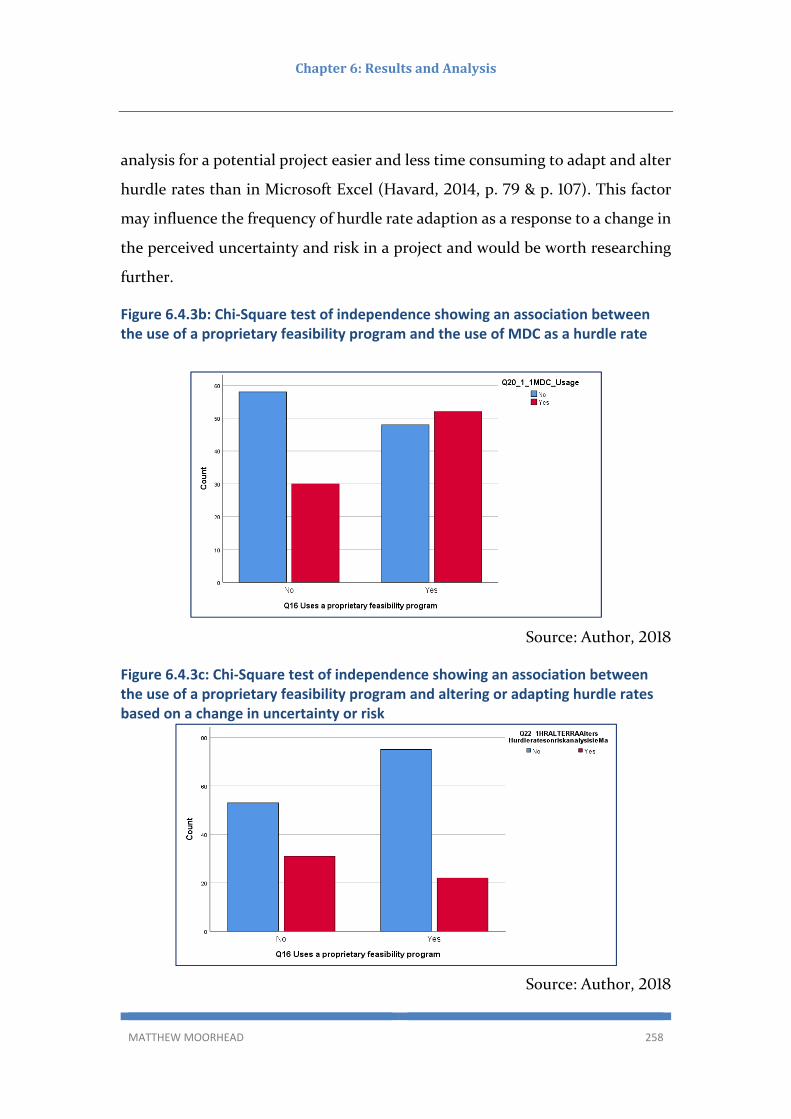
Chapter6:ResultsandAnalysis
MATTHEW MOORHEAD 258
analysis for a potential project easier and less time consuming to adapt and alter
hurdle rates than in Microsoft Excel (Havard, , p. & p. ). This factor
may influence the frequency of hurdle rate adaption as a response to a change in
the perceived uncertainty and risk in a project and would be worth researching
further.
Figure 6.4.3b: Chi‐Square test of independence showing an association between the use of a proprietary feasibility program and the use of MDC as a hurdle rate
Source: Author,
Figure 6.4.3c: Chi‐Square test of independence showing an association between the use of a proprietary feasibility program and altering or adapting hurdle rates based on a change in uncertainty or risk
Source: Author,

Chapter6:ResultsandAnalysis
MATTHEW MOORHEAD 259
Theuseofbespokefeasibilityprograms
In order to assess differences between respondent developers regarding the use
of bespoke feasibility programs, a series of Mann‐Whitney U tests were
conducted to look at predictors of development companies that developed and
use specific bespoke feasibility development software (See Appendix F‐ ). The
development of bespoke feasibility software is a time consuming and expensive
exercise and, because of this, it was expected that larger and more experienced
firms would engage in this activity. A number of significant results were found
in a cross‐sectional analysis which is summarised in Table . . . The results
demonstrate that development organisations which have developed a bespoke
feasibility analysis program are more likely to be publicly listed, have larger
project sizes (> $ million), undertake projects in the tourism sector, use IRR
as a hurdle rate, have more years of decision‐making experience, use a DCF
methodology for feasibility analysis, have specific go/no‐go hurdle rates, have
specific mechanisms for adjusting hurdles rates, adjust hurdle rates on perceived
risk and adjust hurdle rates on the level of planning application needed. These
organisations are also less likely to be privately structured or to be trader
developers.
FindingRQ3:
There were a number of differences found among survey respondents who use a
proprietary feasibility analysis program. First, a key difference included being
more likely to use specific hurdle rate metrics to make a decision to proceed with
a project beyond the pre‐commitment stages of the development process.
Second, they were more likely to use a specific hurdle rate metric in determining
project viability and were also more likely to alter or adapt hurdle rates given a
change in project outcome uncertainty or risk. Third, they were more likely to
use MDC as a hurdle rate metric, but there was no difference in the percentage
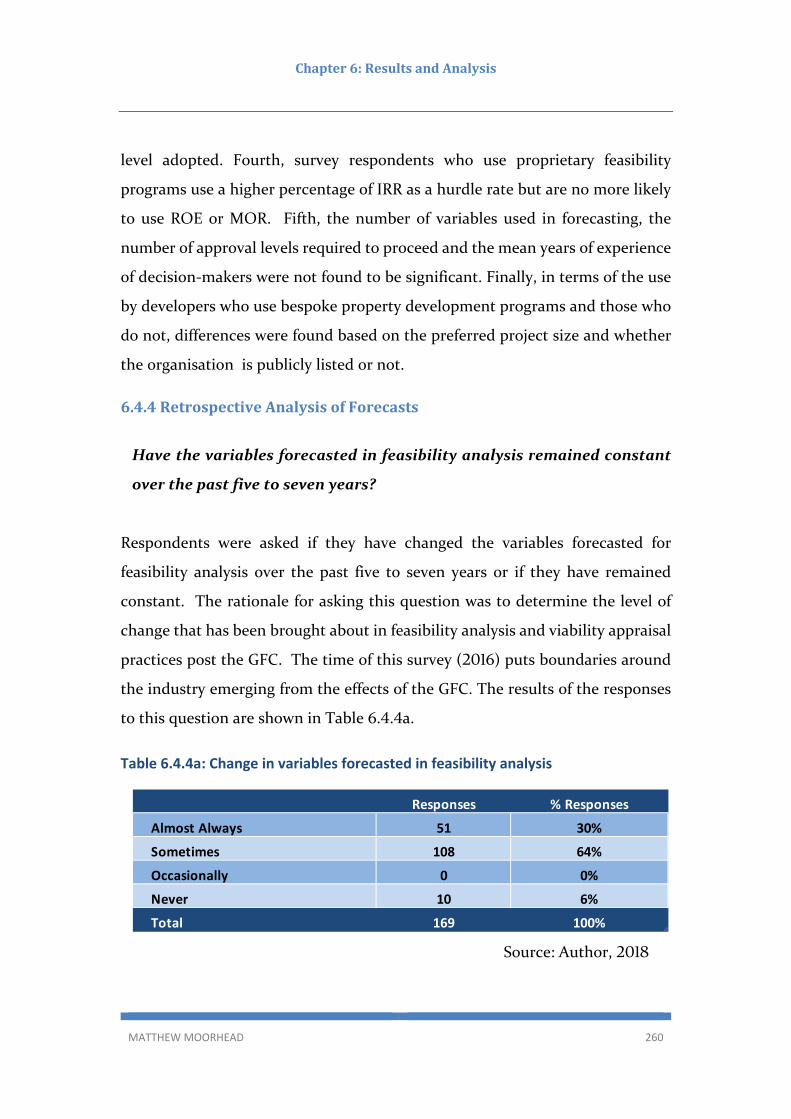
Chapter6:ResultsandAnalysis
MATTHEW MOORHEAD 260
level adopted. Fourth, survey respondents who use proprietary feasibility
programs use a higher percentage of IRR as a hurdle rate but are no more likely
to use ROE or MOR. Fifth, the number of variables used in forecasting, the
number of approval levels required to proceed and the mean years of experience
of decision‐makers were not found to be significant. Finally, in terms of the use
by developers who use bespoke property development programs and those who
do not, differences were found based on the preferred project size and whether
the organisation is publicly listed or not.
6.4.4RetrospectiveAnalysisofForecasts
Have the variables forecasted in feasibility analysis remained constant
over the past five to seven years?
Respondents were asked if they have changed the variables forecasted for
feasibility analysis over the past five to seven years or if they have remained
constant. The rationale for asking this question was to determine the level of
change that has been brought about in feasibility analysis and viability appraisal
practices post the GFC. The time of this survey ( ) puts boundaries around
the industry emerging from the effects of the GFC. The results of the responses
to this question are shown in Table . . a.
Table 6.4.4a: Change in variables forecasted in feasibility analysis
Source: Author,
Column1 Responses % Responses
Almost Always 51 30%
Sometimes 108 64%
Occasionally 0 0%
Never 10 6%
Total 169 100%

Chapter6:ResultsandAnalysis
MATTHEW MOORHEAD 261
The results show there has been a modest amount of change post‐GFC in the
variables forecasted. Respondents were also asked if they retrospectively check
the forecasts of their feasibility analysis and the results are illustrated in Table
. . b.
Do you retrospectively check your forecasts?
Figure . . presents the results of the question regarding respondents
retrospectively checking their forecasts post project completion, which is
considered an important step in improving an organisations practices in
determining project viability. The results demonstrate that the majority of
respondents ( %) retrospectively check their forecasts in their analysis. The
retrospective checking of forecasted variables within a feasibility analysis is an
important process for decision‐makers to learn from their past forecasting
activities by understanding which variables they tend to find most difficult to
forecast, and therefore gain insights into which variables have the highest degree
of uncertainty.
Figure 6.4.4 Retrospective analysis of forecasts
Source: Author,
MOST OF THE TIME/ALWAYS
55%
SOMETIMES27%
NEVER/ RARELY 18%
M Moorhead Empirical Survey 2016 n = 171

Chapter6:ResultsandAnalysis
MATTHEW MOORHEAD 262
Table 6.4.4b: Mann‐Whitney U test of independent samples for developing a bespoke feasibility analysis program (See Appendix F‐8)
Variable Tested Mann‐Whintey
U Score Z ‐ Score p ‐ vlaue Median Value
Vs Median of Null n = r = Result Sig %
Private company structure 398.00 ‐3.105 0.002 0.11 0.63 9 0.224 Less likely to use 95%
Large project developer size 447.00 ‐1.978 0.048 0.88 0.52 8 0.147 More likely to use 95%
Trader Developer 648.00 ‐2.096 0.036 0.00 0.33 9 0.143 Less likely to use 95%
Tourist Developer 787.50 ‐2.841 0.004 0.22 0.03 9 0.189 More likely to use 95%
Publicly listed 306.50 ‐3.995 0.000 0.89 0.27 9 0.290 More likely to use 95%
Use of IRR hurdle rate 565.50 ‐2.351 0.019 0.67 0.30 9 0.163 More likely to use 95%
Alters HR on planning/geo basis 473.50 ‐2.229 0.026 0.29 0.06 7 0.166 More likely to use 95%
Uses DCF methodology 373.00 ‐1.968 0.049 0.56 0.48 7 0.147 More likely to use 95%
Years of experience 530.00 ‐1.788 0.074 3.38 2.52 9 0.130 Use increases w/
years 90%
Use specific go/no‐go decision 567.00 ‐1.921 0.055 1.00 0.70 9 0.136 More likely to use 94.5%
Has mechanism for HR altering 405.00 ‐1.775 0.076 0.71 0.38 7 0.132 More likely to use 90%
Alters hurdle rate based on risk 432.50 ‐1.648 0.099 0.57 0.28 7 0.122 More likely to use 90%
Source: Author,
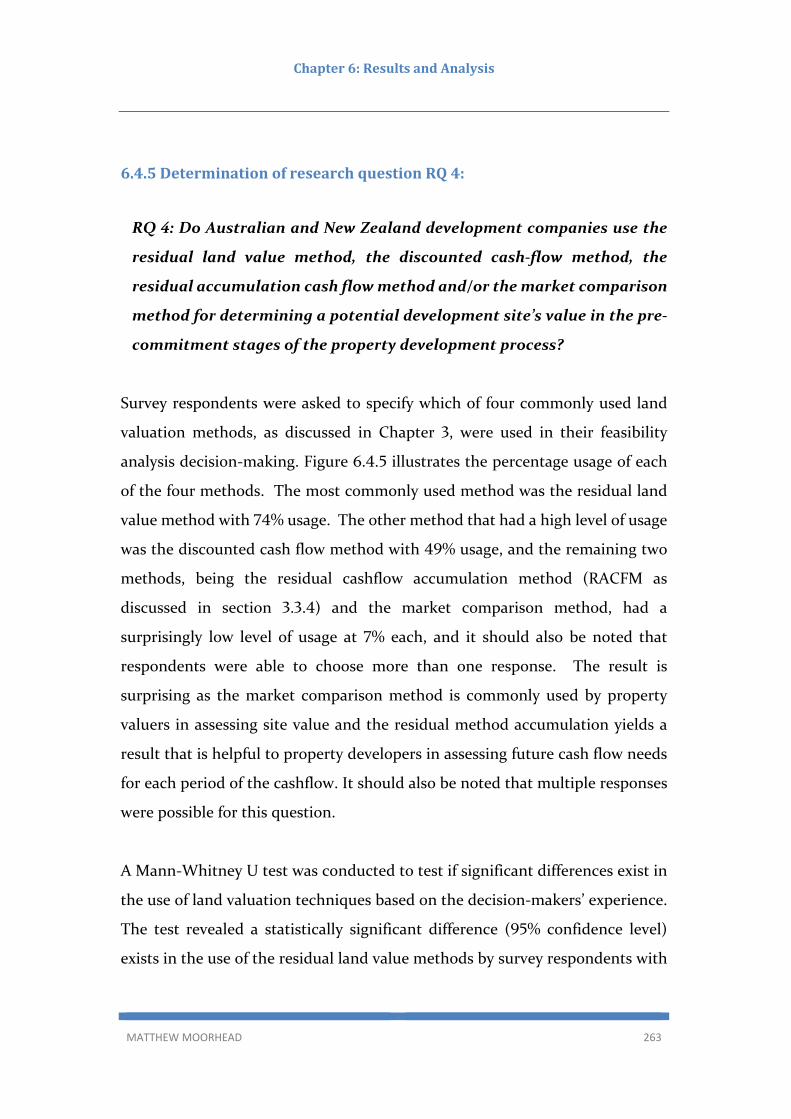
Chapter6:ResultsandAnalysis
MATTHEW MOORHEAD 263
6.4.5DeterminationofresearchquestionRQ4:
RQ : Do Australian and New Zealand development companies use the
residual land value method, the discounted cash‐flow method, the
residual accumulation cash flow method and/or the market comparison
method for determining a potential development site’s value in the pre‐
commitment stages of the property development process?
Survey respondents were asked to specify which of four commonly used land
valuation methods, as discussed in Chapter , were used in their feasibility
analysis decision‐making. Figure . . illustrates the percentage usage of each
of the four methods. The most commonly used method was the residual land
value method with % usage. The other method that had a high level of usage
was the discounted cash flow method with % usage, and the remaining two
methods, being the residual cashflow accumulation method (RACFM as
discussed in section . . ) and the market comparison method, had a
surprisingly low level of usage at % each, and it should also be noted that
respondents were able to choose more than one response. The result is
surprising as the market comparison method is commonly used by property
valuers in assessing site value and the residual method accumulation yields a
result that is helpful to property developers in assessing future cash flow needs
for each period of the cashflow. It should also be noted that multiple responses
were possible for this question.
A Mann‐Whitney U test was conducted to test if significant differences exist in
the use of land valuation techniques based on the decision‐makers’ experience.
The test revealed a statistically significant difference ( % confidence level)
exists in the use of the residual land value methods by survey respondents with

Chapter6:ResultsandAnalysis
MATTHEW MOORHEAD 264
more experience (Md = . , n = ) than respondents who do not use this
method (Md = . , n = , U = , z = ‐ . , p = . ). The discounted cash
flow method, residual cash flow accumulation method and the market
comparison methods of site valuation did not show significant results (See
Appendix F‐ ).
Figure 6.4.5: Percentage usage of methods of land valuation in feasibility analysis
Source: Author,
FindingRQ4:
Respondent developers primarily use the residual land value method and the
discounted cash flow method to value a site in the pre‐commitment stages of
the development process. The residual cash flow accumulation method and the
market comparison method are not used widely by respondents for this purpose.
Additionally, respondent developers with more than ten years’ experience are
RESIDUAL LAND VALUE74%
DISCOUNTED CASHFLOW
49%
RESIDUAL ACCUMULATION
CASHFLOW7%
MARKET COMPARISON
7%
M Moorhead Empirical Survey 2016 n = 178* Multiple response were possible

Chapter6:ResultsandAnalysis
MATTHEW MOORHEAD 265
more likely to use the residual land value method than lesser experienced
respondents. Experience did not play a significant factor in whether the users
used the discounted cash flow method, the residual cash flow accumulation
method or the market comparison method, and multiple responses were
possible.
6.4.6Contributionofrespondentsregardingthefeasibilityanalysispracticesofpropertydevelopers
This section covers the practices of survey respondent organisations in
determining project viability in the pre‐commitment stages of the development
process. The use of proprietary feasibility analysis software programs, use of
bespoke feasibility analysis programs, variables forecasted and the retrospective
review of forecasts is discussed.
6.5Riskanalysisandculturalenvironment(dependentvariables)
The purpose of this section is to examine the risk analysis and management
practices of respondent property developers and gain an understanding of the
cultural aspects of the organisation regarding their risk tolerance and
confidence. Respondents were asked questions to gauge their perception of risk
appetite, confidence in preparing for significant risks and about their employer’s
risk management policies and culture. Additionally, respondents were asked
about the use of specific risk analysis methods used in feasibility analysis to
determine whether to proceed with a project.
6.5.1Riskappetiteperception
In your opinion, does the company you work for regard itself as having
a risk‐taking or risk‐averse culture compared to its relevant competitors?

Chapter6:ResultsandAnalysis
MATTHEW MOORHEAD 266
Participants were asked to rate their perception of the risk appetite of their
organisation against their competitors by indicating either more risk‐averse
culture, having a risk‐taking culture similar to competitors or more risk‐taking
culture. Figures . . summarise the results where % of respondents who
specified the organisation they work for as more risk‐averse, % believe the
risk culture is similar to competitors and % specified the culture is more risk‐
taking. This question was patterned on a question in Wiegelmann ( , p. ),
who surveyed European property developers, and the results are compared in
Table . . a.
Figure 6.5.1: Perception of organisational risk appetite
Source: Author,
The main point of comparison between the two surveys is the similarity of the
frequency of perceived risk appetite across property development organisations
between Europe and Australia/New Zealand in terms of both separate
geographic areas and also across different time horizons. Wiegelmann ( )
found private company structured organisations in Europe were the most risk
MORE RISK
TAKING 19%
RISK SIMILAR TO COMPETITORS
46%
MORE RISK‐AVERSE35%
M Moorhead Empirical Survey 2016 n = 171

Chapter6:ResultsandAnalysis
MATTHEW MOORHEAD 267
tolerant and publicly listed organisations had the highest levels of perceived risk
aversion, but a different result was found in this research when an independent
samples t‐test was conducted finding no significant difference between private
structures (M = ‐ . , SD = . ) and public structures (M = ‐ . , SD = . ;
t = ( ) = ‐ . , p = . , two‐tailed; See Appendix G‐ ). This result is surprising
as it had been anticipated that private company structures, which most small
development firms would use, would be significantly more risk‐tolerant, but the
survey responses included many development organisations which undertake
medium and large projects and also use a private structure.
Table 6.5.1a: Responses of perception of organisational risk appetite: Wiegelmann (2012) and Moorhead (2016) compared
Organisational Risk Appetite Wiegelmann (2012) Moorhead (2016)
More risk taking 14.50% 18.71%
Risk similar to competitors 55.10% 46.20%
More risk‐averse 30.40% 35.09%
Total 100.00% 100.00%
Source: Author,
However, when a one‐way ANOVA between groups was conducted to explore
the impact of project size on risk perception, statistically significant differences
were found and the results are presented in Table . . b and Table . . c. There
was a statistically significant difference at the p < . level in the mean risk
tolerance perception score based on project size. Prior studies have found that
small development organisations take on more risk early in order to grow and
achieve greater economies of scale (Whitehead, ). The organisations
generally grow larger if successful and undertake increasingly large project sizes
or fail along the way. This analysis found that respondent developers who
undertake small project sizes had a higher mean risk tolerance perception than
either medium or large project sizes, but interestingly those who undertake
Chapter6:ResultsandAnalysis
MATTHEW MOORHEAD 268
medium sized projects had a significantly more risk averse score (See Appendix
J‐ ). The reason for this is unclear and should be researched further in the future.
Table 6.5.1b: One‐way ANOVA of project size and risk tolerance perception score
ANOVA
Sum of Squares df
Mean Square F Sig.
Between Groups
4.273 2 2.136 4.352 0.014
Within Groups 79.521 162 0.491
Total 83.794 164
Source: Author,
Table 6.5.1c: Mean, standard deviation and standard error of large medium and small project sizes and risk tolerance perception
N Mean Std.
Deviation Std. Error
Small 25 0.08 0.759 0.152 Medium 57 ‐0.35 0.668 0.088 Large 83 ‐0.06 0.705 0.077 Total 165 ‐0.14 0.715 0.056
Source: Author,
6.5.1.1Differenceinriskappetiteperceptionbetweendevelopertypes
The respondents’ risk appetite perception score was also examined in relation
to developer type to investigate if significant differences exist between groups.
Table . . d summarises the cases and grouped median of each developer type’s
risk score where indicates more risk‐taking, 0 indicates risk similar to
competitors and ‐ indicates more risk‐averse.
The respondents’ risk appetite perception of the organisation they work for was
examined in relation to developer type to investigate if significant differences

Chapter6:ResultsandAnalysis
MATTHEW MOORHEAD 269
exist between groups. A comparison was made between trader developers and
the other developer types in comparison to risk appetite perception. A Mann‐
Whitney U Test revealed a statistically significant difference ( % confidence
level) exists in the level of risk appetite perception of Trader (Md = . , n = )
and other developer types (Md = ‐ . , n = ), U = , z = ‐ . , p = . ,
r = . with a medium effect size; See Appendix F‐ ). Trader developers
specified a median risk appetite score that is risk‐neutral in comparison to their
competitors. All other developer types demonstrated a more risk‐averse
perception of their organisation (score less than ) in comparison to that of their
competitors. This result is not surprising as trader developers fulfil the more
speculative aspects of the property development industry which carries a greater
level of risk than do the other developer typologies which would be less
comfortable with assuming higher levels of project risk.
Table 6.5.1d: Grouped median of developer type risk appetite perception
Developer Type N Median Grouped Median
Other 10 ‐1.00 ‐0.70
Trader Dev 64 0.00 0.00
Investor Dev 29 0.00 ‐0.18
Development Management 44 0.00 ‐0.27
Valuation 17 0.00 ‐0.29
Funds Management 6 0.00 ‐0.20
Total 170 0.00 ‐0.20
Source: Author,
6.5.2Projectriskanalysismethods
Does your company utilise any of the following risk analysis methods for
determining the project viability of potential development projects in
the pre‐commitment stages of the development process?
Sensitivity Analysis of single variables

Chapter6:ResultsandAnalysis
MATTHEW MOORHEAD 270
Scenario Analysis of multiple variables
Probability Analysis/Bayesian Models
Monte Carlo Simulations
Real Option Models
Qualitative Risk Matrix
Other (please specify)
Risk analysis is an important step in the process of determining a potential
project’s viability. Many theoretical examples and techniques exist in the
literature for the examination and analysis of project risk which are summarised
in Table . . .
Table 6.5.2: Methods for analysing project risk
Deterministic methods Qualitative methods Quantitative methods
Benefit cost analysis Risk matrix Mean‐variance criterion
Break‐even analysis Event trees (qualitative) Decision tree analysis
Certainty equivalence SWOT analysis Artificial intelligence
Sensitivity Analysis Risk scoring Fuzzy sets theory
Discounted cash flow Brainstorming sessions Event trees (quantitative)
Standard deviation and
variance
Likelihood/consequence
assessment
Monte Carlo Stochastic
simulation
Risk‐weighted DCF
discount rates
Risk registers and
coefficients of variation
Input estimates based on
probability distribution
Source: Author‐ derived from Boussabaine & Kirkham ( ); Regan ( )
Respondents were asked whether they utilise specific risk analysis methods,
commonly found in proprietary feasibility analysis programs, in their decision‐
making processes before deciding whether to proceed with a project beyond the

Chapter6:ResultsandAnalysis
MATTHEW MOORHEAD 271
pre‐commitment stages of the development process. Additionally, respondents
were given an opportunity to list and describe any additional risk analysis
methods used by their development organisation. Figure . . illustrates the
frequency distribution results of respondents concerning the use of common
risk analysis methods used in the industry which were discussed in Chapter .
The use of a sensitivity analysis of a single variable was widely used with % of
respondents indicating the use of this method. This method is simple to
incorporate into a feasibility analysis and has been used within the industry for
many decades. The use of a scenario analysis of multiple variables had the
second‐highest adoption by respondents at %. Eight per cent of respondents
indicated they use qualitative frameworks including the use of a risk matrix in
their risk analysis process.
Within Microsoft Excel, this technique becomes more complex to complete
than the calculation of a single variable sensitivity analysis. Scenario analysis of
multiple variables has become a common feature of proprietary feasibility
analysis software. In fact, when a Mann Whitney U test was completed
comparing the median score of respondents who use Microsoft Excel for
feasibility analysis and the risk analysis methods listed in the survey instrument,
it was found that only the use of sensitivity analysis of a single variable was
statistically significant with % of respondents who use Microsoft Excel
indicating using this method (Md = . , n = , U = , z = ‐ . , p = . ,
r = . ; See Appendix F‐ ). Usage of all other risk analysis methods was
negligible by respondents who use Microsoft Excel. This result casts doubt upon
whether property developers are able to fully analyse and manage risks at this
stage of the development process when using Microsoft Excel as their primary
feasibility analysis tool. The doubt arises from the lack of sophisticated risk
analysis techniques being used by respondent developers who use Microsoft
Excel for the purpose of feasibility analysis. Additionally, this result is becoming
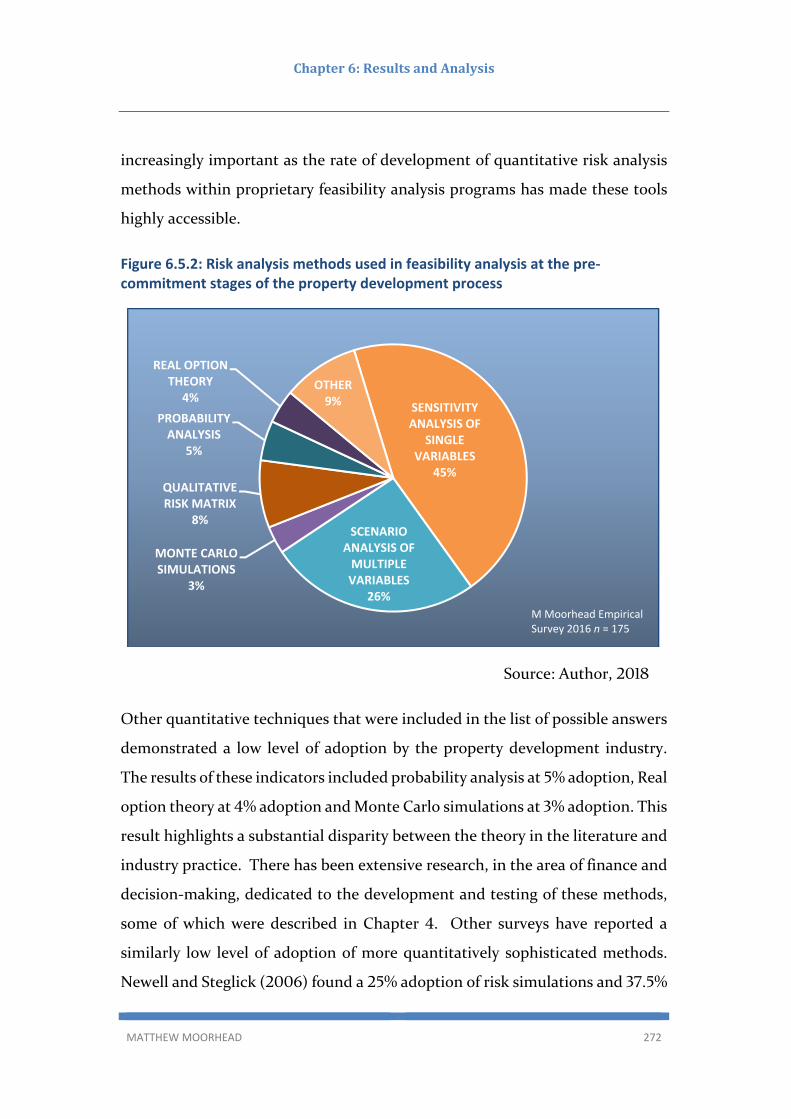
Chapter6:ResultsandAnalysis
MATTHEW MOORHEAD 272
increasingly important as the rate of development of quantitative risk analysis
methods within proprietary feasibility analysis programs has made these tools
highly accessible.
Figure 6.5.2: Risk analysis methods used in feasibility analysis at the pre‐commitment stages of the property development process
Source: Author,
Other quantitative techniques that were included in the list of possible answers
demonstrated a low level of adoption by the property development industry.
The results of these indicators included probability analysis at % adoption, Real
option theory at % adoption and Monte Carlo simulations at % adoption. This
result highlights a substantial disparity between the theory in the literature and
industry practice. There has been extensive research, in the area of finance and
decision‐making, dedicated to the development and testing of these methods,
some of which were described in Chapter . Other surveys have reported a
similarly low level of adoption of more quantitatively sophisticated methods.
Newell and Steglick ( ) found a % adoption of risk simulations and . %
SENSITIVITY ANALYSIS OF
SINGLE VARIABLES
45%
SCENARIO ANALYSIS OF MULTIPLE VARIABLES
26%
MONTE CARLO SIMULATIONS
3%
QUALITATIVE RISK MATRIX
8%
PROBABILITY ANALYSIS
5%
REAL OPTION THEORY
4%OTHER9%
M Moorhead Empirical Survey 2016 n = 175
Chapter6:ResultsandAnalysis
MATTHEW MOORHEAD 273
adoption of probability models in a survey of large ASX listed property
development companies. It is commonly accepted that larger publicly listed
property development companies would use more sophisticated highly
quantified models because of their access to higher levels of resources including
staff. The use of specific risk analysis methods was investigated concerning
respondents’ indication of a consistently applied decision‐making methodology
in the company where they work, but no significant difference was found to
exist. The results of this analysis can be found in Appendix F‐ .
6.5.3DeterminationofresearchquestionRQ7:
RQ : Do Australian and New Zealand property development companies
use sophisticated theory led structured quantitative analysis in the
feasibility analysis models used in the decision‐making processes in the
pre‐commitment stages of the development process? Do Australian and
New Zealand development firms use Monte Carlo simulations, Bayesian
models, and/or option theory to aid decision‐making?
Hutchinson et al. ( , p ) defined sophistication in the use of hurdle rates
and risk analysis in property investment decision‐making as follows:
…The use of formal, theory‐led, quantitative models, use of structured
scenario or sensitivity analysis, strong research or risk department
involvement in model inputs and, generally, more complex processes.
The survey results indicated a very low level of adoption and use of the more
sophisticated quantitative techniques including Monte Carlo Simulation,
probability analysis, qualitative risk matrix, option theory all having less than %
usage by decision‐makers in the pre‐commitment stages of the development
process. Hutchinson et al. ( , p. ) also found very low levels of use of

Chapter6:ResultsandAnalysis
MATTHEW MOORHEAD 274
sophisticated decision‐making models of property investors and developers in
the UK an offered a number of reasons as an explanation including the perceived
difficulty in applying models to heterogeneous assets, senior management
reluctance to accept new approaches, and gaps in the knowledge and human
capital to incorporate sophisticated modelling techniques. These explanations
may also be relevant to the Australian and New Zealand property development
industry and is an area which will be considered for further research.
Table 6.5.3a: Mann‐Whitney U test between groups of respondents who use Monte Carlo, Real option theory or Probability analysis/Bayesian models and variables
Uses MC, ROT or Prob B
Variable Tested yes no U p‐
value Result Sig %
Experience (years > 5) 35 140 2196 0.327 No
association 95%
Publicly Listed 35 138 2095 0.115 No
association 95%
Education Level 35 140 2110 0.172 No
association 95%
Property Qualification 34 135 2281 0.933 No
association 95%
Source: Author,
Notwithstanding the low levels of use of the above risk analysis methods
indicated by survey respondents, a number of Mann‐Whitney U tests were
conducted to determine if there was a statistically significant higher level of use
in terms of experience, publicly listed development company and educational
levels. No statistically significant difference was found between groups of these
indicators, the results of which are presented in Table . . a and also in
Appendix F‐ .
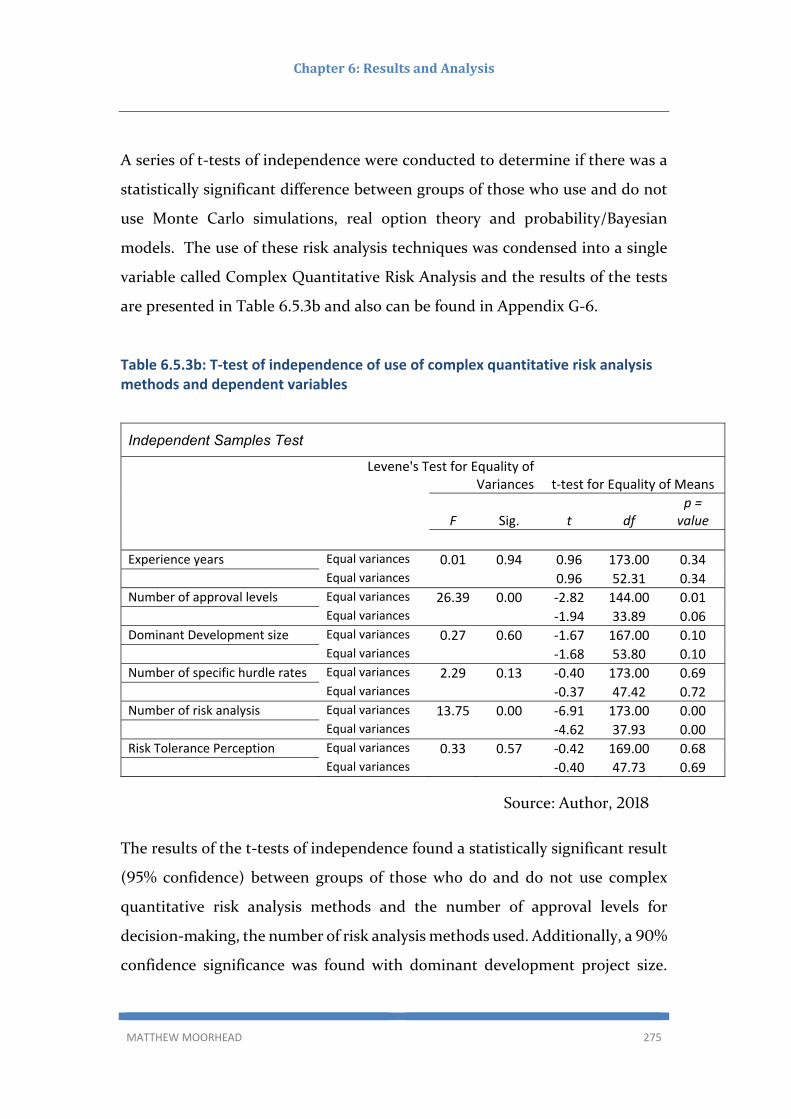
Chapter6:ResultsandAnalysis
MATTHEW MOORHEAD 275
A series of t‐tests of independence were conducted to determine if there was a
statistically significant difference between groups of those who use and do not
use Monte Carlo simulations, real option theory and probability/Bayesian
models. The use of these risk analysis techniques was condensed into a single
variable called Complex Quantitative Risk Analysis and the results of the tests
are presented in Table . . b and also can be found in Appendix G‐ .
Table 6.5.3b: T‐test of independence of use of complex quantitative risk analysis methods and dependent variables
Independent Samples Test
Levene's Test for Equality of
Variances t‐test for Equality of Means
F Sig. t df p = value
Experience years Equal variances 0.01 0.94 0.96 173.00 0.34
Equal variances 0.96 52.31 0.34 Number of approval levels Equal variances 26.39 0.00 ‐2.82 144.00 0.01
Equal variances ‐1.94 33.89 0.06
Dominant Development size Equal variances 0.27 0.60 ‐1.67 167.00 0.10 Equal variances ‐1.68 53.80 0.10
Number of specific hurdle rates Equal variances 2.29 0.13 ‐0.40 173.00 0.69
Equal variances ‐0.37 47.42 0.72 Number of risk analysis Equal variances 13.75 0.00 ‐6.91 173.00 0.00
Equal variances ‐4.62 37.93 0.00
Risk Tolerance Perception Equal variances 0.33 0.57 ‐0.42 169.00 0.68 Equal variances ‐0.40 47.73 0.69
Source: Author,
The results of the t‐tests of independence found a statistically significant result
( % confidence) between groups of those who do and do not use complex
quantitative risk analysis methods and the number of approval levels for
decision‐making, the number of risk analysis methods used. Additionally, a %
confidence significance was found with dominant development project size.
Chapter6:ResultsandAnalysis
MATTHEW MOORHEAD 276
This results indicates that larger development companies with more layers of
approval and who use more risk analysis methods in their project acquisition
tend to use more sophisticated complex quantitative analysis methods.
FindingRQ7:
The analysis of the survey results found a very low level of adoption and use of
the more sophisticated quantitative techniques including Monte Carlo
simulation, probability analysis, qualitative risk matrix and Real option theory,
with all having less than % usage by decision‐makers in the pre‐commitment
stages of the development process. Of those respondents who do use these
methods, they are more likely to be a development organisation that undertakes
large projects, uses a larger number of risk analysis methods and has more layers
in the project approval process.
6.5.4Projectriskidentificationandriskmanagementprocesses
Please evaluate the following aspects/features of your risk management
process at the pre‐commitment stage of the project development
process.
This question aims to give an understanding of respondent organisation risk
identification practices and culture during the pre‐commitment stages of the
development process. This question was patterned after Wiegelmann ( , p.
), but differs in that the focus is on the early stages of the site acquisition and
the go/no‐go decision process rather than across the complete development
process as a whole.

Chapter6:ResultsandAnalysis
MATTHEW MOORHEAD 277
It is generally accepted that organisations should aim to identify the key risks of
a potential project early in the decision process and assess the impact of these
risks on both the project and the organisation as a whole. This step naturally
must occur before any active risk management strategies are implemented and
form an essential part of the due diligence activities of property development
organisations. The results of the risk identification questions are presented in
Figure . . a and a comparison to the results found in Wiegelmann ( ) are
presented in Table . . .
Figure 6.5.4a: Project risk identification in the pre‐commitment stages of the property development process
Source: Author,
The result of this question demonstrates that the majority of respondents either
strongly disagree or disagree with the three statements concerning the difficulty
in the identification of risks demonstrating a high level of confidence in their
organisation’s overall risk management process. This result is similar to that
which was found in Wiegelmann ( ) concerning European property
1%
1%
2%
12%
20%
20%
26%
58%
56%
56%
58%
24%
22%
22%
14%
6%
0% 20% 40% 60% 80% 100%
DIFFICULT TO IDENTIFY THE MAIN RISKS FOR SPECIFIC PROJECTS
DIFFICULT TO IDENTIFY THE LIKELIHOOD OF RISKS OCCURRING
DIFFICULT TO ASSESS THE IMPACTS OF RISK MATERIALISING
RELIES ON EXTERNAL ADVICE IN RISK IDENTIFICATION
STRONGLY AGREE AGREE DISAGREE STRONGLY DISAGREE
M Moorhead Empirical Survey 2016 n = 170

Chapter6:ResultsandAnalysis
MATTHEW MOORHEAD 278
development organisations. Additionally, Newell and Steglick ( ) found %
of respondents, which were ASX publicly listed property developers, had a
system of risk identification prior to the commencement of a development
project.
Table 6.5.4: Project risk identification question comparison to Wiegelmann (2012)
Project risk identification
% that disagree or strongly disagree
Wiegelmann (2012) Moorhead (2016)
Difficult to identify the main risks for specific projects 92.70% 81.20%
Difficult to identify the likelihood of risks occurring 72.10% 78.82%
Difficult to assess the impacts of risk materialising 80.90% 71.76%
Source: Author,
When respondents were asked specifically about aspects of their organisation's
risk management practices, the overall level of confidence is reduced when
expressed in terms of the organisation's management and its attitude to risk
identification. Respondents were asked to evaluate the aspects/features of their
organisation's project decision‐making process and the results are presented in
Figure . . b.

Chapter6:ResultsandAnalysis
MATTHEW MOORHEAD 279
Figure 6.5.4b: Risk management processes
Source: Author,
12%
33%
40%
39%
40%
19%
54%
20%
26%
58%
55%
48%
44%
38%
29%
34%
38%
39%
24%
6%
7%
10%
17%
45%
7%
36%
28%
6%
6%
5%
6%
6%
8%
6%
7%
7%
0% 10% 20% 30% 40% 50% 60% 70% 80% 90% 100%
The company's structure supports effective riskmanagement
The company's culture supports effective risk management
Supportive & effective reporting and communication
Clearly defined roles, responsibilities & accountability
There are clear and written management statements onrisk management
The company's senior management is receptive to allcommunications about risks, including bad news
There is adequate risk management training provided
Are the responsibilities for risk management of the projectand continuous monitoring of risk been defined
A functional reporting concept has been designed and fullyimplemented
STRONGLY AGREE AGREE DISAGREE STRONGLY DISAGREE

Chapter6:ResultsandAnalysis
MATTHEW MOORHEAD 280
Please evaluate the following aspects/features of your risk management
process at the pre‐commitment stage of the project development
process.
Two particular areas which include ‘the company's senior management is
receptive to all communications about risks, including bad news reception to the
levels of confidence is reduced’, and ‘the company's culture supports effective
risk management’ demonstrated a lower level of confidence. This result
indicates that even though respondent organisations believe that they have
systems in place to adequately identify and manage risks to their projects, the
cultural aspects does not encourage decision‐makers to actively identify risks
and report them.
Areas, where high levels of confidence were indicated by survey respondents,
included the provision of risk management training, having clear and written
management statements on risk management, and having a supportive and
effective reporting and communication process and the company’s culture
supports effective risk management. These results appear to contradict those
areas where there was a lower level of confidence displayed. This result is not
dissimilar to other studies (e.g. Wiegelmann, ) where a high level of
confidence in the organisation's risk management practices is not reinforced by
the specific attributes of the risk management process.
6.5.5Confidenceinriskanalysisandmanagement
How confident are you that your company is identifying and preparing
for potentially significant risks in potential projects at the pre‐
commitment stages of the development process?

Chapter6:ResultsandAnalysis
MATTHEW MOORHEAD 281
When respondents were asked to indicate their level of confidence in relation to
their company identifying and preparing for potentially significant risks in
potential projects at the pre‐commitment stages of the development process, %
indicated absolute confidence, % confidence, % were more or less confident
and only % had no confidence. The results are illustrated in Figure . . and
Table . . . This result demonstrates an overall moderately high level of
confidence in their organisation's risk management and identification practices.
This result is more optimistic than that found by Wiegelmann ( ) where the
majority of European developers indicated a moderate to a moderately low level
of confidence, though a comparison is difficult as the difference could be
attributed to the market conditions facing the property development industry in
each region at the time of the survey.
Figure 6.5.5: Confidence in risk identification at the pre‐commitment stages of the property development process
Source: Author,
ABSOLUTE CONFIDENCE
10%
CONFIDENT45%
MORE OR LESS CONFIDENT
42%
NO CONFIDENCE
3%
M Moorhead Empirical Survey 2016 n = 168

Chapter6:ResultsandAnalysis
MATTHEW MOORHEAD 282
Table 6.5.5: Confidence in risk analysis and management
Source: Author,
6.5.6Summaryofresponsestoqualitativequestions
Does the organisation where you are employed have a risk management
strategy that is incorporated into feasibility analysis?
Survey participants were asked to indicate if the organisation for which they are
employed have a risk management strategy incorporated into their feasibility
analysis practices. The results of this question are presented in table . . a and
demonstrate that the majority of respondents ( %) indicated that a risk
management plan was in place, but % indicated that improvement is needed.
Only % of respondents indicated that the organisation for which they are
employed did not have a risk management strategy.
Table 6.5.6a: Respondents organisation has a risk management plan
Risk Management Plan Responses % Responses
Yes, implemented 75 42%
Yes, but needs improvement 57 32%
No, but planned 16 9%
No 29 16%
Total 177 100%
Source: Author,
Confidence in Risk Preperations Responses % Responses
Absolute Confidence 17 10%
Confident 76 45%
More or less confident 71 42%
No confidence 4 2%
Total 168 100%

Chapter6:ResultsandAnalysis
MATTHEW MOORHEAD 283
Has your company's risk management policy changed significantly over
the last seven years as a result of the global financial crisis?
The respondents who answered in the affirmative that the organisation for
which they are employed has a risk management plan, were also asked to
indicate if the organisations’ risk management plan had changed as a result of
the GFC. This question received a % response rate from the eligible
respondents, with % indicating the organisation for which they are employed
had indeed changed its risk management policy as illustrated in Figure . . .
Figure 6.5.6: Organisation change of risk management policy as a result of the GFC
Source: Author,
For the respondents who indicated a change in their organisations risk
management policy as a result of the GFC, were then asked to describe the
changes to their organisations risk management policy in an open‐ended
question, of which responses were received with ( %) indicating an
50%
50%
Yes No
M Moorhead Empirical Survey 2016 n = 132

Chapter6:ResultsandAnalysis
MATTHEW MOORHEAD 284
increase in the risk analysis practices as a result of the GFC The responses were
quantitised, in the process discussed in section . , into five categories which are
presented in table . . b.
Table 6.5.6b: Categories of risk policy change
Risk Policy Change Categories Responses % Responses
Increased qualitative frameworks and less prescriptive 10 22%
Greater focus on risk awareness (more qualitative) 8 18%
Increased quantitative risk analysis 11 24%
Change in funding arrangements (debt or equity) 7 16%
Other 9 20%
Total 45 100%
Source: Author,
The frequency of results after the open‐ended questions were coded into
categories did not reveal any dominating theme, with the per cent of responses
ranging from % to % with the category of increased quantitative risk analysis
and increased qualitative frameworks receiving the highest number of responses.
A recurring theme in the qualitative frameworks category was the inclusion of a
risk register and risk catalogue to allow for decision‐makers to plan for
mitigation and possible transference strategies once risks were identified.
Specific examples of responses found within this theme are given as follows:
Example : There is a greater focus on market risk with respect to
forecast growth assumptions, however, the company does not utilise a
proper risk matrix to assess likelihood and consequence to ascertain a
cost/revenue impact to the project. Scenario analysis is undertaken to
consider changes in forecast, but this is not used to quantify risk.

Chapter6:ResultsandAnalysis
MATTHEW MOORHEAD 285
(Senior Development Manager / Medium‐Large Project Size/ Primary
Residential Type/ Private Company/ ‐ years experience)
Example : A higher level of approval required at acquisition. Greater
research into market depth. Risk register and catalogue to allow for a
downturn strategy.
(Senior Development Manager / Medium‐Large Project Size/ Primary
Residential Type/ Publicly Listed Company/ + years experience)
Example : ) Introduction of an oversight and risk review group, who
are required to review and approve all acquisitions over $ m against a
set of pre‐determined risk strategies. This provides an arm's length
evaluation of assumptions and risk. ) Our company is also less likely
to purchase sites with any planning risk. In addition, there has been a
focus on purchasing assets "off‐balance sheet" with capital partnering,
joint ventures or "staged" acquisitions.
(Development Manager / Large Project Size/ Primary Residential Type/
Publicly Listed Company/ ‐ years experience)
Example : Maintaining a live risk register that is reviewed on month by
month basis.
(Development Manager / Large Project Size/ Primary Mixed‐Use Type/
Publicly Listed Company/ ‐ years experience)
Example : Payment of land value linked to key milestones to de‐risk
property. Much more emphasis on demographic information and
greater emphasis on quantity surveyor reports.
(Development Manager / Medium‐Large Project Size/ Primary
Residential Type/ Publicly Listed Company/ ‐ years experience)

Chapter6:ResultsandAnalysis
MATTHEW MOORHEAD 286
In the increased quantitative analysis category, a recurring theme was the use of
more sophisticated risk analysis techniques in their organisational feasibility
analysis practices. Specific examples of responses found within this theme are
given as follows:
Example : At the start of my involvement where I work, which was some
time ago, risk analysis was pretty much limited to sensitivity analysis
within the feasibility study. Towards the end of my involvement, it
included detailed Monte Carlo profiling of both cost and time aspects as
well as revenue streams
(General Manager / Medium‐Large Project Size/ Primary Residential
Type/ Private Company/ + years experience)
Example : More stringent stress testing of Cash Flow Models, and also
it is important for land values to be assessed on both a direct comparison
and hypothetical cash flow basis. The model may indicate a residual
value, however, it still needs to be supported by analysed sales (as much
as possible). Valuers tend to get in trouble once they place too great a
reliance on cash flow models only, with little regard or support provided
by comparable site sales.
(Senior Development Manager / Large Project Size/ Primary Residential
Type/ Private Company/ + years experience)
Example : More thorough scenario and sensitivity analysis in feasibility
analysis.
(Senior Development Manager / Small Project Size/ Primary Residential
Type/ Private Company/ + years experience)
Example : Financial metrics are much better scrutinised and identified
risks are far more rigorously examined with sensitivity analysis.

Chapter6:ResultsandAnalysis
MATTHEW MOORHEAD 287
(Senior Development Manager / Large Project Size/ Primary Residential
Type/ Publicly Listed Company/ + years experience)
Within the risk awareness and quantitative analysis theme‐specific examples of
responses are given as follows:
Example : Typically the changes have been around the funding
arrangements and our own internal hurdles on preselling or
underwriting potential capex of a project prior to the commitment.
(Senior Development Manager / Medium‐Large Project Size/ Primary
Residential Type/ Private Company/ ‐ years experience)
Example : Independent risk and quantitative analysis team now checks
projects before acquisition.
(Development Manager / Small Project Size/ Primary Other
Development Type/ Publicly Listed Company/ ‐ years experience)
Example : More punitive risk‐adjusted discount rates. Build a better
balance of cashflow producing assets with low risk, and high risk/profit
development projects that don't require profit to be drawn to maintain
overheads.
(Senior Development Manager / Large Project Size/ Primary Tourism
Type/ Publicly Listed Company/ + years experience)
Specific examples of responses regarding the theme of a change in funding
arrangements to debt or equity are given as follows:
Example : We now have much larger cash reserves in our business that
we will not go below under‐any circumstances. If we forecast a short

Chapter6:ResultsandAnalysis
MATTHEW MOORHEAD 288
term gap in development trading income that will potentially result in
this cash buffer being eroded, we will often pay a premium to use private
equity for a short period of time to ensure these cash reserves can be
maintained.
(Assistant Development Manager / Medium‐Small Project Size/
Primary Residential Type/ Private Company/ ‐ years experience)
Example : Seeking lower LVR's, Increased Scenario Analysis, and doing
smaller stages.
Senior Development Manager / Medium‐Small Project Size/ Primary
Residential Type/ Private Company/ + years experience)
Example : Depending on the client and their equity input. Some clients
are able to bring significant amounts of equity into their projects. This
is aligned with their company vision and structure. Equity input from
these clients are on long‐term projects such as land subdivisions and
mixed‐use developments. If debt funding is required it is part of the due
diligence process to liaise with potential lenders to determine their
hurdle rates (LVR, construction lend capacity, fees etc.). Put simply
there isn't a true change from our company's perspective. This is because
the Client's ability to provide equity and their ability to lend will change
on a project per‐project basis. Also, changes in banking circumstances
also provide significant changes to financial risks and lending criteria.
(Assistant Development Manager / Large Project Size/ Primary
Residential Type/ Private Company/ ‐ years experience)
Example : More equity required each deal so harder to get grasp up to
hurdle return. Usually, initial purchase fully equity funded. Approvals
and time frames as closely monitored.

Chapter6:ResultsandAnalysis
MATTHEW MOORHEAD 289
(Senior Development Manager / Medium‐Large Project Size/ Primary
Residential Type/ Publicly Listed Company + years experience)
6.5.7DeterminationofresearchquestionRQ8:
RQ : Are Australian and New Zealand property development companies
confident in their organisation’s risk identification and management
practices in the decision‐making processes of the pre‐commitment
stages of the development process?
FindingsRQ8:
Survey respondents demonstrated a high level of confidence in their
organisation's ability to both identify and manage risks that could be
encountered by potential property development projects. This confidence is
similar to that found by Wiegelmann ( ) but is not supported by the actual
risk management processes. The majority of property developers surveyed ( %)
indicated the organisation which they work for has a risk management plan, and
% indicated that the plan is implemented, with % indicating that
improvement is needed. Only % of respondents indicated their organisation
not having a risk management plan. Of those that do have a risk management
plan, half indicated that the plan has changed as a result of the GFC.
Specific examples of changes to their organisational risk management practices
indicated an increased focus on risk analysis which can be broadly categorised
into four themes which are an increased qualitative frameworks, an increased in
methods of quantitative risk analysis analysis, an increase in risk awareness and
associated quantitative analysis and a change in funding arrangements to debt
and/or equity. Examples of changes to decision‐practices, in regards to risk

Chapter6:ResultsandAnalysis
MATTHEW MOORHEAD 290
identification and management, were given including maintaining a live risk
register and risk catalogue to allow for organisational risk mitigation and risk
transference strategies, alternate debt and/or equity strategies including
securitisation of equity contributions to projects, the use of more sophisticated
quantitative risk analysis techniques such as Monte‐Carlo probability
simulations and adjusted hurdle and discount rates based on project planning
approvals and the outcome of a potential projects risk analysis.
6.5.8Contributionofresponsesconcerningriskanalysis,riskmanagementprocessesandorganisationalculturalaspectsofpropertydevelopers
Section . provided a narrative of the cultural aspects of respondent
organisations with respect to risk tolerance and attitudes. Additionally,
respondent risk analysis and management practices were examined with regards
to the demographic characteristics of respondents.
6.6Summary
This chapter provided a discussion of the results found through the analysis of
the data collected in the research instrument as part of the research
methodology. The results were presented in terms of the survey respondent
organisations in describing their key characteristics and demographics, the
organisation’s decision processes and hurdle rate adoption, the organisation’s
feasibility analysis practices and the organisation’s risk analysis and cultural
environment.
The primary goal of the analysis of the results was to address each of the research
aims and answer the research questions that were discussed in detail in Chapter
and make a contribution to the limited academic research that has been
previously undertaken concerning the decision‐making, hurdle rate selection
and altering and the feasibility analysis practices of Australian property

Chapter6:ResultsandAnalysis
MATTHEW MOORHEAD 291
development organisations in determining a projects viability and the selection
of potential projects in the pre‐commitment stages of the property development
process. Chapter will present a summary of the findings, outline the key
recommendations that have been formulated as a result of the analysis of the
results and also present opportunities for further research.

Chapter6:ResultsandAnalysis
MATTHEW MOORHEAD 292
(This page was left blank intentionally)

Chapter7:Recommendationsandfurtherresearch
MATTHEW MOORHEAD 293
Chapter7:Recommendationsandfurtherresearch
Little is known regarding either the expected or achieved rates of return for property development schemes. This lack of transparency is in contrast to the situation for investment properties where the formation of target return rates has been explored… Many participants in real estate development are not formally benchmarked and academic investigation of how developers form required rates of return is limited. (Crosby, Devaney & Wyatt, 2018a p. 1‐2)
Chapter presented the results of the analysis of the data collected from survey
participants in order to address the primary aims of this research. These aims
include an examination of the decision‐making practices in determining project
viability through feasibility analysis within real estate development firms in
Australia and also obtaining information regarding hurdle rate selection and
techniques commonly utilised to determine project viability. This research
investigates the drivers and decision‐making processes of property developers in
Australia but also touches on the global practices of the industry as property
development becomes increasingly internationalised.
An additional research aim was to examine if decision‐makers within the
industry utilise generic hurdle rates, industry rules of thumb and benchmarks
when deciding to proceed with a project in the pre‐commitment stages of the
property development process. The pre‐commitment stages refer to those stages
in the development process prior to a go/no‐go decision point and before site
acquisition or project commencement. The final research aim includes an

Chapter7:Recommendationsandfurtherresearch
MATTHEW MOORHEAD 294
examination of the risk analysis, risk identification and management practices,
including the use of Monte Carlo simulations, Bayesian models and Real option
theory in property development decision‐making as instruments for providing
flexibility and managing risk, uncertainty and change.
This research investigation has made a contribution to knowledge by informing
on the gaps within the literature and prior academic studies, as more fully
discussed in Chapter . The research questions were designed to address each of
the research aims, originating from both the literature review, predicated on the
author’s professional practice. The key findings are summarised in section . .
7.1ReviewoftheliteraturefromChapters2‐4
Within the framework of this research thesis, chapter outlined and described
a number of development process models that illustrate the process used by real
estate development firms in order to bring a development project from initial
concept and obtaining permissions through to completion, handover and the
managing of the asset over its lifecycle. Additionally, property developer
typologies were identified and defined; types of property development projects
commonly undertaken were outlined; an overview of the Australian property
development industry given; and finally, an original definition of property
development was provided.
Chapter provided a review of the literature and theory regarding the practice
of determining project viability in property development projects through the
use of feasibility analysis. The recent history and evolution of feasibility analysis
practices for property development were also discussed. The practical aspects of
completing a feasibility analysis for a project was addressed. Decision methods
and hurdle rate selection were discussed and past research concerning the
Chapter7:Recommendationsandfurtherresearch
MATTHEW MOORHEAD 295
application and use of hurdle rates in decision making literature was reviewed.
Particular methods of determining site value were discussed including the
traditional static residual land value method, the dynamic methods of
discounted cash flow and the residual accumulation cash flow method and the
market comparison method.
Within existing academic literature, there remains a scarcity of understanding
and analyses concerning the uptake and acceptance of the various risk
measurement and mitigation techniques applied by property developers in the
Australian markets. Chapter investigated the techniques being incorporated
into the decision‐making process during the pre‐commitment stage of the
development process and how property developers adjust their decision‐making
processes in light of a predicted change in project risk.
To this end, a literature review has been completed in respect of the broader
property development process as well as the determination of project viability
through feasibility analysis. The review of the current academic literature
identified only a few studies that have sought to make a thorough investigation
of the practices used within the property development industry, the principal
studies which include Newell & Steglick ( ); Civan ( ); Atherton et al.
( ); Gehner ( ), Costello & Preller ( ); Loizou & French ( );
Wiegelmann ( ); Coleman et al. ( ), Crosby et al. ( a) which outlined
key decision hurdle rates and identified innovative practices that have been
developed including the use of Monte‐Carlo simulation and Bayesian models.
From this supportable foundation, and generated from relevant published
sources, the status of informed, contemporary opinion on the decision models
within the property development process have been illustrated. However, these
studies were limited as they did not identify the extent of adoption or use of
these methods and, in particular, the selection and altering of hurdle rates as a

Chapter7:Recommendationsandfurtherresearch
MATTHEW MOORHEAD 296
decision basis within the property development industry in Australia. As a
consequence, the merits of the views of Crosby, Devaney & Wyatt ( a) and
other commentators concerning the limited knowledge the manner in which
property developers determine rates of return or the viability of potential
projects could then be considered with greater insight. As an outcome of the
literature review, it was appropriate to inquire further into the practices of the
property development industry in Australian and New Zealand, which was
evidently not well documented, and to present empirically a view of the current
decision‐making and hurdle rate selection practices for comparative analysis.
7.2SummaryofFindings
The results of the statistical analysis have been presented in order to provide a
broad level of understanding of industry practice and answer the research
questions presented in Chapters and . The following sections provide a
summary of the results and findings for each research question. Notwithstanding
the limitation of applying the results of respondents in a survey of the industry
as a whole or the other limitations of this study discussed in section . , the
following section will generalise the results of the survey responses as applied to
the broader property development industry in Australia.
7.2.1ResearchAim1–Theroleoffeasibilityanalysisandhurdlerateselectioninmanagementdecisionmakinganddeterminingviabilityinthepre‐commitmentstagesofthedevelopmentprocess
The majority of Australian property development organisations do utilise
specific go/no‐go hurdle rate mechanisms as a decision basis for
proceeding beyond the pre‐commitment stages of the development
process.
In particular, the use of MDC and IRR as specific hurdle rate metrics are
incorporated into the decision to proceed with potential projects. Additionally,

Chapter7:Recommendationsandfurtherresearch
MATTHEW MOORHEAD 297
a large majority ( %) of property developers use either one or two specific
hurdle rate metrics as the basis of decision making. Property developers who do
not use specific hurdle rates are more likely to use a qualitative framework as a
basis for decision‐making.
Dominant property typologies
Differences between dominant property typologies for Australian and New
Zealand property developers were examined and found that there were no
significant differences between typologies in the use of specific go/no‐go
decision processes. Additionally, there were no differences in the use of primarily
quantitative or qualitative methods as a basis for project decisions at the
acquisition or commencement stages of the property development process.
Specific hurdle rate metrics including MDC, IRR, ROE and NPV were tested to
ascertain if significant differences existed in their usage between the residential,
commercial, retail, industrial, tourism or other property typologies. A significant
difference was found in the residential dominant developer category which was
more likely to use an MDC as a hurdle rate metric. No other significant results
were found among the remaining dominant property typologies in the use of IRR,
ROE and NPV.
In addition to testing for the use of specific financial metrics, the specific level
or percentage adopted was also examined among the differing property
typologies. When the specific level of MDC adopted was examined, there was
found to be no statistically significant difference between the individual
dominant property type categories, and the reason for this will be explored
further in the summary of Research Aim . When the specific percentage of IRR
used as a hurdle rate was examined, it was found that the residential dominant
category required a higher minimum IRR percentage than that of the retail and
Chapter7:Recommendationsandfurtherresearch
MATTHEW MOORHEAD 298
mixed‐use dominant categories. Additionally, the ‘other’ property dominant
type category, which included both industrial and childcare developer
respondents, it was found that the adopted percentage rate of IRR was higher
than that of the retail category and was very close to the % mean result of the
residential dominant category. These results demonstrate the perception that
residential and mixed‐use property type categories reflect a higher required
risk/reward trade‐off than those of retail and commercial property development
projects.
Preferred project sizes and public versus private ownership structures
The differences between large, medium and small projects were analysed, as well
as the differences between those developers who use a public versus a private
ownership structure. In relation to project size, the results demonstrated that
developers who undertake large project sizes do utilise more sophisticated
methods of feasibility analysis and have a higher number of specific hurdle rates
as a basis for project selection and proceeding beyond the pre‐commitment
stages of the development process. This result is in line with what was expected,
as those who undertake larger projects typically have more capital at risk and it
was anticipated that more resources would be dedicated to the determination of
project viability.
However, public versus private ownership structures did not influence the
choice or the number of hurdle rates used as a decision basis. It was anticipated
that publicly listed developers would use more specific financial metrics, both in
number and complexity, in order to determine project viability; however,
statistically significant differences were not found. The results also demonstrate
that developers who undertake smaller projects adopt a higher percentage of
ROE as a hurdle rate. One explanation for this result is that smaller projects have

Chapter7:Recommendationsandfurtherresearch
MATTHEW MOORHEAD 299
more access to debt capital which would necessarily increase the ROE
percentage required, given the use of other hurdle rates such as MDC and IRR
which are not as heavily influenced by a project’s gearing. Additionally, a strong
association was found between the use of ROE as a hurdle rate and using
multiple hurdle rates in decision‐making, indicating this was a secondary hurdle
rate metric in addition to the use of MDC or IRR. The results found only a small
incidence of use of NPV as a project decision‐making hurdle rate, and preferred
project size and ownership structure had no significant association with the use
of this hurdle rate. This result was surprising given the prominence of NPV in
the financial decision‐making academic literature.
Project size also influenced a developer’s use of IRR as a hurdle rate, although
the preferred project size and ownership structure had no significant association
with the specific percentage level adopted. Additionally, there was no
association found between preferred project size and ownership structure and
the use of a specific percentage level of MDC adopted as a hurdle rate.
The results also indicate that the structure of many development projects are
complex and the boundaries between traditional speculative development and
property investment through the use of securitisation methods have become
more difficult to distinguish. Additionally, the results show that the majority of
development organisations in this survey did not rely purely on quantitative
metrics of project viability to make decisions but also use qualitative methods
and organisational specific structural checks and balances as a method of
managing the organisation’s risk. Even though the majority of responses indicate
that development organisations rely on a single level of organisational approval,
the nature of that approval is at the corporate board or executive level rather
than at the level of the project manager. Smaller development organisations
Chapter7:Recommendationsandfurtherresearch
MATTHEW MOORHEAD 300
which do not have boards or a formal risk management process are more likely
to require the approval of the General Manager.
Developer typologies
The results of the analysis demonstrate that differences exist in the selection and
use of hurdle rates based on developer typologies. Investor Developers are more
likely to use the payback period as a hurdle rate and Trader Developers and
Development Managers are both more likely to use MDC and also to use specific
hurdle rates as a part of a go/no‐go decision. Additionally, Trader Developers
adopt a higher percentage of IRR as a metric than do the other key developer
typologies which may reflect the higher level of risk inherent in the more
speculative nature of the development process for Trader Developers than for
Investor Developers. It is also relevant to note that Trader Developers deviate
further from accepted financial theory in hurdle rate selection than do Investors
Developers.
Experienced versus novices and having a property related qualification in
hurdle rate section and usage
The results of the analysis demonstrated that there were no differences between
experienced versus novices in terms of their use of go/no‐go hurdle rates, the
usage or specific levels of key hurdle rates, the number of hurdle rates used or in
the number of variables forecasted to aid in decision‐making based on
experience levels. These results were different from those anticipated and is an
area for further research. Additionally, the results also demonstrate that there is
little difference between decision‐makers who have a property qualification and
those who do not, with the exception that they were more likely to use specific
hurdle rates in their decision‐making processes.

Chapter7:Recommendationsandfurtherresearch
MATTHEW MOORHEAD 301
Differences between New Zealand and Australian property developers in
their selection and usage of hurdle rates and decision‐making practices
New Zealand developers demonstrated a lower usage of specific hurdle rates as
part of their decision‐making processes than did Australian based property
developers, where the vast majority use specific go/no‐go hurdle rate metrics.
However, the results of the analysis demonstrated that for those in Australia and
New Zealand who do use specific hurdle rates in decision‐making, significant
differences were not found with the exception of New Zealand based property
developers who were more likely to use the Minimum Profit dollar amount and
Minimum Project Size dollar amount than were Australian based property
developers.
Differences between a multi‐national and domestic scope of property
development regarding the selection and usage of hurdle rates and
decision‐making practices
The results indicated that multi‐national property development organisations
operating in multiple geographic regions demonstrated a higher use of
qualitative frameworks as a decision‐making process and lower use of MDC as a
hurdle rate. This result is the opposite of that of Australian and New Zealand
developers operating in their domestic markets. This result demonstrates that
those firms that operate across multiple national markets need to incorporate
more flexible and complex decision‐making than developers operating in a
single national market.
Feasibility analysis practices and the use of proprietary or bespoke
feasibility analysis programs

Chapter7:Recommendationsandfurtherresearch
MATTHEW MOORHEAD 302
The feasibility analysis practices of Australian property developers were analysed
in terms of the variables forecasted, the retrospective checking of forecasted
variables, the use of Microsoft Excel in determining project viability, proprietary
and bespoke feasibility analysis software and the methods of feasibility analysis
utilised as well as the methods of determining a site’s value prior to project
commencement.
In terms of the most frequently forecasted variables, they included the variables
of gross sales in dollars per square metre, the supply of comparable property
(sales value), the yield of comparable properties, the percentage market capture
of sales (demand), capitalisation rates and interest rates. The only frequently
forecasted variable that is a macro‐economic indicator was found to be interest
rates with all other frequently forecasted variables being concerned with the
microeconomic aspects of the property market. Additionally, the frequency of
usage of variables indicates information that is either from the past (such as
comparable sales or leasing data) or variables that give a reflection of the current
state of the market. In terms of developers retrospectively checking their
forecasted variables, the majority of developers do go back and check their
forecasts in order to learn from their results and improve their forecasting
practices.
In terms of developer feasibility analysis practices and the use of feasibility
analysis programs, the two most frequently used tools included Microsoft Excel
( %) and Argus Estate Master DF ( %), with other proprietary feasibility
analysis programs usage being less than or equal to per cent. In terms of
developers who use a proprietary feasibility analysis program other than
Microsoft Excel, and those who do not, six key differences were found. First, a
key difference included being more likely to use specific hurdle rate metrics to

Chapter7:Recommendationsandfurtherresearch
MATTHEW MOORHEAD 303
decide to proceed with a project beyond the pre‐commitment stages of the
development process. Second, they were more likely to utilise a specific hurdle
rate metric in determining project viability and interestingly were also more
likely to alter or adapt hurdle rates given a change in project uncertainty or risk.
Third, they were more likely to use MDC as a hurdle rate metric, but there was
no difference in the percentage level adopted. Fourth, those who use proprietary
feasibility analysis programs also use a higher percentage of IRR as a hurdle rate
but are no more likely to use ROE or MOR. Fifth, the number of variables used
in forecasting, the number of approval levels required to proceed and the mean
years of experience of decision‐makers were not found to be significantly
different. Finally, in terms of the use by developers who use bespoke property
development programs and those who do not, differences were found based on
both the preferred project size and also whether the organisation is publicly
listed or not.
The use of the residual land value method, the discounted cash‐flow
method, the residual accumulation cash flow method and/or the market
comparison method for determining a potential development site’s value
by Australian and New Zealand development companies
It was found that in the pre‐commitment stages of the development process the
primary methods used included the residual land value method and the
discounted cash flow method to value a site. The residual accumulation cash
flow method (RACFM as discussed in section . . ) and the market comparison
method were not widely used. Additionally, developers with more than ten years’
experience are more likely to use the residual land value method than less
experienced respondents. Experience levels did not play a significant factor at all
in the use of the discounted cash flow method, the residual cash flow method
accumulation or the market comparison method.
Chapter7:Recommendationsandfurtherresearch
MATTHEW MOORHEAD 304
7.2.2ResearchAim2–Therelationshipbetweenboundedrationalityandheuristicbiasinmanagementdecision‐makingbyAustralianandNewZealandpropertydevelopmentorganisations
Do Australian property development organisations have a pre‐determined
process and method of altering or adapting chosen hurdle rates, and do
they specify and change the required hurdle rates and benchmarks as a
basis of go/no‐go decisions in light of increased risk and uncertainty?
The majority of developers in Australia do not have a pre‐determined process
and method for altering or adapting the chosen hurdle rates and benchmarks,
even in the presence of an expected change in uncertainty and risk to a potential
project. It was found that for developers who do alter their hurdle rates, the
primary basis for that change can be categorised by three themes including
altering hurdle rates on the basis of risk analysis and forecasted market
conditions, altering hurdle rates based on qualitative frameworks or intuition
and altering hurdle rates based on the project’s status of planning approval. The
most important variables in predicting whether developers alter their hurdle
rates include the developer typology, the type of property developed, education
level and whether the decision‐maker uses MDC or IRR as a hurdle rate.
The demonstration of bounded rationality in the decision‐making
processes of Australian and New Zealand property developers
The results demonstrate a heavy reliance on industry‐accepted rules of thumb
for both selecting and setting the specific level of hurdle rate metrics used to
decide whether to proceed with a development project beyond the pre‐
commitment stages of the development process. Additionally, it is interesting
to note that the selection and usage of specific hurdle rates did not change even
when there was a perceived change in the risk or the uncertainty of a project.

Chapter7:Recommendationsandfurtherresearch
MATTHEW MOORHEAD 305
The rationale for the choosing and setting of minimum hurdle rate metrics is
based largely on experience, intuition and the minimum accepted benchmarks
set by providers of capital finance to the property development industry.
Residential developers and the typology of Trader Developers were more likely
to rely on a narrow range of MDC (median % and standard deviation of . %)
and IRR (median % and standard deviation . %) percentages.
7.2.3ResearchAim3–ConsidertheuseofMonteCarlosimulations,Bayesianmodelsandoptiontheory,realandembeddedoptionsinlong‐termpropertydevelopmentandinvestmentdecisionmakingasinstrumentsforprovidingflexibilityandmanagingrisk,uncertaintyandchange.
Do Australian and New Zealand property developers use sophisticated
theory‐led structured quantitative analysis in the feasibility analysis
models used in the decision‐making processes in the pre‐commitment
stages of the development process?
The results found few development organisations use sophisticated quantitative
risk analysis methods such as Monte Carlo simulation, Real Option theory and
probability/Bayesian models in their decision making at the pre‐commitment
stages of the development process. Of those who do use these methods, they are
more likely to be a development organisation which undertakes large projects,
uses a larger number of risk analysis methods and has more layers in the project
approval process.
Do Australian and New Zealand property developers demonstrate
confidence in risk identification and management practices in the
decision‐making processes in the pre‐commitment stages of the
development process?

Chapter7:Recommendationsandfurtherresearch
MATTHEW MOORHEAD 306
The results demonstrated that decision‐makers in Australian and New Zealand
property development organisations possess a high level of confidence in their
organisation’s ability in both the identification and management of risks which
may be encountered in a potential property development project. This
confidence is similar to that found in other studies; however, this is not
supported by the actual risk management processes used by property
development organisations revealed by this research. The majority of property
developers ( %) indicated the organisation which they work for has a risk
management plan, and % indicated that the plan is implemented, with %
indicating that improvement is needed. Only % of respondents indicated
their organisation not having a risk management plant. Of those that do have a
risk management plan, half indicated that the plan has changed as a result of the
GFC.
Specific examples of changes to their organisational risk management practices
indicated an increased focus on risk analysis which can be broadly categorised
into four themes which are increased qualitative frameworks, an increased in
methods of quantitative risk analysis analysis, an increase in risk awareness and
associated quantitative analysis and a change in funding arrangements to debt
and/or equity. Examples of changes to decision‐practices, in regards to risk
identification and management, were given including maintaining a live risk
register and risk catalogue to allow for organisational risk mitigation and risk
transference strategies, alternate debt and/or equity strategies including
securitisation of equity contributions to projects, the use of more sophisticated
quantitative risk analysis techniques such as Monte‐Carlo probability
simulations and adjusted hurdle and discount rates based on project planning
approvals and the outcome of a potential projects risk analysis.

Chapter7:Recommendationsandfurtherresearch
MATTHEW MOORHEAD 307
7.3Recommendations
A large quantity of data has been collected, analysed and then synthesised from
the perspectives of the background literature, focused property development
decision‐making literature and from the empirical data collected. The synthesis
and analysis of these elements, of which this study is comprised, has allowed the
formulation of a number of recommendations for the Australian and New
Zealand property development industry in respect of determining potential
project viability in the pre‐commitment stages of the development process. The
key recommendations are summarised in the following:
In relation to short term projects‐ less than three years in total‐ and when
conducting speculative based property development projects, decision‐
makers should not focus on IRR or other time‐weighted metrics as a
method of comparison between projects, but adopt simpler short term
measures such as ROC or MDC.
Property development projects that occur over a period longer than three
years should use a hurdle rate financial metric based on the time value of
money, such as the DCF methodology, in order to determine the
development site’s residual land value as well as a potential project’s NPV
and IRR. However, if decision‐makers continue to rely on a simple MDC
or ROC method, there should be an adjustment in the required MDC for
a longer‐term project to account for time.
For potential projects where the primary purpose for undertaking the
project is for investment purposes, or build to rent, then IRR and other
time‐value of money based financial metrics should be adopted as well as
TIRR for the determination of a go/no‐go decision basis.

Chapter7:Recommendationsandfurtherresearch
MATTHEW MOORHEAD 308
The property development field of research should not blindly follow the
broader financial investment research that is focused on regular recurrent
income. Research into the decision practices of property development
projects should also seek to incorporate specific indicators that cater to
short term speculative development projects.
The property development industries in Australia should be aware of the
changing political and societal landscape that will place a higher
emphasis on the long‐term outcomes of projects rather than a ‘develop
and forget’ model.
Notwithstanding the requirements that providers of capital for property
development projects demand a project must achieve a minimum of %
return on capital, property development organisations should also have
independently determined project hurdle rates as an aid to decision‐
making. These hurdle rates should be based on the organisation’s
opportunity cost, WACC and also an additional risk premium determined
by the forecasted risk and uncertainty of the key variable inputs of a
potential project.
Property development organisations should utilise a pre‐determined
process and method of altering or adapting the chosen hurdle rates and
benchmarks along the basis of a number of criteria including:
o The level of risk and uncertainty concerning input variables which
must be forecasted
o The type of planning approval already obtained or required for the
potential project

Chapter7:Recommendationsandfurtherresearch
MATTHEW MOORHEAD 309
o The level of risk and uncertainty perceived from analysing a
potential project’s key variable inputs
o The level of risk and uncertainty perceived in the broader property
market
o The level of risk and uncertainty perceived in the general economy.
In order to incorporate the recommendation of having a pre‐determined
process and method of adapting hurdle rates, property development
decision‐makers, if using simple MDC, ROC, ROE or ROR decision
metrics, should also utilise a time value of money hurdle rate. This allows
for varying risk premiums commensurate with the anticipated risk and
uncertainty in a potential project.
Property development organisations should incorporate more modern
and sophisticated models of risk analysis in order to determine the
uncertainty of, and risk in, a change of input variables in their financial
viability appraisals. In recent times there have been advances in
proprietary feasibility analysis programs and Microsoft Excel add‐ins that
are readily available and which offer the use of Monte‐Carlo stochastic
simulations and other probability‐based quantitative techniques.
Property development organisations in Australia should utilise these
specific techniques in the pre‐commitment stages of the property
development process and, specifically, in the site acquisition process to
support decision‐making.
In conducting a feasibility analysis to determine financial viability in the
pre‐commitment stages of the development process, property
development organisations should utilise specific debt and equity
structures in their modelling. These are more practical and realistic for

Chapter7:Recommendationsandfurtherresearch
MATTHEW MOORHEAD 310
their purposes than relying on the % finance method often
represented in the literature and employed by valuation firms to
determine site value.
In conducting feasibility analysis to determine financial viability in the
pre‐commitment stages of the development process, property
development organisations should incorporate qualitative risk analysis
methods including a live risk register and catalogue of risks, including
identification of and plans for mitigation of project risks, as a form of risk
management.
This section has presented the key recommendations of this study in terms of
decision‐makers who are engaged in the process of determining the financial
viability of potential projects in the pre‐commitment stages of the development
process in the Australian and New Zealand property development industry. The
following section outlines the areas of contribution to the body of knowledge
that has resulted from undertaking this study.
7.4Contribution
The findings and results of the empirical survey addressing the research
questions in each of the research aims have revealed a degree of consensus from
decision‐makers in property development organisation in Australia. This
consensus in the use and application of hurdle rate metrics and feasibility
analysis practices to determine project viability of potential projects is greater
than that expected from the review of relevant literature. Differences of opinion
and the practical application of techniques have become evident from the
analysis of the data. These findings can provide the basis for further rigorous
discussion in other forums, backed by the integrity of this survey which can now

Chapter7:Recommendationsandfurtherresearch
MATTHEW MOORHEAD 311
form part of the body of knowledge and literature concerning property
development decision‐making and hurdle rate selection practices.
This study analysed and presented findings by examining the literature relating
to the property development process, feasibility analysis practices and risk
management practices of the industry to provide clear identification of the issues
faced by decision‐makers in the pre‐commitment stages of the development
process. Additionally, through the use of an empirical survey and accompanying
analysis, these issues were investigated to provide a greater level of clarity on the
specific practices used as a basis of determining the viability of potential projects,
thereby contributing new perspectives’ to the body of knowledge.
Phillips and Pugh ( , p. – ), building on the work of Francis ( ),
suggest fifteen measures that can be used as an appropriate yardstick as a
measure of originality. The following measures outline those that are considered
relevant to, as well as those delivered and achieved by, this research:
Carrying out empirical work not previously undertaken:
o The survey of decision‐makers in property development
organisations within Australia which elicited details of their
education, experience, motivation, feasibility analysis practices,
hurdle rate selection and risk analysis practices. The survey
identified opinions on specific aspects regarding the
determination of a potential project’s viability, including hurdle
rate alteration and adaptation in light of a change to risk and
uncertainty.
Making a synthesis not made before:
Chapter7:Recommendationsandfurtherresearch
MATTHEW MOORHEAD 312
o The review of the literature in respect of the property development
industry’s views (background theory) of the property development
process and feasibility analysis practices in comparison to those of
the relevant broader property, finance and risk management
literature.
Setting down a major piece of new information in writing for the first time:
o An original definition of property development was given as
follows:
Property development can be defined as a sequence of steps
that take a property development project from inception
through to construction and completion including the
management of the asset over its lifecycle in order to derive
value and achieve the objectives of the project.
o An identification of a dichotomy between property developers’
understanding and the practice of determining project viability.
Continuation of a previously original piece of work:
o The extension and updating of the surveys of property
development organisations undertaken in the following areas:
Concerning hurdle rate selection and use in feasibility
analysis practices:
Hutchinson et al. ( ), Crosby et al. ( ), Preller
( ), and Preller and Costello ( ) and
Coleman et al. ( ).
Concerning the risk analysis in feasibility analysis:
Wiegelmann ( ), Newell & Steglick ( ),
Lyons and Skitmore ( ) and Uher and Toakley
( ).

Chapter7:Recommendationsandfurtherresearch
MATTHEW MOORHEAD 313
Undertaking original research in Australia, which previously, has only
been found in other countries:
o The investigation into heuristic bias and bounded rationality
through the use of rules of thumb for hurdle rate selection and
usage by Australian and New Zealand property development
organisations in the pre‐commitment stages of the property
development process.
o The investigation of the methods used to adjust and adapt specific
hurdle rate metrics in light of a change in uncertainty and risk in
a potential project.
Generating findings concerning aspects of the property development
process not previously reported in the literature:
o This study was the first to examine the alteration and the
adjustment of hurdle rate metrics in the decision‐making of
Australian and New Zealand property development organisations
specifically this in the pre‐commitment, site acquisition and due‐
diligence, stages of the development process.
This section has outlined the key areas where this research has made a
contribution to the body of knowledge concerning the process of determining
the financial viability of potential projects in the pre‐commitment stages of the
development process in the Australian and New Zealand property development
industry. The following section outlines areas of further research which have
been identified as an outcome of the process of undertaking this study.

Chapter7:Recommendationsandfurtherresearch
MATTHEW MOORHEAD 314
7.5FurtherResearch
Chapter has thus far described the purpose and aims of this study which was
primarily concerned with making a contribution to the body of knowledge in the
areas of site acquisition and determining potential project viability in the pre‐
commitment stages of the development process. Although not detracting from
the contribution of this research, there are several unresolved questions which
would make interesting topics of further research which are now discussed.
The results of the analysis demonstrate that respondent development
organisations did not differ in their use of go/no‐go hurdle rates, the
usage or specific levels of key hurdle rates, the number of hurdle rates
used or in the number of variables forecasted to aid in decision‐making.
These results were different from that which was anticipated and is an
area to be considered for further research.
It was found that the same heuristic bias can be found across industry
property types, developer typologies and differing ownership structures
and project sizes. It would be beneficial to conduct further research into
small to medium size development organisations’ decision‐making
practices and, in particular, should these organisations use different
metrics in project selection than those currently adopted when
undertaking larger projects?
The survey results indicated a very low level of adoption and use of
sophisticated quantitative techniques including Monte Carlo simulation,
probability analysis, qualitative risk matrix and real option theory.
Hutchinson et al. ( , p. ) also found very low levels of use of
sophisticated decision‐making models for property investors and

Chapter7:Recommendationsandfurtherresearch
MATTHEW MOORHEAD 315
developers in the UK and offered a number of reasons as an explanation.
These include the perceived difficulty in applying models to
heterogeneous assets, senior management reluctance to accept new
approaches and gaps in the knowledge and human capital required to
incorporate sophisticated modelling techniques. These explanations may
also be relevant to the Australian and New Zealand property development
industries and is an area which warrants further research.
The linking of decision‐making practices and hurdle rate selection with
project outcomes and developer success ratings is an area that also
warrants further research. This could be achieved by the creation of a
database of project viability studies from property development
organisations which could then be linked to the project’s ultimate success
under varying market conditions. Although not required for this study,
the analysis of this information would allow a deeper understanding of a
number of aspects which have had to be inferred from the responses from
survey participants. Property development organisations across a number
of granulating categories such as property type, tenure, geographic
location and ownership structures have provided empirical evidence of
their decision‐making practices and how they respond to a given change
in the perceived uncertainty and risk in the market in which they operate.
The inclusion of a set of market conditions and an ultimate outcome for
a project could lead to a more detailed decision‐making model and/or
recommendation of analytical methods for decision‐making other than
those currently available in the literature.
The creation of project outcomes and the addition of development project
outcomes may also lead to an explanation of why sophisticated analytical
methods from the academic literature are not currently being readily

Chapter7:Recommendationsandfurtherresearch
MATTHEW MOORHEAD 316
adopted by industry. Additionally, material and responses from other
research studies and professional bodies, especially from the UK and USA,
could form the basis for a comparative study of other geographic regions
as well from other industries such as infrastructure projects and long‐
term property investing.
The inclusion of project outcome information could also allow for a
greater understanding of policy outcomes that interject into the broader
property market and upon the property development industry which
forms a significant contributor to both GDP and employment in an
urbanised economy. The movement of the levers of monetary policy,
prudential regulation, the credit cycle and also property taxation at all
levels of government, including funding models for public infrastructure
levied on property developers, all have a significant impact on the input
variables that form critical success factors for property development
projects. Greater awareness of the project outcomes following changes in
key policy may lead to a better understanding of the outcomes of policy
change on the development industry and the economy as a whole.
In conclusion, this study has been successful in achieving its primary aim of
investigating the techniques that are being incorporated into the decision‐
making process during the pre‐commitment stage of the development process
and how property development organisations adjust their decision‐making
processes in the light of a predicted change in project uncertainty and risk.
Firstly, this study has provided clarification of the types of hurdle rates and
decision‐making processes used by Australian property developers in order to
make a go/no‐go project decision. Secondly, this study has provided a more
detailed view of the decision‐making practices of property developers from a
more granulated and stratified perspective across the industry in Australia,

Chapter7:Recommendationsandfurtherresearch
MATTHEW MOORHEAD 317
greater than and more detailed than any which previously existed. Thirdly, this
study has raised further questions concerning the incorporation of hurdle rate
selection and determining the viability of property development projects in
Australia for subsequent study.
References
MATTHEW MOORHEAD 318
References
ABS ( ). Counts of Australian Businesses, including Entries and
Exits, Jun to Jun . Canberra, Australian Bureaus of Statistics.
Retreived from
http://www.abs.gov.au/AUSSTATS/[email protected]/DetailsPage/ . Jun+ +
to+Jun+
ABS ( a). Counts of Australian Businesses, including Entries and
Exits, Jun to Jun . Canberra, Australian Bureaus of Statistics.
Retreived from
http://www.abs.gov.au/AUSSTATS/[email protected]/DetailsPage/ . Jun+ +t
o+Jun+
ABS. ( ). Table , Employed Persons By Industry Sub‐Division of Main
Job (ANZSIC) and Sex. Retrieved from
http://www.abs.gov.au/AUSSTATS/[email protected]/DetailsPage/ . . . Feb
% ?OpenDocument
ABS. ( b). Building Activity, Value of Work Done, Chain volume
Measures, Australia, June ., time series spreadsheet, cat. no. ,
viewed October . Retreived from
http://www.abs.gov.au/ausstats/[email protected]/mf/ .
Acharya, V. V., & Richardson, M. ( ). Causes of the financial crisis.
Critical Review, ( ‐ ), ‐ .
Adair, A., Berry, J., & McGreal, W. ( ). Investment decision making: a
behavioural perspective. Journal of Property Finance, ( ), ‐ .

References
MATTHEW MOORHEAD 319
Adams, D., Croudace, R., & Tiesdell, S. ( ). Exploring the ‘notional
property developer’as a policy construct. Urban Studies, ( ), ‐ .
https://doi.org/ . /
ADB. ( ). Key Indicators for Asia and the Pacific; Asian Development
Bank, Manilla ( th ed.).
Adelman, P. J., & Marks, A. M. ( ). Entrepreneurial Finance (t. Edition
Ed. Vol. ): Pearson.
Akintoye, A. S., & MacLeod, M. J. ( ). Risk analysis and management in
construction. International Journal of Project Management, ( ), ‐ .
https://doi.org/ . /S ‐ ( ) ‐X
Albouy, D., & Ehrlich, G. ( ). Housing productivity and the social cost of
land‐use restrictions. Journal of Urban Economics.
Altshuler, D., & Schneiderman, R. ( ). Point of View: Overpayment of
Manager Incentive Fees—When Preferred Returns and IRR Hurdles Differ.
Journal of Real Estate Portfolio Management, ( ), ‐ .
http://www.aresjournals.org/doi/abs/ . /repm. . . t wlp k
Anderson, B. F., & Settle, J. W. ( ). The influence of portfolio
characteristics and investment period on investment choice. Journal of
Economic Psychology, ( ), ‐ . https://doi.org/ . / ‐
( ) ‐
Anderson, D. R., Sweeney, D. J., & Williams, T. A. ( ). Statistics for
business and Economics. Mason: South‐Western College.

References
MATTHEW MOORHEAD 320
Anikeeff, M. A., & Sriram, V. ( ). Construction management strategy
and developer performance. Engineering, Construction and Architectural
Management, ( ), ‐ . https://doi.org/ . /
Antle, R., & Eppen, G. D., ( ). Capital rationing and organizational slack
in capital budgeting. Management Science, ( ), ‐ .
Appraisal Institute (US). ( ). The dictionary of real estate appraisal.
Appraisal Institute.
Armitage, L. ( ). The role of property market analysis in the valuation of
investment grade property. (PhD Thesis). Centre for Design and
Construction Studies, Queensland University of Technology, Brisbane,
Queensland, Australia.
Arnold G. C. & Hatzopoulos P. D. ( ). The theory‐practice gap in capital
budgeting: evidence from the United Kingdom. Journal of Business Finance
& Accounting, , ‐ .
Atherton E., & French S. ( ) Issues In Supporting Intertemporal Choice.
In: Karwan M.H., Spronk J., Wallenius J. (eds) Essays In Decision Making.
Springer, Berlin, Heidelberg https://doi.org/ . / ‐ ‐ ‐ ‐ _
Atherton, E., French, N., & Gabrielli, L. ( ). Decision theory and real
estate development: a note on uncertainty. Journal of European Real Estate
Research, ( ), ‐ .
Audit Commission. ( ). Building in quality: a study of development
control. Audit Commission, .

References
MATTHEW MOORHEAD 321
Aye, L., Bamford, N., Charters, B., & Robinson, J. ( ). Environmentally
sustainable development: a life‐cycle costing approach for a commercial
office building in Melbourne, Australia. Construction Management &
Economics, ( ), ‐ . https://doi.org/ . /
Azhar, S. ( ). Building information modeling (BIM): Trends, benefits,
risks, and challenges for the AEC industry. Leadership and management in
engineering, ( ), ‐ .
Baker, H. K., & Filbeck, G. ( ). Alternative Investments: Instruments,
Performance, Benchmarks and Strategies. Vol. . John Wiley & Sons.
Baker, S., Ponniah, D., & Smith, S. ( ). Risk response techniques
employed currently for major projects. Construction Management &
Economics, ( ), ‐ . https://doi.org/ . /
Ball, M. ( ) Markets and the structure of the housebuilding industry: an
international perspective, Urban Studies, ( / ), pp. – .
Baldwin C.Y. & Clark K.B. ( ). Capital‐budgeting systems and
capabilities investments in U.S. companies after the Second World War.
Business History Review , ‐ .
Baldwin, W. L. ( ). Jerome Rothenberg. Economic Evaluation of Urban
Renewal: Conceptual Foundation of Benefit‐Cost Analysis. Pp. xiii, .
Washington, D.C.: Brookings Institution, . (Vol. , pp. ‐ ).
Retreived from
http://journals.sagepub.com/doi/abs/ . /

References
MATTHEW MOORHEAD 322
Barras, R. ( ). Property and the economic cycle: building cycles revisited.
Journal of Property Research, ( ), ‐ .
Baum, A. ( a). Evidence of Cycles in European Commercial Real Estate
Markets—and Some Hypotheses A Global Perspective on Real Estate Cycles
(pp. ‐ ): Springer.
Baum, A. ( b). “Evidence of Cycles in European Commercial Real Estate
Markets – and Some Hypotheses” in Brown, S. and Liu, C. (eds.), A Global
Perspective on Real Estate Cycles. Massachusetts: Kluwer, ‐ .
Baum, A. ( ). Commercial Real Estate Investment. Taylor & Francis.
Baum, A. ( ). Real estate investment: A strategic approach. Routledge.
Baum, A. E., & Crosby, N. ( ). Property Investment Appraisal. ( rd ed.).
Hoboken: Wiley.
Baum, A., & Crosby, N. ( ). Principles of Investment Analysis. Property
Investment Appraisal. Oxford: Blackwell.
Baum, A., & Hartzell, D. ( ). Global property investment: Strategies,
structures, decisions. Chichester: Wiley‐Blackwell.
Baum, A., Nunnington, N., & Mackmin, D. ( ). The income Approach to
Property Valuation. ( th ed.). Hoboken: Taylor and Francis.
Baum, A., Mackmin, D., & Nunnington, N. ( ). The Income Approach to
Property Valuation. ( th ed.). Milton: CRC Press.

References
MATTHEW MOORHEAD 323
Baum, A., Devaney, S., & Frodsham, M. ( ). Yield determination in
European office markets: how does pricing respond to bond yields and
market activity?. ERES eres _ , European Real Estate Society (ERES).
Baxter, P., & Jack, S. ( ). Qualitative case study methodology: Study
design and implementation for novice researchers. The qualitative Report,
( ), ‐ .
Bazerman, M.H., & Moore, D.A. ( ). Judgment in Managerial Decision
Making. ( th ed.). New York: Wiley.
Beatty, P. C., & G. B. Willis ( ). Research synthesis: The practice of
cognitive interviewing. Public Opinion Quarterly ( ): ‐ .
Bell, D. E., Raiffa, H., & Tversky, A. ( ). Decision Making: Descriptive,
Normative, and Prescriptive Interactions. Cambridge University Press.
Beraldi, P., Bruni, M. E., & Violi, A., ( ). Capital rationing problems
under uncertainty and risk. Computational Optimization and Applications,
( ), ‐ . doi:http://dx.doi.org/ . /s ‐ ‐ ‐y
Bernanke, B. S. ( ). Irreversibility, Uncertainty, and Cyclical Investment.
The Quarterly Journal of Economics, ( ), ‐ . doi: . /
Bernstein, P. L. ( a). Against the gods: The remarkable story of risk (pp.
‐ ). New York: Wiley.
Bernstein, P. L. ( b). The new religion of risk management. Harvard
Business Review, ( ), .

References
MATTHEW MOORHEAD 324
Black, F., ( ), Capital market equilibrium with restricted borrowing.
Journal of Business, , ‐ .
Black, F., Scholes, M. ( ). The pricing of options and corporate liabilities.
The Journal of Political Economy, ‐ . Retrieved from
https://www.journals.uchicago.edu/doi/abs/ . /
Black, R. T., Brown, G. M., Diaz, J., Gibler, K. M., & Grissom, T. V. ( ).
Behavioral research in real estate: a search for the boundaries. Journal of
Real Estate Practice and Education, ( ), ‐ .
Bloom, N. ( ). Fluctuations in uncertainty. Journal of Economic
Perspectives, ( ), ‐ .
Bloom, N., Floetotto, M., Jaimovich, N., Saporta‐Eksten, I., & Terry, S. J.
( ). Really uncertain business cycles. Econometrica, ( ), ‐ .
Boussabaine, A. H., & Kirkham, R. J. ( ). Simulation of maintenance
costs in UK local authority sport centres. Construction Management and
Economics, ( ), ‐ .
Brealey, R. A., Myers, S. C., Allen, F., & Mohanty, P. ( ). Principles of
Corporate Finance. Tata McGraw‐Hill Education.
Brealey, R. A., Myers, S. C., Allen, F., & Mohanty, P. ( ). Principles of
Corporate Finance. ( th ed.). McGraw‐Hill Education.
Brealey, R., Myers, S., & Marcus, A. ( ). Fundamentals of Corporate
Finance. ( th ed.). McGraw‐Hill: Irwin.

References
MATTHEW MOORHEAD 325
Breiman, L., Friedman, J., Olshen, R. A., & Stone, C. J. ( ). Classification
and decision trees. Wadsworth, Belmont, .
British Property Deferation, Policy for Land. : Commercial Property
Development, First Report of the Advisory Group on Commercial
Development, (Pilcher Report) HMSO,
Brueggeman, W. B., & Fisher, J. D. ( ). Real Estate Finance and
Investments ( th Ed.). McGraw‐Hill Irwin: New York, NY.
Brueggeman, W. B., & Fisher, J. D. ( ). Real Estate Finance and
Investments ( th Ed.). McGraw‐Hill Irwin: New York, NY.
Brueggeman, W. B., & Fisher, J. D. ( ). Real Estate Finance and
Investments ( th Ed.). McGraw‐Hill Irwin: New York, NY.
Bryman, A. ( ). Quantity and quality in social research. London: Unwin
Hyman
Bryman, A. ( ). Integrating quantitative and qualitative research: how is
it done? Qualitative Research ( ): ‐ .
Bryman, A. ( ). Barriers to integrating quantitative and qualitative
research. Journal of mixed methods research, ( ), ‐ .
Bryman, A., & Bell, E. ( ). Business research methods. Oxford University
Press, USA.
References
MATTHEW MOORHEAD 326
Bryman, A. ( ). Quantitative and qualitative research: further reflections
on their integration. In Mixing methods: Qualitative and quantitative
research (pp. ‐ ). Routledge.
Bryant, A., & Charmaz, K. B. ( ). Grounded theory in historical
perspective: An epistemological account. In A. Bryant & K. Charmaz (Eds.),
Sage handbook of grounded theory. Thousand Oaks, CA: Sage.
doi: . /
Bryant, L. ( ), Property Finance – Current Issues. Udb . Property
Finance, Queensland University of Technology, Brisbane.
Bryant, L. ( ). An assessment of development funding for new housing
post GFC in Queensland, Australia. International Journal of Housing
Markets and Analysis, ( ), ‐ .
Bryant, L., & Eves, C. ( ). The link between infrastructure charges and
housing affordability in Australia: where is the empirical evidence?.
Australian Planner, ( ), ‐ .
Bulan, L., Mayer, C., & Somerville, C. T. ( ). Irreversible investment,
real options, and competition: Evidence from real estate development.
Journal of Urban Economics, ( ), ‐
Bulloch, B., & Sullivan, J. ( ). Information–The Key to the Real Estate
Development Process. Cornell Real Estate Review, ( ), . Retrieved from
https://scholarship.sha.cornell.edu/crer/vol /iss / /
References
MATTHEW MOORHEAD 327
Busenitz, L. W., & Barney, J. B. ( ). Differences between entrepreneurs
and managers in large organizations: Biases and heuristics in strategic
decision‐making. Journal of business venturing, ( ), ‐ .
Byrne, P. ( ). Fuzzy analysis: a vague way of dealing with uncertainty in
real estate analysis? Journal of Property Valuation and Investment, ( ), ‐
. https://doi.org/ . /
Byrne, P. ( ). Risk Uncertainty and Decision Making in Property
Development. (Illustrated ed.). E. & F.N. Spon, London.
Byrne, P. ( ). Risk, Uncertainty and Decision‐making in Property
Development. ( nd ed.). New York: Routledge.
Byrne, P., & Cadman, D. ( ). Risk Uncertainty and Decision Making in
Property Development. E. & F.N. Spon, London.
Byrne, P., Jackson, C., & Lee, S. ( ). Bias or rationality? The case of UK
commercial real estate investment. Journal of European Real Estate
Research, Vol. Issue: , pp. ‐ . https://doi.org/ . /
Byrne, P., McAllister, P., & Wyatt, P. ( ). Precisely wrong or roughly
right? An evaluation of development viability appraisal modelling. Journal
of Financial Management of Property and Construction, Vol. Issue: ,
pp. ‐ , https://doi.org/ . /
Cadman, D., & Topping, R. ( ). Property Development. ( th ed.).
London, E & F Spon.

References
MATTHEW MOORHEAD 328
Camerer, C. ( ). Bounded rationality in individual decision making.
Experimental Economics, ( ), ‐ .
https://doi.org/ . /A:
Campbell, H. F. ( ). Benefit‐Cost Analysis: Financial and Economic
Appraisal Using Spreadsheets. Cambridge University Press.
Campbell, R. ( ). Structure of the residential land development industry.
Urban Futures Journal, ( ), pp. – .
Capozza, D., & Li, Y. ( ). The intensity and timing of investment: The
case of land. The American Economic Review, pp. ‐ . JSTOR, JSTOR,
www.jstor.org/stable/ .
Carmona, M., & Sieh, L. ( ). Measuring quality in planning: managing
the performance process. Routledge.
Charmaz, K. & Belgrave, L. ( ). Grounded Theory. In The Blackwell
Encyclopedia of Sociology, G. Ritzer (Ed.).
doi: . / .wbeosg .pub
Chen, J. ( ). Modigliani and Miller Propositions: The Scope of Their
Applicability. Available at SSRN .
Child, D. ( ). The essentials of factor analysis. ( rd ed.). New York, NY:
Continuum International Publishing Group.
Chittenden, F., & Derregia, M. ( ). Uncertainty, irreversibility and the
use of rules of thumb in capital budgeting. The British Accounting Review,
( ), ‐ .

References
MATTHEW MOORHEAD 329
Ciesielski, M., Chinese Developers in Australia – Market Insight , Frank
Knight, Sydney Australia, Retreived from
https://www.knightfrank.com.au/news/ ‐of‐australian‐development‐site‐
sales‐in‐ ‐to‐chinese‐ .aspx
Civan, I. ( ). Assessment and enhancement of decision‐making models
used for the pre‐development stages of office developments in turkey.
Doctoral dissertation, Texas A&M University. Texas A&M University.
Available electronically from http : / /hdl .handle .net / . / .
Coiacetto, E. ( ). Diversity in real estate developer behaviour: A case for
research. Urban Policy and Research, ( ), ‐ .
Coiacetto, E. ( ). Industry structure in real estate development: is city
building competitive? Urban Policy and Research, ( ), ‐ .
https://doi.org/ . /
Coiacetto, E., & Bryant, L. ( ). How does access to development finance
shape our cities?. Urban Policy and Research, ( ), ‐ .
Coleman, C., Crosby, N., McAllister, P., & Wyatt, P. ( ). Development
appraisal in practice: some evidence from the planning system. Journal of
Property Research, ( ), ‐ . DOI: . / . .
Connellan, O., & James, H. ( ). Estimated realisation price (ERP) by
neural networks: forecasting commercial property values. Journal of
property Valuation and Investment, ( ), ‐ .
Collis, J., & Hussey, R. ( ). Business Research: A Practical Guide For
Undergraduate and Postgraduate Students. Palgrave Macmillan.

References
MATTHEW MOORHEAD 330
Cook, C., Heath, F., & Thompson, R. L. ( ). A meta‐analysis of response
rates in web‐or internet‐based surveys. Educational and psychological
measurement, ( ), ‐ .
Coombs, C. H. ( ). A Theory of Data. Oxford, England: Wiley.
Costello, G. & F. Preller ( ). Property development principles and
process‐an industry analysis. Pacific Rim Property Research Journal ( ):
‐ .
Coyne, I. ( ). Sampling in qualitative research. Purposeful and
theoretical sampling; merging or clear boundaries? Journal of Advanced
Nursing, ( ), pp. ‐ . https://doi.org/ . /j. ‐ . .t ‐
‐ .x
Creswell J.W., & Clark V.L.P. ( ) Designing and Conducting Mixed
Methods Research. Sage, Thousand Oaks. doi: . /j. ‐
. . .x
Creswell, J. ( ). Research design : Qualitative, quantitative, and mixed
methods approaches ( th ed.). Thousand Oaks: Sage Publications.
Creswell, J. W., & Creswell, J. D. ( ). Research Design: Qualitative,
Quantitative, and Mixed Methods Approaches. Sage publications.
Creswell, J. W., Plano Clark, V. L., Gutmann, M. L., & Hanson, W. E. ( ).
Advanced mixed methods research designs. Handbook of Mixed Methods in
Social and Behavioral Research, , .

References
MATTHEW MOORHEAD 331
Crosby, N., McAllister, P., & Wyatt, P. ( ). Fit for planning? An
evaluation of the application of development viability appraisal models in
the UK planning system, Environment and Planning B, , – .
Crosby, N., & Wyatt, P. ( ). Financial viability appraisals for site‐specific
planning decisions in England. Environment and Planning C: Policy and
Space, ( ), – .
Crosby, N., Jackson, C., & Orr, A. ( ). Refining the real estate pricing
model. Journal of Property Research, ( ), – .
Crosby N., Devaney, S., & Wyatt P.( a). The implied internal rate of
return in conventional residual valuations of development sites, Journal of
Property Research, DOI: . / . .
Crosby N., Devaney, S., & Wyatt P.( b). Residual Land Values:
Measuring Performance and Investigating Viability. In Investment Property
Forum (Ed.), IPF Research Programme. London
Crudden, M. ( ). A discussion of the Monte Carlo technique applied to
commercial property: Examining risk in perspective. Public Infrastructure
Bulletin, ( ), . Retrieved from
http://epublications.bond.edu.au/pib/vol /iss /
Cukierman, A. ( ). The effects of uncertainty on investment under risk
neutrality with endogenous information. Journal of Political Economy,
( ), ‐ .
References
MATTHEW MOORHEAD 332
Cunningham, C. R. ( ). House price uncertainty, timing of
development, and vacant land prices: Evidence for real options in Seattle.
Journal of Urban Economics, ( ), ‐ .
Cunningham, C. R. ( ). Growth controls, real options, and land
development. The Review of Economics and Statistics, ( ), ‐ .
Curran, J., & Blackburn, R. ( f). Researching the small enterprise. Sage.
Currie, R. R., & Wesley, F. ( ). Is it feasible? Positioning feasibility
analysis as a valuable tool for assessing a potential tourism development.
Tourism and Hospitality Planning & Development, ( ), ‐ .
Currie, R. R., Seaton, S., & Wesley, F. ( ). Determining stakeholders for
feasibility analysis. Annals of Tourism Research, ( ), ‐ . doi:
https://doi.org/ . /j.annals. . .
Cybinski, P. J. ( ). A discrete‐valued risk function for modelling financial
distress in private Australian companies. Accounting & Finance, , ‐ .
Dayananda, D., Harrison, S., Irons, R., Herbohn, J., & Rowland, P. ( ).
Capital budgeting: financial appraisal of investment projects. Cambridge
University Press.
Demyanyk, Y., & Hasan, I. ( ). Financial crises and bank failures: A
review of prediction methods. Omega, ( ), ‐ .
De Neufville, R., Scholtes, S., & Wang, T. ( ). Real options by
spreadsheet: parking garage case example. Journal of Infrastructure Systems,
( ), ‐ .

References
MATTHEW MOORHEAD 333
Department of Infrastructure, L. G. a. P. ( ). Department of
Infrastructure, Local Government and Planning. (n.d.). Retrieved October
, , from http://www.dilgp.qld.gov.au/edq/economic‐
development.html
Diaz III, J. ( ). The process of selecting comparable sales. The Appraisal
Journal, ( ), ‐ .
Diaz III, J. ( ). Disrobing beautiful people: an introduction to the special
issue of behavioural real estate research. Journal of Property Research, ( ),
‐ .
Diaz III, J., & Hansz, J. A. ( ). How valuers use the value opinions of
others. Journal of Property Valuation and Investment, ( ), ‐ .
Diaz, J. ( ). How appraisers do their work: a test of the appraisal process
and the development of a descriptive model. Journal of Real Estate
Research, ( ), ‐ .
Diaz, J. ( ). An investigation into the impact of previous expert value
estimates on appraisal judgment. Journal of Real Estate Research, ( ), ‐
.
Diaz, J., & Wolverton, M. L. ( ). A longitudinal examination of the
appraisal smoothing hypothesis. Real Estate Economics, ( ), ‐ .
Dietterich, T. G. ( ). Ensemble methods in machine learning. In
International workshop on multiple classifier systems (pp. ‐ ). Springer,
(June). Berlin, Heidelberg.

References
MATTHEW MOORHEAD 334
Dillman, D. A., & Bowker, D. K. ( ). The web questionnaire challenge to
survey methodologists. Online social sciences, ‐ .
Dixit, A. K., & Pindyck, R. S. ( ). Investment Under Uncertainty.
Princeton University Press.
Dong, Z., & Sing, T. F. ( ). Developers’ heterogeneity and real estate
development timing options. Journal of Property Investment & Finance,
( ), ‐ . https://doi.org/ . /JPIF‐ ‐ ‐
Doucet, A., De Freitas, N., & Gordon, N. ( ). An introduction to
sequential Monte Carlo methods. In Sequential Monte Carlo methods in
practice (pp. ‐ ). Springer, New York, NY
Dowling, R. ( ). Residential building in Australia, – . Urban
Policy and Research, ( ), ‐ .
Drane, J. ( ). A View From The Ground: Implications for the literature
on the ‘models of the development process’ based on a model of praxis and
an associated mapping study’. Paper presented at the AESOP th Annual
Congress, METU Ankara and published in conference proceedings.
Retreived from
http://www.prres.net/papers/Drane_The_State_Of_Contemporary_Propert
y_Development_Theory.pdf
Drane, J. ( , January). The state of contemporary property development
theory. In th Annual Pacific‐RIM Real Estate Society Conference,( ‐ ).
Melbourne, Australia (pp. ‐ ).

References
MATTHEW MOORHEAD 335
Earl, W. G. ( ). Alternative housing choices at benchmark affordability
levels by'TEIRM'tenure (Doctoral dissertation, Queensland University of
Technology).
England, J. R. ( ). Retail impact assessment: a guide to best practice.
Psychology Press.
Ernst & Young ( ), Economic Impact of the Development Industry in
Queensland, / . Ernst & Young : Sydney.
Ernst & Young. ( ). Economic Impact of the Development Industry in
NSW. Ernst & Young : Sydney.
Ernst & Young. ( ). Property Development Funding Considerations in
Australian Transaction Advisory Services. Ernst and Young: Sydney.
Fainstein, S. ( ). The City Builders: Property, Politics and Planning in
London and New York. Blackwell, Oxford.
Fainstein, S. ( ). The City Builders: Property, Politics, and Planning in
London and New York. Univ. Press of Kansas.
Farragher, E., & Kleiman, R. ( ). A re‐examination of real estate
investment decision‐making practices. Journal of Real Estate Portfolio
Management, ( ), ‐ .
Fincher, R. ( ). Is high‐rise housing innovative? Developers'
contradictory narratives of high‐rise housing in Melbourne. Urban Studies,
( ), ‐ .

References
MATTHEW MOORHEAD 336
Fink, A. ( ). How to design survey studies. Sage Publications: Thousand
Oaks, CA.
Fisher, I. ( ). The theory of interest. New York, NY: McMillan.
Fisher, J. D. ( ). Integrating research on markets for space and capital.
Real Estate Economics, ( ), ‐ .
Fowler Jr, F. J. ( ). Survey Research Methods, Sage publications.
Francis, J.R.D. ( ) Supervision and examination of higher degree
students, Bulletin of the University of London , : – .
Franklin, B. ( ). The Complete Works of Benjamin Franklin: ‐
(Vol. ): GP Putnam's sons.
Fraser, W. D. ( ). Principles of property investment and pricing, ( nd
Ed.). Macmillan International Higher Education.
French, N. ( ). Decision theory and real estate investment: an analysis of
the decision‐making processes of real estate investment fund managers.
Managerial and Decision Economics, ( ), ‐ .
French, N., & Gabrielli, L. ( ). The uncertainty of valuation. Journal of
Property Investment & Finance, ( ), ‐ .
French, N., & Gabrielli, L. ( ). Uncertainty and feasibility studies: an
Italian case study. Journal of Property Investment & Finance, ( ), ‐ .

References
MATTHEW MOORHEAD 337
French, S. ( ). Decision Theory: An Introduction to the Mathematics of
Rationality. Halsted Press.
Friedman, M. ( ). Nobel lecture: inflation and unemployment. Journal of
Political Economy, ( ), ‐ .
Fuerst, F., & Matysiak, G. ( ). Analysing the performance of nonlisted
real estate funds: a panel data analysis. Applied Economics, ( ), ‐
.
Gallimore, P. ( ). Aspects of information processing in valuation
judgement and choice. Journal of Property Research, ( ), ‐ .
Gallimore, P. ( ). Confirmation bias in the valuation process: a test for
corroborating evidence. Journal of Property Research, ( ), ‐ .
Gallimore, P., & Wolverton, M. ( ). Price‐knowledge‐induced bias: a
cross‐cultural comparison. Journal of Property Valuation and Investment,
( ), ‐ .
Gau, G. W., & Kohlhepp, D. B. ( ). The financial planning and
management of real estate developments. Financial Management (Pre‐
), ( ), . Retrieved from
https://search.proquest.com/docview/ ?accountid=
Gehner, E., Halman, J. I. M., & De Jonge, H. ( , April). Risk
management in the Dutch real estate development sector: a survey. In th
International Postgraduate Research Conference (pp. ‐ ).

References
MATTHEW MOORHEAD 338
Geltner, D., Miller, N. G., Clayton, J., & Eichholtz, P. ( ). Commercial
Real Estate Analysis and Investments (Third ed. Vol. ). South‐Western:
Cincinnati, OH.
Geltner, D., Riddiough, T., & Stojanovic, S. ( ). Insights on the effect of
land use choice: The perpetual option on the best of two underlying assets.
Journal of Urban Economics, ( ), ‐ .
Gepp, A., & Kumar, K. ( ). Business Failure Prediction Using Statistical
Techniques: A Review. In K. Kumar, & A. Chaturvedi, Some Recent
Developments in Statistical Theory and Applications (pp. ‐ ). Boca Raton:
Brown Walker Press.
Gepp, A., Kumar, K., & Bhattacharya, S. ( ). Business failure prediction
using decision trees. Journal of Forecasting, ( ), ‐ .
Gepp, A., Wilson, J. H., Kumar, K., & Bhattacharya, S. ( ). A comparative
analysis of decision trees vis‐à‐vis other computational data mining
techniques in automotive insurance fraud detection. Journal of Data
Science, ( ), ‐ .
Gepp, A. ( ). Financial Statement Fraud Detection Using Supervised
Learning Methods. (PhD Thesis, Gold Coast: Bond University).
Gillen, M., & Fisher, P. ( ). Residential developer behaviour in land
price determination. Journal of Property Research, ( ), ‐ .
Gleibner, W., & Wiegelmann, T., ( ) Quantitative methods for risk
management in the real estate development industry. Journal of Property

References
MATTHEW MOORHEAD 339
Investment & Finance, Vol. Iss: . Doi
http://dx.doi.org/ . /jpif. . faa.
Graaskamp, J. ( ). A Guide to Feasibility Analysis. In S.P. Jarchow (Ed.),
Graaskamp on Real Estate, Washington, D.C.: Urban Land Institute, ‐
.
Graaskamp, J. A. ( ). A guide to feasibility analysis. Chicago Society of
Real Estate Appraisers cited in Wurtzebach, CH, Miles, ME & Cannon, SE,
Modern Real Estate.
Graaskamp, J. A. ( ). A rational approach to feasibility analysis. The
Appraisal Journal, ( ), ‐ .
Graaskamp, J. A. ( ). Fundamentals of Real Estate. Development. Risk
Management, , .
Graaskamp, J. A. ( ). Fundamentals of real estate development. Journal
of Property Valuation and Investment, ( ), ‐ .
Greene, J. C. ( ). Mixed Methods In Social Inquiry. John Wiley & Sons.
Greene, J. C., Caracelli, V. J., & Graham, W. F. ( ). Toward a conceptual
framework for mixed‐method evaluation designs. Educational Evaluation
and Policy Analysis, ( ), ‐ .
Greenley, D. A., Walsh, R. G., & Young, R. A. ( ). Option Value:
Empirical Evidence from a Case Study of Recreation and Water Quality*.
The Quarterly Journal of Economics, ( ), ‐ . doi: . /

References
MATTHEW MOORHEAD 340
Grenadier, S. R. ( ). The strategic exercise of options: Development
cascades and overbuilding in real estate markets. The Journal of Finance,
( ), ‐ .
Guy, C. ( ). Planning for retail development: A critical view of the
British experience. Routledge.
Guy, S., & Hanneberry, J. (Eds.). ( ). Development and Developers:
Perspectives On Property. John Wiley & Sons.
Guy, S., & Henneberry, J. ( ). Development and Developers: Perspectives
On Property. Wiley Online Library.
Gyourko, J., & Molloy, R. ( ). Regulation and housing supply. In
Handbook of regional and urban economics (Vol. , pp. ‐ ). Elsevier.
Häkkinen, T., & Belloni, K. ( ). Barriers and drivers for sustainable
building. Building Research & Information, ( ), ‐ .
Halteh, K., Kumar, K., & Gepp, A. ( ). Using Cutting‐Edge Tree‐Based
Stochastic Models to Predict Credit Risk. Risks, ( ), [ ]. DOI:
. /risks
Hargitay, S. E., & Yu, S. ( ). Property Investment Decisions: Quantitative
Approach. London: Spon.
Hargitay, S., & Yu, S.‐M. ( ). Property Investment Decisions: A
Quantitative Approach. Routledge.
References
MATTHEW MOORHEAD 341
Havard, & Platts. ( ). Contemporary Property Development. RIBA
Publications.
Havard, T. M. ( ). Appraisals: An Overview. In Argus Developer in
Practice. pp. ‐ . Berkley, CA: Apress. Doi https://doi.org/ . / ‐ ‐
‐ ‐ _
Havard. ( ). Financial Feasibility Studies for Property Development:
Theory and Practice. Routledge.
Healey, P. ( ). Models of the development process: a review. Journal of
Property Research, ( ), ‐ .
Hedgcock, B., & Lynn, D. ( ). Residential Land Investment Active Private
Equity Real Estate Strategy (pp. ‐ ). John Wiley & Sons, Inc.
Hengels, A. ( ). Creating a practical model using real options to evaluate
large‐scale real estate development projects. Masters Thesis. Massachusetts
Institute of Technology, Cambridge, MA. Retrieved from
https://dspace.mit.edu/handle/ . / #files‐area
Herring, R. & Wachter, S., Real Estate Booms and Banking Busts: An
International Perspective (July ). The Wharton School Research Paper
No. ‐ . Available at SSRN: https://ssrn.com/abstract=
Hilber, C. A., & Vermeulen, W. ( ). The impact of supply constraints on
house prices in England. The Economic Journal, ( ), ‐ .

References
MATTHEW MOORHEAD 342
Hilbers, M. P. L. C., Zacho, M. L., & Lei, M. Q. ( ). Real Estate Market
Developments and Financal Sector Soundness (No. ‐ ). International
Monetary Fund.
HMSO. ( ). Commercial Property Development First Report of the
Government's Advisory Group on Commercial Development
Holland, A. S., Ott, S. H., & Riddiough, T. J. ( ). The role of uncertainty
in investment: An examination of competing investment models using
commercial real estate data. Real Estate Economics, ( ), ‐ .
Hosmer Jr, D. W., Lemeshow, S., & Sturdivant, R. X. ( ). Applied logistic
regression (Vol. ). John Wiley & Sons.
Huchzermeier, A., & Loch, C. H. ( ). Project management under risk:
Using the real options approach to evaluate flexibility in R. D.. Management
Science, ( ), ‐ .
Hughes, W., Risk Analysis and Asset Valuation: A Monte Carlo Simulation
Using Stochastic Rents. Journal of Real Estate Finance and Economics, Vol.
, .
Huston, S. ( ). Capitalisation: reflections and practice for project
appraisal. International Journal Series in Multidisciplinary Research
(IJSMR). (ISSN: ‐ ), ( ), ‐ .
Hutchison, N., Lizieri, C., MacGregor, B., Mansley, N., Portlock, R., Schulz,
R., & Zhao, Y. ( ). An investigation of hurdle rates in the real estate
investment process. London: Investment Property Forum.
References
MATTHEW MOORHEAD 343
Ibbotson, R. G., & Siegel, L. B. ( ). Real estate returns: a comparison
with other investments. Real Estate Economics, ( ), ‐ .
IPD ( ). IPD development performance. London: Author.
Isaac, D., & O'Leary, J. ( ). Property Valuation Principles. Palgrave
Macmillan.
Isaac, D., & O'Leary, J. ( ). Property Valuation Techniques. Palgrave
Macmillan.
Isaac, D., O'Leary, J., & Daley, M. ( ). Property Development: Appraisal
and Finance ( nd ed.). Palgrave Macmillan.
Isaac, D., O'Leary, J., & Daley, M. ( ). Property Development: Appraisal
and Finance ( rd ed.). Palgrave Macmillan.
Jefferies, R. L. ( ). A brief history and development of' real value
valuation models‐the last four decades. In Proceedings of the th annual
conference of the Pacific Rim Real Estate Society, Sydney, Australia (pp. ‐
).
Jefferies, R. L. ( ). History and development of real estate investment
(property) valuation models. Obtained from
https://www.researchgate.net/publication/ _History_and_develo
pment_of_real_estate_investment_property_valuation_models
Jenny, F., ( ). Economic Analysis, Anti‐Trust Law and the Oligopoly
Problem. European Business Organization Law Review (EBOR), ( ), ‐ .

References
MATTHEW MOORHEAD 344
Johnson, R. B., Onwuegbuzie, A. J., & Turner, L. A. ( ). Toward a
definition of mixed methods research. Journal of Mixed Methods Research,
( ), ‐ .
Jones, A., Bell, M., Tilse, C., & Earl, G. ( ). Using research to shape
policy on affordable rental housing for lower income older Australians. In
housing futures in an ageing Australia conference. Melbourne, Australia.
Jud, D. G., & Winkler, D. ( ). The capitalization rate of commercial
properties and market returns. Journal of Real Estate Research, , – .
Kahneman, D., Wakker, P. P., & Sarin, R. ( ). Back to Bentham?
Explorations of experienced utility. The Quarterly Journal of Economics,
‐ .
Kahr, J., & Thomsett, M. C. ( ). Real estate market valuation and
analysis. (Vol. ). John Wiley & Sons.
Kaminsky, G. L., & Reinhart, C. M. ( ). The twin crises: the causes of
banking and balance‐of‐payments problems. American Economic Review,
( ), ‐ .
Kang, J. ( ). Valuing flexibilities in large‐scale real estate development
projects. Masters Thesis. Massachusetts Institute of Technology,
Cambridge, MA. Retrieved from
https://dspace.mit.edu/handle/ . /
Keeney, R. L. ( ). Value‐focused thinking: A path to creative decision‐
making. Harvard University Press.

References
MATTHEW MOORHEAD 345
Kelliher, C. F., & Mahoney, L. S. ( ). Using Monte Carlo simulation to
improve long‐term investment decisions. Appraisal Journal, ( ), ‐ .
Kelly, A. ( ). Land Development and Subdivision in Australia Industry
Sectors (Report No. E ). Sydney: IBIS World Report.
Khumpaisal, S., Ross, A., & Abdulai, R. ( ). An examination of Thai
practitioners’ perceptions of risk assessment techniques in real estate
development projects. Journal of Retail & Leisure Property, ( ), ‐ .
Key, T. ( ). Understanding the property cycle: economic cycles and
property cycles, London: Royal Institution of Chartered Surveyors London.
Kierulff, H. ( ). MIRR: A Better Measure. Business Horizons, ( ), –
.
King, N. and C. Horrocks ( ). Interviews In Qualitative Research, Sage.
Knight, F. H. ( ). Risk, Uncertainty and Profit. Mineola.
Koerber, A., & McMichael, L. ( ). Qualitative sampling methods: A
primer for technical communicators. Journal of Business and Technical
Communication, ( ), ‐ .
Kohlhepp, D. B. ( , April st). The Real Estate Development Matrix.
Paper presented at The American Real Estate Society Meetings St.
Petersberg, Florida. ARES.
Kohlhepp, D. B., & Kohlhepp, K. J. ( ). Real Estate Development Matrix:
A Handbook. Routledge.

References
MATTHEW MOORHEAD 346
Kolbe, P. T., Greer, G. E., & Waller, B. D. ( ). Investment Analysis for
Real Estate Decisions ( th ed.). La Crosse, WI: Dearborn.
Kothari, C. R. ( ). Research Methodology Methods and Techniques
Second Edition.
Kumar N., ( ). Research Methodology. In: Chronic Regulatory Focus and
Financial Decision‐Making. Springer Briefs in Finance. Springer, Singapore
Kumar, S., & P. Phrommathed ( ). Research Methodology. In New
Product Development. Springer, Boston, MA
Kutsch, E., & Hall, M. ( ). Deliberate ignorance in project risk
management. International Journal of Project Management, ( ), ‐ .
Lander, D. M., & Pinches, G. E. ( ). Challenges to the practical
implementation of modeling and valuing real options. The Quarterly Review
of Economics and Finance, ( , Part ), pp. ‐ . doi:
https://doi.org/ . /S ‐ ( ) ‐
Langlois, R. N., & Cosgel, M. M. ( ). Frank Knight On Risk, Uncertainty,
and the Firm: A New Interpretation. Economic Inquiry, ( ), pp. ‐ .
doi: . /j. ‐ . .tb .x
Lapedes, A., & Farber, R. ( ). Nonlinear signal processing using neural
networks: Prediction and system modelling (No. LA‐UR‐ ‐ ; CONF‐
‐ ).
Larsen, J. K., Shen, G. Q., Lindhard, S. M., & Brunoe, T. D. ( ). Factors
affecting schedule delay, cost overrun, and quality level in public

References
MATTHEW MOORHEAD 347
construction projects. Journal of Management in Engineering, ( ),
.
Leahy, J. V. ( ). Investment in Competitive Equilibrium: The Optimality
of Myopic Behavior. The Quarterly Journal of Economics, ( ), pp. ‐
. doi: . /
Leinberger, C. B. ( ). Back to the future: the need for patient equity in
real estate development finance. Washington, DC: Brookings Institution.
Lewis, S. ( ). Qualitative inquiry and research design: Choosing among
five approaches. Health Promotion Practice, ( ), ‐ .
https://doi.org/ . /
Lieser, K., & Groh, A. P. ( ). The determinants of international
commercial real estate investment. The Journal of Real Estate Finance and
Economics, ( ), ‐ .
Lippmann, R. ( ). An introduction to computing with neural nets. IEEE
ASSP Magazine, ( ), ‐ .
Ling, D. C., & Archer, W. R. ( ). Real estate principles: a value approach.
New York: McGraw‐Hill Education.
Lintner, J., ( ). The Valuation of Risk Assets and the Selection of Risky
Investments in Stock Portfolios and Capital Budgets. Review of Economics
and Statistics. : , pp. – .

References
MATTHEW MOORHEAD 348
Liu, D., Li, T., & Liang, D. ( ). Incorporating logistic regression to
decision‐theoretic rough sets for classifications. International Journal of
Approximate Reasoning, ( ), ‐ .
Loizou, P. and N. French ( ). Risk and uncertainty in development: A
critical evaluation of using the Monte Carlo simulation method as a
decision tool in real estate development projects. Journal of Property
Investment & Finance, ( ), pp. ‐ .
Long, C. ( ). Finance for real estate development. Retrieved from
https://apac‐tc.hosted.exlibrisgroup.com/primo‐
explore/fulldisplay?docid=BOND_ALMA &context=L&vi
d=BOND&search_scope=all_resources&tab=default_tab&lang=en_US
Lowies, G. A., Hall, J. H., & Cloete, C. E. ( ). Heuristic‐driven bias in
property investment decision‐making in South Africa. Journal of Property
Investment & Finance, ( ), ‐ .
Lyons, T., & Skitmore, M. ( ). Project risk management in the
Queensland engineering construction industry: a survey. International
journal of project management, ( ), ‐ .
Makridakis, S. ( ). If we cannot forecast how can we plan? Long Range
Planning, ( ), ‐ .
Makridakis, S., & Hibon, M. ( ). The M ‐Competition: results,
conclusions and implications. International Journal of Forecasting, ( ),
‐ .

References
MATTHEW MOORHEAD 349
Makridakis, S., & Taleb, N. ( ). Living in a world of low levels of
predictability. International Journal of Forecasting, ( ), ‐ .
Malkiel, B. ( ). A Random Walk Down Wall Street: The Best Investment
Advice for the New Century Completely Revised and Updated. New York:
WW Norton & Company.
Mandelbrot, B., & Taleb, N. N. ( ). How the finance gurus get risk all
wrong. Fortune Magazine, July, .
Mandelbrot, B., & Taleb, N. ( ). A focus on the exceptions that prove
the rule. Financial Times, March.
May, T. ( ). Qualitative Research in Action. Sage Publications Inc.
Mayer, L. B., & Sommerville, C. T. ( ). Irreversible Investment, Real
Options, and Competition: Evidence from Real Estate Development.
Working Paper ‐ . Centre for Urban Economics and Real Estate,
University of British Columbia.
Mbachu, J. I., & Cross, C. ( ). Key drivers of discrepancies between initial
and final costs of construction projects in New Zealand. Project
Management Institute PM World J. IV, ‐ .
McAllister, P. ( ). The calculative turn in land value capture: Lessons
from the English planning system. Land Use Policy, , – .
McCulloch, W. S., & Pitts, W. ( ). A logical calculus of the ideas
immanent in nervous activity. The bulletin of mathematical biophysics,
( ), ‐ .

References
MATTHEW MOORHEAD 350
McCluskey, W. J., & Franzsen, R. C. ( ). Land value taxation: An applied
analysis. Routledge.
McMahan, J. ( ). Professional Property Development ( st ed.). New York:
McGraw‐Hill.
Merton, R. C. ( ). Option pricing when underlying stock returns are
discontinuous. Journal of Financial Economics, ( ), pp. ‐ .
Merton, R.C., ( ). On estimating the expected return on the market: An
exploratory investigation. Journal of Financial Economics, , ‐ .
Messner, S. ( ). The Application of a Benefit – Cost Framework of
Analysis to Selected Redevelopment Projects in Indianapolis, Indiana: A
Case Study of Locally Financed Redevelopment. (Doctoral Dissertation).
ProQuest Dissertations Publishing.
Messner, S. D. ( ). Urban Redevelopment In Indianapolis: A Benefit‐
Cost Analysis. Journal of Regional Science, ( ), ‐ . doi: . /j. ‐
. .tb .x
Messner, S. D. ( ). Analyzing Real Estate Opportunities: Market and
Feasibility Studies. Realtors National Marketing Institute of the National
Association of Realtors.
Miles, M. E., Berens, G., & Weiss, M. A. ( ). Real Estate Development:
Principles and Process ( rd ed.). Washington, D.C.: Urban Land Institute
Miles, M., Berens, G., & Weiss, M. ( ). Real Estate Development:
Principles and Process. Washington, DC: Urban Land Institute.

References
MATTHEW MOORHEAD 351
Miles, M., Berens, G., & Weiss, M. ( ). Real Estate Development:
Principles and Process ( th ed.). Washington, D.C.: Urban Land Institute.
Miles, M., Netherton, L., & Schmitz, A. ( ). Real Estate Development
Principles and Process ( th ed.). Chicago: Urban Land Institute.
Miles, M., Pringle, J., & Webb, B. ( ). Modeling the corporate real estate
decision. Journal of Real Estate Research, ( ), pp. ‐ .
Miller, N. G., & Geltner, D. ( ). Real Estate Principles for the New
Economy. Thomson/South‐Western.
Mintah, K., Higgins, D., Callanan, J., & Wakefield, R. ( ). Staging option
application to residential development: real options approach. International
Journal of Housing Markets and Analysis, ( ), ‐ .
Mishan, E. J., & Quah, E. ( ). Cost‐Benefit Analysis. Routledge.
Modigliani, F., & Miller, M. H. ( ). The cost of capital, corporation
finance and the theory of investment. American Economic Review, , –
.
Moorhead, M. & Armitage, L. ( ), Real property development process,
history and evolution, Proceedings of the th Annual Pacific Rim Real
Estate Society Conference, Melbourne, Victoria, Australia th – th January
Morgan, D. L. ( ). Paradigms lost and pragmatism regained:
Methodological implications of combining qualitative and quantitative
methods. Journal of Mixed Methods Research, ( ), pp. ‐ .

References
MATTHEW MOORHEAD 352
Morgan, F. ( ). Residential property developers in urban agent‐based
models: Competition, behaviour and the resulting spatial landscape. PhD
Dissertation. University of Auckland.
Morley, S. ( ). The financial appraisal of development projects.
Development and Developers: Perspectives on Property, pp. ‐ .
Mun, J. ( ). Modeling risk: Applying Monte Carlo simulation, real
options analysis, forecasting, and optimization techniques (Vol. ). John
Wiley & Sons.
French, N., & French, S. ( ). Decision theory and real estate investment.
Journal of Property Valuation and Investment, ( ), ‐ .
Nachem, I. ( ). The Complete Guide to Financing Real Estate
Developments. McGraw Hill Professional.
Neuman, W. L. ( ). Social Research Methods: Qualitative and
Quantitative approaches. Pearson Education.
Newell, G., & Steglick, M. ( ). Assessing the importance of property
development risk factors. Pacific Rim Property Research Journal, ( ), pp.
‐ .
Newell, M. ( ). Development Appraisals. Journal of Valuation, ( ), pp.
‐ .
Norman, G. ( ). Likert scales, levels of measurement and the “laws” of
statistics. Advances in health sciences education, ( ), ‐ .
References
MATTHEW MOORHEAD 353
NZPC, . Economic Significance of the Property Industry to the New
Zealand Economy. Urban Economics for New Zealand Property Council.
Retrieved from: https://www.propertynz.co.nz/sites/default/files/uploaded‐
content/newsletter‐content/economic_significance_web.pdf
Pagourtzi, E., Assimakopoulos, V., Hatzichristos, T., & French, N. ( ).
Real estate appraisal: a review of valuation methods. Journal of Property
Investment & Finance, ( ), ‐ .
Pallant, J. ( ). SPSS Survival manual: a step by step guide to data analysis
using SPSS. Crows Nest. New South Wales: Allen & Unwin.
Pallant, J. ( ). SPSS survival manual : A step by step guide to data
analysis using IBM SPSS ( th ed.). Maidenhead, Berkshire, England:
McGraw‐Hill Education.
Parker, D. ( ). An Assessment Of Generic Software Packages Used By
Property Fund Managers in Australia. Cooperative Research Centre For
Construction Innovation, June.
Patton, M. ( ). Qualitative Research. John Wiley & Sons, Ltd.
https://doi.org/ . / .bsa
Paul, G., Hansz, J. A., & Adelaide, G. ( ). Decision making in small
property companies. Journal of Property Investment & Finance, ( ), pp.
‐ . doi: . /
PCA ( ). Economic Significance of the Property Industry to the Australian
Economy. Property Council of Australia. The AEC Group, Sydney. Retrieved
from:

References
MATTHEW MOORHEAD 354
https://cdn .hubspot.net/hubfs/ /_Industry% Campaign/REPOR
TS/ECONOMIC% SIGNIFICANCE% OF% THE% PROPERTY% I
NDUSTRY% TO% THE% AUSTRALIAN% ECONOMY% ‐% FU
LL% REPORT.pdf?t=
Peca ( ). Real Estate Development and Investment: A Comprehensive
Approach. Hoboken, N.J.: Wiley.
Peiser, R. B., & Frej, A. B. ( ). Professional Real Estate Development: the
ULI guide to the business. Urban Land Institute.
Peiser, R.B., & Hamilton, D. ( ). Professional Real Estate Development:
The ULI guide to the business ( rd ed.). Washington DC: Urban Land
Institute.
Peng, H., & Newell, G. ( ). The significance of infrastructure in
investment portfolios. In proceedings of the Pacific Rim Real Estate Society
Conference, Fremantle, Australia, ‐ January , pp. ‐ .
Phillips, E., & Pugh, D. ( ). How to get a PhD: A handbook for students
and their supervisors. McGraw‐Hill Education (UK).
Planning Act ( ). QLD
Platteau, J. P. ( ). Institutions, social norms and economic development.
Routledge.
Pollatsek, A., & Tversky, A. ( ). A theory of risk. Journal of Mathematical
Psychology, ( ), pp. ‐ .

References
MATTHEW MOORHEAD 355
Preller, F. T. ( ). A critical assessment of pre‐construction property
development principles and process in Queensland, Australia. (Masters
Thesis, Curtin University). Retreived from
https://espace.curtin.edu.au/handle/ . . /
Prest, A. R., & Turvey, R. ( ). Cost‐benefit analysis: a survey. The
Economic Journal, ( ), pp. ‐ .
Price, J. H, & Murnan, J. ( ) Research Limitations and the Necessity of
Reporting Them, American Journal of Health Education, : , ‐ , DOI:
. / . .
Pyhrr, S. A., & Cooper, J. R. ( ). Real Estate Investment: Strategy,
Analysis, Decisions. Warren, Gorham & Lamont.
Quigg, L. ( ). Empirical testing of real option‐pricing models. The
Journal of Finance, ( ), pp. ‐ .
Ratcliffe, J., Stubbs, M., & Keeping, M. ( ). Urban planning and Real
Estate Development ( rd ed.). London; New York: Routledge.
Ratcliffe, J., Stubbs, M., & Shepherd, M. ( ). Urban planning and Real
Estate Development (Vol. ). Taylor & Francis.
Raz, T., & Michael, E. ( ). Use and benefits of tools for project risk
management. International Journal of Project Management, ( ), pp. ‐ .
Reed, R. G. & Wilkinson, S. J., ( ). The structural and behavioural
barriers to sustainable real estate development, in ARES : Proceedings
References
MATTHEW MOORHEAD 356
of the rd American Real Estate Society conference, ARES, [San Francisco,
Calif.], pp. ‐ .
Reed, R. ( ). The Valuation of Real Estate (The Australian Edition of the
Appraisal of Real Estate) ( th ed.). Canberra: Australian Property Institute.
Reed, R. ( ). The Valuation of Real Estate. Australian Property Institute.
Reed, R., & Sims, S. ( ). Property Development ( th ed.). Routledge.
Regan, M. ( ). Working Paper WP Glossary of Terms. Bond
University. Mirvac School of Sustainable Development.
Regan, M. ( ). Working Paper WP Understanding Risk and
Uncertainty A Brief History. Bond University. Faculty of Society and Design.
Regan, M., Smith, J., & Love, P. E. ( ). Impact of the capital market
collapse on public‐private partnership infrastructure projects. Journal of
Construction Engineering and Management, ( ), ‐ .
Ricardo, D. ( ). The Principles of Taxation and Political Economy. JM
Dent, London.
Ricardo, D. ( ). Principles of Political Economy and Taxation. Eds. G. Bell.
JM Dent, London.
RICS. ( ). The Valuation of Development Land. The Valuation
Information Paper . London: RICS.
Rietveld, T. & Van Hout, R. ( ). Statistical Techniques for the Study of
Language and Language Behaviour. Berlin – New York: Mouton de Gruyter.

References
MATTHEW MOORHEAD 357
Roberts, C. M. ( ). The Dissertation Journey: A Practical and
Comprehensive Guide to Planning, Writing, and Defending Your
Dissertation. Corwin Press.
Roberts, C., & Henneberry, J. ( ). Exploring office investment decision‐
making in different European contexts. Journal of Property Investment &
Finance, ( ), pp. ‐ .
Robinson, J. ( ). Property Valuation and Investment Analysis: A Cash
Flow Approach. Law Book Company.
Robinson, V. and Robinson, L. ( ). Dimensions of residential developer
decision‐making in a rapidly urbanizing region, Socio‐economic Planning
Sciences, , : ‐
Ross, S. A., Bianchi, R., Christensen, M., Drew, M., Westerfield, R., & Jordan,
B. D. ( ). Fundamentals of Corporate Finance ( th ed.). North Ryde,
N.S.W.: McGraw‐Hill Education Australia.
Ross, S., Westerfield, R., & Jordan, B. ( ). Fundamentals of Corporate
Finance. Tata McGraw‐Hill Education.
Roth, P. L., & BeVier, C. A. ( ). Response rates in HRM/OB survey
research: Norms and correlates, ‐ . Journal of Management, ( ),
‐ .
Rowland, P. ( ). Australian Property Investment and Financing. The
Lawbook Company.

References
MATTHEW MOORHEAD 358
Rowley, S., Costello, G., Higgins, D., & Phibbs, P. ( ). The financing of
residential development in Australia. Australian Housing and Urban
Research Institute Final Report, Series, , pp. ‐ .
Ruming, K. J. ( ). Developer typologies in urban renewal in Sydney:
recognising the role of informal associations between developers and local
government. Urban Policy and Research, ( ), pp. ‐ .
Sah, V., Gallimore, P., & Clements, S. ( ). Experience and real estate
investment decision‐making: a process‐tracing investigation. Journal of
Property Research, ( ): pp. ‐ . doi: . / . .
Savvides, S. ( ). Risk Analysis in Investment Appraisal, Project Appraisal,
Vol. No. , .
Saunders, M., Lewis, P., & Thornhill, A. ( ). Research methods for
business students. Pearson education.
Sharam, A., Bryant, L. E., & Alves, T. ( ). Identifying the financial
barriers to deliberative, affordable apartment development in Australia.
International Journal of Housing Markets and Analysis, ( ), ‐ .
Sharkawy, M. ( ). PHYS‐FI: A Physical‐financial Model for Design
Economy Trade‐offs. Appraisal, Market Analysis, and Public Policy in Real
Estate: Essays in Honor of James Graaskamp. Boston: Kluwer Academic
Publishers, ‐ .
Sharpe, W. ( ) Capital Asset Prices: A Theory of Market Equilibrium
Under Conditions of Risk. The Journal of Finance, ( ), pp. – .
https://doi.org/ . /j. ‐ . .tb .x

References
MATTHEW MOORHEAD 359
Sharpe, W.F. ( ) Capital asset prices: A theory of market equilibrium
under conditions of risk. Journal of Finance, , ‐ .
Silverman, D. ( ). Doing qualitative research: A practical handbook.
SAGE Publications Limited.
Simon, H. A. ( ). A behavioral model of rational choice. The Quarterly
Journal of Economics, ( ), ‐ .
Sing, T.‐F., & Patel, K. ( ). Evidence of irreversibility in the UK property
market. The Quarterly Review of Economics and Finance, ( ), ‐ .
Slife, B. D., & , Williams R. N. ( ). What's Behind the Research?:
Discovering Hidden Assumptions in the Behavioral Sciences, Sage
Publications Inc.
Smith, A. D. ( ). Making the case for the competitive advantage of
corporate social responsibility. Business Strategy Series, ( ), ‐ .
Squires, G., & Heurkens, E. ( ). Methods and models for international
comparative approaches to real estate development. Land Use Policy, ,
‐ . doi: http://dx.doi.org/ . /j.landusepol. . .
Squires, G., Hutchison, N., Adair, A., Berry, J., McGreal, S., & Organ, S.
( ). Innovative real estate development finance–evidence from Europe.
Journal of Financial Management of Property and Construction, ( ), ‐
.
Staiger, R. ( ). Foundations of real estate financial modelling. Routledge.

References
MATTHEW MOORHEAD 360
Stainback, S., & Stainback, W. ( ). Understanding & Conducting
Qualitative Research, ERIC.
Statistics New Zealand ( ). Value of building work put in place:
September quarter. Viewed December . Retreived from
https://www.stats.govt.nz/information‐releases/value‐of‐building‐work‐
put‐in‐place‐september‐ ‐quarter
Stockland starts construction of Aura. ( ). Retreived from
https://www.stockland.com.au/media‐centre/media‐releases/stockland‐
starts‐construction‐of‐aura
Tabachnick, B., & Fidell, L. ( ). Using Multivariate Statistics ( th ed.,
Always learning). Harlow, Essex: Pearson Education.
Taleb, N. ( ). Fooled by randomness: The hidden role of chance in life
and in the markets: Random House LLC.
Tan, C., Entrekin, L., & Butler, D. ( ). Decision‐making Behaviour of
Real Estate Investors: A Delphi Study in Australia and Malaysia.
Proceedings of the nd UUM International Qualitative Research
Conference. Penang, Malaysia, ‐ May . Obtained online from
http://qualitative‐research‐conference.com/download/proceedings‐
/ ‐% consilz% ‐ .pdf
Tanrivermis, H., Aliefendioglu, Y., Ozturk, A., & Kapusuz, Y. E. ( ).
Determining Risk Management Dynamics: An Analysis of Risk Perceptions
of Real Estate Development Firms in Turkey (No. eres _ ). European
Real Estate Society (ERES).

References
MATTHEW MOORHEAD 361
Thekdi, S. A., & Lambert, J. H. ( ). Decision analysis and risk models for
land development affecting infrastructure systems. Risk Analysis: an
international journal, ( ), ‐ .
Tunaru, R. ( ). The fundamental economic term of commercial real‐
estate in UK, in Balling, Morten et al. ( ). Property Prices and Real
Estate Financing in a Turbulent World, SUERF Studies, No. / , ISBN
‐ ‐ ‐ ‐
Tashakkori, A., & Creswell, J. W. ( ). Editorial: The new era of mixed
methods. Journal of mixed methods research ( ): ‐ .
Tashakkori, A., & Teddlie, C. ( ). Sage Handbook of Mixed Methods in
Social & Behavioral Research. Sage Publications Inc.
Teddlie, C., & Tashakkori, A. ( ). Foundations of Mixed Methods
Research: Integrating Quantitative and Qualitative Approaches in the Social
and Behavioral Sciences. Sage Publications Inc.
Teneng, D. ( ). Limitations of the Black‐Scholes model. International
Research Journal of Finance and Economics, , ‐ .
Titman, S. ( ). Urban land prices under uncertainty. The American
Economic Review, ( ), ‐ .
Tversky, A., & Kahneman, D. ( ). Judgment under uncertainty:
Heuristics and biases. Science, ( ), ‐ .

References
MATTHEW MOORHEAD 362
Tversky, A., & Kahneman, D. ( ). Extensional versus intuitive reasoning:
The conjunction fallacy in probability judgment. Psychological Review,
( ), ‐ . doi: . / ‐ x. . .
Tziralis, G., Kirytopoulos, K., Rentizelas, A., & Tatsiopoulos, I. ( ).
Holistic investment assessment: optimization, risk appraisal and decision
making. Managerial and Decision Economics, ( ), ‐ .
Uher, T. E., & Toakley, A. R. ( ). Risk management in the conceptual
phase of a project. International Journal of Project Management, ( ), ‐
.
UN DESA Department of Economic and Social Affairs. (n.d.). Retrieved
from https://www.un.org/development/desa/en/news/population/ ‐
revision‐of‐world‐urbanization‐prospects.html
Von Neumann, J., & Morgenstern, O. ( ). Theory of Games and
Economic Behavior ( th Anniversary Commemorative Edition). Princeton
University Press.
Ward, S. V. ( ). Planning the Twentieth‐Century City: The Advanced
Capitalist World. Academy Press.
Whitehead, J. ( ). Decision making in the property development
industry during a business cycle, PhD Dissertation. The University of British
Columbia.
Wiegelmann, T. W. ( ). Risk Management in the Real Estate
Development Industry: Investigations into the Application of Risk
Management Concepts in Leading European Real Estate Development

References
MATTHEW MOORHEAD 363
Organisations (PhD Thesis). ePublications@bond. Bond University,
Australia.
Wiener, J. B. ( ) The Diffusion of Regulatory Oversight. In Livermore,
M., & Revesz, R. L. (Eds.). Globalization of Cost‐Benefit Analysis in
Environmental Policy (pp. ‐ ). Duke Law School. Retreived from
htps://scholarship.law.duke.edu/faculty_scholarship/
Wiener, J. B. ( ) Risk Regulation and Future Learning. European Journal
of Risk Regulation (EJRR), Vol. , , pp. ‐ .
Wilkinson, S. J., Sayce, S. L., & Christensen, P. H. ( ). Developing
Property Sustainably. Routledge.
Wilkinson, S., & Reed, R. ( ). Property Development ( th ed.).
Routledge.
Williams, J. T. ( ). Real estate development as an option. The Journal of
Real Estate Finance and Economics, ( ), ‐ .
Williams, J. T. ( ). Equilibrium and options on real assets. The Review of
Financial Studies, ( ), ‐ .
Woodson, R. D. ( ). Be a Successful Residential Land Developer.
McGraw‐Hill.
Wurtzebach, C., Miles, M., & Cannon, S. ( ). Modern Real Estate. John
Wiley & Sons. New York, , .

References
MATTHEW MOORHEAD 364
Yin, R. K. ( ). Case study research: Design and methods ( rd ed.).
Thousand Oaks, CA: Sage.
Yin, R. K. ( ). Mixed methods research: Are the methods genuinely
integrated or merely parallel. Research in the Schools, ( ), ‐ .
Yin, R. K. ( ). Qualitative research from start to finish. Guilford
Publications.
Yin, R. K. ( ). Case study research and applications: Design and
methods. Sage publications.
Yong, A. G., & Pearce, S. ( ). A beginner’s guide to factor analysis:
Focusing on exploratory factor analysis. Tutorials in quantitative methods
for psychology, ( ), ‐ .
Young, M. ( ). Real‐Time Valuation: Breathing New Life into Moribund
DCF Modeling. Journal of Real Estate Practice and Education: , Vol. ,
No. , pp. ‐
Zhang, H., & Singer, B. H. ( ). Recursive partitioning and applications.
Springer Science & Business Media.
Zuckerman, H. A., & Blevins, G. D. ( ). Real Estate Development
Workbook and Manual. Aspen Publishing.

References
MATTHEW MOORHEAD 365
Appendices A ‐ J

AppendixA‐DefinitionsandTerms
MATTHEW MOORHEAD 366
AppendixA‐DefinitionsandTerms
DefinitionsandTerms
Artificial Neural Networks or ANN’s are based on the biological networks that
exist within the human brain and were introduced by Mculloch and Pitts
( ). ANNs were later shown to have been a useful technique for testing
the relationship between independent variables (Lippmann, ,
Demyanyk & Hasan, ).
Bounded rationality ‐ The constraints to rational decision‐making which include
( ) lack of information, (b) time constraints and (c) the cognitive abilities
of the decision‐maker. Other factors that may impair rational decision‐
making include poor advice, cultural and peer group influences, limited
understanding of the issues through poor education or training, cultural
and organisational value systems and emotional states (Regan, , p. ).
Capital Asset Pricing Model ‐ CAPM builds upon modern portfolio theory
developed by Markowitz ( ) and aims to discount future cash flows by
a minimum market return and a risk‐premium commensurate with the
expected volatility of returns.
Code assessment – an assessment that must be carried out only against the
assessment benchmarks in a categorising instrument for the development; and
having regard to any matters prescribed by regulation. (Planning Act QLD,
, p. ).
Coombs’ Theory ‐ postulates that individuals have an ideal risk level and that
choosing between equal probability events, the individual selects the event
that is closer to the ideal risk level (Coombs, ).
Decision theory is the ‘study of how people model ‘judgement’ and, from that,
how they determine their choice’ (Atherton et al., , p. ).
Descriptive analysis: models which purport to describe how we do decide.
Descriptive models do not seek to aid people in making ‘rational’ decision
Atherton et al. ( , p. ).
AppendixA‐DefinitionsandTerms
MATTHEW MOORHEAD 367
Development value ‐ The estimated value of a property development scheme
once completed (adapted from Crosby et al., a, p. )
A discount rate is a required rate of return on a real estate
investment/development based on its risk when compared with returns
earned on competing investments and other capital market benchmarks
(Rowland, ).
Discounting is the process of determining the present value (PV) of a cashflow
inflows and outflows by taking into account the time value of money of
future value (FV) inputs (Moorhead & Armitage, )
Due diligence‐ a period of time where a contract is not unconditional to allow for
the purchaser to review the feasibility of the potential project and
acquisition. In terms of property development a due diligence period is
equivalent to a call option over real property to evaluate the viability of a
potential project.
Factor analysis targets the ‘dimensionality of the original space and to give an
interpretation to the new space, spanned by a reduced number of new
dimensions which are supposed to underlie the old ones’ (Rietveld & Van
Hout, , p. ).
Feasibility analysis‐ Determination of a potential development scheme’s
forecasted profit or loss in order to determine project viability, the impact
of a range of variations on a project, to test the veracity of the assumptions,
as a measurement of risk, and as a tool for raising capital in both debt and
equity forms (Havard, , p. ).
Gross realisation (GR) or gross development value (GDV) – is the development
value of a completed project after subtracting GST.
Highest and best use (HABU) ‐ the use that represents the greatest economic
financial value (Messner, ). The Dictionary of Real Estate Appraisal
defines highest and best use for a site as the reasonably probable and legal
use that generates the highest value (Appraisal Institute (US), , p. ).
process of scheme evaluation will result in a range of values, and the vendor

AppendixA‐DefinitionsandTerms
MATTHEW MOORHEAD 368
will usually sell to the highest bid that a prospective developer can make
while still achieving their target return (Havard, ).
Homogenous sampling involves studying individuals who have membership in a
subgroup with distinctive characteristics (Patton, ; Teddlie & Yu,
).
Hurdle rate‐ A required rate of return or an economic profit that a potential
project would need to generate for the property developer to be willing to
proceed. From a property investment decision, ‘hurdle rates’ are linked to
capitalisation rates and investment yields in capital budgeting decisions, or
a required return less the forecasted long‐term growth in income after
allowing for depreciation. (Hutchison et al., , p. )
Impact Assessment ‐ is an assessment that must be carried out against the assessment
benchmarks in a categorising instrument for the development; and having
regard to any matters prescribed by regulation may be carried out against, or
having regard to, any other relevant matter, other than a person’s personal
circumstances, financial or otherwise (Planning Act QLD, , p. ).
Kruskal‐Wallis Test is the non‐parametric alternative to a one‐way ANOVA
between groups, and also allows for comparison of scores on continuous
variables across three or more groups (Pallant, ).
Limitation ‐ a ‘systematic bias that the researcher did not or could not control
and which could inappropriately affect the results’ (Price & Murnan, ,
p. ).
Mann‐Whitney U Test is useful for examining the differences between two
independent groups on a continuous measure and is the ‘non‐parametric
alternative to the t‐test for independent samples’ (Pallant, , p. ).
Material Change of Use (MCU) ‐ The start of a new use of the premises; (or) the
re‐establishment of the premises of a use that has been abandoned; (or) a
material increase in the intensity or scale of the use of the premises. Planning
Act (Qld) , p. .

AppendixA‐DefinitionsandTerms
MATTHEW MOORHEAD 369
Marketability analysis ‐ can be described as a process where the analyst
‘investigates how a particular piece of property will be absorbed, sold, or
leased under current or anticipated market conditions’ (Reed, , p. ).
Mixed‐methods research involves the use of strands which represents those
components of the study that encompasses the basic process of conducting
quantitative or qualitative research: posing a question, collecting data,
analysing data, and interpreting results based on that data (Teddlie &
Tashakkori, ).
Monte‐Carlo simulation stochastic simulations ‐are a methodology by which the
uncertainty encompassing the main variables projected in a forecasting
model is processed in order to estimate the impact of risk on the projected
results. (Savvides, , p. )
Net Present Value (NPV)– The NPV of a project is the estimated present value of
future cash flows minus the present value of the investment made to have
the right to receive the future cash flows (Ross et al., ).
Non‐parametric techniques – analyse differences between groups, and differ
from parametric techniques in that they do not place the same demands
for the distribution of the data but do have the requirements of random
samples and independent observations. This technique is useful when data
is measured in nominal and ordinal ranked scales as well as categorical
variables (Pallant, ).
Normative analysis ‐ models which suggest how we should decide. ‘Usually based
on mathematical axioms, which define rational behaviour’. ‘The decision‐
maker believes A and b then should do X and Y. However, the additional
element that is critical in the development process is time’. (Atherton &
French, , p. ; Bell et al., )
Pearson Chi‐square test – is a non‐parametric test of independence that is ‘used
when you wish to explore the relationship between two categorical
variables’ (Pallant, , p )

AppendixA‐DefinitionsandTerms
MATTHEW MOORHEAD 370
Prescriptive analysis ‐ models which use normative models to guide the decision‐
maker within other limiting cognitive parameters (Atherton et al., , p.
).
Project viability ‐ refers to the outcome of a feasibility analysis forecasting
whether a potential development project is anticipated to meet or exceed
the required hurdle rates, and therefore, warrants further investigation
(Havard, ).
Property ‐ is a generic term referring to real assets including land and its
improvements rather than the stricter legal definition of a model of rights
associated with some tangible and intangible object.
Property development –is a sequence of steps that take a property development
project from inception through to construction and completion including
the management of the asset over its lifecycle in order to derive value and
achieve the projects objectives.
Prospect Theory ‐ risk is regarded as a property of options or events which can
be meaningfully ordered for riskiness. The risk of an event is related to the
variance of its outcomes (Pollatsek & Tversky, , p. ).
Purposeful sampling in quantitative and qualitative research means that
‘researchers intentionally select participants who have experienced the
central phenomenon or key concept being explored in the study’ (Creswell
& Clark, , p. ).
Pearson Chi‐square test of independence is ‘used when you wish to explore the
relationship between two categorical variables; (Pallant, , p ).
Parametric tests are designed to make an ‘assumption about the population from
which the sample has been drawn’ (Pallant, , p ).
Reliability, is ‘the degree to which the instrumentation consistently measures a
variable in repeated over multiple periods’ (Roberts, , p. ).

AppendixA‐DefinitionsandTerms
MATTHEW MOORHEAD 371
Validity is the degree to which your instrument accurately measures the
variables that were intended to be measured. (Roberts, , p. ).
Confirmatory Factor Analysis (CFA) is a type of factor analysis statistical
technique that is used to confirm or reject the null‐hypothesis (Child,
).
Exploratory Factor Analysis (EFA) is a type of factor analysis statistical technique
that is primarily used to uncover complex data patterns by testing
predictions (Child, ).
Reliability – ‘the degree to which the instrumentation consistently measures a
variable in repeated over multiple periods’ (Roberts, , p. ).
Residual land valuation (RLV)‐ is the maximum amount that can be paid for the
site or bid at auction after the costs associated with acquiring the site are
allowed (Havard, , Isaac et al., )
Risk ‐ an occurrence of a future event that may produce an outcome different
from what was anticipated (Regan, ).
Sampling ‐ the process of selecting a sample from the sampling population which
will work to become the basis for estimating or predicting the prevalence
of an unknown piece of information, situation or outcome of the larger
population. Kumar and Phrommathed ( , p. )
Scenario Analysis‐ addresses ‘what‐if’ questions. By allowing multiple variables
to be changed the analyst is able to address the interdependence of many
input variables. Two common forms include what‐if scenarios and
probability linked scenarios.
Sensitivity Analysis ‐ changing a variable singularly by a set percentage that is
often incremental, and determining the impact of this change on the key
financial metrics of the project (Havard, , p. ).

AppendixA‐DefinitionsandTerms
MATTHEW MOORHEAD 372
Site acquisition‐ is the process of identifying, negotiating and obtaining the legal
rights of ownership over land, and is also associated with the determination
of the viability of a potential property development project.
Target Internal Rate of Return (TIRR) ‐ is a required IRR set by the decision‐
maker as a minimum hurdle rate to which a project’s forecasted return
must be equal or greater than, and a TIRR converts an IRR from a measure
of expected return to a ‘go’ or ‘no‐go’ decision criterion. (Author, ).
Uncertainty ‐ Events that cannot be predicted. For example, seismic activity in
the form of volcanic eruptions and earthquakes. Uncertain events of
catastrophic dimension are termed black swans (Regan, , p. ).
Validity is the degree to which your instrument accurately measures the
variables that were intended to be measured.

AppendixB‐QuestionnaireSurveyInstrument,ResearchExplanationStatementandParticipantConsent
MATTHEW MOORHEAD 373
AppendixB‐QuestionnaireSurveyInstrument,ResearchExplanationStatementandParticipantConsent
FEASIBILITY ANALYSIS IN THE PRE‐COMMITMENT STAGES OF THE DEVELOPMENT PROCESS BUHREC No 15151 RE: RESEARCH EXPLANATORY STATEMENT I would like to introduce myself: my name is Matthew Moorhead and I am conducting research for a PhD under the supervision of Prof Michael Regan and Dr Lynne Armitage. We are pleased to present you with the questionnaire “Feasibility analysis in the pre‐commitment stages of the development process”. This questionnaire forms an essential part of my Ph.D. thesis with the objective of gaining a greater understanding of the decision making processes currently being used by property development organisations in deciding whether to proceed with site acquisition and/or commencement of a project.In order to accomplish the research aims, a necessary step is to gather empirical evidence of the current practices used within the major property sectors and company types within the Australian property development industry. This questionnaire will be useful to draw comparisons between the theoretical models and processes and actual industry practice. The questionnaire consists of approximately 25 questions (dependent upon responses) and will take approximately 15 minutes or less. Most questions can be answered by marking the appropriate pre‐set answer boxes with a cross. It would be helpful to provide additional comments where you consider this necessary to explain further. In order to make a consistent and representative evaluation, the researcher would be grateful for responses to all questions. In order to accomplish the research aims, a necessary step is to gather empirical evidence of the current practices used within the major property sector and organisations in the Australian property development industry. This questionnaire will be useful to draw comparisons between the theoretical models and processes and actual industry practice.
All data obtained from participants will be kept confidential and will be reported in an aggregate format (by reporting only combined results and never reporting individual ones). All questionnaires will be concealed, and no one other than the primary investigator and supervising researches will have access to them. The data collected will be stored in the HIPPA‐compliant, Qualtrics‐secure database until it has been deleted by the primary investigator. There is no direct compensation, however, participants may elect to leave their details to go into the prize draw for an Apple Ipad Air 2 64 GB. Prize draw to

AppendixB‐QuestionnaireSurveyInstrument,ResearchExplanationStatementandParticipantConsent
MATTHEW MOORHEAD 374
be conducted on March 31st 2016 and the winner to be contacted by email and phone. The data collected will be stored in the HIPPA‐compliant, Qualtrics‐secure database until it has been deleted by the primary investigator.
Participation in this research study is completely voluntary. You have the right to withdraw at anytime or refuse to participate entirely without jeopardy. If you desire to withdraw, please close your internet browser and notify the principal investigator at [email protected] so you will not be included in subsequent correspondence. We would be grateful if you could participate in the online survey using the link below before 31st March 2016. If you have any questions regarding this research please do not hesitate to contact us on 5595‐2194 or by email at [email protected], [email protected] or [email protected]. Thank you very much for your time and contribution which are greatly appreciated.
Survey Link: https://bond.qualtrics.com/SE/?SID=SV_4HhryvJGgy0fO9n Sincerely, Matthew Moorhead Faculty of Society & Design
Should you have any complaints concerning the manner in which this research is being conducted please make contact with –
Bond University Human Research Ethics Committee, Bond University Office of Research Services. Bond University, Gold Coast, 4229, Australia
Tel: +61 7 5595 4194 Fax: +61 7 5595 1120 email: [email protected]

AppendixB‐QuestionnaireSurveyInstrument,ResearchExplanationStatementandParticipantConsent
MATTHEW MOORHEAD 375

AppendixB‐QuestionnaireSurveyInstrument,ResearchExplanationStatementandParticipantConsent
MATTHEW MOORHEAD 376

AppendixB‐QuestionnaireSurveyInstrument,ResearchExplanationStatementandParticipantConsent
MATTHEW MOORHEAD 377

AppendixB‐QuestionnaireSurveyInstrument,ResearchExplanationStatementandParticipantConsent
MATTHEW MOORHEAD 378

AppendixB‐QuestionnaireSurveyInstrument,ResearchExplanationStatementandParticipantConsent
MATTHEW MOORHEAD 379

AppendixB‐QuestionnaireSurveyInstrument,ResearchExplanationStatementandParticipantConsent
MATTHEW MOORHEAD 380

AppendixB‐QuestionnaireSurveyInstrument,ResearchExplanationStatementandParticipantConsent
MATTHEW MOORHEAD 381

AppendixB‐QuestionnaireSurveyInstrument,ResearchExplanationStatementandParticipantConsent
MATTHEW MOORHEAD 382

AppendixB‐QuestionnaireSurveyInstrument,ResearchExplanationStatementandParticipantConsent
MATTHEW MOORHEAD 383
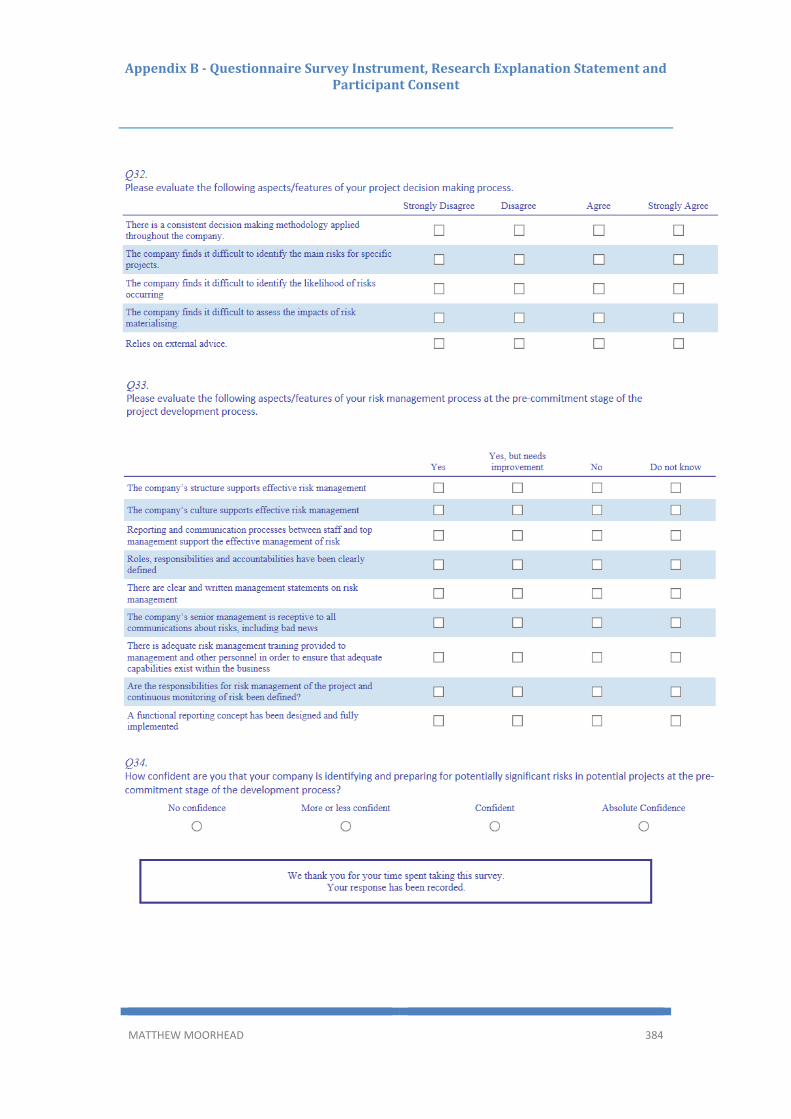
AppendixB‐QuestionnaireSurveyInstrument,ResearchExplanationStatementandParticipantConsent
MATTHEW MOORHEAD 384

AppendixC–EthicsClearance
MATTHEW MOORHEAD 385
AppendixC–EthicsClearance
The empirical research that forms the basis for the outcomes of this thesis
received ethics approval from the Human Research Ethics Committee at Bond
University. Ethics approval ID numbers & .

AppendixC–EthicsClearance
MATTHEW MOORHEAD 386

AppendixD–DecisionTree&RandomForestResults
MATTHEW MOORHEAD 387
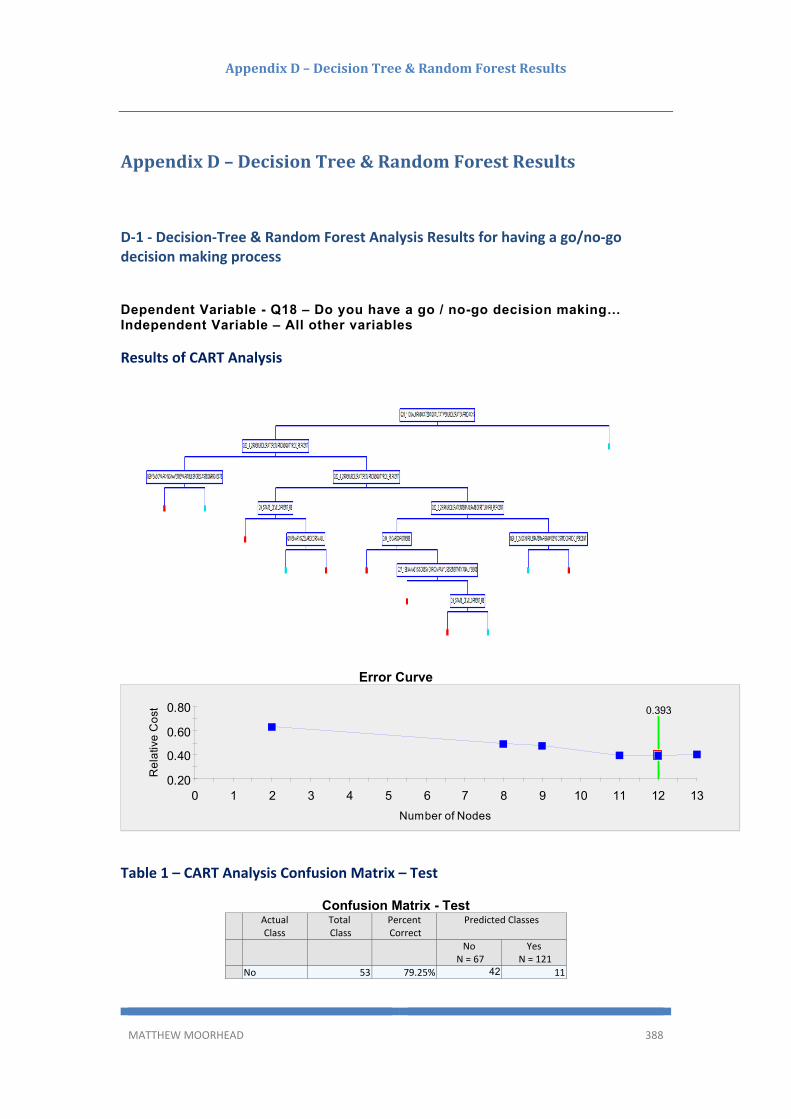
AppendixD–DecisionTree&RandomForestResults
MATTHEW MOORHEAD 388
AppendixD–DecisionTree&RandomForestResults
D‐1 ‐ Decision‐Tree & Random Forest Analysis Results for having a go/no‐go decision making process Dependent Variable - Q18 – Do you have a go / no-go decision making… Independent Variable – All other variables Results of CART Analysis
Error Curve
Table 1 – CART Analysis Confusion Matrix – Test
Confusion Matrix - Test Actual
Class Total Class
Percent Correct
Predicted Classes
No N = 67
Yes N = 121
No 53 79.25% 42 11
0.20
0.40
0.60
0.80
0 1 2 3 4 5 6 7 8 9 10 11 12 13
Re
lativ
e C
ost
Number of Nodes
0.393

AppendixD–DecisionTree&RandomForestResults
MATTHEW MOORHEAD 389
Yes 135 81.48% 25 110 Total: 188 Average: 80.36% Overall % Correct:
80.85%
Specificity 81.48% Sensitivity/Recall
79.25%
Precision 62.69% F1 statistic 70.00%
Table 1 – CART Analysis Variable Importance
Variable ImportanceVariable Score
Q20_4_2ROEHURDLERATERETURNONEQUITYROE_PERCENT 100.00 ||||||||||||||||||||||||||||||||||||||||||||||||
Q20_6_2MINPROFIT_HURDLERATEMINIMUM_PROFIT 71.51 ||||||||||||||||||||||||||||||||||
Q20_11QUALHRINDICATEDAQUALITATIVEHURDLERATEAPPROACH$ 56.99 ||||||||||||||||||||||||||| Q20_2_2IRRHURDLERATEINTERNALRATEOFRETURNIRR_PERCENT 48.17 ||||||||||||||||||||||| Q19HURDLERATEUSEDOESYOURCOMPANYINCORPORATESPECIFICF$ 33.51 |||||||||||||||| Q10DEVSIZEDOMINANTSIZEOFPROJECTIN_ORIFMORETHANONE$ 25.82 |||||||||||| Q20_1_2MDCHURDLERATEMARGINONDEVCOSTMDCORROC_PERCENT 17.03 |||||||| Q5_DEVELOPER_TYPE$ 16.73 |||||||| Q9_STATE_DEVELOPMENT_R$ 16.38 ||||||| Q8_JOB_ROLE_R$ 13.22 |||||| Q14_1BOARDOROTHER$ 12.49 ||||| Q14_1BOARDOROTHER_R$ 12.49 ||||| Q29FEASOVARCHNGHAVETHEVARIABLESFORECASTEDINPROJECT$ 11.79 ||||| Q14DECISIONMAKERISTHEREASPECIALISEDBOARDSENIORMANAG$ 10.46 ||||| Q7_PROPERTY_TYPE$ 10.06 |||| Q27_B_NO_OF_RISK_ANALYSIS_METHODS 9.39 |||| _20_3_2TIRRHURDLERATETARGETIRR_PERCENT 8.95 |||| Q10BINARYSIZELARGEORSMALL 8.95 |||| Q27_1SENANALYSISDOESYOURCOMPANYUSESENSITIVITYANALYSISO$ 8.70 |||| HURDLERATENUMNUMBEROFSPECIFICHURDLERATESINDICATED 8.63 |||| Q24RISKMANPLANDOESYOURCOMPANYHAVEARISKMANAGEMENTST$ 7.25 ||| Q27_7OTHERANALYSISOTHERPLEASESPECIFYASARISKANALYSIS$ 5.91 || Q20_1_1MDCDOYOUUSEMDCROCASAHURDLERATE$ 5.75 || Q23_2DCFDOESYOURCOMPANYUTILISETHEDISCOUNTEDCASHFLOWM$ 5.32 || Q17_4ARGUSDEVDOESYOURCOMPANYUSEARGUSDEVELOPERFEASIBILI$ 5.08 || _20_4_1ROEDOYOUUSEROEASHURDLERATE$ 4.07 | Q12_EDCUCATION_LEVEL_R$ 3.60 | Q6OWNERSHIPPLEASEPROVIDEDETAILSONTHEOWNERSHIPSTRUCTU$ 3.38 | Q26_IFYESTORISKPOLICYCHANGE_WHAT$ 2.82 | Q11EXPERIENCEPLEASEINDICATEYOURLEVELOFEXPERIENCEINT$ 2.76 | Q6_1_ASXPUBLICLISTED 2.61 | Q24RISKMANPLAN_YES_NO_COND$ 2.57 | _20_3_1TIRRDOYOUUSETARGETIRRASAHURDLERATE$ 1.67 Q20_5NPVDOYOUUSENPVASAHURDLERATENPVGTTHAN_0$ 1.60 Q30BACKCHECKDOYOURETROSPECTIVELYCHECKYOURFORECASTS$ 0.83

AppendixD–DecisionTree&RandomForestResults
MATTHEW MOORHEAD 390
Results of Random Forest with Pruning Analysis
Variable Importance
Variable Score Q20_11QUALHRINDICATEDAQUALITATIVEHURDLERATEAPPROACH$ 100.00 |||||||||||||||||||||||||||||
||||||||||||| Q19HURDLERATEUSEDOESYOURCOMPANYINCORPORATESPECIFICF$ 45.11 ||||||||||||||||||
Q7_PROPERTY_TYPE$ 44.99 |||||||||||||||||| Q5_DEVELOPER_TYPE$ 42.76 ||||||||||||||||| Q9_STATE_DEVELOPMENT_R$ 40.79 ||||||||||||||||| Q27_7OTHERANALYSISOTHERPLEASESPECIFYASARISKANALYSIS$ 37.31 ||||||||||||||| Q10DEVSIZEDOMINANTSIZEOFPROJECTIN_ORIFMORETHANONE$ 34.79 |||||||||||||| Q29FEASOVARCHNGHAVETHEVARIABLESFORECASTEDINPROJECT$ 34.29 ||||||||||||||
Q21HRALTERDOESYOURCOMPANYUTILISEASPECIFICMECHANISMF$ 33.46 |||||||||||||
Q8_JOB_ROLE_R$ 26.78 ||||||||||| Q12_EDCUCATION_LEVEL_R$ 24.42 |||||||||| Q17_4ARGUSDEVDOESYOURCOMPANYUSEARGUSDEVELOPERFEASIBILI$ 22.78 |||||||||
Q26_IFYESTORISKPOLICYCHANGE_WHAT$ 22.20 ||||||||| Q6OWNERSHIPPLEASEPROVIDEDETAILSONTHEOWNERSHIPSTRUCTU$ 20.23 ||||||||
Q11EXPERIENCEPLEASEINDICATEYOURLEVELOFEXPERIENCEINT$ 19.92 |||||||| Q25RISKPOLCHNGHASYOURCOMPANYSRISKMANAGEMENTPOLICITY$ 17.02 ||||||
Q31_RISK_TOLERANCE_SCALE$ 16.66 |||||| Q24RISKMANPLANDOESYOURCOMPANYHAVEARISKMANAGEMENTST$ 16.53 ||||||
Q30BACKCHECKDOYOURETROSPECTIVELYCHECKYOURFORECASTS$ 16.29 ||||||
Q13PROPERTYQUALWEREANYOFYOURQUALIFICATIONSINAPROPER$ 15.61 ||||||
Q27_1SENANALYSISDOESYOURCOMPANYUSESENSITIVITYANALYSISO$ 15.00 |||||
Q14_1BOARDOROTHER$ 14.05 ||||| Q3_2NZDEVDOYOUCONDUCTPROPERTYDEVELOPMENTSINNEWZEALAND$ 13.11 |||||
Q20_2_1IRRDOYOUUSEIRRASAHURDLERATE$ 11.13 |||| Q23_4MARKCOMPDOESYOURCOMPANYUTILISETHEMARKETCOMPARIS$ 9.85 |||
Q17_1EMDFDOESYOURCOMPANYUSEESTATEMASTERDFDEVELOPMENT$ 9.54 |||
Q20_2_2IRRHURDLERATEINTERNALRATEOFRETURNIRR_PERCENT 9.52 ||| Q3_1AUSDEVDOYOUCONDUCTPROPERTYDEVELOPMENTSINAUSTRALIA$ 9.01 |||
HURDLERATENUMNUMBEROFSPECIFICHURDLERATESINDICATED 8.50 ||| Q14DECISIONMAKERISTHEREASPECIALISEDBOARDSENIORMANAG$ 8.22 |||
Q22_3ALTERHRQUALFRAMEALTERSHURDLERATESONQUALITATIVE$ 8.22 |||
Q23_2DCFDOESYOURCOMPANYUTILISETHEDISCOUNTEDCASHFLOWM$ 6.74 ||
Q22_1HRALTERRAALTERSHURDLERATESONRISKANALYSISIEMA$ 6.72 || Q20_1_2MDCHURDLERATEMARGINONDEVCOSTMDCORROC_PERCENT 6.62 ||
Q27_B_NO_OF_RISK_ANALYSIS_METHODS 5.96 || Q16FEASOPROGRAMDOESYOURCOMPANYUSEAPROPRIETARYDEVELOPME$ 5.72 |
Q17_2EXCELDOESYOURCOMPANYUSEMICROSOFTEXCEL$ 5.33 | Q17_6FEASTUDYDOESYOURCOMPANYUSEFEASTUDYFEASIBILITYPROGR$ 4.70 |

AppendixD–DecisionTree&RandomForestResults
MATTHEW MOORHEAD 391
Q20_7_1MINPROJDOYOUUSEMINIMUM_PROJECTSIZEASAHURDLE$ 4.50 |
Q10BINARYSIZELARGEORSMALL 4.33 | Q23_1RLVDOESYOURCOMPANYUTILISETHERESIDUALLANDVALUEM$ 4.19 |
_20_3_1TIRRDOYOUUSETARGETIRRASAHURDLERATE$ 4.04 | Q27_3MCANALYSISMONTECARLOSIMULATIONSASARISKANALYSISM$ 3.96 |
Q20_5NPVDOYOUUSENPVASAHURDLERATENPVGTTHAN_0$ 3.92 | Q24RISKMANPLAN_YES_NO_COND$ 3.74 | Q27_6ROANALYSISREALOPTIONMODELSASARISKANALYSISMETHOD$ 3.39
Q23_3RESACCFLOWDOESYOURCOMPANYUTILISETHERESIDUALACC$ 2.70
Q27_2SCENANALYSISDOESYOURCOMPANYUSESCENARIOANALYSISOF$ 0.33
Confusion Matrix - Test Actual
Class Total Class
Percent Correct
Predicted Classes
No N = 16
Yes N = 13
No 4 100.00% 4 0 Yes 25 52.00% 12 13 Total: 29 Average: 76.00% Overall % Correct:
58.62%
Specificity 52.00% Sensitivity/Recall
100.00%
Precision 25.00% F1 statistic 40.00%
Results of TREENET Analysis
Confusion Matrix - OOB Actual
Class Total Class
Percent Correct
Predicted Classes
No N = 156
Yes N = 32
No 53 92.45% 49 4 Yes 135 20.74% 107 28 Total: 188 Average: 56.60% Overall % Correct:
40.96%
Specificity 20.74% Sensitivity/Recall
92.45%
Precision 31.41% F1 statistic 46.89%

AppendixD–DecisionTree&RandomForestResults
MATTHEW MOORHEAD 392
Variable Importance Variable Score
Q20_11QUALHRINDICATEDAQUALITATIVEHURDLERATEAPPROACH$ 15.32 ||||||||||||||||||||||||||||||||||||||||||||||||
Q19HURDLERATEUSEDOESYOURCOMPANYINCORPORATESPECIFICF$ 8.74 ||||||||||||||||||||||||||| Q20_1_1MDCDOYOUUSEMDCROCASAHURDLERATE$ 5.53 ||||||||||||||||| Q9_STATE_DEVELOPMENT_R$ 4.03 |||||||||||| Q5_DEVELOPER_TYPE$ 3.82 ||||||||||| Q7_PROPERTY_TYPE$ 3.36 |||||||||| _20_3_1TIRRDOYOUUSETARGETIRRASAHURDLERATE$ 3.19 ||||||||| Q8_JOB_ROLE_R$ 3.13 ||||||||| Q14_1BOARDOROTHER_R$ 2.75 |||||||| Q11EXPERIENCEPLEASEINDICATEYOURLEVELOFEXPERIENCEINT$ 2.66 |||||||| HURDLERATENUMNUMBEROFSPECIFICHURDLERATESINDICATED 2.52 ||||||| Q10DEVSIZEDOMINANTSIZEOFPROJECTIN_ORIFMORETHANONE$ 2.47 ||||||| Q26_IFYESTORISKPOLICYCHANGE_WHAT$ 2.36 ||||||| Q20_2_1IRRDOYOUUSEIRRASAHURDLERATE$ 2.10 |||||| Q24RISKMANPLANDOESYOURCOMPANYHAVEARISKMANAGEMENTST$ 2.10 |||||| Q14_1BOARDOROTHER$ 1.87 ||||| Q21HRALTERDOESYOURCOMPANYUTILISEASPECIFICMECHANISMF$ 1.86 ||||| Q12_EDCUCATION_LEVEL_R$ 1.85 ||||| Q31_RISK_TOLERANCE_SCALE$ 1.84 ||||| Q30BACKCHECKDOYOURETROSPECTIVELYCHECKYOURFORECASTS$ 1.58 |||| Q27_2SCENANALYSISDOESYOURCOMPANYUSESCENARIOANALYSISOF$ 1.56 |||| Q6OWNERSHIPPLEASEPROVIDEDETAILSONTHEOWNERSHIPSTRUCTU$ 1.53 |||| Q29FEASOVARCHNGHAVETHEVARIABLESFORECASTEDINPROJECT$ 1.41 |||| Q20_5NPVDOYOUUSENPVASAHURDLERATENPVGTTHAN_0$ 1.30 |||| Q22_3ALTERHRQUALFRAMEALTERSHURDLERATESONQUALITATIVE$ 1.15 ||| Q22_1HRALTERRAALTERSHURDLERATESONRISKANALYSISIEMA$ 1.12 ||| Q27_7OTHERANALYSISOTHERPLEASESPECIFYASARISKANALYSIS$ 1.03 ||| Q17_8PROPRIETARYPROGRAMDIDYOURCOMPANYHAVEITSOWNPROGRAM$ 1.02 ||| Q27_3MCANALYSISMONTECARLOSIMULATIONSASARISKANALYSISM$ 0.81 || _20_4_1ROEDOYOUUSEROEASHURDLERATE$ 0.78 || Q23_1RLVDOESYOURCOMPANYUTILISETHERESIDUALLANDVALUEM$ 0.77 || Q20_8_1ROIDOYOUUSEROIASAHURDLERATE$ 0.77 || Q20_2_2IRRHURDLERATEINTERNALRATEOFRETURNIRR_PERCENT 0.75 || Q20_1_2MDCHURDLERATEMARGINONDEVCOSTMDCORROC_PERCENT 0.74 || Q20_7_1MINPROJDOYOUUSEMINIMUM_PROJECTSIZEASAHURDLE$ 0.74 || Q27_B_NO_OF_RISK_ANALYSIS_METHODS 0.72 || Q27_1SENANALYSISDOESYOURCOMPANYUSESENSITIVITYANALYSISO$ 0.70 || Q17_2EXCELDOESYOURCOMPANYUSEMICROSOFTEXCEL$ 0.65 || _20_3_2TIRRHURDLERATETARGETIRR_PERCENT 0.63 | Q17_1EMDFDOESYOURCOMPANYUSEESTATEMASTERDFDEVELOPMENT$ 0.61 | Q3_2NZDEVDOYOUCONDUCTPROPERTYDEVELOPMENTSINNEWZEALAND$ 0.58 | Q22_3ALTERHRPLANALTERSHURDLERATESONPLANNINGORGEOGRA$ 0.54 | Q23_2DCFDOESYOURCOMPANYUTILISETHEDISCOUNTEDCASHFLOWM$ 0.52 | Q3_1AUSDEVDOYOUCONDUCTPROPERTYDEVELOPMENTSINAUSTRALIA$ 0.50 | Q23_4MARKCOMPDOESYOURCOMPANYUTILISETHEMARKETCOMPARIS$ 0.49 | Q14DECISIONMAKERISTHEREASPECIALISEDBOARDSENIORMANAG$ 0.48 | Q25RISKPOLCHNGHASYOURCOMPANYSRISKMANAGEMENTPOLICITY$ 0.44 | Q27_5PROPANALYSISPROBABILITYANALYSISBAYESIANMODELSASA$ 0.40 | Q20_6_1MINPROFITDOYOUUSEMINIMUM_PROFITASAHURDLERAT$ 0.38 | Q24RISKMANPLAN_YES_NO_COND$ 0.36 | Q16FEASOPROGRAMDOESYOURCOMPANYUSEAPROPRIETARYDEVELOPME$ 0.36 | Q27_6ROANALYSISREALOPTIONMODELSASARISKANALYSISMETHOD$ 0.35 | Q10BINARYSIZELARGEORSMALL 0.34 | Q20_4_2ROEHURDLERATERETURNONEQUITYROE_PERCENT 0.34 | Q17_4ARGUSDEVDOESYOURCOMPANYUSEARGUSDEVELOPERFEASIBILI$ 0.34 | Q27_4QUALMATRIXQUALITATIVERISKMATRIXASARISKANALYSISM$ 0.29 Q13PROPERTYQUALWEREANYOFYOURQUALIFICATIONSINAPROPER$ 0.28 Q17_6FEASTUDYDOESYOURCOMPANYUSEFEASTUDYFEASIBILITYPROGR$ 0.26 Q23_3RESACCFLOWDOESYOURCOMPANYUTILISETHERESIDUALACC$ 0.26
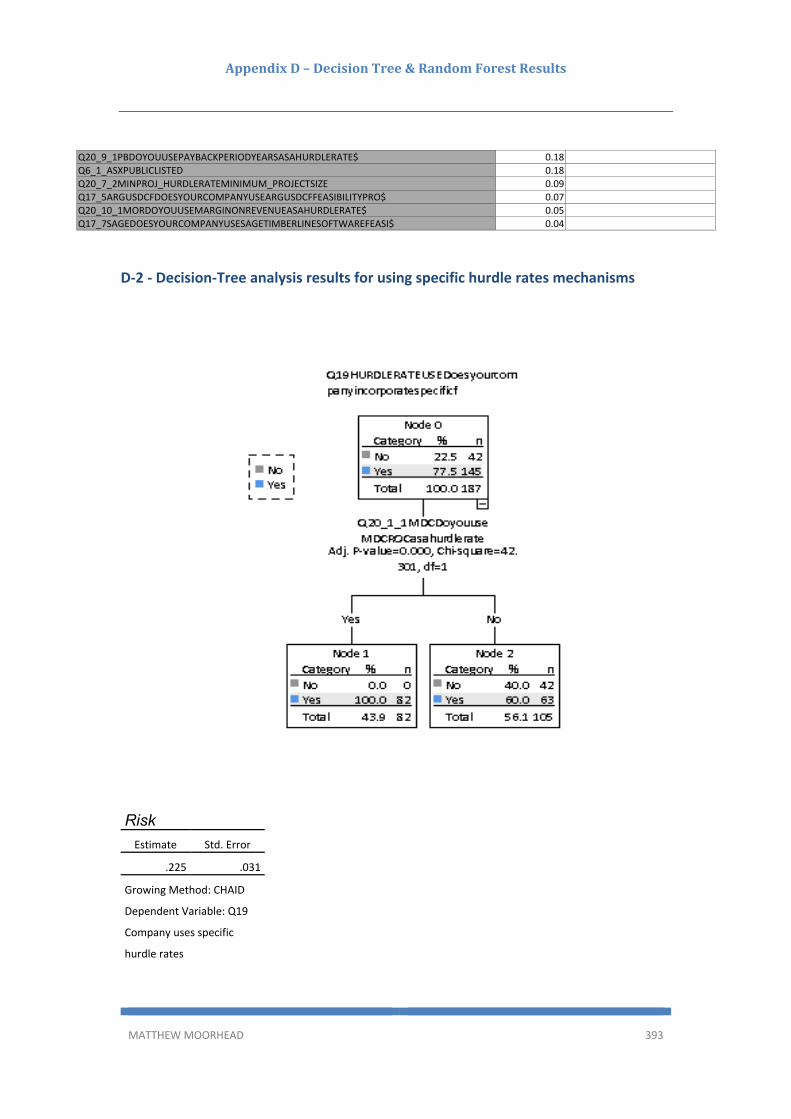
AppendixD–DecisionTree&RandomForestResults
MATTHEW MOORHEAD 393
Q20_9_1PBDOYOUUSEPAYBACKPERIODYEARSASAHURDLERATE$ 0.18 Q6_1_ASXPUBLICLISTED 0.18 Q20_7_2MINPROJ_HURDLERATEMINIMUM_PROJECTSIZE 0.09 Q17_5ARGUSDCFDOESYOURCOMPANYUSEARGUSDCFFEASIBILITYPRO$ 0.07 Q20_10_1MORDOYOUUSEMARGINONREVENUEASAHURDLERATE$ 0.05 Q17_7SAGEDOESYOURCOMPANYUSESAGETIMBERLINESOFTWAREFEASI$ 0.04
D‐2 ‐ Decision‐Tree analysis results for using specific hurdle rates mechanisms
Risk
Estimate Std. Error
.225 .031
Growing Method: CHAID
Dependent Variable: Q19
Company uses specific
hurdle rates

AppendixD–DecisionTree&RandomForestResults
MATTHEW MOORHEAD 394
Classification
Observed
Predicted
No Yes Percent Correct
No 0 42 0.0%
Yes 0 145 100.0%
Overall Percentage 0.0% 100.0% 77.5%
Growing Method: CHAID
Dependent Variable: Q19 Company uses specific hurdle rates

AppendixE‐ResultsofArtificialNeuralNetworkAnalysis
MATTHEW MOORHEAD 395
AppendixE‐ResultsofArtificialNeuralNetworkAnalysis
E‐1: ANN as a predictor of developer type Multilayer Perceptron
Case Processing Summary
N Percent
Sample Training 104 68.9%
Testing 47 31.1%
Valid 151 100.0%
Excluded 79
Total 230
Model Summary
Training Cross Entropy Error 107.882
Percent Incorrect Predictions 50.0%
Stopping Rule Used 1 consecutive
step(s) with no
decrease in errora
Training Time 0:00:00.04
Testing Cross Entropy Error 42.495
Percent Incorrect Predictions 36.2%
Dependent Variable: Q5 Developer Type (Condensed)
a. Error computations are based on the testing sample.
Classification
Sample Observed
Predicted
Trader Developer
Investor
Developer
Development
Manager Percent Correct
Training Trader Developer 30 2 15 63.8%
Investor Developer 11 7 9 25.9%
Development Manager 9 6 15 50.0%
Overall Percent 48.1% 14.4% 37.5% 50.0%
Testing Trader Developer 20 1 2 87.0%
Investor Developer 3 0 1 0.0%
Development Manager 8 2 10 50.0%
Overall Percent 66.0% 6.4% 27.7% 63.8%
Dependent Variable: Q5 Developer Type (Condensed)
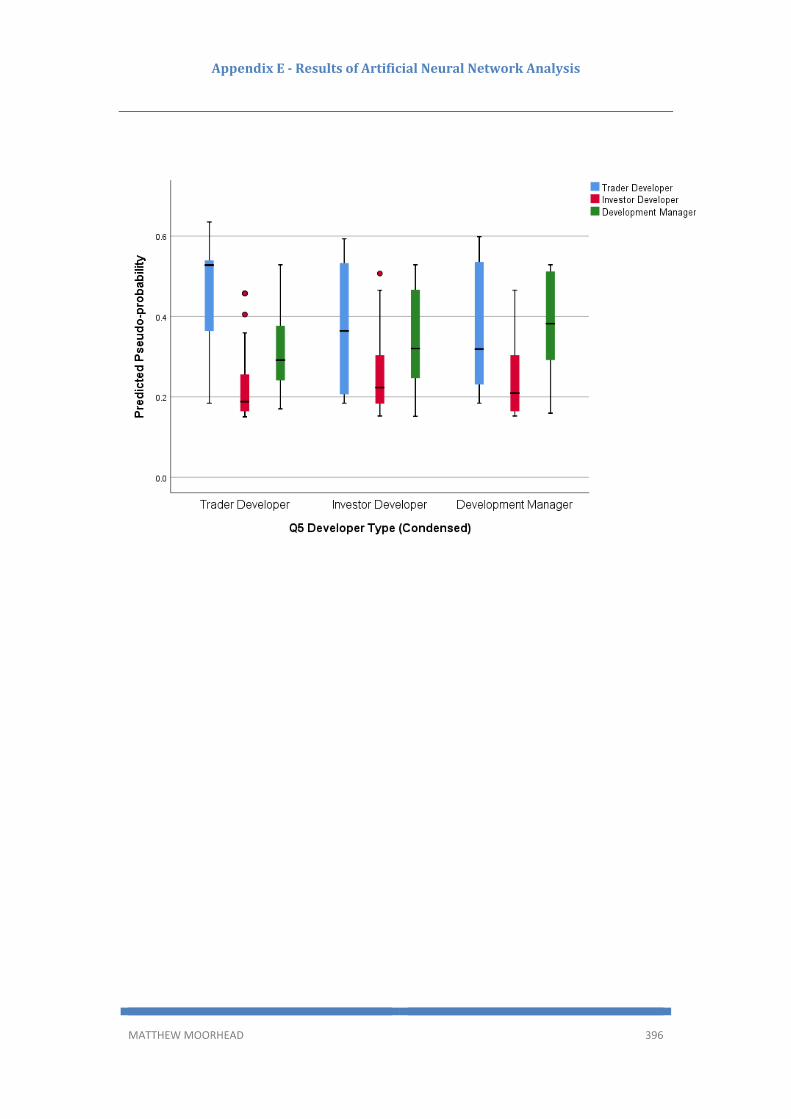
AppendixE‐ResultsofArtificialNeuralNetworkAnalysis
MATTHEW MOORHEAD 396

AppendixE‐ResultsofArtificialNeuralNetworkAnalysis
MATTHEW MOORHEAD 397
E‐2: ANN of Property Type and Forecast Variables Model Summary
Training Cross Entropy Error 123.830
Percent Incorrect Predictions 47.7%
Stopping Rule Used 1 consecutive
step(s) with no
decrease in errora
Training Time 0:00:00.04
Testing Cross Entropy Error 23.808
Percent Incorrect Predictions 47.1%
Dependent Variable: Dominant type of property developed
a. Error computations are based on the testing sample.
Independent Variable Importance
Importance Normalized Importance
Q28_1Grosssales$m2 .034 31.9%
Q28_2GrossRentofcompletedpr
oduct
.056 52.6%
Q28_3DemandCaptureSales .068 64.1%
Q28_4DemandCaptureTenancy
Market
.056 52.2%
Q28_5Rentalgrowthescalation .057 53.2%
Q28_6Vacancyrates .086 80.7%
Q28_7Salesrateescalation .020 18.5%
Q28_8Supplyofcomparablepro
pertyforsale
.056 52.5%
Q28_9Supplyofcomparablepro
pertyavailableforrent
.042 39.5%
Q28_10Productabsorptionrates .061 57.3%
Q28_11Salesvolumeofcompara
blepropertiesliquidity
.064 60.1%
Q28_12Yieldofcomparableprop
erties
.079 74.3%
Q28_13Capitalisationrates .052 48.9%
Q28_14GDPforecasts .107 100.0%
Q28_15Unemploymentforecast
s
.075 70.3%

AppendixE‐ResultsofArtificialNeuralNetworkAnalysis
MATTHEW MOORHEAD 398
Q28_16Interestrates .054 50.3%
Q28_17_Market_Vol_Scaled .034 32.0%

AppendixE‐ResultsofArtificialNeuralNetworkAnalysis
MATTHEW MOORHEAD 399
E‐3: ANN of Property Type and Hurdle Rate Selection Model Summary
Training Cross Entropy Error 178.089
Percent Incorrect Predictions 49.6%
Stopping Rule Used 1 consecutive
step(s) with no
decrease in errora
Training Time 0:00:00.04
Testing Cross Entropy Error 62.072
Percent Incorrect Predictions 50.0%
Dependent Variable: Dominant type of property developed
condensed
a. Error computations are based on the testing sample.
Classification
Sample Observed
Predicted
Residential Commercial Retail Mixed‐Use Other
Percent
Correct
Training Residential 69 0 0 0 0 100.0%
Commercial 6 0 1 0 0 0.0%
Retail 15 0 0 0 0 0.0%
Mixed‐Use 24 0 0 0 0 0.0%
Other 22 0 0 0 0 0.0%
Overall
Percent
99.3% 0.0% 0.7% 0.0% 0.0% 50.4%
Testing Residential 25 0 0 0 0 100.0%
Commercial 1 0 0 0 1 0.0%
Retail 3 0 0 0 0 0.0%
Mixed‐Use 13 0 0 0 0 0.0%
Other 7 0 0 0 0 0.0%
Overall
Percent
98.0% 0.0% 0.0% 0.0% 2.0% 50.0%
Dependent Variable: Dominant type of property developed condensed

AppendixE‐ResultsofArtificialNeuralNetworkAnalysis
MATTHEW MOORHEAD 400

AppendixE‐ResultsofArtificialNeuralNetworkAnalysis
MATTHEW MOORHEAD 401
E‐4: ANN of Hurdle rate altering and demographic characteristics Case Processing Summary
N Percent
Sample Training 83 74.1%
Testing 29 25.9%
Valid 112 100.0%
Excluded 118
Total 230 Model Summary
Training Cross Entropy Error 40.149
Percent Incorrect Predictions 22.9%
Stopping Rule Used 1 consecutive
step(s) with no
decrease in errora
Training Time 0:00:00.16
Testing Cross Entropy Error 15.951
Percent Incorrect Predictions 27.6%
Dependent Variable: Has specific mechanism for altering hurdle
rates
a. Error computations are based on the testing sample.
Classification
Sample Observed
Predicted
No Yes Percent Correct
Training No 41 7 85.4%
Yes 12 23 65.7%
Overall Percent 63.9% 36.1% 77.1%
Testing No 15 2 88.2%
Yes 6 6 50.0%
Overall Percent 72.4% 27.6% 72.4%
Dependent Variable: Has specific mechanism for altering hurdle rates

AppendixE‐ResultsofArtificialNeuralNetworkAnalysis
MATTHEW MOORHEAD 402
Independent Variable Importance
Importance
Normalized
Importance
Q5_Developer_Type .076 100.0%
Q3_1AUSDEVDoyouconductpropertydevelopmentsinAustralia .036 47.1%
Q3_2NZDEVDoyouconductpropertydevelopmentsinNewZealand .039 51.6%
Geography Condensed to Australia New Zealand or Other .024 32.0%
Ownership Public, Private or Other .034 45.4%
Dominant type of property developed condensed .061 80.0%
Q8_Job_Role_R .044 57.7%
Q9_State_Development_R .044 57.5%
Q10 Project Size Small, Medium or Large .027 35.1%
Q11_Experience_Years .040 53.3%
Q12_Edcucation_Level_R .059 78.5%
Q13_Property_Qualification .009 12.0%
Num_Levels_Approve_Proceed .024 32.1%
Q16 Uses a proprietary feasibility program .025 32.4%
Q17_1EMDFDoesyourcompanyuseEstateMasterDFdevelopment .011 14.9%
Q17_2EXCELDoesyourcompanyuseMicrosoftExcel .046 60.7%
Q17_8PROPRIETARYPROGRAMDidyourcompanyhaveitsownprogram .013 17.2%
Q18_B_Binary_Consisten_Decision_Methodology .035 45.8%
Q19 Company uses specific hurdle rates .021 28.1%
Q20_1_1MDC_Usage .056 74.4%
Q20_2_1IRR_Usage .057 75.2%
@20_3_1TIRR_Usage .036 47.4%
@20_4_1ROE_Usage .030 40.0%
NPV used .012 15.9%
Q20_6_1MINPROFIT$_Usage .021 27.9%
Q20_7_1MINPROJ$_Usage .013 17.6%
Q20_8_1ROI_Usage .032 42.4%
Q20_9_1PaybackPeriodYears_Usage .013 16.6%
Q20_10_1MOR_Usage .029 38.8%
Q20_11QualitativeHurdleRateApproach .033 43.8%

AppendixF‐Non‐ParametricTestsofIndependentSamples
MATTHEW MOORHEAD 403
AppendixF‐Non‐ParametricTestsofIndependentSamples
F‐1: Non‐parametric Mann‐Whitney U test of 2‐independen samples by using Monte Carlo simulations, Real Option theory or probability/Bayesian models in risk analysis with years’ experience Descriptive Statistics
N Mean Std. Deviation Minimum Maximum
Q11_Experience_Years 188 2.56 1.129 1 4
Q27 Uses Monte Carlo, Real
Option or Probability/Bayesian
175 .20 .401 0 1
Ranks Q27 Uses Monte Carlo, Real
Option or Probability/Bayesian N Mean Rank Sum of Ranks
Q11_Experience_Years No 140 89.81 12574.00
Yes 35 80.74 2826.00
Total 175
Test Statisticsa
Q11_Experience_
Years
Mann‐Whitney U 2196.000
Wilcoxon W 2826.000
Z ‐.979
Asymp. Sig. (2‐tailed) .327
a. Grouping Variable: Q27 Uses Monte Carlo,
Real Option or Probability/Bayesian

AppendixF‐Non‐ParametricTestsofIndependentSamples
MATTHEW MOORHEAD 404
F‐2: Non‐parametric Mann‐Whitney U test of 2‐independen samples of trader developer type and MDC and IRR hurdle rate usage
Descriptive Statistics
N Mean Std. Deviation Minimum Maximum
Q20_1_1MDC_Usage 205 .40 .491 0 1
Q20_2_1IRR_Usage 209 .31 .464 0 1
@20_4_1ROE_Usage 205 .10 .304 0 1
Q20_11QualitativeHurdleRateA
pproach
205 .16 .364 0 1
Q5_1TRADERDEVIsyourcompan
yaTraderDeveloper
225 .32 .468 0 1
Ranks Q5_1TRADERDEVIsyourcompan
yaTraderDeveloper N Mean Rank Sum of Ranks
Q20_1_1MDC_Usage No 134 94.13 12613.00
Yes 71 119.75 8502.00
Total 205
Q20_2_1IRR_Usage No 137 99.20 13590.00
Yes 72 116.04 8355.00
Total 209
@20_4_1ROE_Usage No 134 102.44 13727.50
Yes 71 104.05 7387.50
Total 205
Q20_11QualitativeHurdleRateA
pproach
No 134 105.36 14118.00
Yes 71 98.55 6997.00
Total 205 Test Statisticsa
Q20_1_1MDC_Us
age
Q20_2_1IRR_Usag
e
@20_4_1ROE_Us
age
Q20_11Qualitativ
eHurdleRateAppr
oach
Mann‐Whitney U 3568.000 4137.000 4682.500 4441.000
Wilcoxon W 12613.000 13590.000 13727.500 6997.000
Z ‐3.467 ‐2.387 ‐.351 ‐1.244
Asymp. Sig. (2‐tailed) .001 .017 .726 .214
a. Grouping Variable: Q5_1TRADERDEVIsyourcompanyaTraderDeveloper

AppendixF‐Non‐ParametricTestsofIndependentSamples
MATTHEW MOORHEAD 405
F‐3: Non‐parametric Mann‐Whitney U test of 2‐independent samples of multinational developer type and MDC and qualitative framework hurdle rate usage Descriptive Statistics
N Mean Std. Deviation Minimum Maximum
Q20_1_1MDC_Usage 205 .40 .491 0 1
Q20_10_1MOR_Usage 205 .02 .139 0 1
Q20_11QualitativeHurdleRateA
pproach
205 .16 .364 0 1
Q4_1Multiple_Countires 203 .06 .245 0 1
Ranks Q4_1Multiple_Countires N Mean Rank Sum of Ranks
Q20_1_1MDC_Usage No 190 104.27 19811.50
Yes 13 68.81 894.50
Total 203
Q20_10_1MOR_Usage No 190 102.14 19406.00
Yes 13 100.00 1300.00
Total 203
Q20_11QualitativeHurdleRateA
pproach
No 190 100.42 19080.50
Yes 13 125.04 1625.50
Total 203 Test Statisticsa
Q20_1_1MDC_Us
age
Q20_10_1MOR_U
sage
Q20_11Qualitativ
eHurdleRateAppr
oach
Mann‐Whitney U 803.500 1209.000 935.500
Wilcoxon W 894.500 1300.000 19080.500
Z ‐2.478 ‐.527 ‐2.316
Asymp. Sig. (2‐tailed) .013 .598 .021
a. Grouping Variable: Q4_1Multiple_Countires
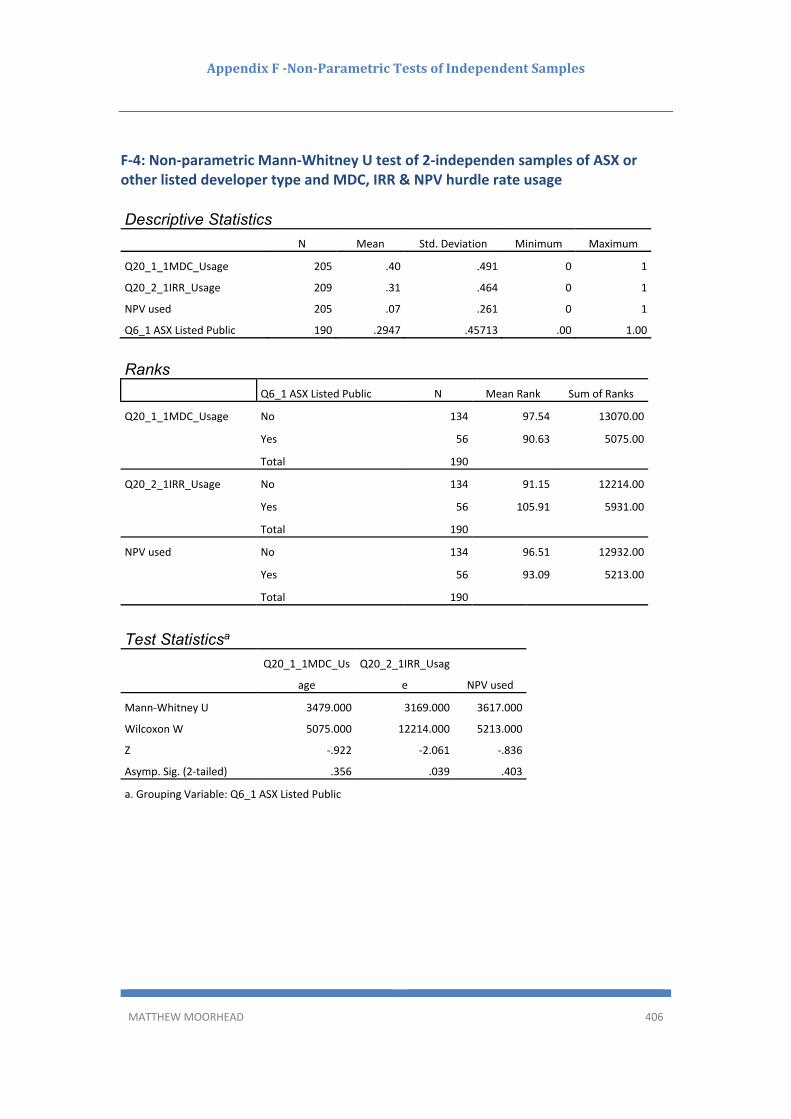
AppendixF‐Non‐ParametricTestsofIndependentSamples
MATTHEW MOORHEAD 406
F‐4: Non‐parametric Mann‐Whitney U test of 2‐independen samples of ASX or other listed developer type and MDC, IRR & NPV hurdle rate usage
Descriptive Statistics
N Mean Std. Deviation Minimum Maximum
Q20_1_1MDC_Usage 205 .40 .491 0 1
Q20_2_1IRR_Usage 209 .31 .464 0 1
NPV used 205 .07 .261 0 1
Q6_1 ASX Listed Public 190 .2947 .45713 .00 1.00
Ranks Q6_1 ASX Listed Public N Mean Rank Sum of Ranks
Q20_1_1MDC_Usage No 134 97.54 13070.00
Yes 56 90.63 5075.00
Total 190
Q20_2_1IRR_Usage No 134 91.15 12214.00
Yes 56 105.91 5931.00
Total 190
NPV used No 134 96.51 12932.00
Yes 56 93.09 5213.00
Total 190
Test Statisticsa
Q20_1_1MDC_Us
age
Q20_2_1IRR_Usag
e NPV used
Mann‐Whitney U 3479.000 3169.000 3617.000
Wilcoxon W 5075.000 12214.000 5213.000
Z ‐.922 ‐2.061 ‐.836
Asymp. Sig. (2‐tailed) .356 .039 .403
a. Grouping Variable: Q6_1 ASX Listed Public

AppendixF‐Non‐ParametricTestsofIndependentSamples
MATTHEW MOORHEAD 407
F‐5: Non‐parametric Mann‐Whitney U test of 2‐independen samples by private company structure developer type and MDC, IRR, ROE & NPV hurdle rate usage as well as decision making processes Q18, Q19, Q221 & Q23 Descriptive Statistics
N Mean Std. Deviation Minimum Maximum
Q18_B_Binary_Consisten_Decis
ion_Methodology
170 .81 .392 0 1
Q19 Company uses specific
hurdle rates
187 .78 .418 0 1
Q20_1_1MDC_Usage 205 .40 .491 0 1
Q20_2_1IRR_Usage 209 .31 .464 0 1
@20_4_1ROE_Usage 205 .10 .304 0 1
NPV used 205 .07 .261 0 1
Q22_1HRALTERRAAltersHurdler
atesonriskanalysisieMa
181 .29 .456 0 1
Q22_3ALTERHRQUALFRAMEAlt
ersHurdleratesonQualitative
181 .09 .285 0 1
Q22_3ALTERHRPLANAltersHurd
leratesonPlanningorGeogra
181 .07 .259 0 1
Q23_1RLVDoesyourcompanyuti
lisetheresiduallandvaluem
178 .74 .439 0 1
Q23_2DCFDoesyourcompanyut
ilisetheDiscountedCashflowM
179 .49 .501 0 1
Q23_3RESACCFLOWDoesyourc
ompanyutilisetheResidualAcc
178 .07 .261 0 1
Q23_4MARKCOMPDoesyourco
mpanyutilisetheMarketCompari
s
177 .07 .262 0 1
Q6_Private_Company 193 .61 .490 0 1
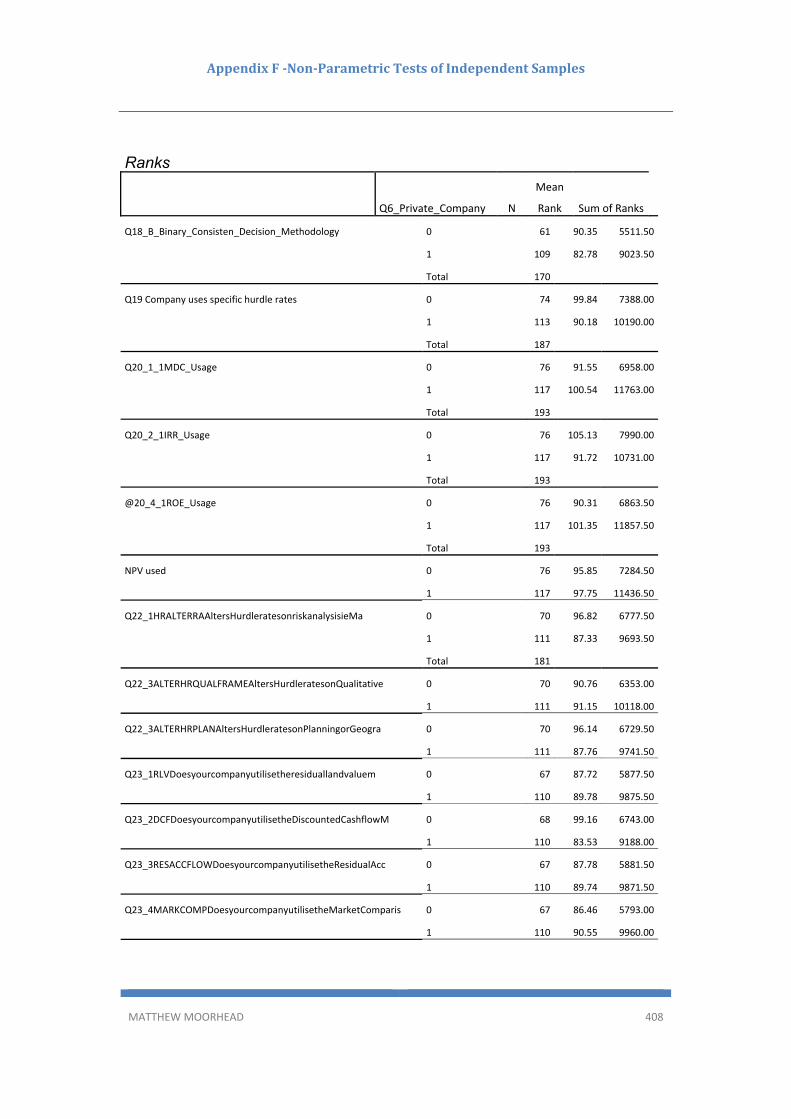
AppendixF‐Non‐ParametricTestsofIndependentSamples
MATTHEW MOORHEAD 408
Ranks
Q6_Private_Company N
Mean
Rank Sum of Ranks
Q18_B_Binary_Consisten_Decision_Methodology 0 61 90.35 5511.50
1 109 82.78 9023.50
Total 170
Q19 Company uses specific hurdle rates 0 74 99.84 7388.00
1 113 90.18 10190.00
Total 187
Q20_1_1MDC_Usage 0 76 91.55 6958.00
1 117 100.54 11763.00
Total 193
Q20_2_1IRR_Usage 0 76 105.13 7990.00
1 117 91.72 10731.00
Total 193
@20_4_1ROE_Usage 0 76 90.31 6863.50
1 117 101.35 11857.50
Total 193
NPV used 0 76 95.85 7284.50
1 117 97.75 11436.50
Q22_1HRALTERRAAltersHurdleratesonriskanalysisieMa 0 70 96.82 6777.50
1 111 87.33 9693.50
Total 181
Q22_3ALTERHRQUALFRAMEAltersHurdleratesonQualitative 0 70 90.76 6353.00
1 111 91.15 10118.00
Q22_3ALTERHRPLANAltersHurdleratesonPlanningorGeogra 0 70 96.14 6729.50
1 111 87.76 9741.50
Q23_1RLVDoesyourcompanyutilisetheresiduallandvaluem 0 67 87.72 5877.50
1 110 89.78 9875.50
Q23_2DCFDoesyourcompanyutilisetheDiscountedCashflowM 0 68 99.16 6743.00
1 110 83.53 9188.00
Q23_3RESACCFLOWDoesyourcompanyutilisetheResidualAcc 0 67 87.78 5881.50
1 110 89.74 9871.50
Q23_4MARKCOMPDoesyourcompanyutilisetheMarketComparis 0 67 86.46 5793.00
1 110 90.55 9960.00

AppendixF‐Non‐ParametricTestsofIndependentSamples
MATTHEW MOORHEAD 409
Test Statisticsa
Q18_B_Bin
ary_Consist
en_Decisio
n_Methodo
logy
Q19
Company
uses
specific
hurdle
rates
Q20_1_1
MDC_Usa
ge
Q20_2
_1IRR_
Usage
@20_4
_1ROE
_Usage
NPV
used
Q22_1HRAL
TERRAAlter
sHurdlerate
sonriskanal
ysisieMa
Q22_3ALTE
RHRQUALF
RAMEAlter
sHurdlerate
sonQualitat
ive
Q22_3ALTE
RHRPLANAl
tersHurdler
atesonPlan
ningorGeog
ra
Q23_1RLVD
oesyourco
mpanyutilis
etheresidu
allandvalue
m
Q23_2DC
FDoesyou
rcompan
yutiliseth
eDiscoun
tedCashfl
owM
Q23_3RE
SACCFLO
WDoesyo
urcompa
nyutiliset
heResidu
alAcc
Q23_4M
ARKCOM
PDoesyou
rcompan
yutiliseth
eMarketC
omparis
Mann‐Whitney
U
3028.500 3749.000 4032.000 3828.0
00
3937.5
00
4358
.500
3477.500 3868.000 3525.500 3599.500 3083.000 3603.500 3515.000
Wilcoxon W 9023.500 10190.000 6958.000 10731.
000
6863.5
00
7284
.500
9693.500 6353.000 9741.500 5877.500 9188.000 5881.500 5793.000
Z ‐1.420 ‐1.651 ‐1.275 ‐1.991 ‐2.487 ‐.49
8
‐1.506 ‐.101 ‐2.342 ‐.343 ‐2.271 ‐.546 ‐1.138
Asymp. Sig. (2‐
tailed)
.156 .099 .202 .046 .013 .619 .132 .920 .019 .732 .023 .585 .255
a. Grouping Variable: Q6_Private_Company

AppendixF‐Non‐ParametricTestsofIndependentSamples
MATTHEW MOORHEAD 410
F‐6: Non‐parametric Mann‐Whitney U test of 2‐independent samples by use of Margin on Revenue and publicly listed company Descriptive Statistics
N Mean Std. Deviation Minimum Maximum
Q20_10_1MOR_Usage 205 .02 .139 0 1
Q6_1 ASX Listed Public 190 .2947 .45713 .00 1.00
Ranks Q6_1 ASX Listed Public N Mean Rank Sum of Ranks
Q20_10_1MOR_Usage No 134 94.21 12624.00
Yes 56 98.59 5521.00
Total 190
Test Statisticsa
Q20_10_1MOR_U
sage
Mann‐Whitney U 3579.000
Wilcoxon W 12624.000
Z ‐2.013
Asymp. Sig. (2‐tailed) .044
a. Grouping Variable: Q6_1 ASX Listed Public
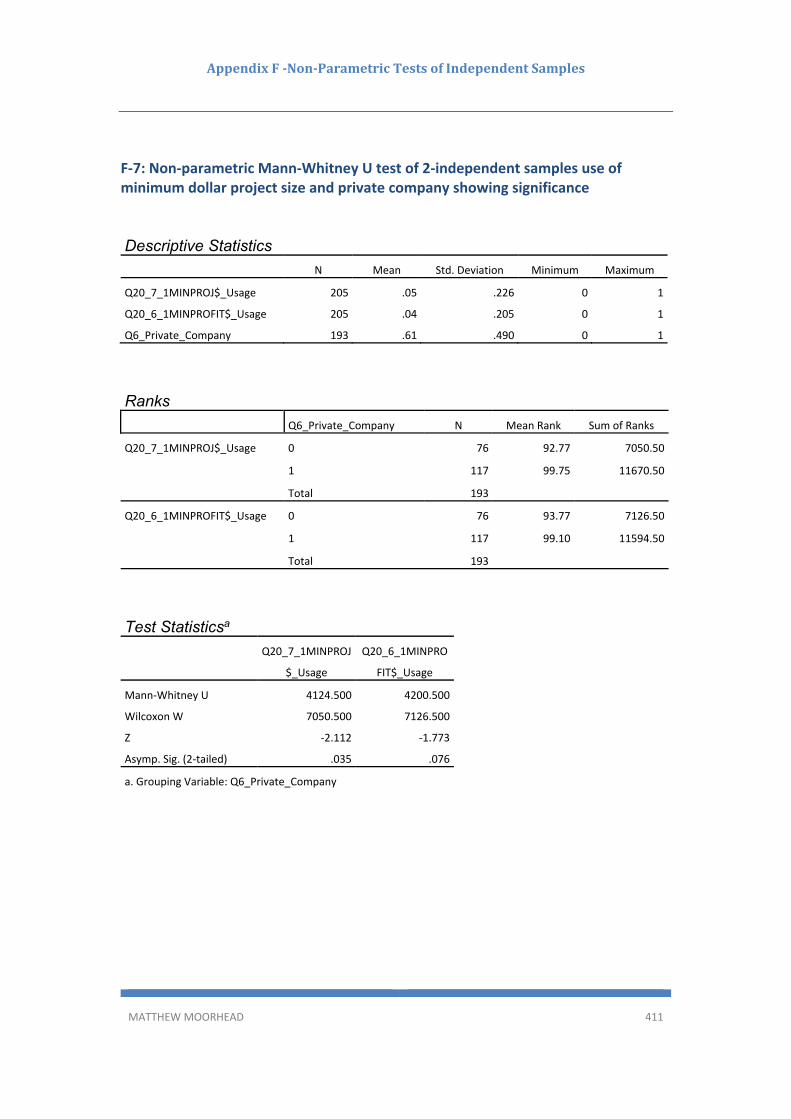
AppendixF‐Non‐ParametricTestsofIndependentSamples
MATTHEW MOORHEAD 411
F‐7: Non‐parametric Mann‐Whitney U test of 2‐independent samples use of minimum dollar project size and private company showing significance
Descriptive Statistics
N Mean Std. Deviation Minimum Maximum
Q20_7_1MINPROJ$_Usage 205 .05 .226 0 1
Q20_6_1MINPROFIT$_Usage 205 .04 .205 0 1
Q6_Private_Company 193 .61 .490 0 1
Ranks Q6_Private_Company N Mean Rank Sum of Ranks
Q20_7_1MINPROJ$_Usage 0 76 92.77 7050.50
1 117 99.75 11670.50
Total 193
Q20_6_1MINPROFIT$_Usage 0 76 93.77 7126.50
1 117 99.10 11594.50
Total 193
Test Statisticsa
Q20_7_1MINPROJ
$_Usage
Q20_6_1MINPRO
FIT$_Usage
Mann‐Whitney U 4124.500 4200.500
Wilcoxon W 7050.500 7126.500
Z ‐2.112 ‐1.773
Asymp. Sig. (2‐tailed) .035 .076
a. Grouping Variable: Q6_Private_Company

AppendixF‐Non‐ParametricTestsofIndependentSamples
MATTHEW MOORHEAD 412
F‐8: Non‐parametric Mann‐Whitney U test of 2‐independent samples by use of bespoke feasibility program versus survey variables
Variable Tested
Mann‐Whintey U
Score Z ‐ Score p ‐ vlaue Median Value Vs Median of Null n = r = Result Sig %
Private Company Structure 398.00 ‐3.105 0.002 0.11 0.63 9 0.224 Less likely to use 95%
Large Project Developer Size 447.00 ‐1.978 0.048 0.88 0.52 8 0.147 More likely to use 95%
Trader Developer 648.00 ‐2.096 0.036 0.00 0.33 9 0.143 Less likely to use 95%
Tourist Developer 787.50 ‐2.841 0.004 0.22 0.03 9 0.189 More likely to use 95%
Publicly Listed 306.50 ‐3.995 0.000 0.89 0.27 9 0.290 More likely to use 95%
Use of IRR hurdle rate 565.50 ‐2.351 0.019 0.67 0.30 9 0.163 More likely to use 95%
Alters HR on Planning/Geo basis 473.50 ‐2.229 0.026 0.29 0.06 7 0.166 More likely to use 95%
Uses DCF Methodology 373.00 ‐1.968 0.049 0.56 0.48 7 0.147 More likely to use 95%
Years of Experience 530.00 ‐1.788 0.074 3.38 2.52 9 0.130 Use increases w/ years 90%
Use specific Go/No‐Go Decision 567.00 ‐1.921 0.055 1.00 0.70 9 0.136 More likely to use 94.5%
Has mechanism for HR Altering 405.00 ‐1.775 0.076 0.71 0.38 7 0.132 More likely to use 90%
Alters HR based on Risk 432.50 ‐1.648 0.099 0.57 0.28 7 0.122 More likely to use 90%
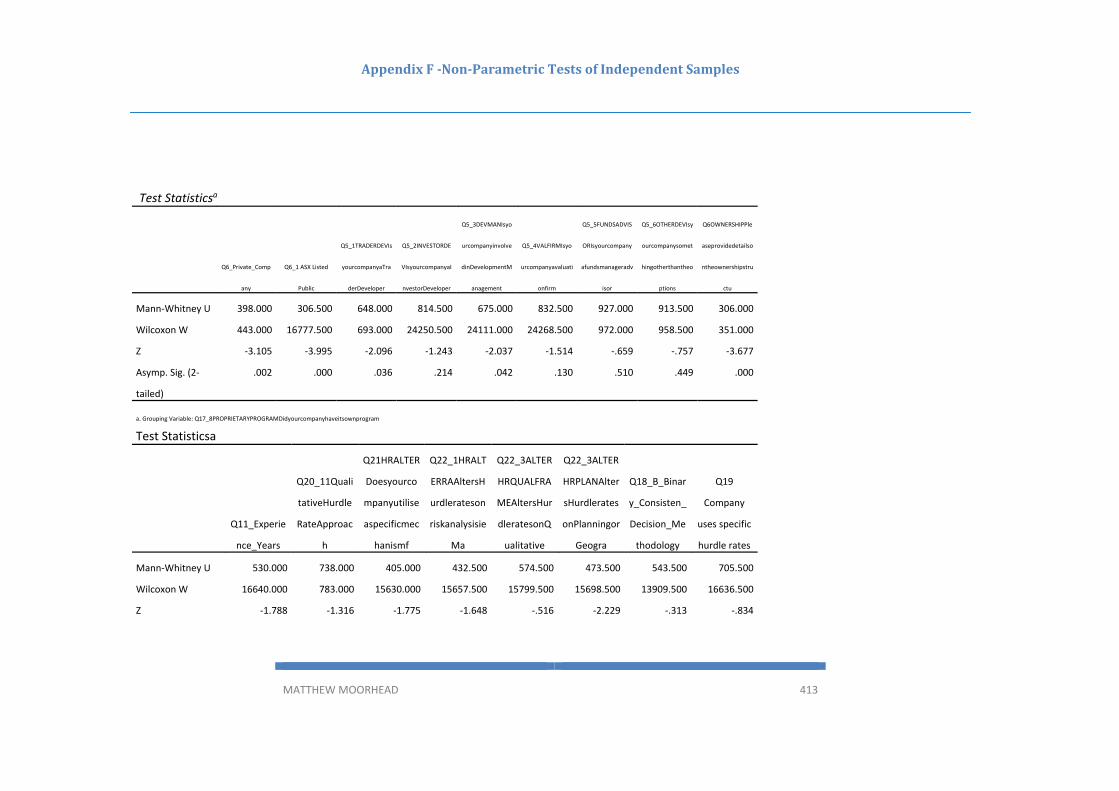
AppendixF‐Non‐ParametricTestsofIndependentSamples
MATTHEW MOORHEAD 413
Test Statisticsa
Q6_Private_Comp
any
Q6_1 ASX Listed
Public
Q5_1TRADERDEVIs
yourcompanyaTra
derDeveloper
Q5_2INVESTORDE
VIsyourcompanyaI
nvestorDeveloper
Q5_3DEVMANIsyo
urcompanyinvolve
dinDevelopmentM
anagement
Q5_4VALFIRMIsyo
urcompanyavaluati
onfirm
Q5_5FUNDSADVIS
ORIsyourcompany
afundsmanageradv
isor
Q5_6OTHERDEVIsy
ourcompanysomet
hingotherthantheo
ptions
Q6OWNERSHIPPle
aseprovidedetailso
ntheownershipstru
ctu
Mann‐Whitney U 398.000 306.500 648.000 814.500 675.000 832.500 927.000 913.500 306.000
Wilcoxon W 443.000 16777.500 693.000 24250.500 24111.000 24268.500 972.000 958.500 351.000
Z ‐3.105 ‐3.995 ‐2.096 ‐1.243 ‐2.037 ‐1.514 ‐.659 ‐.757 ‐3.677
Asymp. Sig. (2‐
tailed)
.002 .000 .036 .214 .042 .130 .510 .449 .000
a. Grouping Variable: Q17_8PROPRIETARYPROGRAMDidyourcompanyhaveitsownprogram
Test Statisticsa
Q11_Experie
nce_Years
Q20_11Quali
tativeHurdle
RateApproac
h
Q21HRALTER
Doesyourco
mpanyutilise
aspecificmec
hanismf
Q22_1HRALT
ERRAAltersH
urdlerateson
riskanalysisie
Ma
Q22_3ALTER
HRQUALFRA
MEAltersHur
dleratesonQ
ualitative
Q22_3ALTER
HRPLANAlter
sHurdlerates
onPlanningor
Geogra
Q18_B_Binar
y_Consisten_
Decision_Me
thodology
Q19
Company
uses specific
hurdle rates
Mann‐Whitney U 530.000 738.000 405.000 432.500 574.500 473.500 543.500 705.500
Wilcoxon W 16640.000 783.000 15630.000 15657.500 15799.500 15698.500 13909.500 16636.500
Z ‐1.788 ‐1.316 ‐1.775 ‐1.648 ‐.516 ‐2.229 ‐.313 ‐.834
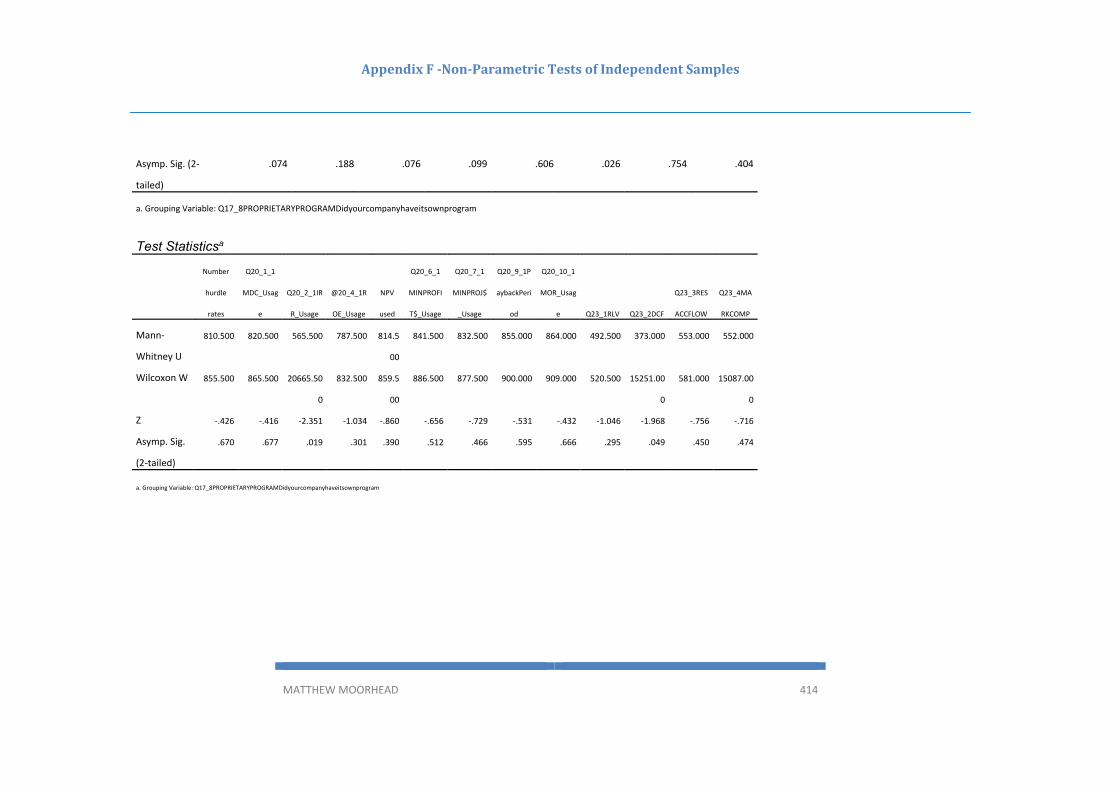
AppendixF‐Non‐ParametricTestsofIndependentSamples
MATTHEW MOORHEAD 414
Asymp. Sig. (2‐
tailed)
.074 .188 .076 .099 .606 .026 .754 .404
a. Grouping Variable: Q17_8PROPRIETARYPROGRAMDidyourcompanyhaveitsownprogram
Test Statisticsa
Number
hurdle
rates
Q20_1_1
MDC_Usag
e
Q20_2_1IR
R_Usage
@20_4_1R
OE_Usage
NPV
used
Q20_6_1
MINPROFI
T$_Usage
Q20_7_1
MINPROJ$
_Usage
Q20_9_1P
aybackPeri
od
Q20_10_1
MOR_Usag
e Q23_1RLV Q23_2DCF
Q23_3RES
ACCFLOW
Q23_4MA
RKCOMP
Mann‐
Whitney U
810.500 820.500 565.500 787.500 814.5
00
841.500 832.500 855.000 864.000 492.500 373.000 553.000 552.000
Wilcoxon W 855.500 865.500 20665.50
0
832.500 859.5
00
886.500 877.500 900.000 909.000 520.500 15251.00
0
581.000 15087.00
0
Z ‐.426 ‐.416 ‐2.351 ‐1.034 ‐.860 ‐.656 ‐.729 ‐.531 ‐.432 ‐1.046 ‐1.968 ‐.756 ‐.716
Asymp. Sig.
(2‐tailed)
.670 .677 .019 .301 .390 .512 .466 .595 .666 .295 .049 .450 .474
a. Grouping Variable: Q17_8PROPRIETARYPROGRAMDidyourcompanyhaveitsownprogram

AppendixF‐Non‐ParametricTestsofIndependentSamples
MATTHEW MOORHEAD 415
Ranks
Q17_BESPOKE FEASIBILITY PROGRAM N Mean Rank Sum of Ranks
Q6_Private_Company No 184 99.34 18278.00
Yes 9 49.22 443.00
Total 193
Q6_1 ASX Listed Public No 181 92.69 16777.50
Yes 9 151.94 1367.50
Total 190
Q5_1TRADERDEVIsyourcompanyaTrad
erDeveloper
No 216 114.50 24732.00
Yes 9 77.00 693.00
Total 225
Q5_2INVESTORDEVIsyourcompanyaIn
vestorDeveloper
No 216 112.27 24250.50
Yes 9 130.50 1174.50
Total 225
Q5_3DEVMANIsyourcompanyinvolvedi
nDevelopmentManagement
No 216 111.63 24111.00
Yes 9 146.00 1314.00
Total 225
Q5_4VALFIRMIsyourcompanyavaluatio
nfirm
No 216 112.35 24268.50
Yes 9 128.50 1156.50
Total 225
Q5_5FUNDSADVISORIsyourcompanyaf
undsmanageradvisor
No 216 113.21 24453.00
Yes 9 108.00 972.00
Total 225
Q5_6OTHERDEVIsyourcompanysomet
hingotherthantheoptions
No 216 113.27 24466.50
Yes 9 106.50 958.50
Total 225
Q6OWNERSHIPPleaseprovidedetailson
theownershipstructu
No 184 99.84 18370.00
Yes 9 39.00 351.00
Total 193

AppendixF‐Non‐ParametricTestsofIndependentSamples
MATTHEW MOORHEAD 416
Ranks Q17_BESPOKE FEASIBILITY PROGRAM N Mean Rank Sum of Ranks
Q11_Experience_Years No 179 92.96 16640.00
Yes 9 125.11 1126.00
Total 188
Q20_11QualitativeHurdleRateA
pproach
No 196 103.73 20332.00
Yes 9 87.00 783.00
Total 205
Q21HRALTERDoesyourcompany
utiliseaspecificmechanismf
No 174 89.83 15630.00
Yes 7 120.14 841.00
Total 181
Q22_1HRALTERRAAltersHurdler
atesonriskanalysisieMa
No 174 89.99 15657.50
Yes 7 116.21 813.50
Total 181
Q22_3ALTERHRQUALFRAMEAlt
ersHurdleratesonQualitative
No 174 90.80 15799.50
Yes 7 95.93 671.50
Total 181
Q22_3ALTERHRPLANAltersHurd
leratesonPlanningorGeogra
No 174 90.22 15698.50
Yes 7 110.36 772.50
Total 181
Q18_B_Binary_Consisten_Decis
ion_Methodology
No 163 85.33 13909.50
Yes 7 89.36 625.50
Total 170
Q19 Company uses specific
hurdle rates
No 178 93.46 16636.50
Yes 9 104.61 941.50
Total 187
Ranks Q17_BESPOKE FEASIBILITY PROGRAM N Mean Rank Sum of Ranks
Number of specific hurdle rates No 196 103.36 20259.50
Yes 9 95.06 855.50
Total 205
Q20_1_1MDC_Usage No 196 103.31 20249.50
Yes 9 96.17 865.50

AppendixF‐Non‐ParametricTestsofIndependentSamples
MATTHEW MOORHEAD 417
Total 205
Q20_2_1IRR_Usage No 200 103.33 20665.50
Yes 9 142.17 1279.50
Total 209
@20_4_1ROE_Usage No 196 103.48 20282.50
Yes 9 92.50 832.50
Total 205
NPV used No 196 103.34 20255.50
Yes 9 95.50 859.50
Total 205
Q20_6_1MINPROFIT$_Usage No 196 103.21 20228.50
Yes 9 98.50 886.50
Total 205
Q20_7_1MINPROJ$_Usage No 196 103.25 20237.50
Yes 9 97.50 877.50
Total 205
Q20_9_1PaybackPeriodYears_Usage No 196 103.14 20215.00
Yes 9 100.00 900.00
Total 205
Q20_10_1MOR_Usage No 196 103.09 20206.00
Yes 9 101.00 909.00
Total 205
Q23_1RLVDoesyourcompanyutilisetheresidualla
ndvaluem
No 171 90.12 15410.50
Yes 7 74.36 520.50
Total 178
Q23_2DCFDoesyourcompanyutilisetheDiscount
edCashflowM
No 172 88.67 15251.00
Yes 7 122.71 859.00
Total 179
Q23_3RESACCFLOWDoesyourcompanyutiliseth
eResidualAcc
No 171 89.77 15350.00
Yes 7 83.00 581.00
Total 178
Q23_4MARKCOMPDoesyourcompanyutilisethe
MarketComparis
No 170 88.75 15087.00
Yes 7 95.14 666.00
Total 177
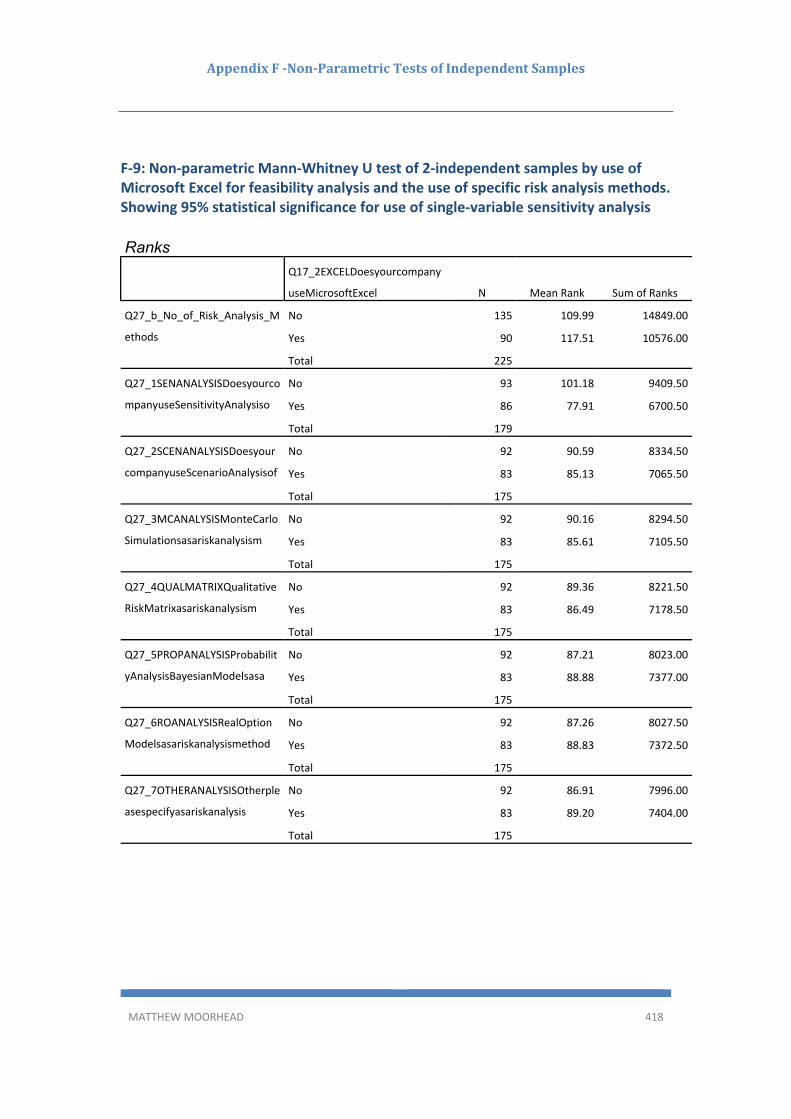
AppendixF‐Non‐ParametricTestsofIndependentSamples
MATTHEW MOORHEAD 418
F‐9: Non‐parametric Mann‐Whitney U test of 2‐independent samples by use of Microsoft Excel for feasibility analysis and the use of specific risk analysis methods. Showing 95% statistical significance for use of single‐variable sensitivity analysis Ranks Q17_2EXCELDoesyourcompany
useMicrosoftExcel N Mean Rank Sum of Ranks
Q27_b_No_of_Risk_Analysis_M
ethods
No 135 109.99 14849.00
Yes 90 117.51 10576.00
Total 225
Q27_1SENANALYSISDoesyourco
mpanyuseSensitivityAnalysiso
No 93 101.18 9409.50
Yes 86 77.91 6700.50
Total 179
Q27_2SCENANALYSISDoesyour
companyuseScenarioAnalysisof
No 92 90.59 8334.50
Yes 83 85.13 7065.50
Total 175
Q27_3MCANALYSISMonteCarlo
Simulationsasariskanalysism
No 92 90.16 8294.50
Yes 83 85.61 7105.50
Total 175
Q27_4QUALMATRIXQualitative
RiskMatrixasariskanalysism
No 92 89.36 8221.50
Yes 83 86.49 7178.50
Total 175
Q27_5PROPANALYSISProbabilit
yAnalysisBayesianModelsasa
No 92 87.21 8023.00
Yes 83 88.88 7377.00
Total 175
Q27_6ROANALYSISRealOption
Modelsasariskanalysismethod
No 92 87.26 8027.50
Yes 83 88.83 7372.50
Total 175
Q27_7OTHERANALYSISOtherple
asespecifyasariskanalysis
No 92 86.91 7996.00
Yes 83 89.20 7404.00
Total 175

AppendixF‐Non‐ParametricTestsofIndependentSamples
MATTHEW MOORHEAD 419
Test Statisticsa
Q27_b_No_o
f_Risk_Analy
sis_Methods
Q27_1SENAN
ALYSISDoesy
ourcompany
useSensitivit
yAnalysiso
Q27_2SCENA
NALYSISDoes
yourcompan
yuseScenario
Analysisof
Q27_3MCAN
ALYSISMonte
CarloSimulati
onsasariskan
alysism
Q27_4QUAL
MATRIXQuali
tativeRiskMa
trixasariskan
alysism
Q27_5PROP
ANALYSISPro
babilityAnaly
sisBayesianM
odelsasa
Q27_6ROAN
ALYSISRealO
ptionModels
asariskanalys
ismethod
Q27_7OTHER
ANALYSISOth
erpleasespec
ifyasariskanal
ysis
Mann‐Whitney U 5669.000 2959.500 3579.500 3619.500 3692.500 3745.000 3749.500 3718.000
Wilcoxon W 14849.000 6700.500 7065.500 7105.500 7178.500 8023.000 8027.500 7996.000
Z ‐.905 ‐3.719 ‐.842 ‐1.550 ‐.653 ‐.480 ‐.487 ‐.493
Asymp. Sig. (2‐
tailed)
.366 .000 .400 .121 .514 .631 .626 .622
a. Grouping Variable: Q17_2EXCELDoesyourcompanyuseMicrosoftExcel
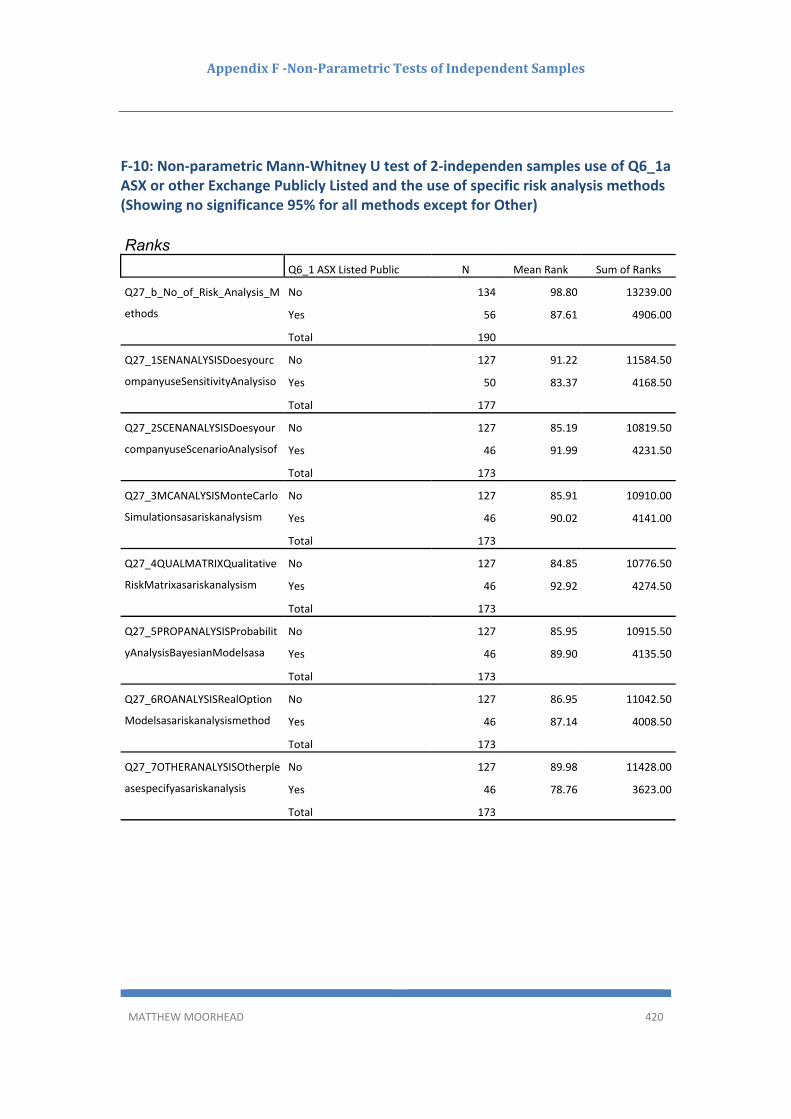
AppendixF‐Non‐ParametricTestsofIndependentSamples
MATTHEW MOORHEAD 420
F‐10: Non‐parametric Mann‐Whitney U test of 2‐independen samples use of Q6_1a ASX or other Exchange Publicly Listed and the use of specific risk analysis methods (Showing no significance 95% for all methods except for Other) Ranks Q6_1 ASX Listed Public N Mean Rank Sum of Ranks
Q27_b_No_of_Risk_Analysis_M
ethods
No 134 98.80 13239.00
Yes 56 87.61 4906.00
Total 190
Q27_1SENANALYSISDoesyourc
ompanyuseSensitivityAnalysiso
No 127 91.22 11584.50
Yes 50 83.37 4168.50
Total 177
Q27_2SCENANALYSISDoesyour
companyuseScenarioAnalysisof
No 127 85.19 10819.50
Yes 46 91.99 4231.50
Total 173
Q27_3MCANALYSISMonteCarlo
Simulationsasariskanalysism
No 127 85.91 10910.00
Yes 46 90.02 4141.00
Total 173
Q27_4QUALMATRIXQualitative
RiskMatrixasariskanalysism
No 127 84.85 10776.50
Yes 46 92.92 4274.50
Total 173
Q27_5PROPANALYSISProbabilit
yAnalysisBayesianModelsasa
No 127 85.95 10915.50
Yes 46 89.90 4135.50
Total 173
Q27_6ROANALYSISRealOption
Modelsasariskanalysismethod
No 127 86.95 11042.50
Yes 46 87.14 4008.50
Total 173
Q27_7OTHERANALYSISOtherple
asespecifyasariskanalysis
No 127 89.98 11428.00
Yes 46 78.76 3623.00
Total 173

AppendixF‐Non‐ParametricTestsofIndependentSamples
MATTHEW MOORHEAD 421

AppendixF‐Non‐ParametricTestsofIndependentSamples
MATTHEW MOORHEAD 422
Test Statisticsa
Q27_b_No_of_Risk_A
nalysis_Methods
Q27_1SENANALYSISD
oesyourcompanyuseS
ensitivityAnalysiso
Q27_2SCENANALYSIS
Doesyourcompanyus
eScenarioAnalysisof
Q27_3MCANALYSISM
onteCarloSimulations
asariskanalysism
Q27_4QUALMATRIXQ
ualitativeRiskMatrixas
ariskanalysism
Q27_5PROPANALYSIS
ProbabilityAnalysisBa
yesianModelsasa
Q27_6ROANALYSISRe
alOptionModelsasaris
kanalysismethod
Q27_7OTHERANAL
YSISOtherpleasespe
cifyasariskanalysis
Mann‐Whitney U 3310.000 2893.500 2691.500 2782.000 2648.500 2787.500 2914.500 2542.000
Wilcoxon W 4906.000 4168.500 10819.500 10910.000 10776.500 10915.500 11042.500 3623.000
Z ‐1.408 ‐1.139 ‐.930 ‐1.242 ‐1.622 ‐1.005 ‐.053 ‐2.175
Asymp. Sig. (2‐
tailed)
.159 .255 .353 .214 .105 .315 .958 .030
a. Grouping Variable: Q6_1 ASX Listed Public

AppendixF‐Non‐ParametricTestsofIndependentSamples
MATTHEW MOORHEAD 423
F‐11: Non‐parametric Mann‐Whitney U test of 2‐independent samples by use of Q18_B binary consistent decision‐making methodology and the use of specific risk analysis methods (Showing no significance 95%) Descriptive Statistics
N Mean Std. Deviation Minimum Maximum
Q27_b_No_of_Risk_Analysis_M
ethods
225 1.20 .893 0 5
Q27_1SENANALYSISDoesyourc
ompanyuseSensitivityAnalysiso
179 .68 .467 0 1
Q27_2SCENANALYSISDoesyour
companyuseScenarioAnalysisof
175 .39 .490 0 1
Q27_3MCANALYSISMonteCarlo
Simulationsasariskanalysism
175 .05 .222 0 1
Q27_4QUALMATRIXQualitative
RiskMatrixasariskanalysism
175 .13 .332 0 1
Q27_5PROPANALYSISProbabilit
yAnalysisBayesianModelsasa
175 .07 .263 0 1
Q27_6ROANALYSISRealOption
Modelsasariskanalysismethod
175 .06 .243 0 1
Q27_7OTHERANALYSISOtherpl
easespecifyasariskanalysis
175 .14 .351 0 1
Q18_B_Binary_Consisten_Decis
ion_Methodology
170 .81 .392 0 1
Ranks Q18_B_Binary_Consisten_Decis
ion_Methodology N Mean Rank Sum of Ranks
Q27_b_No_of_Risk_Analysis_M
ethods
Disagree or Strongly Disagree 32 80.97 2591.00
Strongly Agree or Agree 138 86.55 11944.00
Total 170
Q27_1SENANALYSISDoesyourco
mpanyuseSensitivityAnalysiso
Disagree or Strongly Disagree 32 83.09 2659.00
Strongly Agree or Agree 137 85.45 11706.00
Total 169
Disagree or Strongly Disagree 32 81.72 2615.00

AppendixF‐Non‐ParametricTestsofIndependentSamples
MATTHEW MOORHEAD 424
Q27_2SCENANALYSISDoesyour
companyuseScenarioAnalysisof
Strongly Agree or Agree 138 86.38 11920.00
Total 170
Q27_3MCANALYSISMonteCarlo
Simulationsasariskanalysism
Disagree or Strongly Disagree 32 83.66 2677.00
Strongly Agree or Agree 138 85.93 11858.00
Total 170
Q27_4QUALMATRIXQualitative
RiskMatrixasariskanalysism
Disagree or Strongly Disagree 32 85.13 2724.00
Strongly Agree or Agree 138 85.59 11811.00
Total 170
Q27_5PROPANALYSISProbabilit
yAnalysisBayesianModelsasa
Disagree or Strongly Disagree 32 84.81 2714.00
Strongly Agree or Agree 138 85.66 11821.00
Total 170
Q27_6ROANALYSISRealOption
Modelsasariskanalysismethod
Disagree or Strongly Disagree 32 87.97 2815.00
Strongly Agree or Agree 138 84.93 11720.00
Total 170
Q27_7OTHERANALYSISOtherple
asespecifyasariskanalysis
Disagree or Strongly Disagree 32 89.44 2862.00
Strongly Agree or Agree 138 84.59 11673.00
Total 170
Test Statisticsa
Q27_b_No_o
f_Risk_Analy
sis_Methods
Q27_1SENAN
ALYSISDoesy
ourcompany
useSensitivit
yAnalysiso
Q27_2SCENA
NALYSISDoes
yourcompan
yuseScenario
Analysisof
Q27_3MCAN
ALYSISMonte
CarloSimulati
onsasariskan
alysism
Q27_4QUAL
MATRIXQuali
tativeRiskMa
trixasariskan
alysism
Q27_5PROP
ANALYSISPro
babilityAnaly
sisBayesianM
odelsasa
Q27_6ROAN
ALYSISRealO
ptionModels
asariskanalys
ismethod
Q27_7OTHER
ANALYSISOth
erpleasespec
ifyasariskanal
ysis
Mann‐Whitney U 2063.000 2131.000 2087.000 2149.000 2196.000 2186.000 2129.000 2082.000
Wilcoxon W 2591.000 2659.000 2615.000 2677.000 2724.000 2714.000 11720.000 11673.000
Z ‐.656 ‐.311 ‐.571 ‐.606 ‐.082 ‐.198 ‐.739 ‐.833
Asymp. Sig. (2‐
tailed)
.512 .755 .568 .544 .934 .843 .460 .405
a. Grouping Variable: Q18_B_Binary_Consisten_Decision_Methodology

AppendixF‐Non‐ParametricTestsofIndependentSamples
MATTHEW MOORHEAD 425
F‐12: Non‐parametric Kruskal‐Wallace H test of 2‐independent samples by use of Q11 experience levels and go/no‐go decision basis as well as usage of MDC, IRR and ROE hurdle rates.
(Showing no significance at the 95% level)
Test Statisticsa,b
Q18GONOGODECISION
Q19 SPECIFIC HURDLE RATE
USED Q20_1_1MDC_Usage
Q20_2_1IRR_Usage
@20_4_1ROE_Usage
Kruskal‐Wallis H 4.383 0.423 1.435 1.634 0.779
df 3 3 3 3 3
Asymp. Sig. 0.223 0.935 0.697 0.652 0.855
a. Kruskal Wallis Test
b. Grouping Variable: Q11_Experience_Years
Descriptive Statistics
N Mean Std.
Deviation Minimum Maximum
Q18GONOGODECISIONDoesyourcompanyuseaspecificquan
188 0.72 0.451 0 1
Q19HURDLERATEUSEDoesyourcompanyincorporatespecificf
187 0.78 0.418 0 1
Q20_1_1MDC_Usage 205 0.40 0.491 0 1
Q20_2_1IRR_Usage 209 0.31 0.464 0 1
@20_4_1ROE_Usage 205 0.10 0.304 0 1
Q11_Experience_Years 188 2.56 1.129 1 4

AppendixF‐Non‐ParametricTestsofIndependentSamples
MATTHEW MOORHEAD 426
Ranks
Q11_Experience_Years N Mean Rank Q18GONOGODECISION 1 ‐ 2 years experience 43 86.02
2 ‐ 5 years experience 49 97.98 5 ‐ 10 years experience 43 103.51 10+ years experience 53 90.85 Total 188
Q19SPECIFIC HURDLE RATES USED
1 ‐ 2 years experience 43 93.26 2 ‐ 5 years experience 49 95.92 5 ‐ 10 years experience 43 91.08
10+ years experience 52 95.22
Total 187 Q20_1_1MDC_Usage 1 ‐ 2 years experience 43 88.48
2 ‐ 5 years experience 49 95.70 5 ‐ 10 years experience 43 92.85 10+ years experience 53 99.61 Total 188
Q20_2_1IRR_Usage 1 ‐ 2 years experience 43 90.42 2 ‐ 5 years experience 49 92.69 5 ‐ 10 years experience 43 92.60 10+ years experience 53 101.02 Total 188
@20_4_1ROE_Usage 1 ‐ 2 years experience 43 92.74 2 ‐ 5 years experience 49 97.43 5 ‐ 10 years experience 43 92.74 10+ years experience 53 94.64 Total 188

AppendixF‐Non‐ParametricTestsofIndependentSamples
MATTHEW MOORHEAD 427
F‐13: Non‐parametric Mann‐Whitney U test of 2‐independent samples between developer typologies and risk tolerance perception score. (Showing association at 95% significance)
Mann-Whitney Test
Descriptive Statistics
N Mean Std. Deviation Minimum Maximum
Q31 b Risk Tolerance Perception 171 ‐.16 .717 ‐1 1
Q5_1TRADERDEVIsyourcompanya
TraderDeveloper
225 .32 .468 0 1
Ranks Q5_1TRADERDEVIsyourco
mpanyaTraderDeveloper N Mean Rank Sum of Ranks
Q31 b Risk Tolerance Perception No 107 79.98 8558.00
Yes 64 96.06 6148.00
Total 171
Test Statisticsa
Q31 b Risk Tolerance Perception
Mann‐Whitney U 2780.000
Wilcoxon W 8558.000
Z ‐2.227
Asymp. Sig. (2‐tailed) .026

AppendixF‐Non‐ParametricTestsofIndependentSamples
MATTHEW MOORHEAD 428
a. Grouping Variable: Q5_1TRADERDEVIsyourcompanyaTraderDeveloper
F‐14: Non‐parametric Mann‐Whitney U test of 2‐independent samples between developers who use the RLV method, DCF method, RAC method and market comparison method and years’ experience (Showing association at 95% significance for RLV) Report Q11_Experience_Years
Q23_1RLVDoesyourcompanyuti
lisetheresiduallandvaluem N Median
No 45 2.00
Yes 132 3.00
Total 177 3.00
Descriptive Statistics
N Mean Std. Deviation Minimum Maximum
Q11_Experience_Years 188 2.56 1.129 1 4
Q23_1RLVDoesyourcompanyuti
lisetheresiduallandvaluem
178 .74 .439 0 1
Ranks Q23_1RLVDoesyourcompanyuti
lisetheresiduallandvaluem N Mean Rank Sum of Ranks
Q11_Experience_Years No 45 72.41 3258.50
Yes 132 94.66 12494.50
Total 177 Test Statisticsa

AppendixF‐Non‐ParametricTestsofIndependentSamples
MATTHEW MOORHEAD 429
Q11_Experience_
Years
Mann‐Whitney U 2223.500
Wilcoxon W 3258.500
Z ‐2.599
Asymp. Sig. (2‐tailed) .009
a. Grouping Variable:
Q23_1RLVDoesyourcompanyutilisetheresidual
landvaluem
Descriptive Statistics
N Mean Std. Deviation Minimum Maximum
Q11_Experience_Years 188 2.56 1.129 1 4
Q23_2DCFDoesyourcompanyut
ilisetheDiscountedCashflowM
179 .49 .501 0 1
Ranks Q23_2DCFDoesyourcompanyut
ilisetheDiscountedCashflowM N Mean Rank Sum of Ranks
Q11_Experience_Years No 90 86.73 7806.00
Yes 88 92.33 8125.00
Total 178 Test Statisticsa
Q11_Experience_
Years
Mann‐Whitney U 3711.000
Wilcoxon W 7806.000
Z ‐.749
Asymp. Sig. (2‐tailed) .454
a. Grouping Variable:
Q23_2DCFDoesyourcompanyutilisetheDiscoun
tedCashflowM
Descriptive Statistics
N Mean Std. Deviation Minimum Maximum

AppendixF‐Non‐ParametricTestsofIndependentSamples
MATTHEW MOORHEAD 430
Q11_Experience_Years 188 2.56 1.129 1 4
Q23_3RESACCFLOWDoesyourc
ompanyutilisetheResidualAcc
178 .07 .261 0 1
Ranks Q23_3RESACCFLOWDoesyourc
ompanyutilisetheResidualAcc N Mean Rank Sum of Ranks
Q11_Experience_Years No 164 89.87 14738.00
Yes 13 78.08 1015.00
Total 177
Test Statisticsa
Q11_Experience_
Years
Mann‐Whitney U 924.000
Wilcoxon W 1015.000
Z ‐.825
Asymp. Sig. (2‐tailed) .409
a. Grouping Variable:
Q23_3RESACCFLOWDoesyourcompanyutiliset
heResidualAcc
Descriptive Statistics
N Mean Std. Deviation Minimum Maximum
Q11_Experience_Years 188 2.56 1.129 1 4
Q23_4MARKCOMPDoesyourcomp
anyutilisetheMarketComparis
177 .07 .262 0 1
Ranks Q23_4MARKCOMPDoesyourco
mpanyutilisetheMarketCompar
is N Mean Rank Sum of Ranks
Q11_Experience_Years No 164 89.61 14695.50
Yes 13 81.35 1057.50
Total 177 Test Statisticsa

AppendixF‐Non‐ParametricTestsofIndependentSamples
MATTHEW MOORHEAD 431
Q11_Experience_
Years
Mann‐Whitney U 966.500
Wilcoxon W 1057.500
Z ‐.578
Asymp. Sig. (2‐tailed) .563
a. Grouping Variable:
Q23_4MARKCOMPDoesyourcompanyutiliseth
eMarketComparis
\
F‐15: Kruskal‐Wallace Test for categories of experience and independent variables
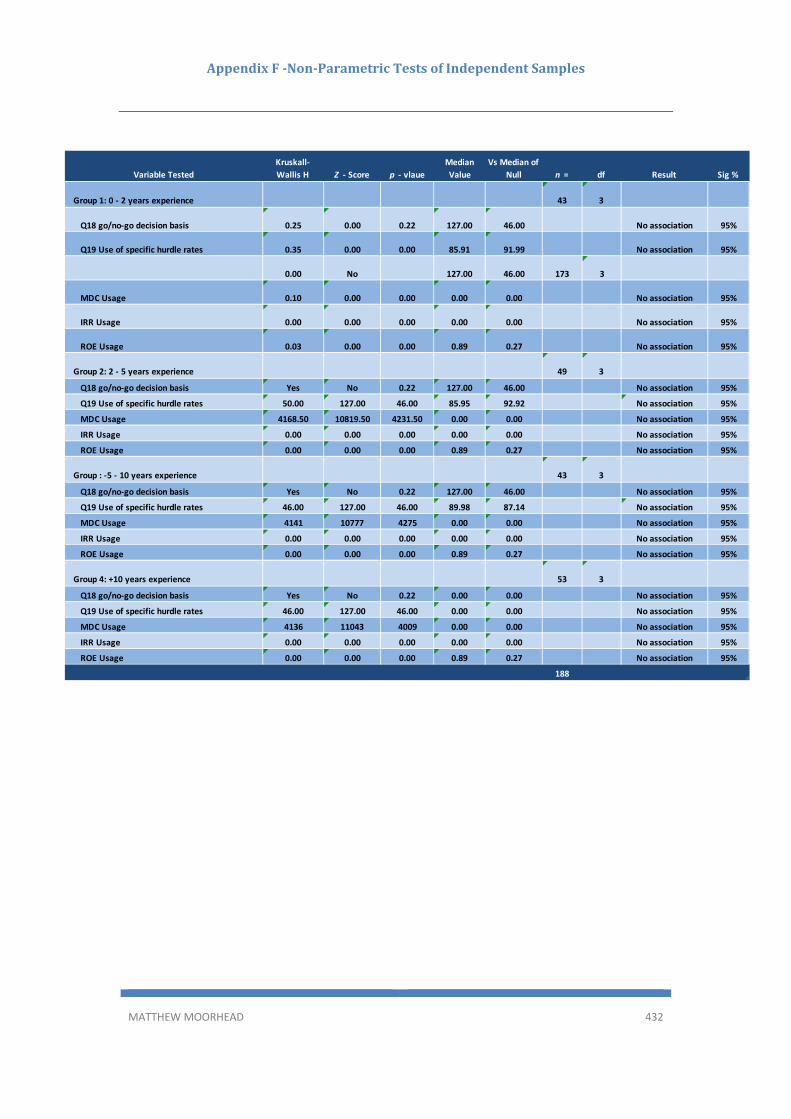
AppendixF‐Non‐ParametricTestsofIndependentSamples
MATTHEW MOORHEAD 432
Variable Tested
Kruskall‐
Wallis H Z ‐ Score p ‐ vlaue
Median
Value
Vs Median of
Null n = df Result Sig %
Group 1: 0 ‐ 2 years experience 43 3
Q18 go/no‐go decision basis 0.25 0.00 0.22 127.00 46.00 No association 95%
Q19 Use of specific hurdle rates 0.35 0.00 0.00 85.91 91.99 No association 95%
0.00 No 127.00 46.00 173 3
MDC Usage 0.10 0.00 0.00 0.00 0.00 No association 95%
IRR Usage 0.00 0.00 0.00 0.00 0.00 No association 95%
ROE Usage 0.03 0.00 0.00 0.89 0.27 No association 95%
Group 2: 2 ‐ 5 years experience 49 3
Q18 go/no‐go decision basis Yes No 0.22 127.00 46.00 No association 95%
Q19 Use of specific hurdle rates 50.00 127.00 46.00 85.95 92.92 No association 95%
MDC Usage 4168.50 10819.50 4231.50 0.00 0.00 No association 95%
IRR Usage 0.00 0.00 0.00 0.00 0.00 No association 95%
ROE Usage 0.00 0.00 0.00 0.89 0.27 No association 95%
Group : ‐5 ‐ 10 years experience 43 3
Q18 go/no‐go decision basis Yes No 0.22 127.00 46.00 No association 95%
Q19 Use of specific hurdle rates 46.00 127.00 46.00 89.98 87.14 No association 95%
MDC Usage 4141 10777 4275 0.00 0.00 No association 95%
IRR Usage 0.00 0.00 0.00 0.00 0.00 No association 95%
ROE Usage 0.00 0.00 0.00 0.89 0.27 No association 95%
Group 4: +10 years experience 53 3
Q18 go/no‐go decision basis Yes No 0.22 0.00 0.00 No association 95%
Q19 Use of specific hurdle rates 46.00 127.00 46.00 0.00 0.00 No association 95%
MDC Usage 4136 11043 4009 0.00 0.00 No association 95%
IRR Usage 0.00 0.00 0.00 0.00 0.00 No association 95%
ROE Usage 0.00 0.00 0.00 0.89 0.27 No association 95%
188
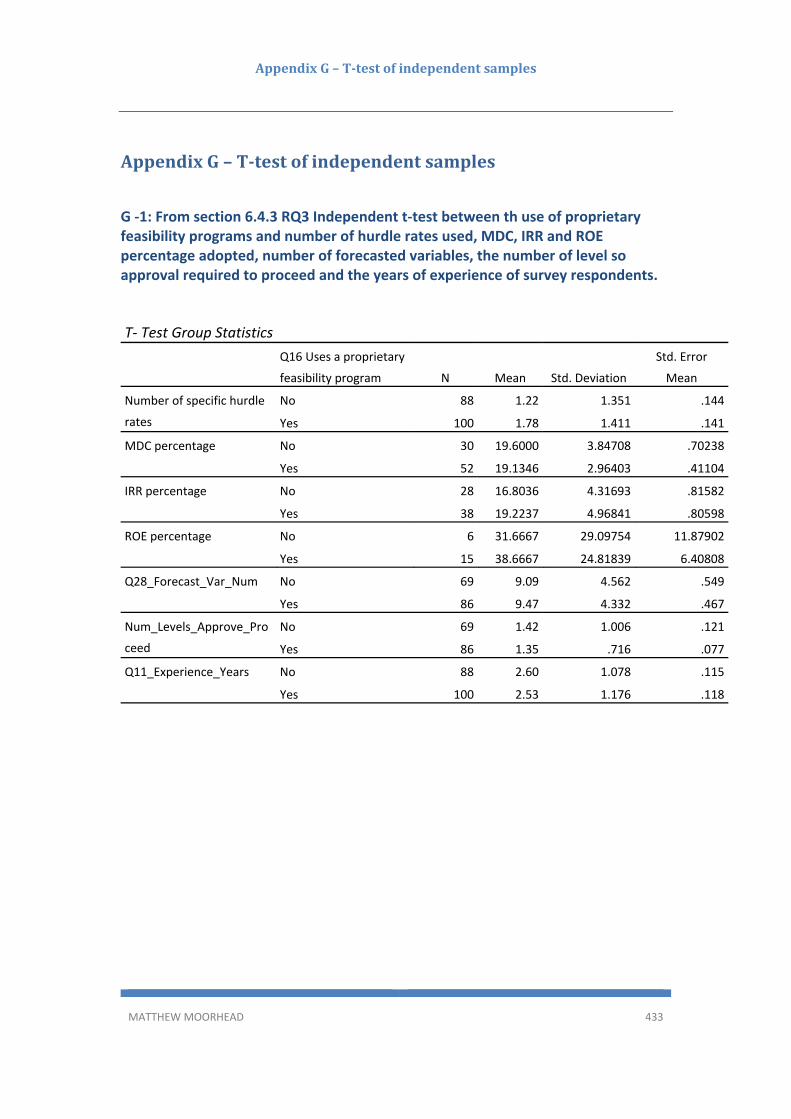
AppendixG–T‐testofindependentsamples
MATTHEW MOORHEAD 433
AppendixG–T‐testofindependentsamples
G ‐1: From section 6.4.3 RQ3 Independent t‐test between th use of proprietary feasibility programs and number of hurdle rates used, MDC, IRR and ROE percentage adopted, number of forecasted variables, the number of level so approval required to proceed and the years of experience of survey respondents.
T‐ Test Group Statistics Q16 Uses a proprietary
feasibility program N Mean Std. Deviation
Std. Error
Mean
Number of specific hurdle
rates
No 88 1.22 1.351 .144
Yes 100 1.78 1.411 .141
MDC percentage No 30 19.6000 3.84708 .70238
Yes 52 19.1346 2.96403 .41104
IRR percentage No 28 16.8036 4.31693 .81582
Yes 38 19.2237 4.96841 .80598
ROE percentage No 6 31.6667 29.09754 11.87902
Yes 15 38.6667 24.81839 6.40808
Q28_Forecast_Var_Num No 69 9.09 4.562 .549
Yes 86 9.47 4.332 .467
Num_Levels_Approve_Pro
ceed
No 69 1.42 1.006 .121
Yes 86 1.35 .716 .077
Q11_Experience_Years No 88 2.60 1.078 .115
Yes 100 2.53 1.176 .118
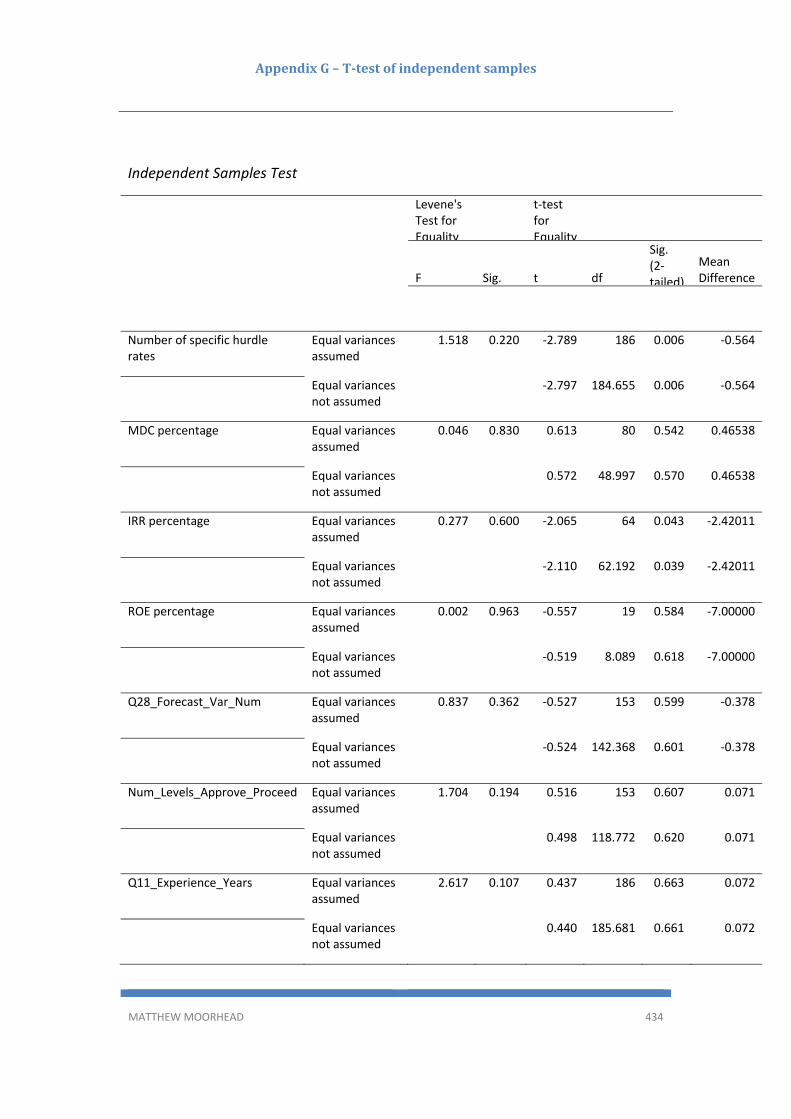
AppendixG–T‐testofindependentsamples
MATTHEW MOORHEAD 434
Independent Samples Test
Levene's Test for Equality
t‐test for Equality
F Sig. t df
Sig. (2‐tailed)
Mean Difference
Number of specific hurdle rates
Equal variances assumed
1.518 0.220 ‐2.789 186 0.006 ‐0.564
Equal variances not assumed
‐2.797 184.655 0.006 ‐0.564
MDC percentage Equal variances assumed
0.046 0.830 0.613 80 0.542 0.46538
Equal variances not assumed
0.572 48.997 0.570 0.46538
IRR percentage Equal variances assumed
0.277 0.600 ‐2.065 64 0.043 ‐2.42011
Equal variances not assumed
‐2.110 62.192 0.039 ‐2.42011
ROE percentage Equal variances assumed
0.002 0.963 ‐0.557 19 0.584 ‐7.00000
Equal variances not assumed
‐0.519 8.089 0.618 ‐7.00000
Q28_Forecast_Var_Num Equal variances assumed
0.837 0.362 ‐0.527 153 0.599 ‐0.378
Equal variances not assumed
‐0.524 142.368 0.601 ‐0.378
Num_Levels_Approve_Proceed Equal variances assumed
1.704 0.194 0.516 153 0.607 0.071
Equal variances not assumed
0.498 118.772 0.620 0.071
Q11_Experience_Years Equal variances assumed
2.617 0.107 0.437 186 0.663 0.072
Equal variances not assumed
0.440 185.681 0.661 0.072

AppendixG–T‐testofindependentsamples
MATTHEW MOORHEAD 435
G ‐2: From section 6.3.6 Independent t‐test by New Zealand and Australian respondent developers and go/no‐go decision processes, use of specific hurdle rates and usage of MDC, IRR and ROE: Group Statistics Geography Condensed
to Australia New
Zealand or Other N Mean Std. Deviation
Std. Error
Mean
Number of specific
hurdle rates
Aus 171 1.37 1.250 .096
NZ 14 1.93 1.940 .518
Q28_Forecast_Var_Num Aus 134 9.21 4.430 .383
NZ 11 10.64 3.355 1.012
MDC percentage Aus 71 19.4507 3.35001 .39757
NZ 7 17.4286 3.35942 1.26974
IRR percentage Aus 56 18.6071 4.94305 .66054
NZ 4 17.5000 2.88675 1.44338
ROE percentage Aus 16 35.3125 25.13091 6.28273
NZ 3 56.6667 27.53785 15.89899
Independent Samples Test
Levene's Test for Equality of Variances
t‐test for Equality of Means
F Sig. t df Sig. (2‐tailed)
Number of specific hurdle rates
Equal variances assumed 9.247 0.003 ‐1.537 183 0.126
Equal variances not assumed
‐1.062 13.898 0.306
Q28_Forecast_Var_Num Equal variances assumed 2.142 0.145 ‐1.043 143 0.299
Equal variances not assumed
‐1.320 13.048 0.210
MDC percentage Equal variances assumed 0.801 0.374 1.523 76 0.132
Equal variances not assumed
1.520 7.228 0.171
IRR percentage Equal variances assumed 0.489 0.487 0.440 58 0.661
Equal variances not assumed
0.697 4.378 0.521
ROE percentage Equal variances assumed 0.096 0.760 ‐1.335 17 0.200
Equal variances not assumed
‐1.249 2.665 0.310

AppendixG–T‐testofindependentsamples
MATTHEW MOORHEAD 436
G ‐3: From section 6.3.6 Independent t‐test between public and private structures and risk tollerance percetpion Group Statistics
Q6c Public or
Private structure N Mean Std. Deviation
Std. Error
Mean
Q31 b Risk Tolerance
Perception
Public 50 ‐.12 .689 .097
Private 110 ‐.11 .721 .069
Independent Samples Test
Levene's Test for Equality of Variances
t‐test for Equality of Means
F Sig. t df Sig. (2‐tailed)
Q31 b Risk Tolerance Perception
Equal variances assumed
0.269 0.605 ‐0.090 158 0.928
Equal variances not assumed
‐0.091 98.890 0.927

AppendixG–T‐testofindependentsamples
MATTHEW MOORHEAD 437
G ‐4: From section 6.3.6 Independent t‐test between having a property qualification and years of industry experience Descriptive Statistics
N Mean Std. Deviation Minimum Maximum
Q11_Experience_Years 188 2.56 1.129 1 4
Q11 Experience > 5 years 188 .51 .501 0 1
Q13_Property_Qualification 182 .84 .372 0 1
Ranks Q13_Property_Qualification N Mean Rank Sum of Ranks
Q11_Experience_Years No 30 89.27 2678.00
Yes 152 91.94 13975.00
Total 182
Q11 Experience > 5 years No 30 90.00 2700.00
Yes 152 91.80 13953.00
Total 182 Test Statisticsa
Q11_Experience_
Years
Q11 Experience >
5 years
Mann‐Whitney U 2213.000 2235.000
Wilcoxon W 2678.000 2700.000
Z ‐.263 ‐.197
Asymp. Sig. (2‐tailed) .793 .844
a. Grouping Variable: Q13_Property_Qualification

AppendixG–T‐testofindependentsamples
MATTHEW MOORHEAD 438
G ‐5: From section 6.3.6 Independent t‐test on property type and hurdle rates:
Independent Samples Test
Levene's Test
for Equality
of Variances t‐test for Equality of Means
F Sig. t df
Sig. (2‐
tailed)
Mean
Differe
nce
Std. Error
Differenc
e
95% Confidence
Interval of the
Difference
Lower Upper
Q20_1_2MDCHurdleRate
MarginonDevCostMDCor
ROC_percent
Equal variances
assumed
1.
98
4
.163 ‐.059 80 .953 ‐.04489 .76665 ‐1.57057 1.48079
Equal variances not
assumed
‐.066 77.450 .948 ‐.04489 .67976 ‐1.39834 1.30856
Q20_2_2IRRHurdleRateI
nternalRateofReturnIRR_
percent
Equal variances
assumed
.0
02
.961 ‐
3.265
64 .002 ‐
3.63056
1.11211 ‐5.85225 ‐1.40886
Equal variances not
assumed
‐
3.274
62.485 .002 ‐
3.63056
1.10905 ‐5.84718 ‐1.41393
@20_3_2TIRRHurdleRate
TargetIRR_percent
Equal variances
assumed
.0
47
.831 ‐
1.611
28 .118 ‐
2.32579
1.44387 ‐5.28343 .63185
Equal variances not
assumed
‐
1.608
25.799 .120 ‐
2.32579
1.44651 ‐5.30026 .64867
Q20_4_2ROEHurdleRate
ReturnonEquityROE_per
cent
Equal variances
assumed
.4
26
.522 ‐
1.027
19 .317 ‐
11.7788
5
11.47015 ‐
35.7861
4
12.2284
4
Equal variances not
assumed
‐
1.033
15.252 .318 ‐
11.7788
5
11.40057 ‐
36.0435
9
12.4859
0
Q20_6_2MINPROFIT$Hu
rdleRateMinimum$Profit
Equal variances
assumed
3.
27
4
.120 28.69
7
6 .000 911666
6.6667
317688.4
101
8339311
.1310
9894022
.2024
Equal variances not
assumed
52.39
3
5.000 .000 911666
6.6667
174005.1
085
8669372
.2955
9563961
.0378
Q20_7_2MINPROJ$Hurdl
eRateMinimum$ProjectS
ize
Equal variances
assumed
27
.3
28
.001 2.199 7 .064 998333
33.3333
45409381
.2418
‐
7542790
.8008
2072094
57.4675

AppendixG–T‐testofindependentsamples
MATTHEW MOORHEAD 439
Equal variances not
assumed
1.456 2.023 .281 998333
33.3333
68589317
.2764
‐
1921063
18.4999
3917729
85.1666
Q20_8_2ROIHurdleRateR
eturnonInvestmentROI
Equal variances
assumed
19
.9
80
.003 ‐
2.042
7 .080 ‐
30.0000
0
14.69069 ‐
64.7379
6
4.73796
Equal variances not
assumed
‐.993 1.029 .499 ‐
30.0000
0
30.21747 ‐
389.079
99
329.079
99
Q27_b_No_of_Risk_Anal
ysis_Methods
Equal variances
assumed
8.
54
9
.004 ‐
1.965
223 .051 ‐.234 .119 ‐.469 .001
Equal variances not
assumed
‐
2.075
215.94
0
.039 ‐.234 .113 ‐.457 ‐.012
Group Statistics
Q7_1RESDEVResidentialDeveloper4160orabove N Mean Std. Deviation Std. Error Mean
Q20_1_2MDCHurdleRateMarginonDevCostMDCorROC_percent
No 29 19.2759 2.41863 .44913
Yes 53 19.3208 3.71470 .51025
Q20_2_2IRRHurdleRateInternalRateofReturnIRR_percent
No 30 16.2167 4.42501 .80789
Yes 36 19.8472 4.55885 .75981
@20_3_2TIRRHurdleRateTargetIRR_percent
No 13 18.6154 3.94838 1.09508
Yes 17 20.9412 3.89664 .94507
Q20_4_2ROEHurdleRateReturnonEquityROE_percent
No 8 29.3750 25.13357 8.88606
Yes 13 41.1538 25.75152 7.14219
Q20_6_2MINPROFIT$HurdleRateMinimum$Profit
No 2 10000000.000 .0000 .0000
Yes 6 883333.333 426223.7284 174005.1085
Q20_7_2MINPROJ$HurdleRateMinimum$ProjectSize
No 3 113333333.333 118462370.9594 68394281.7623
Yes 6 13500000.000 12660963.6284 5168816.7569
Q20_8_2ROIHurdleRateReturnonInvestmentROI
No 7 20.0000 9.57427 3.61873
Yes 2 50.0000 42.42641 30.00000
Q20_9_2PBYRSHurdleRatePaybackPeriodYears
No 6 8.333 6.0553 2.4721
Yes 0a . . .
Q20_10_2MORHurdleRateMarginonRevenue
No 0a . . .
Yes 2 25.0000 .00000 .00000
Q27_b_No_of_Risk_Analysis_Methods
No 127 1.10 1.030 .091
Yes 98 1.34 .657 .066
a. t cannot be computed because at least one of the groups is empty.

AppendixG–T‐testofindependentsamples
MATTHEW MOORHEAD 440
G ‐6: From section 6.5.3 Independent t‐test on use of Monte Carlo simulations, Real Option theory or Probability/Bayesian models and dependent variables Group Statistics
Q27 Uses Monte
Carlo, Real Option or
Probability/Bayesian N Mean Std. Deviation
Std. Error
Mean
Q11_Experience_Years No 140 2.61 1.142 .097
Yes 35 2.40 1.143 .193
Num_Levels_Approve_Pr
oceed
No 115 1.29 .659 .061
Yes 31 1.77 1.359 .244
Q10DEVSIZEDominantSiz
eofProjectin$orifmoretha
none
No 134 51996268.66 40084239.129 3462750.855
Yes 35 64642857.14 39459318.483 6669842.181
Number of specific hurdle
rates
No 140 1.58 1.368 .116
Yes 35 1.69 1.586 .268
Q27_b_No_of_Risk_Analy
sis_Methods
No 140 1.38 .487 .041
Yes 35 2.20 1.023 .173
Q31 b Risk Tolerance
Perception
No 137 ‐.18 .706 .060
Yes 34 ‐.12 .769 .132
Independent Samples Test
Levene's Test for Equality of Variances
t‐test for Equality of Means
F Sig. t df Sig. (2‐tailed)
Q11_Experience_Years Equal variances assumed
0.01 0.94 0.96 173.00 0.34
Equal variances not assumed
0.96 52.31 0.34
Num_Levels_Approve_Proceed Equal variances assumed
26.39 0.00 ‐2.82 144.00 0.01
Equal variances not assumed
‐1.94 33.89 0.06
Q10DEVSIZEDominantSizeofProjectin$orifmorethanone
Equal variances assumed
0.27 0.60 ‐1.67 167.00 0.10

AppendixG–T‐testofindependentsamples
MATTHEW MOORHEAD 441
Equal variances not assumed
‐1.68 53.80 0.10
Number of specific hurdle rates Equal variances assumed
2.29 0.13 ‐0.40 173.00 0.69
Equal variances not assumed
‐0.37 47.42 0.72
Q27_b_No_of_Risk_Analysis_Methods
Equal variances assumed
13.75 0.00 ‐6.91 173.00 0.00
Equal variances not assumed
‐4.62 37.93 0.00
Q31 b Risk Tolerance Perception
Equal variances assumed
0.33 0.57 ‐0.42 169.00 0.68
Equal variances not assumed
‐0.40 47.73 0.69

AppendixH–ChiSquareTestsforIndependence
MATTHEW MOORHEAD 442
AppendixH–ChiSquareTestsforIndependence
H‐1 – Chi Square test between education level and obtaining a property qualification Chi-Square Tests
Value df
Asymptotic Significance (2-sided)
Pearson Chi-Square 12.065a 4 .017 Likelihood Ratio 9.196 4 .056 Linear-by-Linear Association .030 1 .863 N of Valid Cases 182 a. 4 cells (40.0%) have expected count less than 5. The minimum expected count is .66. Q12_Edcucation_Level_R * Q13PROPERTYQUALWereanyofyourqualificationsinaproper Crosstabulation Count
Q13PROPERTYQUALWereanyofyourqualificationsinaproper
Total No Yes Q12_Edcucation_Level_R Diploma or Trade Certificate 2 6 8
Master’s Degree 9 52 61 Post Graduate Diploma 1 17 18 Professional Degree (JD, MD) 3 1 4 University Bachelor’s Degree 15 76 91
Total 30 152 182
H‐2 ‐ Chi Square and Cramer’s V on Use of MDC as a hurdle rate and Developer Type: Yes, there is an association Chi-Square Tests
Value df
Asymptotic Significance (2-sided)
Pearson Chi-Square 14.212a 5 .014 Likelihood Ratio 15.670 5 .008 Linear-by-Linear Association .292 1 .589 N of Valid Cases 193 a. 2 cells (16.7%) have expected count less than 5. The minimum expected count is 3.40. Q20_1_1MDCDoyouuseMDCROCasahurdlerate * Q5_Developer_Type Crosstabulation Count

AppendixH–ChiSquareTestsforIndependence
MATTHEW MOORHEAD 443
Q5_Developer_Type
Total Other Trader Dev Investor Dev Dev Mngmt Valuation Funds Mngmt
Q20_1_1MDCDoyouuseMDCROCasahurdlerate
No 12 31 19 34 10 5 111 Yes 1 40 12 17 9 3 82
Total 13 71 31 51 19 8 193
H‐3 – Chi Square test between use of go/no‐go hurdle rates and use of MDC Chi-Square Tests
Value df
Asymptotic Significance (2-sided)
Exact Sig. (2-sided)
Exact Sig. (1-sided)
Pearson Chi-Square 13.204a 1 .000 Continuity Correctionb 12.043 1 .001 Likelihood Ratio 13.886 1 .000 Fisher's Exact Test .000 .000 Linear-by-Linear Association 13.134 1 .000 N of Valid Cases 188 a. 0 cells (0.0%) have expected count less than 5. The minimum expected count is 23.12. b. Computed only for a 2x2 table
H‐4 – Chi Square test between use of go/no‐go hurdle rates and use of IRR Chi-Square Tests
Value df
Asymptotic Significance (2-sided)
Exact Sig. (2-sided)
Exact Sig. (1-sided)
Pearson Chi-Square 6.232a 1 .013 Continuity Correctionb 5.410 1 .020 Likelihood Ratio 6.588 1 .010 Fisher's Exact Test .017 .009 Linear-by-Linear Association 6.198 1 .013 N of Valid Cases 188 a. 0 cells (0.0%) have expected count less than 5. The minimum expected count is 18.32. b. Computed only for a 2x2 table

AppendixH–ChiSquareTestsforIndependence
MATTHEW MOORHEAD 444
H‐5 – Chi Square test between use of go/no‐go hurdle rates and use of Qualitative Approach Chi-Square Tests
Value df
Asymptotic Significance (2-sided)
Exact Sig. (2-sided)
Exact Sig. (1-sided)
Pearson Chi-Square 81.874a 1 .000 Continuity Correctionb 78.018 1 .000 Likelihood Ratio 78.175 1 .000 Fisher's Exact Test .000 .000 Linear-by-Linear Association 81.439 1 .000 N of Valid Cases 188 a. 0 cells (0.0%) have expected count less than 5. The minimum expected count is 9.02. b. Computed only for a 2x2 table
H‐6 – Chi Square test for association of differences between Australian and New Zealand based respondents. Showing significance for Minimum Profit dollar amount and Minimum Project Size. No significance for the number of hurdles used
Case Processing Summary
Cases
Valid Missing Total
N Percent N Percent N Percent
Geography Condensed to Australia New
Zealand or Other *
Q18_B_Binary_Consisten_Decision_Metho
dology
157 68.3% 73 31.7% 230 100.0%
Geography Condensed to Australia New
Zealand or Other * Q19 Company uses
specific hurdle rates
172 74.8% 58 25.2% 230 100.0%
Geography Condensed to Australia New
Zealand or Other * Q20_1_1MDC_Usage
185 80.4% 45 19.6% 230 100.0%
Geography Condensed to Australia New
Zealand or Other * Q20_2_1IRR_Usage
185 80.4% 45 19.6% 230 100.0%
Geography Condensed to Australia New
Zealand or Other * @20_3_1TIRR_Usage
185 80.4% 45 19.6% 230 100.0%

AppendixH–ChiSquareTestsforIndependence
MATTHEW MOORHEAD 445
Geography Condensed to Australia New
Zealand or Other * @20_4_1ROE_Usage
185 80.4% 45 19.6% 230 100.0%
Geography Condensed to Australia New
Zealand or Other * NPV used
185 80.4% 45 19.6% 230 100.0%
Geography Condensed to Australia New
Zealand or Other *
Q20_6_1MINPROFIT$_Usage
185 80.4% 45 19.6% 230 100.0%
Geography Condensed to Australia New
Zealand or Other * Minimum project size
8 3.5% 222 96.5% 230 100.0%
Geography Condensed to Australia New
Zealand or Other * Q20_8_1ROI_Usage
185 80.4% 45 19.6% 230 100.0%
Geography Condensed to Australia New
Zealand or Other *
Q20_9_1PaybackPeriodYears_Usage
185 80.4% 45 19.6% 230 100.0%
Geography Condensed to Australia New
Zealand or Other * Q20_10_1MOR_Usage
185 80.4% 45 19.6% 230 100.0%
Geography Condensed to Australia New
Zealand or Other *
Q20_11QualitativeHurdleRateApproach
185 80.4% 45 19.6% 230 100.0%
Geography Condensed to Australia New Zealand or Other * Q18_B_Binary_Consisten_Decision_Methodology
Crosstab
Q18_B_Binary_Consisten_Dec
ision_Methodology
Total
Disagree or
Strongly
Disagree
Strongly Agree
or Agree
Geography Condensed to
Australia New Zealand or
Other
Aus Count 28 115 143
Expected Count 28.2 114.8 143.0
NZ Count 3 11 14
Expected Count 2.8 11.2 14.0
Total Count 31 126 157
Expected Count 31.0 126.0 157.0

AppendixH–ChiSquareTestsforIndependence
MATTHEW MOORHEAD 446
Chi-Square Tests
Value df
Asymptotic
Significance
(2-sided)
Exact Sig. (2-
sided)
Exact Sig. (1-
sided)
Pearson Chi-Square .027a 1 .868
Continuity Correctionb .000 1 1.000
Likelihood Ratio .027 1 .870
Fisher's Exact Test 1.000 .550
Linear-by-Linear
Association
.027 1 .869
N of Valid Cases 157
a. 1 cells (25.0%) have expected count less than 5. The minimum expected count is 2.76.
b. Computed only for a 2x2 table Geography Condensed to Australia New Zealand or Other * Q19 Company uses specific hurdle rates
Crosstab
Q19 Company uses specific
hurdle rates
Total No Yes
Geography Condensed to
Australia New Zealand or
Other
Aus Count 30 128 158
Expected Count 32.2 125.8 158.0
NZ Count 5 9 14
Expected Count 2.8 11.2 14.0
Total Count 35 137 172
Expected Count 35.0 137.0 172.0
Chi-Square Tests
Value df
Asymptotic
Significance
(2-sided)
Exact Sig. (2-
sided)
Exact Sig. (1-
sided)
Pearson Chi-Square 2.220a 1 .136
Continuity Correctionb 1.308 1 .253
Likelihood Ratio 1.951 1 .162

AppendixH–ChiSquareTestsforIndependence
MATTHEW MOORHEAD 447
Fisher's Exact Test .164 .128
Linear-by-Linear
Association
2.207 1 .137
N of Valid Cases 172
a. 1 cells (25.0%) have expected count less than 5. The minimum expected count is 2.85.
b. Computed only for a 2x2 table Geography Condensed to Australia New Zealand or Other * Q20_1_1MDC_Usage
Crosstab
Q20_1_1MDC_Usag
e
Total No Yes
Geography Condensed to
Australia New Zealand or
Other
Aus Count 100 71 171
Expected Count 98.9 72.1 171.0
NZ Count 7 7 14
Expected Count 8.1 5.9 14.0
Total Count 107 78 185
Expected Count 107.0 78.0 185.0
Chi-Square Tests
Value df
Asymptotic
Significance
(2-sided)
Exact Sig. (2-
sided)
Exact Sig. (1-
sided)
Pearson Chi-Square .382a 1 .537
Continuity Correctionb .113 1 .737
Likelihood Ratio .377 1 .539
Fisher's Exact Test .582 .365
Linear-by-Linear
Association
.379 1 .538
N of Valid Cases 185
a. 0 cells (0.0%) have expected count less than 5. The minimum expected count is 5.90.
b. Computed only for a 2x2 table
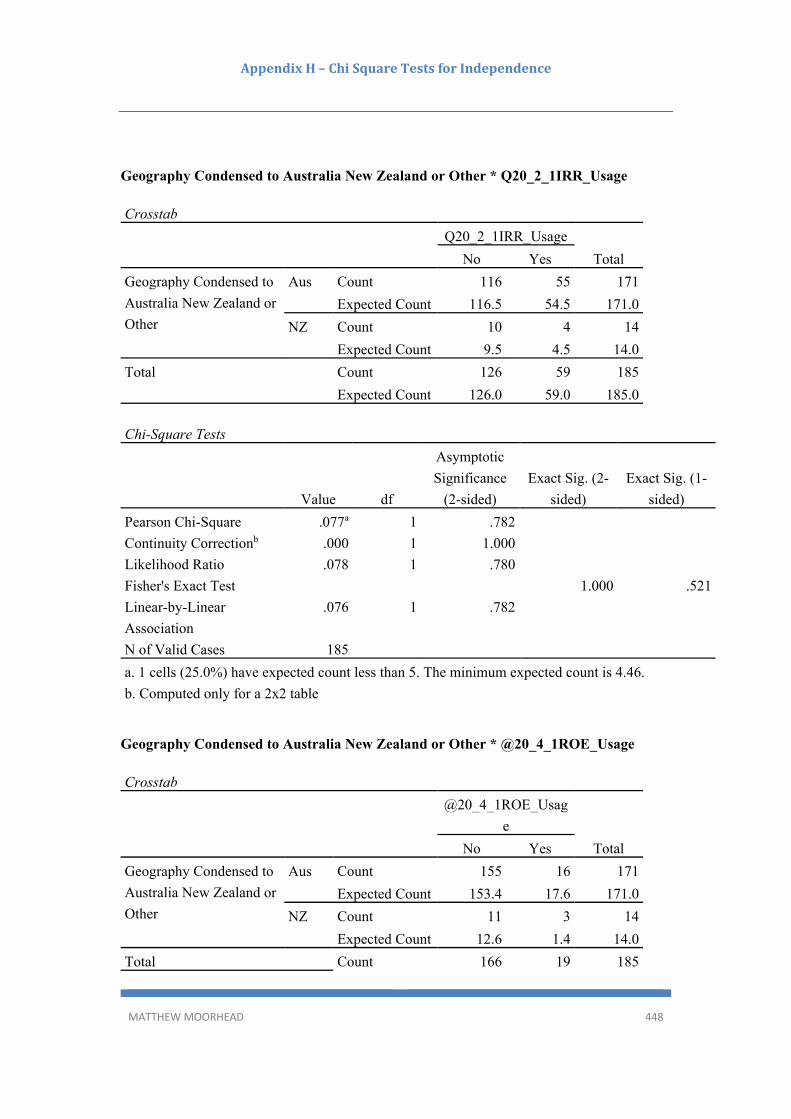
AppendixH–ChiSquareTestsforIndependence
MATTHEW MOORHEAD 448
Geography Condensed to Australia New Zealand or Other * Q20_2_1IRR_Usage
Crosstab
Q20_2_1IRR_Usage
Total No Yes
Geography Condensed to
Australia New Zealand or
Other
Aus Count 116 55 171
Expected Count 116.5 54.5 171.0
NZ Count 10 4 14
Expected Count 9.5 4.5 14.0
Total Count 126 59 185
Expected Count 126.0 59.0 185.0
Chi-Square Tests
Value df
Asymptotic
Significance
(2-sided)
Exact Sig. (2-
sided)
Exact Sig. (1-
sided)
Pearson Chi-Square .077a 1 .782
Continuity Correctionb .000 1 1.000
Likelihood Ratio .078 1 .780
Fisher's Exact Test 1.000 .521
Linear-by-Linear
Association
.076 1 .782
N of Valid Cases 185
a. 1 cells (25.0%) have expected count less than 5. The minimum expected count is 4.46.
b. Computed only for a 2x2 table Geography Condensed to Australia New Zealand or Other * @20_4_1ROE_Usage
Crosstab
@20_4_1ROE_Usag
e
Total No Yes
Geography Condensed to
Australia New Zealand or
Other
Aus Count 155 16 171
Expected Count 153.4 17.6 171.0
NZ Count 11 3 14
Expected Count 12.6 1.4 14.0
Total Count 166 19 185

AppendixH–ChiSquareTestsforIndependence
MATTHEW MOORHEAD 449
Expected Count 166.0 19.0 185.0
Chi-Square Tests
Value df
Asymptotic
Significance
(2-sided)
Exact Sig. (2-
sided)
Exact Sig. (1-
sided)
Pearson Chi-Square 2.046a 1 .153
Continuity Correctionb .946 1 .331
Likelihood Ratio 1.650 1 .199
Fisher's Exact Test .161 .161
Linear-by-Linear
Association
2.035 1 .154
N of Valid Cases 185
a. 1 cells (25.0%) have expected count less than 5. The minimum expected count is 1.44.
b. Computed only for a 2x2 table Geography Condensed to Australia New Zealand or Other * NPV used
Crosstab
NPV used
Total No Yes
Geography Condensed to
Australia New Zealand or
Other
Aus Count 160 11 171
Expected Count 159.9 11.1 171.0
NZ Count 13 1 14
Expected Count 13.1 .9 14.0
Total Count 173 12 185
Expected Count 173.0 12.0 185.0
Chi-Square Tests
Value df
Asymptotic
Significance
(2-sided)
Exact Sig. (2-
sided)
Exact Sig. (1-
sided)
Pearson Chi-Square .011a 1 .917
Continuity Correctionb .000 1 1.000
Likelihood Ratio .010 1 .919
Fisher's Exact Test 1.000 .623
Linear-by-Linear
Association
.011 1 .918
N of Valid Cases 185

AppendixH–ChiSquareTestsforIndependence
MATTHEW MOORHEAD 450
a. 1 cells (25.0%) have expected count less than 5. The minimum expected count is .91.
b. Computed only for a 2x2 table Geography Condensed to Australia New Zealand or Other * Q20_6_1MINPROFIT$_Usage
Crosstab
Q20_6_1MINPROFIT$_Usa
ge
Total No Yes
Geography Condensed to
Australia New Zealand or
Other
Aus Count 166 5 171
Expected Count 163.6 7.4 171.0
NZ Count 11 3 14
Expected Count 13.4 .6 14.0
Total Count 177 8 185
Expected Count 177.0 8.0 185.0
Chi-Square Tests
Value df
Asymptotic
Significance
(2-sided)
Exact Sig. (2-
sided)
Exact Sig. (1-
sided)
Pearson Chi-Square 10.710a 1 .001
Continuity Correctionb 6.704 1 .010
Likelihood Ratio 6.181 1 .013
Fisher's Exact Test .016 .016
Linear-by-Linear
Association
10.652 1 .001
N of Valid Cases 185
a. 1 cells (25.0%) have expected count less than 5. The minimum expected count is .61.
b. Computed only for a 2x2 table
Symmetric Measures
Value
Approximate
Significance
Nominal by Nominal Phi .241 .001
Cramer's V .241 .001
N of Valid Cases 185

AppendixH–ChiSquareTestsforIndependence
MATTHEW MOORHEAD 451
Geography Condensed to Australia New Zealand or Other * Minimum project size
Crosstab
Minimum project size
Total
20000
00.0
40000
00.0
50000
00.0
15000
000.0
20000
000.0
35000
000.0
40000
000.0
250000
000.0
Geography
Condensed to
Australia New
Zealand or
Other
Aus Count 0 0 0 1 1 1 1 1 5
Expected Count .6 .6 .6 .6 .6 .6 .6 .6 5.0
NZ Count 1 1 1 0 0 0 0 0 3
Expected Count .4 .4 .4 .4 .4 .4 .4 .4 3.0
Total Count 1 1 1 1 1 1 1 1 8
Expected Count 1.0 1.0 1.0 1.0 1.0 1.0 1.0 1.0 8.0

AppendixH–ChiSquareTestsforIndependence
MATTHEW MOORHEAD 452
Chi-Square Tests
Value df
Asymptotic
Significance
(2-sided)
Pearson Chi-Square 8.000a 7 .333
Likelihood Ratio 10.585 7 .158
Linear-by-Linear
Association
1.256 1 .262
N of Valid Cases 8
a. 16 cells (100.0%) have expected count less than 5. The
minimum expected count is .38.
Geography Condensed to Australia New Zealand or Other * Q20_9_1PaybackPeriodYears_Usage
Crosstab
Q20_9_1PaybackPeriodYears_
Usage
Total No Yes
Geography Condensed to
Australia New Zealand or
Other
Aus Count 166 5 171
Expected Count 166.4 4.6 171.0
NZ Count 14 0 14
Expected Count 13.6 .4 14.0

AppendixH–ChiSquareTestsforIndependence
MATTHEW MOORHEAD 453
Total Count 180 5 185
Expected Count 180.0 5.0 185.0
Chi-Square Tests
Value df
Asymptotic
Significance
(2-sided)
Exact Sig. (2-
sided)
Exact Sig. (1-
sided)
Pearson Chi-Square .421a 1 .517
Continuity Correctionb .000 1 1.000
Likelihood Ratio .798 1 .372
Fisher's Exact Test 1.000 .672
Linear-by-Linear
Association
.418 1 .518
N of Valid Cases 185
a. 2 cells (50.0%) have expected count less than 5. The minimum expected count is .38.
b. Computed only for a 2x2 table

AppendixH–ChiSquareTestsforIndependence
MATTHEW MOORHEAD 454
H‐7 – Chi Square test of independence showing no association between dominant property type development and the use of a go/no‐go decision process Chi-Square Tests
Value df
Asymptotic Significance (2-sided)
Exact Sig. (2-sided)
Exact Sig. (1-sided)
Pearson Chi-Square 10.710a 1 .001 Continuity Correctionb 6.704 1 .010 Likelihood Ratio 6.181 1 .013 Fisher's Exact Test .016 .016 Linear-by-Linear Association 10.652 1 .001
N of Valid Cases 185 a. 1 cells (25.0%) have expected count less than 5. The minimum expected count is .61.
Dominant type of property Developed consdensed *
Q18GONOGODECISIONDoesyourcompanyuseaspecificquan Crosstabulation
Q18GONOGODECISIONDoes
yourcompanyuseaspecificquan
Total No Yes
Dominant type of
property Developed
consdensed
Residential Count 25 70 95
Expected Count 26.8 68.2 95.0
% of Total 13.3% 37.2% 50.5%
Commercial Count 1 8 9
Expected Count 2.5 6.5 9.0
% of Total 0.5% 4.3% 4.8%
Retail Count 5 13 18
Expected Count 5.1 12.9 18.0
% of Total 2.7% 6.9% 9.6%
Mixed-Use Count 13 24 37
Expected Count 10.4 26.6 37.0
% of Total 6.9% 12.8% 19.7%
Other Count 9 20 29
Expected Count 8.2 20.8 29.0
% of Total 4.8% 10.6% 15.4%
Total Count 53 135 188
Expected Count 53.0 135.0 188.0
% of Total 28.2% 71.8% 100.0%

AppendixH–ChiSquareTestsforIndependence
MATTHEW MOORHEAD 455
Chi-Square Tests
Value df
Asymptotic
Significance (2-
sided)
Pearson Chi-Square 2.461a 4 .652
Likelihood Ratio 2.678 4 .613
Linear-by-Linear Association .881 1 .348
N of Valid Cases 188
a. 1 cells (10.0%) have expected count less than 5. The minimum
expected count is 2.54.
Dominant type of property Developed consdensed * Q18GONOGODECISIONDoesyourcompanyuseaspecificquan
Crosstabulation
Q18GONOGODECISIONDoes
yourcompanyuseaspecificquan
Total No Yes
Dominant type of property
Developed consdensed
Residential Count 25 70 95
Expected Count 26.8 68.2 95.0
% of Total 13.3% 37.2% 50.5%
Commercial Count 1 8 9
Expected Count 2.5 6.5 9.0
% of Total 0.5% 4.3% 4.8%
Retail Count 5 13 18
Expected Count 5.1 12.9 18.0
% of Total 2.7% 6.9% 9.6%
Mixed-Use Count 13 24 37
Expected Count 10.4 26.6 37.0
% of Total 6.9% 12.8% 19.7%
Other Count 9 20 29
Expected Count 8.2 20.8 29.0
% of Total 4.8% 10.6% 15.4%
Total Count 53 135 188
Expected Count 53.0 135.0 188.0
% of Total 28.2% 71.8% 100.0%

AppendixH–ChiSquareTestsforIndependence
MATTHEW MOORHEAD 456
Chi-Square Tests
Value df
Asymptotic
Significance (2-
sided)
Pearson Chi-Square 2.461a 4 .652
Likelihood Ratio 2.678 4 .613
Linear-by-Linear
Association
.881 1 .348
N of Valid Cases 188
a. 1 cells (10.0%) have expected count less than 5. The minimum
expected count is 2.54.
Independent Samples Test
Levene's Test
for Equality of
Variances t‐test for Equality of Means
F Sig. t df
Sig. (2‐
tailed)
Mean
Differe
nce
Std.
Error
Differe
nce
95%
Confidence
Interval of the
Difference
Lower Upper
Number of Specific
Hurdle Rates
Indicated
Equal
variances
assumed
9.247 .003 ‐
1.53
7
183 .126 ‐.560 .365 ‐1.279 .159
Equal
variances
not assumed
‐
1.06
2
13.8
98
.306 ‐.560 .527 ‐1.692 .571

AppendixH–ChiSquareTestsforIndependence
MATTHEW MOORHEAD 457
H‐8 – Chi Square test for independence and association of differences between dominant property type categories and use of MDC as a hurdle rate. Association shown for residential dominant development type and use of MDC as a hurdle rate
Dominant type of property Developed consdensed * Q20_1_1MDC_Usage Crosstabulation
Q20_1_1MDC_Usage
Total No Yes
Dominant type of
property Developed
consdensed
Residential Count 45 53 98
Expected Count 58.8 39.2 98.0
% of Total 22.0% 25.9% 47.8%
Commercial Count 7 3 10
Expected Count 6.0 4.0 10.0
% of Total 3.4% 1.5% 4.9%
Retail Count 12 6 18
Expected Count 10.8 7.2 18.0
% of Total 5.9% 2.9% 8.8%
Mixed-Use Count 24 13 37
Expected Count 22.2 14.8 37.0
% of Total 11.7% 6.3% 18.0%
Other Count 35 7 42
Expected Count 25.2 16.8 42.0
% of Total 17.1% 3.4% 20.5%
Total Count 123 82 205
Expected Count 123.0 82.0 205.0
% of Total 60.0% 40.0% 100.0%
Chi-Square Tests
Value df
Asymptotic
Significance (2-
sided)
Pearson Chi-Square 18.740a 4 .001
Likelihood Ratio 19.780 4 .001
Linear-by-Linear
Association
16.708 1 .000
N of Valid Cases 205
a. 1 cells (10.0%) have expected count less than 5. The minimum expected
count is 4.00.

AppendixH–ChiSquareTestsforIndependence
MATTHEW MOORHEAD 458
Q7_1RESDEVResidentialDeveloper4160orabove * Q20_1_1MDC_Usage Crosstabulation
Q20_1_1MDC_Usage
Total No Yes
Q7_1RESDEVResidentialD
eveloper4160orabove
No Count 78 29 107
Expected Count 64.2 42.8 107.0
% of Total 38.0% 14.1% 52.2%
Yes Count 45 53 98
Expected Count 58.8 39.2 98.0
% of Total 22.0% 25.9% 47.8%
Total Count 123 82 205
Expected Count 123.0 82.0 205.0
% of Total 60.0% 40.0% 100.0%
Chi-Square Tests
Value df
Asymptotic
Significance (2-
sided)
Exact Sig. (2-
sided)
Exact Sig. (1-
sided)
Pearson Chi-Square 15.513a 1 .000
Continuity Correctionb 14.409 1 .000
Likelihood Ratio 15.696 1 .000
Fisher's Exact Test .000 .000
Linear-by-Linear Association 15.437 1 .000
N of Valid Cases 205
a. 0 cells (0.0%) have expected count less than 5. The minimum expected count is 39.20.
b. Computed only for a 2x2 table

AppendixH–ChiSquareTestsforIndependence
MATTHEW MOORHEAD 459
Dominant type of property Developed consdensed * Q20_2_1IRR_Usage Crosstabulation
Q20_2_1IRR_Usage
Total No Yes
Dominant type of property
Developed consdensed
Residential Count 62 36 98
Expected Count 67.5 30.5 98.0
% of Total 29.7% 17.2% 46.9%
Commercial Count 7 3 10
Expected Count 6.9 3.1 10.0
% of Total 3.3% 1.4% 4.8%
Retail Count 10 8 18
Expected Count 12.4 5.6 18.0
% of Total 4.8% 3.8% 8.6%
Mixed-Use Count 26 11 37
Expected Count 25.5 11.5 37.0
% of Total 12.4% 5.3% 17.7%
Other Count 39 7 46
Expected Count 31.7 14.3 46.0
% of Total 18.7% 3.3% 22.0%
Total Count 144 65 209
Expected Count 144.0 65.0 209.0
% of Total 68.9% 31.1% 100.0%
Chi-Square Tests
Value df
Asymptotic
Significance (2-
sided)
Pearson Chi-Square 8.401a 4 .078
Likelihood Ratio 9.028 4 .060
Linear-by-Linear
Association
5.301 1 .021
N of Valid Cases 209
a. 1 cells (10.0%) have expected count less than 5. The minimum
expected count is 3.11.
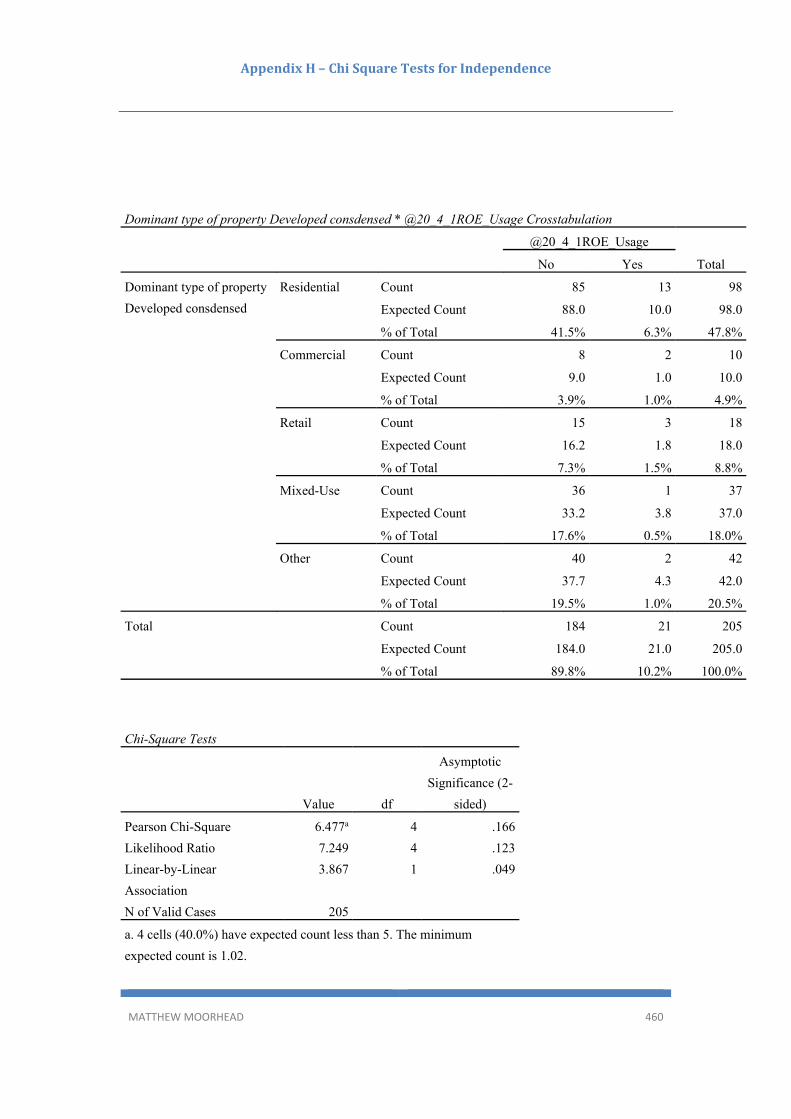
AppendixH–ChiSquareTestsforIndependence
MATTHEW MOORHEAD 460
Dominant type of property Developed consdensed * @20_4_1ROE_Usage Crosstabulation
@20_4_1ROE_Usage
Total No Yes
Dominant type of property
Developed consdensed
Residential Count 85 13 98
Expected Count 88.0 10.0 98.0
% of Total 41.5% 6.3% 47.8%
Commercial Count 8 2 10
Expected Count 9.0 1.0 10.0
% of Total 3.9% 1.0% 4.9%
Retail Count 15 3 18
Expected Count 16.2 1.8 18.0
% of Total 7.3% 1.5% 8.8%
Mixed-Use Count 36 1 37
Expected Count 33.2 3.8 37.0
% of Total 17.6% 0.5% 18.0%
Other Count 40 2 42
Expected Count 37.7 4.3 42.0
% of Total 19.5% 1.0% 20.5%
Total Count 184 21 205
Expected Count 184.0 21.0 205.0
% of Total 89.8% 10.2% 100.0%
Chi-Square Tests
Value df
Asymptotic
Significance (2-
sided)
Pearson Chi-Square 6.477a 4 .166
Likelihood Ratio 7.249 4 .123
Linear-by-Linear
Association
3.867 1 .049
N of Valid Cases 205
a. 4 cells (40.0%) have expected count less than 5. The minimum
expected count is 1.02.

AppendixH–ChiSquareTestsforIndependence
MATTHEW MOORHEAD 461
Dominant type of property Developed consdensed * Q20_5NPV_Usage Crosstabulation
Q20_5NPV_Usage
Total No Yes
Dominant type of property
Developed consdensed
Residential Count 90 8 98
Expected Count 90.8 7.2 98.0
% of Total 43.9% 3.9% 47.8%
Commercial Count 9 1 10
Expected Count 9.3 .7 10.0
% of Total 4.4% 0.5% 4.9%
Retail Count 15 3 18
Expected Count 16.7 1.3 18.0
% of Total 7.3% 1.5% 8.8%
Mixed-Use Count 35 2 37
Expected Count 34.3 2.7 37.0
% of Total 17.1% 1.0% 18.0%
Other Count 41 1 42
Expected Count 38.9 3.1 42.0
% of Total 20.0% 0.5% 20.5%
Total Count 190 15 205
Expected Count 190.0 15.0 205.0
% of Total 92.7% 7.3% 100.0%

AppendixH–ChiSquareTestsforIndependence
MATTHEW MOORHEAD 462
H‐9 – Fishers Exact test showing no association between medium and large project sizes and use of NPV as a hurdle rate Chi‐Square Tests
Value df
Asymptotic
Significance (2‐
sided)
Exact Sig. (2‐
sided)
Exact Sig. (1‐
sided)
Pearson Chi‐Square .333a 1 .564
Continuity Correctionb .078 1 .780
Likelihood Ratio .342 1 .559
Fisher's Exact Test .767 .398
Linear‐by‐Linear Association .331 1 .565
N of Valid Cases 157
a. 1 cells (25.0%) have expected count less than 5. The minimum expected count is 4.97.
b. Computed only for a 2x2 table
Medium and Large Size Projects * NPV used Crosstabulation
NPV used
Total No Yes
Medium and Large Size
Projects
Medium Count 56 <5 60
% within NPV used 38.9% n<5 38.2%
Large Count 88 9 97
% within NPV used 61.1% 69.2% 61.8%
Total Count 144 13 157
% within NPV used 100.0% 100.0% 100.0%

AppendixH–ChiSquareTestsforIndependence
MATTHEW MOORHEAD 463
H‐10 – Chi Square test of independence showing no association between NPV usage and public, private or other ownership structure NPV used * Ownership Public, Private or Other Crosstabulation
Ownership Public, Private or Other
Total Public Private Other
NPV used No Count 60 107 3 170
% within Ownership Public,
Private or Other
93.8% 91.5% 100.0% 92.4%
Yes Count 4 10 0 14
% within Ownership Public,
Private or Other
6.3% 8.5% 0.0% 7.6%
Total Count 64 117 3 184
% within Ownership Public,
Private or Other
100.0% 100.0% 100.0% 100.0%
Chi‐Square Tests
Value df
Asymptotic
Significance (2‐
sided)
Pearson Chi‐Square .562a 2 .755
Likelihood Ratio .794 2 .672
Linear‐by‐Linear Association .124 1 .724
N of Valid Cases 184
a. 3 cells (50.0%) have expected count less than 5. The minimum
expected count is .23.

AppendixH–ChiSquareTestsforIndependence
MATTHEW MOORHEAD 464
H‐11 – Chi Square test of independence between groups of property qualifications and having go/no‐go decision processes, use of specific hurdle rates in decision practices and usage of MDC, IRR and ROE Case Processing Summary
Cases
Valid Missing Total
N Percent N Percent N Percent
Q13_Property_Qualification
*
Q18_B_Binary_Consisten_D
ecision_Methodology
164 71.3% 66 28.7% 230 100.0%
Q13_Property_Qualification
* Q19 Company uses
specific hurdle rates
181 78.7% 49 21.3% 230 100.0%
Q13_Property_Qualification
* Q20_1_1MDC_Usage
182 79.1% 48 20.9% 230 100.0%
Q13_Property_Qualification
* Q20_2_1IRR_Usage
182 79.1% 48 20.9% 230 100.0%
Q13_Property_Qualification
* @20_4_1ROE_Usage
182 79.1% 48 20.9% 230 100.0%
Q13_Property_Qualification * Q18_B_Binary_Consisten_Decision_Methodology
Chi-Square Tests
Value df
Asymptotic
Significance (2‐
sided)
Exact Sig. (2‐
sided)
Exact Sig. (1‐
sided)
Pearson Chi‐Square 2.036a 1 .154
Continuity Correctionb 1.350 1 .245
Likelihood Ratio 1.872 1 .171
Fisher's Exact Test .185 .124
Linear‐by‐Linear Association 2.023 1 .155
N of Valid Cases 164
a. 0 cells (0.0%) have expected count less than 5. The minimum expected count is 5.30.
b. Computed only for a 2x2 table

AppendixH–ChiSquareTestsforIndependence
MATTHEW MOORHEAD 465
Q13_Property_Qualification * Q20_1_1MDC_Usage
Chi-Square Tests
Value df
Asymptotic
Significance (2‐
sided)
Exact Sig. (2‐
sided)
Exact Sig. (1‐
sided)
Pearson Chi‐Square 2.151a 1 .142
Continuity Correctionb 1.602 1 .206
Likelihood Ratio 2.138 1 .144
Fisher's Exact Test .162 .103
Linear‐by‐Linear Association 2.139 1 .144
N of Valid Cases 182
a. 0 cells (0.0%) have expected count less than 5. The minimum expected count is 13.35.
b. Computed only for a 2x2 table
Crosstab Count
Q20_1_1MDC_Usage
Total No Yes
Q13_Property_Qualification No 13 17 30
Yes 88 64 152
Total 101 81 182
Q13_Property_Qualification * Q20_2_1IRR_Usage
Chi-Square Tests
Value df
Asymptotic
Significance (2‐
sided)
Exact Sig. (2‐
sided)
Exact Sig. (1‐
sided)
Pearson Chi‐Square .036a 1 .850
Continuity Correctionb .000 1 1.000
Likelihood Ratio .035 1 .851
Fisher's Exact Test .837 .503
Linear‐by‐Linear Association .035 1 .851
N of Valid Cases 182
a. 0 cells (0.0%) have expected count less than 5. The minimum expected count is 10.55.
b. Computed only for a 2x2 table

AppendixH–ChiSquareTestsforIndependence
MATTHEW MOORHEAD 466
Crosstab Count
Q20_2_1IRR_Usage
Total No Yes
Q13_Property_Qualification No 19 11 30
Yes 99 53 152
Total 118 64 182
Q13_Property_Qualification * @20_4_1ROE_Usage
Chi-Square Tests
Value df
Asymptotic
Significance (2‐
sided)
Exact Sig. (2‐
sided)
Exact Sig. (1‐
sided)
Pearson Chi‐Square 1.184a 1 .277
Continuity Correctionb .591 1 .442
Likelihood Ratio 1.071 1 .301
Fisher's Exact Test .334 .214
Linear‐by‐Linear Association 1.177 1 .278
N of Valid Cases 182
a. 1 cells (25.0%) have expected count less than 5. The minimum expected count is 3.30.
b. Computed only for a 2x2 table
Crosstab Count
@20_4_1ROE_Usage
Total No Yes
Q13_Property_Qualification No 25 5 30
Yes 137 15 152
Total 162 20 182

AppendixH–ChiSquareTestsforIndependence
MATTHEW MOORHEAD 467
H‐12 – Chi Square test of independence between groups of those that use proprietary feasibility analysis programs and the use of specific hurdle rates
Crosstab Count
Q20_1_1MDC_Usage
Total No Yes
Q16 Uses a proprietary
feasibility program
No 58 30 88
Yes 48 52 100
Total 106 82 188
Chi-Square Tests
Value df
Asymptotic
Significance (2‐
sided)
Exact Sig. (2‐
sided)
Exact Sig. (1‐
sided)
Pearson Chi‐Square 6.105a 1 .013
Continuity Correction 5.398 1 .020
Likelihood Ratio 6.154 1 .013
Fisher's Exact Test .018 .010
Linear‐by‐Linear Association 6.072 1 .014
N of Valid Cases 188
a. 0 cells (.0%) have expected count less than 5. The minimum expected count is 38.38.
b. Computed only for a 2x2 table

AppendixH–ChiSquareTestsforIndependence
MATTHEW MOORHEAD 468
Crosstab Count
Q19 Company uses specific hurdle
rates
Total No Yes
Q16 Uses a proprietary
feasibility program
No 28 60 88
Yes 14 85 99
Total 42 145 187
Chi-Square Tests
Value df
Asymptotic
Significance (2‐
sided)
Exact Sig. (2‐
sided)
Exact Sig. (1‐
sided)
Pearson Chi‐Square 8.359a 1 .004
Continuity Correctionb 7.375 1 .007
Likelihood Ratio 8.442 1 .004
Fisher's Exact Test .005 .003
Linear‐by‐Linear Association 8.314 1 .004
N of Valid Cases 187
a. 0 cells (.0%) have expected count less than 5. The minimum expected count is 19.76.
b. Computed only for a 2x2 table

AppendixH–ChiSquareTestsforIndependence
MATTHEW MOORHEAD 469
H‐13 – Chi Square test of independence between groups of those that use proprietary feasibility analysis programs and adapting or altering hurdle rates based on a change in uncertainty or risk
Crosstab Count
Q22_1HRALTERRAAltersHurdlerateson
riskanalysisieMa
Total No Yes
Q16 Uses a proprietary
feasibility program
No 53 31 84
Yes 75 22 97
Total 128 53 181
Chi-Square Tests
Value df
Asymptotic
Significance (2‐
sided)
Exact Sig. (2‐
sided)
Exact Sig. (1‐
sided)
Pearson Chi‐Square 4.399a 1 .036
Continuity Correctionb 3.738 1 .053
Likelihood Ratio 4.401 1 .036
Fisher's Exact Test .049 .027
Linear‐by‐Linear Association 4.374 1 .036
N of Valid Cases 181
a. 0 cells (.0%) have expected count less than 5. The minimum expected count is 24.60.
b. Computed only for a 2x2 table

AppendixI‐ResultsofLogisticBinaryandMultinomialRegressionAnalysis
MATTHEW MOORHEAD 470
AppendixI‐ResultsofLogisticBinaryandMultinomialRegressionAnalysis
I‐1 Binary logistic regression predicting using MDC as a hurdle rate Variables not in the Equation
Score df Sig.
Step 0 Variable
s
Q5_Dev_Type_Condensed 4.906 3 .179
Q5_Dev_Type_Condensed(1
)
.653 1 .419
Q5_Dev_Type_Condensed(2
)
2.928 1 .087
Q5_Dev_Type_Condensed(3
)
.317 1 .574
Dominant type of property
developed
8.783 6 .186
Dominant type of property
developed(1)
.402 1 .526
Dominant type of property
developed(2)
.965 1 .326
Dominant type of property
developed(3)
.402 1 .526
Dominant type of property
developed(4)
2.148 1 .143
Dominant type of property
developed(5)
.143 1 .705
Dominant type of property
developed(6)
2.449 1 .118
Q10DEVSIZEDominantSizeof
Projectin$orifmorethanone
5.174 4 .270
Q10DEVSIZEDominantSizeof
Projectin$orifmorethanone(
1)
3.467 1 .063

AppendixI‐ResultsofLogisticBinaryandMultinomialRegressionAnalysis
MATTHEW MOORHEAD 471
Q10DEVSIZEDominantSizeof
Projectin$orifmorethanone(
2)
.031 1 .860
Q10DEVSIZEDominantSizeof
Projectin$orifmorethanone(
3)
2.490 1 .115
Q10DEVSIZEDominantSizeof
Projectin$orifmorethanone(
4)
.004 1 .951
Q12_Edcucation_Level_R 3.118 4 .538
Q12_Edcucation_Level_R(1) .948 1 .330
Q12_Edcucation_Level_R(2) .160 1 .690
Q12_Edcucation_Level_R(3) .402 1 .526
Q12_Edcucation_Level_R(4) .000 1 .992
Q11EXPERIENCEPleaseindic
ateyourlevelofexperienceint
2.079 3 .556
Q11EXPERIENCEPleaseindic
ateyourlevelofexperienceint
(1)
1.123 1 .289
Q11EXPERIENCEPleaseindic
ateyourlevelofexperienceint
(2)
.343 1 .558
Q11EXPERIENCEPleaseindic
ateyourlevelofexperienceint
(3)
.267 1 .605
Q13PROPERTYQUALWerean
yofyourqualificationsinapro
per
.821 1 .365
Q14DECISIONMAKERIsthere
aspecialisedboardseniorman
ag
.019 1 .890
Q16FEASOPROGRAMDoesy
ourcompanyuseaproprietary
developme
4.721 1 .030

MATTHEW MOORHEAD 472
Q19HURDLERATEUSEDoesy
ourcompanyincorporatespe
cificf
35.419 1 .000
Q20_2_1IRRDoyouuseIRRas
ahurdlerate
3.222 1 .073
Q24RISKMANPLANDoesyour
companyhaveariskmanagem
entst
.535 1 .465
Q31_Risk_Tolerance_Scale 9.381 2 .009
Q31_Risk_Tolerance_Scale(
1)
8.293 1 .004
Q31_Risk_Tolerance_Scale(
2)
.347 1 .556
Overall Statistics 61.212 28 .000

MATTHEW MOORHEAD 473
I‐2 Binary logistic regression predicting the use of complex quantitative decision methods of large property developers Binary Logistic Regression ‐Variables in the Equation
B S.E. Wald df Sig. Exp(B)
Step 5e Q18 GO/NO‐GO Decision Basis 1.417 .707 4.014 1 .045 4.125
Q14_1BoardorOther_R 14.370 2 .001
Q14_1BoardorOther_R(1) 2.025 .746 7.376 1 .007 7.576
Q14_1BoardorOther_R(2) 2.548 .682 13.939 1 .000 12.780
Q19 Specific hurdle rate use 1.358 .554 6.012 1 .014 3.889
Q20 ‐11 Qualitative Hurdle Rate Approach
2.464 .837 8.656 1 .003 11.748
Q23‐Residual Cashflow Accumulation Method
‐1.605 .753 4.547 1 .033 .201
Constant ‐4.561 1.053 18.751 1 .000 .010
e. Variable(s) entered on step 5: Q18 GO/NO‐ GO Decision Basis.
Classification Tablea
Observed
Predicted
Q10BinaryLarge Size is $50 mill
or more Percentage
Correct .00 1.00
Step 1 Q10BinaryLarge Size is
$50 mill or more
.00 43 38 53.1
1.00 20 63 75.9
Overall Percentage 64.6
Step 2 Q10BinaryLarge Size is
$50 mill or more
.00 53 28 65.4
1.00 29 54 65.1
Overall Percentage 65.2
Step 3 Q10BinaryLarge Size is
$50 mill or more
.00 49 32 60.5
1.00 19 64 77.1
Overall Percentage 68.9
Step 4 Q10BinaryLarge Size is
$50 mill or more
.00 52 29 64.2
1.00 21 62 74.7
Overall Percentage 69.5
Step 5 Q10BinaryLarge Size is
$50 mill or more
.00 46 35 56.8
1.00 12 71 85.5
Overall Percentage 71.3
a. The cut value is .500
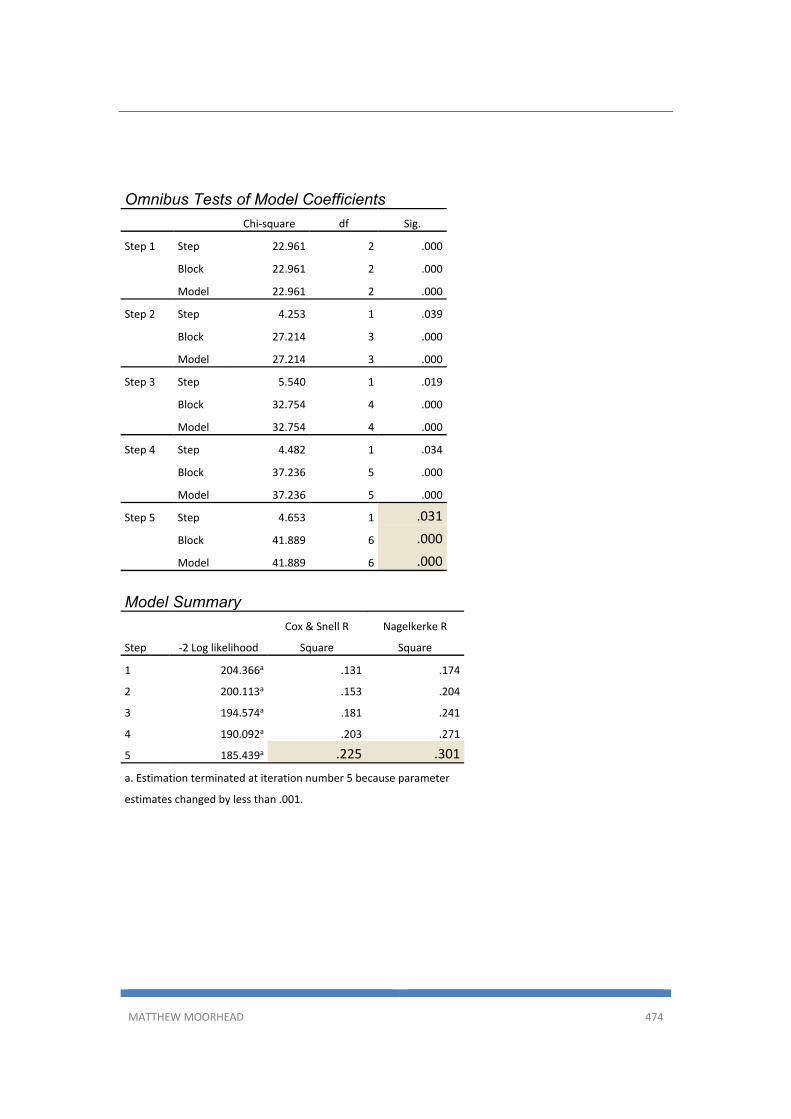
MATTHEW MOORHEAD 474
Omnibus Tests of Model Coefficients
Chi‐square df Sig.
Step 1 Step 22.961 2 .000
Block 22.961 2 .000
Model 22.961 2 .000
Step 2 Step 4.253 1 .039
Block 27.214 3 .000
Model 27.214 3 .000
Step 3 Step 5.540 1 .019
Block 32.754 4 .000
Model 32.754 4 .000
Step 4 Step 4.482 1 .034
Block 37.236 5 .000
Model 37.236 5 .000
Step 5 Step 4.653 1 .031
Block 41.889 6 .000
Model 41.889 6 .000
Model Summary
Step ‐2 Log likelihood
Cox & Snell R
Square
Nagelkerke R
Square
1 204.366a .131 .174
2 200.113a .153 .204
3 194.574a .181 .241
4 190.092a .203 .271
5 185.439a .225 .301
a. Estimation terminated at iteration number 5 because parameter
estimates changed by less than .001.

AppendixJ–AnalysisofVariance(ANOVA)
MATTHEW MOORHEAD 475
AppendixJ–AnalysisofVariance(ANOVA)
J‐1 – One way analysis of variance test between dominant property type and percentage of MDC as a minimum hurdle rate for a go/no‐go decision Descriptives
Q20_1_2MDCHurdleRate_percent
N Mean
Std.
Deviation Std. Error
95% Confidence Interval
for Mean
Minimu
m Maximum
Lower
Bound
Upper
Bound
Residential 53 19.3208 3.71470 .51025 18.2969 20.3447 10.00 30.00
Commercial 3 18.0000 3.46410 2.00000 9.3947 26.6053 14.00 20.00
Retail 6 20.8333 2.04124 .83333 18.6912 22.9755 20.00 25.00
Industrial 1 12.0000 . . . . 12.00 12.00
Mixed Use/No
Dominant
13 19.0769 1.89128 .52455 17.9340 20.2198 15.00 20.00
Other 4 20.0000 .00000 .00000 20.0000 20.0000 20.00 20.00
Total 80 19.2875 3.33828 .37323 18.5446 20.0304 10.00 30.00
ANOVA
Q20_1_2MDCHurdleRate_percent
Sum of Squares df Mean Square F Sig.
Between Groups 75.084 5 15.017 1.380 .242
Within Groups 805.304 74 10.882
Total 880.388 79

AppendixJ–AnalysisofVariance(ANOVA)
MATTHEW MOORHEAD 476
J‐2 – One way analysis of variance test between dominant property type and percentage of IRR as a minimum hurdle rate for a go/no‐go decision
Descriptives
Q20_2_2IRRHurdleRate_percent
N Mean
Std.
Deviation Std. Error
95% Confidence Interval
for Mean
Minimum Maximum
Lower
Bound
Upper
Bound
Residential 36 19.8472 4.55885 .75981 18.3047 21.3897 12.50 30.00
Commercial 3 15.6667 4.04145 2.33333 5.6271 25.7062 12.00 20.00
Retail 8 13.6875 3.65413 1.29193 10.6326 16.7424 10.00 20.00
Mixed-Use 11 15.3636 3.44304 1.03812 13.0506 17.6767 10.00 20.00
Other 8 20.1250 4.48609 1.58607 16.3745 23.8755 15.00 30.00
Total 66 18.1970 4.82133 .59346 17.0117 19.3822 10.00 30.00
ANOVA
Q20_2_2IRRHurdleRate_percent
Sum of Squares df Mean Square F Sig.
Between Groups 397.974 4 99.493 5.453 .001
Within Groups 1112.966 61 18.245
Total 1510.939 65

AppendixJ–AnalysisofVariance(ANOVA)
MATTHEW MOORHEAD 477
Multiple Comparisons
Dependent Variable: Q20_2_2IRRHurdleRate_percent
Tukey HSD
(I) Dominant type of
property developed
consdensed
(J) Dominant type of
property developed
consdensed
Mean
Difference
(I-J) Std. Error Sig.
95% Confidence Interval
Lower
Bound
Upper
Bound
Residential Commercial 4.18056 2.56683 .485 -3.0349 11.3960
Retail 6.15972* 1.66958 .004 1.4665 10.8530
Mixed-Use 4.48359* 1.47156 .027 .3470 8.6202
Other -.27778 1.66958 1.000 -4.9710 4.4155
Commercial Residential -4.18056 2.56683 .485 -11.3960 3.0349
Retail 1.97917 2.89179 .959 -6.1498 10.1081
Mixed-Use .30303 2.78217 1.000 -7.5178 8.1238
Other -4.45833 2.89179 .540 -12.5873 3.6706
Retail Residential -6.15972* 1.66958 .004 -10.8530 -1.4665
Commercial -1.97917 2.89179 .959 -10.1081 6.1498
Mixed-Use -1.67614 1.98478 .916 -7.2554 3.9032
Other -6.43750* 2.13573 .030 -12.4411 -.4339
Mixed-Use Residential -4.48359* 1.47156 .027 -8.6202 -.3470
Commercial -.30303 2.78217 1.000 -8.1238 7.5178
Retail 1.67614 1.98478 .916 -3.9032 7.2554
Other -4.76136 1.98478 .129 -10.3407 .8179
Other Residential .27778 1.66958 1.000 -4.4155 4.9710
Commercial 4.45833 2.89179 .540 -3.6706 12.5873
Retail 6.43750* 2.13573 .030 .4339 12.4411
Mixed-Use 4.76136 1.98478 .129 -.8179 10.3407
*. The mean difference is significant at the 0.05 level.

AppendixJ–AnalysisofVariance(ANOVA)
MATTHEW MOORHEAD 478
J‐3 – Two‐way analysis of variance test between groups of public and private developers and large project sizes (> $50 million) and the number of hurdle rates used as a basis for a go/no‐go decision. Descriptive Statistics
Dependent Variable: Number_Specific_Hurdle Rates
Ownership Public, Private or
Other
Q10 Project Size is $50 mill
or more Mean Std. Deviation N
Public No 1.17 .718 12
Yes 1.49 1.249 47
Total 1.42 1.163 59
Private No 1.35 1.283 66
Yes 2.07 1.776 45
Total 1.64 1.536 111
Total No 1.32 1.211 78
Yes 1.77 1.549 92
Total 1.56 1.418 170
Tests of Between-Subjects Effects
Dependent Variable: Number_Specific_Hurdle Rates
Source
Type III Sum
of Squares df Mean Square F Sig.
Partial Eta
Squared
Corrected Model 16.592a 3 5.531 2.841 .040 .049
Intercept 259.602 1 259.602 133.337 .000 .445
Q6b_Ownership_Condens
ed
4.059 1 4.059 2.085 .151 .012
Q10ProjectSizeLargeorSm
all
7.631 1 7.631 3.919 .049 .023
Q6b_Ownership_Condens
ed *
Q10ProjectSizeLargeorSm
all
1.102 1 1.102 .566 .453 .003
Error 323.196 166 1.947
Total 756.000 170
Corrected Total 339.788 169
a. R Squared = .049 (Adjusted R Squared = .032)

AppendixJ–AnalysisofVariance(ANOVA)
MATTHEW MOORHEAD 479

AppendixJ–AnalysisofVariance(ANOVA)
MATTHEW MOORHEAD 480
J‐4 – Two‐way analysis of variance test between groups on the basis of developer typologies and the number of specific hurdle rates and forecasted variables as well as the specific levels of MDC, IRR and ROE used.
ANOVA
Sum of Squares df
Mean Square F Sig.
Number of specific hurdle rates
Between Groups 7.27 2 3.63 1.86 0.16
Within Groups 292.90 150 1.95
Total 300.17 152
MDC percentage Between Groups 25.67 2 12.83 1.08 0.35
Within Groups 784.97 66 11.89
Total 810.64 68
IRR percentage Between Groups 148.75 2 74.38 3.23 0.05
Within Groups 1196.65 52 23.01
Total 1345.41 54
ROE percentage Between Groups 135.21 2 67.60 0.09 0.92
Within Groups 10308.54 13 792.96
Total 10443.75 15
Tukey HSD
Dependent Variable Mean
Difference Std. Error Sig. IRR percentage
Trader Developer Investor Developer 4.26* 1.68 0.038
Development Manager
1.52 1.59 0.605
Investor Developer Trader Developer ‐4.26* 1.68 0.038
Development Manager
‐2.73 1.97 0.353
Development Manager
Trader Developer ‐1.52 1.59 0.605
Investor Developer 2.73 1.97 0.353
*The mean difference is significant at the 0.05 level.
N Mean Std.
Deviation Std. Error
Trader Developer 71 1.66 1.07 0.127
Investor Developer 31 1.71 1.87 0.335

AppendixJ–AnalysisofVariance(ANOVA)
MATTHEW MOORHEAD 481
Number of specific hurdle rates
Development Manager
51 1.22 1.47 0.206
Total 153 1.52 1.41 0.114
MDC percentage
Trader Developer 40 19.93 3.81 0.602
Investor Developer 12 18.67 3.77 1.089
Development Manager
17 18.71 1.99 0.483
Total 69 19.41 3.45 0.416
IRR percentage
Trader Developer 31 19.48 4.93 0.885
Investor Developer 11 15.23 4.36 1.313
Development Manager
13 17.96 4.82 1.338
Total 55 18.27 4.99 0.673
ROE percentage
Trader Developer 8 39.38 27.05 9.564
Investor Developer 5 34.00 31.50 14.089
Development Manager
3 41.67 24.66 14.240
Total 16 38.13 26.39 6.597
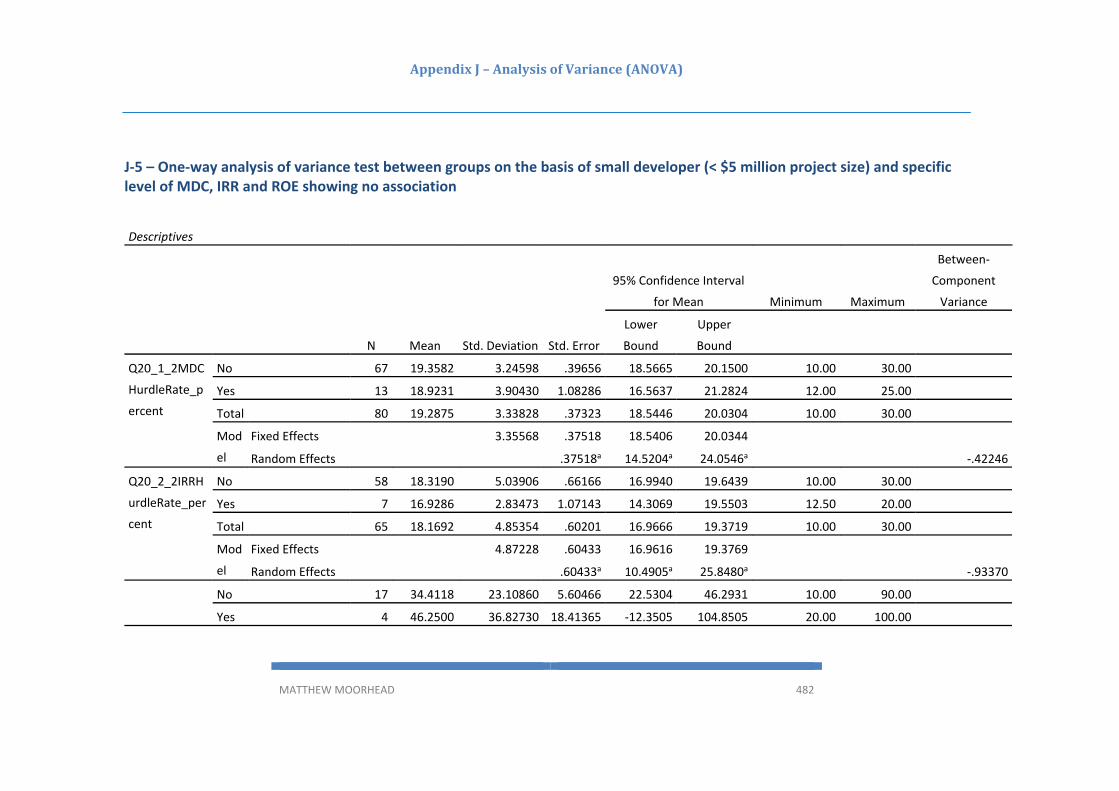
AppendixJ–AnalysisofVariance(ANOVA)
MATTHEW MOORHEAD 482
J‐5 – One‐way analysis of variance test between groups on the basis of small developer (< $5 million project size) and specific level of MDC, IRR and ROE showing no association
Descriptives
N Mean Std. Deviation Std. Error
95% Confidence Interval
for Mean Minimum Maximum
Between‐
Component
Variance
Lower
Bound
Upper
Bound
Q20_1_2MDC
HurdleRate_p
ercent
No 67 19.3582 3.24598 .39656 18.5665 20.1500 10.00 30.00
Yes 13 18.9231 3.90430 1.08286 16.5637 21.2824 12.00 25.00
Total 80 19.2875 3.33828 .37323 18.5446 20.0304 10.00 30.00
Mod
el
Fixed Effects 3.35568 .37518 18.5406 20.0344
Random Effects .37518a 14.5204a 24.0546a ‐.42246
Q20_2_2IRRH
urdleRate_per
cent
No 58 18.3190 5.03906 .66166 16.9940 19.6439 10.00 30.00
Yes 7 16.9286 2.83473 1.07143 14.3069 19.5503 12.50 20.00
Total 65 18.1692 4.85354 .60201 16.9666 19.3719 10.00 30.00
Mod
el
Fixed Effects 4.87228 .60433 16.9616 19.3769
Random Effects .60433a 10.4905a 25.8480a ‐.93370
No 17 34.4118 23.10860 5.60466 22.5304 46.2931 10.00 90.00
Yes 4 46.2500 36.82730 18.41365 ‐12.3505 104.8505 20.00 100.00

AppendixJ–AnalysisofVariance(ANOVA)
MATTHEW MOORHEAD 483
Q20_4_2ROEH
urdleRate_per
cent
Total 21 36.6667 25.56039 5.57773 25.0317 48.3016 10.00 100.00
Mod
el
Fixed Effects 25.76500 5.62238 24.8989 48.4345
Random Effects 5.62238a ‐34.7725a 108.1058a ‐32.43205
a. Warning: Between‐component variance is negative. It was replaced by 0.0 in computing this random effects measure.
ANOVA
Sum of
Squares df Mean Square F Sig.
Q20_1_2MDCHurdleRat
e_percent
Between Groups 2.061 1 2.061 .183 .670
Within Groups 878.326 78 11.261
Total 880.388 79
Q20_2_2IRRHurdleRate
_percent
Between Groups 12.075 1 12.075 .509 .478
Within Groups 1495.563 63 23.739
Total 1507.638 64
Q20_4_2ROEHurdleRate
_percent
Between Groups 453.799 1 453.799 .684 .419
Within Groups 12612.868 19 663.835
Total 13066.667 20

AppendixJ–AnalysisofVariance(ANOVA)
MATTHEW MOORHEAD 484
J‐6 – One‐way Analysis of Variance test between groups on the basis of use of ROE and number of specific hurdle rates used Descriptives
Number of specific hurdle rates
N Mean
Std.
Deviation Std. Error
95% Confidence Interval for
Mean
Minimum Maximum Lower Bound Upper Bound
No 184 1.15 1.120 .083 .99 1.32 0 5
Yes 21 3.48 1.940 .423 2.59 4.36 1 9
Total 205 1.39 1.412 .099 1.20 1.58 0 9
ANOVA
Number of specific hurdle rates
Sum of Squares df Mean Square F Sig.
Between Groups 101.803 1 101.803 67.763 .000
Within Groups 304.977 203 1.502
Total 406.780 204

AppendixJ–AnalysisofVariance(ANOVA)
MATTHEW MOORHEAD 485
J‐7 – One‐way Analysis of Variance test between groups on the basis of years of experience and number of specific hurdle rates used and the specific levels adopted ANOVA
Sum of
Squares df Mean Square F Sig.
Q28_Forecast_Var_Num Between Groups 29.727 3 9.909 .501 .682
Within Groups 2986.622 151 19.779
Total 3016.348 154
Number of specific
hurdle rates
Between Groups .766 3 .255 .127 .944
Within Groups 370.186 184 2.012
Total 370.952 187
MDC percentage Between Groups 32.620 3 10.873 .999 .398
Within Groups 848.758 78 10.882
Total 881.378 81
IRR percentage Between Groups 50.127 3 16.709 .709 .550
Within Groups 1460.812 62 23.561
Total 1510.939 65
ROE percentage Between Groups 1342.560 3 447.520 .649 .594
Within Groups 11724.107 17 689.653
Total 13066.667 20

AppendixJ–AnalysisofVariance(ANOVA)
MATTHEW MOORHEAD 486
Descriptives
N Mean Std. Deviation Std. Error
Q28_Forecast_Var_Num
1 ‐ 2 years experience 37 9.30 4.743 0.780
2 ‐ 5 years experience 34 9.32 5.007 0.859
5 ‐ 10 years experience 38 8.63 4.290 0.696
10+ years experience 46 9.83 3.855 0.568
Total 155 9.30 4.426 0.355
Number of specific hurdle rates
1 ‐ 2 years experience 43 1.44 1.297 0.198
2 ‐ 5 years experience 49 1.47 1.569 0.224
5 ‐ 10 years experience 43 1.53 1.594 0.243
10+ years experience 53 1.60 1.198 0.165
Total 188 1.52 1.408 0.103
MDC percentage
1 ‐ 2 years experience 16 19.3125 3.84220 0.96055
2 ‐ 5 years experience 22 20.2273 3.99919 0.85263
5 ‐ 10 years experience 18 19.2222 2.94170 0.69337
10+ years experience 26 18.5769 2.40288 0.47124
Total 82 19.3049 3.29867 0.36428
IRR percentage
1 ‐ 2 years experience 14 16.6429 3.36514 0.89937
2 ‐ 5 years experience 16 18.1563 5.43973 1.35993
5 ‐ 10 years experience 14 18.5000 6.53688 1.74705
10+ years experience 22 19.0227 3.86830 0.82472
Total 66 18.1970 4.82133 0.59346
ROE percentage
1 ‐ 2 years experience 4 37.5000 35.23729 17.61865
2 ‐ 5 years experience 7 27.1429 10.35098 3.91230
5 ‐ 10 years experience 4 36.2500 22.86737 11.43369
10+ years experience 6 47.5000 34.02205 13.88944
Total 21 36.6667 25.56039 5.57773

AppendixJ–AnalysisofVariance(ANOVA)
MATTHEW MOORHEAD 487

AppendixJ–AnalysisofVariance(ANOVA)
MATTHEW MOORHEAD 488
J‐X – One‐way Analysis of Variance test between groups on the basis of preferred project size and risk tolerance perceptions. (In Output 11 01 2019 RQ 2b) Descriptives
Q31_B_Risk_Tolerance_Numerical
N Mean
Std.
Deviation
Std.
Error
95% Confidence
Interval for Mean
Minimu
m
Maximu
m
Between-
Compone
nt
Variance
Lower
Bound
Upper
Bound
$0 - $5 million 25 .08 .759 .152 -.23 .39 -1 1
$5 - $10 million 23 -.39 .722 .151 -.70 -.08 -1 1
$10 - $50 million 34 -.32 .638 .109 -.55 -.10 -1 1
$50 - $100 million 29 .07 .753 .140 -.22 .36 -1 1
$100 million + 54 -.13 .674 .092 -.31 .05 -1 1
Total 165 -.14 .715 .056 -.25 -.03 -1 1
Model Fixed Effects .701 .055 -.25 -.03
Random
Effects
.092 -.39 .11
.024
Levene's Test of Equality of Error Variancesa,b
Levene Statistic df1 df2 Sig.
Q20_2_1IRR_Usage Based on Mean 16.303 3 166 .000
Based on Median 4.403 3 166 .005
Based on Median and with
adjusted df
4.403 3 159.119 .005
Based on trimmed mean 16.303 3 166 .000
Tests the null hypothesis that the error variance of the dependent variable is equal across groups.
a. Dependent variable: Q20_2_1IRR_Usage
b. Design: Intercept + Q6b_Ownership_Condensed + Q10ProjectSizeLargeorSmall + Q6b_Ownership_Condensed
* Q10ProjectSizeLargeorSmall

AppendixJ–AnalysisofVariance(ANOVA)
MATTHEW MOORHEAD 489
ANOVA
Q31_B_Risk_Tolerance_Numerical
Sum of Squares df Mean Square F Sig.
Between Groups 5.080 4 1.270 2.581 .039
Within Groups 78.714 160 .492
Total 83.794 164
Multiple Comparisons
Dependent Variable: Q31_B_Risk_Tolerance_Numerical
Tukey HSD
(I)
Q10DEVSIZEDomina
ntSizeofProjectin$orif
morethanone
(J)
Q10DEVSIZEDomina
ntSizeofProjectin$orif
morethanone
Mean
Difference
(I-J) Std. Error Sig.
95% Confidence Interval
Lower
Bound
Upper
Bound
$0 - $5 million $5 - $10 million .471 .203 .142 -.09 1.03
$10 - $50 million .404 .185 .191 -.11 .91
$50 - $100 million .011 .191 1.000 -.52 .54
$100 million + .210 .170 .731 -.26 .68
$5 - $10 million $0 - $5 million -.471 .203 .142 -1.03 .09
$10 - $50 million -.068 .189 .996 -.59 .45
$50 - $100 million -.460 .196 .135 -1.00 .08
$100 million + -.262 .175 .565 -.74 .22
$10 - $50 million $0 - $5 million -.404 .185 .191 -.91 .11
$5 - $10 million .068 .189 .996 -.45 .59
$50 - $100 million -.392 .177 .180 -.88 .10
$100 million + -.194 .154 .714 -.62 .23
$50 - $100 million $0 - $5 million -.011 .191 1.000 -.54 .52
$5 - $10 million .460 .196 .135 -.08 1.00
$10 - $50 million .392 .177 .180 -.10 .88
$100 million + .199 .161 .734 -.25 .64
$100 million + $0 - $5 million -.210 .170 .731 -.68 .26
$5 - $10 million .262 .175 .565 -.22 .74
$10 - $50 million .194 .154 .714 -.23 .62
$50 - $100 million -.199 .161 .734 -.64 .25
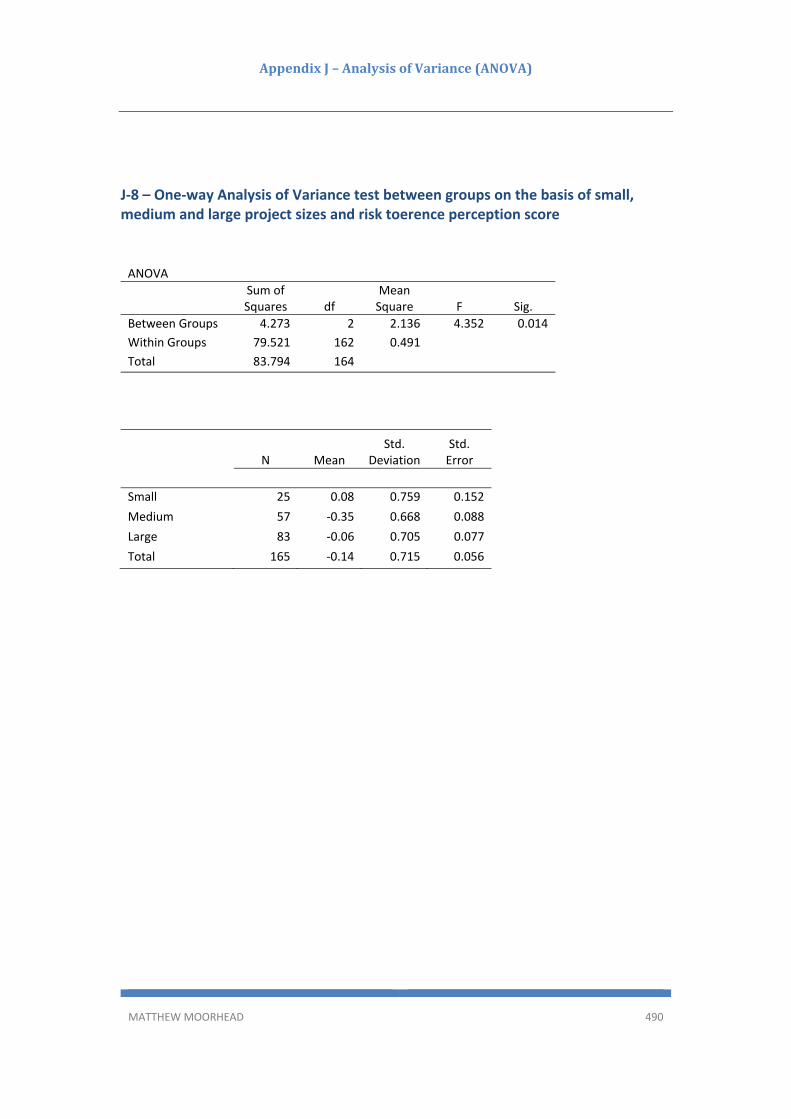
AppendixJ–AnalysisofVariance(ANOVA)
MATTHEW MOORHEAD 490
J‐8 – One‐way Analysis of Variance test between groups on the basis of small, medium and large project sizes and risk toerence perception score ANOVA
Sum of Squares df
Mean Square F Sig.
Between Groups 4.273 2 2.136 4.352 0.014
Within Groups 79.521 162 0.491
Total 83.794 164
N Mean Std.
Deviation Std. Error
Small 25 0.08 0.759 0.152
Medium 57 ‐0.35 0.668 0.088
Large 83 ‐0.06 0.705 0.077
Total 165 ‐0.14 0.715 0.056