bond q2 compass 2019 the future of bond trading and …
TRANSCRIPT
05 Investor Sentiment — Flows and Holdings
10 PriceStats®
13 Interview with a Portfolio Manager
18 Q2 Investment Outlook
22 Panel Discussion —The Future of...
Q2 2019
Bond Compass The Future of Bond Trading and Technology
2 Bond Compass Q2 2019
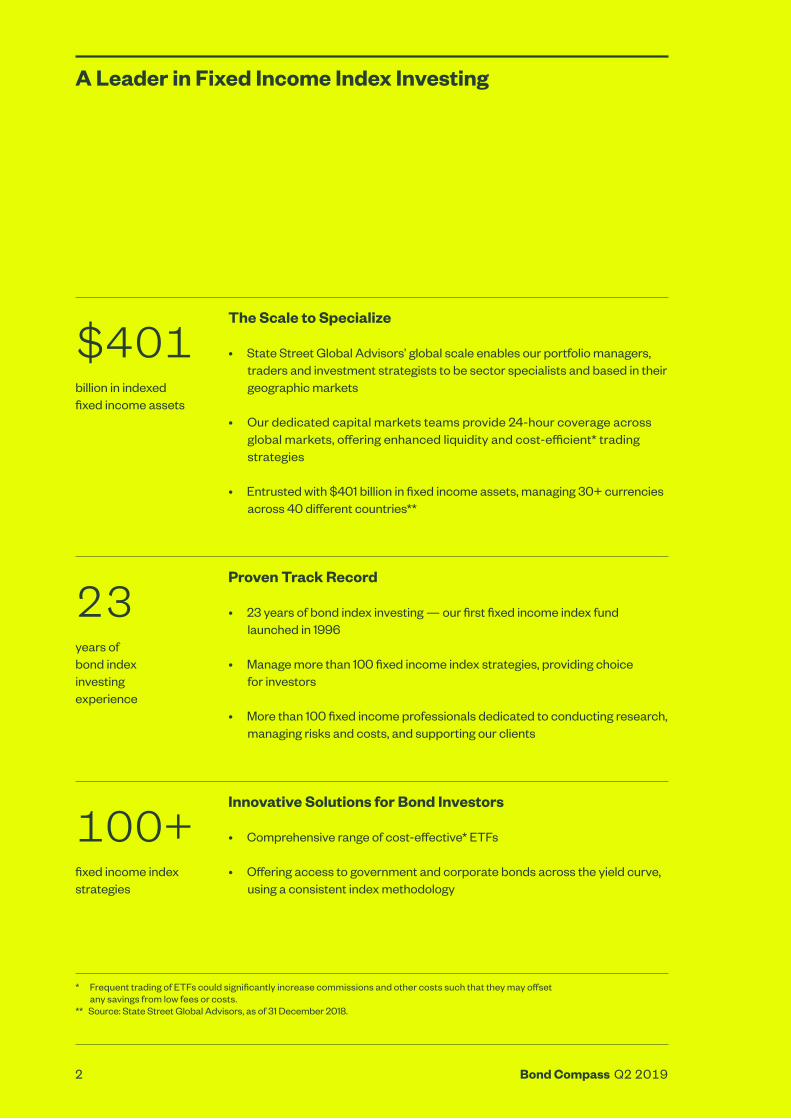
$401billion in indexed fixed income assets
23years of bond index investing experience
100+fixed income index strategies
The Scale to Specialize
• State Street Global Advisors’ global scale enables our portfolio managers, traders and investment strategists to be sector specialists and based in their geographic markets
• Our dedicated capital markets teams provide 24-hour coverage across global markets, offering enhanced liquidity and cost-efficient* trading strategies
• Entrusted with $401 billion in fixed income assets, managing 30+ currencies across 40 different countries**
Proven Track Record
• 23 years of bond index investing — our first fixed income index fund launched in 1996
• Manage more than 100 fixed income index strategies, providing choice for investors
• More than 100 fixed income professionals dedicated to conducting research, managing risks and costs, and supporting our clients
Innovative Solutions for Bond Investors
• Comprehensive range of cost-effective* ETFs
• Offering access to government and corporate bonds across the yield curve, using a consistent index methodology
* Frequent trading of ETFs could significantly increase commissions and other costs such that they may offset any savings from low fees or costs.
** Source: State Street Global Advisors, as of 31 December 2018.
A Leader in Fixed Income Index Investing
3 Bond Compass Q2 2019
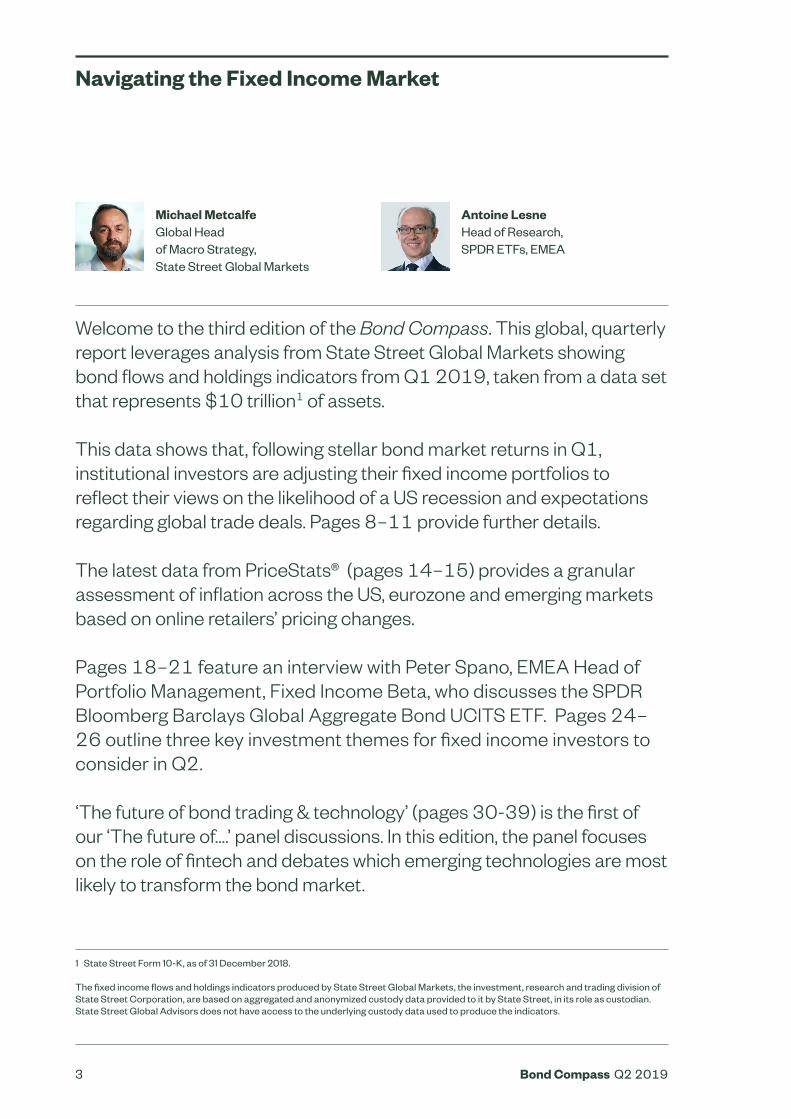
Michael Metcalfe Global Head of Macro Strategy,State Street Global Markets
Antoine LesneHead of Research, SPDR ETFs, EMEA
1 State Street Form 10-K, as of 31 December 2018. The fixed income flows and holdings indicators produced by State Street Global Markets, the investment, research and trading division of State Street Corporation, are based on aggregated and anonymized custody data provided to it by State Street, in its role as custodian. State Street Global Advisors does not have access to the underlying custody data used to produce the indicators.
Navigating the Fixed Income Market
Welcome to the third edition of the Bond Compass. This global, quarterly report leverages analysis from State Street Global Markets showing bond flows and holdings indicators from Q1 2019, taken from a data set that represents $10 trillion1 of assets.
This data shows that, following stellar bond market returns in Q1, institutional investors are adjusting their fixed income portfolios to reflect their views on the likelihood of a US recession and expectations regarding global trade deals. Pages 8–11 provide further details.
The latest data from PriceStats® (pages 14–15) provides a granular assessment of inflation across the US, eurozone and emerging markets based on online retailers’ pricing changes.
Pages 18–21 feature an interview with Peter Spano, EMEA Head of Portfolio Management, Fixed Income Beta, who discusses the SPDR Bloomberg Barclays Global Aggregate Bond UCITS ETF. Pages 24–26 outline three key investment themes for fixed income investors to consider in Q2.
‘The future of bond trading & technology’ (pages 30-39) is the first of our ‘The future of….’ panel discussions. In this edition, the panel focuses on the role of fintech and debates which emerging technologies are most likely to transform the bond market.
4 Bond Compass Q2 2019
Contents
05 Investor Sentiment — Flows and Holdings
A snapshot of global fixed income flows, holdings and valuations, based on data provided by State Street Global Markets.
10 PriceStats® Quarterly measure of inflation based on prices from millions of items sold by online retailers, helping investors anticipate and evaluate the impact of inflation.
13 Interview with a Portfolio Manager
Peter Spano, EMEA Head of Portfolio Management, Fixed Income Beta, discusses how investors are incorporating Global Agg into their portfolios, the impact of China’s inclusion in the index, and the importance of currency hedging.
18 Q2 Investment Outlook
State Street Global Advisors has identified the key considerations for investors in the coming quarter, and how markets can be navigated using SPDR ETFs.
22 Panel Discussion — The Future of...
Our panel of experts discuss which emerging technologies might transform the bond market, how big data could improve trading efficiencies, and the role of ETFs.
5 Bond Compass Q2 2019
* The fixed income flows and holdings indicators produced by State Street Global Markets, the investment, research and trading division of State Street Corporation, are based on aggregated and anonymized custody data provided to it by State Street, in its role as custodian. State Street Global Advisors does not have access to the underlying custody data used to produce the indicators.
A snapshot of global fixed income flows, holdings and valuations, based on data provided by State Street Global Markets.*
Investor Sentiment — Flows and Holdings
6 Bond Compass Q2 2019
State Street Global Markets builds indicators of aggregated long-term investor behaviour in fixed income markets from a substantial subset of $10 trillion worth of fixed income assets under custody and administration at State Street.2
This captures behavioural trends across tens of thousands of portfolios and is estimated to capture just over 10% of outstanding fixed income securities globally.
Analysis
Few expected central banks to capitulate on monetary tightening quite as quickly as they did in Q1. As a consequence, long-term investors were not prepared for the stellar bond market returns that followed. Nevertheless, investors have adjusted their fixed income portfolios, revealing what they believe could happen next.
1 Demand for Treasuries surged into the top quartile as investors chased returns, but they did so primarily at the front end of the curve. Investors are not yet betting on a recession, even though they have reduced their holdings of high yield corporate debt.
2 Growth forecasts have been reduced everywhere, especially in Europe. However, investors’ demand for yield appears to be trumping both growth and fiscal fears, for now, amid continued recovery in flows into Italian sovereign debt and European corporates at the expense of Bunds.
3 Equity investors in emerging markets appear to be waiting for a trade deal, but bond investors have already seen enough and are in the process of buying back their underweight. We note on page 13 that the inflation outlook for emerging market debt is also improving.
Fixed Income Flows and Holdings
2 Source: State Street Global Markets, as of 31 December 2018.
Investor Sentiment
7 Bond Compass Q2 2019
US Sov.
US TIPS
US Treasury 1 to 3
US Treasury 3 to 5
US Treasury 5 to 7
US Treasury 7 to 10
US Treasury 10+
Euro Sov
Euro Govt 1 to 3
Euro Govt 3 to 5
Euro Govt 5 to 7
Euro Govt 7 to 10
Euro Govt 10+
Italy
Germany
France
Spain
UK
EM
Euro Corp
US HY
US IG
US MBS
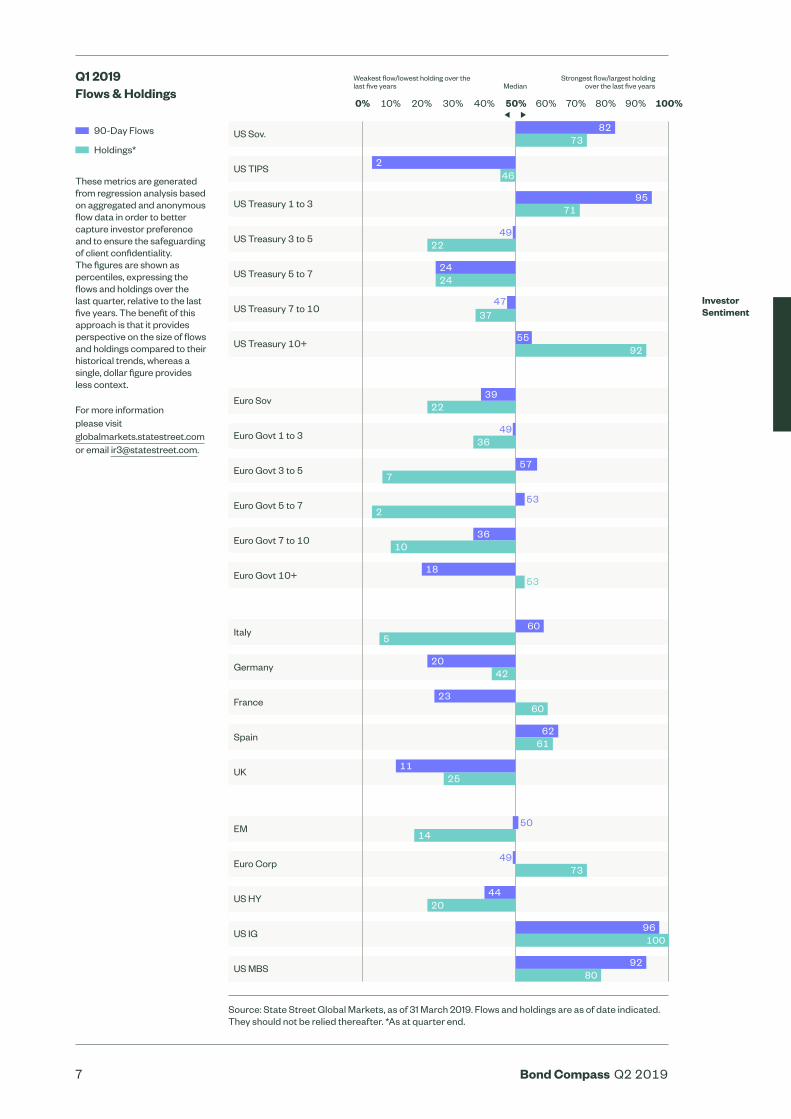
Source: State Street Global Markets, as of 31 March 2019. Flows and holdings are as of date indicated. They should not be relied thereafter. *As at quarter end.
Investor Sentiment
0% 10% 20% 30% 40% 50% 60% 70% 80% 90% 100%
Weakest flow/lowest holding over the last five years
Strongest flow/largest holding over the last five yearsMedian
82
Q1 2019 Flows & Holdings
90-Day Flows
Holdings*
These metrics are generated from regression analysis based on aggregated and anonymous flow data in order to better capture investor preference and to ensure the safeguarding of client confidentiality. The figures are shown as percentiles, expressing the flows and holdings over the last quarter, relative to the last five years. The benefit of this approach is that it provides perspective on the size of flows and holdings compared to their historical trends, whereas a single, dollar figure provides less context.
For more information please visitglobalmarkets.statestreet.comor email [email protected].
92
9280
37
36
36
42
44
24
22
22
23
25
20
20
71
73
73
7
5
10
11
14
18
60
60
6261
24
39
95
96100
2
2
49
49
49
47
46
55
57
53
53
50
8 Bond Compass Q2 2019
Investor Flows in US Corporate Bonds and US Treasuries
Corporate Bonds (IG-HY)
Treasuries
Treasury Flows by Maturity
1 to 3
3 to 5
5 to 7
7 to 10
10 plus
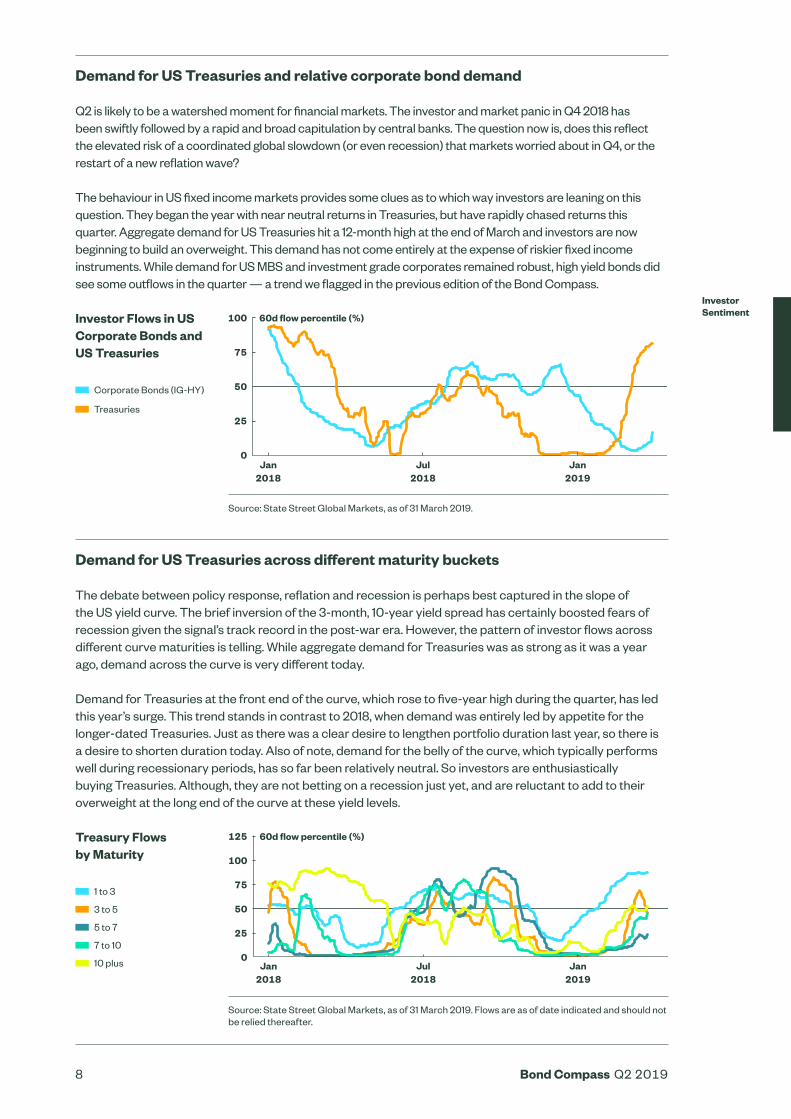
Demand for US Treasuries and relative corporate bond demand
Q2 is likely to be a watershed moment for financial markets. The investor and market panic in Q4 2018 has been swiftly followed by a rapid and broad capitulation by central banks. The question now is, does this reflect the elevated risk of a coordinated global slowdown (or even recession) that markets worried about in Q4, or the restart of a new reflation wave?
The behaviour in US fixed income markets provides some clues as to which way investors are leaning on this question. They began the year with near neutral returns in Treasuries, but have rapidly chased returns this quarter. Aggregate demand for US Treasuries hit a 12-month high at the end of March and investors are now beginning to build an overweight. This demand has not come entirely at the expense of riskier fixed income instruments. While demand for US MBS and investment grade corporates remained robust, high yield bonds did see some outflows in the quarter — a trend we flagged in the previous edition of the Bond Compass.
Demand for US Treasuries across different maturity buckets
The debate between policy response, reflation and recession is perhaps best captured in the slope of the US yield curve. The brief inversion of the 3-month, 10-year yield spread has certainly boosted fears of recession given the signal’s track record in the post-war era. However, the pattern of investor flows across different curve maturities is telling. While aggregate demand for Treasuries was as strong as it was a year ago, demand across the curve is very different today.
Demand for Treasuries at the front end of the curve, which rose to five-year high during the quarter, has led this year’s surge. This trend stands in contrast to 2018, when demand was entirely led by appetite for the longer-dated Treasuries. Just as there was a clear desire to lengthen portfolio duration last year, so there is a desire to shorten duration today. Also of note, demand for the belly of the curve, which typically performs well during recessionary periods, has so far been relatively neutral. So investors are enthusiastically buying Treasuries. Although, they are not betting on a recession just yet, and are reluctant to add to their overweight at the long end of the curve at these yield levels.
Source: State Street Global Markets, as of 31 March 2019.
Source: State Street Global Markets, as of 31 March 2019. Flows are as of date indicated and should not be relied thereafter.
60d flow percentile (%)
0
100
75
50
25
Jan 2018
Jul 2018
Jan 2019
60d flow percentile (%)
0
125
75
100
50
25
Jan 2018
Jul 2018
Jan 2019
Investor Sentiment
9 Bond Compass Q2 2019
Investor Flows in European Bonds
Italian Sov.
French Sov.
Euro Corp.
Flows and Holdings for EM Local Debt
Flows
Holdings
Local currency emerging market sovereign debt recovers
Coordinated global slowdown, ongoing uncertainty around the US-China trade war, localised risks of credit downgrades (South Africa), and lingering political risk (Turkey, Russia) — this sobering medley may not sound like an especially conducive environment for emerging market debt. But as we noted in last quarter’s Bond Compass, long-term investors are already underweight the asset class, and some of the threats are clearly diminishing.
The Fed’s capitulation means the risks of rising US rates and a strengthening dollar are modest. On balance, news about the US-China trade war appears to be meandering to a more constructive outcome. And the recovery in EM currencies means that the inflation threat has turned, too (see page 13). In response, even though recession risk has risen in developed markets, long-term investors continue to return to local currency debt markets. This trend is especially true in Mexico, Indonesia and South Africa. Meanwhile, investors have remained more cautious on Turkey.
Source: State Street Global Markets, as of 31 March 2019.
Source: State Street Global Markets, as of 31 March 2019. Flows are as of date indicated and should not be relied thereafter.
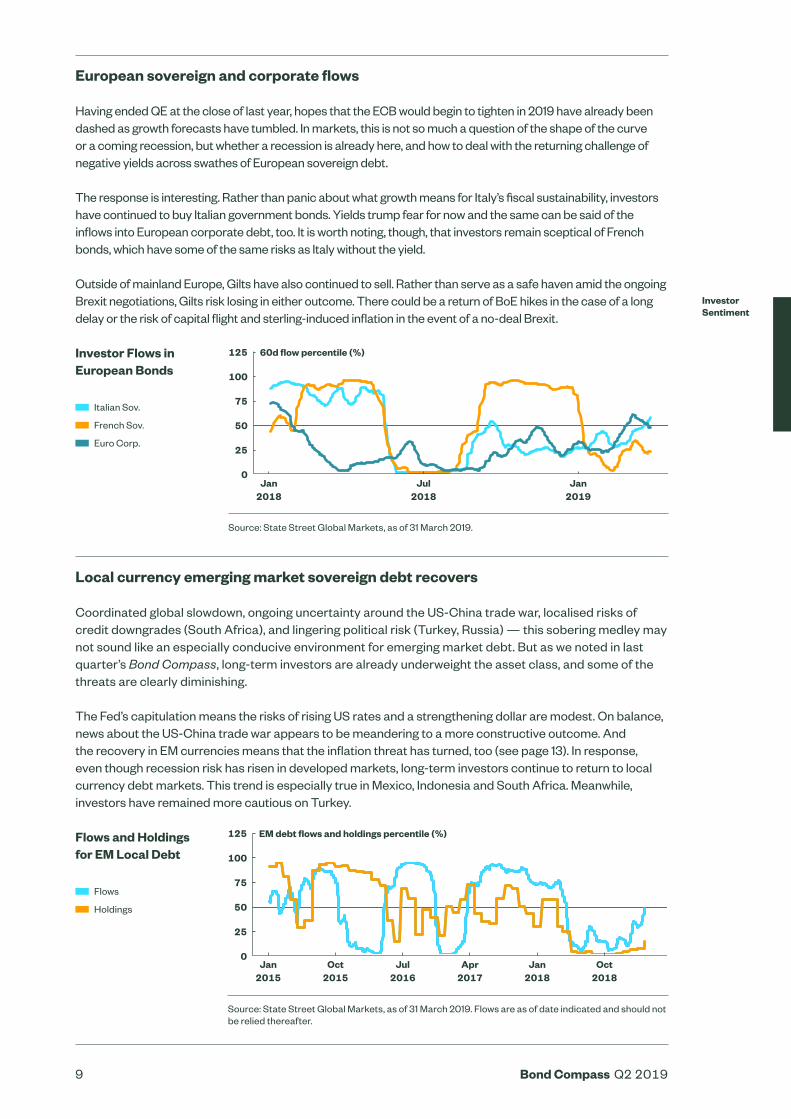
European sovereign and corporate flows
Having ended QE at the close of last year, hopes that the ECB would begin to tighten in 2019 have already been dashed as growth forecasts have tumbled. In markets, this is not so much a question of the shape of the curve or a coming recession, but whether a recession is already here, and how to deal with the returning challenge of negative yields across swathes of European sovereign debt.
The response is interesting. Rather than panic about what growth means for Italy’s fiscal sustainability, investors have continued to buy Italian government bonds. Yields trump fear for now and the same can be said of the inflows into European corporate debt, too. It is worth noting, though, that investors remain sceptical of French bonds, which have some of the same risks as Italy without the yield.
Outside of mainland Europe, Gilts have also continued to sell. Rather than serve as a safe haven amid the ongoing Brexit negotiations, Gilts risk losing in either outcome. There could be a return of BoE hikes in the case of a long delay or the risk of capital flight and sterling-induced inflation in the event of a no-deal Brexit.
Investor Sentiment
60d flow percentile (%)
0
125
75
100
50
25
Jan 2018
Jan 2019
Jul 2018
EM debt flows and holdings percentile (%)
0
125
75
100
50
25
Jan 2015
Oct 2015
Jul 2016
Apr 2017
Jan 2018
Oct 2018
10 Bond Compass Q2 2019
Quarterly measure of inflation based on prices from millions of items sold by online retailers, helping investors anticipate and evaluate the impact of inflation.
PriceStats®
11 Bond Compass Q2 2019
PriceStats® Daily Country Inflation Index (% yoy)
US PriceStats®, yoy%
Official data, yoy%
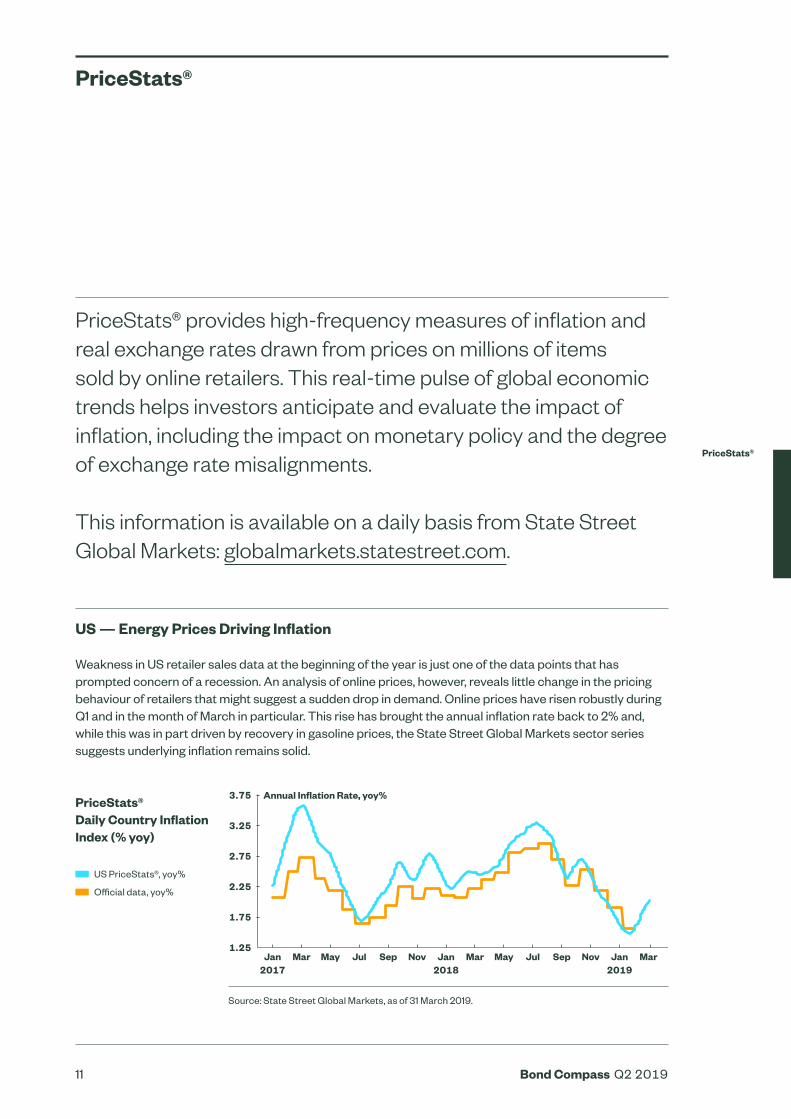
PriceStats® provides high-frequency measures of inflation and real exchange rates drawn from prices on millions of items sold by online retailers. This real-time pulse of global economic trends helps investors anticipate and evaluate the impact of inflation, including the impact on monetary policy and the degree of exchange rate misalignments. This information is available on a daily basis from State Street Global Markets: globalmarkets.statestreet.com.
US — Energy Prices Driving Inflation
Weakness in US retailer sales data at the beginning of the year is just one of the data points that has prompted concern of a recession. An analysis of online prices, however, reveals little change in the pricing behaviour of retailers that might suggest a sudden drop in demand. Online prices have risen robustly during Q1 and in the month of March in particular. This rise has brought the annual inflation rate back to 2% and, while this was in part driven by recovery in gasoline prices, the State Street Global Markets sector series suggests underlying inflation remains solid.
PriceStats®
Source: State Street Global Markets, as of 31 March 2019.
Annual Inflation Rate, yoy%
1.25
3.75
2.25
2.75
3.25
1.75
Jan 2017
Mar May Jul Nov Jan 2018
May Jul Nov Jan 2019
Sep Mar Sep Mar
PriceStats®
12 Bond Compass Q2 2019
PriceStats® Daily Eurozone Inflation Index (% yoy)
Eurozone PriceStats®
Official data
PriceStats® Daily EM Inflation Index (% yoy)
EM PriceStats®
Official data (right hand scale)
PriceStats®
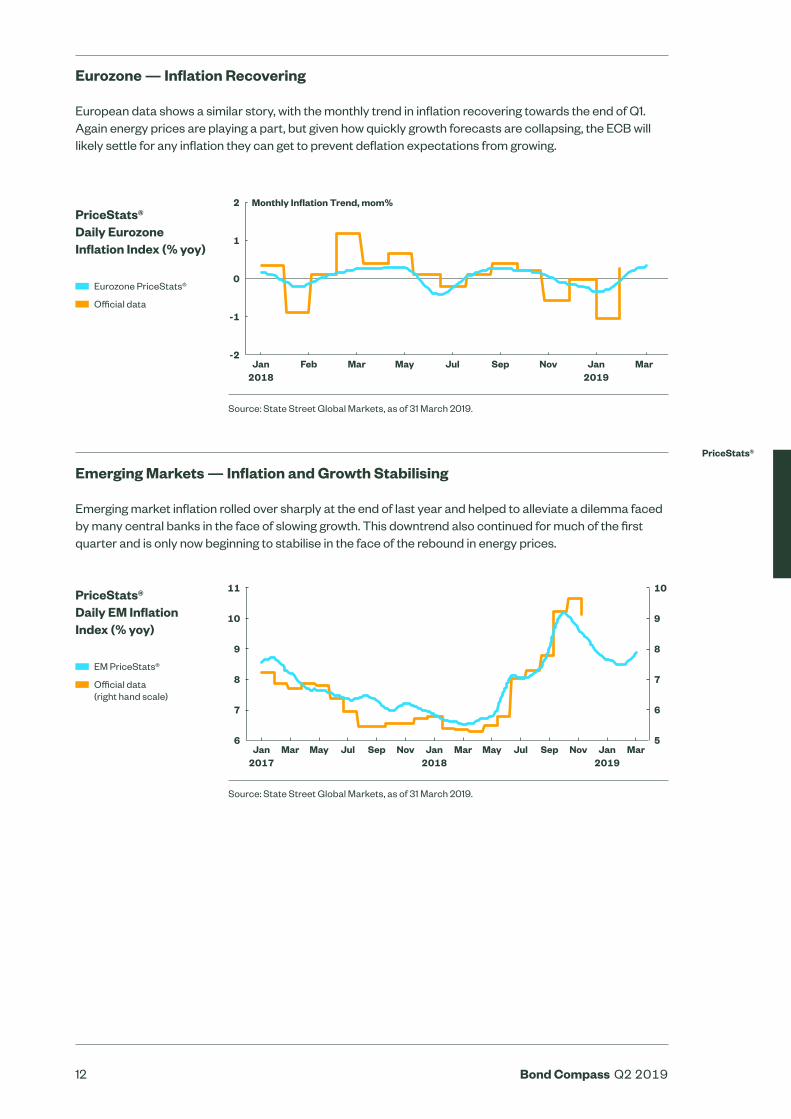
Eurozone — Inflation Recovering
European data shows a similar story, with the monthly trend in inflation recovering towards the end of Q1. Again energy prices are playing a part, but given how quickly growth forecasts are collapsing, the ECB will likely settle for any inflation they can get to prevent deflation expectations from growing.
Emerging Markets — Inflation and Growth Stabilising
Emerging market inflation rolled over sharply at the end of last year and helped to alleviate a dilemma faced by many central banks in the face of slowing growth. This downtrend also continued for much of the first quarter and is only now beginning to stabilise in the face of the rebound in energy prices.
Source: State Street Global Markets, as of 31 March 2019.
Source: State Street Global Markets, as of 31 March 2019.
Monthly Inflation Trend, mom%
-2
2
1
-1
Jan 2018
Feb Mar May Jul Sep Nov Jan 2019
Mar
0
56
11
10
9
8
7
Jan 2017
Mar May Jul Sep Nov Mar May Jul Sep NovJan 2018
Jan 2019
Mar
10
9
8
7
6
13 Bond Compass Q2 2019
Peter Spano, EMEA Head of Portfolio Management, Fixed Income Beta, discusses how investors are incorporating Global Agg into their portfolios, the impact of China’s inclusion in the index, and the importance of currency hedging.
Interview with a Portfolio Manager
14 Bond Compass Q2 2019
About the Portfolio Manager
About the Fund
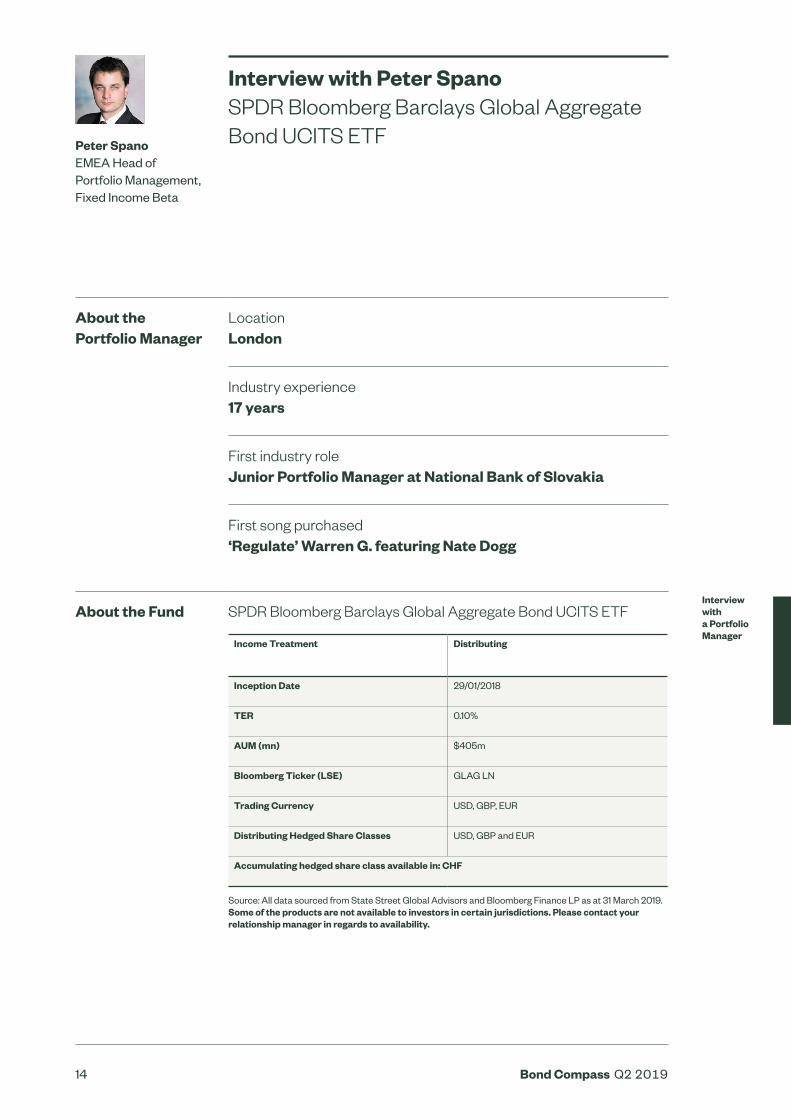
Peter Spano EMEA Head of Portfolio Management, Fixed Income Beta
Interview with Peter Spano SPDR Bloomberg Barclays Global Aggregate Bond UCITS ETF
Location London
Industry experience 17 years
First industry role Junior Portfolio Manager at National Bank of Slovakia
First song purchased ‘Regulate’ Warren G. featuring Nate Dogg
SPDR Bloomberg Barclays Global Aggregate Bond UCITS ETF
Source: All data sourced from State Street Global Advisors and Bloomberg Finance LP as at 31 March 2019. Some of the products are not available to investors in certain jurisdictions. Please contact your relationship manager in regards to availability.
Income Treatment
Distributing
Inception Date 29/01/2018
TER 0.10%
AUM (mn) $405m
Bloomberg Ticker (LSE) GLAG LN
Trading Currency USD, GBP, EUR
Distributing Hedged Share Classes USD, GBP and EUR
Accumulating hedged share class available in: CHF
Interview with a Portfolio Manager
15 Bond Compass Q2 2019
How are investors using the SPDR Global Aggregate Bond UCITS ETF in their portfolios?
Although we have seen investors using the SPDR Global Aggregate Bond UCITS ETF in numerous ways, from equitizing excess portfolio cash to short-term tactical allocation to the broad fixed income market, the main use case we have seen is as a core building block for investors’ fixed income allocation.
The Global Agg index represents over 23,400 securities3, with a total market value of more than $50 trillion, covering multi-currency government bonds and assets such as corporates, mortgage-backed securities and agencies. The Global Agg index is therefore the ultimate fixed income diversification tool.
This diverse exposure can offer lower volatility, as well as better risk-adjusted returns when compared to narrower bond exposures. The exposure can also provide a yield pick-up over other domestic government exposures.
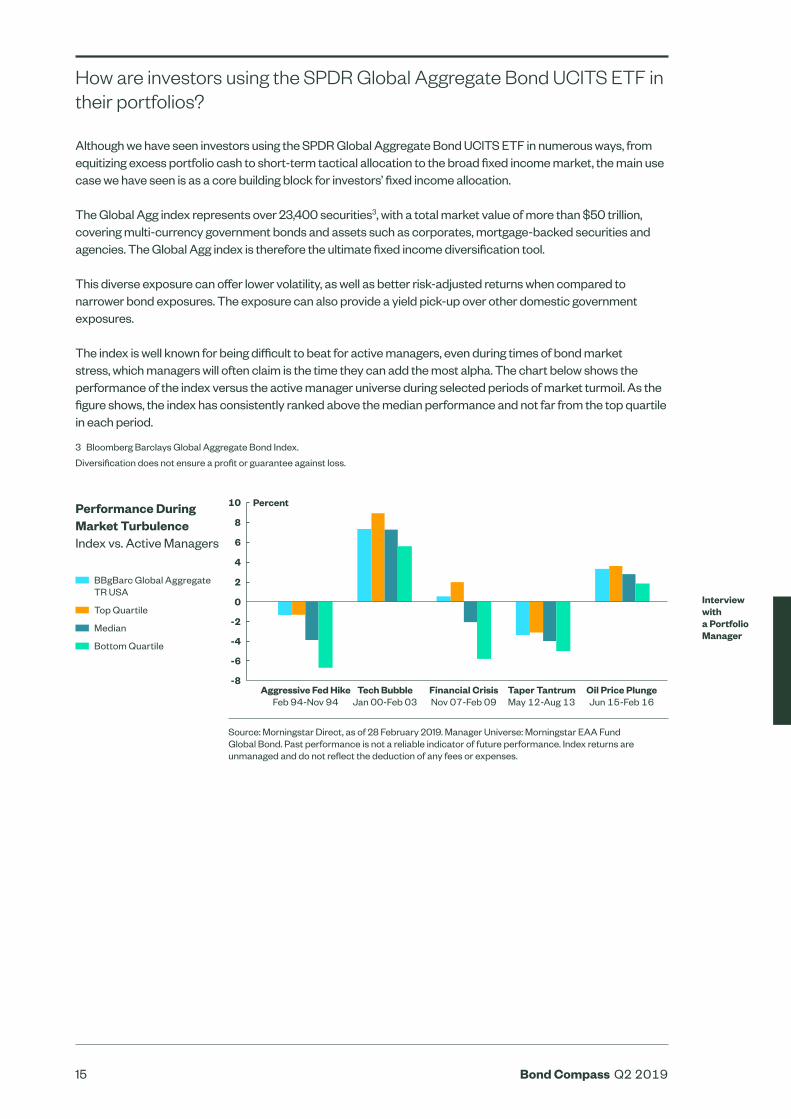
The index is well known for being difficult to beat for active managers, even during times of bond market stress, which managers will often claim is the time they can add the most alpha. The chart below shows the performance of the index versus the active manager universe during selected periods of market turmoil. As the figure shows, the index has consistently ranked above the median performance and not far from the top quartile in each period.
3 Bloomberg Barclays Global Aggregate Bond Index.
Diversification does not ensure a profit or guarantee against loss.
Interview with a Portfolio Manager
Performance During Market Turbulence Index vs. Active Managers
BBgBarc Global Aggregate TR USA
Top Quartile
Median
Bottom Quartile
Source: Morningstar Direct, as of 28 February 2019. Manager Universe: Morningstar EAA Fund Global Bond. Past performance is not a reliable indicator of future performance. Index returns are unmanaged and do not reflect the deduction of any fees or expenses.
Percent10
8
6
4
2
0
-2
-4
-6
-8Aggressive Fed Hike
Feb 94-Nov 94Tech Bubble
Jan 00-Feb 03Financial Crisis Nov 07-Feb 09
Taper Tantrum May 12-Aug 13
Oil Price Plunge Jun 15-Feb 16
16 Bond Compass Q2 2019
How will China’s inclusion in the Global Agg index affect the exposure?
From April 2019, CNY-denominated bonds will be included in the Global Agg index, with the exposure gradually increasing over a 20-month period until fully implemented into the index. Once the inclusion process is complete, CNY will be the fourth-largest currency component of the index, after USD, EUR and JPY.
The two main effects of this change will be that the index yield will rise somewhat, due to the more ‘emerging market’ nature of Chinese bonds, while the duration will fall slightly, as Chinese bonds tend to have a slightly lower maturity than developed market bonds.
Despite these changes, the overall credit quality of the index will remain unaffected, as China has seen its sovereign credit rating climb from BBB to A1 during the last 20 years, currently giving it an equivalent rating to Japan.
The change will also improve the diversification of the index, and historically would have increased the return while also decreasing volatility.
What is unique about your approach to currency hedging?
Currently SPDR ETFs offers four different currency-hedged share classes of the SPDR Global Aggregate Bond UCITS ETF, in USD, GBP, EUR and CHF, as well as our unhedged share class. Unlike some other products in the market, each of these share classes is benchmarked versus the equivalent Bloomberg Barclays Global Aggregate Currency-Hedged index, so that investors can accurately monitor the performance of their exposure.
In order to hedge the currency exposure within the portfolio, we employ rolling one-month forward contracts, which aim to hedge the currency exposure of the underlying securities into the relevant base currency of the hedged index.
We have employed this approach, as we believe it gives greater transparency to our clients as to the methodology we are using to hedge our currency, so they can have a better understanding of our portfolio management process. We also believe that our approach will result in reduced costs from implementing the hedge less frequently, although this may result in less tight hedging relative to a portfolio with the hedge ratio reset more frequently.
Interview with a Portfolio Manager
17 Bond Compass Q2 2019
How can you manage such a large portfolio of bonds in an efficient manner with tight tracking?
State Street Global Advisors has a strong track record of managing indexed fixed income exposures, with over 17 years’ experience managing Global Aggregate strategies. Currently, we manage more than $370 billion in passive fixed income strategies globally, and $67 billion in Aggregate strategies.
Our experienced and specialised portfolio management team consists of more than 30 portfolio managers, averaging more than 14 years of industry experience. We also have 24-hour trading capabilities across three trading desks in each major investment region.
The scale and depth of our organisation enables us to manage broad fixed income exposures efficiently, giving us access to both primary and secondary issuance. Our relationships with local regulators and trading counterparties also gives us access to extra sources of liquidity, as well as offering a greater risk management and operational risk framework.
State Street Global Advisors is also well positioned to manage the Chinese bond inclusion process, as we have been active in the Chinese bond market since 2005, with over $870 million of CNY-denominated securities held in our portfolios.4
4 Source: Bloomberg Finance L.P., as of 31 March 2019.
Interview with a Portfolio Manager
18 Bond Compass Q2 2019
State Street Global Advisors has identified the key considerations for investors in the coming quarter, and how markets can be navigated using SPDR ETFs.
Q2 Investment Outlook
19 Bond Compass Q2 2019
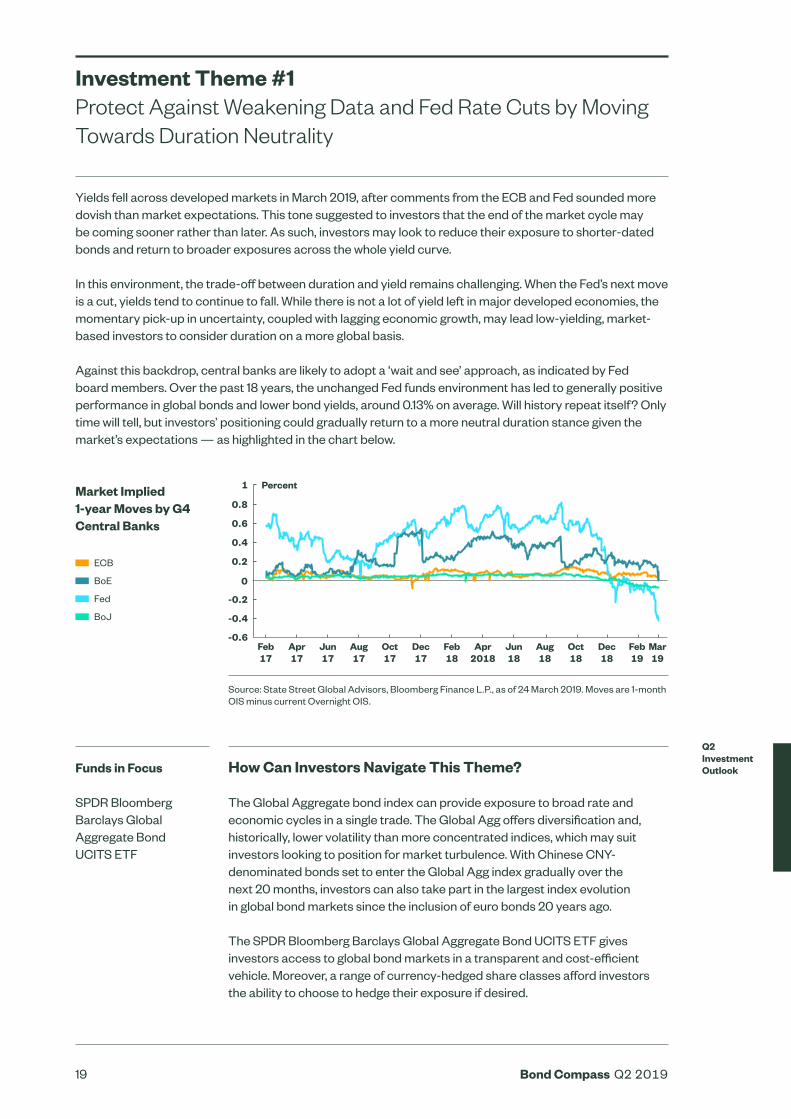
Market Implied 1-year Moves by G4 Central Banks
ECB
BoE
Fed
BoJ
Yields fell across developed markets in March 2019, after comments from the ECB and Fed sounded more dovish than market expectations. This tone suggested to investors that the end of the market cycle may be coming sooner rather than later. As such, investors may look to reduce their exposure to shorter-dated bonds and return to broader exposures across the whole yield curve.
In this environment, the trade-off between duration and yield remains challenging. When the Fed’s next move is a cut, yields tend to continue to fall. While there is not a lot of yield left in major developed economies, the momentary pick-up in uncertainty, coupled with lagging economic growth, may lead low-yielding, market-based investors to consider duration on a more global basis.
Against this backdrop, central banks are likely to adopt a ‘wait and see’ approach, as indicated by Fed board members. Over the past 18 years, the unchanged Fed funds environment has led to generally positive performance in global bonds and lower bond yields, around 0.13% on average. Will history repeat itself? Only time will tell, but investors’ positioning could gradually return to a more neutral duration stance given the market’s expectations — as highlighted in the chart below.
Jun 18
Apr2018
Feb18
Dec17
Oct17
Aug17
Jun17
Apr17
Feb17
Aug 18
Oct 18
Dec 18
Feb19
Mar19
-0.6
-0.4
-0.2
0
0.2
0.4
0.6
0.8
1 Percent
Investment Theme #1 Protect Against Weakening Data and Fed Rate Cuts by Moving Towards Duration Neutrality
How Can Investors Navigate This Theme?
The Global Aggregate bond index can provide exposure to broad rate and economic cycles in a single trade. The Global Agg offers diversification and, historically, lower volatility than more concentrated indices, which may suit investors looking to position for market turbulence. With Chinese CNY-denominated bonds set to enter the Global Agg index gradually over the next 20 months, investors can also take part in the largest index evolution in global bond markets since the inclusion of euro bonds 20 years ago.
The SPDR Bloomberg Barclays Global Aggregate Bond UCITS ETF gives investors access to global bond markets in a transparent and cost-efficient vehicle. Moreover, a range of currency-hedged share classes afford investors the ability to choose to hedge their exposure if desired.
Funds in Focus
SPDR Bloomberg Barclays Global Aggregate Bond UCITS ETF
Source: State Street Global Advisors, Bloomberg Finance L.P., as of 24 March 2019. Moves are 1-month OIS minus current Overnight OIS.
Q2 Investment Outlook
20 Bond Compass Q2 2019
Investment Theme #2 Searching for Yield – Emerging Market Hard Currency Sovereign or Euro High Yield
Q2 Investment Outlook
Funds in Focus
SPDR ICE BofAML 0-5 Year EM USD Government Bond UCITS ETF
SPDR Bloomberg Barclays Euro High Yield Bond UCITS ETF
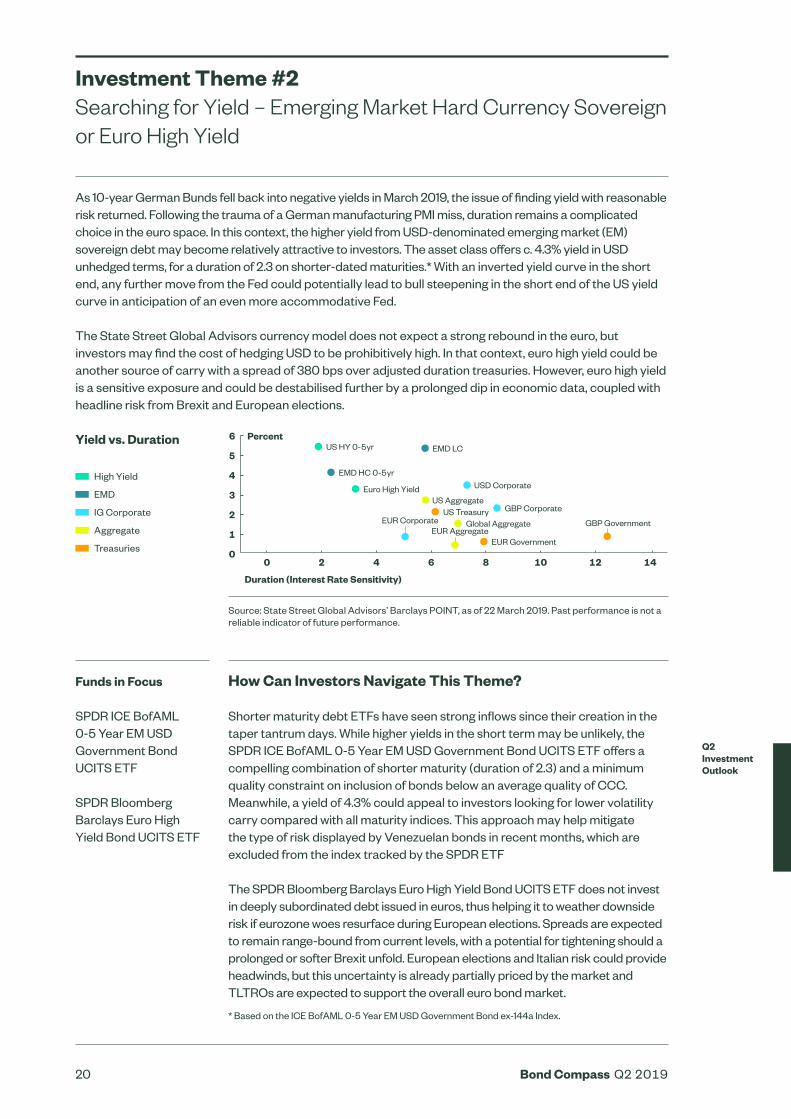
As 10-year German Bunds fell back into negative yields in March 2019, the issue of finding yield with reasonable risk returned. Following the trauma of a German manufacturing PMI miss, duration remains a complicated choice in the euro space. In this context, the higher yield from USD-denominated emerging market (EM) sovereign debt may become relatively attractive to investors. The asset class offers c. 4.3% yield in USD unhedged terms, for a duration of 2.3 on shorter-dated maturities.* With an inverted yield curve in the short end, any further move from the Fed could potentially lead to bull steepening in the short end of the US yield curve in anticipation of an even more accommodative Fed.
The State Street Global Advisors currency model does not expect a strong rebound in the euro, but investors may find the cost of hedging USD to be prohibitively high. In that context, euro high yield could be another source of carry with a spread of 380 bps over adjusted duration treasuries. However, euro high yield is a sensitive exposure and could be destabilised further by a prolonged dip in economic data, coupled with headline risk from Brexit and European elections.
Yield vs. Duration
High Yield
EMD
IG Corporate
Aggregate
Treasuries
Source: State Street Global Advisors’ Barclays POINT, as of 22 March 2019. Past performance is not a reliable indicator of future performance.
EMD LC
EMD HC 0-5yr
Euro High Yield USD Corporate
US Treasury GBP Corporate
Global AggregateEUR Corporate
EUR Government
GBP GovernmentEUR Aggregate
US Aggregate
Percent
Duration (Interest Rate Sensitivity)
0
6
5
4
3
2
1
0 2 4 6 8 10 12 14
US HY 0-5yr
How Can Investors Navigate This Theme?
Shorter maturity debt ETFs have seen strong inflows since their creation in the taper tantrum days. While higher yields in the short term may be unlikely, the SPDR ICE BofAML 0-5 Year EM USD Government Bond UCITS ETF offers a compelling combination of shorter maturity (duration of 2.3) and a minimum quality constraint on inclusion of bonds below an average quality of CCC. Meanwhile, a yield of 4.3% could appeal to investors looking for lower volatility carry compared with all maturity indices. This approach may help mitigate the type of risk displayed by Venezuelan bonds in recent months, which are excluded from the index tracked by the SPDR ETF The SPDR Bloomberg Barclays Euro High Yield Bond UCITS ETF does not invest in deeply subordinated debt issued in euros, thus helping it to weather downside risk if eurozone woes resurface during European elections. Spreads are expected to remain range-bound from current levels, with a potential for tightening should a prolonged or softer Brexit unfold. European elections and Italian risk could provide headwinds, but this uncertainty is already partially priced by the market and TLTROs are expected to support the overall euro bond market.
* Based on the ICE BofAML 0-5 Year EM USD Government Bond ex-144a Index.
21 Bond Compass Q2 2019
How Can Investors Navigate This Theme?
EM exposures have an average duration of 5.6 and a yield of 5.9%, thus offering a better trade-off than their developed market (DM) counterparts. The real yield (c. 3%) and higher carry compare favourably to global government bond indices.
Diversification is also extremely important in this market segment. In early April 2019, as per inclusion rules, portfolio managers for State Street Global Advisors began buying Chinese government bonds for the SPDR Bloomberg Barclays Emerging Markets Local Bond UCITS ETF. Dovish Chinese government policy and the inclusion of China in the broader Bloomberg Barclays bond indices could push yields lower.
EM local currency sovereign debt may become increasingly suitable for the core of an investor’s portfolio as economic growth trajectories converge across both EM and DM.
Investment Theme #3 Emerging Market Debt Local Currency — A Potential Beneficiary of Lower Growth
Funds in Focus
SPDR Bloomberg Barclays Emerging Markets Local Bond UCITS ETF
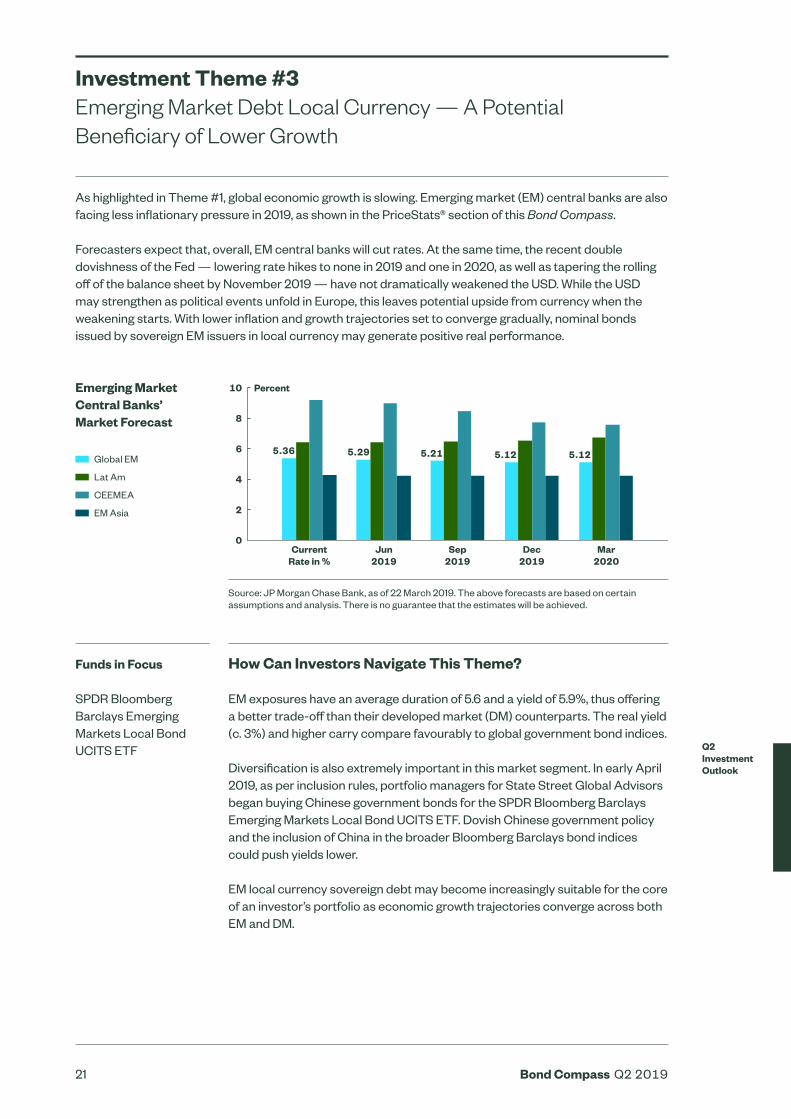
As highlighted in Theme #1, global economic growth is slowing. Emerging market (EM) central banks are also facing less inflationary pressure in 2019, as shown in the PriceStats® section of this Bond Compass.
Forecasters expect that, overall, EM central banks will cut rates. At the same time, the recent double dovishness of the Fed — lowering rate hikes to none in 2019 and one in 2020, as well as tapering the rolling off of the balance sheet by November 2019 — have not dramatically weakened the USD. While the USD may strengthen as political events unfold in Europe, this leaves potential upside from currency when the weakening starts. With lower inflation and growth trajectories set to converge gradually, nominal bonds issued by sovereign EM issuers in local currency may generate positive real performance.
Emerging Market Central Banks’ Market Forecast
Global EM
Lat Am
CEEMEA
EM Asia
Source: JP Morgan Chase Bank, as of 22 March 2019. The above forecasts are based on certain assumptions and analysis. There is no guarantee that the estimates will be achieved.
Percent
0
10
8
6
4
Current Rate in %
5.36 5.29 5.21 5.12 5.12
Jun2019
Sep2019
Dec2019
Mar2020
2
Q2 Investment Outlook

22 Bond Compass Q2 2019
Our panel of experts discuss which emerging technologies might transform the bond market, how big data could improve trading efficiencies and the role of ETFs.
Panel Discussion — The Future of...
23 Bond Compass Q2 2019
The Future of Bond Trading and Technology
In the first of our roundtable discussions, our panel of experts debate which emerging technologies are likely to change the bond market, the potential impact of distributed ledger and blockchain, and how big data could improve trading efficiencies. The panelists also discuss the role of fintech and how specialised start-ups may disrupt and improve trading ecosystems, in addition to the role of ETFs and how they may continue to transform fixed income trading.
Panel Discussion

24 Bond Compass Q2 2019
Christopher Purves Head of Strategic Development Lab, UBS
Pinar Emirdag Head of Digital Product Development & Innovation, State Street
Stephen Yeats Head of Fixed Income, Cash & Currency, State Street Global Advisors EMEA (moderator)
Christopher Purves
I would argue that it is tokenization and digitalization of cash and assets. This year or early next year, we would expect to see the first four or five main currencies digitalized. Once you have a form of tokenized cash, that simplifies settlements and should reduce capital requirements. We will have to deal with the possibility that you can settle something fairly instantly and, as a market, we’re not currently designed for that.
We have very similar views although our framework is a bit different — we do focus on the future of money. We think that the way money is described is changing. The idea is that, if the money and assets are changing, so the future of markets is going to be very different as a concept. We actually can look at everything across the value chain of the markets, from issuance to trading to distribution price formation all the way to custody and settlement. But there’s an overarching topic; it’s not just about one piece of technology — it’s really around how the technology is actually driven by broader market trends.
Chris — if we do go through this transition to tokenization and therefore a real change in the way that the market structure and business models are structured, how does that then affect financial markets in terms of trading?
Most people would agree that the increased capital requirements over the last few years have been a dampener in terms of activity. I think with tokenization, you could get a release of capital and that will flood back into the system and potentially it could actually be very positive for markets.
Panel Discussion
What do you think could be the single most important technology trend to affect fixed income markets and trading in the next five years?
Tokenization A token is a generic, quantified unit of value represented on a ledger of some sort. “Tokenisation” can be defined as the conversion of the rights or value of assets into a digital token. Tokens can be native (i.e. token as the security) or non-native (the token is the ‘representation’ of a security held elsewhere). These tokens can then be stored and managed on a blockchain or distributed ledger network.
Distributed ledger technology (DLT) Any data storage concept that attempts to record transactional data on multiple machines in a distributed and decentralized network. The ledger is shared, secured and synchronized among the participants on the network.
25 Bond Compass Q2 2019
I think the hype is actually quite justified. That combination of digital tools, the digital transformation and what that’s actually going to bring to the marketplace is interesting, and I think beyond that we are not even scratching the surface yet. Distributed ledger technology (DLT) has been discussed for probably five, six years but yet we are still in the early stages and there are just so many things to do. We are thinking about these technologies in the right way today more from a business perspective as opposed to just a pure standalone technology perspective.
The key is taking a new piece of technology and combining it with a new business model change. In itself, the ledger is not that interesting — it’s just a piece of technology. What becomes very exciting is when you actually change the way we do things to use that technology.
There’s been a lot of hype around individual fintechs trying to use ledger and trying to come up with ideas. My belief is that, in that space, it doesn’t necessarily work. I don’t think you’re going to get fintechs taking the bond market away, for example. In terms of AI, I think there are wonderful examples of it working today. Things like smart order routers using machine learning to route in real time and learn in real time. It’s helping. But you’ve also got a lot of machine learning out there that isn’t useful yet.
“ In itself, the ledger is not that interesting — it’s just a piece of technology. What becomes very exciting is when you actually change the way we do things to use that technology.
We see more point solutions in fintech at this stage. When they start connecting, fintech solutions such as AI and DLT will make a big difference due to network effects.
Pinar Emirdag
Christopher Purves
Pinar Emirdag
Is the hype around the applications of AI and distributed ledger technology justified?
Panel Discussion
26 Bond Compass Q2 2019
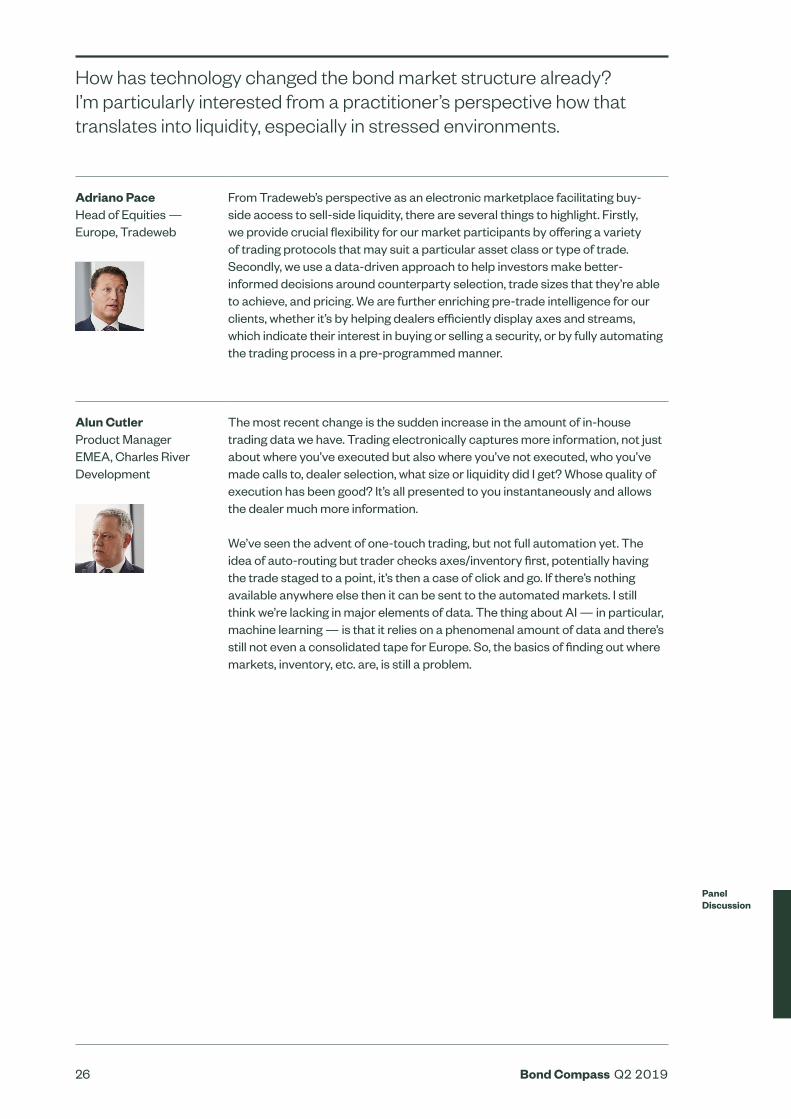
From Tradeweb’s perspective as an electronic marketplace facilitating buy-side access to sell-side liquidity, there are several things to highlight. Firstly, we provide crucial flexibility for our market participants by offering a variety of trading protocols that may suit a particular asset class or type of trade. Secondly, we use a data-driven approach to help investors make better-informed decisions around counterparty selection, trade sizes that they’re able to achieve, and pricing. We are further enriching pre-trade intelligence for our clients, whether it’s by helping dealers efficiently display axes and streams, which indicate their interest in buying or selling a security, or by fully automating the trading process in a pre-programmed manner.
The most recent change is the sudden increase in the amount of in-house trading data we have. Trading electronically captures more information, not just about where you’ve executed but also where you’ve not executed, who you’ve made calls to, dealer selection, what size or liquidity did I get? Whose quality of execution has been good? It’s all presented to you instantaneously and allows the dealer much more information. We’ve seen the advent of one-touch trading, but not full automation yet. The idea of auto-routing but trader checks axes/inventory first, potentially having the trade staged to a point, it’s then a case of click and go. If there’s nothing available anywhere else then it can be sent to the automated markets. I still think we’re lacking in major elements of data. The thing about AI — in particular, machine learning — is that it relies on a phenomenal amount of data and there’s still not even a consolidated tape for Europe. So, the basics of finding out where markets, inventory, etc. are, is still a problem.
Panel Discussion
Adriano Pace Head of Equities — Europe, Tradeweb
Alun Cutler Product Manager EMEA, Charles River Development
How has technology changed the bond market structure already? I’m particularly interested from a practitioner’s perspective how that translates into liquidity, especially in stressed environments.

27 Bond Compass Q2 2019
The consolidated tape was expected to be put in place for some time, but hasn’t yet been implemented. I think it is as much around commercials as it is around regulation. My peers in the buy-side world are looking to collaborate and start to share some of our data with each other. The hope is that the banks and the regulators see that there’s some movement and a real requirement for this.
I think you need to separate risk management from the transaction itself. So personally I don’t see exchanges disappearing. I also don’t see risk management as a concept disappearing; people will still want to transform risk. One of the reasons you’ve seen liquidity disappear is it’s so expensive to actually provide liquidity these days, so it would be useful if we could actually cheapen that process.
That’s one of those things that we’ve seen. It’s valuable data, so somebody wants to be paid; however, no-one wants to pay. Similarly, we’ve seen the use of ledger technology for things like margin payments in gold markets and other areas because it’s highly inefficient and expensive, so new technology is easier to justify here. As you get into the more liquid side where there is more electronic trading already, that’s where I think we see the same struggle, the justification for paying for it versus the benefit you get from it.
Sharon Ruffles Head of Fixed Income Trading, State Street Global Advisors, EMEA
Christopher Purves
Alun Cutler
Data and consumption of data is definitely a strong theme on the buy-side as well. What’s your perspective on the recent changes, and what is your wish list of things that you would like to have from vendors and counter parties when you trade? Will consolidated tape become irrelevant given the introduction of some of the new technologies?
Panel Discussion

28 Bond Compass Q2 2019
It’s a good question. At Tradeweb, we’ve seen increased adoption of AiEX, our innovative ‘Automated Intelligent Execution’ tool, which allows large volumes of transactions to be conducted at high speed with a pre-programmed set of rules tailored to investors’ trading strategies. The full automation of smaller and more basic transactions frees up time for the trading desk, thus creating capacity to focus on larger or more complicated trades. However, the AiEX functionality isn’t necessarily applied at the ISIN level. Instead, it is geared to give the buy-side the ability to pre-program a number of conditions in each product segment, which if not fully met, they simply bounce back into the control of the actual trader.
“ The full automation of smaller and more basic transactions frees up time for the trading desk, thus creating capacity to focus on larger or more complicated trades.
Liquidity is a big conundrum now. We have the constraints on the capital for the banks in terms of providing liquidity and the buy-side are now providing liquidity to some of the brokers. So, in volatile markets, suddenly some liquidity dries up because there isn’t the real capital to provide it. That’s one of the big struggles that ledger technology could help with, the ability to see more true liquidity and the ability to know where it is. Right now we’re all hunting around and things shift so quickly and there’s then nothing there, so what happens? There is a huge void and the regulators seem to think the buy-side should be filling it. However, the fixed income markets just don’t work that way.
Sharon — any thoughts about how the electrification of bond markets has helped you and when you when you use it and when you don’t?
The sheer volume of trading that we’re able to get through in any one day would not be possible without electronic trading. We are now able to free up traders because they’re not concentrated on lots of small tickets. So the question remains, when markets become volatile, is there still a price-maker somewhere in the chain, coding the system, holding onto the system, holding onto the reins?
Panel Discussion
Adriano Pace
Alun Cutler
Stephen Yeats
Sharon Ruffles
Is it true that the more we automate, and the more we use machines to trade rather than humans, the more shallow and transient is the liquidity — particularly during times of heightened volatility?
29 Bond Compass Q2 2019
Institutional investors are using ETFs as cash management tools due to the simplicity of the wrapper, and also as liquidity sleeves when it comes to trading tactically around core positions. Investors are also using ETFs for interim beta, so they might be deciding on an optimal portfolio that they want to invest in and, before they do, they might use the ETF for a period of time to get exposure to the market. ETFs are being used as a relative value tool. So investors may trade ETFs versus other exposure vehicles within the fixed income market, whether it is TRS, CDS or baskets.
Is that because they’re just easy to trade and use?
They are easy to trade and use, but also, increasingly, the ETF is what attracts the largest amount of liquidity. The feedback I get from a lot of our Authorised Participants and market makers is that the ease of use of the ETF ultimately leads to a tighter bid/ask spread in the ETF versus the actual basket of underlying bonds. And that leads to all kinds of applications where investors are using them for portfolio trades, where they trade in and out of the ETF versus the actual underlying basket of bonds, and also for relative value versus other exposure vehicles or as a liquidity tool. If you take the US high yield market as an example, the amount of liquidity that you see in the largest high yield ETFs is superior to what you find in the underlying cash market.
Last year we conducted an analysis on a number of European-listed corporate and government bond ETFs, whereby we compared their average bid/offer spreads against the composite bid/offer spreads of the underlying bonds that made up the ETF. The spread compression in the ETF was typically 30% to 50% tighter than if you’d traded all the relevant bonds at the same time.
“ The spread compression in the ETF was typically 30% to 50% tighter than if you’d traded all the relevant bonds at the same time.
In addition, we tend to see a consistent spike in ETF liquidity on the platform, when markets gap up or down. Therefore, when markets are really fast due to significant geopolitical events, we notice that our ETF volumes expand significantly, whereas some of the other asset classes we support may not react with that velocity or intensity. In this context, the market sees ETFs not just as an access product, but also as an efficient instrument to scale up beta or reduce it.
Marcus Miholich Head of Capital Markets EMEA & APAC, SPDR ETFs
Adriano Pace
Marcus Miholich
Adriano Pace
ETFs are becoming heavily traded instruments, particularly fixed income ETFs. What role are ETFs playing in bond markets and the changes in the market structure? What role do ETFs play in stressed environments and what have we seen in practice?
Panel Discussion
30 Bond Compass Q2 2019
Marcus Miholich
Adriano Pace
Christopher Purves
Stephen Yeats
Marcus Miholich
Stephen Yeats
Some sell-side analysts refer to ETFs as ‘shock absorbers’ in times of market volatility. One important reason investors use ETFs is the simplicity of the wrapper, but cost and transparency are also important.
If you look at the primary versus the secondary ETF market, it would be too simplistic to assume that every time an ETF is purchased in the open market, this automatically leads to an ETF creation. There are many trading sessions when a large secondary market day doesn’t translate into equivalent primary creations or redemptions. This removes the necessity to always trade the underlying bonds.
It sounds like you’ve effectively tokenized fixed income indices. I mean, that is literally what they’ve done, without doing it?
I think that’s fair. When you look at it from a mathematical perspective, it’s concentrating 500 bonds into one. It’s some form of tokenization. But bringing this back to the technology, when you look at those institutions that are trading ETFs, what role does technology play? For example, when you’re looking at the equity versus the constituents that underlie that equity versus the other parts of their balance sheet, what part it is technology playing in that?
ETFs are playing a significant part in the electronification of fixed income trading. Automation is becoming increasingly important and investors are now unwilling to wait for liquidity. They want it instantly and especially in ETFs that are viewed as simple, one-stop-shop wrappers. In one trade you own a basket of 100 to 5,000 bonds. Automation is extremely important; the market makers and banks have invested in automation for the last three to five years to provide rapid pricing to their buy-side clients.
The point is, if I’m going to trade an underlying bond, what is the probability of someone putting a price on that? The probability of them being in long or short that bond for some time is reasonably high. These products centralize liquidity into a single security, trading multiple times a day. Therefore, the probability of an investor or trader being in a position they can’t get out of is lower. So if you strip it back to basic mathematics, I think it’s just a concentration of liquidity.
Panel Discussion

31 Bond Compass Q2 2019
We are seeing more small companies putting offerings together in parts of the market that are not yet electronified. The big question is around regulation and how close are some of these fintechs/solutions to becoming an execution venue. And if they are, then do they need to be regulated like an MTF? With regulation comes the cost.
There are lots of little start-ups with a certain amount of hype — they may revolutionize or change something. However, there’s still the struggle to gain traction and size because, in general, there’s only one or two options. Often these firms need the whole market to come onto the platform all at once or to be bought by a larger player. A part of the problem is identifying which initiatives are serious — in terms of which are commercially viable — which takes time.
The term ‘fintech’ is very broad. I think people think of many different things when they talk about fintech. However, it’s very hard for fintechs to focus on future market structure given their need to gain traction quickly. When we talk about tokenization and digital assets, that also means that underlying market structure actually is changing. It’s really like a carpet under our feet that is actually moving, meaning it’s very hard for the fintechs today to think about a whole new market structure and focus their products on those new market structures.
“ It’s very hard for fintechs to focus on future market structure given their need to gain traction quickly.
Everything boils down to costs and how efficiently and how quickly and how easily you can do things. So most of the fintechs are at some point taking a process which is expensive and making it cheaper and easier and more pleasant. And I don’t think that’s particularly going to change. The challenge for banks or any big financial institution is to actually learn how to do that themselves. That’s really the only thing I think that is stopping banks and indeed the buy-side — they need to work out how to be more like a fintech but do it in a regulated and audited way.
Sharon Ruffles
Alun Cutler
Pinar Emirdag
Christopher Purves
What’s your view of what Fintech has achieved so far and what it potentially could do?
Panel Discussion

32 Bond Compass Q2 2019
Stephen Yeats To summarise, I think we all agree that the bond market has a challenging market structure — no one designed it, it just grew, and it is too fragmented. The sheer size and complexity of the market makes it ideal for advanced technology and big data to help address the challenges traders have.
We are already seeing benefits from technology and bond trading, but we are only starting this journey. Longer-term changes to market structure and business models are going to be driven by tokenization and distributed ledger. Fintechs have a role to play but there’s some scepticism that they are only solving individual problems, based on the current market structure — not holistically for the future market structure. As Pinar’s comments on the market structure illustrate well, “It’s really like a carpet under our feet that is actually moving”. ETFs are obviously playing a key role in all of this, providing more transparency and concentration of liquidity, while also helping drive some of the technological innovation.
Overall, it seems like, in the future, technology can really make bond market participants’ lives easier, and help address some of the challenges of the market structure — but I think we all have a lot of work to do between now and then!
Panel Discussion
33 Bond Compass Q2 2019
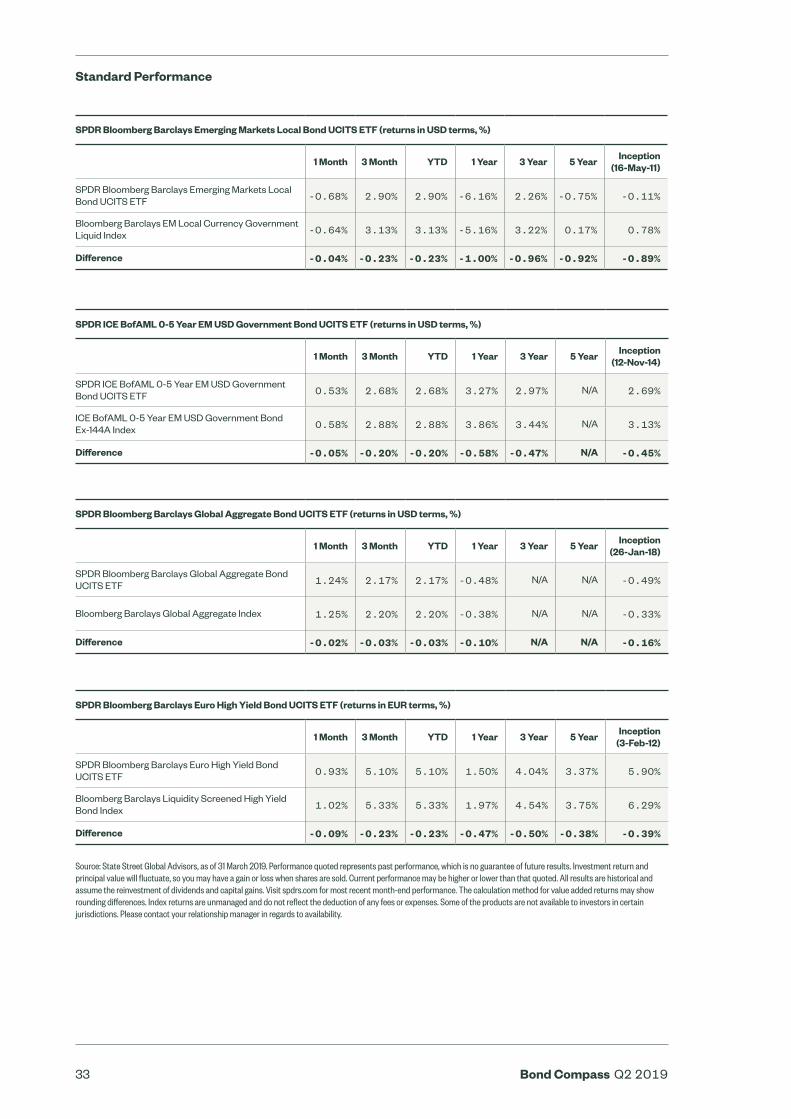
Standard Performance
Source: State Street Global Advisors, as of 31 March 2019. Performance quoted represents past performance, which is no guarantee of future results. Investment return and principal value will fluctuate, so you may have a gain or loss when shares are sold. Current performance may be higher or lower than that quoted. All results are historical and assume the reinvestment of dividends and capital gains. Visit spdrs.com for most recent month-end performance. The calculation method for value added returns may show rounding differences. Index returns are unmanaged and do not reflect the deduction of any fees or expenses. Some of the products are not available to investors in certain jurisdictions. Please contact your relationship manager in regards to availability.
SPDR Bloomberg Barclays Emerging Markets Local Bond UCITS ETF (returns in USD terms, %)
1 Month 3 Month YTD 1 Year 3 Year 5 Year Inception (16-May-11)
SPDR Bloomberg Barclays Emerging Markets Local Bond UCITS ETF -0.68% 2.90% 2.90% -6.16% 2.26% -0.75% -0.11%
Bloomberg Barclays EM Local Currency Government Liquid Index -0.64% 3.13% 3.13% -5.16% 3.22% 0.17% 0.78%
Difference -0.04% -0.23% -0.23% -1.00% -0.96% -0.92% -0.89%
SPDR ICE BofAML 0-5 Year EM USD Government Bond UCITS ETF (returns in USD terms, %)
1 Month 3 Month YTD 1 Year 3 Year 5 Year Inception (12-Nov-14)
SPDR ICE BofAML 0-5 Year EM USD Government Bond UCITS ETF 0.53% 2.68% 2.68% 3.27% 2.97% N/A 2.69%
ICE BofAML 0-5 Year EM USD Government Bond Ex-144A Index 0.58% 2.88% 2.88% 3.86% 3.44% N/A 3.13%
Difference -0.05% -0.20% -0.20% -0.58% -0.47% N/A -0.45%
SPDR Bloomberg Barclays Global Aggregate Bond UCITS ETF (returns in USD terms, %)
1 Month 3 Month YTD 1 Year 3 Year 5 Year Inception (26-Jan-18)
SPDR Bloomberg Barclays Global Aggregate Bond UCITS ETF 1.24% 2.17% 2.17% -0.48% N/A N/A -0.49%
Bloomberg Barclays Global Aggregate Index 1.25% 2.20% 2.20% -0.38% N/A N/A -0.33%
Difference -0.02% -0.03% -0.03% -0.10% N/A N/A -0.16%
SPDR Bloomberg Barclays Euro High Yield Bond UCITS ETF (returns in EUR terms, %)
1 Month 3 Month YTD 1 Year 3 Year 5 Year Inception (3-Feb-12)
SPDR Bloomberg Barclays Euro High Yield Bond UCITS ETF 0.93% 5.10% 5.10% 1.50% 4.04% 3.37% 5.90%
Bloomberg Barclays Liquidity Screened High Yield Bond Index 1.02% 5.33% 5.33% 1.97% 4.54% 3.75% 6.29%
Difference -0.09% -0.23% -0.23% -0.47% -0.50% -0.38% -0.39%

34 Bond Compass Q2 2019
Marketing Communication For professional clients use only.
For Investors in Austria: The offering of SPDR ETFs by the Company has been notified to the Financial Markets Authority (FMA) in accordance with section 139 of the Austrian Investment Funds Act. Prospective investors may obtain the current sales Prospectus, the articles of incorporation, the KIID as well as the latest annual and semi-annual report free of charge from State Street Global Advisors GmbH, Brienner Strasse 59, D-80333 Munich. T: +49 (0)89-55878-400. F: +49 (0)89-55878-440.
For Investors in Finland: The offering of funds by the Companies has been notified to the Financial Supervision Authority in accordance with Section 127 of the Act on Common Funds (29.1.1999/48) and by virtue of confirmation from the Financial Supervision Authority the Companies may publicly distribute their Shares in Finland. Certain information and documents that the Companies must publish in Ireland pursuant to applicable Irish law are translated into Finnish and are available for Finnish investors by contacting State Street Custodial Services (Ireland) Limited, 78 Sir John Rogerson’s Quay, Dublin 2, Ireland.
For Investors in France: This document does not constitute an offer or request to purchase shares in the Companies. Any subscription for shares shall be made in accordance with the terms and conditions specified in the complete Prospectuses, the KIIDs, the addenda as well as the Companies’ Supplements. These documents are available from the Companies’ centralising correspondent: State Street Banque S.A., 23-25 rue Delariviere- Lefoullon, 92064 Paris La Defense Cedex or on the French part of the site spdrs.com. The Companies are undertakings for collective investment in transferable securities (UCITS) governed by Irish law and accredited by the Central Bank of Ireland as a UCITS in accordance with European Regulations. European Directive no. 2014/91/EU dated 23 July 2014 on UCITS, as amended, established common rules pursuant to the crossborder marketing of UCITS with which they duly comply. This common base does not exclude differentiated implementation. This is why a European UCITS can be sold in France even though its activity does not comply with rules identical to those governing the approval of this type of product in France. The offering of these compartments has been notified to the Autorité des Marchés Financiers (AMF) in accordance with article L214-2-2 of the French Monetary and Financial Code.
For Investors in Germany: The offering of SPDR ETFs by the Companies has been notified to the Bundesanstalt
für Finanzdienstleistungsaufsicht (BaFin) in accordance with section 312 of the German Investment Act. Prospective investors may obtain the current sales Prospectuses, the articles of incorporation, the KIIDs as well as the latest annual and semi-annual report free of charge from State Street Global Advisors GmbH, Brienner Strasse 59, D-80333 Munich. T: +49 (0)89-55878-400. F: +49 (0)89-55878-440.
Hong Kong: State Street Global Advisors Asia Limited, 68/F, Two International Finance Centre, 8 Finance Street, Central, Hong Kong. T: +852 2103-0288. F: +852 2103-0200.
The Funds mentioned are not registered in Hong Kong and may not be sold, issued or offered in Hong Kong in circumstances which amount to an offer to the public. This document is issued for informational purposes only. It has not been reviewed or approved by the Hong Kong Securities and Futures Commission. State Street Global Advisors accepts no liability whatsoever for any direct, indirect or consequential loss arising from or in connection with any use of, or reliance on, this document which does not have any regard to the particular needs of any person. State Street Global Advisors takes no responsibility whatsoever for any use, reliance or reference by persons other than the intended recipient of this document.
Ireland Entity: State Street Global Advisors Ireland Limited is regulated by the Central Bank of Ireland. Registered office address 78 Sir John Rogerson’s Quay, Dublin 2. Registered number 145221. T: +353 (0)1 776 3000. Fax: +353 (0)1 776 3300.
Italy Entity: State Street Global Advisors Ireland Limited, Milan Branch (Sede Secondaria di Milano) is a branch of State Street Global Advisors Ireland Limited, registered in Ireland with company number 145221, authorised and regulated by the Central Bank of Ireland, and whose registered office is at 78 Sir John Rogerson’s Quay, Dublin 2. State Street Global Advisors Ireland Limited, Milan Branch (Sede Secondaria di Milano), is registered in Italy with company number 10495250960 - R.E.A. 2535585 and VAT number 10495250960and whose office is at Via dei Bossi, 4 - 20121 Milano, Italy. Telephone: +39 02 32066 100. Facsimile: +39 02 32066 155.
For Investors in Luxembourg: The Companies have been notified to the Commission de Surveillance du Secteur Financier in Luxembourg in order to market their shares for sale to the public in Luxembourg and the Companies are notified Undertakings in Collective Investment for Transferable Securities (UCITS).
For Investors in the Netherlands: This communication is directed at qualified investors within the meaning of Section 2:72 of the Dutch Financial Markets Supervision Act (Wet op het financieel toezicht) as amended. The products and services to which this communication relates are only available to such persons and persons of any other description should not rely on this communication. Distribution of this document does not trigger a licence requirement for the Companies or State Street Global Advisors in the Netherlands and consequently no prudential and conduct of business supervision will be exercised over the Companies or State Street Global Advisors by the Dutch Central Bank (De Nederlandsche Bank N.V.) and the Dutch Authority for the Financial Markets (Stichting Autoriteit Financiële Markten). The Companies have completed their notification to the Authority Financial Markets in the Netherlands in order to market their shares for sale to the public in the Netherlands and the Companies are, accordingly, investment institutions (beleggingsinstellingen) according to Section 2:72 Dutch Financial Markets Supervision Act of Investment Institutions.
For Investors in Norway: The offering of SPDR ETFs by the Companies has been notified to the Financial Supervisory Authority of Norway (Finanstilsynet) in accordance with applicable Norwegian Securities Funds legislation. By virtue of a confirmation letter from the Financial Supervisory Authority dated 28 March 2013 (16 October 2013 for umbrella II) the Companies may market and sell their shares in Norway.
For use in Singapore: The offer or invitation of the Funds mentioned, which is the subject of this document, does not relate to a collective investment scheme which is authorised under section 286 of the Securities and Futures Act, Chapter 289 of Singapore (SFA) or recognised under section 287 of the SFA. The Funds mentioned are not authorised or recognised by the Monetary Authority of Singapore (MAS) and the Funds mentioned are not allowed to be offered to the retail public. Each of this document and any other document or material issued in connection with the offer or sale is not a prospectus as defined in the SFA.
Accordingly, statutory liability under the SFA in relation to the content of prospectuses would not apply. Apotential investor should consider carefully whether the investment is suitable for it.
The MAS assumes no responsibility for the contents of this document. This document has not been registered as a prospectus with the MAS. Accordingly,
this document and any other document or material in connection with the offer or sale, or invitation for subscription or purchase, of the Funds mentioned may not be circulated or distributed, offered or sold, or be made the subject of an invitation for subscription or purchase, whether directly or indirectly, to persons in Singapore other than to an institutional investor under Section 304 of the SFA or otherwise pursuant to, and in accordance with the conditions of, any other applicable provision of the SFA. Any subsequent sale of [Units] acquired pursuant to an offer made in reliance on an exemption under section 305 of the SFA may only be made pursuant to the requirements of sections 304A.
For Investors in Spain: State Street Global Advisors SPDR ETFs Europe I and II plc have been authorised for public distribution in Spain and are registered with the Spanish Securities Market Commission (Comisión Nacional del Mercado de Valores) under no.1244 and no.1242. Before investing, investors may obtain a copy of the Prospectus and Key Investor Information Documents, the Marketing Memoranda, the fund rules or instruments of incorporation as well as the annual and semi-annual reports of State Street Global Advisors SPDR ETFs Europe I and II plc from Cecabank, S.A. Alcalá 27, 28014 Madrid (Spain) who is the Spanish Representative, Paying Agent and distributor in Spain or at spdrs.com. The authorised Spanish distributor of State Street Global Advisors SPDR ETFs is available on the website of the Securities Market Commission (Comisión Nacional del Mercado de Valores). Important Information
For Investors in Switzerland: The collective investment schemes referred to herein are collective investment schemes under Irish law. Prospective investors may obtain the current sales prospectus, the articles of incorporation, the KIID as well as the latest annual and semi-annual reports free of charge from the Swiss Representative and Paying Agent, State Street Bank International GmbH, Munich, Zurich Branch, Beethovenstrasse 19, 8027 Zurich as well as from the main distributor in Switzerland, State Street Global Advisors AG, Beethovenstrasse 19, 8027 Zurich. Before investing please read the prospectus and the KIID, copies of which can be obtained from the Swiss representative, or at spdrs.com.
For Investors in the UK: The Companies are recognised schemes under Section 264 of the Financial Services and Markets Act 2000 (“the Act”) and are directed at ‘professional clients’ in the UK (within the meaning of the rules of the Act) who are deemed both knowledgeable and experienced in matters relating to investments. The products and services to which this
Important Information

35 Bond Compass Q2 2019
communication relates are only available to such persons and persons of any other description should not rely on this communication. Many of the protections provided by the UK regulatory system do not apply to the operation of the Companies, and compensation will not be available under the UK Financial Services Compensation Scheme.
Issuer Entity: State Street Global Advisors Limited. Authorised and regulated by the Financial Conduct Authority. Registered in England. Registered No. 2509928. VAT No. 5776591 81. Registered office: 20 Churchill Place, Canary Wharf, London, E14 5HJ. T: 020 3395 6000. F: 020 3395 6350 Web: ssga.com
Exchange traded funds (ETFs) trade like stocks, are subject to investment risk and will fluctuate in market value. The value of the investment can go down as well as up and the return upon the investment will therefore be variable. Changes in exchange rates may have an adverse effect on the value, price or income of an investment. Further, there is no guarantee an ETF will achieve its investment objective.
Equity securities may fluctuate in value in response to the activities of individual companies and general market and economic conditions.
This document is not, and under no circumstances is to be construed as, an offer or any other step in furtherance of a public offering in the United States, Canada or any province or territory thereof, where the Companies are not authorised or registered for distribution and where the Companies’ Prospectuses have not been filed with any securities commission or regulatory authority. Neither this document nor any copy hereof should be taken, transmitted or distributed (directly or indirectly) into the United States. The Companies have not and will not be registered under the Investment Company Act of 1940 or qualified under any applicable state securities statutes.
SPDR ETFs is the exchange traded funds (“ETF”) platform of State Street Global Advisors and is comprised of funds that have been authorised by European regulatory authorities as open-ended UCITS investment companies (“Companies”).
State Street Global Advisors SPDR ETFs Europe I & SPDR ETFs Europe II plc issue SPDR ETFs, and is an open-ended investment company with variable capital having segregated liability between its sub-funds. The Company is organised as an Undertaking for Collective Investments in Transferable Securities (UCITS) under the laws of Ireland and authorised as a UCITS by the Central Bank of Ireland.Investing involves risk including the risk of loss of principal.
Diversification does not ensure a profit or guarantee against loss.
The trademarks and service marks referenced herein are the property of their respective owners. Third party data providers make no warranties or representations of any kind relating to the accuracy, completeness or timeliness of the data and have no liability for damages of any kind relating to the use of such data.
The information provided does not constitute investment advice as such term is defined under the Markets in Financial Instruments Directive (2014/65/EU) or applicable Swiss regulation and it should not be relied on as such. It should not be considered a solicitation to buy or an offer to sell any investment.
It does not take into account any investor’s or potential investor’s particular investment objectives, strategies, tax status, risk appetite or investment horizon. If you require investment advice you should consult your tax and financial or other professional advisor. All material has been obtained from sources believed to be reliable. There is no representation or warranty as to the accuracy of the information and State Street shall have no liability for decisions based on such information.
This communication is directed at professional clients (this includes eligible counterparties as defined by the appropriate EU regulator or Swiss regulations who are deemed both knowledgeable and experienced in matters relating to investments. The products and services to which this communication relates are only available to such persons and persons of any other description (including retail clients) should not rely on this communication.
The whole or any part of this work may not be reproduced, copied or transmitted or any of its contents disclosed to third parties without SSGA’s express written consent.
Investing in foreign domiciled securities may involve risk of capital loss from unfavourable fluctuation in currency values, withholding taxes, from differences in generally accepted accounting principles or from economic or political instability in other nations.
Investments in emerging or developing markets may be more volatile and less liquid than investing in developed markets and may involve exposure to economic structures that are generally less diverse and mature and to political systems which have less stability than those of more developed countries.
The views expressed in this material are the views of SPDR EMEA Strategy and Research through 31 March 2019 and are subject to change based on market and other conditions. This document contains certain statements that may be deemed forward-looking statements. Please note that any such statements
are not guarantees of any future performance and actual results or developments may differ materially from those projected.
BLOOMBERG®, a trademark and service mark of Bloomberg Finance L.P. and its affiliates, and BARCLAYS®, a trademark and service mark of Barclays Bank Plc, have each been licensed for use in connection with the listing and trading of the SPDR Bloomberg Barclays ETFs.
Bonds generally present less short-term risk and volatility than stocks, but contain interest rate risk (as interest rates rise, bond prices usually fall); issuer default risk; issuer credit risk; liquidity risk; and inflation risk. These effects are usually pronounced for longer-term securities. Any fixed income security sold or redeemed prior to maturity may be subject to a substantial gain or loss.
International Government bonds and corporate bonds generally have more moderate short-term price fluctuations than stocks, but provide lower potential long-term returns.
ICE Data Indices, LLC (“ICE Data Indices”) and its indices may not be reproduced or used for any other purpose. ICE Data Indices’ data is provided “AS IS”. ICE Data Indices, its affiliates and its third party suppliers provide no warranties, has not prepared or approved this report, has no liability, and does not endorse SSGA or guarantee, review, or endorse its products. For the full copy of the disclaimer please refer to the Fund supplement.
Standard & Poor’s®, S&P® and SPDR® are registered trademarks of Standard & Poor’s Financial Services LLC (S&P); Dow Jones is a registered trademark of Dow Jones Trademark Holdings LLC (Dow Jones); and these trademarks have been licensed for use by S&P Dow Jones Indices LLC (SPDJI) and sublicensed for certain purposes by State Street Corporation. State Street Corporation’s financial products are not sponsored, endorsed, sold or promoted by SPDJI, Dow Jones, S&P, their respective affiliates and third party licensors and none of such parties make any representation regarding the advisability of investing in such product(s) nor do they have any liability in relation thereto, including for any errors, omissions, or interruptions of any index.
THOMSON REUTERS DOES NOT GUARANTEE THE QUALITY, ACCURACY AND/OR THE COMPLETENESS OF THE INDEX OR ANY DATA INCLUDED THEREIN. THOMSON REUTERS MAKE NO WARRANTY, EXPRESS OR IMPLIED, AS TO RESULTS TO BE OBTAINED BY LICENSEE, OWNERS OF THE PRODUCT(S), OR ANY OTHER PERSON OR ENTITY FROM THE USE OF THE INDEX OR ANY DATA INCLUDED THEREIN IN CONNECTION WITH THE RIGHTS LICENSED HEREUNDER OR FOR ANY OTHER USE. THOMSON REUTERS
MAKE NO EXPRESS OR IMPLIED WARRANTIES, AND HEREBY EXPRESSLY DISCLAIM ALL WARRANTIES OF MERCHANTABILITY OR FITNESS FOR A PARTICULAR PURPOSE OR USE WITH RESPECT TO THE INDEX OR ANY DATA INCLUDED THEREIN. WITHOUT LIMITING ANY OF THE FOREGOING, IN NO EVENT SHALL THOMSON REUTERS HAVE ANY LIABILITY FOR ANY SPECIAL, PUNITIVE, INDIRECT, INCIDENTAL OR CONSEQUENTIAL DAMAGES OR LOST PROFITS, EVEN IF NOTIFIED OF THE POSSIBILITY OF SUCH DAMAGES.
You should obtain and read the SPDR prospectus and relevant Key Investor Information Document (KIID) prior to investing, which may be obtained from spdrs.com. These include further details relating to the SPDR funds, including information relating to costs, risks and where the funds are authorised for sale.
The information contained in this communication is not a research recommendation or ‘investment research’ and is classified as a ‘Marketing Communication’ in accordance with the Markets in Financial Instruments Directive (2014/65/EU) or applicable Swiss regulation. This means that this marketing communication (a) has not been prepared in accordance with legal requirements designed to promote the independence of investment research (b) is not subject to any prohibition on dealing ahead of the dissemination of investment research.
The units of the Sovereign Bond Flow Indicators are standardised by debt outstanding at each point in the curve and then for the aggregates are duration weighted. State Street Global Markets (‘SSGM’) then aggregate the indictors into percentiles to gauge the significance of a flow or positioning metric over a variety of time periods and countries. SSGM’s use is aimed at being a simple way of ranking flow and positioning indicators relative to their own history. For all of the flow indicators within the State Street Bond Compass, State Street Global Markets calculates the percentiles based on the distribution of flows over the last five years using the daily aggregate time periods shown in the charts. As a guide a 100th percentile reading represents the strongest buying in five years; and a zero percentile equals the strongest selling. A reading in the 50th percentile would signal that net flows in the asset over the period are at their average level, typically close to zero.
© 2019 State Street Corporation. All Rights Reserved. ID16147 2228182.9.1.EMEA.INST Exp. Date 31/07/2019

Calendar of Events 2019
April 1 Mon Europe CPI Core YoY
5 Fri United States Change in Nonfarm Payrolls
10 Wed Europe ECB Main Refinancing Rate
10 Wed United States CPI YoY
10 Wed United States FOMC Meeting Minutes
16 Tue United Kingdom ILO Unemployment Rate 3Mths
17 Wed United Kingdom CPI YoY
17 Wed Europe CPI YoY
24 Wed Europe ECB Publishes Economic Bulletin
25 Thu Japan BOJ Policy Balance Rate
30 Tue Europe Unemployment Rate
June 4 Tue Europe Unemployment Rate
6 Thu Europe ECB Main Refinancing Rate
7 Fri United States Change in Nonfarm Payrolls
7 Fri United States Unemployment Rate
11 Tue United Kingdom ILO Unemployment Rate 3Mths
12 Wed United States CPI YoY
18 Tue Europe CPI YoY
19 Wed United Kingdom CPI YoY
19 Wed United States FOMC Rate Decision (Upper Bound)
20 Thu Japan BOJ Policy Balance Rate
20 Thu Europe ECB Publishes Economic Bulletin
May 1 Wed United States FOMC Rate Decision (Lower Bound)
3 Fri United States Change in Nonfarm Payrolls
10 Fri United States CPI YoY
14 Tue United Kingdom ILO Unemployment Rate 3Mths
17 Fri Europe CPI YoY
22 Wed United Kingdom CPI YoY
22 Wed United States FOMC Meeting Minutes