bofi holding, inc
TRANSCRIPT
0NASDAQ: BOFI
November 2017
BOFI HOLDING, INC.Investor Presentation BOFI HOLDING, INC.Investor Presentation

1
Safe Harbor
This presentation contains forward-lookingstatements within the meaning of the PrivateSecurities Litigation Reform Act of 1995 (the“Reform Act”). The words “believe,” “expect,”“anticipate,” “estimate,” “project,” or thenegation thereof or similar expressionsconstitute forward-looking statements withinthe meaning of the Reform Act. Thesestatements may include, but are not limitedto, projections of revenues, income or loss,estimates of capital expenditures, plans forfuture operations, products or services, andfinancing needs or plans, as well asassumptions relating to these matters. Suchstatements involve risks, uncertainties and other factors that may cause actual results, performance orachievements of the Company and its subsidiaries to be materially different from any future results,performance or achievements expressed or implied by such forward-looking statements. For adiscussion of these factors, we refer you to the Company's reports filed with the Securities andExchange Commission, including its Annual Report on Form 10-K for the year ended June 30, 2017.In light of the significant uncertainties inherent in the forward-looking statements included herein, theinclusion of such information should not be regarded as a representation by the Company or by anyother person or entity that the objectives and plans of the Company will be achieved. For all forward-looking statements, the Company claims the protection of the safe-harbor for forward-lookingstatements contained in the Reform Act.

2
Salaries and benefits
Premises and equipment
BofI1(%)
BofI1(%)
0.79
0.15
Other non-interest expense
0.53
Total non-interest expense
1.47
Core business margin 2.30
1.48
0.32
1.04
2.84
0.62
Banks$1-$10bn2
(%)
Banks$1-$10bn2
(%)
Net interest income 3.77 3.46
As % of average assets
1. For the three months ended 06/30/17 – the most recent data on FDIC website “Statistics on Depository Institutions Report"BofI Federal Bank only, excludes BofI Holding, Inc. to compare to FDIC data
2. Commercial banks by asset size. FDIC reported for three months ended 06/30/17. Total of 515 institutions $1-$10 billion
Our Business Model is More Profitable Because Our Costs are Lower

3
BofI’s Business Model Is Differentiated From Other Banks
Customer Acquisition Sales Servicing Distribution
• Digital Marketing
• Affinity and Distribution Partners
• Data mining/target feeding direct marketing
• Cross-sell
• Automated fulfillment
• Inbound call center sales
• Outbound call center sales
• Minimal outside sales
• Significant inside sales
• Self-service
• Digital journey
• Direct banker (call center)
• Balance sheet
• Whole loan sales options
• Securitization
Data Driven Insight
Integrated Customer
Experience
Digital Marketing
Digitally Enabled
Operations
Next-Gen Technology
Core Digital Capabilities

4
Fiscal 2017 Highlights Compared with Fiscal 2016
7,5598,502
0
2,000
4,000
6,000
8,000
10,000
FY 2016 FY 2017
$ Millions
Asset Growth
11.9%
119.3134.7
0
50
100
150
FY 2016 FY 2017
$ Millions
Net Income
13.0%
6,0446,900
0
2,000
4,000
6,000
8,000
FY 2016 FY 2017
$ Millions
Deposit Growth
14.2%
1.852.07
0.0
0.5
1.0
1.5
2.0
2.5
FY 2016 FY 2017
Diluted EPS
Diluted EPS
11.9%
Return on Equity = 17.78%Return on Assets = 1.68%

5
Fiscal 2018 First Quarter Highlights Comparedwith Fiscal 2017 First Quarter
$ Millions
Asset Growth
$ Millions
Net Income
$ Millions
Deposit Growth
$ Diluted EPS
Diluted EPS
Return on Equity = 15.24%Return on Assets = 1.54%
7,8558,582
0
2,000
4,000
6,000
8,000
10,000
Q1 2017 Q1 2018
9.2% 6,3247,179
0
2,000
4,000
6,000
8,000
Q1 2017 Q1 2018
13.5%
28.932.4
0
10
20
30
40
Q1 2017 Q1 2018
12.1% 0.450.50
0.000.100.200.300.400.500.60
Q1 2017 Q1 2018
11.1%

6
Diluted EPS and Return on Equity Have Been Consistently Strong Despite Significant Increase in Tier 1 Capital Ratios
Return On Average Equity (FY)Diluted EPS (FY)
0.580.72
0.96
1.34
1.85
2.07
0.0
0.5
1.0
1.5
2.0
2.5
2015
$ per share
20142012 2013 2017
29% CAGR
2016
16.9517.57 17.89 18.34
19.4317.78
0
5
10
15
20
2015
%
20142012 2013 20172016
Tier 1 leverage ratio
8.6% 8.6% 8.7% 9.3% 8.8% 9.6%Book value per share
$3.95 $4.79 $6.33 $8.51 $10.73 $13.05

7
BofI is a Top Quartile Performer Versus Bank Peer Group
BofI Federal Bank Peer Group Percentile
ROAA 1.82% 0.93% 90%
Return on equity 19.52% 8.49% 93%
G&A 1.51% 2.60% 19%
Efficiency ratio 31.95% 63.09% 5%
Source: Uniform Bank Performance Report (UBPR) as of 9/30/2017Note: Peer group is all savings banks with assets greater than $1 billion for quarter ended 9/30/17
The 93% on ROE means that the Bank outperformed 93% of all banks. The
19% G&A ranking means that only 19% of banks spend less on G&A than BofI.
Peer group includes savings banks greater than $1 billion.
8
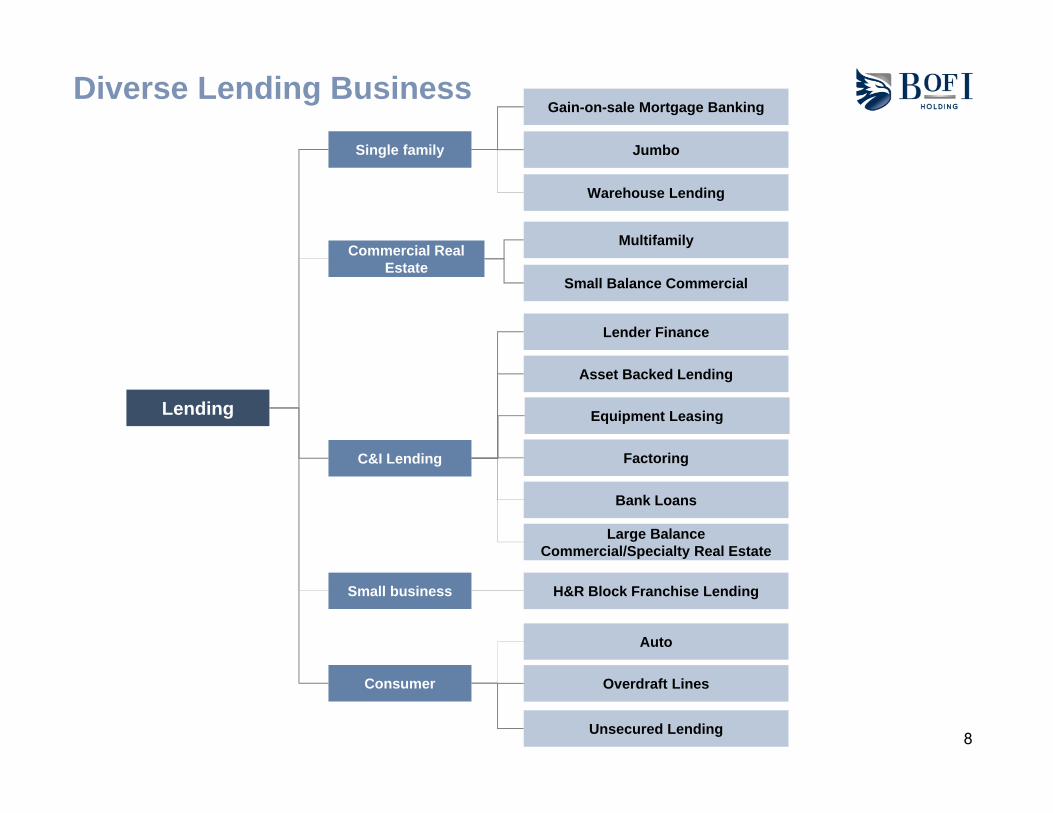
Diverse Lending Business
Lending
Single family
Commercial Real Estate
C&I Lending
Consumer
Small business
Gain-on-sale Mortgage Banking
Jumbo
Multifamily
Small Balance Commercial
Lender Finance
Asset Backed Lending
Warehouse Lending
Factoring
Bank Loans
Auto
Overdraft Lines
Large Balance Commercial/Specialty Real Estate
H&R Block Franchise Lending
Unsecured Lending
Equipment Leasing

91. Gross loans and leases before premiums, discounts and allowances
Loan Portfolio1
100% = $7,597 Million
SF – Residential54%
C&I13%
C&I – SF Lender Finance
5%
CRE/Home Equity/Consumer
and Other5%
Multifamily21%
Factoring2%
Loan Diversity – September 30, 2017
10
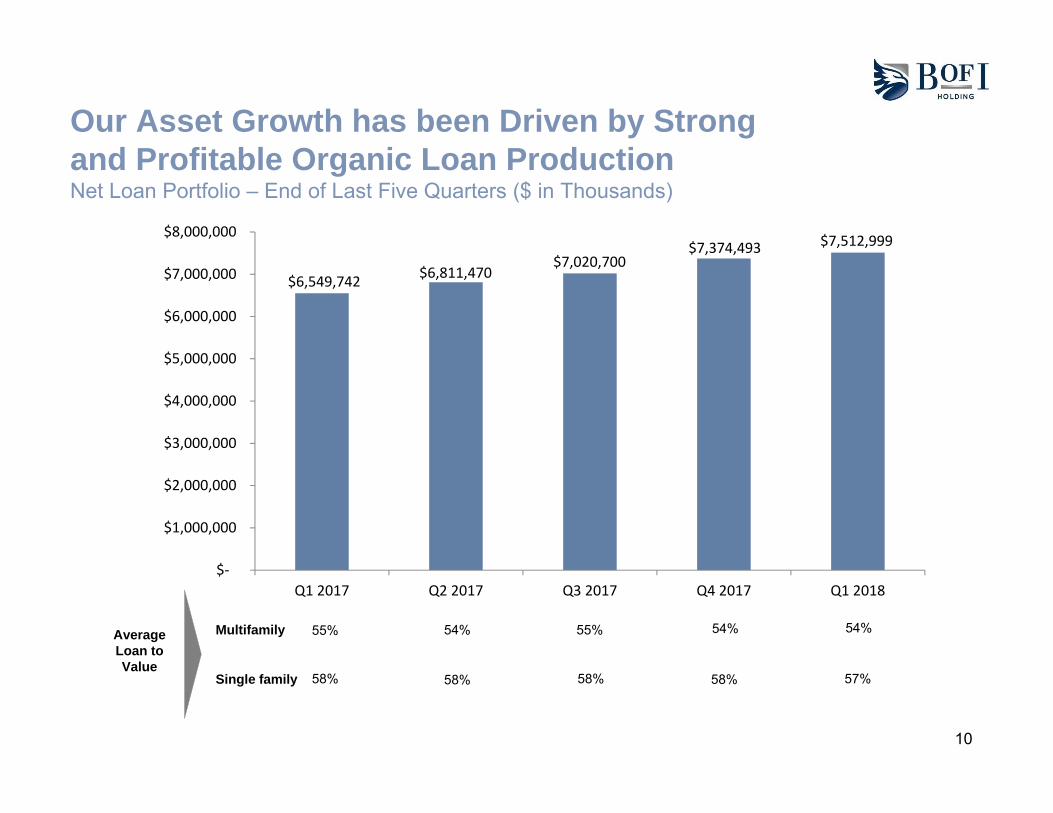
Our Asset Growth has been Driven by Strong and Profitable Organic Loan ProductionNet Loan Portfolio – End of Last Five Quarters ($ in Thousands)
Multifamily
Single family
55% 54% 55% 54%
58% 58% 58% 58%
Average Loan to Value
$7,512,999
$6,549,742 $6,811,470$7,020,700
$7,374,493
$‐
$1,000,000
$2,000,000
$3,000,000
$4,000,000
$5,000,000
$6,000,000
$7,000,000
$8,000,000
Q1 2017 Q2 2017 Q3 2017 Q4 2017 Q1 2018
54%
57%
11
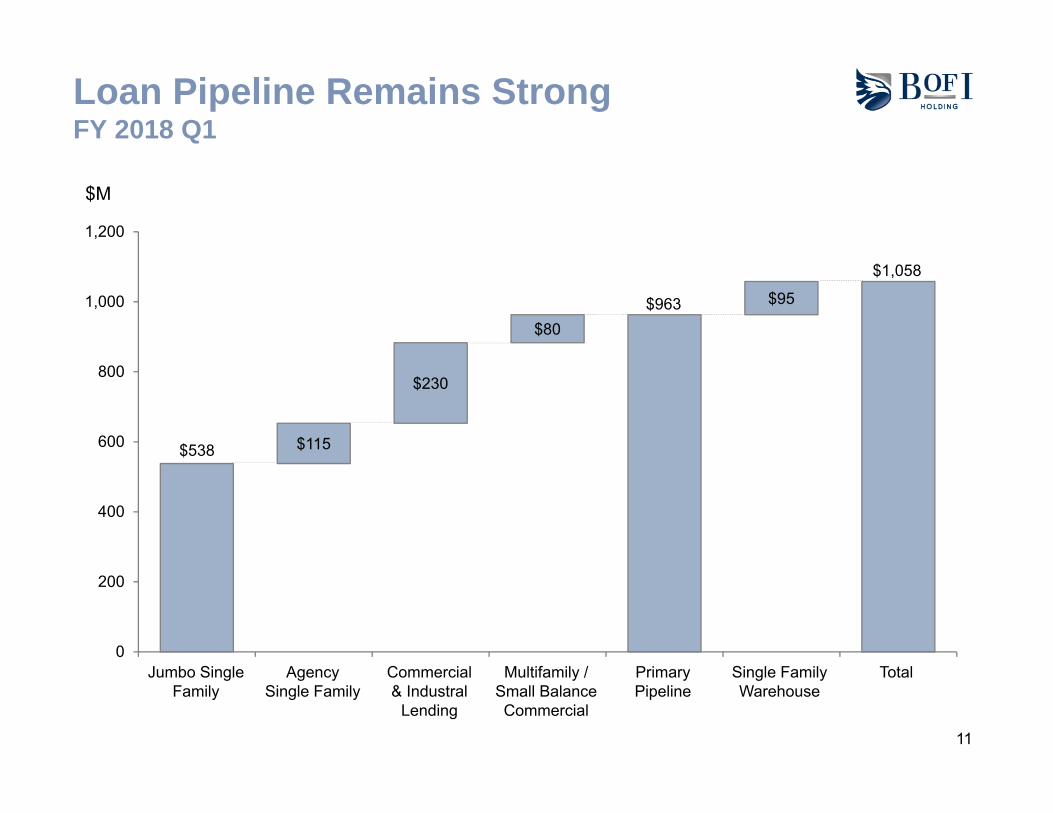
$538 $115
$230
$80$963 $95
$1,058
0
200
400
600
800
1,000
1,200
Loan Pipeline Remains StrongFY 2018 Q1
TotalSingle Family Warehouse
$M
Jumbo Single Family
Agency Single Family
Commercial & Industral
Lending
Multifamily / Small Balance Commercial
Primary Pipeline

12
0.7 1.0
2.33.3 3.6
4.2
1.1
0.7
1.01.4
1.4
0
1
2
3
4
5
6
Loan Origination Growth
53.2% 42.0% 42.2%
• Organic growth in existing business lines
o Multifamily geographic expansion
o Agency and jumbo mortgage channel expansion
o Small Balance Commercial Real Estate expansion
o Large Balance Commercial / Specialty Real Estate expansion
• Additional C&I verticals/product expansion
• Retail auto lending launch
• Consumer unsecured installment lending launch
Annual growth rate
Fiscal Year Loan Originations Future Plans
31.8% 5-yr CAGR
0.7
3.0
2.1
1.4
5.0
5.6
4.3
$ Billions
2012 2013 2014 2015 2016 2017
Loans for investmentLoans for sale
15.6% 11.2%

13
Diversified Branchless Deposit BusinessesKey Elements
Deposit
Consumer direct internet
brands
Distribution Partners
BIN sponsorship
• Demographically targeted brands• Differentiated products with turn-down product
options
Small business banking
• Exclusive relationships with significant brands, groups, or employees
• Exclusive relationships with financial planners through BofI Advisor
• Business banking with simple suite of cash management services
• Prepaid program managers with focus on large national programs
Specialty deposits
• 1031 exchange firms• Title and escrow companies• HOA and property management
Commercial/Treasury
Management• Full service treasury/cash management

14
Deposit Growth in Checking, Business, and Savings Was Achieved While Transforming the Mix of Deposits
19%
Checking and other demand deposits
31%Savings
Time deposits 50%
Checking and other demand deposits
Savings
Time deposits
June 30, 2013 September 30, 2017
Checking Growth (6/2013-09/2017) = 969%Savings Growth (6/2013-09/2017) = 355%
100% of Deposits = $2.1 billion 100% of Deposits = $7.2 billion
Savings – IRA
53%
31%
12% 4%

15
78%
21%1%
1,420
2,449
3,067
3,844
4,163
0
500
1,000
1,500
2,000
2,500
3,000
3,500
4,000
4,500
5,000
Q1 18
Business Deposits by Account Type* Business Banking Deposits
($MM)
Q4 14 Q4 15 Q4 16
Percent (%)
Q4 17
Our Business Banking Vertical has Fueled our Deposit Growth while Generating Significant Fee Income
Checking and other demand deposits
Time Deposits
Savings & MMDA
* As of quarter end 9/30/17

16
BofI Customer Base and Deposit Volume is Well Distributed Throughout the United States
BofI Deposits Have National Reach With Customers in Every State
Average Deposit Balance
Number of Accounts

17
BofI Customers are Highly Engaged
Engagement Low Activity High Activity
Attributes Low Activity User Basic User Engaged Elite Engaged
Engagement Score (0-100) 0s 0 < S < 30 30 ≤ S < 60 ≥ 60
Average Lifetime Balance $100 $4000 $6,000 $50,000
Average # of Services Used - < 5 7 10
Average # of POS - < 1 10 25
% of Total Population 22% 15% 41% 23%
% of Total Balance 0% 6% 24% 70%
Retention Moderate Moderate High High
Customer Engagement Results
Note: Study conducted on Rewards Checking customers
64% of Population or 94% of Balance are Overall High Engagement

18
Core Deposit Growth Was Sufficiently Strong To Grow Overall Deposits While Changing The Deposit Mix
Deposit Growth Future Plans
• Enhanced digital marketing automation integrated to outbound sales group
• Products and technology integration targeted to specific industry groups
• Create differentiated consumer and business banking platform
• Enhanced focus on customer service and user experience
• Leverage existing and create new distribution partnerships to reduce acquisition cost and leverage external brands
1,615 2,092
3,042
4,452
6,044
6,900
0
1,000
2,000
3,000
4,000
5,000
6,000
7,000
$ Millions
2017
33.7% 5-yr CAGR
20162015201420132012
% CDs1 57% 50% 26% 18%
% Borrowings2 25% 25% 24% 15%
17%
12%1 as a % of total deposits2 as a % of total liabilities
12%
9%

19
Diversified Fee / Non-Interest Income
* Excludes securities income
Fee Income
Mortgage Banking
Deposit/ Service Fees
Agency
Jumbo
Structured Settlement
Other
Cash/Treasury Management
Consumer Deposit
Multifamily
Prepaid
Tax
PrepaymentFee
Payments
64%
7%
% Fee Income FY 2017*
22%
Gain on Sale –Other 7%

20
Over the Last Five Years, BofI Has Successfully Started New Products, Added Distribution Channels, and Completed Acquisitions
2010 2011 2012 2013 2014 2015 2016 2017New product • Agency
mortgage• Structured
settlement
• Business banking
• Lottery
• Warehouse Lending
• Treasury/cash manage-ment
• C&I• Prepaid• Agency
Servicing retention
• Small balance CRE
• Auto • HRB franchising lending
• Retail Auto
• RefundAdvance(H&RBlock)
• UnsecuredConsumer Lending
Distribution/channel
• Costco• Retail
agency mortgage
• BofI advisor
• Netbank• Retail
Structured settlement
• UFB Direct
• Bank X• IRA
• Virtus • Wholesale agency
• H&RBlockretail stores
M&A • Principal Bank
• Union Federal
• H&R Block Bank
• Equipment leasing

21
Key Goals of Universal Digital Bank
PersonalizationPersonalization
Self-ServiceSelf-Service
FacilitatePartnerships
FacilitatePartnerships
Customizable Experience
Customizable Experience
Cross-SellCross-Sell• Artificial intelligence and big data credit models enable quick credit
decisions• Customized product recommendations based upon analytical determination
of need
• Provide holistic and interactive and intuitive design experience• Integrate online experience with other channels
• Easy integration of third-party features (e.g., biometrics)• Access to value added tools (e.g., robo-advisory, automated savings features)
either proprietary or third party• Enable creative customer acquisition partners
• Eventual artificial intelligence tools assist sale of banking products such as deposits, loans, and mortgages
• Products optimized by channel, recipient and journey• Self service saves time and cost (e.g., activate and de-activate debit-card
in platform, send wires via self-service)
• Increase chance of offering right product at the right time and place• Personalization is the right antidote for too much choice, too much content,
and not enough time
22
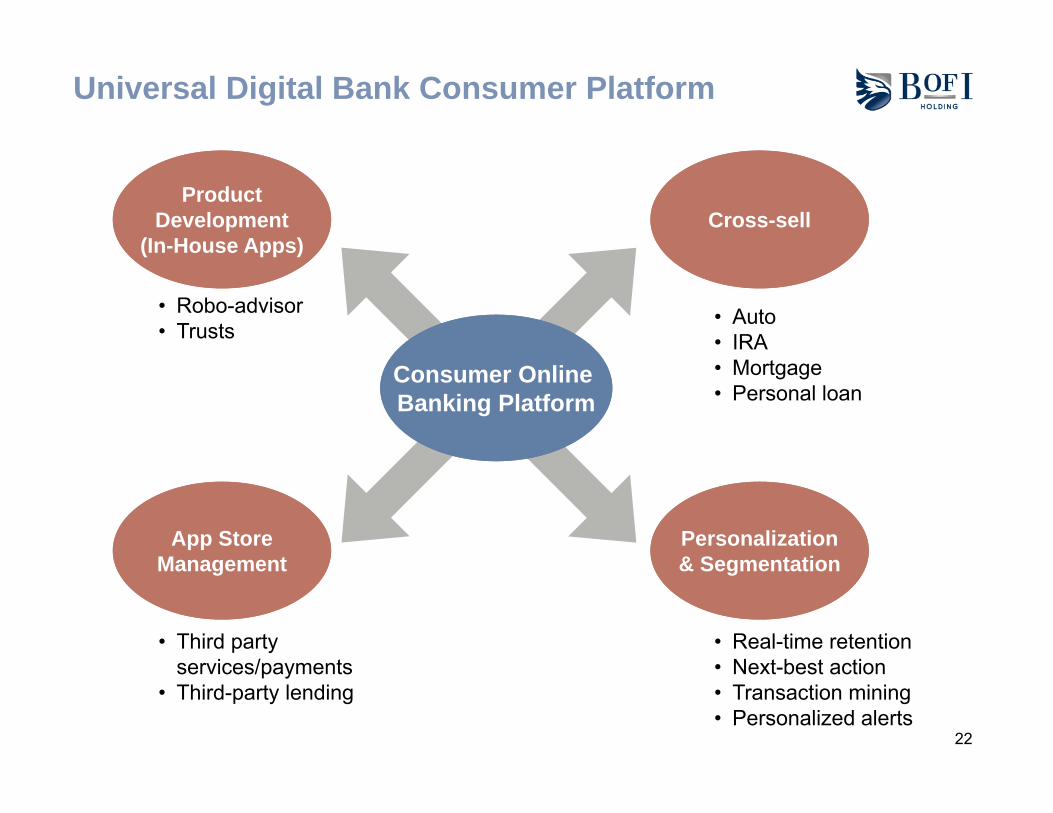
Universal Digital Bank Consumer Platform
Cross-sellCross-sellProduct
Development(In-House Apps)
ProductDevelopment
(In-House Apps)
Personalization& SegmentationPersonalization& Segmentation
App StoreManagement
App StoreManagement
• Robo-advisor• Trusts
• Third party services/payments
• Third-party lending
• Auto• IRA• Mortgage• Personal loan
• Real-time retention• Next-best action• Transaction mining• Personalized alerts
Consumer Online Banking PlatformConsumer Online Banking Platform

23
Advanced Data Analytics Provides Key Insights Into Customer Engagement, Profitability, and Retention to Enhance Customer Lifetime Throughout the Bank
Customer SegmentationMethodology to
Understand Usage & Behavior
Customer SegmentationMethodology to
Understand Usage & Behavior
Profitability Analysis at the Individual Customer Level
Profitability Analysis at the Individual Customer Level
Streamlined Acquisition Process via Lookalike
Modeling &Sales Efficiencies
Streamlined Acquisition Process via Lookalike
Modeling &Sales Efficiencies
Retention & Attrition Drivers to Boost Long-Term
Customer Engagement
Retention & Attrition Drivers to Boost Long-Term
Customer Engagement
Key LearningsFramework for Data Analysis

24
We are Expanding our Strategic Partnership with H&R Block
H&R Block OverviewH&R Block Overview Products for 2018 Tax Season Products for 2018 Tax Season
• Approximately 10,000 U.S branches
• Files 1 in every 7 U.S. tax returns
• 19.7 million U.S. tax returns per year
• 83% of customers receive a refund
• 35% franchise-owned
• Approximately 2,400 employees
• 55 million visits per year on HRB website
• Social media
− 28,600 Twitter Followers− 463,000 Facebook fans− 1.7 Million views on YouTube
• Refund Transfer
• Emerald Advance Unsecured Loan
• Emerald Prepaid Card
• Refund Advance Interest-Free Loan
− BOFI is exclusive provider in 2018 tax season
− BOFI will provide credit underwriting, loan origination, funding and loan servicing
− Interest-free loan is collateralized by borrower’s tax refund
− BOFI’s profits will depend on origination volume and actual credit losses

25
Omni Channel Approach for BofI’s2017 Digital Marketing Strategy
Digital personas for personalized interactions
Introduced BI reporting tool for analytics
Enhanced branding, messaging and positioning
Social employee engagement
Multi-dimensional analysis by geography, customer type, product, media, traffic source
Organizational commitment to user experience InfrastructureInfrastructure
Personalization& Data
Personalization& Data
Brand &ContentBrand &Content
Business Process
Business Process
Analyticalstrategy
Analyticalstrategy
Paid, Social & Mobile
strategy
Paid, Social & Mobile
strategy
User Experience
User Experience
DIGITALSTRATEGY
DIGITALSTRATEGY
Infrastructure
Personalization& Data
Brand &Content
Business Process
Analyticalstrategy
Paid, Social & Mobile
strategy
User Experience
DIGITALSTRATEGY
Marketing automation implementation

26
Holistic Credit Risk Management
What We Do
Loan Life Cycle
Utilize a holistic credit-risk management framework to manage and monitor credit quality at each stage of the loan life cycle, and leverage specialized Credit Tools to optimize monitoring and reporting capabilities
Set AppetiteSet Appetite OriginationsOriginations Portfolio Management
Portfolio Management ReportingReporting Special AssetsSpecial Assets
Credit Monitoring & Oversight
BOFI Credit Objectives
Establish Credit
Framework and Culture
Safe GrowthMonitor Assets
Throughout Life Cycle
Data-Driven Decision Making
Mitigate Problem Loans
Example of Credit Tools
• Board of Directors
• Annual Strategic Plan
• Corporate Governance
• Policies & Approval Authorities
Credit Tools List is a sampling and is not meant to be comprehensive

27
Monitoring & Management Oversight: Core Products
• Loan reviews at least quarterly• Project updates at least quarterly• Updated financials at least annually• Site visits & inspections for development projects
• Portfolio level monitoring with individual loan reviews completed on an exception basis (i.e. delinquency, FICO/LTV degradation).
• FICO pulled twice a year• Updated AVMs twice a year• Super jumbo loans receive complete annual loan
review, including updated credit report• Pledged assets receive refreshed CLTV rations on a
semiannual basis• Portfolio-level review performed quarterly
• Risk based annual loan review process, with 4 levels depending on financial performance & risk triggers
• Updated financials at least annually• FICO pulled twice a year• Updated AVMs twice a year• Updated credit report and property inspections
requested based on risk triggers• Classified loans receive quarterly review• Portfolio-level review performed quarterly• Stress testing performed twice a year
• Loan reviews at least quarterly• Updated financials at least quarterly• Borrowing base / custodial reports at least monthly• Continuous collateral analytics, with quarterly
validation
List is a sampling and is not meant to be comprehensive
Single Family ResidentialSingle Family Residential Income Property LendingIncome Property Lending
Commercial SpecialtyCommercial Specialty C&I – Lender FinanceC&I – Lender Finance

28
(%)
BofI Banks $1-10 bn
Total Net Charge-Offs Annualized 1Total Net Charge-Offs Annualized 1Loans in non-accrual to
total loans1Loans in non-accrual to
total loans1
(%)
BofI Banks $1-10 bn
Best-in-Class Loan Quality
0.01*
0.25
0.0
0.5
0.38
0.89
0
1
2
* Excludes charge-offs related to short-term seasonal tax lending products. The charge-off amount reported by FDIC SDI (including such seasonal tax products) was 0.29.1. From FDIC SDI report at 6/30/17. Total of 515 institutions included in the $1-$10 billion group.

29
Bank Provides Appropriate Resources to Manage Credit and Compliance Risk
Department FTEs June 30, 2014
June 30, 2015
June 30, 2016
June 30, 2017
Credit and Quality Control 41 57 65 85
Risk, Internal Asset Review, Compliance, Audit and BSA
26 35 44 54

30
Full service branchless banking platform with structural cost advantages vs. traditional banks
Superior growth and ROE relative to large and small competitors
Solid track record of allocating capital to businesses with best risk-adjusted returns
New business initiatives will generate incremental growth in customers, loans and profits
Robust risk management systems and culture has resulted in lower credit, counterparty and regulatory risks
Investment Summary

31
Greg Garrabrants, President and CEOAndy Micheletti, EVP/CFO
Johnny Lai, VP Corporate Development andInvestor Relations
Phone: 858.649.2218Mobile: 858.245.1442
Contact Information