body mass index (bmi) describes relative weight for height ... · body mass index (bmi) describes...
TRANSCRIPT
Definitions
Body Mass Index (BMI) describes relativeweight for height: weight (kg)/height (m2)
• Overweight = 25–29.9 BMI
• Obesity = > 30 BMI
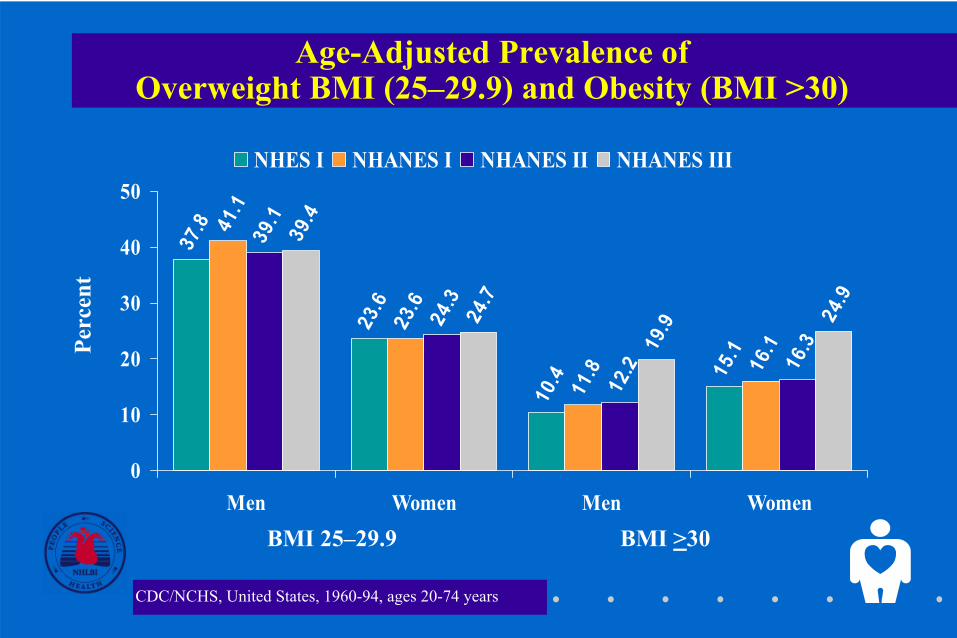
Age-Adjusted Prevalence of Overweight BMI (25–29.9) and Obesity (BMI >30)
37.8
23.6
10.4 15.1
41.1
23.6
11.8 16.1
39.1
24.3
12.2 16.3
24.9
39.4
24.7
19.9
0
10
20
30
40
50
Men Women Men Women
NHES I NHANES I NHANES II NHANES III
BMI >30BMI 25–29.9
CDC/NCHS, United States, 1960-94, ages 20-74 years
Perc
ent
14.9 15.222.1
27.72732.7
41.937.8
0
10
20
30
40
50
Men Women
BMI <25 BMI 25-<27 BMI 27-<30 BMI >30
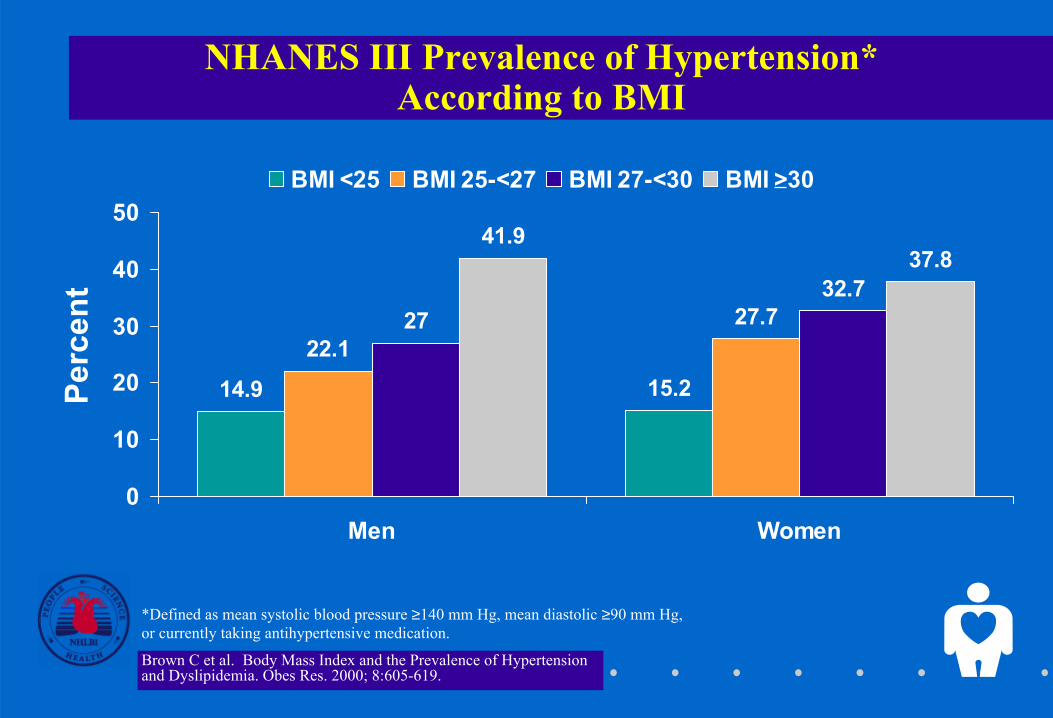
NHANES III Prevalence of Hypertension* According to BMI
*Defined as mean systolic blood pressure ≥140 mm Hg, mean diastolic ≥90 mm Hg, or currently taking antihypertensive medication.
Brown C et al. Body Mass Index and the Prevalence of Hypertension and Dyslipidemia. Obes Res. 2000; 8:605-619.
Perc
ent
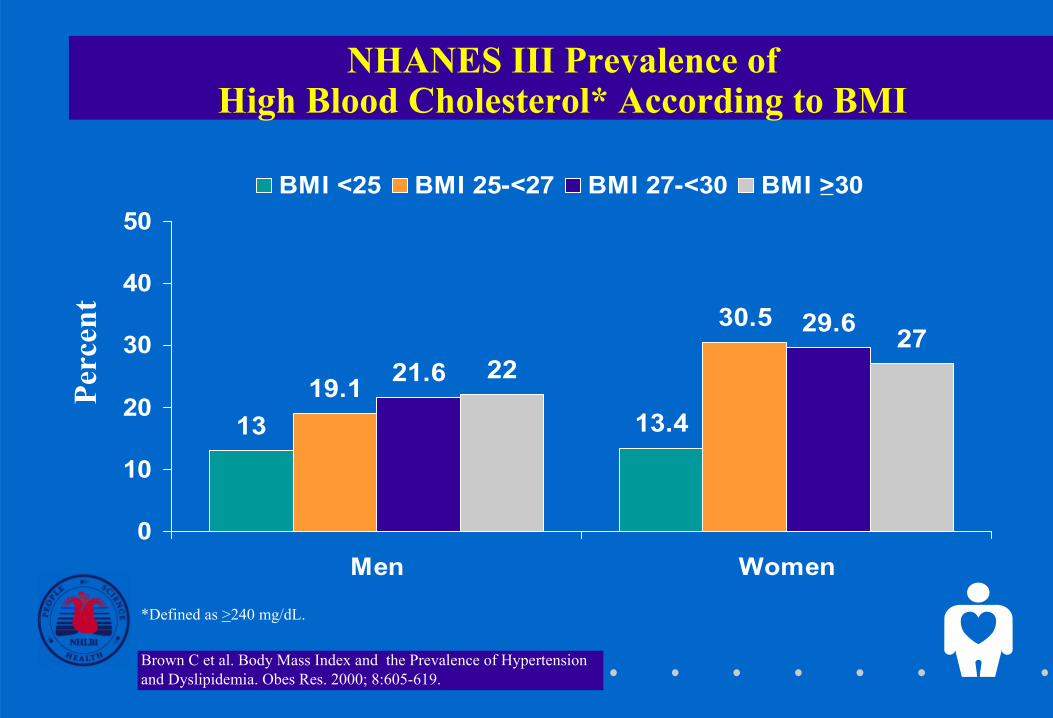
NHANES III Prevalence of High Blood Cholesterol* According to BMI
13.413
30.5
19.1
29.6
21.627
22
0
10
20
30
40
50
Men Women
BMI <25 BMI 25-<27 BMI 27-<30 BMI >30
*Defined as >240 mg/dL.
Brown C et al. Body Mass Index and the Prevalence of Hypertension and Dyslipidemia. Obes Res. 2000; 8:605-619.
Perc
ent
16.6
9
27.1
18.2
28.523.7
40.6
31.1
0
10
20
30
40
50
60
Men Women
BMI <25 BMI 25-<27 BMI 27-<30 BMI >30
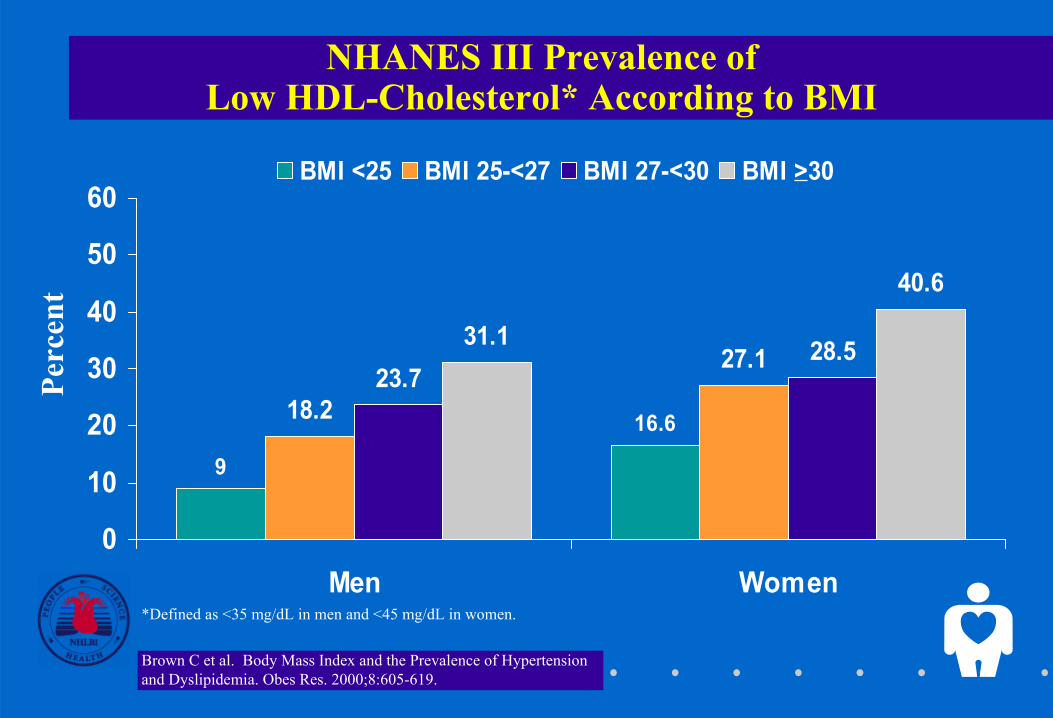
NHANES III Prevalence of Low HDL-Cholesterol* According to BMI
*Defined as <35 mg/dL in men and <45 mg/dL in women.
Brown C et al. Body Mass Index and the Prevalence of Hypertension and Dyslipidemia. Obes Res. 2000;8:605-619.
Perc
ent
Health Benefits of Weight Loss
• Decreased cardiovascular risk
• Decreased glucose and insulin levels
• Decreased blood pressure
• Decreased LDL and triglycerides, increased HDL
• Decrease in severity of sleep apnea
• Reduced symptoms of degenerative joint disease
• Improved gynecological conditions
Requires two steps:
• Assessment
• Management
Care of Overweight/Obese Patients
Assessment of Overweight and Obesity
• Body Mass Index
– Weight (kg)/height (m2)
– Weight (lb)/height (in2) x 703
– Table
• Waist Circumference
– High risk:
• Men >102 cm (40 in.)
• Women >88 cm (35 in.)
Obesity Class BMI kg/m2
Underweight <18.5
Normal 18.5–24.9
Overweight 25–29.9
Obesity I 30.0–34.9
II 35.0–39.9
Extreme Obesity III ≥≥≥≥ 40.0
Classification of Overweight and Obesity by BMI
Determine Absolute Risk StatusEvaluate:
• Disease conditions (e.g., CHD, type 2 diabetes, sleep apnea)(+ = very high risk)
• Other obesity-associated diseases (e.g., gynecologicalabnormalities, osteoarthritis)
• Cardiovascular risk factors: smoking, hypertension,high LDL, low HDL, IGT, family hx (>3 = high risk)
• Other risk factors:
– Physical inactivity
– High serum triglycerides (>200 mg/dL)
Treatment AlgorithmPatient Encounter
Hx of 25 BMI?≥
• Measure weight, height, and waist circumference
• Calculate BMI
Examination
Brief reinforcement/ educate on weight management
Periodic weight check
Advise to maintain weight/address other risk factors
Clinician and patient devise goals and treatment strategyfor weight loss andrisk factor control
Assess reasons for failure to lose weight
Maintenance counseling: Dietary therapy Behavior therapy Physical activity:
Treatment
Assess risk factors
No
Yes
1
2
14
15 13
12
11 1016
3
4 6
5 7
8
9
Yes
No
Yes
No
Hx BMI 25? ≥
No
Yes
Yes
No
Does patient want to lose weight?
Yes
No
Progress being made/goal
achieved?
BMI 25 OR ≥ waist circumference
> 88 cm (F) > 102 cm (M)
BMI ≥ 30 OR
{[BMI 25 to 29.9 OR waist circumference
>88 cm (F) >102 cm (M)] AND 2 risk ≥
factors}
BMImeasured in past
2 years?
No
BMI≥ 30 OR
{[BMI 25 to 29.9OR waist >88 cm (F)
>102 cm (M)]AND ≥ 2 risk
factors}
Treatment Algorithm(Part 1 of 3)
Patient Encounter
Hx of ≥ 25 BMI?
• Measure weight,height, and waistcircumference
• Calculate BMI
Assess risk factors
NoYes
1
2
3
46
5
7
Yes
No
BMImeasured in past
2 years?
BMI ≥ 25 ORwaist > 88 cm (F)
> 102 cm (M)
Yes
ExaminationTreatment
Devise goals andtreatment strategy forweight loss and riskfactor control
Assess reasons forfailure to lose weight
Maintenance counseling
12
11 10
8
9
No
Yes
Yes
No Desire tolose weight?
Yes
No
Progress made?
BMI≥ 30 OR
{[BMI 25 to 29.9OR waist >88 cm (F)
>102 cm (M)]AND ³ 2 risk
factors}
Examination
Treatment
7
Periodic weightcheck
• Advise to maintain weight
• Address other risk factors
13
16
Treatment Algorithm(Part 2 of 3)
• Brief reinforcement
• Educate on weightmanagement
Periodic weight check
• Advise to maintain weight
• Address other risk factors
14
15 13
16
5Yes
No
Yes
No
Hx BMI ≥ 25?
BMI ≥ 25 OR waist > 88 cm (F)
> 102 cm (M)
Examination
Treatment
Treatment Algorithm(Part 3 of 3)
* This algorithm applies only to theassessment for overweight andobesity and subsequent decisionsbased on that assessment. It does notinclude any initial overall assessmentfor cardiovascular risk factors ordiseases that are indicated.
CORE SET II 1
Definitions
Body Mass Index (BMI) describes relativeweight for height: weight (kg)/height (m2)
• Overweight = 25–29.9 BMI
• Obesity = >30 BMI
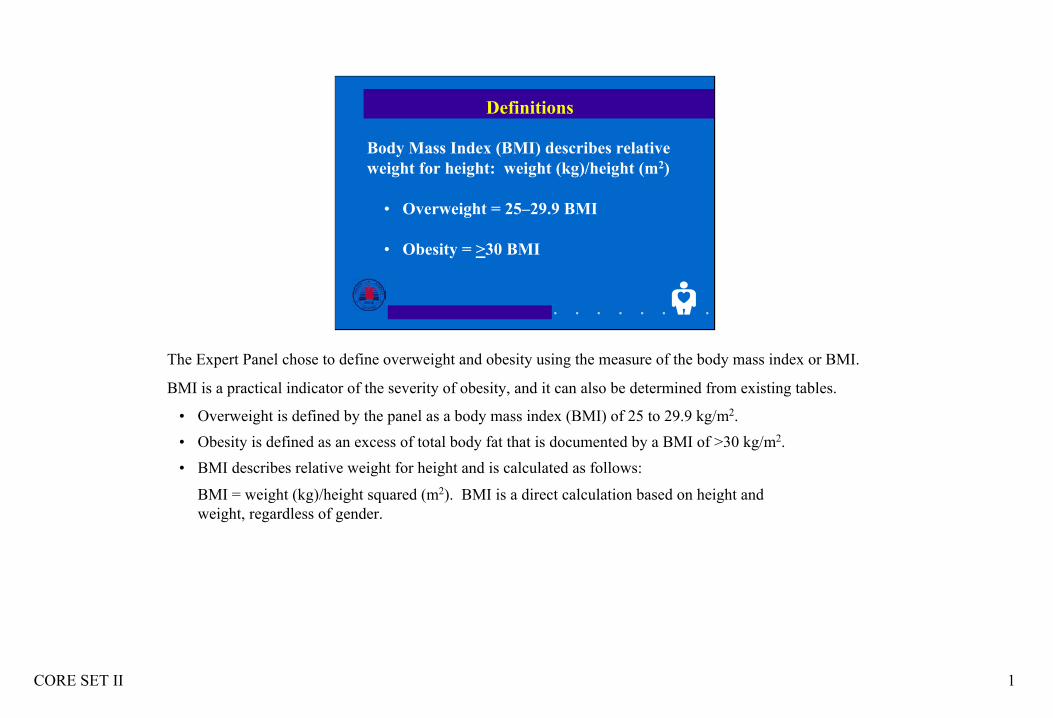
The Expert Panel chose to define overweight and obesity using the measure of the body mass index or BMI.
BMI is a practical indicator of the severity of obesity, and it can also be determined from existing tables.
• Overweight is defined by the panel as a body mass index (BMI) of 25 to 29.9 kg/m2. • Obesity is defined as an excess of total body fat that is documented by a BMI of >30 kg/m2. • BMI describes relative weight for height and is calculated as follows:
BMI = weight (kg)/height squared (m2). BMI is a direct calculation based on height and weight, regardless of gender.
CORE SET II 2
Age-Adjusted Prevalence of Overweight BMI (25–29.9) and Obesity (BMI >30)
37.8
23.6
10.4 15
.1
41.1
23.6
11.8 16
.1
39.1
24.3
12.2 16
.324
.9
39.4
24.7
19.9
0
10
20
30
40
50
Men Women Men Women
NHES I NHANES I NHANES II NHANES III
BMI >30BMI 25–29.9
CDC/NCHS, United States, 1960-94, ages 20-74 years
Perc
ent
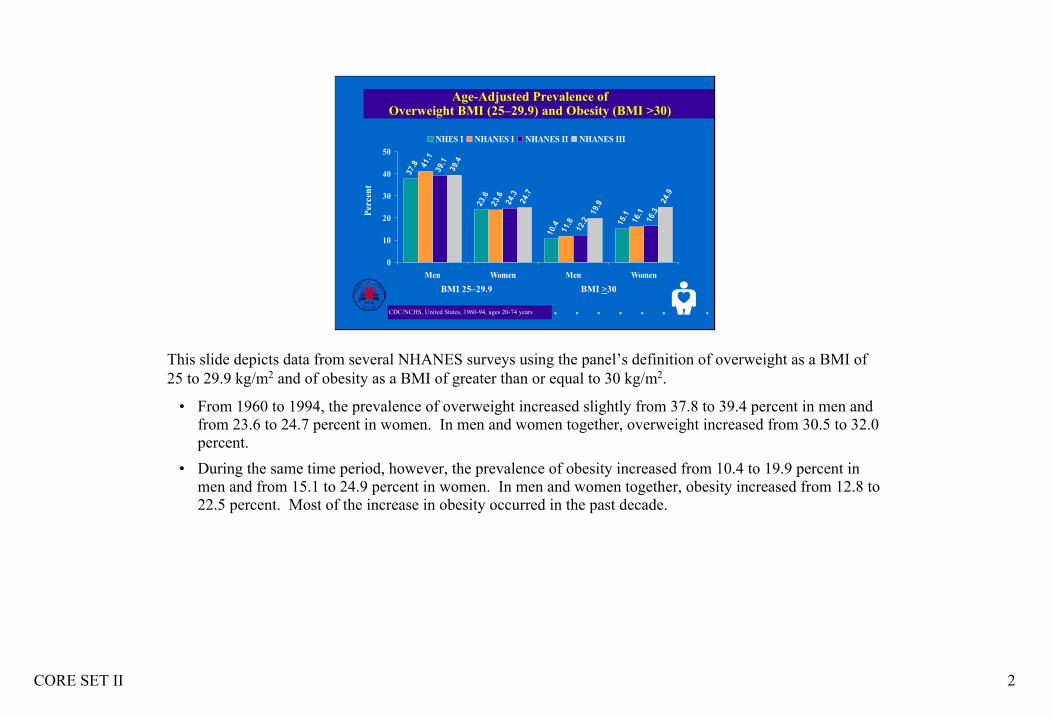
This slide depicts data from several NHANES surveys using the panel’s definition of overweight as a BMI of 25 to 29.9 kg/m2 and of obesity as a BMI of greater than or equal to 30 kg/m2.
• From 1960 to 1994, the prevalence of overweight increased slightly from 37.8 to 39.4 percent in men and from 23.6 to 24.7 percent in women. In men and women together, overweight increased from 30.5 to 32.0 percent.
• During the same time period, however, the prevalence of obesity increased from 10.4 to 19.9 percent in men and from 15.1 to 24.9 percent in women. In men and women together, obesity increased from 12.8 to 22.5 percent. Most of the increase in obesity occurred in the past decade.
CORE SET II 3
14.9 15.222.1
27.72732.7
41.937.8
0
10
20
30
40
50
Men Women
BMI <25 BMI 25-<27 BMI 27-<30 BMI >30
NHANES III Prevalence of Hypertension* According to BMI
*Defined as mean systolic blood pressure ≥140 mm Hg, mean diastolic ≥90 mm Hg, or currently taking antihypertensive medication.
Brown C et al. Body Mass Index and the Prevalence of Hypertension and Dyslipidemia. Obes Res. 2000; 8:605-619.
Perc
ent
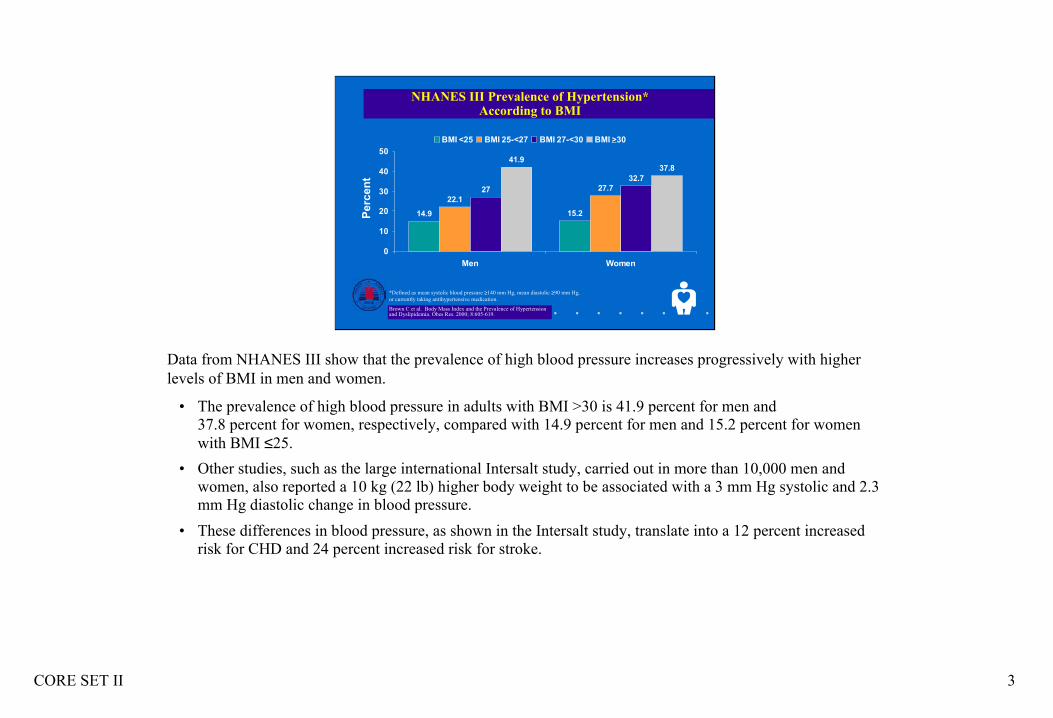
Data from NHANES III show that the prevalence of high blood pressure increases progressively with higher levels of BMI in men and women.
• The prevalence of high blood pressure in adults with BMI >30 is 41.9 percent for men and 37.8 percent for women, respectively, compared with 14.9 percent for men and 15.2 percent for women with BMI ≤25.
• Other studies, such as the large international Intersalt study, carried out in more than 10,000 men and women, also reported a 10 kg (22 lb) higher body weight to be associated with a 3 mm Hg systolic and 2.3 mm Hg diastolic change in blood pressure.
• These differences in blood pressure, as shown in the Intersalt study, translate into a 12 percent increased risk for CHD and 24 percent increased risk for stroke.
CORE SET II 4
NHANES III Prevalence of High Blood Cholesterol* According to BMI
13.413
30.5
19.1
29.6
21.627
22
0
10
20
30
40
50
Men Women
BMI <25 BMI 25-<27 BMI 27-<30 BMI >30
*Defined as >240 mg/dL.
Brown C et al. Body Mass Index and the Prevalence of Hypertension and Dyslipidemia. Obes Res. 2000; 8:605-619.
Perc
ent
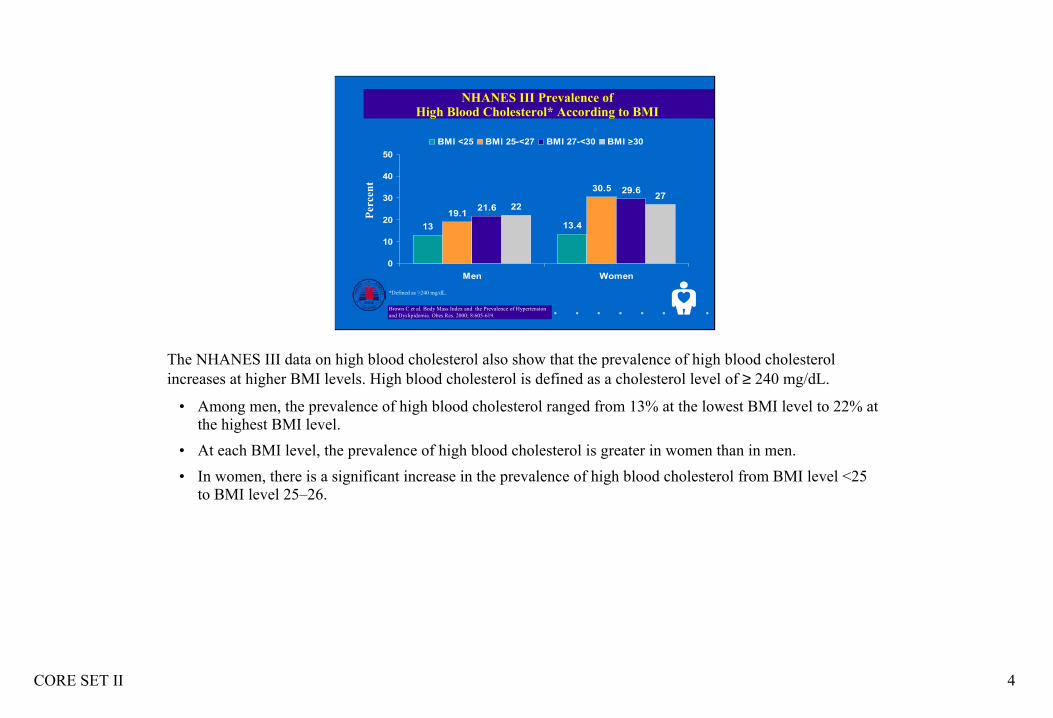
The NHANES III data on high blood cholesterol also show that the prevalence of high blood cholesterol increases at higher BMI levels. High blood cholesterol is defined as a cholesterol level of ≥ 240 mg/dL.
• Among men, the prevalence of high blood cholesterol ranged from 13% at the lowest BMI level to 22% at the highest BMI level.
• At each BMI level, the prevalence of high blood cholesterol is greater in women than in men.• In women, there is a significant increase in the prevalence of high blood cholesterol from BMI level <25
to BMI level 25–26.
CORE SET II 5
16.6
9
27.1
18.2
28.523.7
40.6
31.1
0
10
20
30
40
50
60
Men Women
BMI <25 BMI 25-<27 BMI 27-<30 BMI >30
NHANES III Prevalence of Low HDL-Cholesterol* According to BMI
*Defined as <35 mg/dL in men and <45 mg/dL in women.
Brown C et al. Body Mass Index and the Prevalence of Hypertension and Dyslipidemia. Obes Res. 2000;8:605-619.
Perc
ent
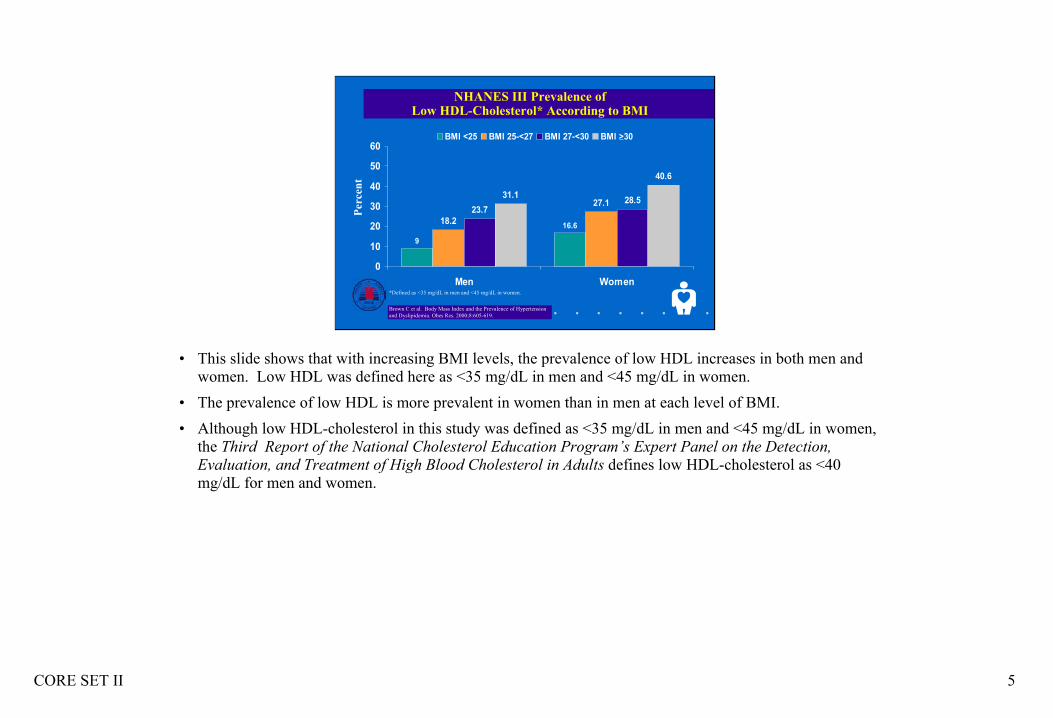
• This slide shows that with increasing BMI levels, the prevalence of low HDL increases in both men and women. Low HDL was defined here as <35 mg/dL in men and <45 mg/dL in women.
• The prevalence of low HDL is more prevalent in women than in men at each level of BMI. • Although low HDL-cholesterol in this study was defined as <35 mg/dL in men and <45 mg/dL in women,
the Third Report of the National Cholesterol Education Program’s Expert Panel on the Detection, Evaluation, and Treatment of High Blood Cholesterol in Adults defines low HDL-cholesterol as <40 mg/dL for men and women.
CORE SET II 6
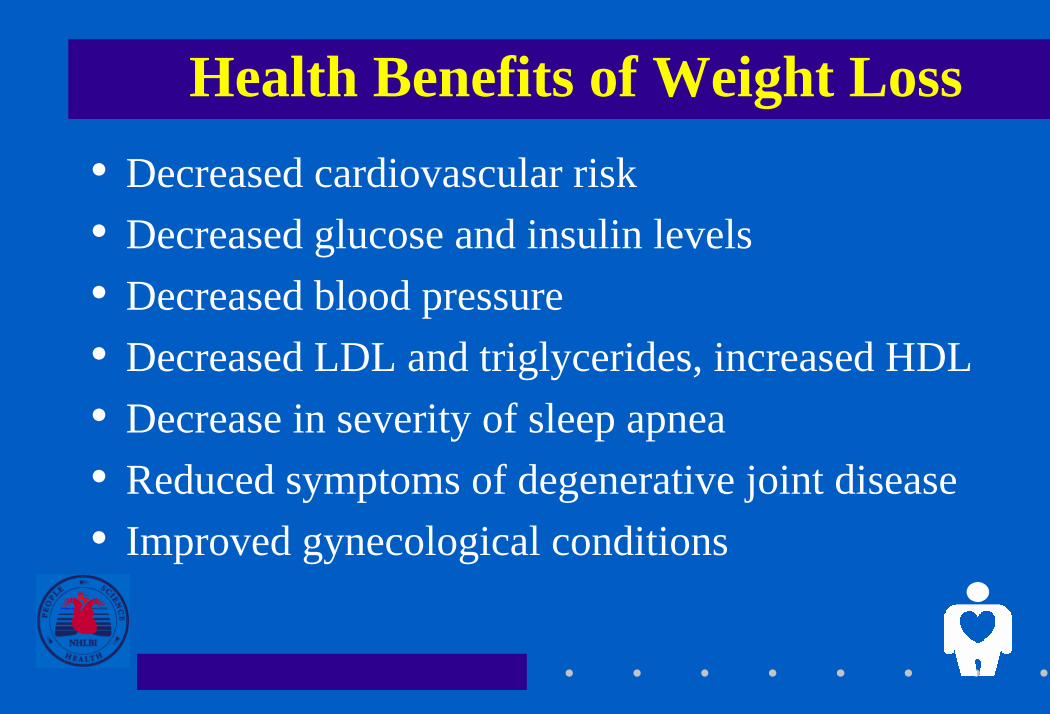
Health Benefits of Weight Loss
• Decreased cardiovascular risk• Decreased glucose and insulin levels• Decreased blood pressure• Decreased LDL and triglycerides, increased HDL• Decreased severity of sleep apnea• Reduced symptoms of degenerative joint disease• Improved gynecological conditions
The recommendation to treat overweight and obesity is based not only on the evidence that shows overweight is associated with increased morbidity and mortality, but also on randomized controlled trials (RCT) evidence that weight loss reduces risk factors for disease. Thus, weight loss may help control diseases worsened by overweight and obesity and may also decrease the likelihood of developing these diseases.
Some benefits associated with weight loss include the following:
• Decreased cardiovascular risk. • Decreased glucose and insulin levels.• Decreased blood pressure. • Decreased LDL-cholesterol and triglycerides and increased HDL-cholesterol. • Decreased severity of sleep apnea.• Reduced symptoms of degenerative joint disease.• Improved gynecological conditions.
CORE SET II 7
Care of Overweight/Obese Patients
Requires two steps:• Assessment• Management
As determined by the expert panel, caring for the overweight or obese patient is a two-step process that includes assessment and management:
• Assessment requires determining the degree of obesity and a patient’s absolute risk status based on other risk factors.
• Management includes both weight control or reducing excess body weight and maintaining that weight loss as well as instituting other measures to control associated risk factors.
Obesity is a chronic disease, and both the patient and the practitioner need to understand that successful treatment requires a lifelong effort.
CORE SET II 8
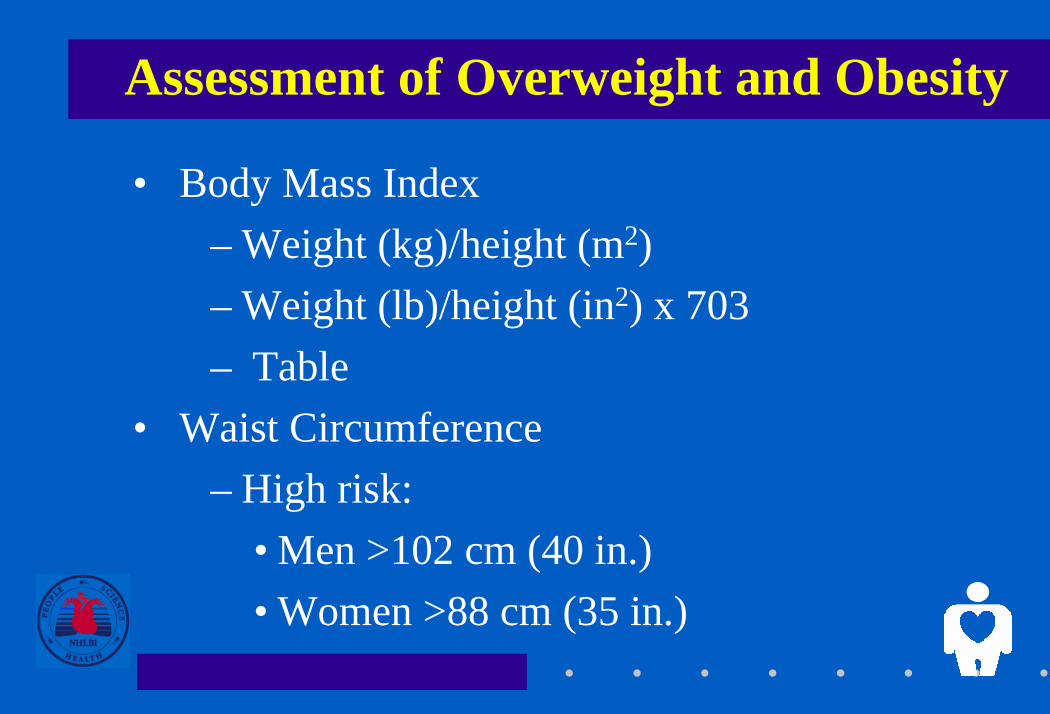
Assessment of Overweight and Obesity• Body Mass Index
– Weight (kg)/height (m2)– Weight (lb)/height (in2) x 703– Table
• Waist Circumference– High risk:
• Men >102 cm (40 in.)• Women >88 cm (35 in.)
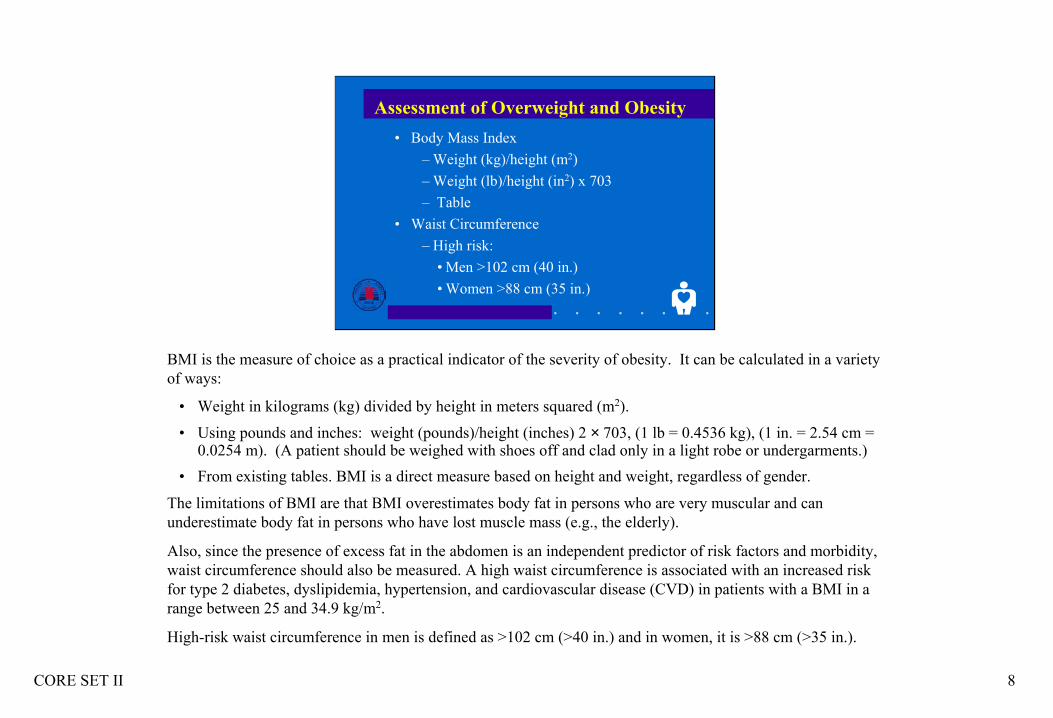
BMI is the measure of choice as a practical indicator of the severity of obesity. It can be calculated in a variety of ways:
• Weight in kilograms (kg) divided by height in meters squared (m2).
• Using pounds and inches: weight (pounds)/height (inches) 2 × 703, (1 lb = 0.4536 kg), (1 in. = 2.54 cm = 0.0254 m). (A patient should be weighed with shoes off and clad only in a light robe or undergarments.)
• From existing tables. BMI is a direct measure based on height and weight, regardless of gender.
The limitations of BMI are that BMI overestimates body fat in persons who are very muscular and can underestimate body fat in persons who have lost muscle mass (e.g., the elderly).
Also, since the presence of excess fat in the abdomen is an independent predictor of risk factors and morbidity, waist circumference should also be measured. A high waist circumference is associated with an increased risk for type 2 diabetes, dyslipidemia, hypertension, and cardiovascular disease (CVD) in patients with a BMI in a range between 25 and 34.9 kg/m2.
High-risk waist circumference in men is defined as >102 cm (>40 in.) and in women, it is >88 cm (>35 in.).
CORE SET II 9
Obesity Class BMI kg/m2
Underweight <18.5
Normal 18.5–24.9
Overweight 25–29.9
Obesity I 30.0–34.9
II 35.0–39.9
Extreme Obesity III ≥40.0
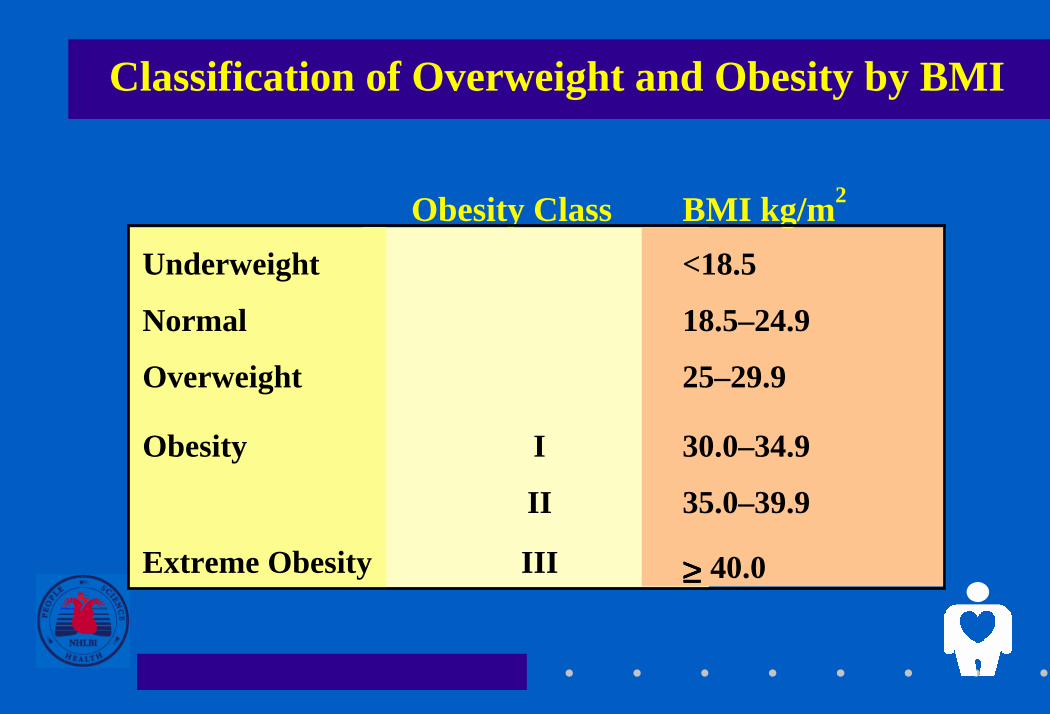
Classification of Overweight and Obesity by BMI
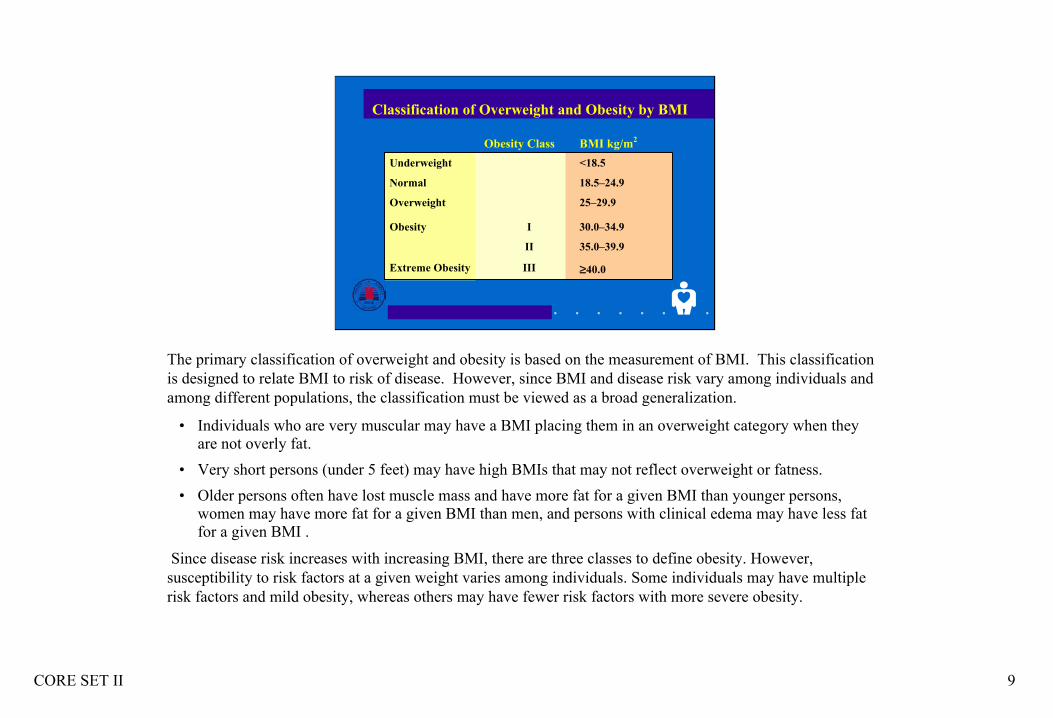
The primary classification of overweight and obesity is based on the measurement of BMI. This classification is designed to relate BMI to risk of disease. However, since BMI and disease risk vary among individuals and among different populations, the classification must be viewed as a broad generalization.
• Individuals who are very muscular may have a BMI placing them in an overweight category when they are not overly fat.
• Very short persons (under 5 feet) may have high BMIs that may not reflect overweight or fatness. • Older persons often have lost muscle mass and have more fat for a given BMI than younger persons,
women may have more fat for a given BMI than men, and persons with clinical edema may have less fat for a given BMI .
Since disease risk increases with increasing BMI, there are three classes to define obesity. However, susceptibility to risk factors at a given weight varies among individuals. Some individuals may have multiple risk factors and mild obesity, whereas others may have fewer risk factors with more severe obesity.
CORE SET II 10
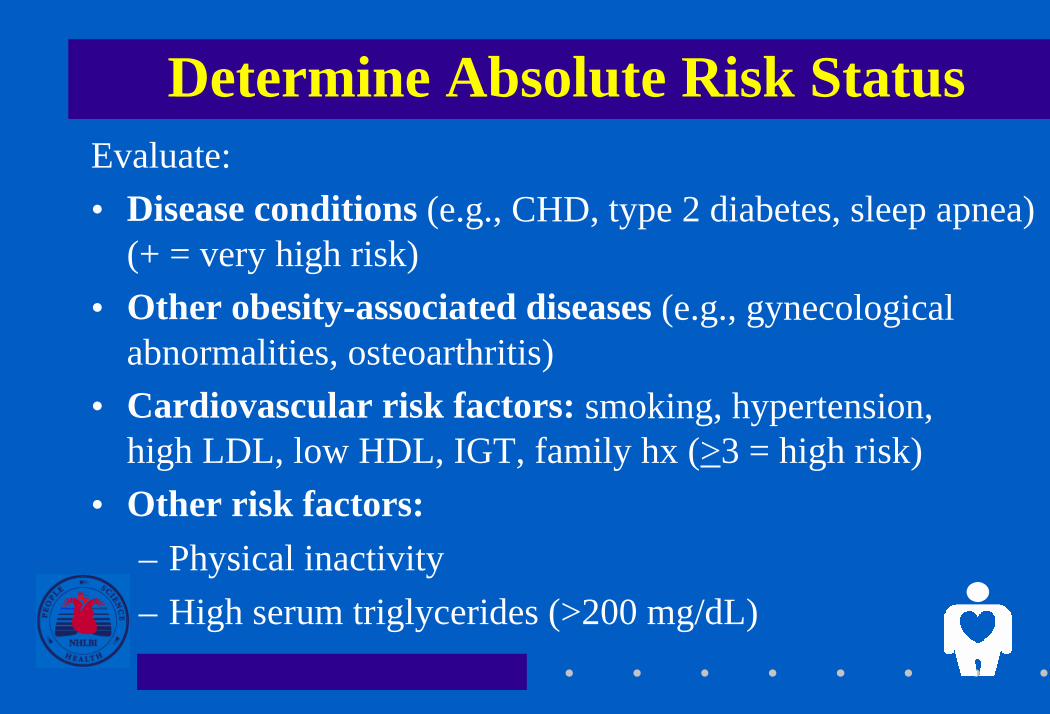
Determine Absolute Risk StatusEvaluate:• Disease conditions (e.g., CHD, type 2 diabetes, sleep apnea)
(+ = very high risk)• Other obesity-associated diseases (e.g., gynecological
abnormalities, osteoarthritis)• Cardiovascular risk factors: smoking, hypertension,
high LDL, low HDL, IGT, family hx (>3 = high risk)• Other risk factors:
– Physical inactivity– High serum triglycerides (>200 mg/dL)
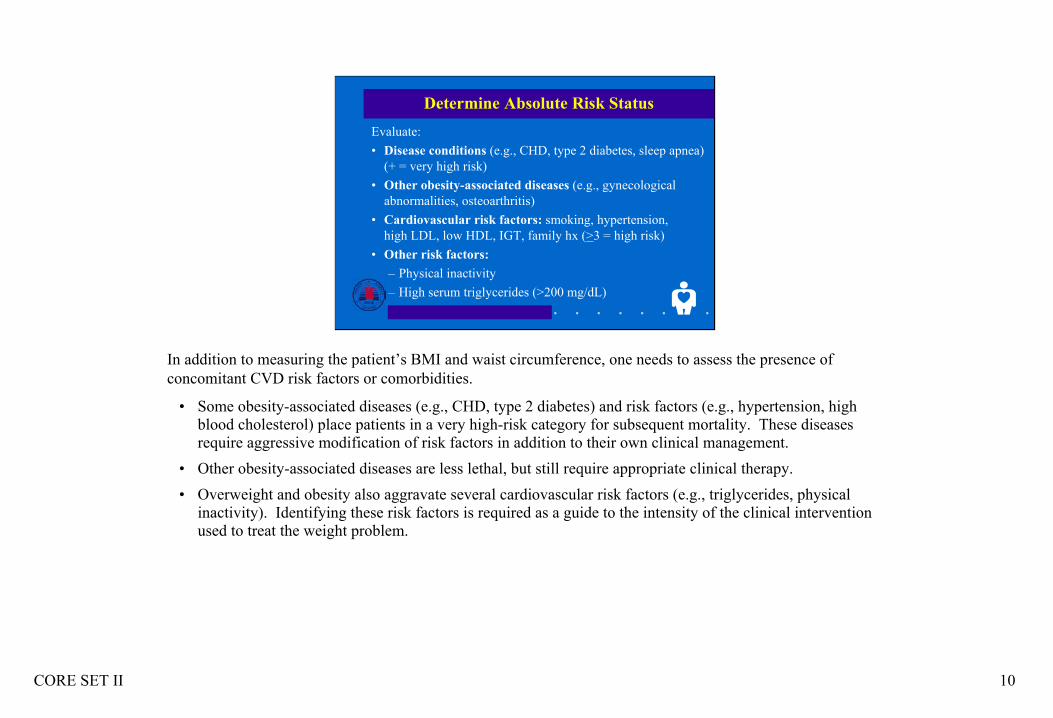
In addition to measuring the patient’s BMI and waist circumference, one needs to assess the presence of concomitant CVD risk factors or comorbidities.
• Some obesity-associated diseases (e.g., CHD, type 2 diabetes) and risk factors (e.g., hypertension, high blood cholesterol) place patients in a very high-risk category for subsequent mortality. These diseases require aggressive modification of risk factors in addition to their own clinical management.
• Other obesity-associated diseases are less lethal, but still require appropriate clinical therapy.• Overweight and obesity also aggravate several cardiovascular risk factors (e.g., triglycerides, physical
inactivity). Identifying these risk factors is required as a guide to the intensity of the clinical intervention used to treat the weight problem.
CORE SET II 11
Treatment AlgorithmPatient Encounter
Hx of 25 BMI?≥
• Measure weight, height, and waistcircumference
• Calculate BMI
Examination
Brief reinforcement/ educate on weight management
Periodic weightcheck
Advise to maintainweight/addressother risk factors
Clinician and patientdevise goals andtreatment strategyfor weight loss andrisk factor control
Assess reasons forfailure to lose weight
Maintenance counseling: Dietary therapyBehavior therapyPhysical activity:
Treatment
Assess risk factors
No
Yes
1
2
14
15 13
12
11 1016
3
4 6
5 7
8
9
Yes
No
Yes
No
Hx BMI 25?≥
No
Yes
Yes
No
Doespatient want tolose weight?
Yes
No
Progress being made/goal
achieved?
BMI 25 OR≥waist circumference
> 88 cm (F)> 102 cm (M)
BMI≥ 30 OR
{[BMI 25 to 29.9 OR waist circumference
>88 cm (F) >102 cm (M)]AND 2 risk≥
factors}
BMImeasured in past
2 years?
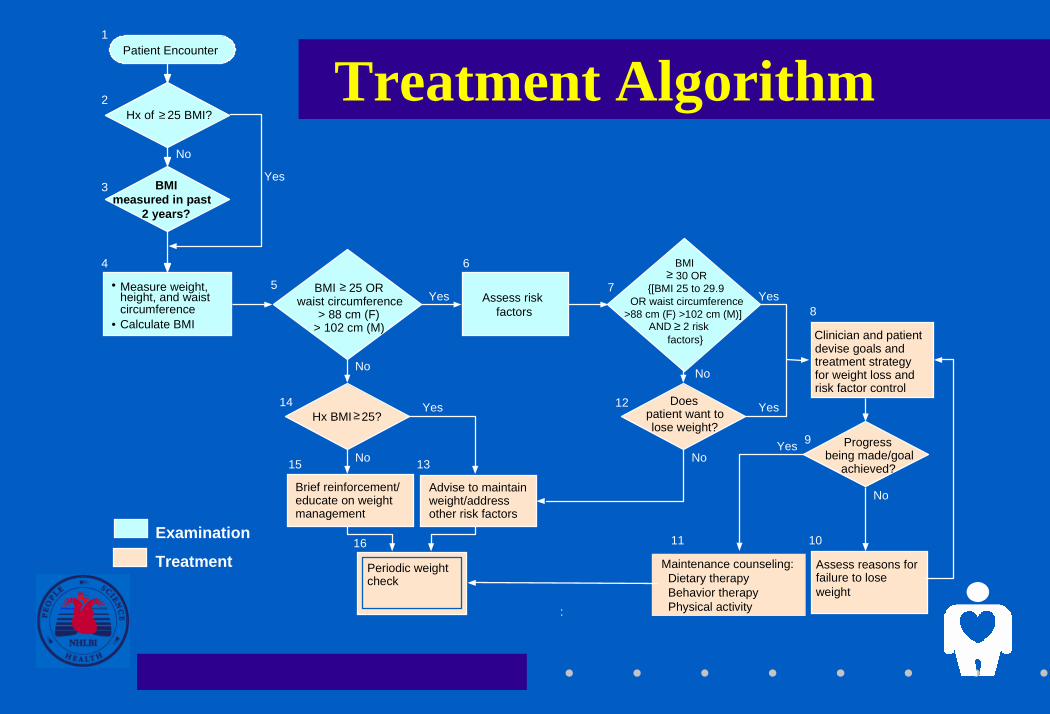
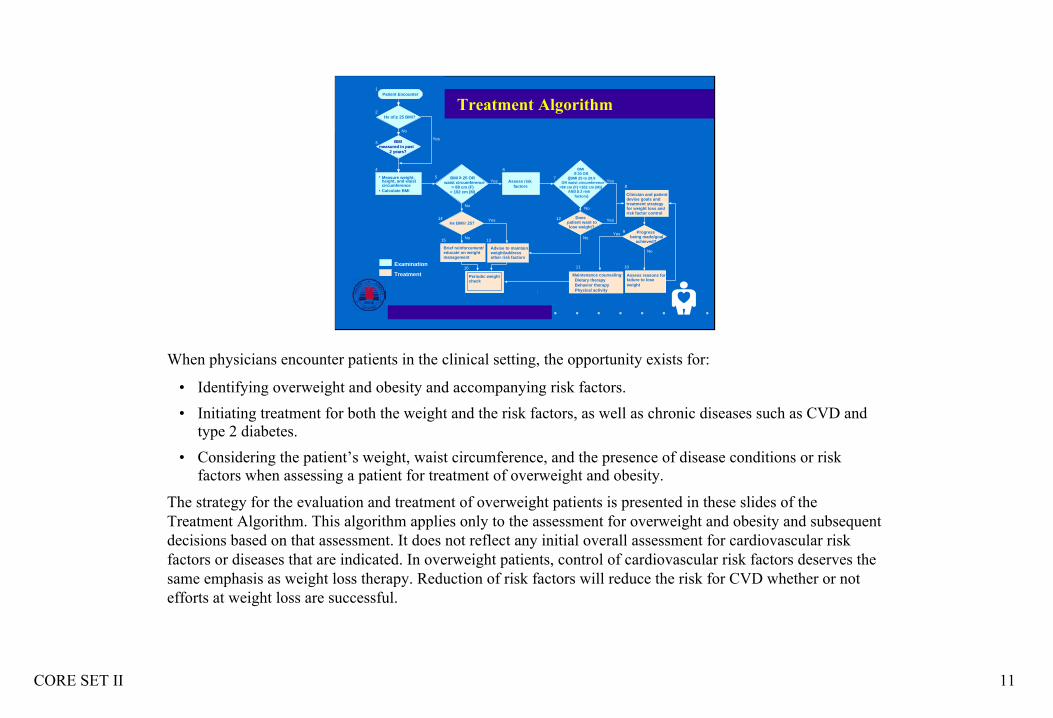
When physicians encounter patients in the clinical setting, the opportunity exists for:
• Identifying overweight and obesity and accompanying risk factors.• Initiating treatment for both the weight and the risk factors, as well as chronic diseases such as CVD and
type 2 diabetes. • Considering the patient’s weight, waist circumference, and the presence of disease conditions or risk
factors when assessing a patient for treatment of overweight and obesity.
The strategy for the evaluation and treatment of overweight patients is presented in these slides of the Treatment Algorithm. This algorithm applies only to the assessment for overweight and obesity and subsequent decisions based on that assessment. It does not reflect any initial overall assessment for cardiovascular risk factors or diseases that are indicated. In overweight patients, control of cardiovascular risk factors deserves the same emphasis as weight loss therapy. Reduction of risk factors will reduce the risk for CVD whether or not efforts at weight loss are successful.
CORE SET II 12
No
BMI ≥30 OR
{[BMI 25 to 29.9 OR waist >88 cm (F)
>102 cm (M)] AND ≥2 risk
factors}
Treatment Algorithm (Part 1 of 3)Patient Encounter
Hx of ≥25 BMI?
• Measure weight, height, and waist circumference
• Calculate BMI
Assess risk factors
NoYes
1
2
3
46
5
7
Yes
No
BMI measured in past
2 years?
BMI ≥25 ORwaist >88 cm (F)
>102 cm (M)
Yes
ExaminationTreatment
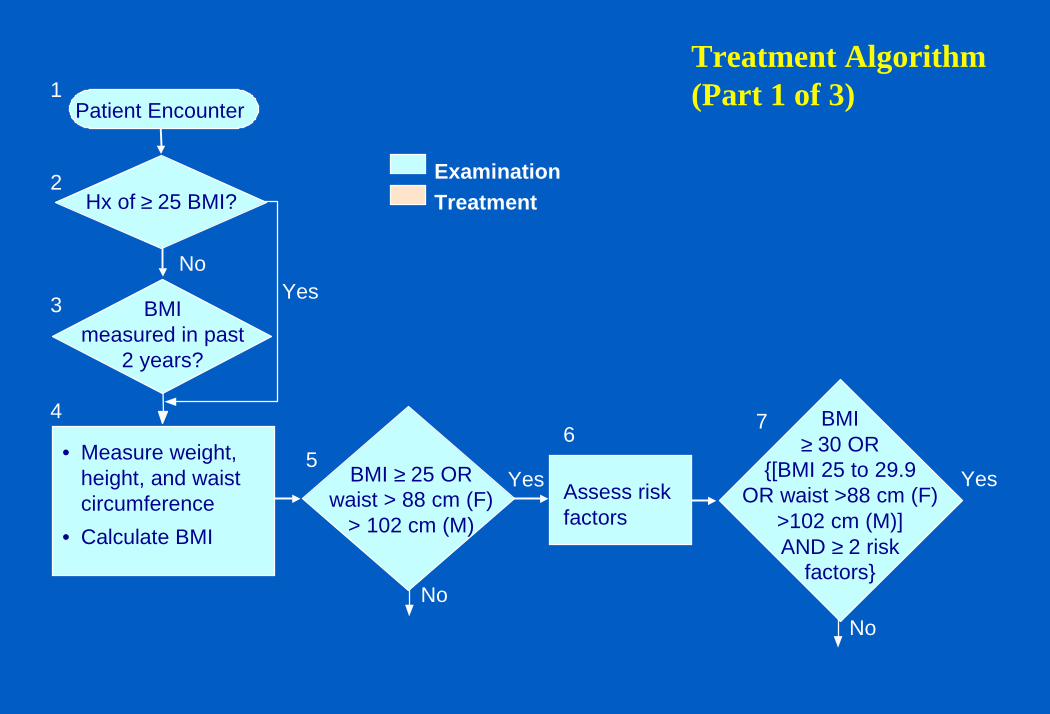
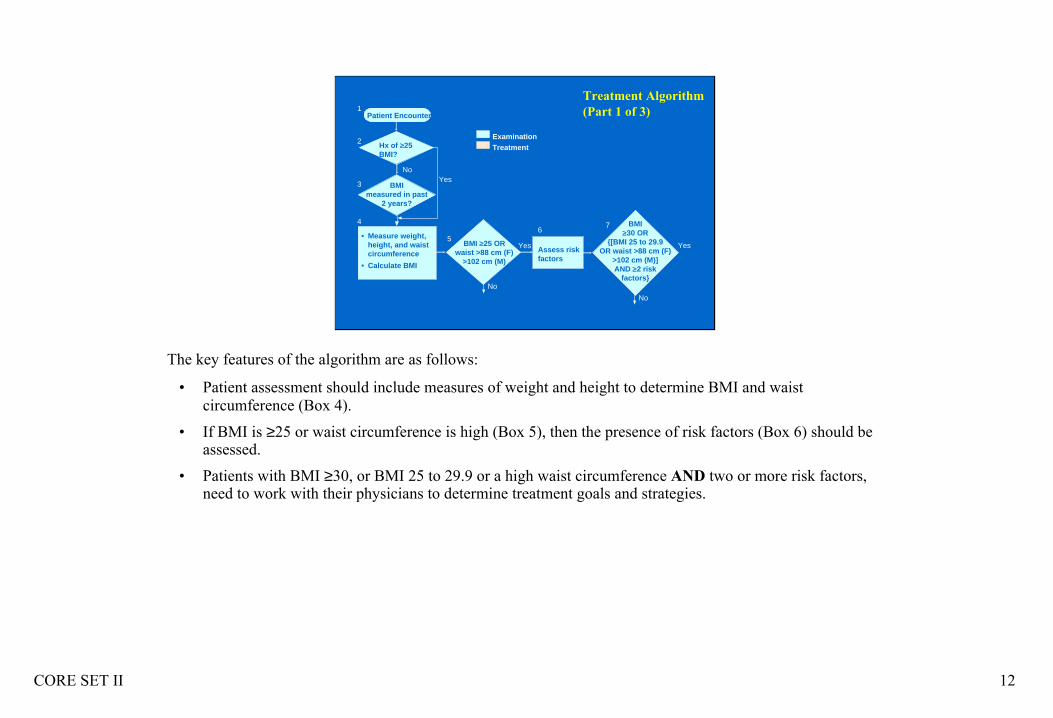
The key features of the algorithm are as follows:
• Patient assessment should include measures of weight and height to determine BMI and waist circumference (Box 4).
• If BMI is ≥25 or waist circumference is high (Box 5), then the presence of risk factors (Box 6) should be assessed.
• Patients with BMI ≥30, or BMI 25 to 29.9 or a high waist circumference AND two or more risk factors, need to work with their physicians to determine treatment goals and strategies.
CORE SET II 13
Devise goals andtreatment strategy forweight loss and riskfactor control
Assess reasons forfailure to lose weight
Maintenance counseling
12
11 10
8
9
No
Yes
Yes
No Desire tolose weight?
Yes
No
Progress made?
BMI ≥30 OR
{[BMI 25 to 29.9 OR waist >88 cm (F)
>102 cm (M)]AND ≥2 risk
factors}Examination
Treatment
7
Periodic weightcheck
• Advise to maintain weight
• Address other risk factors
13
16
Treatment Algorithm (Part 2 of 3)
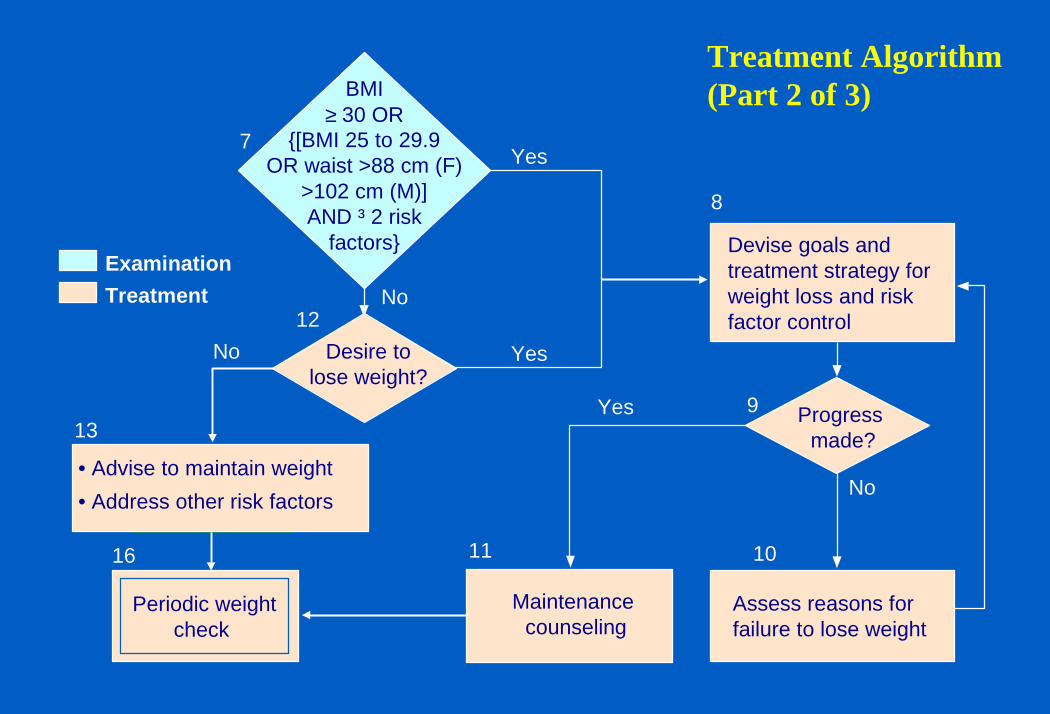
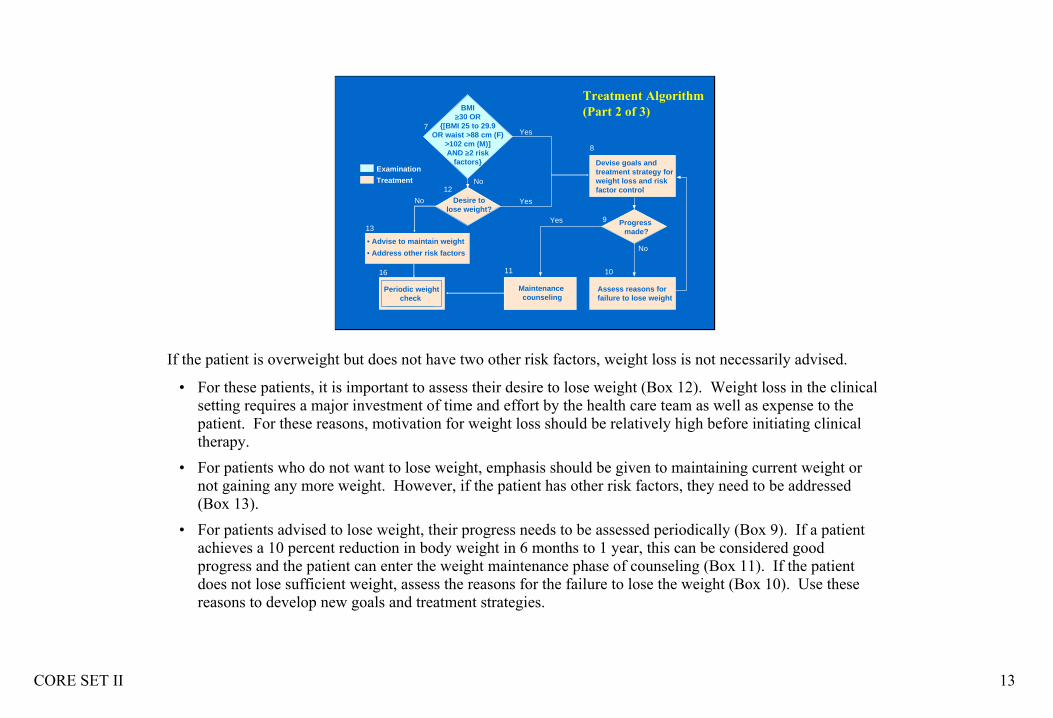
If the patient is overweight but does not have two other risk factors, weight loss is not necessarily advised.
• For these patients, it is important to assess their desire to lose weight (Box 12). Weight loss in the clinical setting requires a major investment of time and effort by the health care team as well as expense to the patient. For these reasons, motivation for weight loss should be relatively high before initiating clinical therapy.
• For patients who do not want to lose weight, emphasis should be given to maintaining current weight or not gaining any more weight. However, if the patient has other risk factors, they need to be addressed (Box 13).
• For patients advised to lose weight, their progress needs to be assessed periodically (Box 9). If a patient achieves a 10 percent reduction in body weight in 6 months to 1 year, this can be considered good progress and the patient can enter the weight maintenance phase of counseling (Box 11). If the patient does not lose sufficient weight, assess the reasons for the failure to lose the weight (Box 10). Use these reasons to develop new goals and treatment strategies.
CORE SET II 14
• Brief reinforcement • Educate on weight
management
Periodic weight check
• Advise to maintain weight
• Address other risk factors
14
15 13
16
5Yes
No
Yes
No
Hx BMI ≥25?
BMI ≥25 OR waist >88 cm (F)
>102 cm (M)Examination
Treatment
Treatment Algorithm (Part 3 of 3)
* This algorithm applies only to the assessment for overweight and obesity and subsequent decisions based on that assessment. It does not include any initial overall assessment for cardiovascular risk factors or diseases that are indicated.
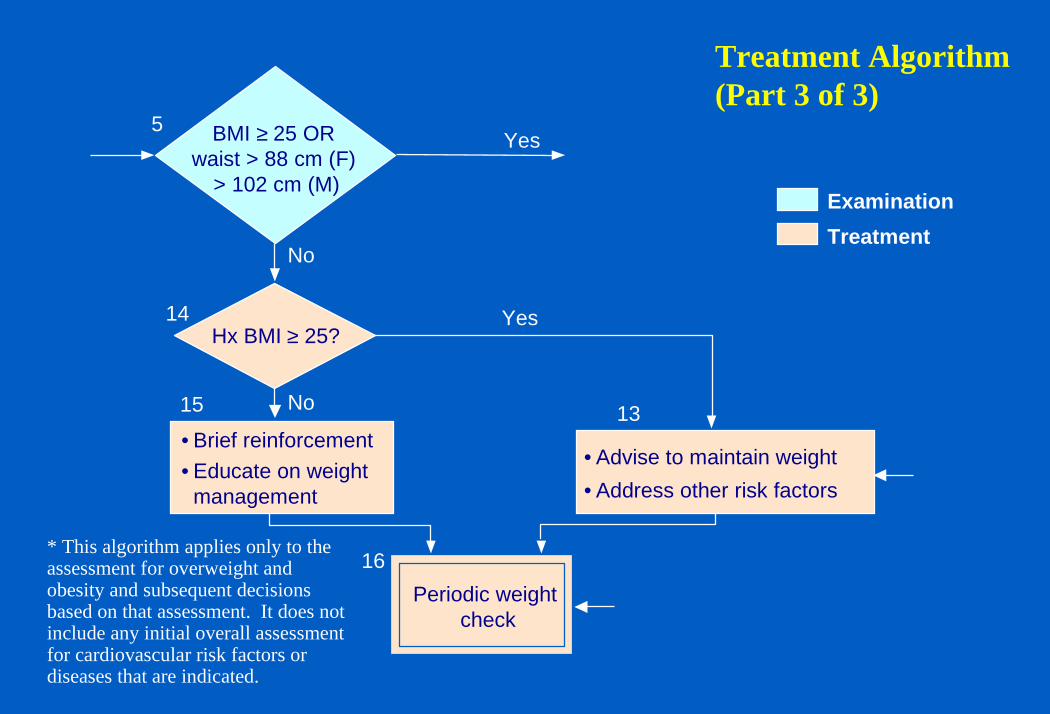
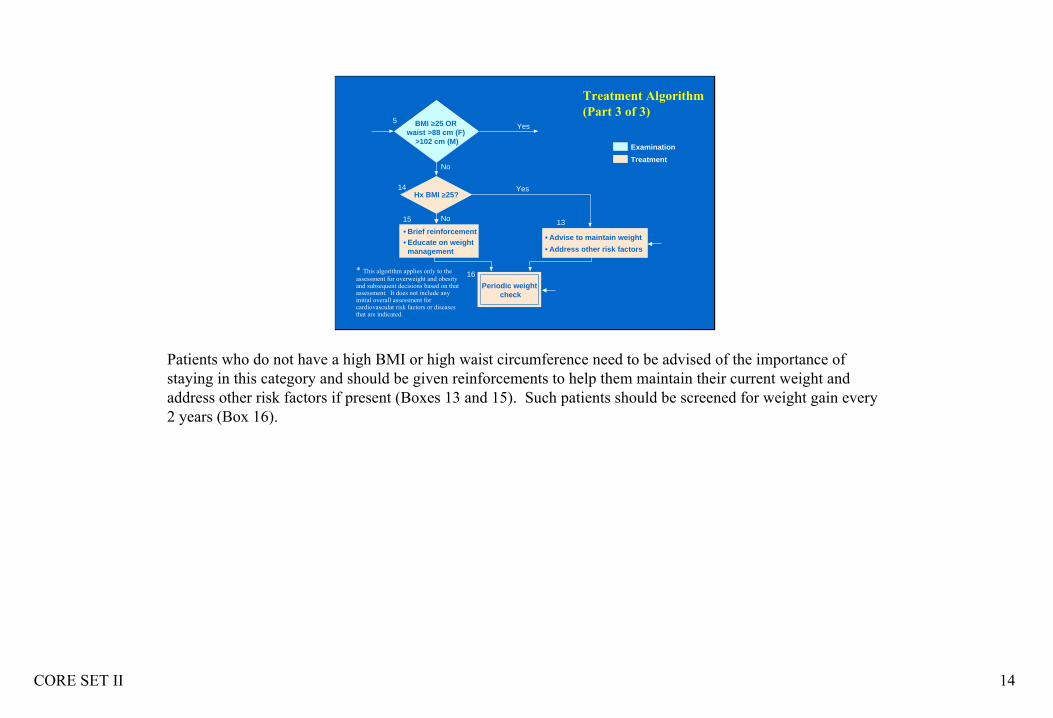
Patients who do not have a high BMI or high waist circumference need to be advised of the importance of staying in this category and should be given reinforcements to help them maintain their current weight and address other risk factors if present (Boxes 13 and 15). Such patients should be screened for weight gain every 2 years (Box 16).