body composition of lean women with polycystic ovary · pdf filewith polycystic ovary syndrome...
TRANSCRIPT

Anthropological Review • Vol. 76 (2), 183–198 (2013)
Body composition of lean women with polycystic ovary syndrome
Lina Zabulienė1,2, Jurgita Urboniene3, Janina Tutkuvienė4
1Clinics of Rheumatology, Traumatology-Orthopaedics and Reconstructive Surgery, Faculty of Medicine, Vilnius University, Lithuania
2Antakalnio out-patient clinic, consultant‘s department, Vilnius, Lithuania 3Infectious Diseases and Tuberculosis Hospital, Vilnius University hospital “Santariskiu
klinikos”, Vilnius, Lithuania 4Department of Anatomy, Histology and Anthropology, Faculty of Medicine, Vilnius
University, Lithuania
AbstrAct: Polycystic ovary syndrome (PCOS) is one of the most frequent endocrine and metabolic disor-ders in reproductive age women, and it is related to changes in body size, shape and composition. Anthro-pometric somatotype is a quantitative description of the individual’s body shape and composition classified as endomorphy, mesomorphy or ectomorphy. Since PCOS somatotype has never previously been studied, here we evaluate body shape and composition phenomena in lean women with polycystic ovary syndrome and assess relationships with metabolic parameters. The study of 20–35 year-old women was carried out at the Department of Anatomy, Histology and Anthropology at Vilnius University. Standard anthropomet-ric instruments and methods were used, and J. Matiegka’s equations calculated skeletal mass, skin and subcutaneous adipose tissue and muscles and internal organs. In addition, Heath – Carter’s somatotypes were computed, and the participants’ glucose, insulin, testosterone, sex hormone-binding globulin and lipid levels were established. We analysed data from 120 women with a mean age of 27.30 ± 3.68 years. Lean women with PCOS had greater skeletal mass by 0.47 kg (p<0.05, Cohen’s d=1.14), greater skin and subcutaneous adipose tissue mass by 2.79 kg (p<0.05, Cohen’s d=6.07) and lower muscle mass by 1.47 kg (p<0.05, Cohen’s d=2.84) compared to control women (p<0.05). The mean PCOS somatotype ratio was 4.96–4.38–3.00 (SD 1.50–1.26–1.11). This classified women with PCOS as mesomorphic endomorphs, in contrast to healthy women who were endomorphic mesomorphs. The PCOS subjects’ skin and subcutane-ous adipose tissue and endomorphy/mesomorphy somatotype positively correlated with insulin levels and the HOMA-IR. It was established that lean women with polycystic ovary syndrome had a mesomorphic endomorph somatotype and higher skin and subcutaneous adipose tissue mass, but less muscle mass than healthy lean women. In addition, skin and subcutaneous adipose tissue positively correlated with insulin level and HOMA-IR in lean PCOS women.
Key words: PCOS, somatotype, adipose tissue
Original Article: Received October 12, 2013; Accepted for publication December 2, 2013DOI: 10.2478/anre-2013-0018 © 2013 Polish Anthropological Society
Lina Zabulienė, Jurgita Urboniene, Janina Tutkuvienė
Body composition of women with PCOS

184 Lina Zabulienė, Jurgita Urboniene, Janina Tutkuvienė
Introduction
Polycystic ovary syndrome (PCOS) is one of the most frequent endocrine and metabolic disorders in reproductive age women with a frequency of 4 to17.8% in over 100 million women globally (Pad-manabhan 2009; March et al. 2010). PCOS is a heterogeneous clinical syn-drome characterised by the presence of hyperandrogenism and/or excess andro-gen in the blood, anovulation, menstrual cycle disturbance and polycystic ovary morphology. PCOS determined by com-plex pathogenic mechanisms is also re-lated to bone mineral density, body size, and shape and compositional changes (Azziz et al. 2009; Allahbadia and Mer-chant 2011).
Current anthropometric indices of adipose tissue amount and accumula-tion site in PCOS women have revealed there is a greater adipose tissue mass in the internal organs, waist and arms of PCOS women than in control sub-jects..A tendency to android fat distri-bution was observed even in lean PCOS women (Gennarelli et al. 2000; Kirchen-gast and Huber 2001; Crosignani et al. 2003; Hashimoto et al. 2003; Snijder et al. 2004; Toscani et al. 2007; Moran and Teede 2009; March et al. 2010 and Pena-forte et al. 2011). However, studies ana-lysing skeletal, muscle and internal or-gan masses in PCOS women is currently lacking.
Anthropometric somatotype is a quantitative description of individual body shape and composition related to height: endomorphy, mesomorphy and ectomorphy. Endomorphy expresses relative body fat, mesomorphy captures muscularity and ectomorphy refers to the body’s leanness. The commonly used differentiation is Heath-Carter’s anthro-
pometric somatotype (Carter and Heath 1990). Somatotype is associated with physical fitness level, a variety of health risk factors and chronic degenerative pathologies (Williams SR et al. 2000; Saitoglu et al. 2007), and it is extremely important in public health studies be-cause of its relationship with cardiovas-cular risk factors (Malina et al. 1997). PCOS Somatotype has never previously been studied.
The aim of this study is to evaluate body shape and composition and assess their relationship with metabolic param-eters in lean women with polycystic ova-ry syndrome.
Materials and Methods
Study population
This cross-sectional study was conduct-ed in 2007–2011 at the Department of Anatomy, Histology and Anthropology (Faculty of Medicine of Vilnius Univer-sity) in cooperation with Outpatient Clinics in Vilnius. The study population was consisted of 20–35 year-old women aged 20–35 residing in Vilnius and its surrounding districts. Written informed consent was obtained from patients prior to the study which was approved by the Lithuanian Bioethics Committee.
All women referred to the outpatient clinics for suspected PCOS because of hirsutism, menstrual cycle disturbance or infertility were offered a place in the study. Inclusion criteria for the study group were: (1) participation consent; (2) women aged 20–35; (3) diagnosis of PCOS determined according to Rot-terdam criteria in: (a) clinical and/or biochemical hyperandrogenism, (b) oli-govulation or anovulation and (c) poly-

Body composition of women with PCOS 185
cystic ovaries defined by ultrasound, af-ter exclusion of adrenal androgen excess, androgen secreting tumours, hyper-prol-actinaemia and thyroid dysfunction (The Rotterdam ESHRE/ASRM-sponsored PCOS consensus workshop group 2004; Azziz et al. 2009). The control group involved healthy women who agreed to take part in the study and their inclusion criteria were: (1) participation consent; (2) women aged 20–35; (3) no evidence of clinical or biochemical androgen ex-cess of any origin; (4) normal regular menstrual cycles, where the presence of normal ovulation was assessed by serum progesterone level on cycle days 21–25 and (5) no first-degree family history of PCOS. Women with type 2 diabetes mel-litus, presence of chronic renal or hepatic diseases, taking contraceptive pills were not enrolled in the study.
In total, 235 women (135 women with PCOS and a 100 control women without hyperandrogenism or menstru-al cycle disturbances) were studied. The data of 38 women were excluded from further analysis: 15 women withdrew consent and 18 women were excluded due to abnormal laboratory tests reveal-ing different other diseases. 197 women composed the final study sample: 116 PCOS women and 81 controls.
Clinical hyperandrogenism was de-fined as the presence of hirsutism in nine body areas by a modified Ferriman-Gall-wey score cut-off point ≥ 6. Biochemical hyperandrogenism was defined as testos-terone serum level ≥ 1.68 nmol/l, dehy-droepiandrosterone sulphate (DHEAS) ≥ 10.42 µmol/l and free androgen index (FAI) ≥ 2.94 (Zabuliene et al 2012).The menstrual cycle was considered impaired when meters; (1) it was shorter than 25 days or longer than 35 days, (2) there were fewer than 9 bleeding episodes per
year and (3) there were at least two con-secutive cycles where serum progester-one level on days 21–25 was lower than 10 nmol/l (Azziz et al. 2009).
Anthropometrics
Standard anthropometric instruments from Siber Hegner and standard methods were employed (Martin and Saller 1959; Knussmann et al. 1988; Anthropometri-ca 2002; Tutkuviene and Jakimaviciene 2004 and Jakimaviciene and Tutkuviene 2004).
The following 16 anthropometric measurements were performed: body mass, height, 4 transverse skeletal meas-urements (widths of elbow, wrist, knee and ankle), 4 body circumferences (cir-cumference of upper arm, forearm, wrist, thigh and calf) and 6 skinfolds (subscap-ular, triceps, biceps, suprailiac, thigh and calf skinfolds). Weight to the nearest 0.1 kg and height to the nearest 0.1 cm were measured in participants wearing light clothing, without shoes, after void-ing and following 10 to 12 hours over-night fast. All participants were weighed on the same Gamma scales (Soehnle, Germany) and the identical spreading and sliding callipers were used for their widths. Circumferences were measured with plastic tape.and skinfolds with the Holtain calliper. All measurements were performed thrice by one investigator and mean values were analysed.
Body mass index (BMI) was calculat-ed as the ratio of weight in kilograms to height squared in meters. The estimated mass of skeleton, skin and subcutaneous adipose tissue, muscles and the internal organs and remainders were calculat-ed according to J. Matiegka’s equations, while the relative and absolute passive mass and absolute active mass were ob-

186 Lina Zabulienė, Jurgita Urboniene, Janina Tutkuvienė
tained using J.V.G.A. Durnin et J. Wom-ersley’s equations (Matiegka 1921 cited in Anthropometrica 2002; Durnin et Womersley 1974 cited in Anthropomet-rica 2002).
Heath-Carter’s somatotypes were computed according to the following equations (Carter JEL 2002); where skinfolds are in mm, widths in mm and height and circumferences in cm:
Endomorphy = – 0.7182 + 0.1451 (X) – 0.00068 (X2) + 0.0000014 (X3), where X = (triceps skinfold + subscapular skinfold + suprailiac skinfold) × (170.18/height).
Mesomorphy = 0.858 × elbows width + 0.601 × knee width + 0.188 × corrected upper arm circumference + 0.161× corrected calf circumference – height ×0.131 + 4.5.
Three different equations were used to calculate ectomorphy according to the height to weight ratio (HWR), calculated by dividing height by the cubed root of the weight: – HWR greater than or equal to 40.75
defined ectomorphy = 0.732 HWR – 28.58;
– HWR less than 40.75 but greater than 38.25 gave ectomorphy = 0.463 HWR – 17.63; HWR equal to or less than 38.25 defined ectomorphy = 0.1.
Laboratory tests
Laboratory tests were performed under standard laboratory procedure in the Medicina Practica laboratory in Vilnius, Lithuania. Venous blood samples were taken thrice between 7 and 9 a.m from each study participant following 10 to 12 hours overnight fasting. These were, (1) during the follicular phase at days 3–6 of spontaneous or progestin-induced bleeding in anovulatory patients, (2) in the middle of the menstrual cycle and (3) on days 21–25. Participants were tested
for fasting glucose, fasting insulin, total testosterone, sex hormone-binding glob-ulin (SHBG), dehydroepiandrosterone sulphate (DHEAS), progesterone, to-tal cholesterol, high density lipoprotein (HDL) cholesterol, low density lipopro-tein (LDL) cholesterol and triglycerides (TG).
Fasting plasma glucose was measured by the glucose oxidase technique (Ro-che Diagnostics GmbH, Cobas Integra 400 plus, Mannheim, Germany). Plas-ma total cholesterol, HDL cholesterol, LDL cholesterol and triglycerides levels were determined by the enzymatic col-orimetric method (Roche Diagnostics GmbH, Cobas Integra 400 plus, Mann-heim, Germany). Insulin was measured by chemiluminiscent immunoassay kits (Abbott Laboratories, Architect 8200, Abbott Park, IL, USA). Total testoster-one, SHBG, DHEAS and progesterone were measured by luminescence immu-noassay (ECLIA) (Roche Diagnostics GmbH, Elecsys 2010; Manheim, Germa-ny). Intra-assay and inter-assay coeffi-cients of variation for the tests were less than 5%.
Free androgen index (FAI) was de-fined according to A. Vermeulen et al.: FAI = (total testosterone (nmol/l) × 100)/ sex hormone-binding globulin (SHBG) (nmo-l/l) (Vermeulen et al. 1999). The glucose tolerance test was carried out according to the methodology suggested by the World Health Organization (WHO) in 2006, with results assessed following WHO and American Diabetes Associ-ation (ADA) guidelines (World Health Organization 2006; ADA 2011; Bartoli et al. 2011). The following indices were cal-culated for insulin resistance evaluation: The HOMA-IR index from the homeosta-sis model of assessment-insulin resist-ance formula HOMA-IR = (insulin (μIU/

Body composition of women with PCOS 187
ml)) × (fasting plasma glucose (mmol/l)) / 22.5) (Matthews et al. 1985) and Quan-titative Insulin Sensitivity Check Index QUICKI = 1/(log(insulin concentration (μIU/ml)) + log(plasma fasting glucose (mmol/l)/0,0555)) (Katz et al. 2000). In-sulin resistance was determined when HOMA-IR was higher than 2.5.
Statistical analysis Statistical analysis was performed by the SPSS version 20 for Windows (SPSS Inc., Chicago, IL) and the Student’s t-test for independent samples was used to com-pare means. Cohen’s d was calculated to evaluate the effect size and Pearson’s correlation coefficient (r) was calculat-ed to establish the relationship between continuous variables. Correlation was
ranked as very weak when r was lower than 0.2, weak when r was from 0.2 to 0.39, moderate when r ranged from 0.4 to 0.69, strong when r was from 0.7 to 0.79 and very strong when r exceeded 0.8. A p value of < 0.05 was considered significant.
Somatotype plotting and analysis was performed using Heath-Carter methods with the special Somatotype – Calcula-tion and Analysis programme (Sweat Technologies, M E R Goulding Software Development).
ResultsWe analysed data from 120 lean women with a mean age of 27.30 ± 3.68 years. The youngest participant was 20 and the oldest was 34. The samples consisted of
Table 1. Clinical, hormonal and biochemical data of studied women (number of patients, mean ± SD)
Variable PCOS n=50 Control n=70 p
Age, years 26.54 ± 3.65 27.84 ± 3.63 0.055
Height, cm 168.31 ± 5.10 166.49 ± 7.06 0.104
Weight, kg 59.75 ± 6.13 58.41 ± 6.51 0.258
BMI, kg/m² 21.10 ± 2.02 21.05 ± 1.65 0.876
Testosterone, nmol/l 1.91 ± 0.75 0.99 ± 0.38 <0.0001
SHBG, nmol/l 62.34 ± 30.17 75.84 ± 22.15 0.009
FAI 4.07 ± 2.85 1.42 ± 0.71 <0.0001
Total cholesterol, mmol/l 4.78 ± 0.89 4.70 ± 0.73 0.591
HDL cholesterol, mmol/l 1.72 ± 0.31 1.85 ± 0.30 0.021
LDL cholesterol, mmol/l 2.67 ± 0.79 2.51 ± 0.70 0.220
TG, mmol/l 0.88 ± 0.40 0.75 ± 0.33 0.047
Glucose, mmol/l 4.94 ± 0.41 4.75 ± 0.48 0.020
Insulin, µU/ml 7.35 ± 4.34 6.20 ± 2.85 0.082
HOMA-IR 1.64 ± 1.05 1.32 ± 0.65 0.056
QUICKI 0.36 ± 0.03 0.37 ± 0.03 0.052
SD – standard deviation, PCOS – women with polycystic ovary syndrome BMI – body mass index, SHBG – sex hormone – binding globulin, FAI – free androgen index, HDL – high density lipoprotein, LDL – low density lipoprotein, TG- triglycerides, HOMA-IR – homeostasis model of assessment-insulin resistance, QUICKI – Quantitative Insulin Sensitivity Check Index.
188 Lina Zabulienė, Jurgita Urboniene, Janina Tutkuvienė
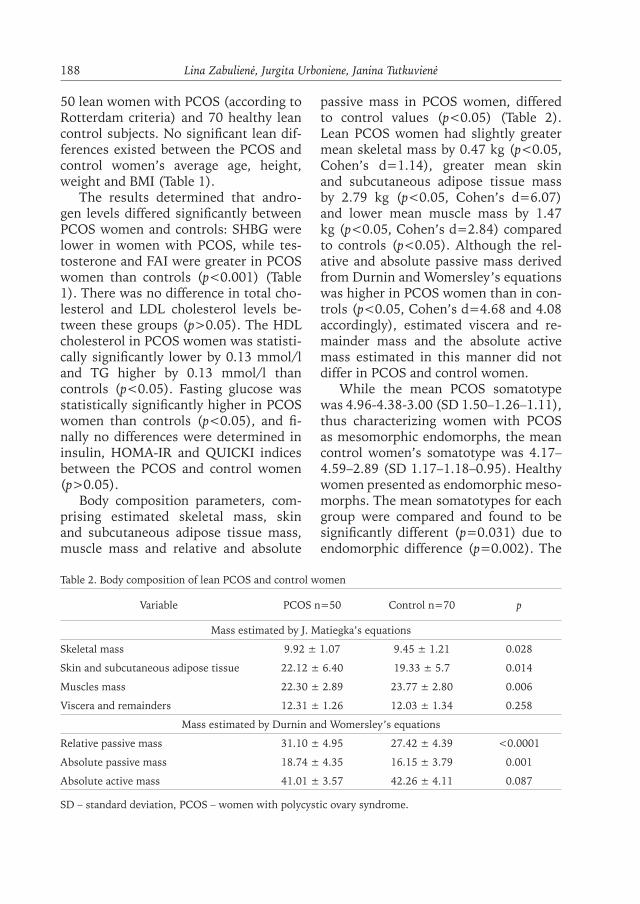
50 lean women with PCOS (according to Rotterdam criteria) and 70 healthy lean control subjects. No significant lean dif-ferences existed between the PCOS and control women’s average age, height, weight and BMI (Table 1).
The results determined that andro-gen levels differed significantly between PCOS women and controls: SHBG were lower in women with PCOS, while tes-tosterone and FAI were greater in PCOS women than controls (p<0.001) (Table 1). There was no difference in total cho-lesterol and LDL cholesterol levels be-tween these groups (p>0.05). The HDL cholesterol in PCOS women was statisti-cally significantly lower by 0.13 mmol/l and TG higher by 0.13 mmol/l than controls (p<0.05). Fasting glucose was statistically significantly higher in PCOS women than controls (p<0.05), and fi-nally no differences were determined in insulin, HOMA-IR and QUICKI indices between the PCOS and control women (p>0.05).
Body composition parameters, com-prising estimated skeletal mass, skin and subcutaneous adipose tissue mass, muscle mass and relative and absolute
passive mass in PCOS women, differed to control values (p<0.05) (Table 2). Lean PCOS women had slightly greater mean skeletal mass by 0.47 kg (p<0.05, Cohen’s d=1.14), greater mean skin and subcutaneous adipose tissue mass by 2.79 kg (p<0.05, Cohen’s d=6.07) and lower mean muscle mass by 1.47 kg (p<0.05, Cohen’s d=2.84) compared to controls (p<0.05). Although the rel-ative and absolute passive mass derived from Durnin and Womersley’s equations was higher in PCOS women than in con-trols (p<0.05, Cohen’s d=4.68 and 4.08 accordingly), estimated viscera and re-mainder mass and the absolute active mass estimated in this manner did not differ in PCOS and control women.
While the mean PCOS somatotype was 4.96-4.38-3.00 (SD 1.50–1.26–1.11), thus characterizing women with PCOS as mesomorphic endomorphs, the mean control women’s somatotype was 4.17–4.59–2.89 (SD 1.17–1.18–0.95). Healthy women presented as endomorphic meso-morphs. The mean somatotypes for each group were compared and found to be significantly different (p=0.031) due to endomorphic difference (p=0.002). The
Table 2. Body composition of lean PCOS and control women
Variable PCOS n=50 Control n=70 p
Mass estimated by J. Matiegka’s equations
Skeletal mass 9.92 ± 1.07 9.45 ± 1.21 0.028
Skin and subcutaneous adipose tissue 22.12 ± 6.40 19.33 ± 5.7 0.014
Muscles mass 22.30 ± 2.89 23.77 ± 2.80 0.006
Viscera and remainders 12.31 ± 1.26 12.03 ± 1.34 0.258
Mass estimated by Durnin and Womersley’s equations
Relative passive mass 31.10 ± 4.95 27.42 ± 4.39 <0.0001
Absolute passive mass 18.74 ± 4.35 16.15 ± 3.79 0.001
Absolute active mass 41.01 ± 3.57 42.26 ± 4.11 0.087
SD – standard deviation, PCOS – women with polycystic ovary syndrome.

Body composition of women with PCOS 189
individual PCOS and controls somato-types are presented graphically in Figure 1 and 2 somatoplots.
Distribution of PCOS and healthy women’s somatotypes are presented in Ta-ble 3. Prevailing PCOS somatotypes were
mesomophic endomorph (31%), mes-omorph-endomorph (17%) and central (13%), while the dominant proportions of the control group were classified as endo-morphic-mesomorph (29%) and balanced mesomorph and central (14% both).
Fig. 1. Somatotype of lean PCOS subjectsO – mean somatotype: 4.96–4.38–3.00
Fig. 2. Somatotype of healthy womenO – mean somatotype: 4.17–4.59–2.89
Table 3. Distribution of PCOS and healthy women’s somatotypes
Somatotype categories PCOS n=50n (%)
Control n=70n (%) p
Endomorph-ectomorph 0 (0) 3 (4%) 0.138
Ectomorphic endomorph 2 (4%) 0 0.092
Balanced endomorph 3 (6%) 3 (4%) 0.671
Mesomorphic endomorph 15 (31%) 8 (11%) 0.011
Mesomorph-endomorph 8 (17%) 8 (11%) 0.468
Endomorphic mesomorph 4 (8%) 20 (29%) 0.006
Balanced mesomorph 2 (4%) 10 (14%) 0.064
Ectomorphic mesomorph 0 0
Mesomorph-ectomorph 2 (4%) 3 (4%) 0.939
Mesomorphic ectomorph 1 (2%) 2 (3%) 0.767
Balanced ectomorph 5 (10%) 3 (4%) 0.216
Endomorphic ectomorph 0 0
Central 6 (13%) 10 (14%) 0.717
PCOS – women with polycystic ovary syndrome.

190 Lina Zabulienė, Jurgita Urboniene, Janina Tutkuvienė
The PCOS body composition param-eters, comprising skin and subcutaneous adipose tissue, viscera and reminders and passive mass and also the endomorphic/mesomorphic somatotypes, positively cor-related with insulin and HOMA-IR (Table
4). Although, ectomorphy was negatively correlated with glucose, insulin and HO-MA-IR, in complete contrast, no control group correlations were established for body composition parameters and glucose and insulin resistance parameters.
Table 4. Correlations between body composition, glucose and insulin resistance parameters
Variable Glucose Insulin HOMA-IR QUICKI
PCOS women n=50
Mass estimated by J. Matiegka’s equations
Skeletal mass 0.14 0.21 0.22 –0.14
Skin and subcutaneous adipose tissue 0.16 0.52** 0.51** –0.49**
Muscles mass 0.20 0.23 0.23 –0.23
Viscera and remainders 0.25 0.48** 0.49** –0.43**
Mass estimated by Durnin and Womersley’s equations
Relative passive mass 0.15 0.43** 0.44** –0.42**
Absolute passive mass 0.23 0.53** 0.53** –0.49**
Absolute active mass 0.16 0.18 0.19 –0.14
Somatotype components
Endomorphy 0.13 0.45** 0.45** –0.45**
Mesomorphy 0.29* 0.41** 0.41** –0.42**
Ectomorphy –0.32* –0.47** –0.48** 0.44**
Controls n=70
Mass estimated by J. Matiegka’s equations
Skeletal mass 0.03 0.11 0.11 –0.10
Skin and subcutaneous adipose tissue 0.04 0.21 0.21 –0.22
Muscles mass –0.00 0.05 0.05 –0.03
Viscera and remainders 0.06 0.10 0.10 –0.11
Mass estimated by Durnin and Womersley’s equations
Relative passive mass –0.06 0.17 0.15 –0.17
Absolute passive mass –0.01 0.15 0.15 –0.16
Absolute active mass 0.11 0.01 0.03 –0.02
Somatotype components
Endomorphy –0.08 0.15 0.12 –0.15
Mesomorphy 0.04 0.07 0.08 –0.07
Ectomorphy –0.02 0.03 0.02 –0.03
PCOS – women with polycystic ovary syndrome, HOMA-IR – homeostasis model of assessment-insulin resistance, QUICKI – Quantitative Insulin Sensitivity Check Index; *p<0.01; **p<0.001.

Body composition of women with PCOS 191
PCOS skin and subcutaneous adipose tissue, passive mass and endomorphic body composition parameters positively correlated with triglycerides (Table 5).
The following weak correlations were determined in the control group: (1) be-tween subcutaneous adipose tissue, pas-sive mass, endomorphy and mesomor-phy and the total cholesterol level and (2) for skeletal mass, subcutaneous ad-
ipose tissue, viscera and reminders and the passive mass endomorphy and LDL cholesterol level.
DiscussionIn recent years, attention has centred on determining body composition in PCOS women with different body mass index, quantity and quality of bone mass and
Table 5. Correlations between body composition and lipids metabolism parameters
Variable Total cholesterolHDL cholesterolLDL cholesterol TG
PCOS women n=50Mass estimated by J. Matiegka’s equations
Skeletal mass 0.03 –0.11 0.03 0.60Skin and subcutaneous adipose tissue 0.06 –0.15 0.06 0.31*Muscles mass –0.11 –0.12 –0.10 0.02Viscera and remainders –0.04 –0.20 –0.02 0.18
Mass estimated by Durnin and Womersley’s equationsRelative passive mass 0.19 –0.11 0.18 0.36**Absolute passive mass 0.10 –0.18 0.10 0.33*Absolute active mass –0.18 –0.13 –0.17 –0.10
Somatotype componentsEndomorphy 0.18 –0.11 0.17 0.38**Mesomorphy 0.10 –0.19 0.15 0.19Ectomorphy –0.07 0.24 –0.11 –0.28
Controls n=70Mass estimated by J. Matiegka’s equations
Skeletal mass 0.15 –0.16 0.24* 0.05Skin and subcutaneous adipose tissue 0.29* –0.14 0.32** 0.19Muscles mass 0.03 –0.10 0.10 –0.10Viscera and remainders 0.21 –0.15 0.27* 0.09
Mass estimated by Durnin and Womersley’s equationsRelative passive mass 0.24* –0.15 0.28* 0.18Absolute passive mass 0.28* –0.18 0.33** 0.16Absolute active mass 0.08 –0.08 0.12 –0.01
Somatotype componentsEndomorphy 0.24* –0.15 0.28* 0.18Mesomorphy 0.26* 0.26 0.23 0.11Ectomorphy –0.28* –0.07 20.21 –0.24*
PCOS – women with polycystic ovary syndrome, HDL – high density lipoprotein cholesterol, LDL – low density lipoprotein cholesterol, TG – triglycerides; *p<0.01; **p<0.001.

192 Lina Zabulienė, Jurgita Urboniene, Janina Tutkuvienė
muscles and adipose tissue (Zborowski et al., 2000; Kirchengast et Huber 2001; Faulds 2003; Puder et al. 2005; To and Wong 2005; Toscani et al. 2007; Barber et al. 2008; Cosar et al. 2008; Moran and Teede 2009; Kassanos et al 2010; March et al. 2010; Manneras-Holm et al. 2011; Villa et al. 2011 and Barber and Franks 2013). Our study presents analytic re-sults of investigations into body com-position and somatotype in lean PCOS women.
PCOS women had similar bone min-eral density (BMD) levels to the control group (To and Wong 2005; Zborowski et al. 2000). Biochemical hyperandro-genism and elevated circulating insu-lin levels, directly through stimulation of osteoblastic activity, or indirectly via its effect on PCOS associated sex hor-mone-binding globulin or insulin-like growth factor binding proteins, have a positive effect on BMD alleviating neg-ative impacts associated with anovula-tion (Zborowski et al. 2000). Our study showed that lean women with PCOS had greater mean skeletal mass than control women. Peripheral quantitative comput-erised tomography established signifi-cantly higher distal-tibial cortical density in lean PCOS than that in lean control women, although trabecular bone densi-ty did not differ (Kassanos et al 2010). Good et al. (1999) reported higher BMD in the left and right arms and left ribs of a lean PCOS group compared to control values. These authors suggested that re-gional differences in PCOS bone mass, and particularly the significant upper skeletal BMD increase, indicates lean mass accretion in the trunk and upper extremities (Good et al. 1999).
Dual energy X-ray absorptiometry results for total body fat in lean PCOS women and healthy controls were dis-
cordant. Although an Austrian study reported that lean women with PCOS had significantly higher total fat mass than controls matched for age, weight and BMI (21.2 kg vs. 14.8 kg, p=0.002) (Kirchengast and Huber 2001), Puder et al. (2005) determined that total fat mass did not differ between PCOS subjects and controls (25.6 kg vs. 25.2 kg, p=0.9). While Carmina et al. examined total, trunk and central abdominal fat quantity by total-body dual energy X-ray absorp-tiometry in 40 lean PCOS women and weight-matched controls (BMI=22.4 kg/m2) and agreed that there was no differ-ence in total fat (Carmina et al. 2007), our study revealed that lean PCOS wom-en had higher skin and subcutaneous adipose tissue and greater relative and absolute passive masses than our lean healthy controls.
Studies examining fat distribution in lean PCOS women gave contradictory results. Topographical studies revealed that the adipose tissue mass in internal organs, waist and arms was greater in PCOS women than in controls. Herein, over two thirds of total adipose tissue accumulated in the upper torso in PCOS women with different weights, and up to 70% PCOS women exhibited male fat distribution patterns (Gennarelli et al. 2000; Kirchengast and Huber 2001; Crosignani et al. 2003; Hashimoto et al. 2003; Snijder et al. 2004; Kirchengast 2005; Li and Lin 2005; Barber et al. 2006; Carmina et al. 2007; Toscani et al. 2007; Moran and Teede 2009; March et al. 2010 and Penaforte et al. 2011).
The following contrasting results were also published; (1) Kirschengast and Hu-bert reported that half their lean PCOS patients had android fat distribution and all lean controls were gynoid (Kirschen-gast 2001), (2) Carmina et al. (2007) re-

Body composition of women with PCOS 193
corded that young normal weight PCOS females with BMI=22.4 kg/m2 had sig-nificantly higher central abdominal fat (451 g vs. 344 g, p<0.01) and higher trunk fat compared to their total fat per-centage (36.6% vs. 32.8%, p<0.01), (3) Yildirim et al. (2003) demonstrated that the mean pre-peritoneal and visceral fat layer determined by ultrasound in non-obese PCOS patients with BMI<25 kg/m² was significantly greater than in controls, (4)Puder et al. (2005) accorded that the trunk to extremity fat ratio was higher in PCOS women (BMI=26.3±5.7 kg/m²) compared to controls (BMI=25.5±4.8 kg/m²) (1.06 vs. 0.79, p=0.007), (5) Yu-cel et al. (2005) showed that fat mass in the trunk and arms and the ratio of trunk fat mass to leg fat mass was significantly higher in non-obese patients with PCOS (p<0.05): (6) A Swedish study reported that lean PCOS women with mean BMI 23±1.5 kg/m² had significantly higher trunk to peripheral fat ratio (Svendsen et al. 2008), (7) Good et al.(1999) found no statistically significant differences in body fat distribution in lean PCOS wom-en and controls; although the former tended to have lower mean body fat per-centages, and (8) most recently, Aydin et al. (2013) documented no differences in fat distribution in lean PCOS women and healthy controls.
In addition to distribution sites, the quality of adipose tissue also differs in healthy and PCOS women. Faulds et al. (2003) showed that subcutaneous fat cells’ lipolytic response to catecho-lamines decreased in young lean PCOS women with 24.8±4.8 kg/m² mean BMI. This increased their abdominal fat cell volume by approximately 25%. De-creased lipolytic activity and increased fat-cell lipid content is known to promote subsequent obesity in PCOS women,
and Manneras-Holm et al. (20011) con-tend that lean PCOS women have larger adipocytes, a lower serum adiponectin level, lower adipose tissue lipoprotein li-pase activity and increased waist-to-hip ratio. These authors reported no further differences in anthropometric variables, abdominal adipose tissue volume or its distribution, and they concluded that adipocyte size, circulating adiponectin and waist circumference were the most important variables associated with in-sulin sensitivity in PCOS women. They further suggested that these factors are more important than biochemical hyper-androgenism in PCOS development and maintenance of insulin resistance.
Studies of lean body mass in PCOS women were also fraught with differ-ent results: (1) Carmina et al.(2009) demonstrated that muscle mass in-creased in PCOS women compared to weight-matched controls (mean BMI of 27.6±5.8 kg/m²). The lean mass ex-pressed as total lean mass divided by height was significantly higher in PCOS women with PCOS than in controls at 275 vs. 256 total g/height cm, p<0.01). (2) Kirschengast and Hubert (2001) re-ported that lean PCOS women had sig-nificantly lower total and upper lean body mass than lean healthy controls at 35.6 kg vs. 38.7 kg, p=0.04 and 20.8 kg vs. 18.7 kg respectively, p=0.03, (3) while, our study showed significant-ly higher muscle mass in lean controls than in lean PCOS women, (4) (Dantas et al. 2013) reported that skeletal mus-cle plays a pivotal role in the peripheral glucose uptake and (5) Schooling et al. (2011) concurred that low muscle mass, especially from adolescence, can increase the risk of diabetes; (6) McGarry (2002) added that triglycerides in the form of ectopic fat mass accumulate in skeletal

194 Lina Zabulienė, Jurgita Urboniene, Janina Tutkuvienė
muscles from insulin resistance. This increases overall weight and adds to the insulin resistance found in 30–50% of normal body weight PCOS women. (7) our study established that insulin and HOMA-IR were higher in PCOS wom-en than in controls; but not significant-ly so. Lean PCOS women showed lower QUICKI than lean controls, but again without significant difference (0.36 vs. 0.32, p=0.052). We also found a moder-ate positive correlation in PCOS women with skin and subcutaneous adipose tis-sue mass, for relative and absolute pas-sive mass with insulin and HOMA-IR (with insulin r=0.52, p<0.0001, with HOMA-IR r=0.51, p<0.0001) and a neg-ative correlation with QUICKI (r=–0.49, p<0.0001); (8) meanwhile, Carmina and colleagues (2007) detected strong correlations between central abdomi-nal fat and insulin and also QUICKI in PCOS women with normal body weight (with insulin r=0.69, p<0.01; QUICKI: r=−0.66, p<0.01) and (9) Aydin and col-leagues (2013) showed that HOMA-IR was positively correlated with total fat percentage, fat mass and trunk fat mass and percentage in lean PCOS women.
Our study results determined that PCOS sufferers had lower HDL choles-terol and higher TG compared to con-trols. We detected weak positive corre-lations for TG with skin, subcutaneous adipose tissue mass and relative and ab-solute passive mass. However, while Yil-drim et al. (2003) found no correlation between subcutaneous fat density and metabolic variables in non-obese PCOS women, they related serum TG level to visceral fat and pre-peritoneal fat thick-ness (Yildrim et al 2003).
Human body size, structure, propor-tions and composition change signifi-cantly during our life span. Heath-Cart-
er’s (1990) somatotyping classifies population in terms of fatness (endo-morphy), muscularity (mesomorphy) and linearity (ectomorphy). Kalichman L (2006) reported the following age re-lated somatotype changes prevalent in women; (1) mesomorphy continues to increase until the 5th decade, (2) ecto-morphy tends to decrease until the 5th decade, (3) endomorphy increases until the 6th decade and decreases thereafter (4) mean endomorphy values decrease during the 7th and 8th decades, (5) 18–30 years old women with mean BMI of 23.2 kg/m² had an endomorphy-meso-morphy-ectomorphy somatotype ratio of 3.78–4.59–2.15 (Kalichman L 2006), and,(6) Sterkowicz-Przybycien and Al-mansba (2011) established that healthy Polish women had a balanced endo-morph ratio at 4.22–2.99–3.08.
Few studies have related somatotype and physical phenomena in patients with different diseases. While type 2 diabetes mellitus sufferers were generally classi-fied as overweight and obese with central body fat distribution pattern, diabetic women with a mean somatotype ratio of 8.6–6.4–0.2 had significantly higher en-domorphic values than controls (p<0.05) (Buffa et al. 2007a). In contrast, Bulgar-ian diabetic females were predominantly mesomorphic, and Baltadjiev AG (2012) considers that this somatotype group possesses advantages in diabetic risk and prognosis (Baltadjiev AG 2012). Women Alzheimer patients with mean somato-type ratio of 7.0–5.3–0.7 were less mes-omorphic and more ectomorphic than the controls who registered 7.7–6.3–0.4. These differences were significant with mesomorphy p=0.000 and ectomorphy p=0.012 (Buffa et al. 2007).
Our study identified a PCOS soma-totype ratio of 4.96-4.38–3.00 compared

Body composition of women with PCOS 195
to 4.17–4.59–2.89 in controls, and our somatotype means were significantly different at p=0.031 due to endomor-phic difference. Here, almost one third of PCOS women were mesomorphic en-domorphs while 30% of healthy controls were endomorphic mesomorphs.
Koleva and colleagues (2002) showed that mesomorphic endomorphs most frequently suffered from digestive sys-tem diseases (40.6%, p<0.05), neuroses (30.1%, p<0.05), and lumbosacral rad-iculitis (15.4%), while those with the highest endomorphy and mesomorphy and the lowest ectomorphy frequently experienced arterial hypertension and liv-er disease. These authors concluded that dominant mesomorphy and marked endo-morphy increase the risk of certain diseas-es, and they therefore stress the extreme necessity for body weight control.
ConclusionLean women with polycystic ovary syndrome had a mesomorphic endo-morph-somatotype and higher skin and subcutaneous adipose tissue mass, but less muscle mass than lean healthy wom-en. Here, skin and subcutaneous adipose tissue positively correlated with insulin and HOMA-IR in our lean PCOS women.
Author contribution
LZ data collection, analysis and article writing; JU data collection, analysis and article writing, JT main scientific super-visor of the study and reviewer of the article.
Conflict of interest
The authors declare there is no conflict of interests
Corresponding author
Lina Zabulienė, Antakalnio out-patient clinic, Antakalnio 59, Vilnius LT-10207e-mail address: [email protected]
ReferencesAllahbadia GN. Merchant R. 2011. Polycys-
tic ovary syndrome and impact on health. Middle East Fertility Jourmal 16:19–37.
American Diabetes Association (ADA). Standards of medical care in diabetes – 2009. Diabetes Care 2011; 34(Suppl 1): S11–61.
Anthropometrica: a textbook of body meas-urement for sports and health courses. 2002. Norton K, Olds T, editors. Sidney: UNSW Press books.
Aydin K, Cinar N, Aksoy DY, Bozdag G, Yildiz BO. 2013. Body composition in lean wom-en with polycystic ovary syndrome: effect of ethinyl estradiol and drospirenone com-bination. Contraception 87(3):358–62.
Azziz R, Carmina E, Dewailly D, Diaman-ti-Kandarakis E, Escobar-Morreale HF, Futterweit W et al. 2009. The Androgen Excess and PCOS Society criteria for the polycystic ovary syndrome: the complete task force report. Fertil Steril 91(2):456–88.
Baltadjiev AG. 2012. Somatotype characteris-tics of male patients with type 2 diabetes mellitus. Folia Med (Plovdiv) 54(2):40–5.
Barber TM, Franks S. 2013. Adipocyte biolo-gy in polycystic ovary syndrome. Mol Cell Endocrinol 373(1-2):68–76.
Barber TM, Golding SJ, Alvey C, Wass JA, Karpe F, Franks S et al. 2008. Global ad-iposity rather than abnormal regional fat distribution characterizes women with polycystic ovary syndrome. J Clin Endo-crinol Metab 93(3):999–1004.
Bartoli E, Fra GP, Carnevale Schianca GP. 2011. The oral glucose tolerance test (OGTT) revisited. Eur J Intern Med 22(1):8–12.
Buffa R, Floris G, Putzu PF, Carboni L, Marini E. 2007a. Somatotype in elderly type 2 dia-betes patients. Coll Antropol 31(3):733–7.

196 Lina Zabulienė, Jurgita Urboniene, Janina Tutkuvienė
Buffa R, Lodde M, Floris G, Zaru C, Putzu PF, Marini E. 2007b. Somatotype in Alzheim-er’s disease. Gerontology 53(4):200–4.
Carmina E, Bucchieri S, Esposito A, Del Puente A, Mansueto P, Orio F et al. 2007. Abdominal fat quantity and distribution in women with polycystic ovary syn-drome and extent of its relation to insu-lin resistance. J Clin Endocrinol Metab 92(7):2500–5.
Carmina E, Guastella E, Longo RA, Rini GB, Lobo RA. 2009. Correlates of increased lean muscle mass in women with poly-cystic ovary syndrome. Eur J Endocrinol 161(4):583–9.
Carter JEL. 2002. The Heath-Carter antro-pometric somatotype. [pdf] Available at: http://www.somatotype.org/Heath-Cart-erManual.pdf [Accessed 9 Sep 2013].
Cosar E, Ucok K, Akgun L, Koken G, Sahin FK, Arioz DT et al. 2008. Body fat com-position and distribution in women with polycystic ovary syndrome. Gynecol En-docrinol 24(8):428–32.
Crosignani PG, Colombo M, Vegetti W, Somigliana E, Gessati A, Ragni G. 2003. Overweight and obese anovulatory pa-tients with polycystic ovaries: parallel improvements in anthropometric in-dices, ovarian physiology and fertili-ty rate induced by diet. Hum Reprod 18(9):1928–32.
Dantas WS, Gualano B, Rocha MP, Barcellos CR, dos Reis Vieira Yance V, Marcondes JA. 2013. Metabolic disturbance in PCOS: clinical and molecular effects on skeletal muscle tissue. ScientificWorld Journal (in press).
Faulds G, Ryden M, Ek I, Wahrenberg H, Arner P. 2003. Mechanisms behind lipo-lytic catecholamine resistance of subcu-taneous fat cells in the polycystic ovar-ian syndrome. J Clin Endocrinol Metab 88(5):2269–73.
Gennarelli G, Holte J, Berglund L, Berne C, Massobrio M, Lithell H. 2000. Predic-tion models for insulin resistance in the polycystic ovary syndrome. Hum Reprod 15(10):2098–102.
Good C, Tulchinsky M, Mauger D, Demers LM, Legro RS. 1999. Bone mineral den-sity and body composition in lean wom-en with polycystic ovary syndrome. Fertil Steril. 72(1):21–5.
Hashimoto DM, Schmid J, Martins FM, Fon-seca AM, Andrade LH, Kirchengast S. 2003. The impact of the weight status on subjective symptomatology of the Polycys-tic Ovary Syndrome: a cross-cultural com-parison between Brazilian and Austrian women. Anthropol Anz 61(3):297–310.
Jakimavičienė EM, Tutkuvienė J. 2004. Antro-pometriniai ir kiti kūno sudėties nustaty-mo metodai. (Antropomethry and other methods for assessment of body com-position.) Medicinos teorija ir praktika 2(38):138–43
Kalichman L, Kobyliansky E. 2006. Sex- and age-related variations of the somato-type in a Chuvasha population. Homo 57(2):151–62.
Kassanos D, Trakakis E, Baltas CS, Papakon-stantinou O, Simeonidis G, Salamalekis G, et al. 2010. Augmentation of cortical bone mineral density in women with poly-cystic ovary syndrome: a peripheral quan-titative computed tomography (pQCT) study. Hum Reprod 25:2107–14.
Katz A, Nambi SS, Mather K, Baron AD, Foll-mann DA, Sullivan G, et al. 2000. Quan-titative insulin sensitivity check index: a simple, accurate method for assessing insulin sensitivity in humans. J Clin En-docrinol Metab 8:2402–10.
Kirchengast S, Huber J. 2001. Body composi-tion characteristics and body fat distribu-tion in lean women with polycystic ovary syndrome. Hum Reprod 16(6):1255–60.
Knussmann R, Schwidetzky I, Jurgens HW, Ziegelmayer G. Antropologie. 1 Teil. 1988. Stuttgart; Gustav Fischer Verlag.
Koleva M, Nacheva A, Boev M. 2002. Somato-type and disease prevalence in adults. Rev Environ Health 17(1):65–84.
Malina RM, Katzmarzyk PT, Song TMK, The-riault G, Bouchard C. 1997. Somatotype and cardiovascular risk factors in healthy adults. Am J Hum Biol 9:11–1.

Body composition of women with PCOS 197
Manneras-Holm L, Leonhardt H, Kullberg J, Jennische E, Oden A, Holm G et al. 2011. Adipose tissue has aberrant morpholo-gy and function in PCOS: enlarged adi-pocytes and low serum adiponectin, but not circulating sex steroids, are strongly associated with insulin resistance. J Clin Endocrinol Metab 96(2):E304–11.
March WA, Moore VM, Willson KJ, Phillips DI, Norman RJ, Davies MJ. 2010. The prevalence of polycystic ovary syndrome in a community sample assessed under contrasting diagnostic criteria. Hum Re-prod 25(2):544–51.
Martin R, Saller K. Lehrbuch Der Anthropol-ogie. Band II. 1959. Stuttgart: Gustav Fis-cher Verlag; p. 971–6.
Matthews DR, Hosker JP, Rudenski AS, Nay-lor BA, Treacher DF, Turner RC. 1985. Homeostasis model assessment: insulin resistance and β – cell function from fast-ing plasma glucose and insulin concentra-tions in man. Diabetologia 28:412–9.
McGarry JD. 2002. Banting lecture 2001: dysregulation of fatty acid metabolism in the etiology of type 2 diabetes. Diabetes 51(1):7–18.
Moran L, Teede H. 2009. Metabolic features of the reproductive phenotypes of poly-cystic ovary syndrome. Hum Reprod Up-date 15(4):477–88.
Padmanabhan V. 2009. Polycystic ovary syn-drome – “A riddle wrapped in a mystery inside an enigma”. J Clin Endocrinol Me-tab 94(6):1883–5.
Penaforte FR, Japur CC, Diez-Garcia RW, Chi-arello PG. 2011. Upper trunk fat assess-ment and its relationship with metabolic and biochemical variables and body fat in polycystic ovary syndrome. J Hum Nutr Diet 24(1):39–46.
Puder JJ, Varga S, Kraenzlin M, De Geyter C, Keller U, Muller B. 2005. Central Fat Ex-cess in Polycystic Ovary Syndrome: Rela-tion to Low-Grade Inflammation and In-sulin Resistance. J Clin Endocrinol Metab 90(11):6014–21.
Saitoglu M, Ardicoglu O, Ozgocmen S, Kamanli A, Kaya A. 2007. Osteoporosis
risk factors and association with somato-types in males. Arch Med Res 38(7):746–51.
Schooling CM, Jiang C, Zhang W, Lam TH, Cheng KK, Leung GM. 2011. Adoles-cent build and diabetes: the Guangzhou Biobank Cohort Study. Ann Epidemiol 21(1):61–6.
Snijder MB, Dekker JM, Visser M, Bouter LM, Stehouwer CD, Yudkin JS, et al. 2004. Trunk fat and leg fat have independent and opposite associations with fasting and postload glucose levels: the Hoorn study. Diabetes Care 27(2):372–7.
Sterkowicz-Przybycien K, Almansba R. 2011. Sexual dimorphism of anthropometrical measurements in judoists vs. untrained subject. Sci Sports 26:316-23.
Sterkowicz-Przybycien K. 2009. Body compo-sition and somatotype of the elite of Polish fencers. St Coll Antropol 33(3):765–72.
Svendsen PF, Nilas L, Norgaard K, Jensen JE, Madsbad S. 2008. Obesity, body com-position and metabolic disturbances in polycystic ovary syndrome. Hum Reprod 23(9):2113–21.
The Rotterdam ESHRE/ASRM-sponsored PCOS consensus workshop group. 2004. Revised 2003 consensus on diagnostic cri-teria and long-term health risks related to polycystic ovary syndrome (PCOS). Hum Reprod 19:41–7.
To M, Wong MA. 2005. Comparison of bone mineral density in oligomenorrhoeic ado-lescents with polycystic ovaries and normal ovaries. Gynecol Endocrinol 20:237–42.
Toscani M, Migliavacca R, Sisson de Castro JA, Spritzer PM. 2007. Estimation of trun-cal adiposity using waist circumference or the sum of trunk skinfolds: a pilot study for insulin resistance screening in hirsute patients with or without polycystic ovary syndrome. Metabolism 56(7):992–7.
Tutkuvienė J, Jakimavičienė EM. 2004. Kūno sudėjimo rodikliai ir jų sąsajos su bendra sveikatos būkle. (Indices of body frame and their connections with general health status.) Medicinos teorija ir praktika 1(37):59–63.

198 Lina Zabulienė, Jurgita Urboniene, Janina Tutkuvienė
Vermeulen A, Verdonck L, Kaufman JM. 1999. A critical evaluation of simple methods for the estimation of free testosterone in serum. J Clin Endocrinol Metab 84:3666–72.
Villa J, Pratley RE. 2011. Adipose tissue dys-function in polycystic ovary syndrome. Curr Diab Rep 11(3):179–84.
Williams SR, Goodfellow J, Davies B, Bell W, McDowell I, Jones E. 2000. Somatotype and angiographically determined athero-sclerotic coronary artery disease in men. Am J Hum Biol 12(1):128–38.
World Health Organization: Definition and Diagnosis of Diabetes Mellitus and in-termediate hyperglycaemia: Report of a WHO/IDF Consultation. 2006. Geneva, World Health Org.
Yildirim B, Sabir N, Kaleli B. 2003. Relation of intra-abdominal fat distribution to met-abolic disorders in nonobese patients with
polycystic ovary syndrome. Fertil Steril 79:1358–64.
Yucel A, Noyan V, Sagsoz N. 2006. The as-sociation of serum androgens and insulin resistance with fat distribution in polycys-tic ovary syndrome. Eur J Obstet Gynecol Reprod Biol 126(1):81–6.
Zabulienė L, Kučinskienė ZA, Jakimavičienė EM, Drąsutienė G, Tutkuvienė J. 2012. Policistinių kiaušidžių sindromu ser-gančių moterų hiperandrogenizmo matai ir jų kritinės reikšmės. (Indices and cut-off points for hyperandrogenism in wom-an with polycystic ovary syndrome.) Lab-oratorinė medicina 14–1(5348):8–17.
Zborowski J, Cauley J, Talbott E, Guzick D, Winters J. 2000. Bone mineral density, androgens, and the polycystic ovary: the complex and controversial issue of andro-genic influence on female bone. J Clin En-docrinol Metab 85:3496–506.