bodily attractiveness and egalitarianism are negatively ...people.brunel.ac.uk/~systmep/price et al...
TRANSCRIPT

Evolutionary Psychology
www.epjournal.net – 2015. 13(1): 140-166
¯¯¯¯¯¯¯¯¯¯¯¯¯¯¯¯¯¯¯¯¯¯¯¯¯¯¯¯
Original Article
Bodily Attractiveness and Egalitarianism are Negatively Related in Males
Michael E. Price, Department of Psychology, Brunel University, London, UK. Email:
[email protected] (Corresponding author).
Stuart Brown, Department of Psychology, Brunel University, London, UK.
Amber Dukes, Department of Psychology, Brunel University, London, UK.
Jinsheng Kang, School of Engineering and Design, Brunel University, London, UK.
Abstract: Ancestrally, relatively attractive individuals and relatively formidable males may
have had reduced incentives to be egalitarian (i.e., to act in accordance with norms
promoting social equality). If selection calibrated one’s egalitarianism to one’s
attractiveness/formidability, then such people may exhibit reduced egalitarianism
(“observed egalitarianism”) and be perceived by others as less egalitarian (“perceived
egalitarianism”) in modern environments. To investigate, we created 3D body models of
125 participants to use both as a source of anthropometric measurements and as stimuli to
obtain ratings of bodily attractiveness and perceived egalitarianism. We also measured
observed egalitarianism (via an economic “dictator” game) and indices of political
egalitarianism (preference for socialism over capitalism) and “equity sensitivity.” Results
indicated higher egalitarianism levels in women than in men, and moderate-to-strong
negative relationships between (a) attractiveness and observed egalitarianism among men,
(b) attractiveness and perceived egalitarianism among both sexes, and (c) formidability and
perceived egalitarianism among men. We did not find support for two previously-reported
findings: that observed egalitarianism and formidability are negatively related in men, and
that wealth and formidability interact to explain variance in male egalitarianism. However,
this lack of support may have been due to differences in variable measurement between our
study and previous studies.
Keywords: physical attractiveness, egalitarianism, formidability, altruism, socioeconomic
status
¯¯¯¯¯¯¯¯¯¯¯¯¯¯¯¯¯¯¯¯¯¯¯¯¯¯¯¯¯¯¯¯¯¯¯¯¯¯¯¯¯¯¯¯¯¯¯¯¯¯¯¯¯¯¯¯¯¯¯¯¯¯¯¯¯¯¯¯¯¯¯¯¯¯¯¯¯¯¯¯¯¯¯¯¯¯¯¯

Attractiveness and egalitarianism
Evolutionary Psychology – ISSN 1474-7049 – Volume 13(1). 2015. -141-
Introduction
In human ancestral environments, physically attractive and/or formidable
individuals would have had an enhanced ability to benefit and/or harm others, and thus
would have had increased bargaining power in social interactions (Lukaszewski, 2013;
Sell, Tooby, and Cosmides, 2009). In the case of attractiveness, enhanced bargaining power
is related to attractive people being perceived as more valuable social associates (Langlois
et al., 2000). Attractiveness is socially desirable presumably because traits perceived as
attractive are signals of high genotypic and phenotypic quality; e.g., of health and physical
fitness, developmental stability, and (in females) fertility (Grammer, Fink, Møller, and
Thornhill, 2003; Roney, 2009; Sugiyama, 2005). Enhanced bargaining power associated
with formidability (e.g., strength, muscularity) is rooted in the power both to inflict harm
via enhanced fighting ability and to confer benefits via enhanced ability to, for example,
offer protection or work effort (Price, Dunn, Hopkins, and Kang, 2012; Sell et al., 2009;
Snyder et al., 2011). Note that some traits may serve as cues to both attractiveness and
formidability (e.g., traits indicating good health).
The increased bargaining power of attractive/formidable individuals would have
made them relatively likely to win social competitions, and to thus benefit from the unequal
distributions of status and resources that would have resulted from these competitions.
Attractive/formidable individuals would have therefore tended to be advantaged by social
norms that promoted inequality, as well as disadvantaged by norms that enforced equality
(which would have obliged them to cede status and resources to less attractive/formidable
individuals). By the same token, less attractive/formidable individuals would have been
more advantaged by pro-equality norms and more disadvantaged by pro-inequality norms.1
If relatively attractive/formidable people were disadvantaged ancestrally by
egalitarian norms, then selection may have favored psychological mechanisms that
calibrated one’s “egalitarianism”—that is, one’s support for norms promoting equality, and
aversion to norms promoting competition and inequality—to one’s own
attractiveness/formidability. Therefore, relatively attractive/formidable people may exhibit
reduced egalitarianism in modern environments (Price, Kang, Dunn, and Hopkins, 2011)—
even in modern environments in which the relationship between
attractiveness/formidability and social bargaining power is weaker than it probably was
ancestrally. For example, although physical strength was likely a relatively important
aspect of winning status competitions ancestrally, it is probably less important in this
regard in many modern industrialized environments. Nevertheless, we may still reasonably
predict a negative strength-egalitarianism relationship in these environments, because
egalitarianism may be calibrated more to long-standing ancestral conditions than to
recently-arising modern ones. Importantly, because men are much more specialized than
women for fighting and other tasks requiring physical strength (e.g., compared to women,
1 Note that we are focusing specifically on the preference for equality rather than for any other kind of
distributive justice. The organizational behavior literature commonly distinguishes between equality (all
group members receiving the same reward, regardless of work contribution) and equity (members receive
more if they contributed more) (Greenberg and Colquitt, 2005), but we did not test predictions related to the
preference for equity. Although we did utilize a construct called “equity sensitivity,” this construct does not
measure the kind of equity described above (i.e., greater rewards for higher contributors).
Attractiveness and egalitarianism
Evolutionary Psychology – ISSN 1474-7049 – Volume 13(1). 2015. -142-
men have about 75% more arm muscle mass and 90% higher upper body strength [Lassek
and Gaulin, 2009]), formidability is expected to relate to bargaining power in men much
more than in women (Lukaszewski, 2013; Sell et al., 2009). Further, because success in
ancestral status/resource competition was probably more important to male fitness than
female fitness (Trivers, 1972), men probably had more to gain from calibrating their
attitudes about resource distribution not just to their own formidability but to any aspect of
their intrasexual competitive ability, including their attractiveness. Therefore, the negative
attractiveness-egalitarianism relationship is expected to be stronger among men than
women.
In accordance with the above expectations, in previous studies, negative
formidability-egalitarianism relationships have been found among men only, and negative
attractiveness-egalitarianism relationships have been demonstrated more consistently
among men than among women. These studies suggest that men with more formidable and
attractive upper bodies exhibit reduced egalitarianism (Price et al., 2011) on measures such
as social dominance orientation (Pratto, Sidanius, Stallworth, and Malle, 1994) and social
value orientation (Van Lange, Otten, De Bruin, and Joireman, 1997), and that stronger men
perceive themselves as more entitled to special treatment (Sell et al., 2009). Studies also
suggest that men who possess traits that are judged as more attractive by others tend to be
less generous in economic games (Sanchez-Pages and Turiegano, 2010; Takahashi,
Yamagishi, Tanida, Kiyonari, and Kanazawa, 2006; Zaatari and Trivers, 2007). Among
women, some studies suggest that egalitarianism is negatively related to self-assessed
attractiveness (Price et al., 2011; Sell et al., 2009), but unrelated to attractiveness as
assessed anthropometrically or by other people (Price et al., 2011; Takahashi et al., 2006).
One study (Holtzman, Augustine and Senne, 2011) reports that among both sexes,
bodily/facial bilateral symmetry (an index of attractiveness and biological quality) relates
negatively to prosocial personality traits, including some related to egalitarianism (e.g.,
fairness, empathy).2
The relatively less reliable evidence for an attractiveness-egalitarianism relationship
in women may suggest, as noted, that women are less likely than men to base their
egalitarianism on their own intrasexual competitive ability. Ancestral women may have
instead used egalitarianism more to solve other kinds of adaptive problems, including
problems related to motherhood and social-network building that require empathy as a
solution (Baron-Cohen, 2008). The greater utility of egalitarianism in these contexts for
women may help explain why, in many social situations, women tend to score higher than
men on measures of egalitarianism and empathy (Croson and Gneezy, 2009; Inness,
Desmarais, and Day, 2004).
Hypotheses. We investigated whether attractiveness and formidability were related
to sharing behavior in an economic “dictator” game, to scores on an “equity sensitivity”
index, and to political egalitarianism (i.e., preference for a relatively redistributive political
2 Note also that “cooperativeness” has multiple meanings, and that attractive people may be higher in some
forms of cooperativeness. For example, in a study involving a trust game, in which players cooperated by
trusting other players to be generous with them, men and women who were higher in other-assessed
attractiveness, and whose attractiveness could be viewed by other players, were more trusting (Smith et al.,
2009). The study’s authors suggest that this increased trust may be rational in the sense that attractive people
do generally receive more generous treatment in economic games.

Attractiveness and egalitarianism
Evolutionary Psychology – ISSN 1474-7049 – Volume 13(1). 2015. -143-
system). Based on the above theoretical considerations, we predicted that lower
egalitarianism on these measures would be associated with higher formidability among
men and higher attractiveness among both sexes (but especially among men), and that
women would score higher than men in overall egalitarianism. We also predicted that
relatively formidable men and relatively attractive people would not only score lower on
egalitarianism, but would also be perceived by raters as being relatively low in
egalitarianism; negative relationships between attractiveness/formidability and perceived
egalitarianism would imply that in the social experience of raters, people who are more
attractive/formidable tend to behave in a less egalitarian manner. Finally, we attempted to
find support for two other previous findings about wealth and egalitarianism: that
socioeconomic status and egalitarianism (or related forms of prosociality) are negatively
correlated (Kunovich and Slomczynski, 2007; Piff, Kraus, Côté, Cheng, and Keltner, 2010;
Piff, Stancato, Côté, Mendoza-Denton, and Keltner, 2012; Ritzman and Tomaskovic-
Devey, 1992), and that egalitarianism (and specifically, support for economic
redistribution) correlates negatively with strength among higher-income men, and
positively with strength among lower-income men (Petersen, Sznycer, Sell, Cosmides, and
Tooby, 2013).
Materials and Methods
Participants
Participants (63 men, 62 women, Mage = 21.63, SD = 4.87) were mostly British
University students who participated in exchange for participation pool credit, a copy of
their 3D body scan, and dictator game proceeds. The study was approved by the Research
Ethics Committee of the Brunel University School of Social Sciences.
Anthropometric measures of attractiveness and formidability
We used an NX-12 3D body scanner ([TC]2, 2010) to measure anthropometric
predictors of bodily attractiveness and formidability. This scanner uses white-light to model
the body in 3D; it has a point accuracy of < 1 mm and circumferential accuracy of < 3 mm
([TC]2, 2010). Our body-scanning procedure was similar to Price et al. (2011, 2012).
Before being scanned, participants changed into standardized, scanner-appropriate clothing
(briefs and, for women, a sports bra as well); while being scanned, they stood erect in a
standardized pose, without flexing muscles, with arms straightened and held slightly away
from the sides of the body. Two scans were obtained from each participant, from which
measurements were extracted by the NX12 software; this software is programmed to take a
wide variety of bodily measurements, and users select which specific measurements (e.g.,
hips at widest circumference) they wish to record. Each trait’s two measurements were
used to assess repeatabilities, before being averaged. Repeatabilities (intraclass correlation
coefficients) ranged from .96 to .998.
For women, there were two anthropometric attractiveness predictors. The first was
waist-to-hip ratio (narrowest circumference between the lower rib cage and upper pelvis,
divided by widest hip circumference). The second was body size relative to height,
assessed as volume-height index (body volume excluding the head in liters, divided by
squared height from chin to the bottom of the feet in meters [Fan, Liu, Wu, and Dai, 2004;
Price, Pound, Dunn, Hopkins, and Kang, 2013]; this measure is similar to body mass

Attractiveness and egalitarianism
Evolutionary Psychology – ISSN 1474-7049 – Volume 13(1). 2015. -144-
index). Measures of waist-to-hip ratio and body size relative to height are regarded by
many attractiveness researchers to be important predictors of female bodily attractiveness
(Fan et al., 2004; Furnham, Swami, and Shaw, 2006; Price et al., 2013; Singh, 1993, 2002;
Tovée, Maisey, Emery, and Cornelissen, 1999; Tovée, Reinhardt, Emery, and Cornelissen,
1998). For men, the anthropometric attractiveness predictor was waist-to-chest ratio
(narrowest circumference between the lower rib cage and upper pelvis, divided by widest
chest circumference). Several studies suggest that measures of torso “v-shapedness,” in
particular waist-to-chest ratio, are excellent predictors of male bodily attractiveness (Coy,
Green and Price, 2014; Fan, Dai, Liu, and Wu, 2005; Horvath, 1979; Maisey, Vale,
Cornelissen, and Tovée, 1999; Price et al., 2013; Swami and Tovée, 2005; Swami et al.,
2007). Our anthropometric measure of male formidability was upper body size: the
summed male z-scores of mean bicep circumference, horizontal shoulder circumference,
and chest circumference, with all circumferences measured at the widest point (this same
method of measuring upper body size was used in Price et al. [2011, 2012]).
All of our anthropometric variables were intended, on theoretical bases, to be in
some way sex-specific: waist-to-hip ratio and volume-height index were intended as
measures of female attractiveness, waist-to-chest ratio was intended as a measure of male
attractiveness, and upper body size was expected to be a more relevant predictor for men
than for women. However, because most of the bodily traits involved in these variables
were measured in the same way for men and women, most of these variables could be
analyzed among either men or women. The exceptions were variables involving chest
circumference (waist-to-chest ratio and upper body size), as there is no female equivalent to
the male chest measurement that would be similarly meaningful theoretically (i.e., female
chest [bust] size could not be construed as a measure of muscularity). Therefore, female
waist-to-chest ratio measurements were not included in the below analyses, and female
upper body size measurements omitted chest circumference and were based only on
summed z-scores of mean bicep circumference and horizontal shoulder circumference.
Grip strength
We measured grip strength—a useful indicator of general upper body strength (Sell
et al., 2010)—using a digital hand dynamometer (Saehan Corporation: Yangdeok-Dong,
Korea). Participants were told to squeeze the dynamometer as hard as they could with their
favored hand. Two readings of grip strength per participant were recorded and averaged;
repeatabilities were high (intraclass correlation coefficient = .90).
Rated attractiveness
A video of participant 3D body scans was created so that they could be rated for
attractiveness. Using Geomagic software, body model heads were removed and their skin
was colored grey to remove information unrelated to bodily shape. Using 3DS Max and
Windows Movie Maker software, two videos were created for each sex; each video
presented models in a different random order to control for order effects. Videos displayed
all models of each sex for eight seconds each, rotating in 360 degrees so that overall body
shape could be evaluated (see Figure 1 for sample video frames). Models were rated by 10
opposite-sex raters on a scale of 1 (“Unattractive”) to 7 (“Attractive”); inter-rater
agreement was high (Cronbach’s α: .88 for male raters, .91 for female raters). The
attractiveness rating instructions are presented in Appendix A.

Attractiveness and egalitarianism
Evolutionary Psychology – ISSN 1474-7049 – Volume 13(1). 2015. -145-
Figure 1. Examples of body model stimuli
Note. Raters viewed a video of body models rotating 360 degrees. Depicted here are
the male model that received the lowest Rated Egalitarianism score and second-highest
Rated Attractiveness score, and the female model that received the second-lowest
Rated Egalitarianism score and second-highest Rated Attractiveness score
Wealth
We measured wealth by taking the mean response to three items (Cronbach’s α =
.82) focusing on self-perceived personal wealth, family wealth, and expected future wealth
(like Piff et al. [2010, 2012], we focused on self-perceived socioeconomic status, although
we did not use the same measure that they used). Participants were asked to “fill in the
blank as it applies to you” to the items “I am wealthier than ____% of other people in my
society,” “my family is wealthier than ____% of other people in my society,” and “I expect
that I will eventually become wealthier than ____% of other people in my society.”
Observed egalitarianism
We measured observed egalitarianism in three ways. First was the amount
contributed in a dictator game—a standard experimental economic task (Engel, 2011).
Participants reported how much of a £5.00 endowment they would give to another player
(from 0 to £5.00, in increments of £0.50) if they were in the role of offerer. They were then
randomly assigned (by coin toss) to the role of either offerer or receiver. If they became the
offerer, their allocation decision was enacted. If they became the receiver, then they
received the amount shared by a randomly-selected prior offerer in the study. Dictator
game offer scores were recorded in GBP; for example, a score of 2.50 indicates an offer of
£2.50. Dictator game instructions are presented in Appendix B.
Our second observed egalitarianism measure was “equity sensitivity” (Huseman,
Hatfield and Miles, 1985, 1987), a five-item index (Cronbach’s α = .83) assessing how
much one values one’s own interests versus those of one’s group/organization (Note that
although equity sensitivity includes “equity” in its name, it does not measure equity as this
term is conventionally defined in the organizational behavior literature, that is, in relation
to the extent to which one’s “inputs” [e.g., work effort] are proportional to one’s
“outcomes” [e.g., salary] [Greenberg and Colquitt, 2005]). We used standard equity

Attractiveness and egalitarianism
Evolutionary Psychology – ISSN 1474-7049 – Volume 13(1). 2015. -146-
sensitivity index items (Mueller and Clarke, 1998), but reworded them slightly because our
participants were not employees (e.g., “organization” became “group”). For each item (e.g.,
“In any social group I might be a member of, it would be more important for me to [a] get
from the group, or [b] give to the group”), participants allocated 10 points between the two
answer choices. For example, if they valued their own and the group’s interests equally,
they would allocate five points to each. Equity sensitivity was the mean number of points
allocated to more pro-group choices. All equity sensitivity items are presented in Appendix
C.
Our third observed egalitarianism measure was a three-item index (Cronbach’s α =
.84) of preference for a more redistributive political philosophy (socialism) over a less
redistributive one (capitalism). This preference was the mean response on a 7-point scale
ranging from “not true” to “very true,” to three statements: “I would rather live in a
Capitalist society than a Socialist society” (reverse-coded); “I would rather live in a
Socialist society than a Capitalist society”; “Capitalism is a fairer system than Socialism”
(reverse-coded).
Rated egalitarianism
We measured rated egalitarianism using the same 3D body model videos used for
attractiveness ratings (however, egalitarianism and attractiveness were measured by
different groups of raters). The perceived egalitarianism of each model was rated by 12
raters (six same-sex, six opposite-sex) on a scale of 1 (“selfish and competitive”) to 7
(“altruistic and egalitarian”). Inter-rater agreement was fairly low (Cronbach’s α = .40 for
female targets, .56 for male targets), but this had little effect on the results of interest and
was not judged to be a major impediment to analysis (this issue is considered in more detail
in the Discussion). The egalitarianism rating instructions are presented in Appendix D.
Results
Several variables were measured in sex-specific ways (e.g., anthropometric
measures of attractiveness and formidability were different in each sex), so the sexes were
analyzed separately when these variables were involved. Other variables were measured in
the same way for both sexes, and therefore the sexes were combined for analyses involving
these variables. We present results below in separate analyses of: (1) men and women
combined, (2) men only, (3) women only, and (4) sex differences in correlations.
Men and Women Combined
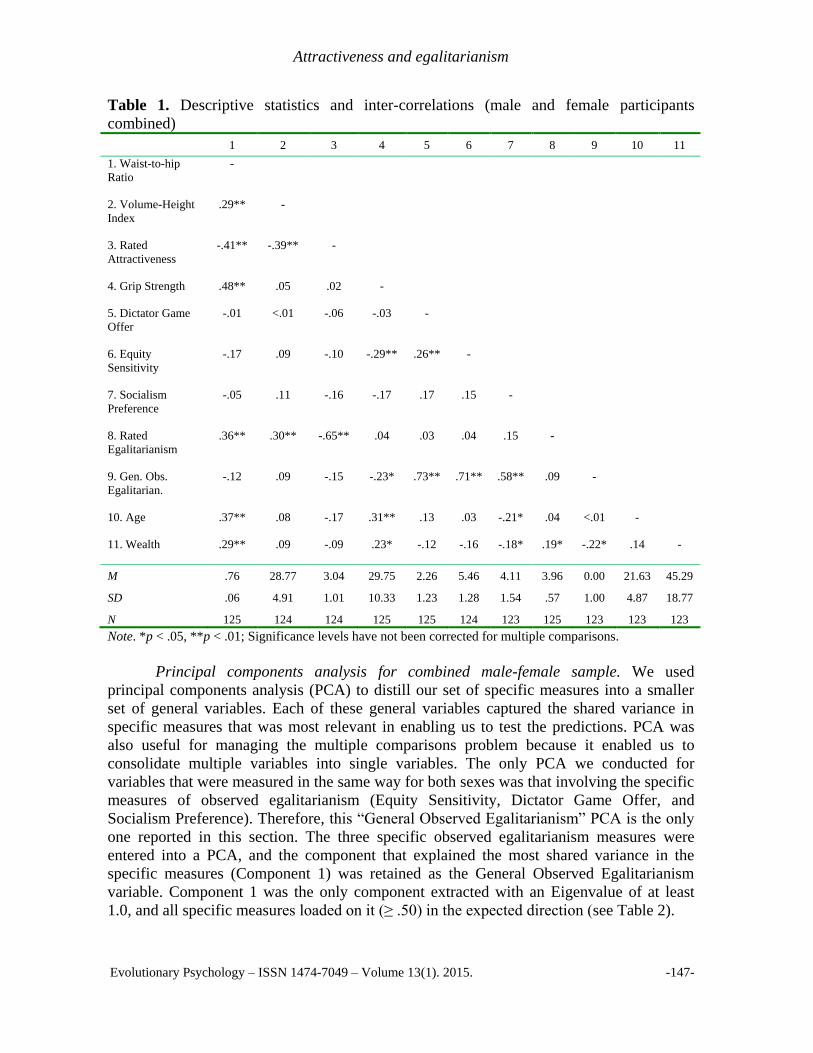
Inter-correlations and descriptive statistics for all variables that were measured in
the same way for both sexes are shown in Table 1. Significance values reported in
association with Table 1 correlations have not been corrected for multiple comparisons and
so do not represent tests of any stated predictions. Significance values reported in Table 1
and throughout this paper are two-tailed.
Attractiveness and egalitarianism
Evolutionary Psychology – ISSN 1474-7049 – Volume 13(1). 2015. -147-
Table 1. Descriptive statistics and inter-correlations (male and female participants
combined)
1 2 3 4 5 6 7 8 9 10 11
1. Waist-to-hip
Ratio
-
2. Volume-Height
Index
.29** -
3. Rated
Attractiveness
-.41** -.39** -
4. Grip Strength .48** .05 .02 -
5. Dictator Game
Offer
-.01 <.01 -.06 -.03 -
6. Equity
Sensitivity
-.17 .09 -.10 -.29** .26** -
7. Socialism
Preference
-.05 .11 -.16 -.17 .17 .15 -
8. Rated
Egalitarianism
.36** .30** -.65** .04 .03 .04 .15 -
9. Gen. Obs.
Egalitarian.
-.12 .09 -.15 -.23* .73** .71** .58** .09 -
10. Age .37** .08 -.17 .31** .13 .03 -.21* .04 <.01 -
11. Wealth .29** .09 -.09 .23* -.12 -.16 -.18* .19* -.22* .14 -
M .76 28.77 3.04 29.75 2.26 5.46 4.11 3.96 0.00 21.63 45.29
SD .06 4.91 1.01 10.33 1.23 1.28 1.54 .57 1.00 4.87 18.77
N 125 124 124 125 125 124 123 125 123 123 123
Note. *p < .05, **p < .01; Significance levels have not been corrected for multiple comparisons.
Principal components analysis for combined male-female sample. We used
principal components analysis (PCA) to distill our set of specific measures into a smaller
set of general variables. Each of these general variables captured the shared variance in
specific measures that was most relevant in enabling us to test the predictions. PCA was
also useful for managing the multiple comparisons problem because it enabled us to
consolidate multiple variables into single variables. The only PCA we conducted for
variables that were measured in the same way for both sexes was that involving the specific
measures of observed egalitarianism (Equity Sensitivity, Dictator Game Offer, and
Socialism Preference). Therefore, this “General Observed Egalitarianism” PCA is the only
one reported in this section. The three specific observed egalitarianism measures were
entered into a PCA, and the component that explained the most shared variance in the
specific measures (Component 1) was retained as the General Observed Egalitarianism
variable. Component 1 was the only component extracted with an Eigenvalue of at least
1.0, and all specific measures loaded on it (≥ .50) in the expected direction (see Table 2).

Attractiveness and egalitarianism
Evolutionary Psychology – ISSN 1474-7049 – Volume 13(1). 2015. -148-
Table 2. PCA factor loadings for general observed egalitarianism component (combined
male-female sample)
General Variable Specific Variables and Factor Loadings
General Observed Egalitarianism
(Eigenvalue = 1.39, 46% of total variance)
Equity Sensitivity (.71)
Dictator Game Offer (.73)
Socialism Preference (.58)
Overall, women exhibited higher observed egalitarianism than men. Using specific
observed egalitarianism measures, the prediction that women would exhibit higher
observed egalitarianism than men was tested three times, because there were three
egalitarianism measures (Equity Sensitivity, Dictator Game Offer, and Socialism
Preference). The prediction was supported in the case of Equity Sensitivity (male M = 5.16,
female M = 5.77, t[122] = -2.71, p = .008), marginally supported in the case of Socialism
Preference (male M = 3.85, female M = 4.36, t[121] = -1.87, p = .064), and unsupported in
the case of Dictator Game Offer (male M = 2.17, female M = 2.35, t[123] = -0.78, p =
.438). The association between Sex and Equity Sensitivity remained significant after
applying a Bonferroni-corrected p value of .017. The prediction of higher observed
egalitarianism in women was also tested once using the General Observed Egalitarianism
component—thus obviating the need to correct for multiple comparisons. The results
supported the prediction (male M = -0.23, female M = 0.22, t[121] = -2.60, p = .011). The
relationship between Sex and General Observed Egalitarianism remained significant after
controlling for the effects of the other predictors on General Observed Egalitarianism (see
below).
In the combined sample, there was some evidence of a negative relationship
between observed egalitarianism and attractiveness. Using specific egalitarianism
measures, the prediction of a negative relationship between observed egalitarianism and
attractiveness was tested three times in the combined sample using the three egalitarianism
measures and the one attractiveness measure that was not intended to be sex-specific
(Rated Attractiveness). None of these three correlations were significant, even before
correcting for multiple comparisons. The prediction was also tested once using the General
Observed Egalitarianism component and Rated Attractiveness; this correlation was in the
expected direction but did not achieve significance, r(120) = -.15, p = .111. However, the
relationship between Rated Attractiveness and General Observed Egalitarianism did
become significant after controlling for the effects of the other predictors on General
Observed Egalitarianism (see multiple regression model at end of this section).
In the combined sample, perceived egalitarianism was significantly negatively
related to attractiveness. The prediction of a negative relationship between Rated
Egalitarianism and attractiveness was tested once in the combined sample using the only
sex-neutral attractiveness measure (Rated Attractiveness). This relationship was strongly
negative (r[122] = -.65, p < .001), and remained so after controlling for the effects of Age
and Sex on Rated Egalitarianism in a multiple regression model (β = -.64, t[118] = -9.23, p
< .001).
In the combined sample, observed egalitarianism was not significantly related to
formidability, after controlling for sex. Using specific egalitarianism and formidability
measures, we tested for the existence of a relationship between observed egalitarianism and
formidability three times using the three egalitarianism measures and the one sex-neutral
Attractiveness and egalitarianism
Evolutionary Psychology – ISSN 1474-7049 – Volume 13(1). 2015. -149-
formidability measure (Grip Strength). Only the correlation between Grip Strength and
Equity Sensitivity was significant (r[122] = -.29, p = .001), and it remained significant after
applying a Bonferroni-corrected p value of .017. The prediction was also tested once using
General Observed Egalitarianism, which also produced a significant correlation with Grip
Strength (r[121] = -.23, p = .010). However, the significance of these correlations was due
to the fact that compared to women, men scored lower on Equity Sensitivity and General
Observed Egalitarianism (as reported above) and much higher on grip strength (male mean
= 37.50, female mean = 21.88, t[123] = 12.92, p < .001). After controlling for the effects of
Sex on Equity Sensitivity, the correlation between Grip Strength and Equity Sensitivity fell
to marginal significance (partial r[121] = -.17, p = .067), and after controlling for the
effects of Sex on General Observed Egalitarianism, the correlation between Grip Strength
and General Observed Egalitarianism became non-significant (partial r[120] = -.09, p =
.333).
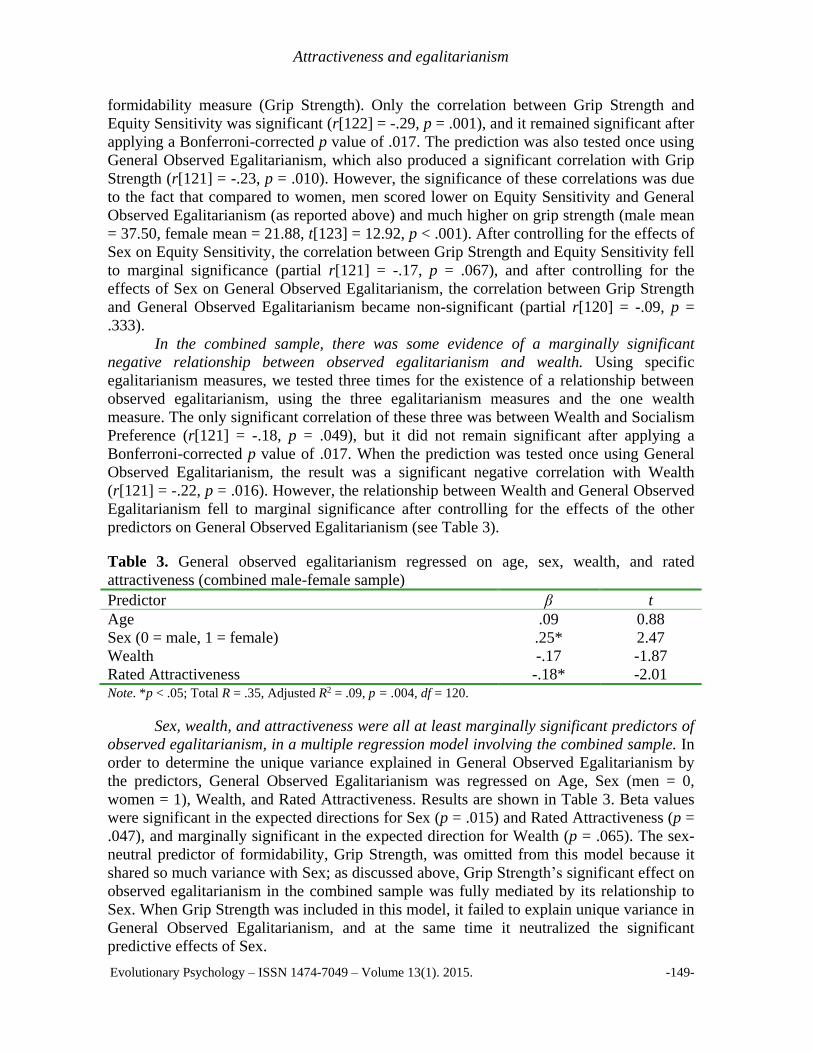
In the combined sample, there was some evidence of a marginally significant
negative relationship between observed egalitarianism and wealth. Using specific
egalitarianism measures, we tested three times for the existence of a relationship between
observed egalitarianism, using the three egalitarianism measures and the one wealth
measure. The only significant correlation of these three was between Wealth and Socialism
Preference (r[121] = -.18, p = .049), but it did not remain significant after applying a
Bonferroni-corrected p value of .017. When the prediction was tested once using General
Observed Egalitarianism, the result was a significant negative correlation with Wealth
(r[121] = -.22, p = .016). However, the relationship between Wealth and General Observed
Egalitarianism fell to marginal significance after controlling for the effects of the other
predictors on General Observed Egalitarianism (see Table 3).
Table 3. General observed egalitarianism regressed on age, sex, wealth, and rated
attractiveness (combined male-female sample)
Predictor β t
Age .09 0.88
Sex (0 = male, 1 = female) .25* 2.47
Wealth -.17 -1.87
Rated Attractiveness -.18* -2.01 Note. *p < .05; Total R = .35, Adjusted R2 = .09, p = .004, df = 120.
Sex, wealth, and attractiveness were all at least marginally significant predictors of
observed egalitarianism, in a multiple regression model involving the combined sample. In
order to determine the unique variance explained in General Observed Egalitarianism by
the predictors, General Observed Egalitarianism was regressed on Age, Sex (men = 0,
women = 1), Wealth, and Rated Attractiveness. Results are shown in Table 3. Beta values
were significant in the expected directions for Sex (p = .015) and Rated Attractiveness (p =
.047), and marginally significant in the expected direction for Wealth (p = .065). The sex-
neutral predictor of formidability, Grip Strength, was omitted from this model because it
shared so much variance with Sex; as discussed above, Grip Strength’s significant effect on
observed egalitarianism in the combined sample was fully mediated by its relationship to
Sex. When Grip Strength was included in this model, it failed to explain unique variance in
General Observed Egalitarianism, and at the same time it neutralized the significant
predictive effects of Sex.

Attractiveness and egalitarianism
Evolutionary Psychology – ISSN 1474-7049 – Volume 13(1). 2015. -150-
In the combined sample, no significant variance in observed egalitarianism was
explained by interaction effects between sex and formidability or between sex and
attractiveness. Two multiple regression models were created to test for predicted sex
differences using the combined sample: (1) that negative correlations between observed
egalitarianism and formidability would be observed only among men, and (2) that negative
correlations between observed egalitarianism and attractiveness would be stronger among
men than among women. Although both of these interaction effects were in the expected
direction of correlations being more negative among men, neither effect was significant. In
the first model, General Observed Egalitarianism was regressed on Age, Sex (men = 0,
women = 1), Grip Strength, and the Sex-Grip Strength interaction term; the interaction was
not significant (β = .46, t[117] = 1.43, p = .155). In the second model, General Observed
Egalitarianism was regressed on Age, Sex, Rated Attractiveness, and the Sex-Rated
Attractiveness interaction term; this interaction was also not significant (β = .51, t[116] =
1.64, p = .103).
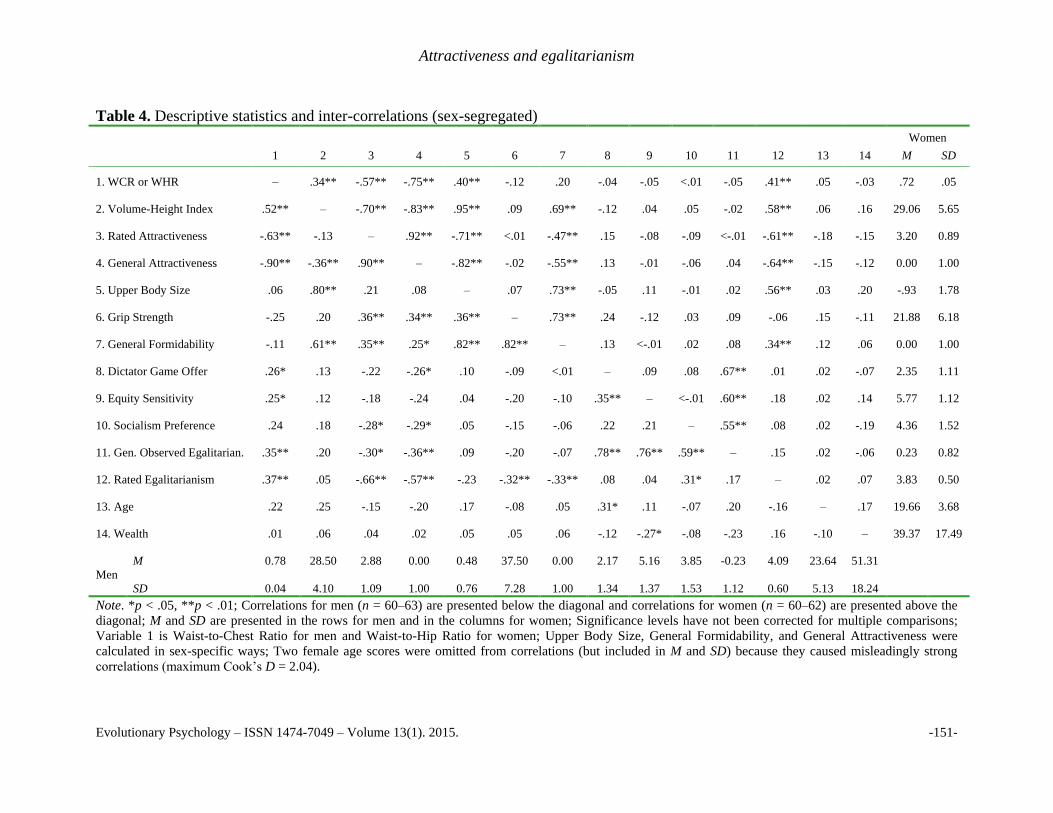
Men
Inter-correlations and descriptive statistics for all male variables are shown in Table
4. (As with Table 1, note that significance levels in Table 4 have not been corrected for
multiple comparisons).
Principal components analysis for men. We used PCA to create male-specific
General Attractiveness and General Formidability variables. As in the creation of General
Observed Egalitarianism described above, we created these general variables by entering
specific measures into a PCA, and retaining Component 1 as the general variable. In both
PCAs, Component 1 was the only component extracted with an Eigenvalue of at least 1.0,
and all specific measures loaded on it (≥ .5) in the expected direction. Table 5 shows male-
specific factor loadings for General Attractiveness, General Formidability, and General
Observed Egalitarianism.
Among men, observed egalitarianism was related negatively to attractiveness, but
not to formidability. Using specific egalitarianism and attractiveness measures, the
prediction of a negative relationship between egalitarianism and attractiveness was tested
six times, using three measures of egalitarianism (Equity Sensitivity, Dictator Game Offer,
and Socialism Preference) and two measures of attractiveness (Waist-to-chest Ratio and
Rated Attractiveness). All six correlations were of a similar magnitude in the expected
direction, and three were significant according to the uncorrected p values shown in Table
4; however, none were significant using a Bonferroni-corrected p value of .008. The
prediction was also tested once using the General Observed Egalitarianism and General
Attractiveness components and, as predicted, these variables were significantly negatively
related (r[59] = -.36, p = .004). This relationship remained significant after controlling for
the effects of the other predictors on General Observed Egalitarianism (see Table 7).
Attractiveness and egalitarianism
Evolutionary Psychology – ISSN 1474-7049 – Volume 13(1). 2015. -151-
Table 4. Descriptive statistics and inter-correlations (sex-segregated)
Women
1 2 3 4 5 6 7 8 9 10 11 12 13 14 M SD
1. WCR or WHR – .34** -.57** -.75** .40** -.12 .20 -.04 -.05 <.01 -.05 .41** .05 -.03 .72 .05
2. Volume-Height Index .52** – -.70** -.83** .95** .09 .69** -.12 .04 .05 -.02 .58** .06 .16 29.06 5.65
3. Rated Attractiveness -.63** -.13 – .92** -.71** <.01 -.47** .15 -.08 -.09 <-.01 -.61** -.18 -.15 3.20 0.89
4. General Attractiveness -.90** -.36** .90** – -.82** -.02 -.55** .13 -.01 -.06 .04 -.64** -.15 -.12 0.00 1.00
5. Upper Body Size .06 .80** .21 .08 – .07 .73** -.05 .11 -.01 .02 .56** .03 .20 -.93 1.78
6. Grip Strength -.25 .20 .36** .34** .36** – .73** .24 -.12 .03 .09 -.06 .15 -.11 21.88 6.18
7. General Formidability -.11 .61** .35** .25* .82** .82** – .13 <-.01 .02 .08 .34** .12 .06 0.00 1.00
8. Dictator Game Offer .26* .13 -.22 -.26* .10 -.09 <.01 – .09 .08 .67** .01 .02 -.07 2.35 1.11
9. Equity Sensitivity .25* .12 -.18 -.24 .04 -.20 -.10 .35** – <-.01 .60** .18 .02 .14 5.77 1.12
10. Socialism Preference .24 .18 -.28* -.29* .05 -.15 -.06 .22 .21 – .55** .08 .02 -.19 4.36 1.52
11. Gen. Observed Egalitarian. .35** .20 -.30* -.36** .09 -.20 -.07 .78** .76** .59** – .15 .02 -.06 0.23 0.82
12. Rated Egalitarianism .37** .05 -.66** -.57** -.23 -.32** -.33** .08 .04 .31* .17 – .02 .07 3.83 0.50
13. Age .22 .25 -.15 -.20 .17 -.08 .05 .31* .11 -.07 .20 -.16 – .17 19.66 3.68
14. Wealth .01 .06 .04 .02 .05 .05 .06 -.12 -.27* -.08 -.23 .16 -.10 – 39.37 17.49
Men
M 0.78 28.50 2.88 0.00 0.48 37.50 0.00 2.17 5.16 3.85 -0.23 4.09 23.64 51.31
SD 0.04 4.10 1.09 1.00 0.76 7.28 1.00 1.34 1.37 1.53 1.12 0.60 5.13 18.24
Note. *p < .05, **p < .01; Correlations for men (n = 60–63) are presented below the diagonal and correlations for women (n = 60–62) are presented above the
diagonal; M and SD are presented in the rows for men and in the columns for women; Significance levels have not been corrected for multiple comparisons;
Variable 1 is Waist-to-Chest Ratio for men and Waist-to-Hip Ratio for women; Upper Body Size, General Formidability, and General Attractiveness were
calculated in sex-specific ways; Two female age scores were omitted from correlations (but included in M and SD) because they caused misleadingly strong
correlations (maximum Cook’s D = 2.04).

Attractiveness and egalitarianism
Evolutionary Psychology – ISSN 1474-7049 – Volume 13(1). 2015. -152-
Table 5. PCA factor loadings for general variables (male sample only)
General Variable Specific Variables and Factor Loadings
General Observed Egalitarianism
(Eigenvalue = 1.54, 51% of total variance)
Equity Sensitivity (.76)
Dictator Game Offer (.77)
Socialism Preference (.61)
General Attractiveness
(Eigenvalue = 1.63, 82% of total variance)
Waist-to-chest Ratio* (.90)
Rated Attractiveness (.90)
General Formidability
(Eigenvalue = 1.82, 91% of total variance)
Upper Body Size (.96)
Grip Strength (.96) Note. *Reverse-coded.
Using specific egalitarianism and formidability measures, the prediction of a
negative relationship between egalitarianism and formidability in men was tested six times
using the three egalitarianism measures and two formidability measures (Upper Body Size
and Grip Strength). None of these correlations were significant, even before correcting for
multiple comparisons. The prediction was also tested once using the General Observed
Egalitarianism and General Formidability components, which were not significantly related
(r[59] = -.07, p = .61). This relationship remained non-significant after controlling for the
effects of the other predictors on General Observed Egalitarianism (see multiple regression
model at end of this section).
Among men, perceived egalitarianism was related negatively to both attractiveness
and formidability. The prediction of a negative relationship between perceived
egalitarianism and attractiveness in men was tested twice using the one perceived
egalitarianism measure (Rated Egalitarianism) and the two specific attractiveness measures
(Waist-to-chest Ratio and Rated Attractiveness). Both of these correlations were in the
expected direction, and both remained significant after applying a Bonferroni-corrected p
value of .025. The prediction was also tested once using the General Attractiveness
component, which was significantly negatively related to Rated Egalitarianism (r[61] =
-.57, p < .001); this relationship remained significant after controlling for the effects of Age
and General Formidability on Rated Egalitarianism (β = -.58, t[57] = -5.37, p < .001).
The prediction of a negative relationship between perceived egalitarianism and
formidability in men was also tested twice using Rated Egalitarianism and the two
formidability measures (Upper Body Size and Grip Strength). Both of these correlations
were in the expected direction, and one of them (Grip Strength) remained significant after
applying a Bonferroni-corrected p value of .025. The prediction was also tested once using
the General Formidability component, which was significantly negatively related to Rated
Egalitarianism (r[61] = -.33, p = .008). This relationship remained significant after
controlling for the effects of Age on Rated Egalitarianism; however, it became non-
significant (β = -.16, t[57] = -1.51, p = .137) after controlling for the effects of General
Attractiveness on Rated Egalitarianism due to the shared variance between General
Attractiveness and General Formidability (r[61] = .25, p = .044).
The male bodily traits most associated with attractiveness and formidability each
contributed uniquely to explain variance in Rated Egalitarianism: As shown in Table 6,
multiple regression revealed that Waist-to-chest Ratio and Upper Body Size each explained
significant variance in Rated Egalitarianism that was not explained by the other. Figure 1

Attractiveness and egalitarianism
Evolutionary Psychology – ISSN 1474-7049 – Volume 13(1). 2015. -153-
depicts the male with the lowest Rated Egalitarianism score and the second-highest Rated
Attractiveness score.
Table 6. Rated egalitarianism regressed on anthropometric predictors among men and
women, respectively
Predictor β T df Total R
Men Waist-to-chest Ratio .39** 3.35 60 .45**
Upper Body Size -.25* -2.16
Women Waist-to-hip Ratio .23* 2.10 58 .62***
Volume-Height Index .50*** 4.54 Note. *p < .05, ** p < .01, *** p < .001.
There was evidence of a marginally-significant negative relationship between
wealth and egalitarianism among men. Using specific egalitarianism measures, the
prediction of a negative relationship between observed egalitarianism and wealth in men
was tested three times, using the three observed egalitarianism measures and Wealth. All of
these correlations were in the expected direction, and one of them (that involving Equity
Sensitivity) was significant according to the uncorrected p value; however, none of them
were significant using a Bonferroni-corrected p value of .017. The prediction was also
tested once using the General Observed Egalitarianism component, which was marginally
significantly negatively related to Wealth (r[59] = -.23, p = .081) among men. This
relationship remained marginally significant after controlling for the effects of the other
predictors on General Observed Egalitarianism (see Table 7).
Table 7. Stepwise regression of general observed egalitarianism on predictors among men
Predictor ΔR2 β t
Step 1 .084
Age .09 0.73
Wealth -.22 -1.75
General Formidability .03 .24
Step 2 .100*
General Attractiveness -.34* -2.60 Note. *p < .05. Total R = .43, Adjusted R2 = .13, p = .022, df = 55.
Among men, when General Observed Egalitarianism was regressed on all
predictors, attractiveness was the only significant predictor. In order to compare the effects
of all predictors of General Observed Egalitarianism among men, General Observed
Egalitarianism was regressed on Age, Wealth, General Formidability, and General
Attractiveness. The only predictor that explained significant unique variance in General
Observed Egalitarianism was General Attractiveness (β = -.34, t[55] = -2.60, p = .012), and
the only other predictor associated with a p value below .468 was Wealth (β = -.22, t[55] =
-1.75, p = .085). In Table 7, we present this model in stepwise format to illustrate that
General Attractiveness explained variance in General Observed Egalitarianism above and
beyond that explained by Wealth (and the other predictors). However, despite the relative
usefulness of General Attractiveness as a predictor in this model, other results indicated

Attractiveness and egalitarianism
Evolutionary Psychology – ISSN 1474-7049 – Volume 13(1). 2015. -154-
that it was not significantly better than Wealth as a predictor of General Observed
Egalitarianism: An asymptotic z-test (Steiger, 1980) indicated that the correlations between
General Observed Egalitarianism and Wealth (r[59] = -.23, p = .081) and between General
Observed Egalitarianism and General Attractiveness (r[59] = -.36, p = .004) were not
significantly different (z = .79, p = .431).
There was no evidence that wealth and formidability (or other predictors)
interacted to explain variance in male observed egalitarianism. As noted above, our main
goal with regard to testing for interaction effects was to look for effects similar those
reported by Peterson et al. (2013), who found that formidability and support for economic
redistribution were positively correlated in lower-income men, and negatively correlated in
higher-income men. We regressed General Observed Egalitarianism on Age, Wealth,
General Formidability, and the Wealth-General Formidability interaction term, and found
no predictor to be significant (all p’s ≥ .075). The Wealth-General Formidability interaction
was not far from significant (β = .22, t[55] = 1.66, p = .102), but was in the opposite
direction of that predicted by Peterson et al. (2013); that is, in our results, the correlation
between formidability and egalitarianism was non-significantly more positive among
wealthier men. We also ran this model with Socialism Preference rather than General
Observed Egalitarianism as the outcome variable, because Socialism Preference was the
most similar of all our egalitarianism measures to the “support for economic redistribution”
outcome variable used by Petersen et al. (2013). In this model, again no predictor was
significant (all p’s ≥ .485), and the Wealth-General Formidability interaction was again in
the opposite direction of that predicted by Peterson et al. (2013), however the effect was far
from significant (β = .07, t[55] = .52, p = .608).
In addition to testing whether significant variance in General Observed
Egalitarianism among men was explained by a Wealth-General Formidability interaction,
for exploratory purposes we also created regression models to see if any such variance was
explained by a Wealth-General Attractiveness interaction or a General Formidability-
General Attractiveness interaction (both models controlled for Age). Neither of these other
two interaction effects were significant (both p’s ≥ .765).
Women
Inter-correlations and descriptive statistics for all female variables are shown in
Table 4. (Again, note that significance levels in this table have not been corrected for
multiple comparisons).
Principal components analysis for women. We used PCA to create two female-
specific general variables: General Attractiveness and General Formidability. As in the
creation of other general variables described above, we created these by entering specific
measures into a PCA, and retaining Component 1 as the general variable. In both PCAs,
Component 1 was the only component extracted with an Eigenvalue of at least 1.0, and all
specific measures loaded on it (≥ .5) in the expected direction. Table 8 shows factor
loadings for General Attractiveness and General Formidability among women, as well as
female-specific loadings for General Observed Egalitarianism.
Attractiveness and egalitarianism
Evolutionary Psychology – ISSN 1474-7049 – Volume 13(1). 2015. -155-
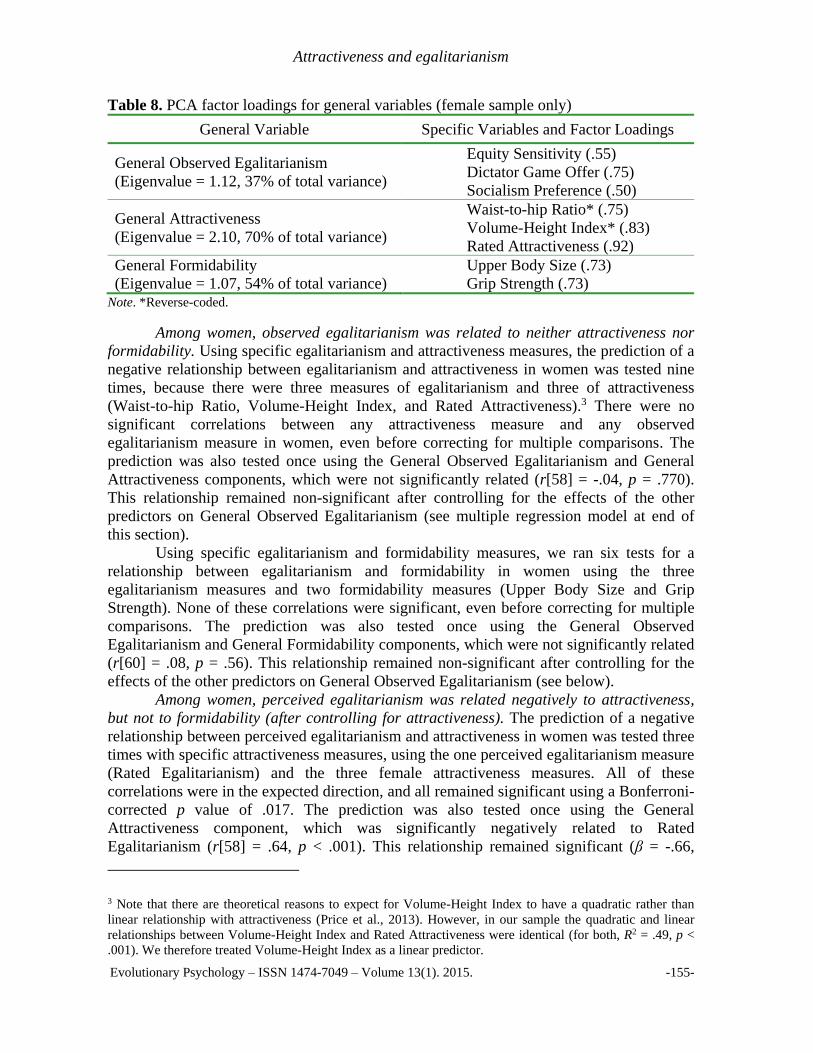
Table 8. PCA factor loadings for general variables (female sample only)
General Variable Specific Variables and Factor Loadings
General Observed Egalitarianism
(Eigenvalue = 1.12, 37% of total variance)
Equity Sensitivity (.55)
Dictator Game Offer (.75)
Socialism Preference (.50)
General Attractiveness
(Eigenvalue = 2.10, 70% of total variance)
Waist-to-hip Ratio* (.75)
Volume-Height Index* (.83)
Rated Attractiveness (.92)
General Formidability
(Eigenvalue = 1.07, 54% of total variance)
Upper Body Size (.73)
Grip Strength (.73) Note. *Reverse-coded.
Among women, observed egalitarianism was related to neither attractiveness nor
formidability. Using specific egalitarianism and attractiveness measures, the prediction of a
negative relationship between egalitarianism and attractiveness in women was tested nine
times, because there were three measures of egalitarianism and three of attractiveness
(Waist-to-hip Ratio, Volume-Height Index, and Rated Attractiveness).3 There were no
significant correlations between any attractiveness measure and any observed
egalitarianism measure in women, even before correcting for multiple comparisons. The
prediction was also tested once using the General Observed Egalitarianism and General
Attractiveness components, which were not significantly related (r[58] = -.04, p = .770).
This relationship remained non-significant after controlling for the effects of the other
predictors on General Observed Egalitarianism (see multiple regression model at end of
this section).
Using specific egalitarianism and formidability measures, we ran six tests for a
relationship between egalitarianism and formidability in women using the three
egalitarianism measures and two formidability measures (Upper Body Size and Grip
Strength). None of these correlations were significant, even before correcting for multiple
comparisons. The prediction was also tested once using the General Observed
Egalitarianism and General Formidability components, which were not significantly related
(r[60] = .08, p = .56). This relationship remained non-significant after controlling for the
effects of the other predictors on General Observed Egalitarianism (see below).
Among women, perceived egalitarianism was related negatively to attractiveness,
but not to formidability (after controlling for attractiveness). The prediction of a negative
relationship between perceived egalitarianism and attractiveness in women was tested three
times with specific attractiveness measures, using the one perceived egalitarianism measure
(Rated Egalitarianism) and the three female attractiveness measures. All of these
correlations were in the expected direction, and all remained significant using a Bonferroni-
corrected p value of .017. The prediction was also tested once using the General
Attractiveness component, which was significantly negatively related to Rated
Egalitarianism (r[58] = .64, p < .001). This relationship remained significant (β = -.66,
3 Note that there are theoretical reasons to expect for Volume-Height Index to have a quadratic rather than
linear relationship with attractiveness (Price et al., 2013). However, in our sample the quadratic and linear
relationships between Volume-Height Index and Rated Attractiveness were identical (for both, R2 = .49, p <
.001). We therefore treated Volume-Height Index as a linear predictor.

Attractiveness and egalitarianism
Evolutionary Psychology – ISSN 1474-7049 – Volume 13(1). 2015. -156-
t[56] = -5.39, p < .001) after controlling for the effects of Age and General Formidability
on Rated Egalitarianism.
The female bodily traits most associated with attractiveness each contributed
uniquely to explain variance in Rated Egalitarianism: As shown in Table 6, multiple
regression revealed that Waist-to-hip Ratio and Volume-Height Index each explained
significant variance in Rated Egalitarianism that was not explained by the other. Figure 1
depicts the female with the second-lowest Rated Egalitarianism score and the second-
highest Rated Attractiveness score.
We tested for a relationship between Rated Egalitarianism and formidability in
women using the two specific formidability measures (Upper Body Size and Grip
Strength). Rated Egalitarianism was not significantly related to Grip Strength, but was
strongly positively related to Upper Body Size (r[60] = .56, p < .001). Due to this strong
relationship, there was also a significant positive correlation between Rated Egalitarianism
and General Formidability (r[60] = .34, p = .007). However, the significance of these
correlations was due to Rated Egalitarianism being related negatively to attractiveness, and
attractiveness in turn being negatively related to Upper Body Size, among women. After
controlling for the effects of General Attractiveness on Rated Egalitarianism in women, the
partial correlations between Upper Body Size and Rated Egalitarianism and between
General Formidability and Rated Egalitarianism fell to non-significance (p’s ≥ .754).
Among women, observed egalitarianism was not related to wealth. Using the three
specific observed egalitarianism measures, we ran three tests for the existence of a
relationship between egalitarianism and Wealth among women. None of these correlations
were significant, even before correcting for multiple comparisons. The prediction was also
tested once using the General Observed Egalitarianism component, which was not
significantly related to Wealth (r[60] = -.06, p = .630); this relationship remained non-
significant after controlling for the effects of the other predictors on General Observed
Egalitarianism (see below).
Among women, when General Observed Egalitarianism was regressed on all
predictors, there were no significant predictors. In order to compare the effects of all
predictors of General Observed Egalitarianism among women, General Observed
Egalitarianism was regressed on Age, Wealth, General Formidability, and General
Attractiveness. No predictor was significant (all p’s ≥ .383).
There was no evidence that predictors interacted to explain variance in female
observed egalitarianism. Just as we did for men, we created multiple regression models to
test whether significant variance in General Observed Egalitarianism among women was
explained by a Wealth-General Formidability interaction, a Wealth-General Attractiveness
interaction, or a General Formidability-General Attractiveness interaction (all models
controlled for Age). None of these three interaction effects were significant (all p’s ≥ .228).
Sex differences in the strength of correlations
We conducted independent samples z-tests in order to investigate whether negative
correlations between observed egalitarianism and formidability, and between observed
egalitarianism and attractiveness, were significantly stronger among men than among
women. The correlations between General Observed Egalitarianism and General
Formidability among women (r[60] = .08, p = .559) and men (r[59] = -.07, p = .610) were
not significantly different (z = .77, p = .441). However, the correlations between General

Attractiveness and egalitarianism
Evolutionary Psychology – ISSN 1474-7049 – Volume 13(1). 2015. -157-
Observed Egalitarianism and General Attractiveness among women (r[58] = .04, p = .770)
and men (r[59] = -.36, p = .004) were significantly different (z = 2.23, p = .026).
Discussion
Perhaps the most interesting finding reported above was the moderately strong and
significantly negative linear association between attractiveness and observed egalitarianism
among men. When General Observed Egalitarianism was regressed on all main predictors
among men (Age, Wealth, General Formidability, General Attractiveness), General
Attractiveness was the only significant predictor, whereas Wealth had a marginally
significant negative effect. Although researchers often use socioeconomic status as a
predictor of egalitarianism and prosociality without considering the predictive effects of
attractiveness (Gelman, Kenworthy, and Su, 2010; Gelman, Shor, Bafumi, and Park, 2007;
Kunovich and Slomczynski, 2007; Piff et al., 2010, 2012; Ritzman and Tomaskovic-
Devey, 1992), results of the current study suggest that attractiveness may be no less
important than wealth as a predictor of egalitarianism among men.
Also intriguing were the strong negative relationships between attractiveness and
Rated Egalitarianism among both male and female targets, and the moderate negative
relationship between formidability and Rated Egalitarianism among male targets only. The
low inter-rater agreement about Rated Egalitarianism (noted above) appeared to weaken
these relationships to some degree, but not to alter their general nature. Cronbach’s α could
be increased from .40–.56 to .68–.70 for each ratings set by excluding the three most
idiosyncratic raters from each set; doing so increased correlations between Rated
Egalitarianism and Rated Attractiveness from -.66 to -.77 for male targets and from -.61 to
-.67 for female targets. Although the low internal consistency of Rated Egalitarianism did
not have a strong impact on the correlations of interest, however, it does suggest that bodily
shape may not be a particularly obvious or reliable cue to egalitarianism. It is also possible
that raters were introducing noise into the ratings by approaching the task of rating
egalitarianism in divergent ways (e.g., by interpreting the instructions differently; we
discuss this possibility further in the “limitations” section below). Still, the strong negative
relationships found between Rated Egalitarianism and attractiveness/formidability could
plausibly indicate how raters would expect personality and behavior to relate to
attractiveness/formidability, all else equal, in everyday life. These results thus suggest that
in the social experience of raters, people who are more attractive/formidable tend to behave
in a less egalitarian manner.
Other results reported above are notable as attempts to approximately replicate
findings that had been reported previously (we say “approximately” replicate because we
did not measure all variables in the same manner as in previous studies, as we discuss
below). Some of these attempts were in agreement with earlier findings: Consistent with
many previous studies (Baron-Cohen, 2008; Croson and Gneezy, 2009; Inness et al., 2004),
we found evidence of higher observed egalitarianism among women than among men.
Consistent with Price et al. (2011) and Takahashi et al. (2006), we found no evidence that
observed egalitarianism was related to attractiveness (as assessed via anthropometric
measures and/or the ratings of other people, as opposed to self-assessed attractiveness)
among women. Some of our other results were inconsistent with previous findings:
Contrary to Price et al. (2011), we found no evidence that men’s observed egalitarianism
Attractiveness and egalitarianism
Evolutionary Psychology – ISSN 1474-7049 – Volume 13(1). 2015. -158-
was related to their bodily formidability, and contrary to Peterson et al. (2013), we found
no evidence that wealth and formidability interacted to explain variance in observed
egalitarianism in general, or in support for a more economically redistributive political
system specifically. What might account for this lack of support for these earlier findings?
One likely explanation is that our egalitarianism measures were substantially different from
those used by Price et al. (2011) and Peterson et al. (2013) (note also that these two studies
themselves used egalitarianism measures that were quite different from one another).
Moreover, our formidability and wealth measures were also different from those used by
Peterson et al. (2013). The fact that we used different variables than these previous studies
substantially reduces the extent to which our study can be regarded as involving
straightforward attempts to replicate their findings.
Limitations
An important limitation of the current study is its correlational nature. Bodily
attractiveness could be related to egalitarianism in men not because having a more
attractive body causes men to be less egalitarian, but because being less egalitarian causes
men to invest more in their own physical condition (e.g., via exercise); or perhaps
egalitarianism and the tendency to invest in one’s own physical condition are both
influenced by some more fundamental individual difference variable. In future correlational
studies of bodily condition and cognition/behavior, it will be important to control for
investment in own condition (e.g., time spent in the gym). It would also be interesting to
experimentally manipulate one’s relative bodily condition in order to see if this affects
egalitarianism; for example, do men become more egalitarian in the presence of men who
are in better condition—and less egalitarian in the presence of men who are in worse
condition—than they are?
Other limitations have to do with the ways in which we measured egalitarianism.
Our three specific egalitarianism measures were, in some respects, quite different from one
another, which made it harder to conceive of these variables in a conceptually unified way.
We thought that the common psychological qualities measured by these variables were best
characterized by the concept of egalitarianism, but we could have increased conceptual
clarity in our study by using a less diverse set of outcome variables. Principal components
analysis helped us manage this diversity by generating a variable that captured the relevant
shared variance among our specific egalitarianism measures. On our General Perceived
Egalitarianism variable (and indeed on all general variables we generated via PCA), all
specific measures loaded acceptably strongly (≥ .5) in the expected direction, so the
variance that was captured seemed to be that which was relevant in terms of our theoretical
expectations and the predictions that we were testing. Nevertheless, we could have
measured egalitarianism in a conceptually simpler way (e.g., by measuring social
dominance orientation [Pratto et al., 1994; Price et al., 2011] or support for redistribution
[Peterson et al., 2013]).
Another limitation related to our egalitarianism measures is that due to the way in
which we asked participants about their preference for socialism over capitalism, we cannot
know the extent to which their responses reflected their views about egalitarianism
specifically. We did not define socialism and capitalism for participants in terms of
economic redistribution. In British society, these terms have connotations (e.g., capitalism
is more suggestive of free market competition and inequality, socialism is more suggestive

Attractiveness and egalitarianism
Evolutionary Psychology – ISSN 1474-7049 – Volume 13(1). 2015. -159-
of redistribution and equality) that we believed would be perceived by participants,
especially because we contrasted these two terms directly. We therefore assumed that
Socialism Preference would usefully reflect participant preferences for redistribution and
equality versus competition and inequality. However, we could be more confident in this
assumption if we had defined these terms in a way that focused more specifically on their
egalitarian aspects.
An additional limitation is the manner in which we described personality types in
the Rated Egalitarianism task. We asked raters to evaluate body models on a scale from
“altruistic and egalitarianism” to “selfish and competitive.” We chose these terms because
we believed that they best represented the qualities measured by the Equity Sensitivity,
Dictator Game Offer, and Socialism Preference variables (qualities which we have
summarized throughout this paper as “egalitarianism”). However, it may be that our use of
multiple descriptors, and/or our confounding of descriptors into pairs, caused uncertainty
among raters about what exact qualities they were supposed to be rating. Any noise in the
ratings caused by such uncertainty may help explain the relatively low internal consistency
of Rated Egalitarianism.
A final limitation we should mention relates to our dictator game instructions.
Participants were told that they had a 50/50 chance of being in either the offerer or receiver
role, and that if they ended up in the receiver role, their earnings would be “determined by
the amount that a previous study participant (chosen at random) decided to share.”
Therefore, their decision about how much to share with the receiver could not affect their
own earnings as the receiver. However, it is possible that being told that they could end up
as the receiver made them more likely to empathize with the receiver, which might lead to
an increase in average offer size. Although such an increase would not necessarily cause
dictator game data in the current study to be uninformative about egalitarian tendencies, it
is important to note that the game’s design could have influenced offer sizes.
Conclusion
Although we did not find evidence for all predicted negative associations between
egalitarianism and physical indices of bargaining power (formidability and attractiveness),
the significant relationships we did find were in the direction of bargaining power and
egalitarianism being negatively related. Our significant findings, then—like results of
previous studies (Holtzman et al., 2011; Price et al., 2011; Sanchez-Pages and Turiegano,
2010; Sell et al., 2009; Takahashi et al., 2006; Zaatari and Trivers, 2007)—provide some
support for the view that egalitarianism is reduced in people—especially in men—who
possess traits that would have led to high social power ancestrally. Further, our results
shine a particularly bright light on the under-appreciated role that physical attractiveness
may play as a predictor of egalitarianism in men.
Acknowledgements: Thanks to Stacey Julien, Zerrin Simsek, and two anonymous
reviewers.
Received 25 November 2013; Revision submitted 01 July 2014; Accepted 15 July 2014

Attractiveness and egalitarianism
Evolutionary Psychology – ISSN 1474-7049 – Volume 13(1). 2015. -160-
References
Baron-Cohen, S. (2008). The evolution of brain mechanisms for social behavior. In C.
Crawford and D. Krebs (Eds.), Foundations of evolutionary psychology (pp. 331–
352). New York: Lawrence Erlbaum.
Coy, A., Green, J., and Price, M. E. (2014). Why is low waist-to-chest ratio attractive in
males? The mediating roles of perceived dominance, fitness, and protection
ability. Body Image, 11, 282–289.
Croson, R., and Gneezy, U. (2009). Gender differences in preferences. Journal of
Economic Literature, 47, 448–474.
Engel, C. (2011). Dictator games: A meta study. Experimental Economics, 14, 583–610.
Fan, J., Dai, W., Liu, F., and Wu, J. (2005). Visual perception of male body attractiveness.
Proceedings of the Royal Society B, 272, 219–226.
Fan, J., Liu, F., Wu, J., and Dai, W. (2004). Visual perception of female physical
attractiveness. Proceedings of the Royal Society B, 271, 347–352.
Furnham, A., Swami, V., and Shah, K. (2006). Body weight, waist-to-hip ratio and breast
size correlates of ratings of attractiveness and health. Personality and Individual
Differences, 41, 443–454.
Gelman, A., Kenworthy, L., and Su, Y. (2010). Income inequality and partisan voting in
the United States. Social Science Quarterly, 91, 1203–1219.
Gelman, A., Shor, B., Bafumi, J., and Park, D. (2007). Rich state, poor state, red state, blue
state: What’s the matter with Connecticut? Quarterly Journal of Political Science,
2, 345–367.
Grammer, K., Fink, B., Møller, A. P., and Thornhill, R. (2003). Darwinian aesthetics:
Sexual selection and the biology of beauty. Biological Reviews, 78, 385–407.
Greenberg, J., and Colquitt, J. A. (2005). Handbook of organizational justice. Mahwah, NJ:
Lawrence Erlbaum.
Holtzman, N. S., Augustine, A. A, and Senne, A. L. (2011). Are pro-social or socially
aversive people more physically symmetrical? Symmetry in relation to over 200
personality variables. Journal of Research in Personality, 45, 687–691.
Horvath, T. (1979). Correlates of physical beauty in men and women. Social Behavior and
Personality, 7, 145–151.
Huseman, R. C, Hatfield, J. D., and Miles, E. W. (1985). Test for individual perceptions of
job equity: Some preliminary findings. Perceptual and Motor Skills, 62, 1055–
1064.
Huseman, R. G., Hatfield, J. D., and Miles, E. W. (1987). A new perspective on equity
theory: The equity sensitivity construct. Academy of Management Review, 12, 222–
234.
Inness, M., Desmarais, S., and Day, A. (2004). Gender, mood state, and justice preference:
Do mood states moderate gender-based norms of justice? British Journal of Social
Psychology, 44, 463–478.
Kunovich, S., and Slomczynski, K. M. (2007). Systems of distribution and a sense of
equity: A multilevel analysis of meritocratic attitudes in post-industrial societies.
European Sociological Review, 23, 649–663.

Attractiveness and egalitarianism
Evolutionary Psychology – ISSN 1474-7049 – Volume 13(1). 2015. -161-
Langlois, J. H., Kalakanis, L., Rubenstein, A. J., Larson, A., Hallam, M., and Smoot, M.
(2000). Maxims or myths of beauty? A meta-analytic and theoretical
review. Psychological Bulletin, 126, 390–423.
Lassek, W. D., and Gaulin, S. J. C. (2009). Costs and benefits of fat-free muscle mass in
men: Relationship to mating success, dietary requirements, and native immunity.
Evolution and Human Behavior, 30, 322–328.
Lukaszewski, A. W. (2013). Testing an adaptationist theory of trait covariation: Relative
bargaining power as a common calibrator of an interpersonal syndrome. European
Journal of Personality, 27, 328–345.
Maisey, D. S., Vale, E. L., Cornelissen, P. L., and Tovée, M. J. (1999). Characteristics of
male attractiveness for women. The Lancet, 353, 1500.
Mueller, S. L., and Clarke, L. D. (1998). Political-economic context and sensitivity to
equity: Differences between the United States and the transition economies of
central and eastern Europe. The Academy of Management Journal, 41, 319–329.
NC-12 3D Body Scanner [Apparatus and software]. (2010). Cary, NC: Textile Clothing
and Technology Corporation, [TC]2.
Petersen, M. B., Sznycer, D., Sell, A., Cosmides, L., and Tooby, J. (2013). The ancestral
logic of politics: Upper-body strength regulates men’s assertion of self-interest over
economic redistribution. Psychological Science, 24, 1098–1103.
Piff, P. K., Kraus, M. W., Côté, S., Cheng, B. H., and Keltner, D. (2010). Having less,
giving more: The influence of social class on egalitarian behavior. Journal of
Personality and Social Psychology, 99, 771–784.
Piff, P. K., Stancato, D. M., Côté, S., Mendoza-Denton, R., and Keltner, D. (2012). Higher
social class predicts increased unethical behavior. Proceedings of the National
Academy of Sciences USA, 109, 4086–4091.
Pratto, F., Sidanius, J., Stallworth, L. M., and Malle, B. F. (1994). Social dominance
orientation: A personality variable predicting social and political attitudes. Journal
of Personality and Social Psychology, 67, 741–763.
Price, M. E., Dunn, J., Hopkins, S., and Kang, J. (2012). Anthropometric correlates of
human anger. Evolution and Human Behavior, 33, 174–181.
Price, M. E., Kang, J., Dunn, J., and Hopkins, S. (2011). Muscularity and attractiveness as
predictors of human egalitarianism. Personality and Individual Differences, 50,
636–640.
Price, M. E., Pound, N., Dunn, J., Hopkins, S., and Kang, J. (2013). Body shape
preferences: Associations with rater body shape and sociosexuality. PLoS ONE, 8,
e52532.
Ritzman, R. L., and Tomaskovic-Devey, D. (1992). Life chances and support for equality
and equity as normative and counternormative distribution rules. Social Forces, 70,
745–763.
Roney, J. R. (2009). The role of sex hormones in the initiation of human mating
relationships. In P. T. Ellison and P. B. Gray (Eds.), Endocrinology of social
relationships (pp. 246–269). Cambridge: Harvard University Press.
Sanchez-Pages, S., and Turiegano, E. (2010). Testosterone, facial symmetry and
cooperation in the prisoners' dilemma. Physiology and Behavior, 99, 355–361.
Attractiveness and egalitarianism
Evolutionary Psychology – ISSN 1474-7049 – Volume 13(1). 2015. -162-
Sell, A., Bryant, G., Cosmides, L., Tooby, J., Sznycer, D., von Rueden, C., . . . Gurven, M.
(2010). Adaptations in humans for assessing physical strength from the
voice, Proceedings of the Royal Society B, 277, 3509–3518.
Sell, A., Tooby, J., and Cosmides, L. (2009). Formidability and the logic of human anger.
Proceedings of the National Academy of Sciences USA, 106, 15073–15078.
Singh, D. (1993). Adaptive significance of female physical attractiveness: Role of waist-to-
hip ratio. Journal of Personality and Social Psychology, 65, 293–307.
Singh, D. (2002). Female mate value at a glance: Relationship of waist-to-hip ratio to
health, fecundity and attractiveness. Neuroendocrinology Letters, 23, 81–91.
Smith, F. G., DeBruine, L. M., Jones, B. C., Krupp, D. B., Welling, L. L. M., and Conway,
C. A. (2009). Attractiveness qualifies the effect of observation on trusting behavior
in an economic game. Evolution and Human Behavior, 30, 393–397.
Snyder, J. K., Fessler, D. M. T., Tiokhin, L., Frederick, D. A., Lee, S. W., and Navarrete,
C. D. (2011). Trade-offs in a dangerous world: Women’s fear of crime predicts
preferences for aggressive and formidable mates. Evolution and Human Behavior,
32, 127–137.
Steiger, J. H. (1980). Tests for comparing elements of a correlation matrix. Psychological
Bulletin, 87, 245–251.
Sugiyama, L. (2005). Physical attractiveness in adaptationist perspective. In D. M. Buss
(Ed.), The handbook of evolutionary psychology (pp. 292–343). New York: Wiley.
Swami, V., Smith, J., Tsiokris, A., Georgiades, C., Sangareau, Y., Tovée, M. J., and
Furnham, A. (2007). Male physical attractiveness in Britain and Greece: A cross-
cultural study. Journal of Social Psychology, 147, 15–26.
Swami, V., and Tovée, M. J. (2005). Male physical attractiveness in Britain and Malaysia:
A cross-cultural study. Body Image, 2, 383–393.
Takahashi, C., Yamagishi, T., Tanida, S., Kiyonari, T., and Kanazawa, S. (2006).
Attractiveness and cooperation in social exchange. Evolutionary Psychology, 4,
315–329.
Tovée, M. J., Maisey, D. S., Emery, J. L., and Cornelissen, P. L. (1999). Visual cues to
female physical attractiveness. Proceedings of the Royal Society B, 266, 211–218.
Tovée., M. J., Reinhardt., S., Emery, J. L., and Cornelissen, P. L. (1998). Optimum body-
mass index and maximum sexual attractiveness. The Lancet, 352, 548.
Trivers, R. L. (1972). Parental investment and sexual selection. In B. Campbell (Ed.),
Sexual selection and the descent of man, 1871-1971 (pp. 136–179). Chicago:
Aldine.
Van Lange, P. A. M., Otten, W., De Bruin, E. M., and Joireman, J. A. (1997). Development
of prosocial, individualistic, and competitive orientations: Theory and preliminary
evidence. Journal of Personality and Social Psychology, 73, 733–746.
Zaatari, D., and Trivers, R. (2007). Fluctuating asymmetry and behavior in the ultimatum
game in Jamaica. Evolution and Human Behavior, 28, 223–227.
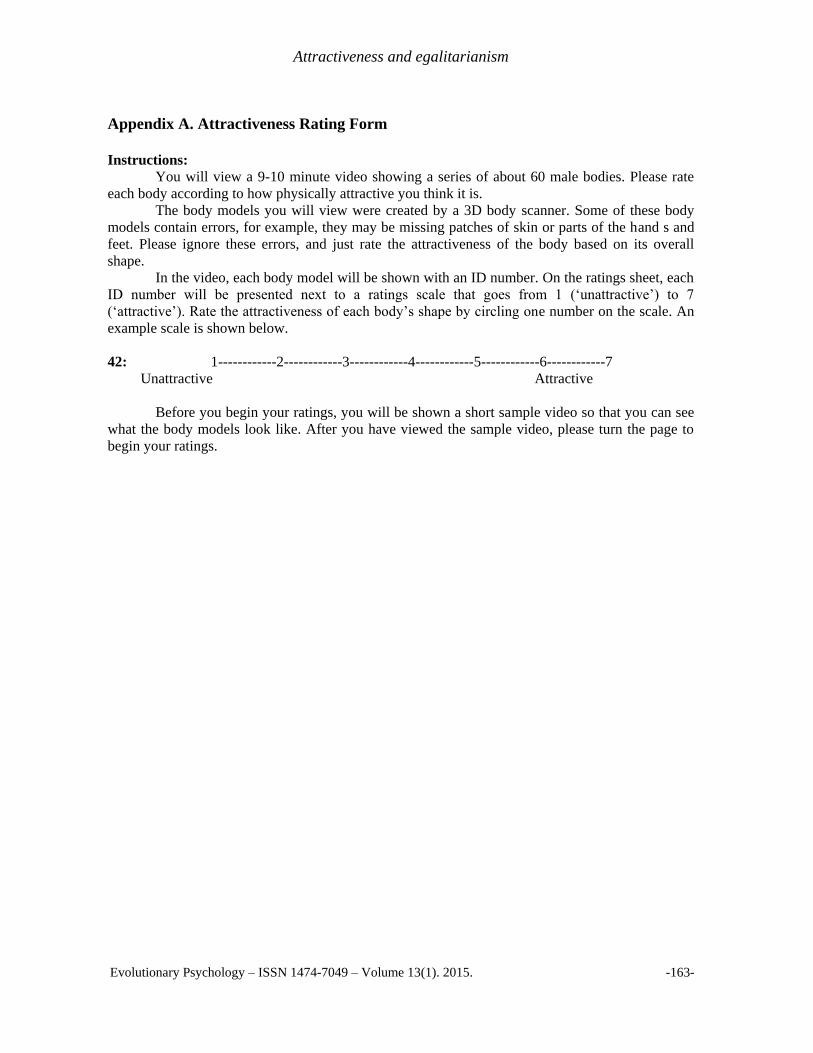
Attractiveness and egalitarianism
Evolutionary Psychology – ISSN 1474-7049 – Volume 13(1). 2015. -163-
Appendix A. Attractiveness Rating Form
Instructions:
You will view a 9-10 minute video showing a series of about 60 male bodies. Please rate
each body according to how physically attractive you think it is.
The body models you will view were created by a 3D body scanner. Some of these body
models contain errors, for example, they may be missing patches of skin or parts of the hand s and
feet. Please ignore these errors, and just rate the attractiveness of the body based on its overall
shape.
In the video, each body model will be shown with an ID number. On the ratings sheet, each
ID number will be presented next to a ratings scale that goes from 1 (‘unattractive’) to 7
(‘attractive’). Rate the attractiveness of each body’s shape by circling one number on the scale. An
example scale is shown below.
42: 1------------2------------3------------4------------5------------6------------7
Unattractive Attractive
Before you begin your ratings, you will be shown a short sample video so that you can see
what the body models look like. After you have viewed the sample video, please turn the page to
begin your ratings.
Attractiveness and egalitarianism
Evolutionary Psychology – ISSN 1474-7049 – Volume 13(1). 2015. -164-
Appendix B. Dictator Game Instructions
Economic game instructions: The choices you make in this game will have real economic
consequences for yourself and /or others. Please read these instructions carefully so that you
understand how this game works.
Two players, Player A and Player B, play this game. Player A receives £5 from the
researchers, and he/she chooses how much of this £5 to share with Player B. Player A can give
Player B any amount (in increments of 50p), from nothing at all (£0) to the full £5. Whatever
amount Player A gives to Player B, Player B gets to keep; whatever amount Player A does NOT
give to Player B, Player A gets to keep for him/herself.
You will play the role of EITHER Player A or Player B in this game. Your role will be
determined by a coin toss, so you will have a 50% chance of playing either role. Before this coin
toss occurs, you will decide how much money you would give to Player B, if you were to end up in
the Player A role. If you do end up in the Player A role, then your earnings will be determined by
your decision about how much you would give. However, if you end up in the Player B role, then
your earnings will be determined by the amount that a previous study participant (chosen at rand
om) decided to share with Player B. Further, your decision about how much you would give may
end up determining the earnings of a future Player B in this study.
If those instructions are NOT clear, please ask the researcher for clarification. If they ARE
clear, then please answer the question below. When you are done, please notify the researcher.
In the role of Player A, I would give the following amount to Player B (circle one): £0.00 £0.50 £1.00 £1.50 £2.00 £2.50 £3.00 £3.50 £4.00 £4.50 £5.00

Attractiveness and egalitarianism
Evolutionary Psychology – ISSN 1474-7049 – Volume 13(1). 2015. -165-
Appendix C. Equity Sensitivity Items
Instructions: Each of the following statements has two possible conclusions. For each statement,
imagine that you have 10 points that you can distribute between the two conclusions. Distribute
MORE of these points to the conclusion that you think BETTER describes your attitude. You can
give between 0 and 10 points to each conclusion, as long as the total points for both conclusions
is equal to 10.
1. In any social group I might be a member of, it would be more important for me to:
(a) get from the group
_________
(write a number 0-10) } combined total must = 10 (b) give to the group
__________
(write a number 0-10)
2. In any social group I might be a member of, it would be more important for me to:
(a) help others
_________
(write a number 0-10) } combined total must = 10 (b) watch out for my own good
__________
(write a number 0-10)
3. In any social group I might be a member of, I would be more concerned about what I:
(a) received from the group
_________
(write a number 0-10) } combined total must = 10 (b) contributed to the group
__________
(write a number 0-10)
4. In any social group I might be a member of, the hard work I would do should benefit:
(a) the group
_________
(write a number 0-10) } combined total must = 10 (b) me
__________
(write a number 0-10)
5. In any social group I might be a member of, my personal philosophy in dealing with the
group would be:
(a) If I don’t look out for
myself, nobody else will
_________
(write a number 0-10) } combined total must = 10 (b) it’s better for me to give
than to receive
__________
(write a number 0-10)

Attractiveness and egalitarianism
Evolutionary Psychology – ISSN 1474-7049 – Volume 13(1). 2015. -166-
Appendix D. Egalitarianism Rating Form
INSTRUCTIONS: Some people have more selfish and competitive personalities, and others
have more altruistic and egalitarian personalities. (Note that ‘altruistic’ means ‘concerned with
the well-being of others’, and ‘egalitarian’ means ‘in favour of social equality’). We can define
these personality types in the following ways: SELFISH and COMPETITIVE people tend to focus on their own needs and desires (as
opposed to the needs and desires of other people), and are interested in winning
competitions against others so that they can come out on top. They are not opposed to high
social inequality in society, because inequality is the result of competition (some people
win, some people lose), and they think that inequality as the result of competition is better
than full equality.
ALTRUISTIC and EGALITARIAN people tend to focus on the needs and desires of
other people (as opposed to their own needs and desires), and are not very interested in
winning competitions against others or in coming out on top. They are opposed to high
social inequality in society, because they think that inequality is wrong and that it should be
reduced as much as possible, and that full equality is better than inequality as the result of
competition.
In this study, you will view a 9-10 minute video showing a series of about 60 (male/female)
bodies, and you will be asked to rate each (man/woman) based on whether you think (his/her)
personality in real life would be more selfish and competitive or more altruistic and egalitarian.
The body models you will view were created by a 3D body scanner. Some of these body
models contain errors, for example, they may be missing patches of skin or parts of the hand s and
feet. Please just ignore these errors.
In the video, each (man/woman )will be shown with an ID number. On the ratings sheet, each
ID number will be presented next to a rating scale that goes from 1 (‘selfish and competitive’) to 7
(‘altruistic and egalitarian’). Rate each (man/woman) by circling one number, indicating where you
think (he/she) would fall on the scale. An example scale is shown below.
42: 1------------2------------3------------4------------5------------6------------7 selfish and competitive altruistic and egalitarian
Before you begin your ratings, you will view a short sample video so that you can see what
the body models look like. After you have viewed the sample video, please turn the page to begin
your ratings.