boats are waking me crazy - worcester polytechnic institute · boats are waking me crazy: an...
TRANSCRIPT

Boats are Waking Me Crazy: An Analysis of Boat Traffic and Moto Ondoso in Venice
An Interdisciplinary Qualifying Project submitted to the faculty of
Worcester Polytechnic Institute in partial fulfillment of the requirements of the
Degree of Bachelor of Science
Submitted By: Alexander Bennett Samuel Hastings Stephen Petry Alexander Solomon Submitted To: Project Advisors: Professor Fabio Carrera Professor Frederick Hart
[email protected] sites.google.com/site/ve13boat/

2
AUTHORSHIP PAGE
The entire team contributed equally to the writing and editing of all sections of this project.

3
ACKNOWLEDGEMENTS
The team would like to acknowledge the following people for their help on our project.
Fabio Carrera – For his guidance and assistance throughout the duration of the project.
Fred Hart – For his guidance and support throughout the duration of the project.
Ben Lichtner – For his assistance in helping us create our app, use of the CityKnowledge
Console, and creating Venipedia pages.
Kyle Miller – For his assistance with QGIS, use of the CityKnowledge Console, creation of
logos, and creating Venipedia pages.
These people were crucial for the success of our project.

4
ABSTRACT
Over the past ten years, the number of boat trips being made in the Venetian canals
has grown substantially, and is expected to continue to rise in the future. This increase in boat
trips represents a major problem for the endurance of Venice, particularly its canal walls due
to the phenomenon called moto ondoso. Moto ondoso is the damage to canal walls caused by
boat wakes. There are varying opinions as to how much of canal wall damage is caused by
moto ondoso, however most can agree that at least 50% of wall damage can be directly
attributed to boat wakes.
This project sought to get a better understanding of the past and current levels of moto
ondoso in the canals, by applying the Moto Ondoso Index to COSES boat counts from the
past decade. The project then aimed to identify multiple ways in which the City of Venice
could reduce moto ondoso. The team identified these reduction methods through research,
and through observations of our own fieldwork.
The project concluded that there are four major ways the City of Venice can reduce
moto ondoso, and therefore canal wall damage. These methods include changes to the
physical shape of the boats, enforcement of the speed limits in the canals, implementation of
a Taxi Re-engineering project, and implementation of a Cargo Re-engineering project. In
total, if all of these recommendations were implemented, the team calculated that moto
ondoso in the canals would be reduced by 57%.

5
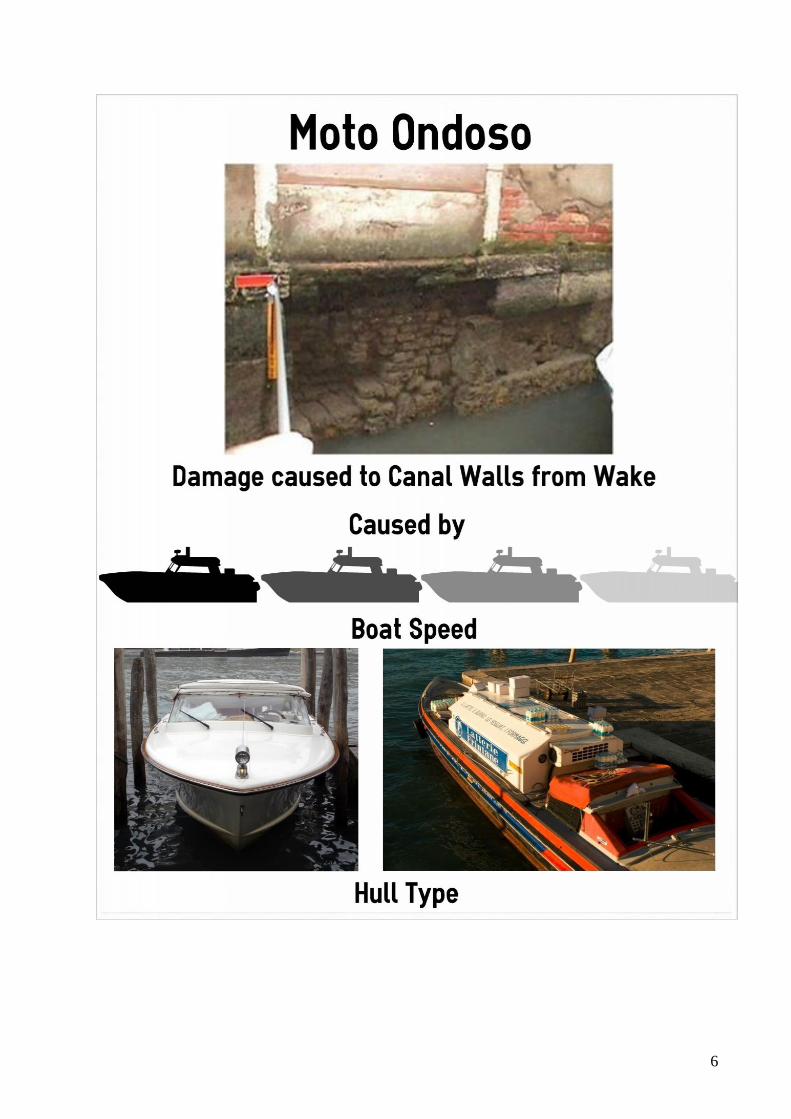
GRAPHICAL EXECUTIVE SUMMARY
6

7

8

9

10
TABLE OF CONTENTS
AUTHORSHIP PAGE: ........................................................................................................... 2
ACKNOWLEDGEMENTS .................................................................................................... 3
ABSTRACT .............................................................................................................................. 4
GRAPHICAL EXECUTIVE SUMMARY ............................................................................ 5
TABLE OF CONTENTS ...................................................................................................... 10
TABLE OF FIGURES: ......................................................................................................... 12
1. INTRODUCTION.......................................................................................................... 14
2 BOAT TRAFFIC IN VENICE ..................................................................................... 16
2.1 Traffic Regulations ............................................................................................................ 20
2.2 Boat Counts in Venice ....................................................................................................... 23
2.3 Analyzing Boat Traffic ...................................................................................................... 25
3. MOTO ONDOSO........................................................................................................... 30
3.1 Physics of Moto Ondoso ..................................................................................................... 31
3.2 Measurement of Moto Ondoso .......................................................................................... 31
3.3 Obtaining Average Boat Speed Values ............................................................................ 32
3.4 Applying Moto Ondoso Index to Traffic Data ................................................................ 33
3.5 Visual Tools for Moto Ondoso .......................................................................................... 35
4 REDUCING MOTO ONDOSO .................................................................................... 38
4.1 Physical Changes to Boats and Engines .......................................................................... 38
4.2 Using Traffic Regulations to Reduce Moto Ondoso ........................................................ 39
4.3 Taxi Re-Engineering.......................................................................................................... 40
4.4 Cargo Re-Engineering ....................................................................................................... 43
4.5 Economic Benefit ............................................................................................................... 57
APPENDICES: ....................................................................................................................... 60
Appendix A: Bibliography ............................................................................................................. 60
BOAT TRAFFIC APPENDICES ......................................................................................... 64
Appendix B: Italian 26 point plan ................................................................................................. 64
Appendix C: 26 point plan (rough translation) ........................................................................... 67
Appendix D: Station Data .............................................................................................................. 69
Appendix E: Canal Segment Data ................................................................................................ 69
Appendix F: How Data was Organized ........................................................................................ 69

11
MOTO ONDOSO APPENDICES ........................................................................................ 70
Appendix G: Boat Speed Data ....................................................................................................... 70
Appendix H: Boat Speed Data for Each Canal Segment ............................................................ 72
Appendix I: Boat Speed Graphs .................................................................................................... 74
Appendix J: Updated and Original Moto Ondoso Index Values ............................................... 76
Appendix K: Equations for Moto Ondoso Index ......................................................................... 77
Appendix L: COSES Turning Movements ................................................................................... 78
REDUCING MOTO ONDOSO APPENDICES ................................................................. 80
Appendix M: Store Data .............................................................................................................. 80
Appendix N: Dry Delivery Data .................................................................................................... 81
Appendix O: Refrigerated Delivery Data ..................................................................................... 82
Appendix P: MOBILIS Extrapolation Data ................................................................................ 83
Appendix Q: Zones Data ................................................................................................................ 84
Appendix R: COSES Straight-Line Distance Matrix .................................................................. 84
Appendix S: Current System Distance Traveled ......................................................................... 85
Appendix T: New System Distance Traveled ............................................................................... 86
Appendix U: Data for Venice Docks ............................................................................................. 87
Appendix V: Best Docks used for Map Shown in Figure 51 ....................................................... 89
Appendix W: Venipedia Pages for each Specific Dock ............................................................... 90
Appendix X: Sheets Used to Calculate Moto Ondoso Costs ........................................................ 92

12
TABLE OF FIGURES
Figure 1: Boats on The Grand Canal ....................................................................................... 16
Figure 2: Distribution of Boats in Venice ................................................................................ 17
Figure 3: Venetian gondolas .................................................................................................... 17
Figure 4: A Venetian Taxi ....................................................................................................... 18
Figure 5: Gondola Traffic ........................................................................................................ 19
Figure 6: Map of Venice speed limits ...................................................................................... 21
Figure 7: How Boat Counts are performed. ............................................................................. 24
Figure 8: When Boat Counts were taken ................................................................................. 25
Figure 9: Boat Traffic by Canal Segment ................................................................................ 25
Figure 10: Boat Trips made from 2001 to 2008 by Cargo, Taxi, Service, and Private boats. . 26
Figure 11: Boat Traffic Distribution 2009 ............................................................................... 26
Figure 12: Boat Traffic and Population in Venice ................................................................... 27
Figure 13: Projected growth of Boat Traffic and Population .................................................. 27
Figure 14: Example of a motion chart that is available online with the station data ............... 28
Figure 15: 2009 Campaign, boat counts by Hour .................................................................... 29
Figure 16: Ambulance Causing Moto Ondoso ........................................................................ 30
Figure 17: Canal Wall Damage................................................................................................ 30
Figure 18: Plot of Velocity vs Wake Amplitude ..................................................................... 32
Figure 19: Speed data taken in the Rio de Ca'Foscari ............................................................. 33
Figure 20: Boat Types Currently ............................................................................................. 34
Figure 21: Boat types following speed limit ............................................................................ 34
Figure 22: Moto Ondoso Index values..................................................................................... 34
Figure 23: Basic View of Moto Ondoso Visualizer................................................................. 35
Figure 24: Clicking on a segment ............................................................................................ 36
Figure 25: Moto Ondoso levels in different campaigns ........................................................... 36
Figure 26: Moto Ondoso app ................................................................................................... 36
Figure 27: M-Hull Shape ......................................................................................................... 38
Figure 28: M-Hull Ship ............................................................................................................ 39
Figure 29: Opening of Arsenale Canal .................................................................................... 41
Figure 30: Changed Route to Airport ...................................................................................... 42
Figure 31: Taxi app mockup .................................................................................................... 43
Figure 32: Current cargo system .............................................................................................. 43

13
Figure 33: Boats needed for San Luca ..................................................................................... 43
Figure 34: Traffic Congestion Survey ..................................................................................... 44
Figure 35: Finding Dock Survey.............................................................................................. 44
Figure 36: Trucks Headed to Warehouse................................................................................. 44
Figure 37: Delivery By Destination ......................................................................................... 45
Figure 38: Proposed Delivery Zones ....................................................................................... 46
Figure 39: Souvenir Shops on Island ....................................................................................... 47
Figure 40: Delivery Demand For Each Island ......................................................................... 48
Figure 41: San Silvestro Delivery Breakdown ........................................................................ 49
Figure 42: Delivery by Destination Zones ............................................................................... 50
Figure 43: Dock Animation ..................................................................................................... 51
Figure 44: Dock animation 2 ................................................................................................... 51
Figure 45: Single Cargo Boat in Current System .................................................................... 52
Figure 46: Single Cargo Boat in Proposed System .................................................................. 52
Figure 47: All Cargo Boats in Current System ........................................................................ 53
Figure 48: All Cargo Boats in Propopsed System ................................................................... 54
Figure 49: Map of all Venetian Docks ..................................................................................... 55
Figure 50: A map of the best docks for cargo boats. ............................................................... 56
Figure 51: Mockup of dock reservation app ............................................................................ 56
Figure 52: A canal wall undergoing repairs. ............................................................................ 57
Figure 53: Total reduction of Moto Ondoso ............................................................................ 59

14
1. INTRODUCTION
Cities around the world have been plagued by increased traffic. As cities are so
densely populated, there is a stronger need for more transportation options such as taxi and
public transit. In addition, increased population requires a corresponding increase in the
number of delivered goods. With more vehicles on the road, transportation times increase by
66% in some areas.1 There are cities that have implemented solutions by targeting specific
problems such as large cargo trucks. For example, commuting time during the morning
commute was reduced by 58 percent in Jerusalem by banning heavy cargo trucks from the
highway.2 These effects are exacerbated in places where a significant portion of the
population is not local.
An extreme example of a city where locals are outnumbered is Venice, Italy. Year
round, Venice averages 60 thousand visitors daily, which is larger than its resident
population.3 Unlike similar tourist cities, the only means of transport in Venice are by boat or
on foot. As a consequence, the cargo necessary to sustain these tourists is delivered by boat.
Tourists arrive to, travel through, and experience the city by boat. Before 1950, this was not
necessarily a problem; but the introduction of motor boats into the canals had unintended
consequences. The turbulence from these boats’ motors caused attrition of the canal walls.
This problem would be similar to the buildings on a street crumbling down as a cargo truck
passes.
Moto ondoso (wake damage) is damage to canal walls caused by motor boats in the
Venetian canals. The large number of tourists entering Venice creates a lot of stress on the
canal infrastructure due to the constant use of taxis, public transportation, and cargo boats.
Because of the high demands of tourists, 46% of all boats in Venice are taxis or public
transport, and an additional 36% are cargo vessels.4 The moto ondoso problem is
compounded by the fact that the taxi and cargo systems are not operating efficiently. For
instance, taxi drivers spend 57% of their time traveling without passengers or simply idling
their engine.5 Even worse, the current cargo system uses 96 boats where only 3 are
1 "Moscow traffic rated worst in world," (2013).
2 Ron Friedman, "Rush Hour Truck Ban Proves Successful," (2010).
3 Catherine Eade, "Venice tourist warning: 'Cap Visitor Numbers to Avoid Environmental Catastrophe'," The
Daily Mail 2011. 4 Giovanni Caniato, Venezia la città dei rii (Cierre, 1999).
5 Robert Accosta, "Re-engineering the Venetian Taxi Transportation System: Efficiency Improvements That
Reduce Moto Ondoso," (2006).

15
necessary.6 In response to public interest in preserving the canals, Venetian policymakers
have set regulations to reduce moto ondoso. Currently, new regulations are being added due
to international reactions after a German tourist was killed in a boat accident. Joachim Vogel,
a professor of criminal law, was riding in a gondola with his family when they were hit by a
water bus. In order to safeguard against future accidents, Venetian policy makers will be
implementing a 26 point plan that will change some aspects of boat traffic in Venice.7
Efforts by Venetian policymakers and WPI IQP groups have made progress towards
solving the traffic situation in Venice, but work remains to be done to reach a viable solution.
Data provided by previous IQP groups is substantial and incredibly useful, but has not been
consolidated. This makes it difficult to access or visualize large trends. Many of the
recommendations proposed to Venetian policymakers by previous IQP teams have not been
implemented. However, Venetian policymakers have set up speed limits to help limit the
creation of moto ondoso in the canals. These regulations will be supplemented by the
upcoming 26 point plan. While a major step forward, the 26 point plan needs to be analyzed
to estimate its effectiveness and to identify areas of improvement. One such area of
improvement could be to utilize available technologies to reduce moto ondoso. As the next
group taking on the moto ondoso challenge, we will build on the work of our predecessors,
while seeking novel solutions to the problem.
For the 25th
anniversary of the Venice Project Center, this IQP will assist Venetian
policymakers to produce a framework for reducing the impact of boat traffic on the city in
terms of wakes and congestion. To achieve this mission, we laid out specific objectives that
will guide us to our end goal. We will start off by analyzing and updating boat traffic counts.
With those counts, we will then relate boat traffic to wake impact. Once we have related boat
traffic to wake impact, we will explore ways to reduce boat impact. Our project will
culminate in the quantification of the economic benefits of a reduction in moto ondoso.
6 Karolyn Amlaw et al., "Optimization of Cargo Boat Deliveries Through the Inner Canals of Venice," (1997).
7 Tom Kington, "Venice Tourist's Gondola Death Prompts Canal Crackdown," The Guardian 2013.

16
2 BOAT TRAFFIC IN VENICE
Because Venice was built on a series of islands in a lagoon, the only logical form of
effective transportation is by boat. Traditionally, this required hiring a personal gondolier,
even for short trips. Mark Twain once described Venice as a place with “no dry land visible
anywhere, and no sidewalks worth mentioning; if you want to go to church, to the theater, or
to the restaurant, you must call a gondola. It must be paradise for cripples, for verily a man
has no use for legs here.”8 This gondola-driven society lasted well into the 19
th century, until
the advent of a new type of vessel. In the 1880’s came the first steam-powered boat, the
vaporetti (water bus), bringing along with it more efficient and easier travel in the city. This
efficiency increased again around 1950 with the wide spread introduction of gas-powered
boats in Venice.9 Since that time, gas powered boats have come to dominate boat traffic in
Venice. Gas powered boats are now used for almost all types of travel, with the exception of
scenic gondola rides.
All boats in Venice can be separated into a few general categories; cargo boats, taxi
boats, vaporetti (water busses), gondolas, private boats, or service boats. Seen in Figure 1 are
two gondolas in the background, a large vaporetto, and
a water taxi in the foreground, and their relative sizes.
In terms of the breakdown of traffic, taxis contribute
roughly one third, cargo contributes another third, while
all other boats make up the final third.10 The two main
reasons for these categories, and the deciding factors
as to which category a boat belongs to, is shape and
function. The length, width, height, and hull shape
are major contributors to how much wake energy the boat dissipates. For example,
gondolas have a flat hull shape, and produce little to no wake. Function also plays a major
role in wake production. Taxis, for instance, often travel at high speeds in order to satisfy
their clients. Thus producing more wakes than the same shape boat being used for a function
that does not require high speeds. A 2008 WPI IQP studying boat traffic found that these
8 Thomas F. Madden, “Venice: A New History”
9 Dominic Standish, “Venice in Environmental Peril?: Myth and Reality”
10 Li, Lester, “Turning Traffic Around: An Analyis of Boat Traffic in Venice and its Environmental Impacts”
Figure 1: Boats on the Grand Canal.

17
percentages are not constant throughout the city, as seen in Figure 2.11
One boat type that is
predominant in some areas of Venice is the gondola, represented by grey.
Figure 2: Distribution of Boats in Venice
Traditional boats were designed to accommodate the shallow inner-city canals as well
as the mud and sand filled banks. To work with the local environment, traditional boats were
designed to have a flat bottom as well as a shallow hull.12
One traditional boat that still has a
presence in Venice is the gondola seen in Figure 3.13
Since the advent of motorized boats, the gondola has
become one of the well-known traditional boats in
Venice. Gondolas are as famous for their unique
build as they are as a symbol of Venice. In the past,
gondolas were used for transporting people short
distances in Venice where speed and maneuverability
were concerns. Now, gondolas are built to take
tourists around leisurely, for short distances in
Venice. This has resulted in gondolas being built for comfort instead of being built for speed
and maneuverability.14
Another boat that has a noticeable presence is the taxi represented by yellow in Figure
2. Taxis are an important source of transportation in Venice. Taxis are made from either
wood or fiberglass. A typical Venetian taxi boat has the ability to seat around ten to eighteen
passengers and provides transportation through the Venetian islands and to the airport.15
Dimensions of a typical taxi boat are 9 meters long, 2.2 meters wide, and 1.3 meters tall, as
11 Catanese, Chris, “Floating Around Venice: Developing Mobility Management Tools and Methodologies in
Venice” 12
Sean Candlish, Craig Shevlin, and Sarah Stout, "The traditional boats of Venice: Assessing a maritime
heritage," Worcester: Worcester Polytechnic Institute (2004). 13
http://venice2point0.org/gallery/v/wallpapers/KHM_1912+1024.jpg.html 14
Candlish, Shevlin, and Stout, "The traditional boats of Venice: Assessing a maritime heritage." 15
Conzorsio Motoscafi Venezia
Figure 3: Venetian gondolas

18
seen in Figure 4. Engines that are commonly seen on the taxis have a range of 100 to 200
horsepower and run off diesel fuel. 16
Figure 4: A Venetian Taxi17
The taxi system in Venice is responsible for transporting many of the daily tourists in
and around the city. In fact, the need for transportation in Venice is so large that taxis and
public transportation boats account for 40% of all boats. The individual taxi drivers are
grouped together into consortiums, the largest containing 98 taxis. The Provincial di Venezia
Settore Mobilita e Transporti regulates the taxi licenses in Venice, and also determines the
number of taxis required at each of the 13 taxi stands around the city. By doing so, the city
ensures each consortium of taxi drivers receives an equal share of taxi business. The taxi
system, however, is very inefficient. For example, due to the current system, and breakdown
of communication between taxi companies, only certain taxis may pick up passengers in
certain areas. Most of the time, a taxi driver must drop off their passengers, and then drive
back to the stand at which they are allowed to work. This results in a large number of empty
trips for taxis.18
As the Venetian economy spread out onto the many islands of the city, the logistics of
delivery became more complicated. Each store now requires deliveries of specified items at
specified times. Also, the delivery to a particular store must first be made to the island that
store is located on. This is because delivery workers often cannot transport large carts up and
over the bridges connecting the islands. To fill these needs, the Venetian cargo system is
designed to make deliveries based on item. This system has many inherent inefficiencies.
First and most profound, each island requires dozens of separate deliveries for the
stores on that island to get the various goods they require. A previous WPI study focusing on
the Sestiere of San Marco, found that the island of San Luca received deliveries from 96
16 Accosta, "Re-engineering the Venetian Taxi Transportation System: Efficiency Improvements That Reduce
Moto Ondoso." 17
Ibid. 18
Accosta, Robert “Re-engineering the Venetian Taxi Transportation System”

19
Figure 5: Gondola Traffic
different boats on a given day. This exemplifies extreme inefficiency because only three
boats could have supplied all of the cargo delivered to the island of San Luca that day. This
increase in efficiency could have been accomplished by restructuring the cargo delivery
system, which will be discussed later.19
Gondolas are typically used by tourists to travel around Venice. Gondolas begin their
trips at heavily tourist populated
spaces, and then move through canals
in the surrounding area. Gondolas run
from approximately 10 in the morning
to 10 at night. Gondolas contribute to
traffic by occasionally stopping so that
tourists can get a better view of the
city.20
As can be seen in Figure 5, this
often leads to congestion.
As with any city, Venice encounters several problems as a result of traffic. The most
obvious of these problems is congestion and increased traffic time. Another city with similar
congestion problems is New York City. As a result of this congestion, the average
commuting time in New York City is 38 minutes. The commuting times in Venice and New
York cannot be compared directly however, due to the fact that Venice has 130 times fewer
citizens, and about 100 times less land area. Based on this, it would be reasonable to guess
that commuting time in Venice would be orders of magnitude less than in New York.
Surprisingly, the average commuting time in Venice is very close to that in New York, at 31
minutes.21
Another, less obvious problem caused by increased traffic levels, may be one that is
unique to Venice. Because the canals of Venice serve as the roads, there is the added problem
of the destruction caused by the wakes of passing boats. The structural damage caused by this
phenomenon is discussed later, but the cultural impact is another issue. The onset of new
motor boats in Venice undoubtedly had positive effects on the economy, but there are also
numerous negative effects. The most recent example of this is the increase in cruise ship
dockings in Venice. “Defenders of the ships say 5,000 local families are supported by the
19 Karolyn Amlaw, “Optimization of Cargo Boat Deliveries Through the Inner Canals of Venice”
20 David Chiu, Anand Jagannath, and Emily Nodine, "The Moto Ondoso Index: Assessing the Effects of Boat
Traffic in the Canals of Venice" (Worcester Polytechnic Institute, 2002). 21
Alosio, Christopher, “Venetian Mobility on Land and Sea”

20
jobs” provided by the many tourists arriving on cruise ships every day. Those opposed to the
ships cite the hydrodynamic effects caused by the ships’ passing. A 2010 WPI IQP found that
as the huge ships pass the city, some canal depths drop by an average of 11 centimeters, and
the speed of the water flowing through the canals increases by 57%.22
The dispute between the people advocating for the economic benefit of the boats, and
the people citing the adverse effects came to a head on September 21st 2013. 50 protesters
dove into the Guidecca canal in an attempt to stop over 35,000 tourists from arriving on 12
cruise ships.23
This most recent protest symbolizes the tension between Venice and non-
traditional boats that dates back to 1881 with public outcry over the first steamboats on the
Grand Canal.24
The city of Venice and its inhabitants are at the same time dependent on the
economic stimulus provided by new kinds of boats, and fighting to stop the accompanying
destructive forces.
As tourism in Venice reaches nearly unsustainable levels, the traffic system in the city
is also strained to similar levels. The thousands of tourists flocking to the city everyday
require a specific infrastructure to provide services, souvenirs, food to eat, and means of
transport, otherwise they will stop visiting, and the Venetian economy will collapse. The need
for tourist related stores has resulted in a 229% increase in the number of tourist shops from
1976 to 2007.25
To support this economic shift, more taxis, public transportation, and cargo
boats are necessary. A 2000 study by COSES (Consortium for Research and Educational
Training) concluded that combined, these boats make roughly 25,000 trips each day.26
2.1 Traffic Regulations
The Provincial di Venezia Settore Mobilita e Transporti, is the branch of the Venetian
government that regulates traffic. Regulations are classified by di linea (by line) and non di
linea (not by line). Line transportation includes all scheduled boats such as ACTVs and not
by line transportation is a category that consists of: taxis, gondolas, and charter boats.27
Speed
limits, as seen in Figure 6, are based on a number of parameters: boat type and location.
22 Shane Bellingham, “Cruise Control”
23 Tom Kington, http://www.telegraph.co.uk/news/worldnews/europe/italy/10326417/Protesters-dive-into-
Venices-canal-to-block-cruise-ships.html 24
New York Times, “STEAM-BOATS IN VENICE” 25
Aurilio, Laura “A Detailed Look at the Changing Venetian Retail Sector” 26
Standish, “Venice in Environmental Peril?” 27
“Settore Mobilita e Transporti.” Provincia di Venezia.
http://www.trasporti.provincia.venezia.it/serv_pubbl_ndl/terra/trnl_amv.html

21
Setting speed limits by boat type is to prevent boats with high wake hulls from causing more
wake damage.
Figure 6: Map of Venice speed limits
Changing speed limits by location is common enough around the world. This type of
regulation occurs in many cities speed limits are changed when driving in residential zones,
near construction, etc. Venice faces a unique situation where the regulations set in place are
not just to manage traffic but also to manage the effects of traffic on the environment.
Because boats have an impact on the canals of Venice, they are prohibited from consciously
producing moto ondoso. Boats are also prohibited from driving in proximity of work that is
being done to restore buildings and foundations.28
Regulations have been set to help reduce
the impact of traffic on the city, but with any city these regulations are at times not followed.
Taxis abide to regulations that manage where each taxi is allowed to stop, the amount
a taxi driver can make, and how fast a taxi can drive. There are 13 taxi stops in the city, the
amount of taxis that will be at each stop is decided by separating between the cooperatives
and consortiums. There are 219 licensed taxis, and each is either an individual owner or
involved in a consortium. The largest consortium, Consorzio Motoscafi Venezia, has 98 taxis,
as of 2006, which is about 44% of the taxis in Venice.36
The reason taxi drivers are assigned
locations is to prevent competitive pressures from de-equalizing the taxi system. The taxi
28 “Settore Mobilita e Transporti.” Provincia di Venezia.
http://www.trasporti.provincia.venezia.it/serv_pubbl_ndl/terra/trnl_amv.html

22
fares are currently decided using a meter, in 2006 the meter started off at 8.70 euro, and then
added 1.30 euro every minute as the trip progressed. The amount of money a taxi driver can
make is decided by the aforementioned assignment of taxis to a particular location. The
different consortiums have their own methods of assigning a taxi to a location. For instance,
the Consorzio Motoscafi Venezia assigns taxis based on dividing the total number of taxis
into 16 teams. Each team has a total of 6 taxis. The teams are assigned to 16 locations around
Venice and then are cycled with a period of 16 days. Taxis located at San Marco airport
follow a similar system and at the end of the day pool their money together to equalize the
pay each makes.
Cargo traffic in Venice makes up approximately 25% of all traffic in Venice.29
Cargo
is typically organized into two types. There is Conto Proprio (their own) which is used to
describe cargo boats that are owned by the companies that they deliver to. It is considered
illegal for these boats to deliver to other stores. Then there is Conto Terzi (literal translation:
behalf of third parties or others), these type of boats legally transport goods for third parties.
These boats can then be separated into the different types of cargo that they deliver. There are
three main types, non-refrigerated, refrigerated, and unit loads.
Any individual that wants to become a taxi driver must first fulfill three conditions.
Applicants cannot have been sentenced to jail time for crimes against patrimony, public faith,
public order, or industry and commerce. An applicant must show some sort of professional
aptitude usually through the form of an apprenticeship. Finally an applicant must pass a
written examination encompassing all knowledge that is required to pilot a water taxi with a
score of at least 70%.30
The city of Venice only allows a specific number of taxi licenses,
which is another means of regulating taxis.
Within Venice if a boat driver wants to work in the cargo industry there are six
licenses that are available. Five of them are mandatory; the first registers the company with
the Chamber of Commerce. The second license is a certification showing that the driver is
qualified to operate his vehicle. The third license is a shipping license specific to boat drivers
who travel in internal waters. The fourth license handles plates and registration of the boat
and the fifth license is a permit to park the boat in the city overnight and it specifies which
29 Lester Li et al., "Turning traffic around -- an analysis of boat traffic in Venice and its environmental impacts,"
In Technology and Environment. (Worcester, MA: Worcester Polytechnic Institute,, 2008),
http://www.wpi.edu/Pubs/E-project/Available/E-project-122107-161101/. 30
ACTV S.p. A. ACTV. 2006 [cited September 9 2006]. Available from
http://www.actv.it/english/azienda.php?pagina=storia.

23
parking spot is to be used. The sixth license is only for those boats that are going to operate in
conto terzi.31
In order to maintain the regulations developed by the city of Venice there must be
some way to enforce those regulations. The tools that are used to enforce these regulations
change depending on which regulation is being enforced.
Enforcement of regulations in the canals is done by two separate organizations. The
coast guard enforces the lagoon, the canal between Giudecca and Venice, and the Grand
Canal; the jurisdiction of the Venetian police is the rest of the Centro Storico. These different
jurisdictions create loopholes that boat drivers can use to their advantage. The regulation of
people transport is an issue but it is only one piece of the puzzle.
The death of a German tourist, a professor Joachim Vogel, has caused an international
reaction to the traffic conditions in Venice. Professor Vogel “was taking a tour with his wife
and three children on August 17th
when the gondola they were in was crushed against a dock
by a reversing vaporetto”32
. The mayor of Venice announced a 26 point plan that will take
affirmative action to improve the conditions in the canals. Among these points are “drug and
alcohol tests for boat handlers, following reports that the gondolier involved in the fatal
collision had traces of cocaine and marijuana in his blood.”33
An original and translated
version of the 26 point plan is available in Appendix B and Appendix C.
2.2 Boat Counts in Venice
31 Jill Duffy et al., "Re-Engineering the City of Venice s Cargo System For the Consorzio Trasportatori
Veneziani Riuniti," (2001). 32
Kington, "Venice Tourist's Gondola Death Prompts Canal Crackdown." 33
Ibid.

24
Figure 7: How Boat Counts are performed.
In order to better quantify the amount of boat traffic in the city of Venice, a 1992 WPI
IQP developed a method for conducting and documenting accurate boat counts. Using their
method, data was
collected at various
intersections around the
city. To collect and
document the data, the
group took note of the
canal of entry to the
intersection, and which
canal it exited to. They
also recorded boat type,
time, number of
passengers, license plate,
and amount cargo, as
seen in Figure 7.34
These
traffic counts were performed at various locations, or intersections, around the city. At each
intersection, each canal segment was given a label, in order to record the turning movement
of the boat. After the system was developed and refined by WPI, it was taught to The
Consortium for Research and Education (COSES), in the hopes that they would perform
counts semi-annually for the foreseeable future.
The actual distribution of the ensuing boat counts can be seen in Figure 8. Despite the
fact that the counts were not performed in the winter and summer, which would be the ideal
counting times, the 15 separate boat counts have provided us with large amounts of data on
how boat traffic is distributed in the city. This data is vital to our project because it allows us
to visualize large traffic trends over the past decade, and also quantify the wake impact, or
Moto Ondoso, for previous years.
34 Balboa, Mark “Turning Traffic Around”

25
2.3 Analyzing Boat Traffic
First, the team will gather all previous data on boat counts in the City of Venice. This
data will be collected from databases created by former WPI IQPs, as well as COSES. All of
the turning movement data must then be gathered into one central database. Next, the data
must be organized by counting station, or intersection. In order to analyze this data by canal
segment, each canal must be associated with a specific turning movement at each
intersection. For more details about how boat traffic counts by turning movement are
performed, see Figure 9. Once this association is made, the number of boats that performed a
specific turning movement is equal to the number of boats that went through the
accompanying canal segment. It is also important to note that it is irrelevant whether a boat
was coming from, or exiting to, a canal segment, the net effect is the same: one boat in that
canal segment. Figure 9 displays COSES boat counts by turning movement, and pure volume.
The variable missing from this analysis is boat type.
Figure 8: When Boat Counts were taken
Figure 9: Boat Traffic by Canal Segment

26
The second step to analyze boat traffic in Venice is to further break down the traffic
by boat type. Because each boat was categorized into types during the actual counts,
acquiring the number of each type of boat in each canal segment requires us to essentially
bring along the boat type as we divide the traffic by canal segment. We can then gather
information on the specific number of each type of boat in each canal segment. Once the
team has the data organized by type of boat in each canal segment, the Moto Ondoso Index
becomes much easier to apply.
The COSES data shows an overall trend for increases in boat traffic. Figure 10 below
shows the trend in four different categories of boats. These are not the only categories of
boats that exist in the canals they are only the largest percentage.
Figure 10: Boat Trips made from 2001 to 2008 by Cargo, Taxi, Service, and Private boats.
These four different categories: Cargo, Taxi, Private, and Service are the types of
boats that also produce the most moto ondoso. The pie chart in Figure 11 shows the
distribution of boat traffic in 2009, which is the last time boat counts were recorded by
COSES.
Figure 11: Boat Traffic Distribution 2009

27
It was also discovered that boat traffic follows the same trend as the population in
Venice. Figure 12 compares the trends in tourism and boat traffic for the summer months
(August and September). These trends can then be projected outward to hypothesize how
many tourist and boat trips will be counted in the future.
Figure 13 shows that boat traffic trends and the population in Venice are increasing
together. If the current trend continues then by the summer of 2020 there will be
approximately 44000 boat trips made in a single day, this assumes all else being equal.
Figure 12: Boat Traffic and Population in Venice Figure 13: Projected growth of Boat Traffic and Population
Apart from identifying these trends the data that was made available by COSES was
organized. The raw data has been gathered and can be found in a single folder on the teams
google drive. Two other excel sheets were created in order to summarize the data. The first is
a summary of the boat traffic counts for 21 stations. The data contains information regarding
the station and counts that were made there. This included the total amount of traffic, traffic
by type (such as Cargo, Taxi, etc.), the peak hour of traffic, and the count of that hour. The
second excel sheet contains information regarding the total amount of traffic within a specific
segment of canal. The stations data set was uploaded to the console and will be used on the
website for interactive station data. The interactive station data will go on a map where the
user will be able to click on each stations icon and data on the station will pop up. Among the
data that will be made available will be a google motion chart. The motion chart in Figure 14
is a cumulative motion chart for the 21 stations that were used. It displays moto ondoso vs
Total Summer Boat Traffic. The color of each station is unique, and the size of each bubble

28
can be modified but currently depends on the amount of cargo traffic there was for that year.
Figure 14: Example of a motion chart that is available online with the station data
The boat traffic data that was provided by COSES was disorganized and for some
years incomplete. In order to process the data and display it using infographic tools it first
had to be organized. The raw data was collected and put in a single folder that is available
online and a summary of station and canal segment data was created in order to easily process
the information. For twenty-one individual stations the GPS coordinates for each station were
found allowing them to be placed on the interactive tool. Once this data was made available
online, further analysis was necessary in order to project boat traffic into the future.
In order to first establish that boat traffic would increase as time progressed it was
necessary to first relate boat traffic to tourism. According to the United World Tourism
Organization tourism in Europe in 2020 is supposed to increase to 717 million tourists35
. As
Venice is itself a city whose economy relies primarily on tourism a large percentage of those
tourists will most likely visit Venice at some point in time. Once establishing that tourism and
boat traffic follows the same trends it could then be assumed that boat traffic will increase
into 2020. Thus a linear estimate of the small sample size of boat traffic was made in order to
project the increases of tourism and boat traffic. The linear estimate projected that per year
there will be 883 more boat trips counted. According to the recorded distribution of boat
traffic in 2009, of these 883 boat trips, 221 of these trips will be from Cargo boats, 353 will
be taxi, and the other 309 boat trips will be made by Private, Service and Other types of
boats. The result of these projections is that by 2021, forty-four thousand boat trips will be
made within the Venetian canals. The increase in boat trips that were counted has a
corresponding increase in moto ondoso. Thus with time the traffic situation in Venice will
35 "Tourism 2020 Vision," http://www.unwto.org/facts/eng/vision.htm.

29
only get worse and the net result will be more maintenance costs for the canal walls. These
projections assume that nothing will be done to change the cargo and taxi systems to make
them more efficient.
The motion chart was formatted to display the four types of boat traffic per year, the
total moto ondoso per station and the total amount of traffic per year. This tool allows the
user to choose a station and visualize the type of traffic that is the most proliferate at these
stations. The motion chart is also extraordinarily multivariate. Meaning you can change the
setting of the chart to try and relate different variables with one another. For instance the
amount of Cargo and Taxi traffic could be set on the Y-axis and the X-axis.
Raw data was collected for the different COSES campaigns; each campaign has a
database associated with it. Several years were missing from the data we had available to us.
This would be the 2002 summer and 2003 spring and summer raw data files. Queries are
available for these seasons and years, but the data seems to be missing from our drive. Other
types of data that have been uploaded to the console include a summary of boat traffic
stations and canal segment data. The canal segment data was organized so that each canal
segment would have a total traffic volume associated with it. The canal segments were
broken up into which stations they were associated with. All of this data was sent to another
team as a supplement to the data that they possessed. Then it was uploaded to the
CityKnowledge Console.
For each station and each campaign the peak times in the traffic data were found. For
52% of the time the peak times were between 10:00 AM and 12:00 PM. Below is a graph
showing the peak hour for the 2009 campaign. As can be seen in Figure 15 the peak for boat
traffic occurs between 9:00 AM and 11:00 AM. Then it decreases heading into the afternoon.
Figure 15: 2009 Campaign, boat counts by Hour
`

30
3. MOTO ONDOSO
Moto ondoso, an Italian phrase literally
meaning “wave motion”, refers to the damaging
wakes produced by all types of motor boats, as seen
in Figure 16. This turbulence is the principal cause
of damage to the Venetian canals.36
Because moto
ondoso is only caused by motor boats, it was not a
problem before the 1950s. Since then, however, the
canals have been degrading faster than ever before.
Historically speaking, moto ondoso is a relatively
new phenomenon. The first motor boat was not created until the middle of 1886 and did not
become widespread for several decades after that.37
In a city with over 1500 years of history,
one hundred years is a blink of an eye.
Because Venice was a city built on a lagoon, boats were the natural way to get
around. Over time, the Venetians began modifying the natural and changing canals. These
modifications eventually became the canal system we know today. When constructing the
canal walls, the Venetians had a choice of several building materials. The two main materials
they used were brick and Istria stone, a type of limestone similar to marble. In most canals,
the Venetians used the Istria stone as a base, and then used bricks to extend the walls above
the waterline.38
For most of their history, the canals fared well
with this mix of materials. The introduction of motor
boats, however, revealed an issue. To begin with, the
water level in the canals has risen 23 centimeters
higher than it was in 1897 thus exposing the brick
sections of the wall to water.39
Additionally, brick,
unlike limestone, is porous. The turbulent saltwater
began to penetrate the bricks and, over time, erode
them as can be seen in Figure 17. As this brick is
36 "Insula Informa," ed. Insula (2000).
37 "Gottlieb Daimler Memorial in Bad Cannstatt," http://media.daimler.com/dcmedia/0-921-1303725-1-
1303019-1-0-0-0-0-1-11694-614318-0-1-0-0-0-0-0.html?TS=1302091862634. 38
Thomas F. Madden, Venice a New History (Penguin Group, 2012). 39
Insula, "Venice Preservation and Urban Maintenance," ed. Insula.
Figure 16: Ambulance Causing Moto Ondoso
Figure 17: Canal Wall Damage

31
eroded away, a larger surface area is exposed to the water accelerating the deterioration.
This decay is accelerated by the introduction of corrosive chemicals into the canal.
The main components here are sulfuric acid from the Mestre-Marghera industrial zone and
sewage from blocked sewer outlets. Sulfuric acid eats away at the stone of the canal, mostly
the limestone, and weakens internal support structures severely compromising the integrity of
the canal walls. When the outlets become blocked by sediment, sewage that would normally
flow freely into the canal is instead trapped in pipes inside the canal walls. From here, it
leeches into the surrounding stone weakening it. The industrial zone has been much less
active since the late 1970s, and the city has been doing a better job of regularly dredging the
canals, so sewage is becoming less of a problem. Unfortunately, much of the damage has
already been done; it is just a matter of time before the turbulence wears away those
weakened sections.40
3.1 Physics of Moto Ondoso
When a boat moves through the water, there are two sets of ripples that come off of
the boat. One set from the bow, and another set from the stern. The set from the bow, called
the wash, is the result of the boat pushing water out of the way as it moves. It is like the rush
of air you feel as a car drives by. The set from the stern, called the wake, is the result of the
motor churning up the water to move the boat. This is like the wind generated by a propeller
plane. As you can guess, the second of these two turbulences is the more energetic. Boats
displace a relatively small amount of water compared to the amount their engines must
displace to move the boat.41
All waves, whether in air or water, are alternating regions of higher and lower
pressure. When a boat is traveling through water, its motor churns the water and creates these
pressure waves. What we see on the surface as waves are the manifestations of this
underwater turbulence. If a boat is in open water, these waves can dissipate and their energy
does not damage anything. When confined in a canal, however, there is nowhere for the
energy to go but to be absorbed by the walls.
3.2 Measurement of Moto Ondoso
Determining the energy of a pressure wave is both very simple and incredibly
complex. The simplest way to measure it is to simply put a pressure sensor in the path of the
40 Chiu, Jagannath, and Nodine, "The Moto Ondoso Index: Assessing the Effects of Boat Traffic in the Canals of
Venice". 41
Ibid.

32
wave and take a reading.42
Unfortunately, this method would not work well in the canals.
The primary issue is that sensors must be deployed in an array. A pressure sensor takes data
at a single point, but the information needed is spread out over a wide area. Additionally,
because the canals are so narrow and shallow, the waves diffract and interfere with each other
so as to make point reading inaccurate.
An alternative to point measurements is to try to describe total energy of the wake.
This is what a 2002 IQP team did43
. They compared the speed of different boats to the
amount of energy they released into the
canal. The major factor in the energy of a
wake is its amplitude. As you can see in
Figure 18: Plot of Velocity vs Wake
Amplitude, this increased exponentially as
boat speed increases. From these energy
calculations, they created the Moto Ondoso
Index, a simple system that relates the type of
boat and speed to the energy contained in its wake.44
3.3 Obtaining Average Boat Speed Values
In order to see how moto ondoso has changed over time, we needed to know the
distribution of speeds for the various types of boats in Venice. We started by identifying
several different types of canals with different speed limits. As you can see in section 2.1,
there are two main speed limits in the interior canals in Venice, 7 km/h in the Grand Canal,
and 5 km/h elsewhere, as well as, 11 km/h zones on the outside of the city. In each of these
areas, we took data on the speeds of the five different types of boats included in the
MOBILIS data. From this, we got a general distribution of speeds that we could apply to the
boat count data.
Looking at the speed data, it is apparent that speeding is a problem. For example, as
shown in Figure 19, out of the 188 boats that speed data was taken in the Rio de Ca’Foscari,
all boats were going above the speed limit. Additionally, the only way for the city to reduce
42 Morgan Elise Gelinas, "Industrial Ships' Wake Propagation and Associated Sediment Resuspension in the
Venice Lagoon," (2011). 43
David Chiu, Anand Jagannath, and Emily Nodine, "The Moto Ondoso Index: Assessing the Effects of Boat
Traffic in the Canals of Venice" (Worcester Polytechnic Institute, 2002). 44
David Chiu, Anand Jagannath, and Emily Nodine, "The Moto Ondoso Index: Assessing the Effects of Boat
Traffic in the Canals of Venice" (Worcester Polytechnic Institute, 2002).
Figure 18: Plot of Velocity vs Wake Amplitude

33
moto ondoso for private boats would be by enforcing speed limits. This is because there are
other measures the city can take for cargo boats, taxis, and service boats because other rules
and regulations can be put in place that would reduce their moto ondoso.
Figure 19: Speed data taken in the Rio de Ca'Foscari
In order to be able to successfully quantify moto ondoso, there was a need for speed
data for each speed limit where boat traffic counts had been conducted. To get the speed of
the various boats, we timed how long it took the boats to pass through a fix length of canal.
As seen in Appendix G, we created a detailed form to note all of the travel time of boats. This
form served as the place to note the times of all boats that passed. Once the count was
completed, we used QGIS to measure the length of canal we had used. Next, we plotted the
data in an Excel spreadsheet, seen in Appendix H, which would convert the data into km/h.
Other speed data in Appendix I show that a vast majority of boats were also speeding in the
canal segments where we took data. With the sampling of data, we were able to prove that
speeding is a problem in Venice. Since moto ondoso increases exponentially with the speed
of a boat, speeding leads to an increase of moto ondoso. One way to reduce moto ondoso in
Venice would be to enforce existing speed limits that already exist.
3.4 Applying Moto Ondoso Index to Traffic Data
Once we got the distributions we needed, we applied them to the existing boat counts.
This allowed us to analyze the changes not only in boat traffic, but in the amount of energy as
well. We began by converting the turning movements recorded by the counts into boats per
canal. Additionally, we switched from the COSES designations to our own names for the
canal segments. For example, the maneuver COSES “612 Rio Novo (P. Roma)-Da:Stazione
ferroviaria- A: Scomenzera” actually is a turning movement from segment GRAN2 to
segment GRAN3. For a more complete listing of these maneuvers, please see Appendix L.

34
Once we had the data separated by boat type and canal segment, we applied our speed
distribution and then used the Moto Ondoso Index equations in Appendix K. We did not want
to apply Moto Ondoso Index at the speeds and then take the average because given the nature
of the Moto Ondoso Index, a small number of high outliers would be able to drastically
distort the final number. This gave us a complete picture of the moto ondoso when the boat
count was conducted. By doing this for all of the COSES boat counts, we were able to get a
better idea of how moto ondoso has changed. This also gave us a better tool to analyze
proposed modifications such as the Cargo Re-Engineering project.
3.4.1 Updated Moto Ondoso Index
When we updated the Moto Ondoso Index to account for the velocity of boats, we
gained a better picture of which boats are contribute the most to the moto ondoso in the
canals. As you can see in Appendix J, the new Moto Ondoso Index values are much higher.
In Figure 20, you can see that in the smaller canals cargo boats produce the most moto
ondoso, but in larger canals, taxis produce more moto ondoso. This is due partially to the
different characteristics of the boats themselves, but also due to the fact that the different
types of boats travel at different speeds. For comparison, you can see in Figure 201 what the
Moto Ondoso Index values would be if boats were traveling at the speed limits. As you can
see, these values are much lower than what they are at the actual speeds. Another interesting
note is that, at these speeds, the taxi has the lowest moto ondoso of all these boats.
Figure 20: Boat Types Currently Figure 21: Boat types following speed limit
3.4.2 Historical Traffic Data
The most obvious thing that can be seen
from this data is that moto ondoso has been
increasing. As seen in Figure 22 Moto Ondoso
Index value for September 2009 is 10,388,080
as compared with 6,924,022 in August 2001.
This is an increase of 50%. Compared with
Figure 22: Moto Ondoso Index values
35
October 2001, the lowest value excluding March 2005, September 2009 is an increase of
123%, more than double.
3.5 Visual Tools for Moto Ondoso
There are many things we were able to do with this new data. The main one was the
creation of an interactive tool to visualize levels of moto ondoso45
. This tool allowed us to
visualize historical levels of moto ondoso from all of the COSES campaigns, as well as to
examine the effects of various proposed reductions such as fully enforcing the speed limits,
or implementing the cargo re-engineering projects. A full discussion of these reductions is in
section 4.
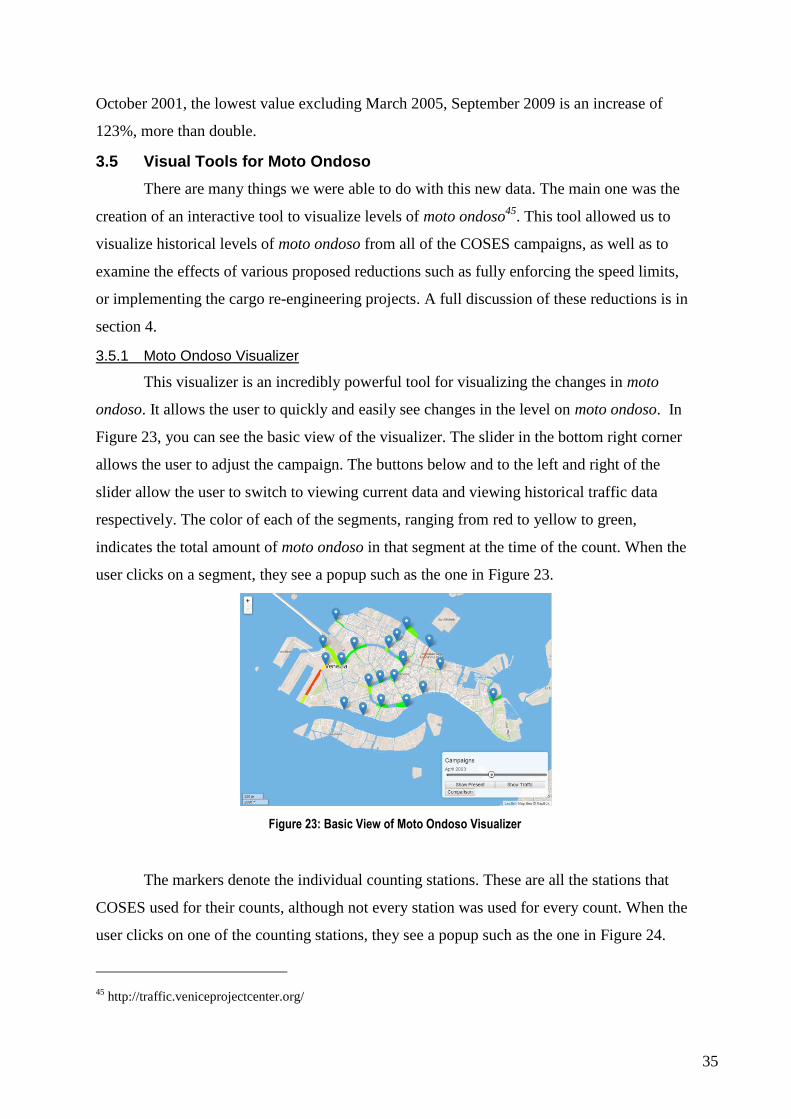
3.5.1 Moto Ondoso Visualizer
This visualizer is an incredibly powerful tool for visualizing the changes in moto
ondoso. It allows the user to quickly and easily see changes in the level on moto ondoso. In
Figure 23, you can see the basic view of the visualizer. The slider in the bottom right corner
allows the user to adjust the campaign. The buttons below and to the left and right of the
slider allow the user to switch to viewing current data and viewing historical traffic data
respectively. The color of each of the segments, ranging from red to yellow to green,
indicates the total amount of moto ondoso in that segment at the time of the count. When the
user clicks on a segment, they see a popup such as the one in Figure 23.
The markers denote the individual counting stations. These are all the stations that
COSES used for their counts, although not every station was used for every count. When the
user clicks on one of the counting stations, they see a popup such as the one in Figure 24.
45 http://traffic.veniceprojectcenter.org/
Figure 23: Basic View of Moto Ondoso Visualizer

36
Figure 24: Clicking on a segment
The user is not just limited to viewing on campaign at a time. The bottom button
below the slider brings up a split view. This can show two campaigns side by side. This is
demonstrated in Figure 25 where you can see the moto ondoso data from October 2001
alongside the data from October 2002. This is useful because it not only allows a user to two
campaigns side by side, but also to see how reductions on the current level of moto ondoso
compare with past measurements.
Figure 25: Moto Ondoso levels in different campaigns
3.6.2 Moto Ondoso App
In addition to looking back at moto ondoso has changed in the past, we would like to
see how it will change in the future. To this end,
we recommend that a future IQP create the
Moto Ondoso App. This app would function in
two parts. The first part is a smartphone
application that you can see in Figure 26 and the
second is a web based visualization tool.
The smartphone app would be very Figure 26: Moto Ondoso app

37
similar to the current StreetBump app developed for Boston. The user would start the app
when they entered a boat. As the boat traveled, the app would record accelerometer readings
and track the user’s path using GPS. When they pressed the stop button, the phone would
upload the data and GPS path to a central server. In order to make sense of the data, the
central server would have to do some simple processing to determine the level of moto
ondoso associated with the readings. This would most likely be related to the integral of the
net acceleration, but field testing would need to be carried out to determine the exact method.
The web visualizer would be similar to Venice Noise46
. As many users contribute
readings to the site, it would be able to build up a heat-map of moto ondoso. Ideally, the site
would allow users to view data based on day, time, and date. On top of this, the site may be
able to incorporate data from the Centro Maree. The Centro Maree is an organization that
operates several monitoring stations in the lagoon. These stations record data that should be
able to be used to roughly calculate the level of moto ondoso.
46 http://www.venicenoise.org/

38
4 REDUCING MOTO ONDOSO
Moto Ondoso remains a very significant problem in the Venetian canals, and has been
increasing over the past decade. If left unchecked, Moto Ondoso will continue to destroy the
canals of Venice, costing millions in repairs. For this reason, it is not just enough to quantify
Moto Ondoso, we must also investigate ways to reduce it. In this chapter, our team will
discuss research we have done on various ways to reduce Moto Ondoso. We will also discuss
how we planned to test these methods in Venice. Finally we will discuss the actual results
and efficiencies of these different methods.
4.1 Physical Changes to Boats and Engines
Because the physical shape of the boat and engine output are major factors in the
creation of wakes, changing the way the boats and
engines interact with the water can drastically reduce
moto ondoso.
The M-Hull is a new hull shape designed by
the Mangia Onda (Wake Eater) Company to reduce
wake energy. The new hull shape is markedly
different from the typical “V” shaped hull, as can be
seen in Figure 27. The hull reduces wake energy by using the side skirts to force the wake
produced from the center section back under the boat, as opposed to releasing it out the sides.
The benefit of forcing the wake back under the boat is two-fold. First, the wake does not
disperse out to the side of the boat, potentially causing damage. Second, as the wake is forced
back under the boat, it is condensed in spiraling channels, and helps to lift the boat itself
higher out of the water, also known as planning. When planning, the moto ondoso produced
is greatly reduced.47
Besides changing the shape of the boat, changing the type of engine can also
positively affect moto ondoso. The largest benefit of hybrid and electric engines is that while
idling, they produce no wakes. A typical gas engine must continue running even at idle,
producing extra wakes. Another benefit of electric engines is the reduction in weight. This
reduction in weight causes the boat to sit higher in the water, displacing less water, causing
fewer wakes.
47 Zion Lee, "M-Shaped Boat Hull Helps Save Venice One Wave at a Time," San Diego Business Journal,
Newspaper Article 2001.
Figure 27: M-Hull Shape
39
After we have used the Moto Ondoso Index to calculate past and current levels of
wake energy using the COSES boat counts, we will be able to quantify any reduction possible
by physical changes to boats. In order to do
this, we will be in direct contact with the
company creating the M-Hull design. This
will allow us to determine the actual
percentage of wakes it can reduce, versus a
typical hull shape. We will also examine a
past IQP’s recommendation to use hybrid
engines to reduce wakes produced at idle.
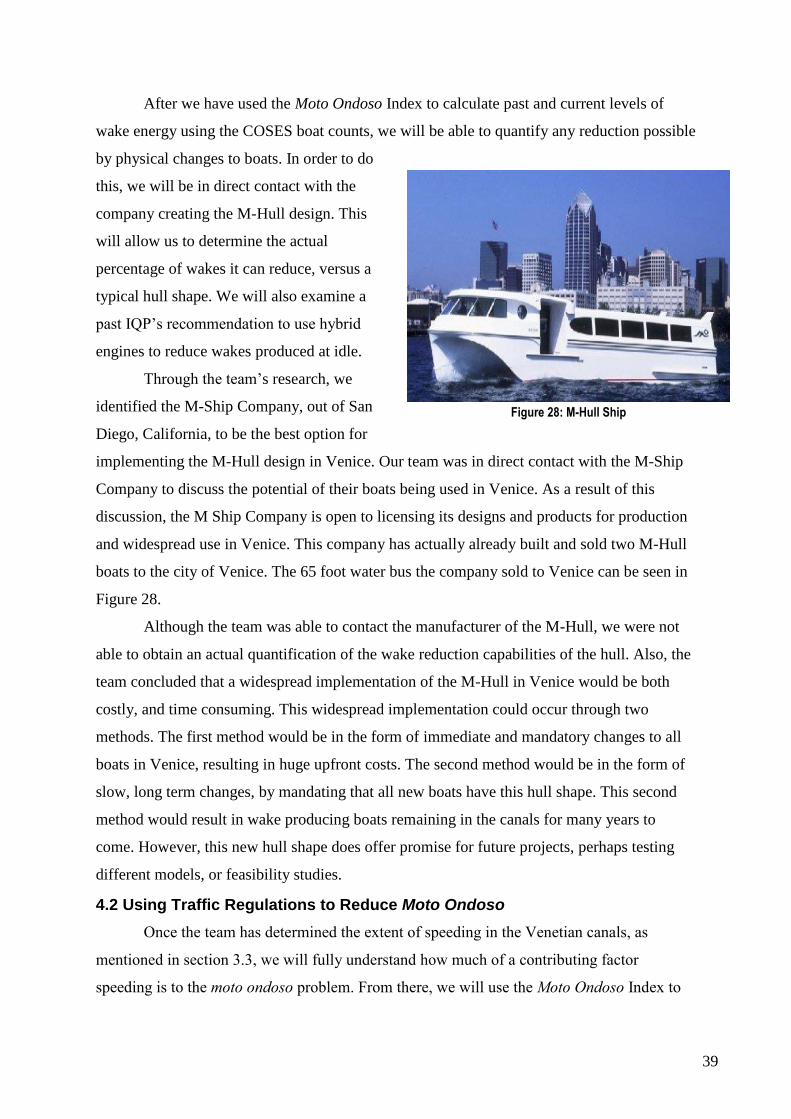
Through the team’s research, we
identified the M-Ship Company, out of San
Diego, California, to be the best option for
implementing the M-Hull design in Venice. Our team was in direct contact with the M-Ship
Company to discuss the potential of their boats being used in Venice. As a result of this
discussion, the M Ship Company is open to licensing its designs and products for production
and widespread use in Venice. This company has actually already built and sold two M-Hull
boats to the city of Venice. The 65 foot water bus the company sold to Venice can be seen in
Figure 28.
Although the team was able to contact the manufacturer of the M-Hull, we were not
able to obtain an actual quantification of the wake reduction capabilities of the hull. Also, the
team concluded that a widespread implementation of the M-Hull in Venice would be both
costly, and time consuming. This widespread implementation could occur through two
methods. The first method would be in the form of immediate and mandatory changes to all
boats in Venice, resulting in huge upfront costs. The second method would be in the form of
slow, long term changes, by mandating that all new boats have this hull shape. This second
method would result in wake producing boats remaining in the canals for many years to
come. However, this new hull shape does offer promise for future projects, perhaps testing
different models, or feasibility studies.
4.2 Using Traffic Regulations to Reduce Moto Ondoso
Once the team has determined the extent of speeding in the Venetian canals, as
mentioned in section 3.3, we will fully understand how much of a contributing factor
speeding is to the moto ondoso problem. From there, we will use the Moto Ondoso Index to
Figure 28: M-Hull Ship

40
compare current levels of wake energy to expected levels if all boats followed the canal speed
limits, seen in section 2.1.
Based on the speed data collection mentioned in section 3.3, it is clear that speeding
is a major problem in all Venetian canals. Through our analysis of the Moto Ondoso Index as
mentioned in section 3.4, the team concluded that speed is also a major factor in the creation
of wakes. In fact, as speed increases, moto ondoso increases exponentially. In other words, an
increased in speed leads to a much greater increase in the moto ondoso produced by the boat.
Because of this, it was concluded that the potential reduction in moto ondoso through the
enforcement of speed limits would be profound. Using the Moto Ondoso Index, the team
calculated that if 100% of boats followed the speed limit, rather than the 19% which do so
currently, overall moto ondoso would be reduced by 26% in the Venetian Canals.
The total reduction to moto ondoso in the Venetian canals by enforcing the speed
limits would be 26%. The team concluded that the most efficient way to enforce these speed
limits would be a system similar to the ARGOS video system. The ARGOS system used
cameras throughout Venice to record boat speeds and dispatch police to issue tickets. A
similar camera system would be able to catch speeders throughout Venice, and reduce the
prevalence of speeding significantly.
4.3 Taxi Re-Engineering
The taxi re-engineering project was an IQP in 2006 whose mission was to propose a
reorganization that would reduce moto ondoso while preserving the economic viability of the
proposal. The recommendations this team made included changing the physical
characteristics of the boat, opening up canals in order to reduce boat travel times, and
optimizing the current dispatch system.
The most promising recommendation made by the 2006 IQP was to reduce the large
amount of time taxis currently spend travelling empty. Based on the current system of taxi
stands, a taxi which picks up a passenger at a particular stand must return to that specific taxi
stand in order to pick up a new passenger. This results in taxis spending 33% of their time
travelling in the canals with no passengers, essentially creating unnecessary moto ondoso.
The way the team planned to accomplish this was by changing the taxi dispatch system to

41
allow taxis to pick up passengers in areas where they drop off others, rather than returning to
their original taxi stand. 48
One recommendation the 2006 IQP group had was to find short cuts in the city of
Venice that would help reduce traffic. One of these short cuts was a canal called the Arsenale.
The Arsenale is owned by the Marina Militare which blocks traffic flow in order to preserve
the nearby foundations. However, the 2006 IQP discovered that with a regulated flow of
boats, traffic could pass through without causing damage. They considered the possibility of
using a toll system that would penalize speeders. As can be seen in Figure 29, if Venetian
traffic was allowed to travel through the Arsenale it would dramatically decrease travel time.
Figure 29: Opening of Arsenale Canal
Another recommendation that involved changes in travel routes was a proposed highway
from the San Marco airport to the city of Venice. The route “would save 10 minutes off every
trip to and from the airport at a projected speed limit of 30km/hr.” The proposed route can be
seen in Figure 30. The route helps reduce the impact of moto ondoso on the islands that the
current route passes by. The only difficulty with implementing this plan is that the proposed
highway is not navigable. In order for it to become navigable it must first be dredged.49
48 Accosta, "Re-engineering the Venetian Taxi Transportation System: Efficiency Improvements That Reduce
Moto Ondoso." 49
Ibid.

42
Figure 30: Changed Route to Airport
4.3.1 Revisiting the Taxi Re-engineering Project
Using the COSES data, and the Moto Ondoso Index, the team will be able to estimate
how much of moto ondoso is attributed to taxis. The team will then examine a previous WPI
IQP entitled “Re-Engineering the Venetian Taxi Transportation System: Efficiency
Improvements That Reduce Moto Ondoso." The team will then determine which areas of the
current taxi system could most benefit from a new system, and what components from the
new system would be most impactful.
After examining the 2006 Taxi Re-engineering project, the COSES boat counts, and
our own field data, the team determined that the area of the taxi system most in need of
reform is the dispatch system. Currently, taxi
boats spend approximately one third of their time
traveling around the city empty. This is due to
the way the taxi stand and license systems work,
as mentioned in section 2.1. The best way to
reduce these empty runs is by revamping the taxi
dispatch system. Our team recommends the
production of a taxi reservation app, as is present
in many other cities. This taxi app would allow
passengers to call a taxi to their current location,
then, the closest available taxi would pick up the
passengers. A system model of a taxi app system
can be seen in Figure 31.
Figure 31: Taxi app

43
After revisiting the Taxi Re-engineering project, examining their recommendations,
and organizing the COSES data to be used for moto ondoso calculations, the total benefit of
the Taxi re-engineering proposal could be quantified. Using the Moto Ondoso Index, the team
calculated that if the taxi dispatch system were implemented at 100% efficiency, the
reduction in moto ondoso would be 14%. This 14% reduction in moto ondoso comes from
reducing the number of empty runs through a more efficient dispatch system mentioned
above.
4.4 Cargo Re-Engineering
The CTVR or (Consorzio Trasportatori Venezi Riuniti) is a teamster union that
represents about two thirds of the total boats responsible for delivering about 70% of the
cargo in Venice.50
In 2006, this Consortium sponsored a WPI IQP to re-engineer how the
islands of Venice receive their deliveries. The inefficiencies in the cargo system were first
studied by other WPI IQP teams in the late 90’s.
Currently in Venice, cargo is delivered by item as seen in Figure 32. Items are taken
from a single warehouse and delivered to
each island. Since deliveries are made by
item, that causes inefficiencies where there
are an excess number of boats making
deliveries. For example, a previous IQP in
1997 determined that, for the island of San
Luca, there were 96 boats were used to make
deliveries to the island. However, it was
determined based on the cargo volume of the
deliveries that only three boats were truly
needed to fulfill the delivery needs of the
island as seen in Figure 33.51
Another issue
that is present with the current cargo system
is that cargo boats have no guaranteed spot to unload their cargo at the time they arrive to a
particular island. This causes boats to have to wait for dock space to open resulting in
preventable traffic bottlenecks and moto ondoso from the idling engine.52
50 Duffy et al., "Re-Engineering the City of Venice s Cargo System For the Consorzio Trasportatori Veneziani
Riuniti." 51
Amlaw et al., "Optimization of Cargo Boat Deliveries Through the Inner Canals of Venice."
Figure 32: Current cargo system
Figure 33: Boats needed for San Luca

44
Concern about how the current delivery system can be seen by those who work in the
industry. In 2001, when an IQP was re-engineering Venice’s
cargo system, they surveyed cargo workers, asking them a
series of questions concerning cargo delivery in Venice. As
seen in Figure 34, an overwhelming majority of the workers
(92 %) believed that traffic congestion is a problem in
Venice. Another question was about delivering items by
location instead of by item. A majority of workers (76%)
agreed that they would prefer to deliver items by destination
instead of by item. Two other questions were asked concerning
equipment at docks and the ease of finding locations to dock.
Many of the workers (71%) agreed that having equipment to
help unload cargo at docks would help to speed up delivery. As
seen in Figure 35, an overwhelming majority of workers (90%)
disagreed that is was easy to find dock spaces to unload cargo.
The survey data taken from cargo workers helps to give
perspective on their thoughts about the system that they work in on a daily basis.53
In 2001, an IQP was tasked to propose a system that
would re-engineer Venice’s cargo delivery system. The
main components of that system were a centralized
warehouse and delivery by island instead of by item. Based
off the recommendations, the city built a warehouse for all
of the items being delivered to Venice located near the
bridge on Tronchetto so that trucks could bring items in
from the mainland as shown in Figure 36. It provided an
essential point for goods to enter Venice and be sorted to the places on each island that
needed that particular item.54
52 Duffy et al., "Re-Engineering the City of Venice s Cargo System For the Consorzio Trasportatori Veneziani
Riuniti." 53
Ibid. 54
Ibid.
Figure 35: Finding Dock Survey
Figure 36: Trucks Headed to Warehouse
Figure 34: Traffic Congestion Survey
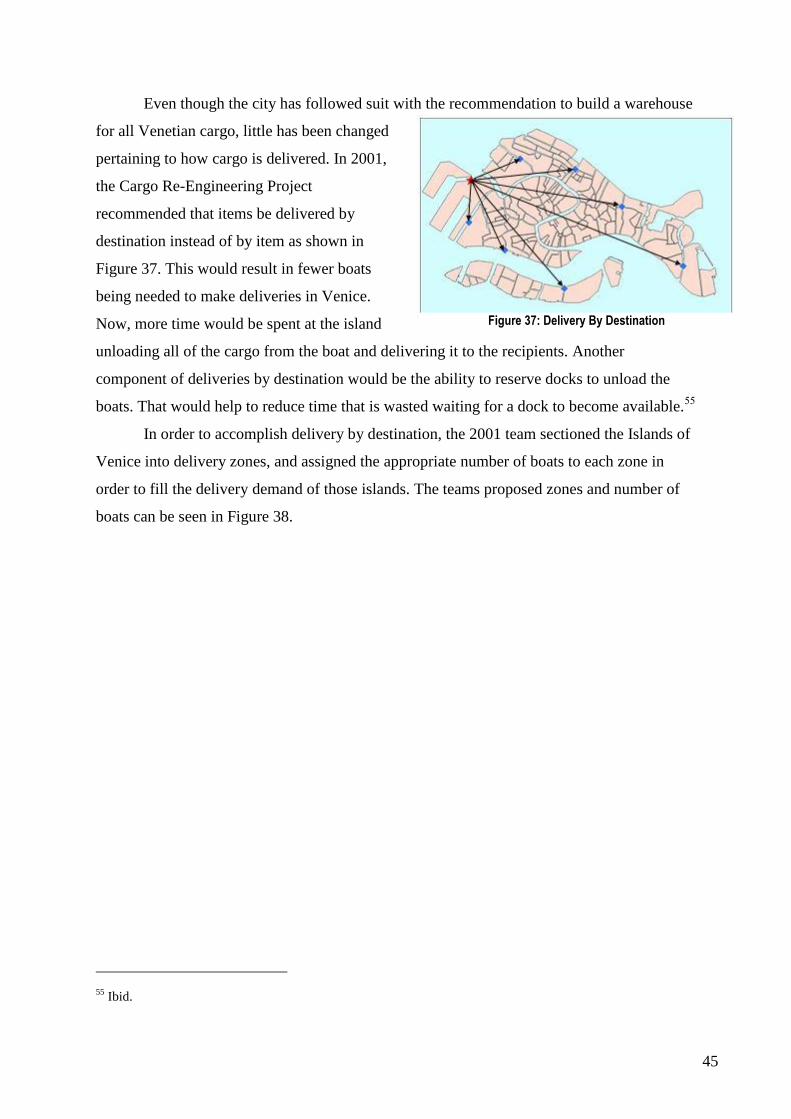
45
Even though the city has followed suit with the recommendation to build a warehouse
for all Venetian cargo, little has been changed
pertaining to how cargo is delivered. In 2001,
the Cargo Re-Engineering Project
recommended that items be delivered by
destination instead of by item as shown in
Figure 37. This would result in fewer boats
being needed to make deliveries in Venice.
Now, more time would be spent at the island
unloading all of the cargo from the boat and delivering it to the recipients. Another
component of deliveries by destination would be the ability to reserve docks to unload the
boats. That would help to reduce time that is wasted waiting for a dock to become available.55
In order to accomplish delivery by destination, the 2001 team sectioned the Islands of
Venice into delivery zones, and assigned the appropriate number of boats to each zone in
order to fill the delivery demand of those islands. The teams proposed zones and number of
boats can be seen in Figure 38.
55 Ibid.
Figure 37: Delivery By Destination

46
Figure 38: Proposed Delivery Zones
4.4.1 Revisiting the Cargo Re-Engineering Project
The team will review the cargo re-engineering project and will be applying the data
that they collected, while also extending upon it. We will be breaking down deliveries not by
specific districts but by island. This way we can get a much closer look at the demand for
cargo boats per island, and for Venice as a whole.
The team’s first step in successfully revisiting the cargo re-engineering project is to
understand how delivery demand is distributed throughout the islands. To do this the team
will examine store counts made by a WPI IQP team in 2012. The data will be in the form of a
map of all types of stores in Venice. The team will then organize this data and determine the
number of each type of store on each island. For example, the 2012 IQP team counted 511
souvenir shops in the city of Venice, and any particular island will have a certain number of

47
those on it, as seen in Figure 39.56
Figure 39: Souvenir Shops on Island
Once the team has determined the number of each type of store on each island, the
next step will be to relate this to delivery data. To do this, the team will use delivery survey
data collected by the 2001 Cargo Re-engineering team. Continuing with the example of
souvenir shops, an average souvenir shop requires ten packages per day, based on the survey
data.57
The team will then multiply the number of souvenir shops on any given island by ten,
to get an estimate for the number of packages that island needs for its souvenir shops. This
process will then be repeated for each type of store and for each island. The end result will be
the total delivery demand per island for the entire city of Venice. The team will then need to
verify the accuracy of this delivery data by comparing it to the 2001 IQP data, as well as
delivery data taken in 2006 by an organization called MOBILIS.
The previous cargo re-engineering IQP developed cargo delivery zones as mentioned
in section 4.4. While these zones were revolutionary, this team will use the new delivery
demand data to create new cargo delivery zones, taking into account changes in the Venetian
retail sector over the past 12 years. The new zones will be created in order to minimize single
cargo boats making deliveries to numerous islands, known as “island hopping.”
4.4.2 Cargo Re-Engineering Revisited
The cargo re-engineering project was a more labor-intensive part of this project then
the above parts. This is because the data from the past project was out dated due to changes in
delivery demand. As a result, both their delivery demand calculations, and zone creations
were redone.
56 Bruso et al., “A Look at the Changes in the Venetian Stores and Tourist Accommodations and Their Impact
on the Local Population” 57
Duffy et al., "Re-Engineering the City of Venice s Cargo System For the Consorzio Trasportatori Veneziani
Riuniti."

48
Using the methods outlined in section 4.4.1, we determined the number of each type
of store on each island. After this, we estimated the total delivery demand for each island, as
seen in Figure 40. The delivery data can be found in both Appendix N and Appendix O. This
graphic makes it clear how delivery demand is distributed throughout the city. Some islands,
such as San Silvestro, in the center of the map, require many more deliveries than other
islands. This data was also cross referenced with the delivery data from the 2001 IQP, as well
as the 2006 MOBILIS data in order to verify its accuracy. The 2006 MOBILIS group
observed deliveries at 19 docks in Venice. The team used this data, along with the stores data
to quantify the relationship between the numbers of stores on an island to observed deliveries
for this island. This relationship was then used to extrapolate delivery demand for those
islands MOBILIS did not observe. It was concluded that the new delivery demand was
accurate. These calculations can be found in Appendix P.
Figure 40: Delivery Demand For Each Island
The delivery demand for San Silvestro was further broken down by types of products,
as seen in Figure 41. As mentioned previously in section 4.4, all of these different types of
products are currently delivered by different boats. In the new Delivery by Destination
system, all of these products would be placed onto boats destined for San Silvestro, and only
San Silvestro.

49
Figure 41: San Silvestro Delivery Breakdown
Using the delivery demand data mentioned above, the team then divided up the many
islands of Venice into new delivery zones. The goal of these new delivery zones was to
assign specific islands for specific cargo boats to deliver to. Originally, the team planned on
having each zone consist of only one island. Upon review of the delivery data however, the
team determined this would lead to partially filled boats being used in some cases. The more
efficient process would be to group together nearby islands so that combined, they required
some round number of full boats. This is more efficient because the distance from the central
warehouse to these islands is much larger than the distance between the islands themselves.
Therefore, it is more efficient to have one boat cover the large distance from the warehouse to
the islands, then cover the short distance to a nearby island, rather than have two boats cover
the large distance to the same islands.
As a result of these conclusions, the delivery zones seen in Figure 42 were created.
These zones minimize the distance travelled in the Canals of Venice, while still delivering the
same number of packages. It is clear from the map that some Zones contain only one island,
while others contain several. In cases where a single island required a large number of
deliveries, some combination of large and medium cargo boats could be assigned to
efficiently fulfill its delivery demand. In the case of islands with smaller delivery demand,
they were grouped together with nearby islands with similarly small delivery demand. By
doing so, the delivery demand for these grouped islands would require a single large boat, or
a single large boat and a single medium boat. As mentioned above, this is much more
efficient than each island being assigned a separate boat.

50
Figure 42: Delivery by Destination Zones
4.4.3 Benefits of Cargo Re-Engineering System
The results from our revisiting of the cargo re-engineering project were very
intriguing. The group and our advisors hoped the new Delivery Zones would result in a
significant impact in moto ondoso levels. Prior to this group’s project, the benefits of delivery
by destination in terms of a reduction in traffic had never been accurately quantified.
As part of our research on the current cargo system, the team took time-lapse videos
at busy docks near the Rialto Bridge. The team then animated this video to keep count of the
number and size of deliveries being made for several hours. To do so, the actual packages
being delivered to the island were highlighted, and the highlighted packages were kept on
screen. A screen shot of this animation can be seen in Figure 43. In this screen shot, a large
cargo boat can be seen in the foreground making a delivery of a highlighted package, while a
previously delivered package can be seen on the dock. At the end of our observation period,
18 cargo boats had delivered approximately 440 packages to the island. This represents an
area that the new delivery by destination system can improve upon. As can be seen in Figure
44, all of the 440 packages delivered during our observation period could have fit onto a
single cargo boat. Using the proposed system, the deliveries at the level of a single dock
would be improved because much fewer boats would be docking throughout the day.
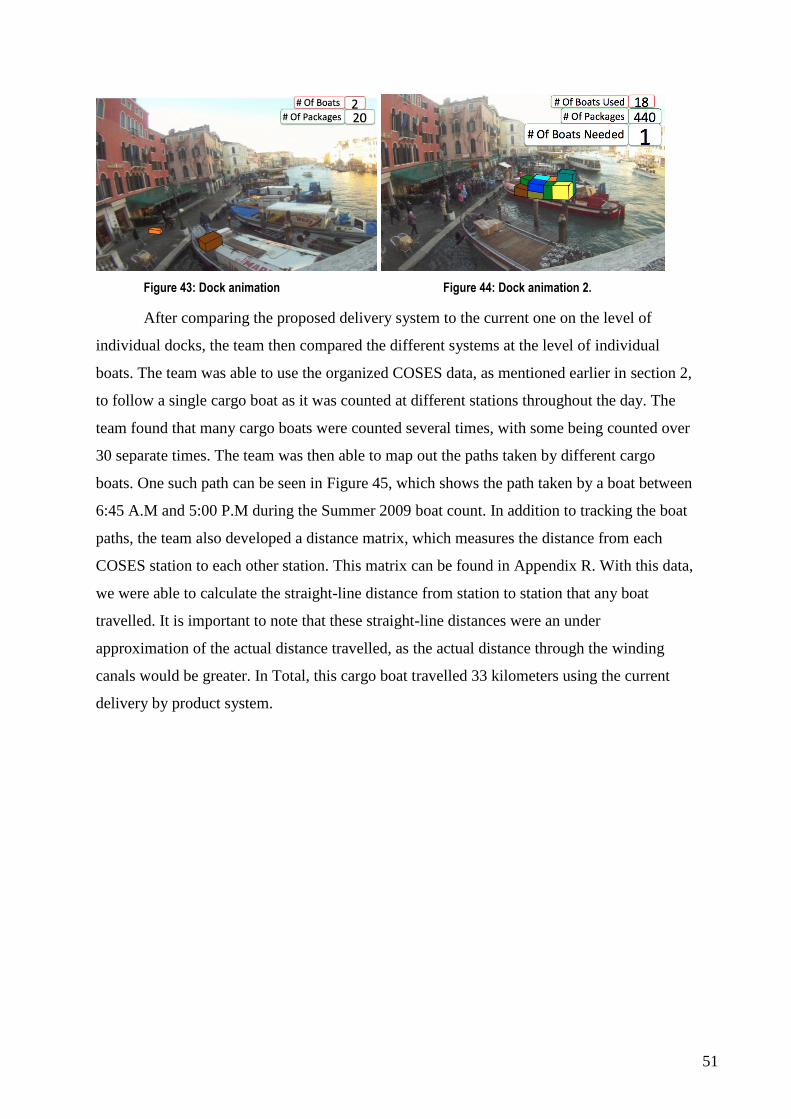
51
Figure 43: Dock animation Figure 44: Dock animation 2.
After comparing the proposed delivery system to the current one on the level of
individual docks, the team then compared the different systems at the level of individual
boats. The team was able to use the organized COSES data, as mentioned earlier in section 2,
to follow a single cargo boat as it was counted at different stations throughout the day. The
team found that many cargo boats were counted several times, with some being counted over
30 separate times. The team was then able to map out the paths taken by different cargo
boats. One such path can be seen in Figure 45, which shows the path taken by a boat between
6:45 A.M and 5:00 P.M during the Summer 2009 boat count. In addition to tracking the boat
paths, the team also developed a distance matrix, which measures the distance from each
COSES station to each other station. This matrix can be found in Appendix R. With this data,
we were able to calculate the straight-line distance from station to station that any boat
travelled. It is important to note that these straight-line distances were an under
approximation of the actual distance travelled, as the actual distance through the winding
canals would be greater. In Total, this cargo boat travelled 33 kilometers using the current
delivery by product system.

52
Figure 45: Single Cargo Boat in Current System
In order to analyze the benefit of the proposed delivery by destination system on the
level of individual boats, the team then looked at a typical day in the life of a cargo boat
driver using the new delivery zones mentioned in section 4.4.2. In this new system, a cargo
boat would leave the cargo warehouse located on the western island of Tronchetto, travel to
its specified zone, and be done for the day. This new boat path can be seen Figure 46. This
new boat path represents the increase in efficiency the delivery by destination system can
bring to the level of individual boats.
Figure 46: Single Cargo Boat in Proposed System

53
After the team analyzed the benefit of the system on the level of individual boats, it
was not hard to extend the same principles to the entire fleet of cargo boats. Using the same
2009 Summer COSES data, the team was able to track all Venetian cargo boats as they
travelled throughout the city. The resulting multitude of boat paths can be seen in Figure 47.
In this figure, because there are so many overlapping paths, the darker lines represent more
frequently covered paths. Using the same method to calculate distance traveled as described
above, the team calculated that all cargo boats in Venice travel approximately 3000
kilometers in a single day. As a comparison, this distance is enough for the Venetian cargo
boats to travel the distance to Iceland every single day. This number, in addition to being an
under approximation due to the nature of straight-line distances versus real distances, is
actually an even greater under approximation. This is because while COSES was conducting
its boat counts, the license plate of a cargo boat was often partially or totally illegible, or
copied down incorrectly. As a result, approximately 35% of the cargo boat counts are not
useable for distance calculations because the data cannot be separated by boat. However, the
3000-kilometer distance still represents another area where the new re-engineered system can
make a profound impact.
By taking the example of a single cargo boat in the proposed system, seen in Figure
46, and extending it to the entire city of Venice, we can visualize the new boat paths of all
cargo boats using the new delivery by destination system. These new boat paths can be seen
in Figure 48.
Figure 47: All Cargo Boats in Current System

54
By calculating the distance traveled by all boats in this proposed system and
comparing it to the 3000 kilometers of the current system, we are able to actually quantify the
reduction in traffic by using a delivery by destination system. The total distance the team
calculated for all cargo boats in the proposed system was 400 kilometers. These calculations,
as well as those for the current system, can be found in Appendix S and Appendix T
respectively. This means that the proposed system could deliver the same number of
packages to the island of Venice while traveling 86% less distance. This huge reduction
would be across the board for the cargo system. There would be similar reductions in gas
costs, boat repairs, delivery times and so forth. Despite this, there would not be an 86%
reduction in cargo delivery jobs, as will be mentioned in section 4.5.
4.4.3 Docks
Since boats are the main form of transportation and delivery of cargo in Venice, there
is a need to have docks scattered throughout the city. In the Venice, there are a total of 1650
docks. In order to be able to direct cargo workers to utilize the best docks possible, we
mapped all of the docks using GIS software as depicted in Figure 49 and put the data into
CSV files as shown in Appendix U. After mapping the docks, the group then determined the
best two docks on each island for cargo boats to use for making deliveries. Factors that went
into deciding which docks were the best on each island included the width of the canal, the
size of the dock itself, and the location in respect to other delivery points in surrounding
islands. The most important factor was the width of the canal because we wanted to ensure
Figure 48: All Cargo Boats in Propopsed System

55
that a docked cargo boat would not become an impediment to other traffic passing by. With
the top identified docks, the group would like to create the ability to reserve docks using an
app to ensure that cargo boats will not have to wait for dock space upon arrival for deliveries.
Figure 49: Map of all Venetian Docks
After obtaining all of the information about docks in Venice, we put that information
on the CityKnowledge Console and created Venipedia pages as shown in Appendix W.
Having information about every dock in Venice will be useful for anyone that is looking for
information about a particular dock in Venice. Each page provides specific information about
each dock including location information, physical characteristics, usability, and condition.
Additionally, there is a map on each page showing the docks location in Venice, as well as,
showing other docks of the same type.
After all of the docks in Venice were mapped, we had identified the docks that would
be best suited for cargo boats. Once we arrived in Venice, we conducted spot checks on
docks that had been identified as the best candidates on each island. While we were
conducting spot checks of the docks, we noticed that there were some unforeseen conflicts
that currently would not make certain docks usable for cargo boats. These docks were being
used for other purposes, such as a gondola stand, an ACTV stand, or as a place for
Ambulances to park. Some of these docks would not be able to be used for cargo boats since
they are already being used for other city services. However, the docks that are being used in
a capacity, such as a gondola stand, we would recommend seeing if there could possibly be a
way for cargo boats to use these docks during times gondolas are not in use, such as the
morning.

56
Another thing we noticed while verifying docks throughout the city, it had become
apparent that riva are not the best docks for cargo boats due to their shape, steps, and ease of
parking alongside the dock
(depending on the tide). Instead, we
noticed that fondamenta were the
most convenient docks for cargo
boats to use because they could
pull up alongside the street and
easily unload their items from their
boat. After noticing that
fondamenta, were more suitable,
more were added to the best docks map as shown below in Figure 50. Adding more
fondamente to the best docks for cargo drivers will help ensure that Venetian policymakers
and cargo boat drivers will utilize these specific docks.
In total, 416 docks were selected as the best docks for cargo boats to utilize when
making deliveries. The purpose of selecting these docks was to help cargo boat drivers to
choose the best places
to dock when making
deliveries. Docks were
also selected on
different parts of many
islands to help cargo
boats to have a
location that is the
most convenient to
them. Some boats may want to have a dock in a particular location because they will have to
make deliveries to other islands within the delivery zones that were established in Figure 51.
In order to ensure cargo boat companies that they will be able to dock at one of the desired
docks on each island, a mockup of an app was created where they will have the ability to
reserve a particular dock. Being able to reserve a particular dock for deliveries will ensure
that cargo boats can make their deliveries at a desired time and location, thus reducing
wasteful idling or driving. We recommend that Venetian policymakers make the docks we
recommended available for cargo boats to reserve and create policies to ensure that others do
not use these docks during times the dock may be reserved for deliveries.
Figure 51: Mockup of dock reservation app
Figure 50: A map of the best docks for cargo boats.

57
4.5 Economic Benefit
Once the wake impact was calculated, we used that data to compare the cost of
maintenance to index values. With those data values, we estimated how much money the city
of Venice could save based off our recommendations. To show Venetian policymakers how
our recommendations will save them money, we visualized the comparison between money
saved by preventative measures and money currently spent on maintenance.
In order to be able to quantify how much money our recommendations could save
Venice, we will need accurate figures relating the cost to repair the canal walls as shown in
Figure 52. In 2007, the Auto-Accretion MQP determined that canal maintenance costs ranged
from $189 to $4,766 per square meter of canal wall repaired for small to average sized canals.
For large canal segments, the cost per square meter rose significantly to $11,680 per square
meter.58
While in Venice, we will need to see if these costs to repair canal walls have
changed significantly from 2007. Additionally, we also need to find out how often repairs are
made on any given canal wall.
Figure 52: A canal wall undergoing repairs.
After calculations relating to how much moto ondoso is created by each type of boat
at different speeds have been made, we will relate the wake energy produced by each type of
boat to how much damage each boat type causes. We will also obtain the time intervals for
58 Jessica Balesano and Jodi Lowell, "AUTO-ACCRETION POWERED BY MICROBIAL FUEL CELLS IN
THE VENETIAN LAGOON," (2008).

58
canal wall repairs. By using our boat count data, we can calculate how much wake energy has
caused the damage that has occurred to the canal wall.
From the recommendations we make to reduce moto ondoso, we will calculate how
much wake energy our recommendations will reduce in comparison to the status quo. These
calculations will show Venetian policymakers how much wake energy could be reduced by
the adoption of our recommendations. Venetian policymakers will also be able to see how
these recommendations will help keep their canals in better shape.
With the quantifying of the reduction wake energy, we will also show Venetian
policymakers what they have to gain financially. Using our energy savings calculations, we
will show the policymakers that if they decide to implement previous projects such as the
Cargo Re-Engineering Project and the Taxi Re-Engineering Project, will result in economic
benefit for the city. The economic benefit will come from the reduction in wake impact that
comes from the implementation of these projects. For Venice, the economic benefit will be
that over time, they will have to do maintenance and repairs on their canals less often. By
having to partake in canal maintenance less often, will save the City of Venice money in the
long run.
4.5.1 Quantifying Economic Benefit
Reducing moto ondoso in Venice has the potential to economically benefit the city.
We found that three areas where the city could reduce moto ondoso. The three areas included
enforcement of speed limits, reducing empty taxi runs, and making deliveries by destination
instead of by item. Once we got repair cost information from the 2013 Canals IQP, as shown
in Appendix X, we were able to calculate the cost of moto ondoso.59
With that data, we could
determine the cost of one unit of moto ondoso, as explained in section 3.2, by comparing the
Moto Ondoso Index from the 2001-2006 COSES campaigns with the cost of repairs for the
same canals segments involved with the COSES campaigns for that period of time. We then
determined the ratio between moto ondoso and repairs costs for one year. It was determined
that 100 units of moto ondoso correlated to 1 euro of repair cost. After determining the cost of
one unit of moto ondoso, we plugged in our estimated reductions of moto ondoso if our
recommendations were fully implemented by Venetian policymakers. Since there are other
factors that require canals to undergo maintenance, we presumed that moto ondoso is
responsible for approximately 50 percent of all canal wall damage. This will help to show
59 2013 Canals IQP

59
Venetian policymakers what they have to gain from the implementation of our
recommendations.
In order to determine how much money could be saved by the city in canal wall
repairs, we had to calculate how much moto ondoso could be reduced by enforcing speed
limits, reducing empty taxi runs, and making deliveries by destinations. If 100% of all boats
in Venice went the speed limit while traveling on Venetian canals, moto ondoso would be
reduced by 26 percent. Additionally, if empty taxi runs were completely eliminated, moto
ondoso would be reduced by 14 percent. Lastly, if deliveries were made by destination
instead of by product, moto ondoso would be reduced by 28 percent. As seen in Figure 53,
the total potential reduction of moto ondoso would be 57 percent. Using the cost per unit of
moto ondoso we calculated, we determined that the City of Venice could save as much as
400,000 euros. On top of those savings, the reductions in moto ondoso will ensure that canal
walls stay in better shape and need to be repaired on a less frequent basis.
Figure 53: Total reduction of Moto Ondoso

60
APPENDICES:
Appendix A: Bibliography
Accosta, Robert. "Re-Engineering the Venetian Taxi Transportation System: Efficiency
Improvements That Reduce Moto Ondoso." (2006).
Agency, Environmental Protection. "How Hybrids Work."
http://www.fueleconomy.gov/feg/hybridtech.shtml.
Amlaw, Karolyn, Carie Lin Kervin, Ignacio Mondine, and Charu Vepari. "Optimization of
Cargo Boat Deliveries through the Inner Canals of Venice." (1997).
Balboa, Marc. "Traffic and Its Impacts." http://www.wpi.edu/Pubs/E-project/Available/E-
project-122107-161101/.
Balesano, Jessica, and Jodi Lowell. "Auto-Accretion Powered by Microbial Fuel Cells in the
Venetian Lagoon." (2008).
Banister, David. Transport Policy and the Environment2013.
Bloisi, Domenico Daniele, Luca Iocchi, G. R. Leone, R. Pigliacampo, L. Tombolini, and
Lorena Novelli. "A Distributed Vision System for Boat Traffic Monitoring in the Venice
Grand Canal." 2007.
Bloisi, Domenico, and Luca Iocchi. "Argos—a Video Surveillance System for Boat Traffic
Monitoring in Venice." International Journal of Pattern Recognition and Artificial
Intelligence 23, no. 07 (2009): 1477-502.
"Boat System with Hybrid-Power Propulsion." 2009.
Candlish, Sean, Craig Shevlin, and Sarah Stout. "The Traditional Boats of Venice: Assessing
a Maritime Heritage." Worcester: Worcester Polytechnic Institute (2004).
Caniato, Giovanni. Venezia La Città Dei Rii: Cierre, 1999.
Capelli, Carlo, C. Tarperi, F. Schena, and A. Cevese. "Energy Cost and Efficiency of
Venetian Rowing on a Traditional, Flat Hull Boat (Bissa)." European journal of applied
physiology 105, no. 4 (2009): 653-61.
Carrera, F. "27• City Knowledge as Key to Understanding the Relation between Waters and
Stones in Venice." Flooding and Environmental Challenges for Venice and Its Lagoon: State
of Knowledge (2005): 219.
Chiu, David, Anand Jagannath, and Emily Nodine. "The Moto Ondoso Index: Assessing the
Effects of Boat Traffic in the Canals of Venice." Worcester Polytechnic Institute, 2002.
Chou, Danice Yequay, Rudy E. Pinkham, Christopher D. Catanese, Bethany J. Lagrant, Fabio
Carrera, and Paul W. Davis. "Floating around Venice -- Developing Mobility Management

61
Tool." In Urban and Environmental Planning. Worcester, MA: Worcester Polytechnic
Institute,, 2008.
Cocks, Anna. "The Science of Saving Venice | World Monuments Fund."
http://www.wmf.org/dig-deeper/article/science-saving-venice.
Downs, Anthony, and Ebrary Academic Complete. "Still Stuck in Traffic
Coping with Peak-Hour Traffic Congestion." In James A Johnson Metro Ser. Washington:
Brookings Institution Press, 2003.
Duffy, Jill, Justin Gagliardi, Kate Mirtle, and Amanda Tucker. "Re-Engineering the City of
Venice S Cargo System for the Consorzio Trasportatori Veneziani Riuniti." (2001).
Eade, Catherine. "Venice Tourist Warning: 'Cap Visitor Numbers to Avoid Environmental
Catastrophe'." The Daily Mail, 2011.
Formazione, Consorzio per la Ricerca e la. "Osservatorio Del Traffico Acqueo a Venezia."
August 2007.
Friedman, Ron. "Rush Hour Truck Ban Proves Successful." (2010).
Gao, H. Oliver, and Vincent Kitirattragarn. "Taxi Owners’ Buying Preferences of Hybrid-
Electric Vehicles and Their Implications for Emissions in New York City." Transportation
Research Part A: Policy and Practice 42, no. 8 (2008): 1064-73.
Gelinas, Morgan Elise. "Industrial Ships' Wake Propagation and Associated Sediment
Resuspension in the Venice Lagoon." (2011).
Geroliminis, Nikolaos, and Carlos F. Daganzo. "A Review of Green Logistics Schemes Used
in Cities around the World." (:).
Geroliminis, Nikolas, and Carlos F. Daganzo. "Macroscopic Modeling of Traffic in Cities."
2007.
"Gottlieb Daimler Memorial in Bad Cannstatt." http://media.daimler.com/dcmedia/0-921-
1303725-1-1303019-1-0-0-0-0-1-11694-614318-0-1-0-0-0-0-0.html?TS=1302091862634.
"Greening Taxis in Latin America." http://www.taxi-library.org/rio.htm.
"Hornblower Hybrid: Ferry and Charter Boat.(Distinctive Boats of 2012)." Marine Log 118,
no. 1 (2013): 15.
Insula. "Chi E Insula (Who Is Insula)." http://www.insula.it/index.php/azienda/chi-e-insula.
———. "Venice Preservation and Urban Maintenance." edited by Insula.
"Insula Informa." edited by Insula, 2000.

62
JesúsMuñuzuri, PabloCortés, LuisOnieva, and JoséGuadix. "Estimation of Daily Vehicle
Flows for Urban Freight Deliveries." http://dx.doi.org/10.1061/(ASCE)UP.1943-
5444.0000099 (2011).
Kington, Tom. "Venice Tourist's Gondola Death Prompts Canal Crackdown." The Guardian,
2013.
Lee, Der-Horng. "Taxi Dispatch System Based on Current Demands and Real-Time Traffic
Conditions - Transportation Research Record: Journal of the Transportation Research Board -
Volume 1882, Volume 1882 / 2004 Transportation Network Modeling 2004 - Transportation
Research Board of the National Academies." Transportation Research Board of the National
Academies, http://trb.metapress.com/content/8366q367h340v4m3/.
Lee, Zion. "M-Shaped Boat Hull Helps Save Venice One Wave at a Time." San Diego
Business Journal, Newspaper Article 2001, 32.
Li, Lester, Michelle Lynn Carbonneau, Marc Joseph Balboa, Kyle Feeley, Kristen Billiar, and
Fabio Carrera. "Turning Traffic around -- an Analysis of Boat Traffic in Venice and Its
Environmental Impacts." In Technology and Environment. Worcester, MA: Worcester
Polytechnic Institute,, 2008.
Madden, Thomas F. Venice a New History: Penguin Group, 2012.
Martin, Lillian Ray. “the” Art and Archaeology of Venetian Ships and Boats: Texas A&M
University Press, 2001.
Molmenti, Pompeo Gherardo. La Storia Di Venezia Nella Vita Privata: Dalle Origini Alla
Caduta Della Republica: Roux e Favale, 1885.
"Moscow Traffic Rated Worst in World." (2013).
Orsoni, Giorgio, Ugo Bergamo, and Marko Agostini. "Piano Per La Sicurezza Della
Navigazione Urbana." 2013.
"Punto Per Punto, Ecco Il Testo Del Piano Acqueo Del Comune - Il Gazzettino." (2013).
Robinson, Charles W., and William F. Burns Iii. "M-Shaped Boat Hull." Google Patents,
2001.
Russo, Antonio Paolo. "The “Vicious Circle” of Tourism Development in Heritage Cities."
Annals of tourism research 29, no. 1 (2002): 165-82.
Standish, Dominic. Venice in Environmental Peril?2013.
Takano, Kelly. "A Genetic Algorithm for the Hub-and-Spoke Problem Applied to
Containerized Cargo Transport." (2013).
Tan, Pinar Z. "A Hub Covering Model for Cargo Delivery Systems." Networks 49, no. 1: 28-
39.

63
Tanefusa, Yusuke, Chun Ho Lee, Alexander Gomperts, Peder C. Pedersen, and Fabio
Carrera. Ultrasound Boat-Monitoring System -- Vencie Canal Boat Traffic and Damage
Monitoring System2004.
Times, New York. "Steam-Boats in Venice." 1881.
Tita, Bob. "Cargo Congestion Worsens." (Dec 20, 2004).
Tucker, Amanda Lynn, Justin Orlando Gagliardi, Jill Elizabeth Duffy, Katherine Lynn Mirtle
Bender, Fabio Carrera, and John F. Zeugner. Re-Engineering the City of Venice's Cargo
System for the Consorzio Trasportatori Veneziani Riuniti, Economic Growth, Stability, and
Development2001.
Vacca, Thomas Michael, Benjamin E. Newton, Ana-Maria Elena Mandrila, Adam Charles
Blomberg, Fred J. Looft, Fabio Carrera, and Rebecca A. Kupcinskas. "Remote Boat
Monitoring System." Worcester, MA: Worcester Polytechnic Institute,, 1999.
Van Twisk, Sander R., Adam J. Hart, Jesse Alexander Chisholm, Peder C. Pedersen, and
Fabio Carrera. "Ultrasound Boat-Monitoring System." http://www.wpi.edu/Pubs/E-
project/Scanned/05D419M.
Vasilescu, I., K. Kotay, D. Rus, M. Dunbabin, and P. Corke. "Data Collection, Storage, and
Retrieval with an Underwater Sensor Network." In Proceedings of the 3rd international
conference on Embedded networked sensor systems, 154-65. San Diego, California, USA:
ACM, 2005.
Venezia, Conzorsio Motoscafi. "Our Boats." http://motoscafivenezia.it/eng/imbarcazioni.php.
Zanatta, Valentina, and Paolo Rosato. "The Impact of Speed Limits on Recreational Boating
in the Lagoon of Venice." Nota di Lavoro, Fondazione Eni Enrico Mattei, 2005.

64
BOAT TRAFFIC APPENDICES
Appendix B: Italian 26 point plan
PIANO PER LA SICUREZZA DELLA NAVIGAZIONE URBANA
A.Miglioramento delle condizioni di navigabilità
1.Revoca delle concessioni di spazi acquei per l'ormeggio lungo il Canal Grande
nel tratto Pontedella Costituzione - Rialto - Rio Nuovo a tutte le unità commerciali
(trasporto in conto proprio econto terzi di persone e cose) e loro ricollocazione nella darsena
dell'Isola Nuova del Tronchettoo della Misericordia
2.Revoca o revisione delle concessioni per l'installazione di pontili pubblici e privati, non
dedicatia servizio pubblico o di pubblico interesse, nel tratto Ponte della Costituzione - Rialto
- Rio Nuovo, sporgenti dalla riva oltre una determinata distanza, da individuare secondo la
sezionenavigabile nel tratto interessato
B.Limitazione del traffico
3.Divieto di accesso e transito in Canal Grande per tutte le unità adibite al trasporto di cose
per conto proprio e per conto terzi da metà mattina sino alle 4 del giorno dopo
4.Obbligo per le unità impiegate in servizio pubblico non di linea per il trasporto di persone -
taxie noleggio con conducente - di utilizzo del Rio Nuovo, con introduzione del divieto di
transitoin Canal Grande nel tratto Rio di Noale - Rio Nuovo da metà mattinata a sera, con
esclusionedei soli taxi in turno
5.Divieto di transito alle unità in servizio pubblico non di linea per il trasporto di persone -
GranTurismo in Canal Grande dal Ponte della Costituzione a Punta della Dogana
6.Divieto di transito in Canal Grande alle gondole negli orari in cui è consentito il transito
delleunità adibite al trasporto di cose per conto proprio e per conto terzi
7.Divieto di transito in Canal Grande delle unità a uso privato a motore dalle 6 alle 12
8.Divieto di transito in Canal Grande delle unità da diporto dal rio di San Giovanni
Grisostomo alr i o d i S a n L u c a n e l l a p r i m a m a t t i n a t a , e s c l u s i i
t i t o l a r i d i c o n c e s s i o n e d i s p a z i o a c q u e o compreso nel tratto interessato
9.Introduzione della raccolta notturna dei rifiuti con divieto di accesso al Canal Grande per
tutte leunità impiegate da Veritas dalle 8 alle 22, eccettuato il servizio di asporto rifiuti
prodotti dalmercato ittico e ortofrutticolo

65
C.Revisione del servizio pubblico di linea
10.Differenziazione degli approdi destinati alle diverse linee di trasporto pubblico, anche
connuove realizzazioni, e riduzione/diversificazione delle fermate dei servizi
Alilaguna e dellaLinea dell'Arte in Canal Grande
11.Revisione dei tempi di percorrenza delle linee ACTV 1 e 2 lungo il Canal Grande,
valutando la possibilità di uniformare fermate e tempi di percorrenza per regolarizzare i
transiti e di unificarele due linee, per evitare sorpassi e ottimizzare gli incroci ai pontili
singoli, in coerenza con imotivi dello stato di non collaborazione del personale navigante
12.Miglioramento della manovrabilità e della sicurezza delle unità in servizio pubblico di
linea, converifica della possibilità e dell’efficacia dell’installazione di eliche
prodiere (bow thruster) einstallazione sperimentale di telecamere posteriori per la piena
visibilità poppiera
D.Messa in sicurezza del servizio di gondola
13.Ridefinizione degli stazi di gondole in prossimità dei pontili ACTV
14.Individuazione dei percorsi delle gondole in servizio pubblico da nolo e messa in
sicurezza deit r a t t i ch e in t e r f e r i s con o co l s e r v i z i o pu bb l i co d i l i n ea , co n
p r e s c r i z io n i c i rc a l e m an ov r e d i immissione in Canal Grande e attraversamento
15.Divieto di imbarco di passeggeri per le gondole nei pontili del rio del Danieli (Rio del
Vin)
16.Individuazione di una zona protetta e preclusa ad altra navigazione in bacino di San Marco
per garantire la evoluzione in sicurezza delle gondola
17.Individuazione univoca delle gondole/sandoli e dei gondolieri/sandolisti in
servizio pubbliconon di linea, con applicazione alle unità del numero della
licenza/autorizzazione a caratteri benleggibili e dotazione dei titolari e sostituti di un
cartellino identificativo
18.Revisione dei traghetti da parada, mantenendo in servizio solo quelli di effettiva utilità
emaggiore frequentazione
E.Regolamentazione del traffico
19.Revisione delle regole di circolazione in Canal Grande, con previsione di tratti con divieto
disorpasso, obbligo di tenere sempre la destra

66
20.Divieto assoluto dalle 9 alle 20 di "carovane" di unità in servizio pubblico non di linea
adibite altrasporto di persone - gondole, taxi e noleggio con conducente - in Canal Grande,
con revisionedella sanzione
F.Controllo del traffico
21.Istituzione di postazioni fisse di controllo con presidio della Polizia Municipale a Rialto e
aPunta della Dogana
22.Riattivazione del sistema di telecontrollo ARGOS e attivazione del sistema integrato
dimonitoraggio con GPS a fini sanzionatori
23.Obbligatorietà per tutte le unità a motore, diverse dalle unità da diporto non commerciale,
e per le unità a remi in servizio pubblico non di linea, per poter navigare in Canal
Grande se e inquanto autorizzate, di essere collegate al sistema di monitoraggio con GPS
integrato nel sistemadi telecontrollo ARGOS
G.Sicurezza della navigazione
24.Introduzione del divieto di condurre tutte le unità a remi e a motore in movimento
utilizzandoapparecchi radiotelefonici, consentendo solo apparecchi a viva voce o dotati di
auricolare
25.Introduzione del divieto di condurre tutte le unità a remi e a motore in servizio pubblico
non dilinea in stato di ebbrezza in conseguenza dell'uso di bevande alcoliche o in stato di
alterazione psico-fisica dovuto all'assunzione di sostanze stupefacenti
26.Introduzione di controlli sistematici dell'idoneità psicofisica di tutti i conducenti di unità
inservizio pubblico non di linea, per prevenire l'uso di bevande alcoliche o sostanze
stupefacenti
67
Appendix C: 26 point plan (rough translation)
A. Improvement of navigability conditions.
1. Revocation of the water spaces for mooring along the Grand Canal in the
stretch Bridge of the Constitution - Rialto - New Rio in all business units
(transport on own account and third parties of people and things) and their
relocation in the harbor of the island of New Boots or of Mercy.
2. Withdrawal or revision of the concessions for the installation of pontoons
public and private, non-dedicated in public service or public interest, the
stretch Constitution Bridge - Rialto – Rio New, protruding from the shore
beyond a certain distance, to be identified in accordance with Section
waterway in the section concerned.
B. Limitations on Traffic
3. Prohibition of access and transit in the Grand Canal to all units designed
to carry things for own account and for third parties by mid-morning until 4
in the next day. ( Cargo ships are not allowed on the grand canal from
mid-morning until 4 am then at 4 in the morning they are allowed to work.)
4. Obligation for the units used in the public service non-scheduled
passenger transport – taxi and car rental with driver - to use the Rio
Nuovo, with the introduction of the ban on the Grand Canal in the stretch
of Noale Rio - Rio Novo from mid-morning to late evening, with the
exception the of only one taxi at a time.
5. No transit units in public service is not scheduled for the transport of
people – Great Tourism in the Grand Canal from the Bridge of the
Constitution at the Punta della Dogana.
6. No transit to the gondolas on the Grand Canal during the hours in which it
is permitted to transit the units designed to carry things on their own
account and for third account.
7. Ban on driving in the Grand Canal the units in use of private motorboats
between 6 and 12.
8. Ban on driving in the Grand Canal of recreational craft from the Rio of St.
John Chrysostom to Rio di San Luca in the early morning, excluding
holders of concession of water space included in the section covered.
9. Introduction of waste collection night with a ban on access to the Grand
Canal for all units used by Veritas from 8 to 22, except in the service of
waste collection produced by fish market, fruit and vegetable.
C. Revision of the public transit lines
10. Differentiation of the landings for the various public transportation lines,
even with new achievements, and reduction / diversification of services
Alilaguna stops and Line Art in the Grand Canal.
11. Revision of travel times ACTV 1 and 2 along the Grand Canal, evaluating
the ability to standardize stops and travel time to regularize the transits
and to unify the two lines to prevent overtaking and optimize the
intersections of the piers individual, consistent with the grounds of the
state of non-cooperation of crews.
12. Improved maneuverability and safety of the public service units in line with
verification of the possibility and effectiveness of the installation of bow

68
propellers (bow thruster) and experimental installation of rear cameras for
full visibility aft.
D. Safety of the gondola service.
13. Redefinition of spaces of gondolas near the piers ACTV
14. Identification of pathways of gondolas in public service freight and safety
of the traits that interfere with public bus service, with requirements on
maneuvers entry into Grand Canal and crossing.
15. Prohibition of passenger embarkation for the gondolas in the piers of the
Danieli Rio (Rio del Vin)
16. Identification of a protected area and precluded other navigation in the
San Marco Basin to ensure safety in the evolution of the gondolas
17. Unequivocal identification of the gondolas / sandoli and gondoliers /
sandolisti in public service non-scheduled, with application to the units of
the number of license / authorization in clearly legible and endowment of
the full and substitute an identification tag
18. Revision of the ferries from parada, keeping only those in service of
effective use and greater attendance
E. Traffic Regulations
19. Revising the rules of movement in the Grand Canal, with a forecast of
traits with no overtaking, the obligation to keep to the right
20. Absolute prohibition from 9 to 20 in the "caravans" of units in the public
service non-scheduled services for the transport of people - gondolas, taxi
and car rental with driver - in the Grand Canal, with review of the sanction
F. Traffic Control
21. Establishment of fixed stations manned control of the Municipal Police in
Rialto and Punta della Dogana
22. Reactivation of the remote control system ARGOS and activation of the
integrated monitoring system with GPS for the purpose of sanctions
23. Compulsory for all motor units, other than a pleasure craft, non-
commercial use, and for units rowing in public service non-scheduled, you
can surf the Grand Canal giveaway and if authorized, to be connected to
the monitoring system with integrated GPS in the remote control system
ARGOS
G. Safety of Navigation
24. Introduction of the prohibition of all units and motor boat in motion using
radio-telephones, allowing only devices with speakerphone or headset
25. Introduction of the prohibition of all units and motor boat in public service
non-scheduled while intoxicated as a result of the use of alcohol or while
impaired psycho-physical due to drug use
26. Introduction of routine mental and physical suitability of all drivers drive
inservice public non-scheduled, to prevent the use of alcohol or drugs

69
Appendix D: Station Data
Appendix E: Canal Segment Data
Appendix F: How Data was Organized
Click on COSES Data unformatted and you will get all data that was received by COSES
during their different campaigns.
Click on Organized Data, a Folder with all the Raw Data available and the Canal and Station
Data will be available.

70
Click on Raw Data
MOTO ONDOSO APPENDICES
Appendix G: Boat Speed Data

71
Boat Speed Data Form
Date: ____________________ Day of the Week: ___________________
Time: _________ to __________
Canal: ______________________
Segment: ________________________
Segment Length (meters): __________________________
Boat Class Legend:
I – Merci III – Diporto/Private V - Altro
II - Persone IV – Servizi
Boat
Class
Time (seconds)
Boat
Class
Time (seconds)
Boat
Class
Time (seconds)

72
Appendix H: Boat Speed Data for Each Canal Segment

73

74
Appendix I: Boat Speed Graphs
Fondamente Nove
Grand Canal
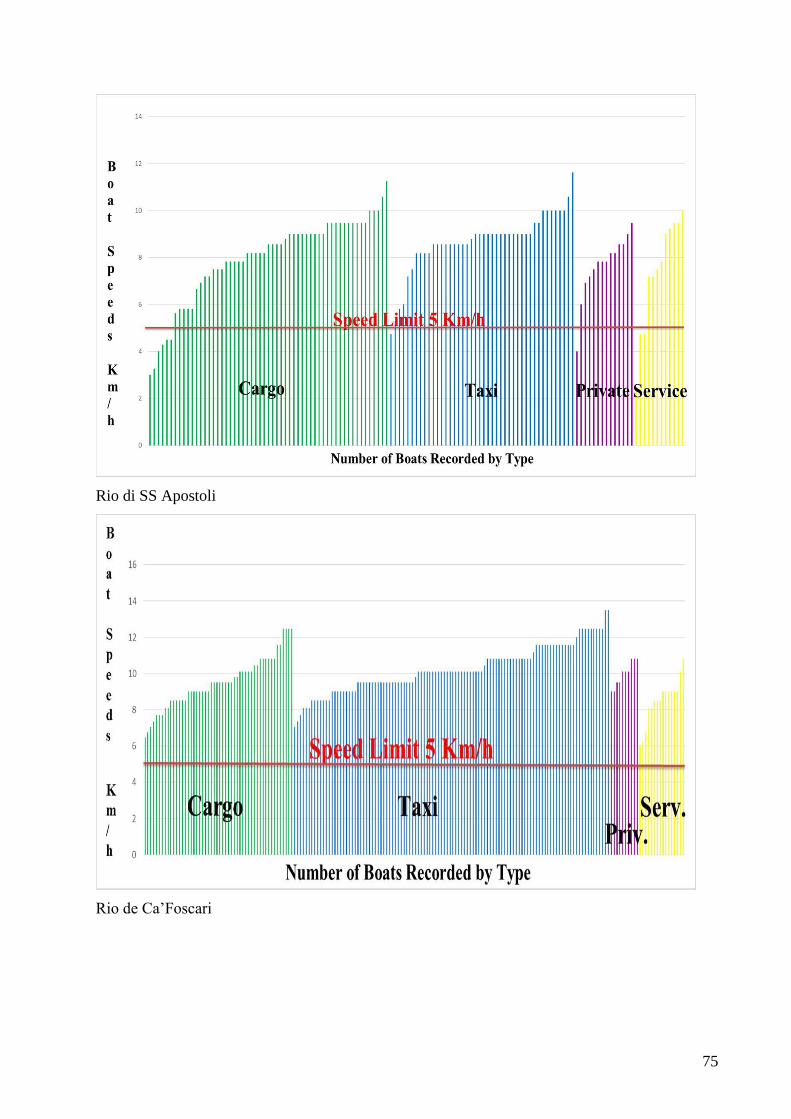
75
Rio di SS Apostoli
Rio de Ca’Foscari

76
Appendix J: Updated and Original Moto Ondoso Index Values
Type 5km/h Zone
7km/h Zone 5km/h 7km/h
Type 1 6.29 9.96 1.28 3.25
Type 2 6.29 9.96 1.28 3.25
Type 3 5.14 16.89 0.36 1.57
Type 4 3.85 6.71 1.68 2.97
Type 5 3.85 6.71 1.68 2.97
Type 6 4.30 6.31 1.74 3.00
Type 7 4.30 6.31 1.74 3.00
Type 8 0.00 0.00 0.00 0.00
Type 9 0.00 0.00 0.00 0.00
Type 10 4.48 6.79 1.68 2.97
Type 11 4.58 13.48 0.36 1.57
Type 12 4.58 13.48 0.36 1.57
Type 13 4.58 13.48 0.36 1.57
Type 14 4.48 6.79 1.68 2.97
Type 15 4.48 6.79 1.68 2.97
Type 16 4.48 6.79 1.68 2.97
Type 17 4.58 13.48 0.36 1.57
Type 18 4.58 13.48 0.36 1.57
Type 19 0.00 0.00 0.00 0.00
Type 20 0.00 0.00 0.00 0.00
Type 21 4.48 6.79 1.68 2.97

77
Appendix K: Equations for Moto Ondoso Index
Type MOI
Type 1 0.015*v^2.7638
Type 2 0.015*v^2.7638
Type 3 0.0003*v^4.402
Type 4 0.109*v^1.698
Type 5 0.109*v^1.698
Type 6 0.13*v^1.6126
Type 7 0.13*v^1.6126
Type 8 0
Type 9 0
Type 10 0.109*v^1.698
Type 11 0.0003*v^4.402
Type 12 0.0003*v^4.402
Type 13 0.0003*v^4.402
Type 14 0.109*v^1.698
Type 15 0.109*v^1.698
Type 16 0.109*v^1.698
Type 17 0.0003*v^4.402
Type 18 0.0003*v^4.402
Type 19 0
Type 20 0
Type 21 0.109*v^1.698

78
Appendix L: COSES Turning Movements
Turn Start End
112 CMIS1 FNUO4
113 CMIS1 CMIS1
114 CMIS1 FNUO2
121 FNUO4 CMIS1
123 FNUO4 CMIS1
124 FNUO4 FNUO2
131 CMIS1 CMIS1
132 CMIS1 FNUO4
134 CMIS1 FNUO2
141 FNUO2 CMIS1
142 FNUO2 FNUO4
143 FNUO2 CMIS1
212 CALA03 GRAN1
213 CALA03 CALA02
214 CALA03 TRNC01
221 GRAN1 CALA03
223 GRAN1 CALA02
224 GRAN1 TRNC01
231 CALA02 CALA03
232 CALA02 GRAN1
234 CALA02 TRNC01
241 TRNC01 CALA03
242 TRNC01 GRAN1
243 TRNC01 CALA02
312 CHIA2 SCOM1
321 SCOM1 CHIA2
412 GIUD04 GIUD03
413 GIUD04 SEBA
421 GIUD03 GIUD04
423 GIUD03 SEBA
431 SEBA GIUD04
432 SEBA GIUD03
512 GIUD07 GIUD06
513 GIUD07 TROV3
521 GIUD06 GIUD07
523 GIUD06 TROV3
531 TROV3 GIUD07
532 TROV3 GIUD06
612 GRAN3 GRAN2
613 GRAN3 NOVO1
621 GRAN2 GRAN3
623 GRAN2 NOVO1
631 NOVO1 GRAN3
632 NOVO1 GRAN2
712 GRAN27 GRAN28
713 GRAN27 CAFO2
721 GRAN28 GRAN27
723 GRAN28 CAFO2
731 CAFO2 GRAN27
732 CAFO2 GRAN28
812 GRAN5 GRAN4
813 GRAN5 MARN
821 GRAN4 GRAN5
823 GRAN4 MARN
831 MARN GRAN5
832 MARN GRAN4
912 NOAL2 NOAL1
913 NOAL2 MISE6
921 NOAL1 NOAL2
923 NOAL1 MISE6
931 MISE6 NOAL2
932 MISE6 NOAL1
1012 GRAN18 GRAN17
1021 GRAN17 GRAN18
1113 GRAN16 APOS4
1114 GRAN18 TEDE
1123 GRAN15 APOS4
1124 GRAN17 TEDE
1131 APOS4 GRAN16
1132 APOS4 GRAN15
1141 TEDE GRAN18
1142 TEDE GRAN16
1212 GRAN36 GRAN35
1213 GRAN36 VIO
1221 GRAN35 GRAN36
1223 GRAN35 VIO
1231 VIO GRAN36
1232 VIO GRAN35
1312 LATE1 LATE2
1313 LATE1 LORE
1321 LATE2 LATE1
1323 LATE2 LORE
1331 LORE LATE1
1332 LORE LATE2
1412 GRAN20 LUCA1
1421 LUCA1 GRAN20
1512 PIER3 GIAR1
1513 PIER3 QUIN
1514 PIER3 ANA
1521 GIAR1 PIER3
1523 GIAR1 QUIN
1524 GIAR1 ANA
1531 QUIN PIER3
1532 QUIN GIAR1
1534 QUIN ANA
1541 ANA PIER3
1542 ANA GIAR1
1543 ANA GIAR1
1612 CANO BACI04
1621 BACI04 CANO
1712 FNUO8 FNUO7
1713 FNUO8 MEND
1721 FNUO7 FNUO8
1723 FNUO7 MEND
1731 MEND FNUO8
1732 MEND FNUO7
1812 SECO01 SECO02
1813 SECO01 CANN1
1814 SECO01 SECO01
1821 SECO02 SECO01
1823 SECO02 CANN1
1824 SECO02 SECO01
1831 CANN1 SECO01
1832 CANN1 SECO02
1834 CANN1 SECO01
1841 SECO01 SECO01
1842 SECO01 SECO02
1843 SECO01 CANN1
1912 NULL NULL
1913 NULL NULL
1914 NULL NULL
1921 NULL NULL
1923 NULL NULL
1924 NULL NULL
1931 NULL NULL
1932 NULL NULL
1934 NULL NULL
1941 NULL NULL
1942 NULL NULL
1943 NULL NULL
2012 NULL NULL
2013 NULL NULL
2021 NULL NULL
2023 NULL NULL
2031 NULL NULL
2032 NULL NULL
2112 NULL NULL

79
2113 NULL NULL
2114 NULL NULL
2121 NULL NULL
2123 NULL NULL
2124 NULL NULL
2131 NULL NULL
2132 NULL NULL
2134 NULL NULL
2141 NULL NULL
2142 NULL NULL
2143 NULL NULL
2212 NULL NULL
2213 NULL NULL
2214 NULL NULL
2221 NULL NULL
2223 NULL NULL
2224 NULL NULL
2231 NULL NULL
2232 NULL NULL
2234 NULL NULL
2241 NULL NULL
2242 NULL NULL
2243 NULL NULL
2312 NULL NULL
2313 NULL NULL
2314 NULL NULL
2321 NULL NULL
2323 NULL NULL
2324 NULL NULL
2331 NULL NULL
2332 NULL NULL
2334 NULL NULL
2341 NULL NULL
2342 NULL NULL
2343 NULL NULL
2412 GRAN12 GRAN11
2421 GRAN11 GRAN12
2513 GRAN24 POLO4
2523 GRAN23 POLO4
2531 POLO4 GRAN24
2532 POLO4 GRAN23
2612 GRAN41 GRAN40
2613 GRAN41 MOIS
2621 GRAN40 GRAN41
2623 GRAN40 MOIS
2631 MOIS GRAN41
2632 MOIS GRAN40

80
REDUCING MOTO ONDOSO APPENDICES
Appendix M:Store Data

81
Appendix N: Dry Delivery Data

82
Appendix O: Refrigerated Delivery Data

83
Appendix P: MOBILIS Extrapolation Data

84
Appendix Q: Zones Data
Appendix R: COSES Straight-Line Distance Matrix

85
Appendix S: Current System Distance Traveled

86
Appendix T: New System Distance Traveled

87
Appendix U: Data for Venice Docks

88

89
Appendix V: Best Docks used for Map Shown in Figure 50

90
Appendix W: Venipedia Pages for each Specific Dock

91

92
Appendix X: Sheets Used to Calculate Moto Ondoso Costs

93
Accosta, Robert. "Re-Engineering the Venetian Taxi Transportation System: Efficiency
Improvements That Reduce Moto Ondoso." (2006).
Amlaw, Karolyn, Carie Lin Kervin, Ignacio Mondine, and Charu Vepari. "Optimization of
Cargo Boat Deliveries through the Inner Canals of Venice." (1997).
Balesano, Jessica, and Jodi Lowell. "Auto-Accretion Powered by Microbial Fuel Cells in the
Venetian Lagoon." (2008).
Candlish, Sean, Craig Shevlin, and Sarah Stout. "The Traditional Boats of Venice: Assessing
a Maritime Heritage." Worcester: Worcester Polytechnic Institute (2004).
Caniato, Giovanni. Venezia La Città Dei Rii: Cierre, 1999.
Chiu, David, Anand Jagannath, and Emily Nodine. "The Moto Ondoso Index: Assessing the
Effects of Boat Traffic in the Canals of Venice." Worcester Polytechnic Institute,
2002.
Duffy, Jill, Justin Gagliardi, Kate Mirtle, and Amanda Tucker. "Re-Engineering the City of
Venice S Cargo System for the Consorzio Trasportatori Veneziani Riuniti." (2001).
Eade, Catherine. "Venice Tourist Warning: 'Cap Visitor Numbers to Avoid Environmental
Catastrophe'." The Daily Mail, 2011.
Friedman, Ron. "Rush Hour Truck Ban Proves Successful." (2010).
"Gottlieb Daimler Memorial in Bad Cannstatt." http://media.daimler.com/dcmedia/0-921-
1303725-1-1303019-1-0-0-0-0-1-11694-614318-0-1-0-0-0-0-
0.html?TS=1302091862634.
Insula. "Venice Preservation and Urban Maintenance." edited by Insula.
Kington, Tom. "Venice Tourist's Gondola Death Prompts Canal Crackdown." The Guardian,
2013.
Lee, Zion. "M-Shaped Boat Hull Helps Save Venice One Wave at a Time." San Diego
Business Journal, Newspaper Article 2001, 32.

94
Li, Lester, Michelle Lynn Carbonneau, Marc Joseph Balboa, Kyle Feeley, Kristen Billiar, and
Fabio Carrera. "Turning Traffic around -- an Analysis of Boat Traffic in Venice and
Its Environmental Impacts." In Technology and Environment. Worcester, MA:
Worcester Polytechnic Institute,, 2008.
Madden, Thomas F. Venice a New History: Penguin Group, 2012.
"Moscow Traffic Rated Worst in World." (2013).
"Tourism 2020 Vision." http://www.unwto.org/facts/eng/vision.htm.