board pd-metromanilafloodproject (20170907) · 352-(&7 6800$5< 6+((7 5hsxeolf ri wkh...
TRANSCRIPT

PD 0023-PHL
September 27, 2017
PROJECT DOCUMENT
OF THE ASIAN INFRASTRUCTURE INVESTMENT BANK
Republic of the Philippines
Metro Manila Flood Management Project
This document has a restricted distribution and may be used by recipients only in performance of their official duties. Its contents may not otherwise be disclosed without AIIB authorization.

ii
CURRENCY EQUIVALENTS (As of September 1, 2017) Currency Unit - Philippine Peso (PhP) PhP 1.00 = US$0.019 PhP51.16 = US$1.00
FISCAL YEAR January 1 – December 31
ABBREVIATIONS AND ACRONYMS
AIIB Asia Infrastructure Investment Bank
ASEAN Association of South East Asian Nations
COA Commission on Audits CSCAND Collective Strengthening on
Community Awareness on National Disasters
CSOs Civil Society Organizations DDR Due Diligence Report DENR Department of Environment
and Natural Resources DPWH Department of Public Works
and Highways ERR Economic rate of return ESIA Environmental and Social
Impact Assessment ESMF Environmental and Social
Management Framework ESMP Environmental and Social
Management Plan FCMC Flood Control Management
Cluster FCSMO Flood Control and Sewerage
Management Office GDP Gross Domestic Product GNI Gross National Income GoP Government of the Philippines HOA Homeowners Associations HUDCC Housing and Urban
Development Coordinating Council
IBRD International Bank for Reconstruction and Development
IEC Information, Education and Communication
IMP Integrity Management Program ISF Informal Settler Families
KSA Key Shelter Agencies LGU Local Government Units LLDA Laguna Lake Development
Authority MDB Multilateral Development
Bank MIS Management Information
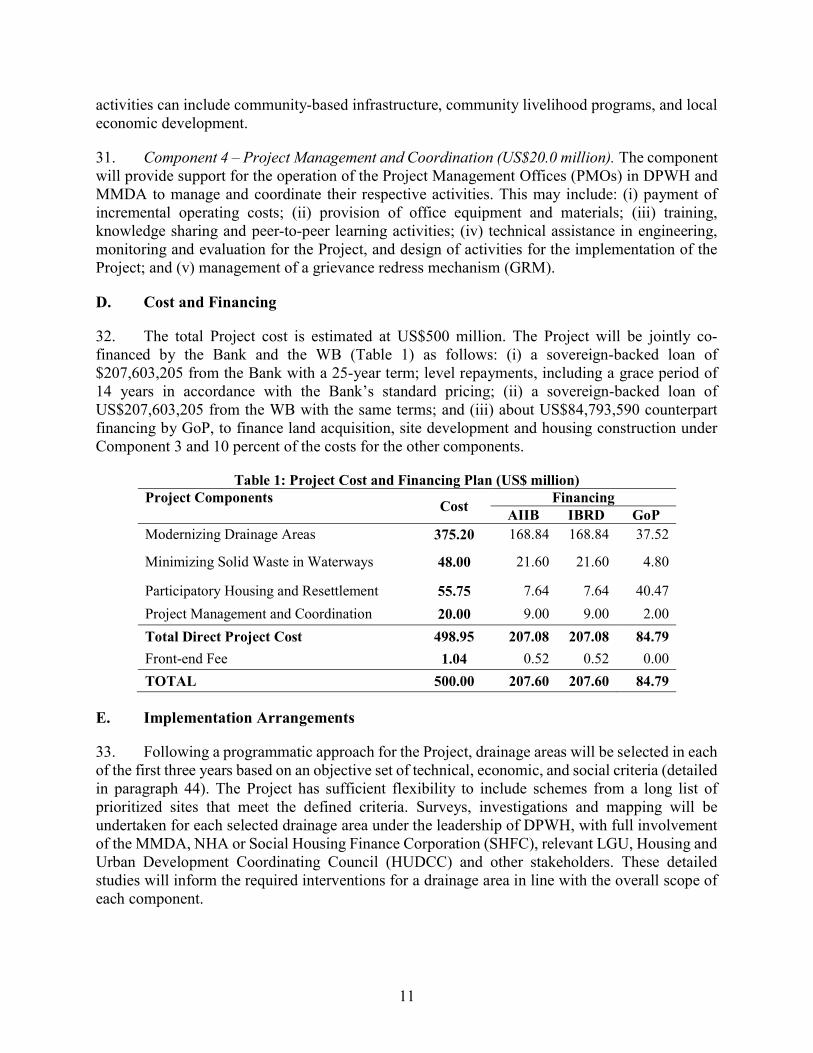
System MM Metro Manila MMDA Metro Manila Development
Authority MoA Memorandum of Agreement NAMRIA National Mapping and
Resource Information Authority
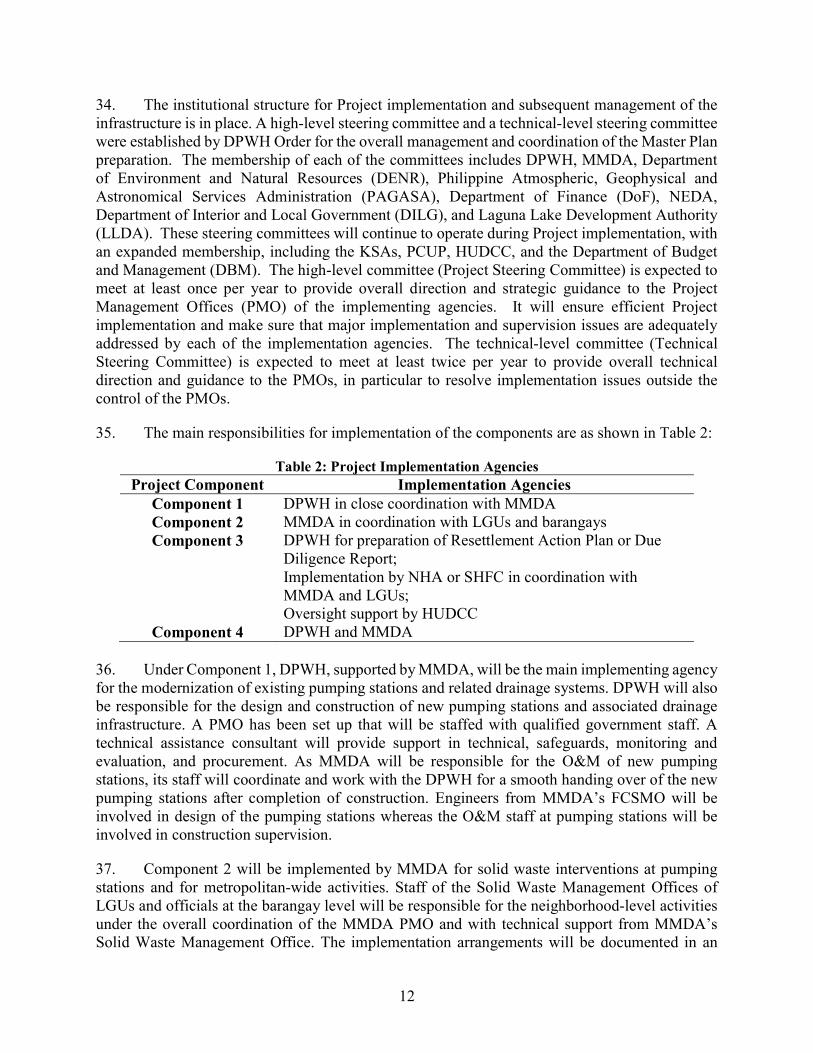
NCR National Capital Region NEDA National Economic and
Development Authority NHA National Housing Authority NPV Net present value O&M Operation and maintenance OP/BP Operational Policy/Bank
Procedures (World Bank) PAGASA Philippine Atmospheric,
Geophysical and Astronomical Services Administration
PAP Project Affected Person PMO Project Management Office PY Project Year RAP Resettlement Action Plan RPF Resettlement Policy
Framework SHFC Social Housing Finance
Corporation SUDS Sustainable Urban Drainage
Systems WB World Bank WRI World Risk Index

ii
CONTENTS OF THE PROJECT DOCUMENT 1. PROJECT SUMMARY SHEET ................................................................................. 1 2. STRATEGIC CONTEXT ............................................................................................ 3
A. Country Context ...................................................................................................... 3 B. Sectoral and Institutional Context ........................................................................... 4
3. THE PROJECT ............................................................................................................ 6 A. Rationale ................................................................................................................. 6 B. Objective ................................................................................................................. 7 C. Project Description and Components...................................................................... 8 D. Cost and Financing ............................................................................................... 11 E. Implementation Arrangements.............................................................................. 11
4. PROJECT ASSESSMENT ........................................................................................ 14 A. Technical ............................................................................................................... 14 B. Economic and Financial ........................................................................................ 15 C. Fiduciary and Governance .................................................................................... 17 D. Environmental and Social ..................................................................................... 19 E. Risks and Mitigation measures ............................................................................. 24
ANNEXES ....................................................................................................................... 26 Annex 1: Results Framework and Monitoring.............................................................. 26 Annex 2: Detailed Project Description ......................................................................... 31 Annex 3: Economic and Financial Analysis ................................................................. 52 Annex 4. Sovereign Credit Fact Sheet- Philippines ...................................................... 57

1
1. PROJECT SUMMARY SHEET
Republic of the Philippines
Metro Manila Flood Management Project
Project No. 0023-PHL Client Borrower(s) Implementation Agency
Republic of the Philippines 1. Department of Public Works and Highways 2. Metro Manila Development Authority (supported by National Housing Authority and Social Housing Finance Corporation)
Sector(s) Subsector(s)
Water Flood Management
Project Objectives / Brief Project Description
The Project objective is to improve flood management in selected areas of Metro Manila. This will be achieved through the following activities: (i) modernizing of drainage areas, involving construction of new pumping stations or rehabilitation of existing ones and associated drainage infrastructure; (ii) strengthening of solid waste collection and disposal; and (iii) supporting participatory housing and resettlement, involving land acquisition, housing construction, rental support and livelihood assistance.
Project Implementation Period (Start Date and End Date)
Start Date: October 1, 2017 End Date: May 31, 2024
Expected Loan Closing Date November 30, 2024 Project cost and Financing Plan
Total Project Cost: $500M Financing Plan: AIIB: US$207,603,205 WB: US$207,603,205 GoP: US$84,793,590
AIIB Loan (Size and Terms)
US$207,603,205 25-year term; level repayments, including a grace period of 14 years, in accordance with the Bank’s standard pricing.
Co-financing (If any) (Co-financier(s), Size and Terms)
WB: US$207,603,205, an IBRD loan 25-year term; level repayments, including a grace period of 14 years.
Environmental and Social Category
A Project Risk (Low/Medium/High) High
2
Conditions for Effectiveness and Disbursement (If any)
1. Cross-Effectiveness of the IBRD’s Loan Agreement.
2. Effectiveness of the Project Co-Lenders’ Agreement
Key Covenants 1. The Borrower shall establish and maintain a Project Steering Committee and a Technical Steering Committee.
2. The Borrower shall establish and maintain Project Management Offices (PMOs) in DPWH and MMDA.
3. The Borrower shall ensure that the implementation of all Project activities complies with Safeguard Documents, Project Operations Manual, Prohibited Practices and IBRD’s Anti-Corruption Guidelines.
4. The Borrower shall maintain and operate throughout the Project implementation period a Grievance Redress Mechanism.
Policy Assurance The Vice President, Policy and Strategy confirms an overall assurance that the Bank is in compliance with the policies applicable to the Project.
President Jin Liqun Vice-President, CIO D. J. Pandian Director General, Investment Operations Supee Teravaninthorn Manager, Investment Operations Ke Fang Project Team Leader Ghufran Shafi, Senior Investment Operations Specialist Project Team Members Alexander I. Ugut, Principal Risk Specialist Bin Wang, Senior Policy & Strategy Officer Chongwu Sun, Senior Environment Specialist Jang Ping Thia, Senior Economist Jessana A. Yanuario, Finance Officer Kishor Uprety, Senior Counsel Somnath Basu, Senior Social Development Specialist Xiaowei Guo, Senior Procurement Specialist Yige Zhang, Project Assistant
3
2. STRATEGIC CONTEXT A. Country Context 1. The Republic of the Philippines is the second most populous country in the Association of South East Asian Nations (ASEAN) with a gross domestic product (GDP) of US$305 billion and a population of 103.3 million. Its growth over the past decade has allowed it to emerge as a confident middle-income country and one of the most vibrant economies in the Asia and Pacific region. The economy, on average, has grown 6.2 percent per year in 2010-2015, in line with the major economies in the region. Real GDP grew by 5.9 and 6.8 percent in 2015 and 2016, respectively, driven by household consumption, private construction, and exports of goods and services. The robust economic growth has been characterized by strong macroeconomic fundamentals, which has led to low and stable inflation, a healthy current account surplus and a falling debt burden. 2. After years of stagnation, the officially measured poverty rate declined by three percentage points in 2013 over 2012, dropping to 24.6 percent. However, in the first half of 2014, poverty increased by one percentage point.1 Despite this slight increase, attributed in part to Typhoon Yolanda, 2 the poverty rate dropped below 24 percent by the end of 2015. Moreover, increases in income are becoming slightly more progressive, as the real income of the bottom 30 percent of the population has been rising steadily faster than that of higher income classes. The per capita income of the bottom 30 percent grew over 20 percent in 2012-2015, while the average income of all households grew by 15.3 percent. 3. The International Monetary Fund is optimistic about the outlook for the Philippine economy in the near future, projecting that it will maintain its momentum, based on continued policy reforms and an increase in public spending, including for public infrastructure. At the same time, unemployment is projected to decline and inflation to stabilize. Strong economic growth will be led by capital investments, overseas remittances and an increase in global demand, which will drive exports. These strong economic fundamentals and sound development policies should enable the Government of the Philippines (GoP) to respond to the risks in outlook on the economic and development front. 4. However, despite a solid macroeconomy and impressive reduction in poverty, considerable challenges remain in achieving sustained inclusive growth. Vulnerability to poverty remains a major concern. Of the 1.1 million entrants to the labor force annually, only 22 percent obtain employment in the domestic formal sector. Better jobs are needed for the 21 million Filipinos who are informally employed and have few skills. Among the 10 million poorest Filipinos, only 100,000 (1 percent) have a college education. Many Filipinos still hover just above the poverty line (“near poor”), cycling in and out of poverty due to high vulnerability to climatic, disaster, financial, and price shocks. 1 World Bank (2015), Philippine Economic Update, October 2015. 2 The typhoon displaced 4.1 million people, destroyed over a half million houses and damaged another half million. Around 8,000 people died or went missing. Approximately six million workers were affected by the typhoon. The value of damaged physical assets, both public and private, was estimated at 3.7 percent of GDP.

4
B. Sectoral and Institutional Context 5. Flooding and other water-related disasters have the potential to undermine the Philippines’ strong economic gains and development outcomes. Geographically, the Philippines is located in one of the global hotspots for high disaster risks. The United Nations University Institute for Environment and Human Security ranks the Philippines at number three on its World Risk Index (WRI).3 The WRI is based on exposure to multiple natural hazards, and the Philippines is highly exposed to two of them – cyclones and floods. 4 According to data compiled by the Asian Development Bank, of the 1,000 average annual fatalities due to natural disasters, 75 percent can be attributed to typhoons and associated flooding. In economic terms, storms and floods cause an average annual loss of more than US$200 million, apart from the considerable loss of human lives. The economic cost of tropical storm Ondoy and typhoon Pepeng, which hit the country in 2009, was estimated at 2.7 percent of GDP. 6. Metro Manila is situated in a low-lying semi-alluvial floodplain, open to Manila Bay on the west and to a large lake, Laguna de Bay, on the southeast. It constitutes a vast urbanized basin that drains the flash floods of the northern and northeastern mountain ranges and is frequently inundated by the overflowing Pasig-Marikina river system during typhoons. Despite its vulnerability and exposure to water-related disasters, rapid urbanization of the area continues unabated. Much of the urban area is insufficiently protected from flooding as natural drainage is restricted during rainfall by high river and seawater levels. 7. Rainfall in the Philippines is especially intense during the typhoon season, June through October, when the country typically receives 80 percent of its annual rainfall; in Metro Manila, this means about 1,700 mm of the annual average precipitation of 2,100 mm. Floods are a recurrent problem in the city, inundating housing and other buildings, and affecting traffic. Urban drainage, a crucial element in the city’s Master Plan, relies on a combination of drainage channels, waterways and pumping stations. 8. Flood Management. The Department of Public Works and Highways (DPWH) is responsible for country-wide planning, construction, and maintenance of infrastructure, such as national roads and bridges, flood control systems, water resources projects, and other public works. Historically, DPWH was also responsible for the design, construction, and management of large pumping stations in Metro Manila. However, through a Memorandum of Agreement (MoA) signed in 2002, DPWH turned over to the Metro Manila Development Authority (MMDA) all functions and responsibilities for flood control management in Metro Manila, including all relevant programs, projects and activities, personnel, funds, equipment, facilities, records, assets and liabilities. DPWH, through its Flood Control Management Cluster (FCMC), still supports urban drainage development in Metro Manila, through the design and construction of pumping stations and the dredging of major rivers and waterways. MMDA, through its Flood Control and Sewerage Management Office (FCSMO), presently operates 57 pumping stations spread throughout the 3 United Nations University, Institute for Environment and Human Security. 2016. World Risk Report. Bonn. The index is based on calculations drawing on the formula: exposure times vulnerability. Vulnerability is calculated through a weighted aggregation process whereby susceptibility, lack of coping capacities and lack of adaptive capacities are aggregated or multiplied. 4 See, for example: World Bank. 2005: Natural Disaster Hotspots: A Global Risk Analysis. Washington D.C.
5
metro area, 23 of which are major, to discharge drainage water from populated areas into waterways and rivers. In addition, MMDA also manages 17 relief pumping stations in flood-prone areas, such as Navotas and Malabon. Many of these pumping stations and appurtenant infrastructure were constructed several decades ago, however, and no longer function as designed. 9. Solid Waste Management. Metro Manila generates about 9,200 tons of waste per day. MMDA is the main metropolitan government entity responsible for the identification and management of sanitary landfills, in partnership with private landfill operators. The Ecological Solid Waste Management Act of 2000 (Republic Act, RA 9003) mandates barangays (lowest elected political units in the Philippines) to ensure waste segregation and undertake basic waste collection, while Local Government Units (LGUs) are responsible for larger-scale collection, transfer, and final disposal of solid waste at designated landfill facilities. Most LGUs contract out collection and disposal, for which about 1,400 trucks were available as of 2014. Collection efficiency in Metro Manila is estimated at 80 percent, with the remaining 20 percent either burned in backyards, left on the streets, or disposed of in waterways. 10. Solid waste that accumulates at pumping stations adversely affects the efficiency of the pumping mechanisms, another reason why many pumping stations in Metro Manila are functioning below their rated capacity. Most of the solid waste accumulating at pumping stations is residual (rather than recyclable), such as plastic bags, styrofoam food containers, tetrapak containers, and small single-use sachets. Decomposing and settled solid wastes together with silt sediments accumulate in waterways and pumping stations’ retention or settling basins, thereby reducing their holding capacity. 11. ISFs and Relocation Efforts. Strong growth in the country’s capital attracts an increasing number of migrants from rural areas in search of better jobs. Metro Manila is home to a population of about 15 million, with a population density in excess of 20,000 persons per square kilometer. These migrants typically occupy low-paying jobs, and frequently end up living in informal settlements, which are characterized by lack of security of tenure, poor living conditions, and often high exposure to natural disasters, especially flooding. While an accurate number is difficult to discern, the National Housing Authority (NHA) estimates that there are about 600,000 Informal Settler Families (ISFs) in Metro Manila, or almost 2.8 million people.5 This represents about one out of every five persons in the metropolitan area. Many ISFs live along and even over drainage channels and waterways that connect to pumping stations, impeding the flow of water, and making access to waterways for maintenance difficult. 12. Over the years, the GoP has implemented several affordable housing programs for ISFs. Approaches have evolved from centrally-administered government-led schemes to more decentralized participatory ones. Past efforts mainly involved off-city resettlements, which were subject to resistance and criticism, mostly for lack of consideration of the adverse socio-economic impacts on affected households, such as loss of economic livelihood opportunities, lack of adequate access to basic services, and disruption of social networks. Due to the absence of opportunities for livelihood restoration and/or mismatch between skills and job opportunities, ISFs
5 Calculated based on an average household of 4.6 members.
6
resettled to off-city sites often experience a sharp decline in incomes and end up returning to the informal settlements in Metro Manila. 13. In 2011, the GoP launched the Oplan Likas Program: Lipat para Iwas Kalamidad At Sakit (Operational Plan: Evacuation to Prevent Calamity and Sickness), which aims to relocate about 104,000 ISFs out of danger areas, including waterways. PhP 50 billion (approximately US$1.05 billion) was allocated over a five-year period, between 2011 and 2016, to finance land acquisition and housing construction. Taking global and national best practices into account, Oplan Likas advocated for in-city relocation within the vicinity of ISF livelihoods, with off-city relocation as a last resort.6 Yet, due to lack of affordability, land constraints, and institutional challenges, among other factors, about 67 percent of the resettlement under Oplan Likas that had taken place by April 2015 was off-city under NHA.7
3. THE PROJECT A. Rationale 14. Strategic Fit. To prevent and control flooding in Manila and its surrounding areas, the DPWH initiated a holistic Flood Management Master Plan in 2011. The World Bank (WB) provided technical and financial support for developing the Master Plan, which was approved by the National Economic and Development Authority (NEDA) Board in September 2012. The plan sets priority structural and non-structural measures for sustainable flood management in Metro Manila to be implemented by 2035, at a total estimated cost of PhP 352 (US$7.5 billion). The main elements of the Master Plan are: (i) structural measures to reduce flooding from river systems that run through the city, including a high dam in the upper Marikina River catchment area; (ii) structural measures to eliminate long-term flooding in the flood plain of Laguna de Bay; (iii) structural measures to improve urban drainage; (iv) non-structural measures such as flood forecasting and early warning systems and community-based flood risk management; and (v) recommendations for an improved institutional structure to deal with flood management. 15. All the above interventions are crucial for overall flood management in Metro Manila. The rationale for the involvement of the AIIB (the Bank) is to provide support for implementation of Master Plan activities linked to improvement in urban drainage, and assist with scaling up “easy” interventions that the GoP has already initiated, such as river bank protection and improvement of pumping infrastructure. The Project will promote social and economic development in Metro Manila, in accordance with the Bank’s mandate, which seeks to foster sustainable growth and infrastructure development through investing in infrastructure in the region. While the Project is expected to generate positive impacts and benefits, in the near term, these will be mostly social 6 Republic of the Philippines (2013). Draft Joint Memorandum Circular (signed by Secretary of Interior and Local Government) on “Policy Guidelines on the Operationalization and Utilization of the PhP 50 billion Housing Fund for ISFs in Danger Areas of the NCR.” Article 1 states that “relocation of the affected ISFs shall be on-site, near-city, and in-city” and that “off-sites shall only be resorted to in accordance with the People’s Plans after adequate and genuine consultation or when directly requested by the affected ISFs themselves.” 7 As of April 30, 2015, NHA had completed 46,077 units, of which 25,049 units were occupied, with 96 percent of the occupied units in off-city sites. The Social Housing Finance Corporation (SHFC) had approved construction of about 11,000 units under its High-Density Housing program, all of which are in-city.

7
and intangible and, therefore, the Project is unlikely to attract any private investment. Support from multilateral development banks (MDBs) and institutions is needed to raise adequate financial resources for Project implementation. Additionally, technical assistance from MDBs is also critical, as some elements of the program, such as climate resilience, require global knowledge and technical expertise, which can only be mobilized with the help of these institutions. 16. Value added of the Bank’s support. The Bank’s assistance will deliver institutional and technical benefits by helping DPWH and MMDA in planning and implementing large scale multi-sectoral projects. These agencies will benefit through capacity-building opportunities in planning, designing and implementing current techniques and best practices in urban drainage and flood protection and climate-resilient infrastructure. The unique hydro-geological features of Metro Manila – including the low retention of the upstream watershed, the tidal variations in the downstream receiving body, Manila Bay, and the unfavorable urban characteristics – makes flood hydrology very complex. A complete and detailed analysis requires deployment of updated tools, knowledge and computational resources. The Bank, in partnership with the WB, will mobilize required expertise and skills so that interventions can be designed using in-depth hydrological and hydraulic assessments. Under a technical assistance activity, the WB contracted Deltares 8 to perform detailed hydrological studies in five drainage areas. Based on these studies and hydrodynamic modeling of pumps, engineering recommendations were made for modernization of the pumping stations of each drainage area. The Bank will reinforce continued leveraging of global knowledge to manage urban flooding in the remainder of the drainage areas. 17. The Bank has also been providing technical inputs to the WB team on addressing the legacy issues pertaining to earlier displacement of affected people in areas within the technical footprint of the Project (see Section 4.D). The Bank’s inputs will support measures to achieve broad consistency between the resettlement that occurred before the WB’s interventions and the resettlement planned under the current interventions. In addition, the Bank will help to resolve resettlement-related issues in the specific context of the Project. The Bank will work with the WB to ensure effective implementation of the Environmental and Social Management Plan (ESMP) and the Resettlement Action Plan (RAP) for the Project through joint review missions and monitoring. 18. At the same time, co-investment with the WB provides a strategic entry point for the Bank to engage with an important ASEAN country in urban infrastructure – a thematic priority of the Bank. B. Objective 19. The Project objective is to improve flood management in selected areas of Metro Manila. This will be achieved by constructing new pumping stations and modernizing existing ones, rehabilitating the supporting infrastructure and improving the associated drainage system; improving solid waste management practices within the vicinity of the drainage systems of
8 Deltares is a Netherlands-based independent institute and provides advanced services in water and environmental engineering including applied research in flood sciences.

8
selected pumping stations; and supporting the resettlement of Project Affected Persons (PAPs, mostly ISFs). 20. Project results will be measured by the following indicators: (i) flood-prone areas that are free of water within 24 hours after a major rainfall event (measured in hectares); (ii) direct Project beneficiaries, (measured in number of beneficiaries, including women); (iii) solid wastes collected at targeted existing pumping stations (measured in cubic meters); (iv) households permanently resettled from areas where their housing would otherwise obstruct O&M of the drainage systems (measured in number of households); and (v) beneficiaries satisfied with reduced vulnerability to flooding in Project areas (measured as percentage). C. Project Description and Components 21. The Philippines is highly exposed to climate change induced events. Possible impacts for Metro Manila include higher-intensity rainfall events – the most likely scenario is a 12 percent increase in rainfall by 2050. This, combined with a sea level rise estimated at 24 cm by 2050, is expected to worsen urban drainage. The Project will focus on 56 potentially critical drainage areas in 11 LGUs, covering a total estimated drainage area of 11,100 ha or over 17 percent of the total area of Metro Manila. The total population of the 56 drainage areas is estimated at 3.5 million (760,000 households). The direct Project beneficiaries, i.e., those adversely affected by regular flooding, are estimated at 1.7 million (370,000 households). These numbers were derived from overlaying population and flood risk maps. About 50 percent of the direct beneficiaries will be female. Direct Project benefits include the reduction of damage to properties and infrastructure and reduction in income loss (livelihood and business). The Project components are detailed in this section. 22. Component 1 – Modernizing of Drainage Areas (US$375.2 million). The Project will construct an estimated 20 new pumping stations and modernize about 36 existing ones. Improvements in the appurtenant infrastructure, associated waterways and draining channels will also be carried out. Modern, efficient, and high capacity pumping units will be installed. The design discharge determination will be underpinned by hydrological studies of the drainage areas and efficient pumps will be selected for each given site. Appurtenant infrastructure such as flood gates and trash racks will be rehabilitated as necessary. The energy source will, where needed and possible, be changed from diesel to electricity. The component will also finance dredging, including accumulated sediments and solid waste, and improvements to waterways and drainage channels. 23. The component will develop asset management plans, as a minimum for the larger pumping stations, and operational manuals will be prepared or updated for all pumping stations and associated waterways. These will support MMDA with good O&M of the pumping stations and other drainage infrastructure and inform budget requirements. The component will provide specialized, modern maintenance equipment for waterways, such as floating dozers, couple pontoons, and remote-controlled cleaners for closed drains and interceptors. This will not only enable DPWH and MMDA to carry out emergency cleaning operations but also demonstrate to private contractors the availability of resources for efficient waterway cleaning. Modern equipment for removal of water hyacinth will be introduced, along with programs that encourage processing hyacinth products as community livelihood activities, which are practiced by women

9
in particular, and production of biogas on a pilot basis. DPWH also intends to test and demonstrate some of the maintenance equipment in other principal cities, including Cebu and Davao. 24. A program to increase the water retention capacity within the Project drainage areas will be developed and implemented where suitable and possible. This includes green and other infrastructure such as rooftop rainwater collection, green roofs, permeable pavements, and temporary retention of drainage water in public areas such as basketball courts and parking garages. The need for non-structural interventions will be limited. However, as part of the design of specific interventions in each drainage area, there may be activities related to community-based flood risk management and setting up of local warning systems, etc. 25. Component 2 – Minimizing Solid Waste in Waterways (US$48 million). Solid wastes that accumulate in waterways significantly reduce the water carrying and retention capacities and negatively affect pumping station efficiencies. Activities under this component will be organized on a spatial scale, focusing at a neighborhood-level on areas upstream of pumping stations, and to a lesser extent on metropolitan-wide activities. The component will build on the existing systems implemented by LGUs, barangays, and households. The rationale for this approach is to ensure a comprehensive and effective set of interventions to address the challenges of solid waste in waterways. This will be complemented by specific, customized activities undertaken at appropriate locations and scales, avoiding a “one-size fits all” approach. 26. Neighborhood-level activities in the vicinity of the pumping stations, waterways and drainage channels will include improved solid waste collection services; community mobilization and awareness creation; incentive-based improved waste collection with independently verifiable results; and neighborhood upgrading. LGUs within the designated Project areas along waterways may choose a combination of some or all of these options based on their local needs. Improved solid waste collection services will involve the provision of equipment such as bins, push carts, and larger storage containers that are appropriate for local-level waste collection in a barangay or municipality. Trash loaders, compactors and other equipment that will facilitate the removal of the trash from the vicinity of pumping stations will also be provided. Community mobilization will involve a combination of local-level information, education and communication (IEC) campaigns, with the involvement of local-level block leaders, to raise awareness and encourage behavior change for improved solid waste management at the individual and household level. Financial incentives to barangays will encourage behavior change by basing incentive payments on independently verified results of improved waste collection and reduced waste quantities at pumping stations. Investments in neighborhoods will beautify selected waterways and easements to discourage indiscriminate disposal of waste into the waterways. 27. The component will also carry out metropolitan-wide activities for improved solid waste management, including a large-scale metro-wide IEC campaign; the development and installation of an integrated management information system (MIS); and preparation of a solid waste master plan for Metro Manila. The metro-wide IEC campaign will complement the local-level IEC and will focus on reducing solid waste, recycling, proper disposal of solid waste, and the impact on landfills. An integrated MIS is crucial for improved operation and performance of Metro Manila’s overall solid waste management system. The MIS will help track the implementation of other activities under this component, as well as enable MMDA to better monitor waste collection activities and track performance, and thus deploy needed resources to critical sites in a more
10
strategic, dynamic and efficient manner. The solid waste master plan will provide the overall framework for a strategic and coordinated vision for all of Metro Manila, including assessment of waste-to-energy opportunities and development of new landfills. In the context of existing national frameworks and guidelines, the master plan will provide specific guidance for LGUs, while strengthening the role of MMDA in managing inter-jurisdictional activities. If confirmed by the master plan, the Project will support, where feasible, MMDA’s agenda to apply appropriate technologies to reduce the volume of residual solid waste that ends up in landfills. Waste processing equipment could include waste-to-energy facilities, the suitability of which will be determined taking into account the full range of costs and benefits, including externality effects. This is in addition to other interventions to reduce the waste volume that may be introduced at pumping stations, such as the use of shredding machines. If the viability of technical and financial solutions is justified by studies, loan proceeds may be used to support one or two interventions on a pilot basis. An amount of US$15 million has been preliminarily earmarked for such pilots under this component, but the final decision on financing is subject to the assessment of the technical, economic, environmental and social viability of the proposed interventions. 28. Component 3 – Participatory Housing and Resettlement (US$55.75 million). A small number of new pumping station sites require resettlement of PAPs to allow new construction. Resettlement is also needed from the technical footprint of an estimated 16 drainage areas. The magnitude of PAPs to be resettled, mostly ISFs, is expected to be around 2,500 households, but the actual number of ISFs may change based on the pumping stations that will ultimately be included in the Project. The resettlement aims to strengthen the affected people’s resilience to external risks. 29. The component will carry out a program of activities to resettle people away from the technical footprints by providing access to better housing and basic services and building stronger community organizations. This includes land acquisition, site development, housing construction, rental support for a transition period of up to 24 months as needed,9 and livelihood assistance programs. Technical assistance and capacity building activities will strengthen the ability of the community organizations, LGUs, and implementing and housing agencies to implement resettlement programs. To allow flexibility and cater to varying needs of PAPs, up to three standard resettlement options will be offered, with priority being in-city resettlement in vertical housing. Other possible options include: near-city resettlement – defined as areas that will result in minimal economic dislocation and with secure access to basic services – where people can commute to their livelihoods of origin; and self-resettlement with cash payment. Other preferred options expressed during consultations with PAPs (e.g., off-city resettlement) will be considered as well. Screening of option feasibility will be undertaken before consulting with PAPs, so that only affordable options are presented. 30. The component will assess needs and finance either individual assistance activities and/or community development activities at resettlement sites for PAPs. Community development 9 The average 24-month transition period is expected only for in-city resettlement. Rental assistance will be provided to PAPs who have agreed to vacate their current dwellings for temporary rented houses in the vicinity of their current area of residence so that activities in the drainage area can commence as early as possible. The Project will help PAPs find houses/rooms for rent. This measure is expected to be acceptable to PAPs as they will not be moved from their current sources of livelihood.
11
activities can include community-based infrastructure, community livelihood programs, and local economic development. 31. Component 4 – Project Management and Coordination (US$20.0 million). The component will provide support for the operation of the Project Management Offices (PMOs) in DPWH and MMDA to manage and coordinate their respective activities. This may include: (i) payment of incremental operating costs; (ii) provision of office equipment and materials; (iii) training, knowledge sharing and peer-to-peer learning activities; (iv) technical assistance in engineering, monitoring and evaluation for the Project, and design of activities for the implementation of the Project; and (v) management of a grievance redress mechanism (GRM). D. Cost and Financing 32. The total Project cost is estimated at US$500 million. The Project will be jointly co-financed by the Bank and the WB (Table 1) as follows: (i) a sovereign-backed loan of $207,603,205 from the Bank with a 25-year term; level repayments, including a grace period of 14 years in accordance with the Bank’s standard pricing; (ii) a sovereign-backed loan of US$207,603,205 from the WB with the same terms; and (iii) about US$84,793,590 counterpart financing by GoP, to finance land acquisition, site development and housing construction under Component 3 and 10 percent of the costs for the other components.
Table 1: Project Cost and Financing Plan (US$ million) Project Components Cost Financing
AIIB IBRD GoP Modernizing Drainage Areas 375.20 168.84 168.84 37.52 Minimizing Solid Waste in Waterways 48.00 21.60 21.60 4.80 Participatory Housing and Resettlement 55.75 7.64 7.64 40.47 Project Management and Coordination 20.00 9.00 9.00 2.00 Total Direct Project Cost 498.95 207.08 207.08 84.79 Front-end Fee 1.04 0.52 0.52 0.00 TOTAL 500.00 207.60 207.60 84.79
E. Implementation Arrangements 33. Following a programmatic approach for the Project, drainage areas will be selected in each of the first three years based on an objective set of technical, economic, and social criteria (detailed in paragraph 44). The Project has sufficient flexibility to include schemes from a long list of prioritized sites that meet the defined criteria. Surveys, investigations and mapping will be undertaken for each selected drainage area under the leadership of DPWH, with full involvement of the MMDA, NHA or Social Housing Finance Corporation (SHFC), relevant LGU, Housing and Urban Development Coordinating Council (HUDCC) and other stakeholders. These detailed studies will inform the required interventions for a drainage area in line with the overall scope of each component.
12
34. The institutional structure for Project implementation and subsequent management of the infrastructure is in place. A high-level steering committee and a technical-level steering committee were established by DPWH Order for the overall management and coordination of the Master Plan preparation. The membership of each of the committees includes DPWH, MMDA, Department of Environment and Natural Resources (DENR), Philippine Atmospheric, Geophysical and Astronomical Services Administration (PAGASA), Department of Finance (DoF), NEDA, Department of Interior and Local Government (DILG), and Laguna Lake Development Authority (LLDA). These steering committees will continue to operate during Project implementation, with an expanded membership, including the KSAs, PCUP, HUDCC, and the Department of Budget and Management (DBM). The high-level committee (Project Steering Committee) is expected to meet at least once per year to provide overall direction and strategic guidance to the Project Management Offices (PMO) of the implementing agencies. It will ensure efficient Project implementation and make sure that major implementation and supervision issues are adequately addressed by each of the implementation agencies. The technical-level committee (Technical Steering Committee) is expected to meet at least twice per year to provide overall technical direction and guidance to the PMOs, in particular to resolve implementation issues outside the control of the PMOs. 35. The main responsibilities for implementation of the components are as shown in Table 2:
Table 2: Project Implementation Agencies Project Component Implementation Agencies
Component 1 DPWH in close coordination with MMDA Component 2 MMDA in coordination with LGUs and barangays Component 3 DPWH for preparation of Resettlement Action Plan or Due
Diligence Report; Implementation by NHA or SHFC in coordination with MMDA and LGUs; Oversight support by HUDCC
Component 4 DPWH and MMDA 36. Under Component 1, DPWH, supported by MMDA, will be the main implementing agency for the modernization of existing pumping stations and related drainage systems. DPWH will also be responsible for the design and construction of new pumping stations and associated drainage infrastructure. A PMO has been set up that will be staffed with qualified government staff. A technical assistance consultant will provide support in technical, safeguards, monitoring and evaluation, and procurement. As MMDA will be responsible for the O&M of new pumping stations, its staff will coordinate and work with the DPWH for a smooth handing over of the new pumping stations after completion of construction. Engineers from MMDA’s FCSMO will be involved in design of the pumping stations whereas the O&M staff at pumping stations will be involved in construction supervision. 37. Component 2 will be implemented by MMDA for solid waste interventions at pumping stations and for metropolitan-wide activities. Staff of the Solid Waste Management Offices of LGUs and officials at the barangay level will be responsible for the neighborhood-level activities under the overall coordination of the MMDA PMO and with technical support from MMDA’s Solid Waste Management Office. The implementation arrangements will be documented in an

13
MoA to be signed between MMDA and the respective LGU. For example, LGUs and barangays may request solid waste equipment. After vetting the request, MMDA will undertake the procurement of the machinery for the use of the LGUs and barangays. MMDA will also lead the non-structural activities under the component, such as IEC, incentive and behavior change initiatives, citizen feedback and other necessary “soft” interventions. 38. Component 3 will adopt a participatory approach and multi-stakeholder partnership in implementation. Communities to be resettled will be given full information regarding various resettlement options to ensure that they are adequately informed and consulted, and are able to plan and engage with relevant stakeholders. The preparation of RAPs and due diligence reports (DDR) to be implemented under Component 3 will be the responsibility of DPWH, in close cooperation with MMDA, HUDCC and NHA or SHFC. The RAP or DDR will stipulate the arrangements for their implementation. NHA and SHFC will be the direct implementing agencies for all activities related to resettlement, with HUDCC providing oversight along with DPWH. NHA and SHFC will be responsible for (i) consulting PAPs on resettlement options, (ii) land acquisition, (iii) housing and site development, (iv) contracting service providers for social preparation and technical studies, (v) provision of rental assistance to PAPs and (vi) engaging service providers to implement livelihood support activities for PAPs. A geographical division of labor has been agreed between NHA and SHFC, whereby the former will be the lead agency for Manila, Pasay, San Juan, and Makati – the southern and western areas of the National Capital Region (NCR), whereas the latter will be the lead agency for Quezon City, Malabon, Muntinlupa, and Pasig. However, if certain communities in the designated LGUs already have ongoing/planned partnerships or have preferences for either one of the agencies, communities will be assigned to either one of the agencies on an individual basis, irrespective of the geographical location. 39. A Housing and Resettlement Team within the DPWH PMO will be staffed with qualified government personnel and assisted by implementation support consultants. The Team will consist of a team leader, housing and resettlement specialist(s), livelihood specialist(s), supervising engineer(s) and monitoring and evaluation specialist(s), who will also act as grievance redress officer(s). On-field resettlement activities will be anchored by LGUs. Assisted by the DPWH PMO, each participating LGU will be required to establish a Housing and Resettlement Team to handle the day-to-day implementation of resettlement activities. This Team will be composed of officials and staff drawn from relevant LGU offices (Urban Poor Affairs Office/Urban Settlements Office, City Social Welfare and Development, and City Engineering Office), designated personnel from NHA/SHFC, and representative(s) from civil society organizations (CSOs), who will be engaged to carry out social preparation activities. Officials and staff from other city departments including the Budget Office, City Planning and Development Office and City Environment and Natural Resources Office may be engaged. 40. Procurement. Procurement for the Project will be carried out in accordance with the WB’s “Guidelines: procurement of goods, works, and non-consulting services under IBRD Loans and IDA credits and grants by World Bank borrowers,” dated January 2011 revised July 2014; and “Guidelines: selection and employment of consultants under IBRD loans and IDA credits and grants by World Bank borrower,” dated January 2011 revised July 2014, and the provisions stipulated in the Loan Agreement. While the Philippine Procurement Law (RA 9184) is in reasonable harmony with the WB’s Guidelines at the NCB level, the Procurement Schedule of the

14
Loan Agreement will detail those procedures that are not acceptable to the WB and provisions that will apply when NCB is used. 41. Procurement of works will include modernizing pumping stations and appurtenant infrastructure such as flood gates, cleaning and improving waterways, fixing manholes, access roads, greenways, electrical connections, and material recovery and water retention facilities. Goods to be procured under the Project will include pumps, specialized waterway maintenance and cleaning equipment, garbage bins, recycling containers, trucks, vehicles, office equipment, etc. Consulting firms and individual consultants will be procured for technical assistance and operational support, capacity building and various studies for Project implementation and monitoring, feasibility study and detailed engineering design, IEC and advocacy, and community organizing activities. Applicable procurement methods for each specific contract will depend on the nature, value and risk of each contract and will be specified in the procurement plan approved by the WB and agreed by the Bank. 42. Funds flow arrangements. The proceeds of the loans from the Bank and the WB will flow to the Bureau of Treasury account at the Central Bank of the Philippines. Disbursements under the Project will comply with the policies and procedures on disbursements and financial management of the Bank and the WB. After the issuance of the Notice of Cash Allocation by the Department of Budget and Management, the requested advance payment will be credited to the Designated Accounts of the Project maintained by DPWH and MMDA at Land Bank of the Philippines, an authorized government depository bank acceptable to the WB. All replenishments to the Designated Accounts shall only be for eligible expenditures based on the agreed eligibility/financing percentage in the Loan Agreements. The frequency for reporting eligible expenditures paid from the Designated Accounts will be quarterly, or as need arises. The borrower may also use Reimbursement and Direct Payment methods. Retroactive financing for eligible expenditures up to an aggregate amount not to exceed one million dollars may be made for payments made on or after August 1, 2017, provided that the relevant WB procurement guidelines have been followed.
4. PROJECT ASSESSMENT A. Technical 43. Central to the understanding of urban flooding in Metro Manila is an appreciation of the interplay between different natural and physical systems, including demographic growth, topography, urban development, climate change and technology. While rainfall is a natural phenomenon, the occurrence of urban floods and their devastating impacts cannot be regarded purely as physical events. In the context of the Project, they are due to a combination of (i) rainfall events in the catchment of Metro Manila, (ii) underperforming pumping systems, (iii) obstruction of drainage channels and waterways by solid waste and debris, and (iv) human encroachments on the waterways, which obstruct the natural flows. As a consequence, flooding becomes more widespread, frequent and severe. The areas inundated even during a moderate rainfall event have spread from the low-lying coastal or riverine hinterlands to include more suburban and urban localities of Manila. Due to inefficient pumping systems and drainage infrastructure, the water recedes slowly from urban areas and, therefore, seriously affects the living conditions and livelihoods of the inhabitants.

15
44. After extensive discussions among MMDA, DPWH, LGUs, and other government agencies, 139 drainage areas, including most of the existing pumped drainage systems, were identified for a long list of priority intervention areas. The final selection will be informed by the following factors: (i) the severity of the drainage problem, (ii) the severity of the solid waste problem, (iii) the number of ISFs already resettled from the waterways under the Oplan Likas program, (iv) the size and capacity of the pumping stations, and (v) the number of ISFs that need to be resettled. A preliminary assessment for 56 prioritized drainage schemes (36 existing and 20 new sites) has been done, but the selection will be confirmed during Project implementation. 45. Surveys, mapping and investigations will generate a feasibility report that will list the proposed interventions, safeguard requirements, initial cost estimates and benefits. Detailed design and implementation of proposed activities will only commence after the feasibility report has been reviewed and cleared by the WB. In case of unforeseen complexities highlighted during review, the WB team may also seek advice from its management and relevant advisors on required instruments before implementation of proposed interventions in a particular drainage area. 46. Five drainage areas, namely Vitas, Balut, and Paco in Manila, Tripa de Galina in Pasay, and Labasan in Taguig have already been selected by MMDA and their modernization will start during Project Year One (PY1). The technical specifications and the design works have been completed for each based on the hydrology of the drainage areas as well as the hydraulic and technical conditions of the drainage systems and the pumping stations. Based on the design calculations, current pumping capacities can be increased from 29 to 255 percent. The total estimated cost to upgrade the five pumping stations is US$30.57 million. The necessary desilting of waterways and drainage channels leading to the five pumping stations has also been determined. The total sediment volume to be removed is estimated at 1.38 million cubic meters, at an estimated cost of US$9.25 million. DPWH and MMDA will also procure modern cleaning and desilting equipment with an estimated cost of US$6.7 million. Therefore, it is expected that works and goods totaling about US$45 million will be procured during PY1. 47. Appropriate technologies will be used for the design and construction of the physical interventions under the various components in the remaining drainage sites. MMDA and DPWH engineers will be supported to ensure the appropriate skills and modern design and operational tools are available. Information on the drainage areas will be captured in a MIS/Geographic Information System (MIS/GIS) platform. Final designs will be sound and suitable for local conditions, to ensure that the proposed works serve the intended purpose, the infrastructure is sustainable, and O&M requirements are in place. Modernization of some similar pumping stations has already been carried out by MMDA and DPWH. Similarly, LGUs have experience with solid waste management interventions, including community-based solid waste management through partnering with CSOs. Although these activities have been discrete and isolated, without the multi-sectoral and integrated approach that is needed for an entire drainage area, the technical experience gained nevertheless provides evidence that the Project can be implemented without major technical difficulties. B. Economic and Financial 48. A cost-benefit analysis was carried out to assess the economic benefits of the Project, in which the monetized benefits and costs were compared in “with” and “without project” scenarios.

16
Benefits of the Project include avoided or reduced flood damages; avoided losses in business income and disruption in commercial activities; avoided productivity loss due to traffic disruption and other services; avoided opportunity loss for school age children and for the general public with regard to access to public services; and avoided health costs. At the household level, benefits include avoided costs from increases in food prices and transportation. The benefits that have been monetized for the analysis include avoided or reduced flood damages and avoided productivity losses. 49. Flood damages were estimated using data from the study on Flood Risk Analysis of Pasig-Marikina River Basin, completed by PAGASA in 2015. For the Project, damages from urban flooding cover the costs of repairs of house structures, household appliances, and vehicles, plus the cost of cleaning up after each flooding event. This was assumed to be five percent of the estimated average cost per square meter of floor area. Based on available data and maps from the National Mapping and Resource Information Authority (NAMRIA), the average affected area without the Project was assessed as 45 percent of the target drainage area. Eighty percent of the affected area was estimated to be built-up. 50. Estimated annual damages are based on a 10-year return period of rainfall. The value of damages was assumed to grow by two percent per year in real terms, since flood damages in a without-project scenario are expected to increase in future. As a conservative estimate, it was assumed that the reduction in flood damages attributable to the Project is 30 percent of total estimated damages. Benefits from avoided productivity loss were estimated using a proxy gross national income (GNI) per capita with disruption of economic activities over five days per year, due to traffic interruptions and inaccessibility of roads during floods. Different impacts were assumed for three different age groups (0-14 years, 15-64 years, and 65 years and above) based on the present demographics of the city. 51. The economic costs of the Project include capital works, resettlement, and operation and maintenance costs for each component. Taxes and duties were assumed to be 12 percent of the financial costs and were deducted to reflect the economic cost. 52. Using conservative assumptions, the base case – accounting for only avoided or reduced flood damages as benefits – shows positive results. The Project has an economic rate of return (ERR) of 34.3 percent, using a discount rate of 15 percent, a positive Net Present Value (NPV) of PHP 12.6 billion, and a benefit-cost ratio of 1.9. Adding the benefits of avoided productivity loss increases the ERR to 44 percent. Sensitivity analysis was applied to the base case to determine the impact of changes in key variables on the economic viability of the Project. The scenarios are as follows: (i) reducing benefits by 20 percent; (ii) increasing costs by 20 percent; and (iii) a combination of these two scenarios. The Project remains viable under all scenarios with ERR ranging from 21.0 to 27.6 percent (details are provided in Annex 3). 53. The Project engenders other social and intangible benefits. The beneficial impact on the poor, particularly on the affected ISFs, includes the opportunity to have better and affordable housing and environmental amenities, as well as the positive health impacts resulting from cleaner environments and better housing. The Project will introduce specialized knowledge and good practices in community-based solid waste management, including incentivized solid waste collection and disposal; IEC; and institutional arrangements for waste recycling. Institutional
17
strengthening and capacity building in targeted activities will assist in improvement of Manila Bay water quality. Lastly, the targeted flood prone areas are densely populated, consisting of mostly low and medium income communities where most households are involved in the informal economy with low paying jobs. The Project will improve their employment during the rainy season as well as minimize interruptions in economic activities with the possibility of increasing their productivity from improved physical conditions. C. Fiduciary and Governance 54. Fiduciary. In accordance with its Operational Policy/Bank Procedures (OP/BP) 10.00 on Investment Project Financing, the WB completed an assessment of the implementing agencies’ financial management systems, including budgeting, accounting, internal controls, financial reporting, and auditing systems. The assessment concluded that the financial management systems at DPWH and MMDA meet the WB’s requirements. The financial management risk of the Project before the mitigating measures is assessed as Substantial, which will be mitigated through a range of measures for strengthening the FM and procurement functions. The measures include adoption of a financial management manual to formalize Project-specific control processes; completion of the financial management staffing plan with relevant experience in MDBs’ fiduciary procedures at the PMOs; annual procurement and financial audits by the Commission on Audits (COA); use of direct payments for large contracts; and continued implementation of the Integrity Management Program (IMP) in DPWH and rolling out of IMP in MMDA. The IMP is a department-wide integrity improvement system mandated by Executive Order (EO) No. 176, issued in December 2014 that continues to be in force under the current Administration. The EO institutionalizes the IMP as the national corruption prevention program in all departments, bureaus, offices, agencies, including government-owned and controlled corporations, government financial institutions, state universities and colleges, and LGUs. It calls for the establishment of integrity management systems by the government entities. Its main objective is to reduce the level of corruption vulnerabilities at the agency level, and to ensure that integrity measures are practiced in the public sector with the primary aim of improving public trust and confidence in government. It covers six dimensions, namely: (i) Service Delivery; (ii) Institutional Leadership; (iii) Human Resource Management and Development; (iv) Financial; (v) Procurement; and (vi) Asset Management, Internal Reporting and Investigation, and Corruption Risk Management. 55. Institutional capacities. Several agencies are involved in flood management activities at multiple levels and different locations. The experience of MMDA and LGUs in implementing multi-sectoral projects that are funded by MDBs is not extensive. The implementation will be led by the two PMOs that have already been established within MMDA and DPWH. The staff will be trained through capacity-building activities. PMOs will be strengthened through qualified external consultants to provide implementation support. The Project activities will be rolled out at different locations over several years. The peak of the activities is expected during Years 3 to 5. Care will be taken to ensure that the PMOs are by then at full strength, with adequate capacity to oversee implementation. 56. Procurement will be carried out mainly by DPWH and MMDA. However, under Component 3, some procurement may also be carried out by NHA, SHFC and community organizations. Both DPWH and MMDA have some experience in implementing MDB-financed projects, however, the procurement assessment conducted by the WB indicated that the

18
procurement experience of MMDA is limited. NHA, SHFC and the community organizations are not familiar with MBD procurement and will require oversight and assistance of the DPWH PMO during implementation. Based on the WB assessment as well as the complex Project design, implementation of widespread activities in congested urban settings, and public-sector procurement risk, the Project procurement risk is rated High. Risk management measures include: (i) training of procurement specialists; (ii) preparing a Project operational manual with a specific procurement section detailing procurement arrangements, procedures and processing timelines within the various implementation agencies; and (iii) conducting procurement training, including procurement planning and strategic tracking of exchanges in procurement (STEP). Other public procurement system strengthening measures will also be adopted, which may include: (i) performance monitoring using the Agency Procurement Compliance Performance Indicators; (ii) professionalization of procurement practitioners; (iii) CSOs and private sector involvement as procurement observers; (iv) the use of geo-tagging in identifying specific locations of pumping stations and other critical interventions; and (v) conduct of annual procurement audit by CoA, following its Guide in the Audit of Procurement (GAP) as part of the regular financial audit. 57. WB Supervision. The WB, as lead co-financier, will take the lead role on procurement, disbursements, environmental and social aspects, and Project monitoring and reporting. It will supervise the Project and administer the Bank’s loan on behalf of the Bank, in accordance with the WB’s applicable policies and procedures and a Project Co-Lenders’ Agreement, to be signed between the Bank and the WB, in accordance with the Co-financing Framework Agreement between the Bank and the WB. The Bank has reviewed the WB’s Procurement and Consultant Guidelines (2014) and the WB’s sanctions policies and procedures, including its Anti-Corruption Guidelines. It has found them satisfactory for application to the Project in accordance with the Bank’s Procurement Policy10 and the Bank’s Policy on Prohibited Practices.11 In addition, the Bank also reviewed the WB’s standard environmental and social safeguard policies that have been triggered for the Project. As detailed in Section 4.D, Environmental and Social, the Bank found them in accordance with the Bank’s Environmental and Social Policy (ESP).12 The Bank will accordingly rely on the WB’s determination of compliance with the above WB policies and 10 Under the Procurement Policy, the Bank may agree on a common procedure framework with other co-financiers for a jointly-co-financed Project, if the Bank has determined that the co-financiers’ procurement policies are consistent with the Bank’s Core Procurement Principles and Procurement Standards (paragraph 5.11.3). In that case, the lead co-financier is normally responsible for overseeing the procurement process, applying its own procurement policy and internal review and clearance procedures, and determining whether the procurement has been conducted in accordance with its own policy. In all cases, the Bank’s eligibility requirement will apply, permitting firms and individuals from all countries to offer goods, works and services for a Bank-financed contract. 11 Under the Bank’s Policy on Prohibited Practices, the Bank may agree to the application of the prohibited practices or similar policy and investigations and sanctions processes of certain co-financiers for a Project (paragraph 12.3). As a precondition, the Bank must be satisfied that the co-financier’s policy and processes are consistent with the Bank’s Articles of Agreement and materially consistent with the Bank’s Policy on Prohibited Practices. In that case, the Bank may agree that the co-financier will be responsible for the investigations and sanctions processes and the Bank may agree to give full force and effect to the co-financier’s sanctions decisions with respect to investigations arising from the Project. 12 Under the ESP, the Bank may agree to the application, in a project, of the environmental and social policies and procedures of co-financiers. As a precondition, the Bank must be satisfied that these policies and procedures are consistent with the Bank’s Articles of Agreement and materially consistent with the Bank’s ESP and relevant ESSs, and that appropriate monitoring procedures are in place. In that case, the Bank may rely on the co-financier’s determination of compliance with the co-financier’s policies and procedures.

19
procedures applicable to the Project. Project monitoring and reporting, as well as financial management, will also be carried out in accordance with the WB’s requirements. This approach will ensure that one set of policies will apply to the entire Project; it will also provide a single point of contact for the GoP and therefore facilitate a more efficient and seamless approach to Project implementation. 58. On strategically important and complex procurements, the Bank will work with the WB for regular procurement supervision in the field every year, including ex-post reviews of not less than 20 percent of the contracts. D. Environmental and Social 59. The Bank has decided to use the WB’s Environmental and Social Safeguard Policies (Safeguard Policies) since (i) they are consistent with the Bank’s Articles of Agreement and materially consistent with the provisions of the Bank’s Environmental and Social Policy and relevant Environmental and Social Standards; and (ii) the monitoring procedures that the WB has in place to ascertain compliance with its Safeguard Policies are appropriate for the Project. Under the WB’s Safeguard Policies, the Project has been assigned Category A. 60. The WB has conducted due diligence for the Project, which has identified substantial environmental and social risks and impacts. Four WB Safeguard Policies have been applied to the Project, namely OP/BP 4.01 – Environmental Assessment, OP/BP 4.04 – Natural Habitats, OP/BP 4.11 – Physical Cultural Resources and OP/BP 4.12 – Involuntary Resettlement. An Environmental and Social Management Framework (ESMF) and a Resettlement Policy Framework (RPF) for the Project have been developed and finalized with feedback from public consultations. 61. The ESMF will assist the implementing agencies in complying with the environmental safeguard requirements of the Project. The ESMF includes a screening instrument to identify environmental and social impacts of the activities in each drainage area. Anticipated impacts will include collection and disposal of solid wastes, construction debris, and dredged silt, worker health and safety, disruptions to local traffic, disposal of old pumps and equipment, spent fuel, oil, and lubricants from the pumping stations, mitigation of dust, noise, domestic wastewater, run-off, loss of vegetation, cut and fill of undeveloped terrain, loose soil and debris during site development and construction, siltation of waterways, and poor aesthetic quality. 62. Five drainage areas have been selected for Project implementation for the first year. Consistent with the ESMF, a consolidated Environmental and Social Impact Assessment (ESIA) for activities within each of the five drainage areas has been prepared. Based on the possible impacts during construction and operation, the most significant impacts relate to the dredging of waterways, the generation of solid waste collected from the pumping stations and communities near the drainage areas, and the impact of relocating ISFs. Of the three, the impact of dredging is of most concern due to the resuspension of contaminants, collection of potentially toxic and hazardous sediment material, especially heavy metals, and the generation of odor. The possible negative impacts are all reversible and temporary. Site-specific ESMPs have been prepared for each of these drainage areas delineating the mitigation measures and monitoring arrangements along with budgetary provisions.
20
63. The improvements in the flood management systems involve several measures, such as enhancing the capacity of the pumping stations and the appurtenant infrastructure, that will lead to displacement of ISFs along the waterways. Together with the interventions for the pumping stations and related waterways and drainage channels, the Project will also support improvements to solid waste management in waterways that are served by the pumping stations. PAPs whose habitations obstruct the proper operation and maintenance of the drainage systems will be physically resettled and economic rehabilitation will be supported. Most of the PAPs are ISFs residing within the technical footprint13 of existing pumping stations which are to be rehabilitated or upgraded. 64. The GoP launched the Oplan Likas Program in 2011 to relocate about 100,000 ISFs in Metro Manila out of danger areas over a five-year period. The current Project is not linked with Oplan Likas although some activities financed by the Project have a spatial overlap with Oplan Likas activities as the latter are located within the technical footprint of the Project. Moreover, the WB has provided technical assistance in support of Oplan Likas. The technical footprint covers the pumping station and its related facilities as well as sections of waterways serving the pumping station. The physical limits of the technical footprint for the waterways are established based on hydrological and engineering criteria for each drainage area. Waterway sections within the technical footprint are typically near the pumping facility. Resettlement under the Project will be unavoidable where dwellings and structures established by ISFs impede the flow or inhibit access for effective maintenance and operation of the facilities. People who live or have properties within the Project’s technical footprint or those who were resettled from the technical footprint under Oplan Likas are considered PAPs under the Project and OP 4.12 applies. 65. The assistance to be provided to PAPs by the Project will depend on the time frame of resettlement. Resettlement activities within the footprint of the Project that took place prior to the WB’s engagement (December 8, 2014, the date of the WB’s Project identification mission) are considered a legacy issue. Resettlement before this date will need to have been in accordance with country legislation and consistent with objectives of OP 4.12. Should this past resettlement not have been consistent with national legislation and the objectives of OP 4.12, remedial measures must be provided. This will be done at the community level for equity purposes and to avoid conflicts with persons relocated to the same resettlement sites from other areas not related to the Project. The safeguard instrument to be prepared is a DDR that will describe the remedial measures to be provided and an action plan to ensure the consistency of past rehousing/resettlement with the objectives of OP 4.12. 66. After the date of Project identification by the WB team, resettlement should comply with OP 4.12, including compensation at full replacement cost for loss of assets and other resettlement assistance. Two groups of PAPs have been identified, namely, (i) people who were resettled from the technical footprint after the Project identification date (December 8, 2014), but prior to the date 13 For purposes of the ESIA, the Project area of influence (referred to as the ‘Project footprint’) of each subproject can comprise the pump station and yard, drainage areas, waterways and drainage channels, and ancillary facilities such as access roads, disposal sites for dredged materials and solid wastes from pumping stations, resettlement sites, as well as temporary sites needed for equipment parks and materials stockpiles. The Project footprint for ESIA purposes is different from the technical footprint for resettlement purposes described above. The technical footprint overlaps the Project footprint, but is typically smaller.

21
a census is initiated in all sub-project sites during the early stage of Project implementation (cut-off date); and (ii) people who will be resettled from the technical footprint after the cut-off date during Project implementation. For the first group, due diligence will be conducted and the PAPs that were resettled from the technical footprint will be traced to the extent possible. If their current resettlement conditions are not in compliance with OP 4.12, the Project will provide remedial measures to address the gaps, described in a RAP, and measures will have to be applied retroactively to ensure compliance with OP 4.12. Remedial measures will include compensation to individual PAPs, or through community-level interventions for equity purposes if acceptable to the PAPs. 67. The ESIA has identified positive impacts of the Project, including (i) reduction of floods; (ii) improvements in public health conditions; and (iii) improvement of quality of life of the affected people in particular and the people of Manila in general. The ESIA also addresses negative impacts. Impacts during construction include generation of construction waste and solid waste that need to be disposed of appropriately. Plans have been put in place to address fugitive dust and noise emission during construction. A toxicity analysis has concluded that the dredged materials are non-hazardous, and disposal sites have been identified to deposit the silt. Water hyacinth will be removed from some waterways; removal operations will have limited effects on the ecology of the waterways. ESMPs have been put in place which has identified the impacts in detail and management plans have been formulated to mitigate impacts. 68. The Project will not support activities that will significantly convert or degrade natural or critical natural habitats, OP 4.04 is applicable as there is a very small potential chance that the Project area may impact natural habitats, mostly outside the city at resettlement sites. Interventions at existing pumping stations, associated drainage areas and waterways, and related activities will take place in original locations and not affect natural habitats. Activities related to new pumping stations and associated waterways will take place in built-up areas in urban settings, which are unlikely considered as natural habitats. Application of screening criteria developed in the ESMF will determine the potential impacts on existing and new pumping stations, their drainage areas, ancillary facilities and related activities such as disposal sites and resettlement sites. Screening will also be conducted for potential impacts on natural habitats for candidate relocation sites for the PAPs. No settlements will be allowed in critical natural habitats as prescribed in the OP and in accordance with the national regulations. 69. The five PY1 drainage areas were screened for physical cultural resources (PCR) and were found to have none in the primary or secondary areas of influence. For other Project sites, the screening matrix in the ESMF will determine any possible cause of disturbance and negative impacts to PCR such as historical areas, architectural landmarks, and other cultural property, which may need to be mitigated. During construction, the landscape of the existing and new sites and off-site facilities may also be affected and structural damage to old structures may occur due to vibrations and excavation of adjacent areas. Where needed, a PCR management plan will be formulated as part of the ESMP, including chance find procedures that will be followed during construction. 70. The Project and ESMF and the results of the ESIA were discussed during public consultations held on September 9, 2016 and November 18, 2016. The public was invited for this consultation by way of an announcement in a national newspaper and on DPWH’s website.

22
Overall, the participants fully support the Project because of the benefits that flood control and solid waste management will bring to Metro Manila and issues and suggestions raised are mostly to be considered during Project implementation. 71. In compliance with the requirements of OP 4.12, DPWH and MMDA conducted public consultations where the following documents were shared and discussed: (i) Project background (including objective, components, benefits, etc.); (ii) ESIA; (iii) ESMF; (iv) RPF; and (v) the three PY1 safeguards documents. Project briefs and flyers highlighting the key sections of the safeguards documents written in Tagalog were provided to the five communities prior to the consultations. English versions of the documents were placed on DPWH’s website, were available at the DPWH-Unified Project Management Office, DPWH-Environmental and Social Safeguards Division, and at the MMDA-Planning Office, and were also provided to the barangays in the PY1 drainage areas to ensure that interested individuals could easily have access to the full versions of the documents. Documents were first disclosed by the WB on February 8, 2016, with final disclosure on May 1, 2017.14 DPWH disclosed safeguard documents on its website on December 31, 2016. 72. A number of community consultation activities have been organized by DPWH to disclose the safeguards instruments to PAPs and other interested people in each of the five PY1 areas. A first consultation meeting was held September 23, 2016 for the PAPs in Vitas, followed by a second consultation on October 10, 2016. Community consultations were organized by DPWH, with support from other agencies, for the other four PY1 drainage areas from October 10 to 13, 2016. During this period, a separate consultation activity was held at Towerville 6 Resettlement Site in San Jose del Monte, Bulacan to discuss the resettlement legacy issues related to the technical footprint of Paco and to learn lessons from past Government resettlement activities. The site-specific consultations were generally well attended, with more than 100 participants at the Paco and Vitas consultations. The participants were generally supportive of the Project as measures to reduced flooding in the communities are deemed very important. In addition to measures that reduce flooding, participants often mentioned the need to reduce solid waste in the waterways. As part of the communication plan, the key elements of the citizen engagement strategy for the Project include the following: (i) disclosure of important Project-related information by DPWH and MMDA on their websites, (ii) consultation with the key stakeholders during planning, design, and implementation of the activities in a particular drainage area; (iii) upgrading the established GRMs within DPWH and MMDA to meet specific grievance redress requirements of this operation; (iv) promoting community-based risk reduction initiatives with the participation of and networking with relevant stakeholders, including women, CSOs, and local bodies; and (v) neighborhood-level solid waste management interventions that involve extensive local-level IEC and local leaders to effect individual and household-level behavior change related to solid waste. 73. During the investigations, surveys, and design of the interventions in a specific drainage area, consultations will be carried out with relevant stakeholders and beneficiaries. This engagement will allow implementers to understand better the drainage problems and people’s expectations. Where relevant, differentiation based on gender will take place to understand the specific needs of women. These consultations will feed into the design for specific drainage area 14 http://projects.worldbank.org/P153814/?lang=en&tab=documents&subTab=projectDocuments

23
interventions, but will also continue during the implementation of the interventions. For example, communication on construction activities that may cause traffic disruptions, excessive noise, or dirty roads will be provided to avoid dissent and lack of local support. 74. Information, education, and communication (IEC) programs will target barangay officials and affected residents in Project drainage areas, especially from within the technical foot print of drainage areas, as well as CSOs operating in such drainage areas. The following are the major topics to be discussed: (i) Project description; (ii) ESIA process status and findings; (iii) resettlement and other social action plans for the identified PAPs; (iv) potential consequential impacts on the residents in the affected communities; (v) the benefits of the Project on the socio-cultural, economic, and bio-physical environment of the affected residents as they address flooding and solid waste management issues; and (vi) the Project mechanisms for grievance redress. The IEC materials and strategies that will be used should be simple and easy to be understood by all stakeholders, and presented either to groups or individuals. The materials will be illustrated in the local language. As such, the Project is expected to have extensive civil engagement, including with women. 75. DPWH has a functioning GRM. The Project-level GRM will be established along the same lines and will address the elements stipulated in the RPF. It is also envisaged that as the Project-level GRM is set up, the DPWH’s agency-level GRM will also be enhanced. Adopting the principles of simplicity, accessibility, transparency and timeliness, the Project-level GRM will address and resolve any Project-level grievances from stakeholders, including PAPs and other members of public. It will be managed with the support of the social and environmental team in the PMO. 76. Gender Dimensions. Resettlement can exacerbate gender disparities and inequalities. Women carry the brunt of managing the adverse impacts of relocation. For instance, the due diligence review of the Paco Pumping Station resettlement showed that because of insufficient livelihood opportunities in off-city resettlement, many men leave their families and come home only every weekend or fortnight so that they can continue the income generating activities they were engaged in prior to relocation. The women are relied upon to manage the meager income the men bring home, send children to school, keep them away from trouble, and keep the family together. 77. The Project will utilize various gender analytical tools, especially for activities under Components 2 and 3, to ensure that the differentiated needs of men and women and boys and girls affected by the Project are properly responded to, and appropriate monitoring and reporting tools are developed to keep track of the gender-related progress of the Project. Gender analysis will be embedded in its impact assessments to identify gaps between men and women across human endowments, jobs, ownership and control of assets, and voice. The Project will: (i) generate gender disaggregated data from consultation, census, socio-economic survey, asset survey, compensation, and livelihood restoration programs; (ii) identify formal and informal arrangements that exacerbate gender inequalities and those that promote gender equality; (iii) ensure representation of women from different economic groups during consultations and meetings by ensuring consultation/meeting venues are discussed with women to promote freer and uninhibited participation by women, and that female facilitators are mobilized and, if found appropriate, separate meetings for women are organized; (iv) exert efforts to ensure that women play an
24
important role in analyzing and deciding on resettlement options under Component 3; (v) maximize women’s participation in resettlement site development and housing and facilities designs; (vi) ensure livelihood restoration programs are informed by intensive discussions with women; (vii) provide access to training programs for at least one female household member; and (viii) monitor gender indicators throughout the Project implementation period and assess gender impacts at the end of the Project. 78. Labor. In general, Project activities are not very labor intensive. Most labor, both skilled and unskilled, will be sourced from within Metro Manila, as much as possible from local communities within the Project areas, and they will continue to live at their homes in the city. Therefore, migrant labor is not expected and there will be no need for labor camps near Project sites, except for site office 79. Climate Change. Manila is frequently subject to heavy damages due to seasonal typhoons and cyclones. These incidents have become more intense and unpredictable in recent years due to climate change, with increasingly severe impacts on the people who reside in flood prone areas, such as Manila Bay and Laguna de Bay. The Project will support mitigation measures to address these climate change-related impacts. The main benefit of the Project will be through reduction of the flooding that affects people, roads, and property. The waterways served by the pumping stations are affected by tidal flows and high levels in the main river, and during high tide, the water levels in Manila Bay, Laguna de Bay and the receiving rivers are higher than the level of the waterways. The pumping stations can regulate this flow and therefore reduce flooding. This is anticipated to improve quality of life, public health and communications in the Project areas. Reduction of flooding in Metro Manila due to these impacts of climate change will also enhance land values and property prices, and contribute to reducing poverty. E. Risks and Mitigation measures 80. During preparation, the WB conducted a Project-level assessment of the various risks using its Systematic Operations Risk Rating Tool, rating the overall risk as “High.” Four of the individual indicators, namely institutional capacity, fiduciary, environmental and social, and stakeholders have been categorized as either High or Substantial. Based on the WB assessment as well as the complex Project design – involving coordination of activities among a range of stakeholders; complex environmental and social safeguard issues; implementation of widespread activities in congested urban settings; and public-sector procurement and financial risks – the Bank team proposes a “High” Project risk rating. 81. The key institutional and fiduciary risks and the proposed mitigation measures are described under sub-sections A through C above. Environment and social risks are discussed in more detail below. 82. Environmental risks are manageable, but there are high social risks, especially related to past relocation of people from the drainage areas under recent government resettlement programs, including Oplan Likas. Although these risks may not directly affect the achievement of the Project objectives, they may have adverse impacts on Project implementation. As part of due diligence to be conducted, the Project may have to provide additional support to people that were relocated to off-city sites to ensure that their resettlement is consistent with national legislation and the relevant
25
provisions of the WB’s OP 4.12, in particular with regard to livelihood restoration. Targeted support to a small select group of people in large resettlement sites may create resentment among people who were resettled from non-Project areas and who will not receive direct Project support, which may lead to complaints. To mitigate this to a certain extent, the Project includes community-based support activities that can benefit a larger group of people residing in resettlement sites. 83. There is a risk that land acquisition may be delayed, as land for in-city resettlement may not be readily available in every participating LGU, may be too costly, or may be encumbered. This in turn can delay Project implementation. Given the risks involved in achieving in-city resettlement within the Project time frame, the Project will screen the eligibility of communities for in-city resettlement with strict readiness criteria such as community readiness, land identified, etc. during PY1. There is also a risk that counterpart funding for land acquisition and housing construction may not be provided in a timely manner to the KSAs, which may result in delays in resettlement activities and subsequently in construction or modernization of pumping stations. To mitigate the risk, the Project will plan the full resettlement program early, in close coordination with KSAs and concerned LGUs, so that funding can be appropriated as required on an annual basis. 84. There are substantial risks related to stakeholders who may have ground to object to certain activities under the Project, especially related to how successfully the Project will address issues related to past resettlement. Such stakeholders could include CSOs, people in existing resettlement sites, and other members of the general public, and their actions could delay Project implementation. This can also include communities in the drainage sites who resist solid waste reduction efforts or other Project activities. Such risks will be mitigated through a comprehensive communication strategy that will focus on detailed and transparent messaging as well as a responsive Project-level GRM. The activities will be implemented in close cooperation with the communities and will include socializing the Project in general, community mobilization, incentive-based approaches, and increasing the visibility of tangible benefits among the communities.
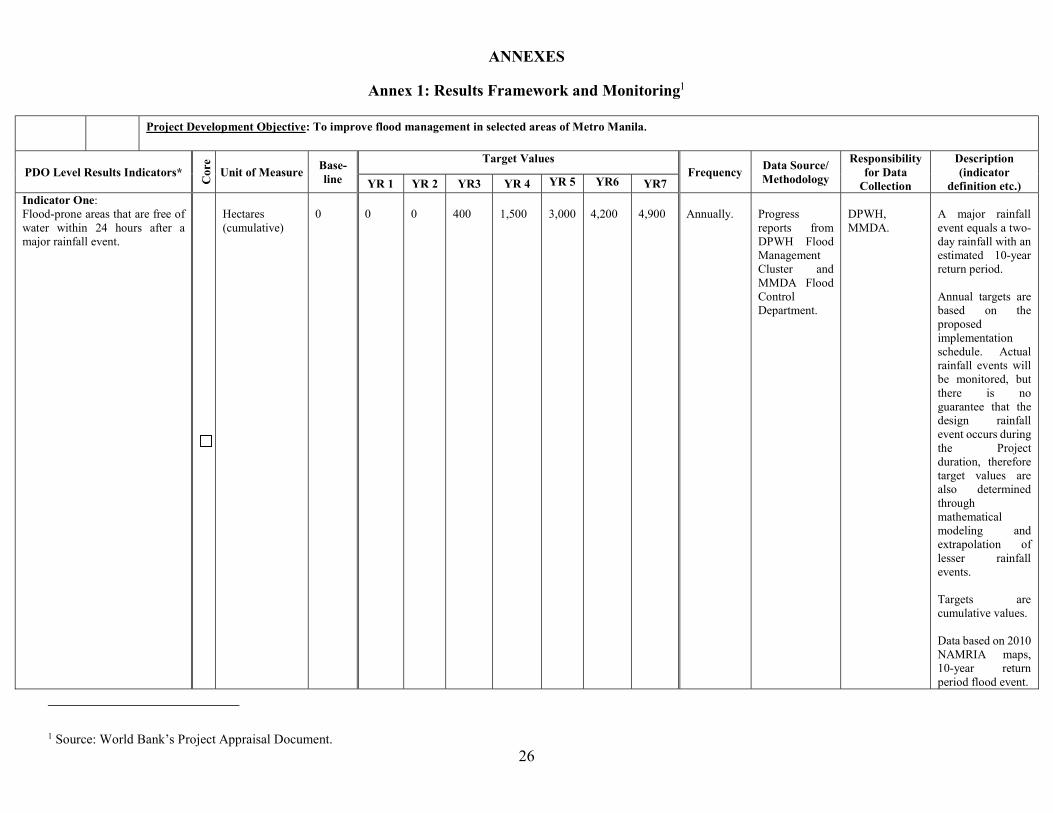
26
ANNEXES Annex 1: Results Framework and Monitoring1
Project Development Objective: To improve flood management in selected areas of Metro Manila.
PDO Level Results Indicators* Core Unit of Measure Base-
line Target Values
Frequency Data Source/ Methodology
Responsibility for Data
Collection Description (indicator
definition etc.) YR 1 YR 2 YR3 YR 4 YR 5 YR6 YR7 Indicator One: Flood-prone areas that are free of water within 24 hours after a major rainfall event.
Hectares (cumulative)
0
0
0
400
1,500
3,000
4,200
4,900
Annually.
Progress reports from DPWH Flood Management Cluster and MMDA Flood Control Department.
DPWH, MMDA.
A major rainfall event equals a two-day rainfall with an estimated 10-year return period. Annual targets are based on the proposed implementation schedule. Actual rainfall events will be monitored, but there is no guarantee that the design rainfall event occurs during the Project duration, therefore target values are also determined through mathematical modeling and extrapolation of lesser rainfall events. Targets are cumulative values. Data based on 2010 NAMRIA maps, 10-year return period flood event.
1 Source: World Bank’s Project Appraisal Document.

27
Indicator Two: Direct Project beneficiaries, of which females.
X
Number (in million) Number of females in brackets. (cumulative)
0
0
0
0.55 (0.27)
0.71 (0.35)
1.16 (0.58)
1.40 (0.70)
1.70 (0.85)
Annually.
Progress reports from DPWH Flood Management Cluster and MMDA Flood Control Department.
DPWH, MMDA.
Population provided with improved flood protection and improved drainage. Annual targets are based on the proposed implementation schedule. Targets are cumulative values. Female beneficiaries are about 50 percent, but gender disaggregation will be done during surveys. Data based on area identified by NAMRIA maps and 2010 barangay 2010 NSO, adjusted to 2015 at 2 percent annual growth.
Indicator Three: Solid wastes collected at targeted existing pumping stations.
Cubic meters (in thousand)
17
17
17
17
13.5
11.4
9.5
8.5
Annually.
Progress reports from MMDA Solid Waste Department in coordination with the solid waste management office of the participating LGUs.
MMDA and LGUs.
Final target is 50 percent reduction of solid wastes that accumulate at the pumping stations. MMDA measures waste in cubic meters, not tons.
Indicator Four: Households successfully resettled from areas where they would obstruct proper O&M of the drainage systems.
Number of households (cumulative)
0
0
0
137
1,451
2,500
2,500
2,500
Annually.
Progress reports from MMDA Planning Department in
MMDA and LGUs.
Annual targets are based on the proposed implementation schedule.

28
coordination with the Urban Poor Affairs Office (UPAO) of the LGUs.
Households are counted when they have secure housing, basic services, and livelihoods maintained.
Indicator Five: Beneficiaries satisfied with reduced vulnerability to flooding in Project areas.
Percentage
0
0
0
0
20
50
70
80
Annually.
Progress reports from MMDA Planning Department in coordination with the Urban Poor Affairs Office of the LGUs.
MMDA and LGUs.
Measured through beneficiary feedback surveys, starting one year after completion of pumping stations, including gender disaggregation.
INTERMEDIATE RESULTS
Intermediate Result (Component One): Modernizing Drainage Areas Intermediate Result Indicator One: Existing pumping stations rehabilitated.
Number (cumulative)
0 0
0
5
10
21
36
36
Annually.
Progress reports from MMDA Flood Control Department.
MMDA.
Intermediate Result Indicator Two: New pumping stations constructed and operational.
Number (cumulative)
0
0
0
0
0
0
6
20
Annually.
Progress reports from DPWH Flood Management Cluster and MMDA Flood Control Department.
DPWH, MMDA.
Intermediate Result Indicator Three: Drainage waterways cleaned.
Km (cumulative)
0
0
8
28
48
73
94
104
Annually.
Progress reports from DPWH Flood Management Cluster and MMDA Flood Control Department.
DPWH, MMDA.
Considers waterways that lead to pumping stations.
Intermediate Result (Component Two): Minimizing Solid Waste in Waterways

29
Intermediate Result Indicator One: Barangays with improved solid waste management programs in place.
Number (cumulative)
0
0
0
25
75
125
200
200
Annually.
Progress reports from MMDA Solid Waste Department in coordination with the solid waste management office of LGUs.
MMDA and LGUs.
Improved solid waste management will be measured by the following: increased number of eco aides, alternative collection points (e.g. floating bins), innovative measures in recycling of low value wastes in waterways, effective IECs, etc. It is estimated that about 80 percent of 255 barangays in Project area will see positive impact.
Intermediate Result Indicator Two: Barangays receiving results-based financing (RBF) schemes.
Number (cumulative)
0
0
0
0
5
15
25
40
Annually.
Progress reports from MMDA Solid Waste Department in coordination with the solid waste management office of LGUs.
MMDA and LGUs.
Assumes 20 percent of barangays with improved solid waste management programs will benefit from the RBF scheme.
Intermediate Result (Component Three): Participatory Housing and Resettlement Intermediate Result Indicator One: Community consultations undertaken.
Number (cumulative)
3
3
6
12
24
30
30
30
Annually.
Progress reports from MMDA Planning Department in coordination with LGU UPAO and KSAs.
MMDA, LGUs, and KSAs.
For RAPs (minimum of two consultations per Project drainage area) and due diligence (at least one consultation).
Intermediate Result Indicator Two: Home-owners’ Associations (HOA) or housing cooperatives receiving TA for community organizing, mapping, and surveying.
Number (cumulative)
0
0
1
2
5
7
7
7
Annually.
Progress reports from MMDA Planning Department in coordination with LGU UPAO, and KSAs.
MMDA, LGUs, and KSAs.
One HOA/cooperative per site with resettlement.
30
Intermediate Result Indicator Three: In-city resettlement sites developed and ready for occupation
Number (cumulative)
0
0
0
1
2
4
6
8
Annually.
Progress reports from MMDA Planning Department and KSAs.
MMDA and KSAs.
Intermediate Result (Component Four): Project Management and Coordination Intermediate Result Indicator One: Grievances registered related to delivery of Project benefits that are actually addressed (core)
Percentage
0
90
90
90
90
90
90
90
Semi-annually.
Progress reports from MMDA Planning Department.
DPWH, MMDA.
Intermediate Result Indicator Two: Semi-annual progress reports submitted on time.
Number (cumulative)
0
2
4
6
8
10
12
13
Semi-annually.
Progress reports from DPWH PMO and MMDA PMO combined in one semi-annual report.
DPWH, MMDA.
Excluding the Borrower’s completion report.

31
Annex 2: Detailed Project Description1 PHILIPPINES: Metro Manila Flood Management Project
Master Plan for Flood Management in Metro Manila and Surrounding Areas 1. Intense rainfall and flooding in the Philippines are especially severe during the typhoon season from June through October when typically, around 80 percent of the annual rainfall falls, which for Metro Manila is about 1,700 mm out of the approximate 2,100 mm average annual rainfall. Metro Manila is located in a delta, sandwiched by Manila Bay to the west with its storm surge risks, Laguna de Bay to the southeast with annual flooding issues, and closed in to the north and northeast by mountain ranges that drain flash floods into the Pasig-Marikina River during typhoon events. Many areas in Metro Manila are designated as flood prone, with insufficient protection against frequent inundation. This includes areas along the Pasig-Marikina River and its tributaries, as well as many areas bordering Laguna de Bay. Typhoons and tropical storms that affect Metro Manila on a regular basis result in flooding of many low-lying areas with poor drainage conditions, resulting in extensive localized flooding that can last for days. Close to five million people (about 1.1 million households) live in urban areas that require pumping for proper drainage. 2. On September 26, 2009, Tropical Depression Ondoy hit Metro Manila. It was a disastrous event that resulted in extensive inundation caused by water flows that were well above the capacities of rivers, floodways, and urban drainage systems. The situation was exacerbated by lack of regular maintenance of infrastructure, including dredging of silts and cleaning of solid waste from waterways, and encroachment on the banks of rivers and waterways. Encroachment not only puts people at risk during flash flood events, but also obstructs the flow of water thereby enhancing flood conditions. In many areas, the flooding after Ondoy receded within one or two weeks, but other areas remained inundated for months, especially around Laguna de Bay. Tropical storm Ondoy was quickly followed by typhoon Pepeng (international name Parma) that affected the Philippines during October 3-9, 2009, following an irregular path which crossed over Central and Northern Luzon three times. Since Ondoy, there have been typhoons or long-duration rainfall events on an annual basis over Metro Manila, with seemingly increasing intensity. 3. Ondoy was a turning point in government’s attention to flood management. It was so damaging and lasting that it renewed the focus on improving flood management and making Metro Manila, the main engine of economic growth for the country, a safer place for its inhabitants by implementing measures that will substantially reduce flood risks. Identified issues included: Deforestation in the upper catchment of the Marikina River, resulting in erosion that
accumulates in the lower reaches of the river system, which in turn reduces the river carrying capacity; Uncontrolled disposal of solid waste in waterways and drains that reduces carrying capacity;
1 Source: World Bank’s Project Appraisal Document.
32
Lack of maintenance of existing flood management infrastructure and failure to maintain carrying capacity of waterways and drains for lack of regular desilting; Reduced absorptive capacity of soil due to rapid urbanization, resulting in increased flash flood events; Under-designed flood management infrastructure resulting in an insufficient level of protection of a large urban area; Flawed land use and urban planning, resulting in both legal and illegal settlements in high flood hazard areas; Lack of adequate preparedness, early warning communication, and evacuation of typhoon-affected communities; Climate change and sea level rise that over time may exacerbate the problem of flood management and drainage control; and Fragmented institutional flood management arrangements.
4. The Post Disaster Needs Assessment carried out after Ondoy reviewed the above identified issues in detail and recommended that a comprehensive update of the 1990 master plan be prepared to propose detailed flood risk management plans and determine an updated set of priority structural and non-structural measures to provide sustainable flood management. 5. The Flood Management Master Plan for the Greater Metro Manila Area (hereafter the Master Plan) has since been prepared by government, with technical and financial assistance of the World Bank through a grant from the Global Facility for Disaster Risk Reduction that was provided by the Australian Government. The Master Plan was approved by the NEDA Board on September 4, 2012 during a Board meeting chaired by the President of the Philippines. The total estimated cost for the implementation of the master plan is up to PhP 352 billion (US$7.0 billion) over the next 20-25 years. The main elements of the master plan are: Structural measures to reduce flooding from river systems that run through the city; Structural measures to eliminate long-term flooding in the flood plain of Laguna de Bay; Structural measures to improve urban drainage; Non-structural measures such as flood forecasting and early warning systems and
community-based flood risk management; and Improved institutional structure to deal with flood management in an integrated manner. 6. The September 4, 2012 NEDA Board meeting also approved an initial allocation of PhP 5 billion to DPWH to start the implementation of the Master Plan with some activities that can be implemented with minimum design. GoP has indeed started working on several activities, such as dredging, river bank protection, and modernization of a small number of pumping stations that are managed by MMDA. It is important to scale up such activities, which will be done under this proposed Project. However, government is also interested that some of the more complicated priority structural and non-structural measures are prepared for investment by government, possibly with the support of development partners. It is also seeking more advice on appropriate institutional developments. Therefore, in parallel, feasibility studies and designs of major priority interventions under elements (a) and (b) will be prepared that are essential for city wide improvement. Government was provided with US$6 million TA grant from the World Bank to

33
prepare necessary studies and designs for major structural interventions, including a high dam in the upper Marikina watershed. This TA grant is likely to result in the next major phase of the implementation of the Master Plan. 7. From the PhP 5 billion that was allocated towards the implementation of the Master Plan in 2012, PhP 1.59 billion was transferred by DPWH to MMDA. Utilizing the recommendations of the Master Plan and subsequent detailed studies by MMDA, with WB-executed TA support, a modernization program for 12 major pump stations was developed. Estimates placed the total cost of total modernization of the 12 facilities at PhP 3.3 billion. Due to the limited funds, only select priority activities were included in the initial PhP 1.59 billion project. Pump capacity increase was uniformly pegged at 25 percent. The project was tendered through four design-and-build contracts, using national government procurement standards. The modernization of select pumps was completed towards the end of 2015. The said project was a valuable learning experience in respect to the implementation of an accelerated program of modernizing drainage areas, including pumping stations. Some of the lessons learned include: (i) need for sufficiently detailed technical specifications to ensure smooth tendering and implementation; and (ii) need for comprehensive planning of various sub-components to ensure a fully-integrated implementation of required interventions in a drainage system. The proposed Project draws upon these experiences for the design of its drainage modernization program. Description of Project Components 8. The Project development objective is to improve flood management in selected areas of Metro Manila. This will be achieved through an integrated set of interventions to modernize existing pumping stations and make improvements to appurtenant infrastructure; construct new pumping stations to accommodate urban expansion in low-lying areas; increase short-term water retention capacity in the drainage areas; reduce the volume of indiscriminately dumped solid waste into waterways; and support community-driven resettlement of PAPs mostly ISFs to safer relocation areas, preferably in-city. The reduction in flood risks will be specific to drainage areas that are served by pumping stations. It will not reduce flooding risks in other parts of Metro Manila as that would require investments under the other elements of the master plan. 9. The combination of: (i) rainfall events leading to excess water in urban areas; (ii) underperforming pumping stations; (iii) solid waste causing obstructions of drainage channels, waterways, and at pumping stations; and (iv) people living over waterways results in poor water management, these days even during moderate rainfall events. As a result, water recedes slowly from urban areas, impacting the living conditions of many people. Urban drainage improvements within Metro Manila are considered a priority by the GoP to lessen the impact of rainfall events on people and the economy. Improvements will require a multi-sectoral approach of simultaneously improving physical infrastructure and solid waste management, and relocating those ISFs living on and over waterways and drainage channels, thereby affecting the proper O&M of drainage systems. Metro Manila has grown rapidly during the past decades and in many low-lying areas flood waters cannot be discharged for lack of pumping stations. MMDA and several LGUs have constructed small pumping stations during the past years, but these are not enough and there is a need to construct larger pumping stations to properly serve recent urban developments. The possible impact of climate change, which for Metro Manila is expected to lead to rainfall

34
events with higher intensity (the most likely scenario is a 12 percent increase in rainfall intensity by 2050) and rising sea level (estimated at 24 cm by 2050) that would worsen drainage conditions, will have to be taken into account as well. 10. It has been estimated that with the available Project funds some 56 drainage areas in 11 LGUs, covering a total estimated drainage area of 11,100 ha or over 17 percent of the total area of Metro Manila, can be supported, with the interventions differing by selected drainage area. The total population in these 56 drainage areas, either with existing or proposed pumping stations, is estimated at around 3.5 million or about 760,000 households. The direct Project beneficiaries, i.e. those that are adversely affected by regular flooding, are estimated at 1.7 million or about 370,000 households, with the exact number depending on the final selection and number of drainage areas that will benefit from funding under the Project. Table 1 provides the names and summary details of the 56 existing and new pumping stations proposed for inclusion in the Project, while the map at the end of this document shows the location of all 56 drainage areas.. Five drainage areas have been selected for implementation to start in Project year 1 (PY1). The details of the proposed activities in these five areas are given at the end of this Annex.
Table 1. Names and Details of 56 Pumping Stations PUMPING STATION LGU
Total Catchment Area (ha)*
Current Capacity
(m3/s)
Preliminary Cost
Estimate (USD ‘000) Existing Pumping Stations
1 Vitas Manila 641.10 32.00 1,064 2 Balut Manila 44.88 2.00 851 3 Paco Manila 195.58 7.59 7,979 4 Tripa de galina Pasay 2,058.01 58.00 4,255 5 Labasan Taguig 440.78 9.00 851 6 Balete-Ermita Manila 129.75 2.58 851 7 Escolta Manila - 1.50 851 8 Sta. Clara Manila 122.98 5.30 4,255 9 Libertad Pasay 772.19 48.00 7,447
10 Makati Makati 110.65 7.00 2,553 11 Abucay PS Manila 339.25 6.00 6,383 12 San andres Manila 375.21 19.00 8,511 13 Santibanez Manila - 0.35 426 14 Tapayan Taguig 281.20 15.00 1,064 15 Taguig Taguig 1,110.04 12.00 1,064 16 Hagonoy Taguig 264.52 6.00 213 17 Hulong duhat Malabon 10.00 0.11 851 18 Magsay say Malabon 10.00 0.11 851 19 Herrera Malabon 10.00 0.11 851 20 Concepcion Malabon 10.00 0.60 851 21 Balot Malabon 10.00 0.11 851 22 Merville-dampalilt Malabon 10.00 2.19 851

35
23 Tanza Malabon 10.00 0.11 851 24 Niugan Malabon 10.00 0.11 851 25 Artex Malabon 10.00 0.11 851 26 Muzon Malabon 10.00 0.11 851 27 Acacia Malabon 10.00 1.30 851 28 Roque Malabon 10.00 0.33 851 29 Aviles-Uliuli Malabon 251.91 16.45 4,255 30 Beata ind. Manila 10.00 0.11 426 31 Binondo-Escolta Manila 252.91 11.60 2,128 32 Pandacan Manila 152.76 4.40 426 33 Quiapo PS Manila 218.11 10.85 2,128 34 San agustin Manila - 1.10 1,277 35 Uli uli Manila - 6.00 12,787 36 Valencia Manila 296.27 11.85 1,066 Subtotal Existing 8,188.10 298.98 83,321
New Pumping Stations 1 Cutcut Pasay 114.10 12.00 21,277 2 Romualdez Manila - 2.50 4,096 3 Maytunas Mandaluyong
-San Juan 269.67 16.00 28,777 4 Buhangin Mandaluyong 130.52 5.72 3,191 5 Casili Caloocan-
Manila 193.33 4.59 3,989 6 Ilugin River Pasig 288.86 11.43 7,979 7 Isla Valenzuela 228.50 8.27 14,096 8 Damayang Lagi QC 120.95 13.20 8,703 9 Del Monte QC 32.76 6.40 13,261
10 Dona Imelda QC 51.24 2.70 7,012 11 Kalusugan QC 88.39 4.90 5,595 12 Mariblo QC 50.73 2.70 6,423 13 Masambong QC 14.41 26.00 42,478 14 Matalahib-Talayan QC 673.38 21.00 22,793 15 Progreso QC 64.99 6.30 15,936 16 Roxas QC 251.15 11.00 10,412 17 Sobrepena QC 68.87 1.80 3,825 18 Sta. Cruz QC 40.07 3.10 5,737 19 Talayan QC - 3.30 13,054 20 Tatalon QC 217.99 7.50 28,047 Subtotal New 2,899.91 170.41 266,679
GRAND TOTAL 11,088.01 469.39 350,000 Note * - blanks are areas that are already counted in other catchments.
36
Component 1: Modernizing of Drainage Areas (US$375.2 million) 11. Rehabilitation of Existing Facilities. Many of the 57 pumping stations managed by MMDA are over 30 years old and no longer operate at full capacity, while waterways and drainage channels are often heavily silted. Based on a recent inventory by MMDA of its existing pumping stations it is expected that this component will modernize about 36 existing pumping stations, but the exact number will be determined during Project implementation, based on a number of technical, economic, and social screening criteria, as well as the availability of Project funds. As part of the modernization program, pumps will be replaced with modern, more efficient, and higher capacity units. The design discharge determination will be underpinned by hydrological studies of the drainage areas and the best type of pump will be selected for each given site, including submersible pumps, possibly with variable speed drive, or horizontal axial pumps. In addition to optimizing the pumping capacity, the modernization of existing facilities will focus, as needed, on: (i) improvement to appurtenant infrastructure such as flood gates; (ii) changing power supply from diesel to electric, where feasible, with provision of back-up generator sets; (iii) installation of modern monitoring and control equipment, including Supervisory Control and Data Acquisition (SCADA) systems at selected pumping stations, to integrate them into the MMDA central management system; and (iv) upgrading of solid-waste management equipment at the pumping station, such as trash racks and collection areas that may include loaders and large waste containers (compactors). 12. Construction of New Pump Stations. MMDA and LGUs have identified 36 new pump stations, while DPWH has a long-list of 51 new pumping stations, including 27 major ones. The component will support DPWH with the construction of about 20 new pumping stations to serve flood-prone areas around Metro Manila where the population has grown rapidly over the past 10-20 years. The scope of the new pumping stations will include: (i) civil works, pumps, and electro-mechanical equipment related to the pumps, motors, and ancillary equipment; (ii) floodgates; (iii) and for selected stations, equipment for integration in a centralized monitoring and control system. After construction, new pumping stations will be handed over to MMDA for O&M as per current MoA. MMDA will as much as possible assign engineering staff to a specific pumping station when the design work starts, so that they are fully acquainted with the pumping station at the time of hand-over. 13. Upgrading of Drainage Systems. Contingent to the modernization of the pumping stations or construction of new ones is the improvement of waterways and drainage systems. For effective drainage control, the efficiency of the drainage system to bring flood waters to the pumps must be improved. Upgrading of the drainage system could include cleaning and dredging of waterways and drainage channels, cleaning drainage pipes, covering manholes with grids, and flood walls, while it is not excluded that some new drainage channel developments will be needed to optimize the drainage of an entire drainage area. Detailed hydrologic analysis will determine the needed interventions that are drainage area specific. Where feasible, the Project will support the establishment of green barriers along selected drainage areas. Green barriers will serve two purposes, they will act as natural wastewater treatment systems and they will maintain the shoreline of the drainage areas free from structures. These green barriers will make use of design features of engineered reed beds, which have proven to be effective in the treatment of wastewater (both domestic and commercial) in several examples in the Philippines. For example, green barriers have already been effectively used in the Estero de Paco area. As part of the green barriers,

37
beautifying selected waterways and easements will be done, where feasible, reinforcing the incentive not to indiscriminately dispose of waste into the waterways.
14. Asset Management and Maintenance Equipment. The Project will develop asset management plans, as a minimum for the large pumping stations, and operational manuals will be prepared or updated, where needed, to guide MMDA towards proper O&M of the pumping stations and other drainage infrastructure. MMDA typically has enough manpower in place at a pumping station to provide for mechanical and electrical maintenance and repairs. As part of the preparation of the asset management plan or operational manual the additional need for tools and equipment will be assessed and be procured by the Project, not just for the pumping station, but also for the waterways and drainage channels.
15. The Project will provide modern specialized waterway maintenance equipment, such as floating bulldozers, amphi-dredge loading barges, waterproof trucks, etc. This equipment is designed to work in waterways and drainage channels that cannot be reached by standard dredging equipment. All urban channels from 2-100 meters wide as well as under low bridges from as little as 0.70 m from water level can be dredged. The proposed equipment works from the water when there is no access from the adjacent banks. For example, about 90 percent of all urban channels (drains, tertiary, secondary and main channels) in the Netherlands are dredged and maintained with specialized urban dredging techniques, often floating. Most of the equipment will initially be used by MMDA, DPWH, and contractors for emergency cleaning and for testing and demonstration purposes to show how efficient dredging and cleaning can be done with the right types of equipment. DPWH intends to test and demonstrate some of the maintenance equipment also in other main cities, including Cebu and Davao.
16. Modern equipment for cleaning of interceptor drains and drainage pipes and removal of water hyacinth or water lilies will be introduced as well. Remote controlled small type bulldozers will be introduced to clean closed drains and interceptors. Management of water hyacinths or water lilies, mostly by MMDA as part of its responsibility to maintain waterways, will be addressed specifically in areas where these are prevalent. The Project will finance appropriate equipment for harvesting and preservation prior to processing, but also programs that encourage processing for reuse of products such as community livelihood activities, which are especially practiced by women, and production of biogas on a pilot basis. As it is proposed that most equipment will be procured during PY1, more details are provided later in this Annex. 17. Increasing Water Retention Capacity. A program of increasing the water retention capacity within the Project drainage areas will be developed and implemented, where suitable and doable, as part of sustainable urban drainage systems (SUDS). 2 This can include green and other infrastructure such as rooftop rainwater collection, green roofs, permeable concrete roads and pavements, and temporary retention of drainage water in public areas such as parks and basketball courts, and during extreme flood events even in underground parking garages. 2 SUDS aim to manage rainwater more naturally and are particularly useful in helping to manage small but frequent floods from rainfall, just as an un-urbanized landscape would. The system has three main aims: (i) to catch and slow down the flow of water; (ii) to improve the quality of water by capturing and treating the pollutants it contains; and (iii) where feasible, to benefit the local community by providing a green space that people can enjoy.
38
18. Non-structural Measures. The need for non-structural interventions will be limited. However, as part of the design of specific interventions in each drainage area there may be activities related to community-based flood risk management, setting up of local warning systems, etc.
19. Implementation. DPWH, with the support of MMDA and engineering consultants, will design and procure the interventions in the drainage areas. Modern mathematical tools such as 3-dimensional interactive models may be used for the larger drainage areas to visualize flooding events and the impact of proposed interventions. It is expected that most pumping stations will be designed by DPWH either in-house by own engineers or with the support of engineering consultants. Contractors will be responsible for custom manufacturing and installation of pumps as well as related civil works at the pumping stations and in the drainage systems. However, DPWH may also follow design, manufacture, and install practices for some of the pumping stations, especially new ones. DPWH, again with the support of MMDA staff and consultants, will be responsible for day-to-day construction supervision. A Memorandum of Agreement has been signed by DPWH and MMDA that spells out the responsibilities of each of the agencies during design, construction, and subsequent operation and maintenance. Component 2: Minimizing Solid Waste in Waterways (US$48 million) 20. Since the enactment of Republic Act 9003, awareness of the threat posed by solid waste to the natural environment has increased, but enforcement of the legislation varies significantly across and even within LGUs. Solid waste remains a major challenge threatening Metro Manila’s waterways. Urban drainage has been hampered by the accumulation of solid waste in waterways and at pumping stations, significantly reducing the water carrying and retention capacities, which intensifies the flood hazard and increases the risk of direct damage and economic losses. Pumping stations are directly affected by the accumulation of solid waste and numerous pumping stations are functioning at less than their rated capacity. 21. ISF communities are key contributors to solid waste that accumulates in Metro Manila’s waterways, but they are not the sole contributor. Businesses, both large and small, and residents with land tenure are responsible as well. Moreover, improperly disposed waste from other parts of drainage areas can easily find its way into the same waterways. 22. As with other behaviors that produce negative externalities and moral hazard, the individual actors contributing to the problem of improper waste disposal assign blame to others. Accordingly, behaviors need to be understood in order to address the root cause of solid waste in Metro Manila’s waterways. The individual actors’ - residents, households, and businesses -motivations and social and environmental contexts have been taken into account in the design of the proposed activities in this component. Yet, these issues are complicated by the fact that Metro Manila’s waterways usually traverse the boundaries of several barangays and sometimes even of LGUs. The inter-jurisdictional nature of waterway management and protection diffuses local responsibility. Therefore, intervention at a local level requires strong coordination with other adjacent communities. Otherwise, responsibility for waterway management, including solid waste issues, may continue to be attributed to others.
39
23. The specific objective of this component is to improve solid waste management practices within sections of the drainage areas that will receive support from the Project, building on the existing systems implemented by LGUs, barangays, CSOs, and households. The aim is to enhance the sustainability of the solid waste management interventions, which in turn should lead to less waste in waterways and drainage channels. This will be achieved through strengthening and complementing existing waste collection systems and facilities, as well as transport and disposal processes, raising community awareness, and providing incentives for individual behavior change, all aimed at reducing solid waste dumped into waterways, not just in the immediate vicinities of the targeted pumping stations, but, as needed, upstream along waterways within the catchment area of a given pumping station. Activities under this component will be organized by spatial scales of intervention, but mainly focusing on neighborhood-level activities in the area upstream of the pumping station, and to a lesser extent on metropolitan-wide activities. The rationale of this approach is to ensure a comprehensive and effective set of interventions to address the challenges of solid waste in waterways, while also enabling specific activities to be customized and focused at the appropriate locations and scales, and avoiding a “one-size fits all” approach. At the neighborhood level, in particular, the proposed activities are intended to complement and reinforce one another, with activities selected for relevance in each location. 24. The approaches defined under this component take account of lessons learned in past solid waste management interventions, namely, that solid waste management requires individual behavior change in addition to improvements in infrastructure, equipment, and institutions. To address the challenge of behavior change, the activities incorporate methodologies of results-based financing that provides rewards to individuals or communities based upon verified achievement of desired results. 25. Component 2 will support the following activities, with the exact activities to be implemented based on the local needs in a particular drainage area. Implementation of specific activities will largely be done by participating LGUs and barangays, with oversight and coordination by MMDA, which will also manage the RBF scheme: Strengthening solid waste collection systems, including necessary equipment; Conducting targeted IEC and awareness campaigns on solid waste management; Implementing an incentive-based approach for solid waste management results; Studies to improve solid waste management at metropolitan level; and If found feasible, pilot waste-to-energy facilities. 26. Strengthening Solid Waste Collection Systems. Under this activity, the Project will support provision of necessary equipment and training to strengthen the solid waste collection systems in selected pumping stations, LGUs, and barangays. LGUs and barangays will be responsible for the increased staffing required to operate the tools and equipment. LGUs and barangays will be selected based on their location within the drainage areas of pumping stations that are adversely affected by solid waste. This activity will:
a) Strengthen the Capacity of Pumping Station Solid Waste Management Systems, including the provision of equipment at selected pumping stations (to be designed as

40
part of component 1). The activity supports, but is not limited to, the following investments: Regular collection by MMDA. More consistent waste collection will help manage
the quantity of on-site pumping station waste; Covered containers or compactors and large trash bins. In addition to improved collection efficiency, compactors and trash bins will contain the trash and reduce the incidence of pest and odor nuisance at the site and surrounding community; Trash loaders and other collection equipment. Equipment provisioning and upgrades will facilitate the removal of the trash from the premises of the pumping station.
b) Strengthen existing LGU Collection Systems. The Project will provide the necessary equipment, financing, and training to support the following in parts of the drainage areas where solid waste accumulation and disposal in waterways and drains is a problem: Regular and efficient secondary solid waste collection from designated locations
in the LGU; Establishment of neighborhood collection points (NCP) at designated locations and appropriately staffed to ensure that waste is deposited correctly and not subsequently disturbed; and Space-appropriate, covered containers at strategic NCP locations.
c) Strengthen existing Barangay Collection Systems. The Project will provide the
necessary equipment, financing, and training to support the following: Regular, safe, and efficient primary solid waste collection from designated locations within the barangay; Establishment of NCPs with appropriate collection equipment such as bins and push cards, and staffing; and Household compliance in depositing waste at the designated collection times and locations.
27. IEC and Awareness Campaigns on Solid Waste Management. This activity will support targeted training to barangay captains, selected households, barangay waste collectors, and eco-patrols in effective solid waste management practices. The Project will support workshops and seminars, with emphasis on leadership, values, community ownership, behavior change, and community-based monitoring and evaluation. The Project will involve recognized experts and CSOs with expertise in local community-organizing, capacity development, and conducting training on behavior change. In addition to training, mass communication campaigns using insights from behavioral economics will be developed for dissemination among key areas upstream of critical pumping stations. This communication will be complementary to other IEC activities and will be deployed using SMS messaging, among other technologies. 28. Incentive-Based Approach for Solid Waste Management Results. Under this activity, the Project will support a results-based financing approach that provides payments to barangays upstream of pumping stations. Incentive payments will be based on independently verified results

41
of improved waste collection and reduced waste quantities at pumping stations. Incentives will allow for small investments that will benefit the barangay population, such as street lights, bicycle paths, and basketball courts. Additionally, the Project will provide technical assistance in establishing eco-patrols/appointing eco-aides, and barangays will designate respected leaders in the community to oversee proper individual/household-level waste disposal.3 The eco-patrols/eco-aides will be remunerated contingent upon the improvement of solid waste management within his/her community. 29. The RBF approach supported under this sub-component addresses some of the root behavioral issues that contribute to unsound solid waste management practices at the household and barangay levels. To ensure the effectiveness of the RBF approach, the Project will promote active feedback loops during implementation as a way to monitor and evaluate progress. Through proper implementation and iterative learning, RBF is an innovative approach that may prove useful in catalyzing behavior change. As behaviors become habitual and part of the social norm within a community, financial incentives can be phased out without compromising the sustainability of the behavior. 30. Studies to Improve Solid Waste Management. A set of metropolitan-wide activities for improved solid waste management will provide the right enabling conditions and complement the other activities under this component. The scope of these interventions involves the entire Metro Manila area and the various solid waste actors. These interventions, to be executed directly by MMDA, are for a large-scale metro-wide IEC campaign that complements the local-level IEC; an integrated management information system; and a solid waste master plan for Metro Manila. A strong integrated MIS is crucial for improved operation and performance of Metro Manila's overall solid waste management system. The MIS will help track the implementation of other activities under this component, as well as enable MMDA to better monitor waste collection activities and track performance, and thus deploy needed resources to critical sites in a more strategic, dynamic and efficient manner. Moreover, it will improve coordination and information flow across all government levels and with other public/private stakeholders. The solid waste master plan will provide the overall framework for a strategic and coordinated vision for all of Metro Manila. In the context of existing national frameworks and guidelines, the master plan will provide specific guidance for LGUs, while strengthening the role of MMDA in managing inter-jurisdictional activities. 31. Innovative Waste Management Opportunities. If confirmed by the solid waste master plan, the Project will support, where feasible, MMDA’s agenda to apply appropriate echnologies to reduce the volume of residual solid waste from Project drainage areas that ends up in landfills. Possible solutions include shredding machines at pumping stations to reduce the waste volume and waste processing equipment such as styro-filters that transform styrofoam waste into activated 3 Eco-aides are those who go door-to-door to collect residential wastes and bring them to designated collection points. To be inclusive of existing systems and labor markets, eco-aides are often selected from informal waste collectors within communities. The role of eco-aides may vary from LGU to another. In some LGUs, they are also tasked to do some sweeping tasks or document violators who will be reported to the barangay environmental police for action. They are paid by the barangay on a monthly basis, ranging from PhP 1,500 to 3,000, depending on the financial capacity of the barangay.

42
carbon, which can then be utilized for purifying water. If studies show viable technical and financial solutions, loan proceeds may be used to support a number of innovative waste management opportunities. US$15 million has been tentatively earmarked for such pilots, but the final decision on financing under the Project will be made after the results of a feasibility study have been approved by government, and the World Bank has had a chance to assess the viability of proposed interventions and has been able to provide advice, including on how best to manage such facilities. It is noted that IFC is exploring PPP opportunities in waste to energy in the Philippines. Before the Project can finance any agreed activity under this sub-component a restructuring will have to be processed, including as needed updates of the safeguards documents. Component 3: Participatory Housing and Resettlement (US$55.75 million) 32. The existing pumping stations to be modernized under the Project are typically located in well fenced areas and there has been no encroachment of people within the immediate pumping station sites. However, some drainage areas with existing pumping stations have PAPs, including ISFs, along waterways who will have to be resettled where they pose a constraint on construction or where they will affect the proper operation and maintenance of the drainage areas to ensure optimum water flow in waterways leading to the pumping stations. The area from which people will have to move is referred to as the “technical footprint”. The technical footprint for each site will be defined by detailed technical survey.4 The component aims to strengthen the affected people’s resilience to external risks by providing access to better housing on safer grounds, basic public services, more stable income sources, and stronger community organizations. Initial screenings have listed an estimated 11,500 PAPs (about 2,500 households) to be resettled from the technical footprint in 16 drainage areas. The actual number of ISFs may change based on the pumping stations that will ultimately be targeted under the Project. 33. Land acquisition, site development, housing construction, rental support (for transitional period, as needed), livelihood assistance programs, and various technical assistance and capacity-building activities will be be financed under the Component that will help strengthen the communities, LGUs, and implementing agencies to successfully implement this component. In order to ensure that mortgages are affordable to all PAPs, an upfront income-based capital subsidy will be provided. In practice, the subsidy means that some of the housing construction, land acquisition, and site development costs provided by the KSAs will not be recovered through mortgages and will be written-off by the government. The amount to be written-off will be scaled based on PAPs’ income levels. Land acquisition, site development, housing construction, and income-based capital subsidy will specifically be financed by the Government counterpart funds, and Bank funding will be used for the remaining activities. 34. The component will also finance, as needed, remedial measures such as community development assistance (community-based infrastructure, community livelihood programs, etc.) 4 Resettlement will be unavoidable where dwellings and structures established by people, including ISFs, impede the flow or inhibit access for effective maintenance and operation of the facilities. The area of influence is referred to as the ‘technical footprint’. The technical footprint covers the pumping station and its related facilities as well as sections of waterways serving the pumping stations. The physical limits of technical footprints for waterways are established on the basis of hydrological and engineering criteria for each drainage area. Waterway sections within the technical footprint are typically in relatively close proximity to the pumping facility.

43
should gaps be identified from due diligence studies for resettlement from the technical footprint under recent government programs, including Oplan Likas. The objective of Oplan Likas and the Project differ in that the former aimed to evacuate people from danger areas such as from the 3-meter easement from waterways while the latter aims to retain as many as possible by improving flood management. The feasibility of this Project does not depend on Oplan Likas, while the two programs are not contemporaneous in that Oplan Likas was initiated before the Project was conceptualized. The two programs are therefore not considered linked beyond the technical footprint. Any resettlement that took place from the technical footprint will be assessed to examine any gaps vis-à-vis OP 4.12 and remedial measures will be provided accordingly. All activities under this component will comply with procedures and requirements stipulated in national legislation and in the World Bank’s OP 4.01 (Environmental Assessment) and OP 4.12 (Involuntary Resettlement). 35. To allow flexibility and cater to varying needs of the PAPs, three standard resettlement options will initially be offered, with priority being in-city resettlement. Options include: (i) in-city resettlement in vertical housing; (ii) near-city resettlement defined as areas that will result in minimal socio-economic dislocation with secure access to basic services in adjacent LGUs, where people can ideally physically and financially commute to their livelihoods of origin; or (iii) one-off lump-sum cash compensation. Screening of feasibility of these options will be undertaken before consulting with PAPs to make sure that only affordable and viable options are discussed with PAPs. Other options expressed as preference during consultations with PAPs (e.g. off-city resettlement) can be considered as well. Resettlement will build on the existing government housing programs and will be implemented by two KSAs, namely NHA and SHFC. The options will be presented and discussed with detailed information to allow the PAPs to make informed decisions. SHFC and NHA are especially interested to promote the following two options that are important development options under their resettlement programs: SHFC – High-Density Housing, In-city or Near-city. Under this option, SHFC will provide
housing finance to HOAs or housing cooperatives. The HOAs or housing cooperatives will choose and mobilize a CSO to help them in community organizing, social preparation and mobilization. They will then undertake land research and acquisition, design and construction of housing, and community infrastructure. The communities will also carry out procurement, implementation, and monitoring of civil works, all with expert support from the CSO and other hired specialists. SHFC will provide oversight; and NHA - Low-rise Buildings, In-city or Near-city. NHA will carry out land acquisition and construction of housing units for the ISFs. Housing construction will be done through public procurement of contractors by NHA. NHA will elicit the participation of ISF communities particularly in housing design and monitoring of civil works.
36. Based on knowledge gained with the implementation of such programs, the two agencies have agreed to build in some innovative and good practices to improve their existing housing programs. These include: (i) provision of upfront income-based capital subsidy to bridge the affordability gap, specifically for those who opt for in-city vertical housing; (ii) provision of land on a usufruct arrangement to minimize the financial burden on the PAPs; (iii) standardization of the construction price ceiling and minimum specifications for both agencies’ programs to avoid inequity; and (iv) as needed, provision of rental support, in the form of cash, as a transitory measure
44
until the completion of their new housing units, which is expected to be around 24 months on average. The rental subsidy will allow early relocation so that the works to start in the technical footprint. A geographical division of labor between the two agencies has also been agreed upon, while also agreeing that there has to be some flexibility in this based on preference of affected communities. A communications plan will be developed under the Project to ensure that PAPs will be given full information on the resettlement options to allow them to make informed decisions. 37. Component 3 will support the activities discussed in the following paragraphs. 38. Land and housing. This sub-component will finance land acquisition, site development, housing construction, and upfront subsidy to ensure that mortgages are affordable to all PAPs. Government counterpart funds will finance land acquisition, site development, housing construction, and the capital subsidy in the form of writing off part of the loans to PAPs to bridge the affordability gap, specifically for those who opt for in-city vertical housing. Based on available data, an estimated 73 percent of the ISFs cannot afford the required amortizations under the existing in-city vertical housing programs. The actual subsidy per PAP will differ, based on income levels of the PAPs, where poorer ones will get a greater amount of subsidy. 39. The proposed upfront capital subsidy design was developed through a year-long inter-agency working group comprising all KSAs, chaired by HUDCC, and supported by a WB TA. ISFs were first grouped into 10 income brackets based on the most comprehensive income data on ISFs available, and to minimize the cliff effect. The affordable loan amount was derived from the monthly mortgage payment each income group can afford, which was based on monthly household income allocated for housing-related expenditure (according to past few national Family Income and Expenditure Surveys). The gap between what ISFs are required to repay (PhP 410,000, through a 30-year loan with interest of 4.5 percent per annum) and the affordable loan amount will be deducted from the mortgage amount and will be absorbed as a loss by the KSAs, which is considered an upfront subsidy. The amount of subsidy will differ for each income group. This amount will be written off from the PhP 410,000 loan upfront, and monthly amortizations will be calculated accordingly and will be stipulated in the memorandum of agreement to be signed between individual ISFs and SHFC/NHA. ISFs’ original income levels will be determined through census that will be carried out to develop the RAP, using the national household targeting system, a proxy means test used under the government’s national conditional cash transfer program which is deemed quite accurate. To further bridge the affordability gap, land will be provided under usufruct arrangements. 40. Grant support for rental support and one-off cash compensation. The component will provide rental support, as needed, as a transitory housing measure for those who opt for any of the housing options. The rental support will be provided until the new housing units are complete. This arrangement will be relevant especially during the first years of implementation. ISFs can move out of the Project footprint areas so that modernization of drainage areas can start, while planning and development of housing units is still ongoing. Rental assistance will be provided on a monthly basis in the form of cash directly from NHA/SHFC to the affected households. NHA/SHFC with the help of the CSO engaged for social preparation will ensure that the temporary accommodation meets minimum quality and safety standard. The levels of rental support, estimated at PhP 1,800/ISF per month, are the incremental costs for ISFs to afford a low-cost rental

45
accommodation outside the informal settlement areas. The incremental costs include the difference between rents as well as utility cost such as water and electricity between the original waterway structures and adjacent low-cost rental housing. The latter is derived from the Metro Manila low cost rental market study which was conducted by the World Bank. Those who opt for one-off cash compensation rather than a housing option will be provided cash compensation in line with the Resettlement Policy Framework. 41. Technical studies, capacity building, community organizing, and livelihood assistance. The component will finance the non-structural requirements of housing and resettlement. It will support consultant services to: (i) help the LGUs and the community organizations in the conduct of consultations, social preparation, and community organizing activities to ensure substantive community participation in the resettlement process; (ii) carry out technical studies, including as needed soil suitability tests, geo-technical surveys, subdivision plans, and housing and community infrastructure designs, etc.; and (iii) provide livelihood assistance to homeowners associations (HOA) or housing cooperatives. 42. The Project has an inherent feature of capacity-building for: (i) HOAs and housing cooperatives on aspects relating to organizational development and strengthening, community mapping and surveying, community savings, settlement planning, community procurement, financial management, and construction monitoring, among others; and for (ii) LGUs on participatory shelter/resettlement planning, procurement and financial management, and construction supervision, among others. Costs for the above activities will be channeled from the NHA/SHFC to the CSOs working with particular HOAs and housing cooperatives. Costs for the following activities will be channeled from the NHA/SHFC to the contractors selected by the communities: technical studies, including soil suitability tests, geo-technical surveys, subdivision plans, and housing and community infrastructure designs. 43. Resettlement management and monitoring. The Project will support the establishment and operation of a grievance redress mechanism in NHA and SHFC, specifically for resettlement activities. It will also carry out process evaluation, participatory monitoring, outcome assessment, including beneficiary satisfaction survey, and documentation, knowledge sharing, and peer-to-peer learning between and among communities and LGUs. 44. Lessons taken into account for component design. The component was developed based on a number of international and local good practices in housing and resettlement for ISFs. Learning from innovative initiatives supported by World Bank financed TAs in the housing sector in the Philippines, as well as lessons learned from failures in such programs, have been reflected in the Project design, specifically in the following aspects: The importance of an integrated and holistic approach to resettlement. The prevailing
resettlement approach under the government’s resettlement program has been off-city relocation, often resulting in disconnect from livelihood opportunities and social networks, and many resettled people return again to ISF areas in Metro Manila. Such approach to resettlement is neither in line with the Bank’s safeguards policies and guidelines, nor sustainable for the communities or government. The design of component 3 strives for a holistic approach by empowering communities to work with LGUs and KSAs to build their

46
resettlement community of choice, with enhanced organizational capacity, which is essential for the sustainability of the communities;
The need for extensive community participation in resettlement design and implementation. The component is anchored on empowering communities to make their own decisions among different resettlement options. This approach will help ensure community buy-in, and maintaining ISFs’ access to livelihood, basic services, and social networks. Based on a number of successful in-city developments in Metro Manila, this approach ensured much higher willingness to pay mortgage and services, and hence contributes to the sustainability of the shelter programs of the participating KSAs;
The need for subsidies for technical assistance and infrastructure to make in-city housing affordable for ISFs. Considering the issues with livelihood opportunities and adequate service provisions in off-city resettlement sites, making in-city housing affordable for the ISFs is essential for both the ISFs themselves and the sustainability of such resettlement program. Experiences in past ISF housing programs have shown that a critical funding gap lies in the technical assistance to enable the communities to make informed choices in land identification and housing options, as well as in the development of housing and community infrastructure; and
The need for LGU to be in the drivers’ seat on shelter programs. Past national ISF housing programs often enjoyed limited LGU support, with receiving LGU of the off-city relocation finding it difficult to deal with a large influx of relocatees. Until recently, the Oplan Likas program has heavily relied on KSAs to directly work with communities, giving little incentives for LGUs to proactively support its implementation. The component will involve LGUs with implementation and work in close partnership with MMDA, DPWH, KSAs, CSOs, and communities to forge shelter solutions.
Component 4 - Project Management and Coordination (US$20 million) 45. The component will support the operation of the PMO in MMDA and DPWH. DPWH already has a well-established PMO under its FCMC, headed by a director, and a Project Manager has already been appointed. MMDA has established a PMO team comprising management and staff from the Planning Office, the FCSMO, and the Solid Waste Management Office. Both multi-disciplinary teams have worked on the project preparation as well. The PMOs will coordinate the overall planning, coordination, implementation, and supervision of Project activities, including central procurement and management of funds. Accounting and bookkeeping will be mainstreamed in MMDA and DPWH’s Finance/Comptrollership Division. 46. The component will provide funding for: (i) incremental operating costs, including office rentals and utilities, per diem and other travel expenses for staff, operation and maintenance of vehicles, and allowances for short-term contractual staff; (ii) office equipment and materials, including computers, printers, and communication equipment; (iii) technical and management training of relevant DPWH, MMDA, and PMO staff; (iv) training of the PMO staff in strategic communications, the formulation of a communication and citizen engagement plan, and the execution of the same, headed by a dedicated communication specialist. Citizen engagement will
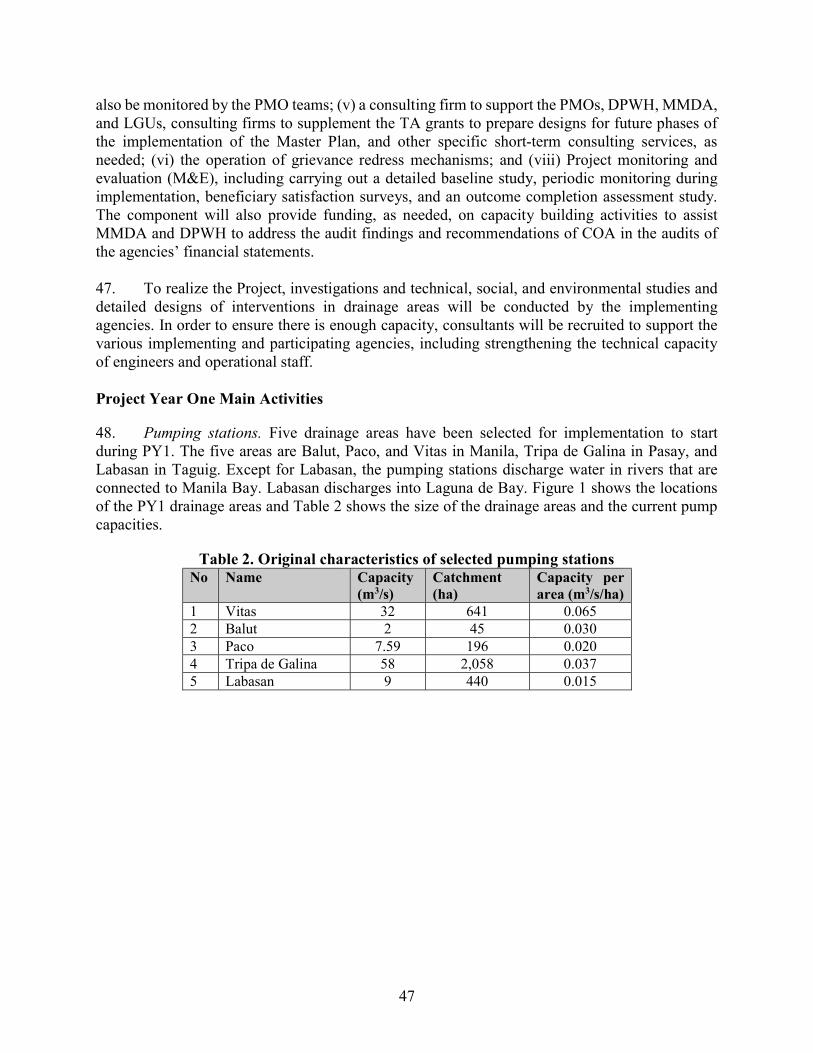
47
also be monitored by the PMO teams; (v) a consulting firm to support the PMOs, DPWH, MMDA, and LGUs, consulting firms to supplement the TA grants to prepare designs for future phases of the implementation of the Master Plan, and other specific short-term consulting services, as needed; (vi) the operation of grievance redress mechanisms; and (viii) Project monitoring and evaluation (M&E), including carrying out a detailed baseline study, periodic monitoring during implementation, beneficiary satisfaction surveys, and an outcome completion assessment study. The component will also provide funding, as needed, on capacity building activities to assist MMDA and DPWH to address the audit findings and recommendations of COA in the audits of the agencies’ financial statements. 47. To realize the Project, investigations and technical, social, and environmental studies and detailed designs of interventions in drainage areas will be conducted by the implementing agencies. In order to ensure there is enough capacity, consultants will be recruited to support the various implementing and participating agencies, including strengthening the technical capacity of engineers and operational staff. Project Year One Main Activities 48. Pumping stations. Five drainage areas have been selected for implementation to start during PY1. The five areas are Balut, Paco, and Vitas in Manila, Tripa de Galina in Pasay, and Labasan in Taguig. Except for Labasan, the pumping stations discharge water in rivers that are connected to Manila Bay. Labasan discharges into Laguna de Bay. Figure 1 shows the locations of the PY1 drainage areas and Table 2 shows the size of the drainage areas and the current pump capacities.
Table 2. Original characteristics of selected pumping stations No Name Capacity
(m3/s) Catchment (ha)
Capacity per area (m3/s/ha)
1 Vitas 32 641 0.065 2 Balut 2 45 0.030 3 Paco 7.59 196 0.020 4 Tripa de Galina 58 2,058 0.037 5 Labasan 9 440 0.015

48
Figure 1. Location of the five PY1 pumping stations 49. Between 2013 and 2015, MMDA modernized some pumps at 12 pumping stations. MMDA estimated the recommended increase in pumping capacity based on little hydrological assessments. A standard increase of 25 percent was used for most of the pumping stations. During the detailed preparation studies for the five PY1 areas, much more attention was paid to hydrological assessments to support the best decision-making on the upgrading of the existing pumps. The better the hydrological system can be assessed and understood, the better the feasible pumping capacity can be determined. 50. The standard required pumping capacity of the pumping stations in Metro Manila is based on the ability to handle a 48-hour design rain storm with a return period of 10 years. As part of the determination of the possible pumping capacity, numerous calculations have been carried out for all five pumping stations to determine the water level upstream of the pumping station and the flooded area during and immediately after a two day long 10-year design rainstorm. The first calculation for each pumping station has been done for the current pumping capacity. From there the discharge capacity of the pumps has been step wise increased until the capacity that no more flooding occurred. For example, for Vitas pumping station calculations show that the current pumping capacity of 32 m3/s is clearly not sufficient to prevent flooding during a two-day rainstorm with a return time of 10 year. To prevent all flooding in the catchment area of Vitas

49
pumping station by pumping alone, the current pumping capacity of 32 m3/s needs to be increased to 80 m3/s. 51. In general, the current pumping capacities of all five PY1 pumping stations are clearly insufficient to discharge the runoff from a two-day design rainfall with a return period of 10 year without causing severe flooding. The required pumping capacities to prevent flooding during and after a two-day design rainstorm with a return period of 10 years are 2.5 to 15 times higher than the current pumping capacities. For most existing pumping stations, such large increase in capacity cannot be realized in the current buildings, while existing pump pits, pump bell mouth, etc. are also limiting factors to increase pumping capacity. Rebuilding all this for the above-mentioned increases in pumping capacities would be very expensive and is not considered. Based on hydraulic design calculations the feasible flow capacities for the pumping stations can be determined. The feasible increase in pump capacity within the current pumping stations is generally not sufficient to prevent flooding altogether. There will be some remaining flooding in the drainage areas, but this will affect smaller areas, have lower flood water depths, and flood waters will be drained quicker than currently the case. For example, for Vitas, the proposed pumping capacity is 50 m3/s, which will result in a temporary flooded area of 12 percent, about half of the flooded area with the current pumping capacity. For each drainage area additional solutions can be introduced to reduce the flooded area and depth further, such as downstream river dredging to increase the utilization of flood gates and water retention facilities in the drainage areas. 52. Table 3 shows the cost estimates for the replacement of current pumps with larger ones and the necessary auxiliaries such as new generator sets, new or refurbished trash racks, and flood gates.
Table 3. Summary of costs for the five pumping stations No. Pumping Station Estimated
Costs (PhP) Estimated
Costs (US$) 1 Vitas 738,770,879 15,752,000 2 Balut 83,191,900 1,773,800 3 Paco 181,687,000 3,873,900 4 Tripa de Galina 231,746,900 4,941,300 5 Labasan 198,561,000 4,233,700
TOTAL PY1 1,433,957,679 30,574,700 53. Desilting of Waterways. Desilting of the waterways leading to the five pumping stations is another activity expected to start in PY1. The volumes of dredged material and cost estimates are summarized in Table 4.
Table 4. Summary of desilting volumes and costs for PY1 drainage areas No. Pumping Station Sediment
Volumes (m3) Estimated
Costs (PhP) Estimated Costs (US$
1 Tripa de Galina 472,148 172,941,000 3,680,000 2 Vitas 383,166 101,863,000 2,167,000 3 Paco 92,989 22,827,000 486,000 4 Balut 53,031 14,423,000 307,000
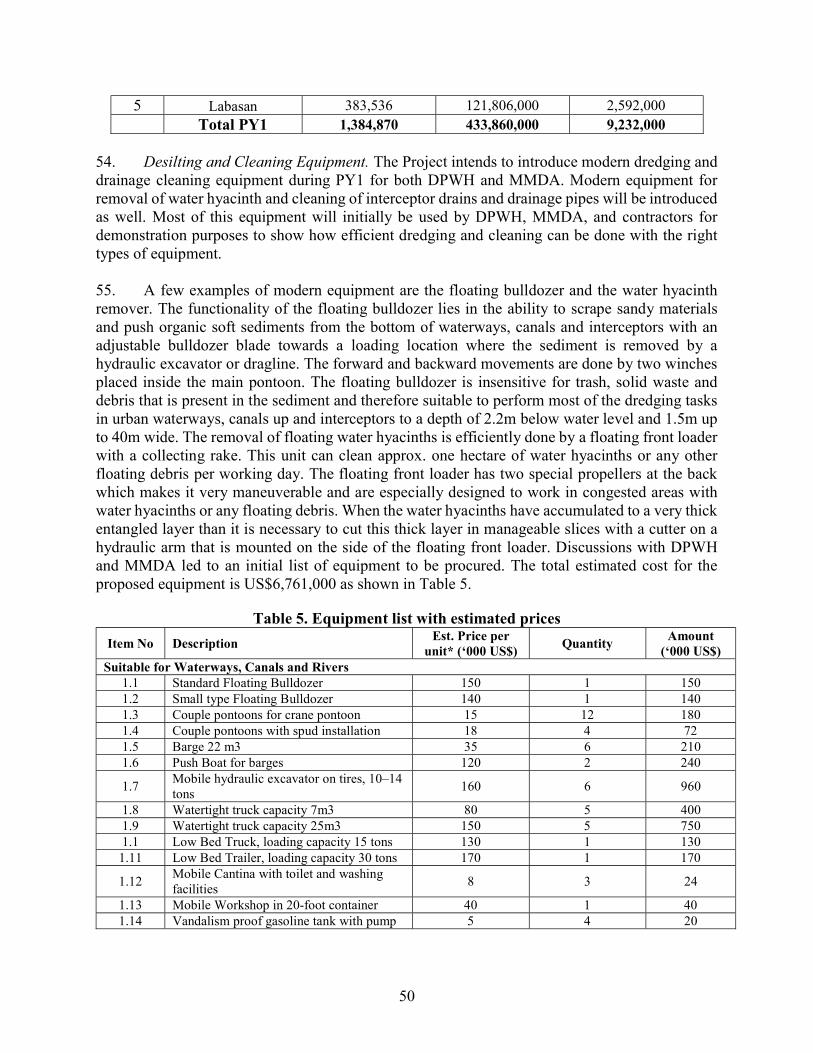
50
5 Labasan 383,536 121,806,000 2,592,000 Total PY1 1,384,870 433,860,000 9,232,000
54. Desilting and Cleaning Equipment. The Project intends to introduce modern dredging and drainage cleaning equipment during PY1 for both DPWH and MMDA. Modern equipment for removal of water hyacinth and cleaning of interceptor drains and drainage pipes will be introduced as well. Most of this equipment will initially be used by DPWH, MMDA, and contractors for demonstration purposes to show how efficient dredging and cleaning can be done with the right types of equipment. 55. A few examples of modern equipment are the floating bulldozer and the water hyacinth remover. The functionality of the floating bulldozer lies in the ability to scrape sandy materials and push organic soft sediments from the bottom of waterways, canals and interceptors with an adjustable bulldozer blade towards a loading location where the sediment is removed by a hydraulic excavator or dragline. The forward and backward movements are done by two winches placed inside the main pontoon. The floating bulldozer is insensitive for trash, solid waste and debris that is present in the sediment and therefore suitable to perform most of the dredging tasks in urban waterways, canals up and interceptors to a depth of 2.2m below water level and 1.5m up to 40m wide. The removal of floating water hyacinths is efficiently done by a floating front loader with a collecting rake. This unit can clean approx. one hectare of water hyacinths or any other floating debris per working day. The floating front loader has two special propellers at the back which makes it very maneuverable and are especially designed to work in congested areas with water hyacinths or any floating debris. When the water hyacinths have accumulated to a very thick entangled layer than it is necessary to cut this thick layer in manageable slices with a cutter on a hydraulic arm that is mounted on the side of the floating front loader. Discussions with DPWH and MMDA led to an initial list of equipment to be procured. The total estimated cost for the proposed equipment is US$6,761,000 as shown in Table 5.
Table 5. Equipment list with estimated prices Item No Description Est. Price per
unit* (‘000 US$) Quantity Amount (‘000 US$)
Suitable for Waterways, Canals and Rivers 1.1 Standard Floating Bulldozer 150 1 150 1.2 Small type Floating Bulldozer 140 1 140 1.3 Couple pontoons for crane pontoon 15 12 180 1.4 Couple pontoons with spud installation 18 4 72 1.5 Barge 22 m3 35 6 210 1.6 Push Boat for barges 120 2 240 1.7 Mobile hydraulic excavator on tires, 10–14
tons 160 6 960 1.8 Watertight truck capacity 7m3 80 5 400 1.9 Watertight truck capacity 25m3 150 5 750 1.1 Low Bed Truck, loading capacity 15 tons 130 1 130
1.11 Low Bed Trailer, loading capacity 30 tons 170 1 170 1.12 Mobile Cantina with toilet and washing
facilities 8 3 24 1.13 Mobile Workshop in 20-foot container 40 1 40 1.14 Vandalism proof gasoline tank with pump 5 4 20
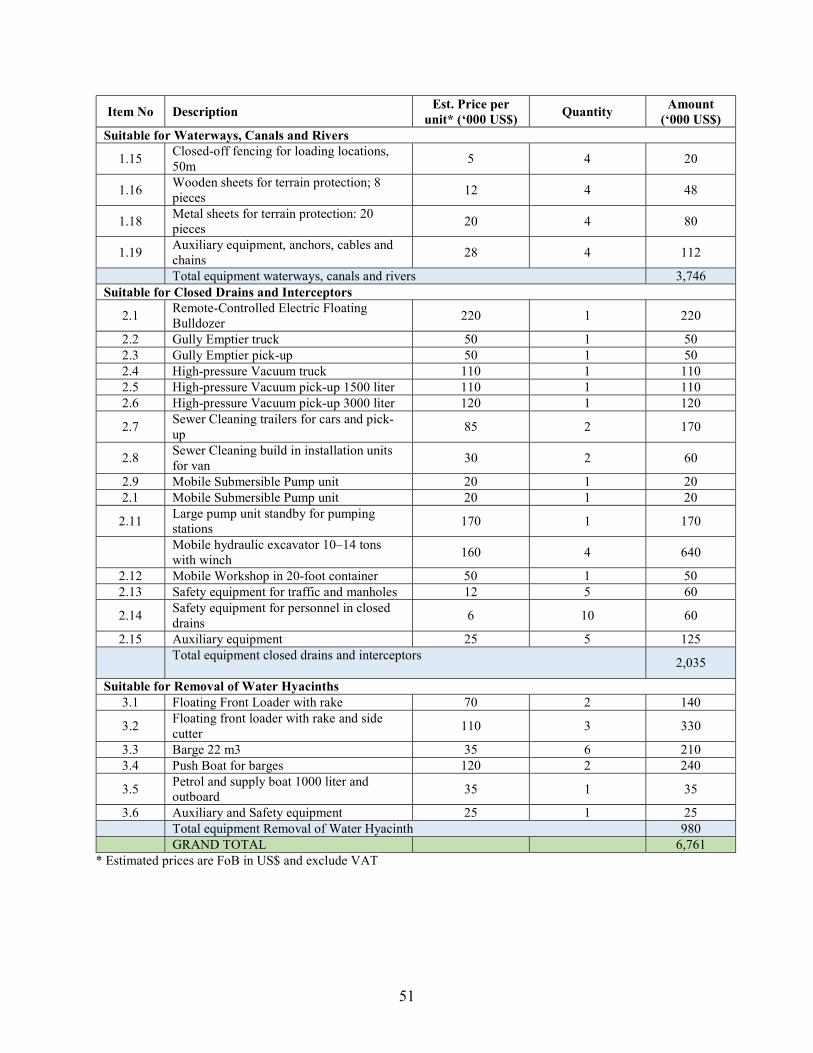
51
Item No Description Est. Price per unit* (‘000 US$) Quantity Amount
(‘000 US$) Suitable for Waterways, Canals and Rivers
1.15 Closed-off fencing for loading locations, 50m 5 4 20
1.16 Wooden sheets for terrain protection; 8 pieces 12 4 48
1.18 Metal sheets for terrain protection: 20 pieces 20 4 80
1.19 Auxiliary equipment, anchors, cables and chains 28 4 112
Total equipment waterways, canals and rivers 3,746 Suitable for Closed Drains and Interceptors
2.1 Remote-Controlled Electric Floating Bulldozer 220 1 220
2.2 Gully Emptier truck 50 1 50 2.3 Gully Emptier pick-up 50 1 50 2.4 High-pressure Vacuum truck 110 1 110 2.5 High-pressure Vacuum pick-up 1500 liter 110 1 110 2.6 High-pressure Vacuum pick-up 3000 liter 120 1 120 2.7 Sewer Cleaning trailers for cars and pick-
up 85 2 170 2.8 Sewer Cleaning build in installation units
for van 30 2 60 2.9 Mobile Submersible Pump unit 20 1 20 2.1 Mobile Submersible Pump unit 20 1 20
2.11 Large pump unit standby for pumping stations 170 1 170
Mobile hydraulic excavator 10–14 tons with winch 160 4 640
2.12 Mobile Workshop in 20-foot container 50 1 50 2.13 Safety equipment for traffic and manholes 12 5 60 2.14 Safety equipment for personnel in closed
drains 6 10 60 2.15 Auxiliary equipment 25 5 125
Total equipment closed drains and interceptors 2,035
Suitable for Removal of Water Hyacinths 3.1 Floating Front Loader with rake 70 2 140 3.2 Floating front loader with rake and side
cutter 110 3 330 3.3 Barge 22 m3 35 6 210 3.4 Push Boat for barges 120 2 240 3.5 Petrol and supply boat 1000 liter and
outboard 35 1 35 3.6 Auxiliary and Safety equipment 25 1 25
Total equipment Removal of Water Hyacinth 980 GRAND TOTAL 6,761
* Estimated prices are FoB in US$ and exclude VAT

52
Annex 3: Economic and Financial Analysis PHILIPPINES: Metro Manila Flood Management Project1
Development context 1. The Philippines’ geographical location makes it vulnerable to typhoons and other natural hazards. An average of 20 typhoons a year enters the Philippine area of responsibility and about half make landfall. With climate change, these typhoons are expected to increase in number and intensity. Metro Manila (MM) is located in a typhoon belt. It is therefore frequented by typhoons and monsoon rains and this has resulted in physical destruction, loss of lives, and significant losses to the economy. The most devastating typhoon that hit MM in recent history was typhoon Ondoy in 2009 (internationally known as Ketsana) which submerged much of MM incurring damages and losses amounting to 2.7 percent of the country’s GDP in 2009 including that of central Luzon. MM contributes to a third of the country’s GDP. Further, MM’s hydrology lends itself to flooding and this is exacerbated by the combined effects of population growth including rapid urbanization and poor infrastructure. After typhoon Ondoy, a MM Flood Management Master Plan was prepared with World Bank assistance and approved by government in 2012. The Master Plan aims to reduce vulnerability to and to strengthen resilience against floods. It includes priority structural and non-structural measures over a 25-year period with total estimated cost of Php350 billion (or US$8 billion). This Project is the first major phase of the implementation of the Master Plan and is intended to reduce risks from flooding caused by regular rainfall events including from river/lake overflow, and tidal movements from Manila Bay particularly in the most vulnerable areas of MM where many poor, marginalized families reside. The Project 2. The PDO will be achieved through (a) modernization of existing pumping stations, increasing the number of these stations, and improving drainage systems; (b) addressing solid waste management to improve efficiency of pumps and the drainage systems; and (c) addressing resettlement of ISFs living in the vicinity of the pumping stations in an integrated approach. ISFs are a major contributor of solid wastes dumped into the waterways and are an obstruction to the flow of these waterways. The Project will be implemented following a programmatic approach; while target drainage areas have been identified, these will be subject to a set of technical, economic, social and environmental criteria, and subsequently prioritized based on readiness for implementation. Existing pumping stations for rehabilitation were selected by MMDA based on the age of the equipment, some of which were installed some 30 years ago, thus many have been not been operating efficiently. Priority will be given to those areas with the highest number of complaints on flooding received from residents and commercial establishments. The MMDA list was further vetted by concerned LGUs and revised accordingly to reflect issues on the ground, including enhancing synergy with other flood-related investments funded by both local and national government agencies with the objective of maximizing impact. New pumping stations identified by MMDA and DPWH are based on frequency flooding brought about by urbanization. 1 Source: World Bank’s Project Appraisal Document.
53
The Project area is about 12,000 hectares with a population of almost 3.5 million, of which least 50 percent is estimated to be directly affected. Methodology 3. Cost-benefit analysis was applied with costs and benefits defined based on ‘with’ and ‘without project’ scenarios. Detailed design of Project interventions will be site-specific and will consider best practices globally, where appropriate, as well as build on existing good practices of local governments. The ERR was estimated for the entire Project. Economic viability is measured by a positive NPV, a benefit cost ratio of more than one, and an ERR higher than the discount rate of 15 percent. Benefits 4. Benefits from this Project include avoided or reduced flood damages, avoided losses in business income and from disruption of commercial activities, avoided productivity loss due to traffic interruption and inaccessibility of roads during floods, avoided opportunity loss for school age children from disruption in schools and for the public from interrupted access to public services, increases in amenity, and avoided health costs. At the household level, avoided costs are those due to increases in food prices and transportation costs during and in the immediate aftermath of floods. Due to data constraints, not all benefits could be monetized. The benefits monetized include avoided flood damages and avoided productivity loss. 5. Reduced flood damages. Flood damages were estimated using data from the study Enhancing Risk Analysis Capacities for Flood, Tropical Cyclone Severe Wind and Earthquake for Greater Metro Manila Area, a project of government led by the agencies comprising the Collective Strengthening on Community Awareness on National Disasters (CSCAND)2, assisted by AusAid and completed in 2014. In particular, flood damage estimates were based on the Flood Risk Analysis of the Pasig-Marikina River Basin prepared by PAGASA and completed in mid-2015. While available data refer to damages caused by river overflow, data of LGUs with at least 80 percent coverage in the hydrologic model were used as proxy for damages arising from urban flooding inasmuch as the same area is expected to be flooded.3 Flood damages estimated under the above-mentioned study considered replacement cost of damaged structural components and finishes, fixtures and fixed equipment, but excluded contents. For this analysis, damage from urban flooding cover the costs of minor repairs on house structures, household appliances and vehicles, plus the cost of cleaning up after each flood event. This was assumed to be 5 percent of the estimated average cost (damage) per square meter of floor area under the abovementioned CSCAND project4. The affected area was estimated using NAMRIA maps where 80 percent was assumed to be built up. Again, the estimate on directly affected population was based on NAMRIA maps and adjusted to 2015 data based on 2 percent annual growth rate. Estimated annual damages 2 The government agencies comprising CSCAND include Office of Civil Defense (OCD) as chair, NAMRIA and MGB under DENR, PHILVOLCS and PAGASA under DOST, as members. The Technical Working Group on Flood Risk Modelling is composed of PAGASA as chair, and members including MGB, DPWH, MMDA and LLDA. 3 The LGUs are Manila with 90.5 percent of area covered by the hydrologic modelling, Pasig, 93.7 percent and San Juan, 86.1 percent. 4 Estimated damages under the CSCAND project is based on full replacement cost of damaged structures.
54
used under the CSCAND project are for a 10-year return period of rainfall. The value of damages was assumed to grow by 2 percent a year in real terms as flood damages in a non-project scenario are expected to increase in the future. Conservatively, it was assumed that the Project overall would reduce flood damages by 50 percent of total estimated damages.5 6. Avoided productivity loss. Benefits from avoided productivity loss were estimated using as proxy GNI per capita multiplied by 5 days or 120 hours during which economic activities are expected to be disrupted due to traffic interruption and inaccessibility of roads. This was then multiplied by the population affected by the Project and broken down by age group using the age profile of the population of Metro Manila. The impact by age group was assumed to be 0, 100, and 40 percent for ages 0 – 14 years, 15 – 64 years, and 65 years and older, respectively. Population growth in Metro Manila is assumed at 2 percent annually. 7. Other benefits. Other benefits of the Project include the following: improved well-being from better housing and environmental amenities, and positive health
impacts particularly for the affected ISFs that will be relocated under the Project; greater knowledge on designs applying ‘green technology’ such as adopting green infrastructure in retention facilities (e.g., green roofs), rooftop wastewater collection, permeable pavements, retention of drainage water in public areas like basketball courts, parking garages, etc., waste conversion technologies, among others, to be piloted and demonstrated under the Project; greater knowledge on (i) good practices in community-based solid waste management focusing on minimizing dumping of solid waste in waterways particularly in communities with narrow road access that cannot be reached by garbage trucks, estimated at 20 percent of uncollected solid wastes, (ii) incentive based approaches to solid waste management, (iii) targeted IEC, and (iv) mechanisms and institutional arrangements in recycling of residual solid wastes; lessons learned from institutional arrangements supporting in-city relocation of ISFs; accelerated improvement of water quality of Manila Bay through institutional strengthening and capacity building; and capacity building of DPWH, MMDA, LGUs, NHA and SHFC as implementer of projects funded by international financial institutions.
Costs 8. Project costs include capital and operation and maintenance costs for each component. Taxes and duties were assumed to be 12 percent of the financial costs and were deducted to reflect the economic cost.
5 This is based on an 80:20 foreign to local financing ratio and US$8 billion investment program under the MM Flood Control Master Plan.

55
Results 9. Using conservative assumptions, the base case scenario with avoided flood damages as a benefit shows positive results, with an ERR of 34.3 percent, a positive NPV of PhP 12.6 billion using a social discount rate of 15 percent, and a benefit-cost ratio of 1.9. Considering the additional benefit of avoided productivity loss increases the ERR to 44 percent (see Table 1 below).
Table 1. Economic viability results Net present
value (PhP billion)
Benefit cost ratio
Economic internal rate of return (%)
Base case – only includes Avoided Flood Damages as benefit
12.598 1.9 34.3 Includes Avoided Flood Damages and Avoided Productivity Loss as benefits
19.996 2.5 44.0 Sensitivity analysis 10. Sensitivity analysis was applied on the base case to determine impact of changes of certain variables on the economic viability of the Project. The scenarios included: (a) reducing benefits by 20 percent, (b) increasing costs by 20 percent, and (c) combination of the two scenarios. The Project remains to viable under all scenarios.
Table 2. Sensitivity analysis Net present value
(PhP billion) Benefit cost ratio
Economic internal rate of return (%)
Scenario 1: Reduction of benefits by 20%
7.398 1.6 26.3 Scenario 2: Increase in costs by 20%
9.917 1.6 27.6 Scenario 3: Combination of scenarios 1 and 2 above
4.716 1.3 21.0 11. Beyond the avoidance of economic losses due to flooding, the ultimate economic impact of the Project is the unquantified effect of improving living and business environments in the areas under the Project. For the local economy, improvement in local businesses will bring in higher revenues due to a decrease in income losses from damages caused by flooding and the closure of business operations during flood events. Also, more businesses will mean more tax revenues for local governments and more employment opportunities for their constituents. Impact on the poor 12. The impact on the poor particularly on the affected ISFs is the opportunity to have better and affordable housing, and environmental amenities, as well as the positive health impacts resulting from cleaner environments and better housing. This is in addition to the benefits of reduced expenses from flood damages and productivity losses.

56
13. On employment creation and income generation, during Project implementation, it is expected that much of the skilled and unskilled labor required by the Project, e.g., civil works, dredging, cleaning of waterways, collection of solid wastes, will be sourced from the local communities surrounding the Project areas. This will generate employment opportunities as well as downstream economic activities e.g., provision of transportation to and from Project sites, lodging of transient workers, food and other domestic services. During operation, skilled labor will be needed to operate and manage the pumping stations, and implement solid waste programs. Similarly, this will create economic opportunities that will generate income for communities close to the Project areas. The Project will also support those currently employed living in the vicinity of the Project areas, otherwise affected by the lack of accessibility during floods. These flood prone areas are densely populated, mostly low to medium income communities where majority of households are involved in the informal economy with low-paying jobs. The Project will help sustain their employment and therefor their income even during the rainy season as well as minimize interruptions in economic activities with a strong possibility of increasing productivity from improved physical conditions. Notes and assumptions used (i) Social discount rate used was 15 percent.6
(ii) Tax is 12 percent of financial costs. (iii) Shadow rate for foreign exchange is 1.2.7 (iv) Shadow rate for unskilled labor is 0.60.8 (v) Per square meter cost of flood damage was assumed to be PhP 10,947 (2011 prices)
based on average cost of Manila, Pasig, and San Juan cities under the Flood Risk Analysis prepared by PAGASA in 2015. To be conservative, the same cost was used for 2016 and adjusted by 2 percent annually to reflect increasing future real costs. Only five percent of this cost was used to account for costs of cleaning up and minor repairs in house structures, household appliances and vehicles.
(vi) Gross national income in 2014 is PhP 86,510 per capita, 2000 prices (source National Statistics Authority) using an annual growth rate of 3.5 percent based on the average growth rate for the period 2008 to 2014.
(vii) Real increase in prices was assumed at 2 percent annually. (viii) Population by age group for the NCR (2010 data) is 29, 68, and 3 percent for ages 0-
14 years, 15-64 years, and 65 years and older, respectively. Source: National Statistics Office.
(ix) Average annual population growth of NCR for the period 1990 to 2010 is 2.02 percent. Source: National Statistics Office.
(x) Impact of flooded days by age group was assumed to be 0, 100, and 40 percent for ages 0-14 years, 15-64 years, and 65 years and older, respectively.
(xi) Annual O&M costs of components 1 and 2 were assumed to be 1 percent and 7 percent of investment costs, respectively.
6 Government project evaluation guidelines. 7 Government project evaluation guidelines. 8 Government project evaluation guidelines.

57
Annex 4. Sovereign Credit Fact Sheet- Philippines A. Recent Economic Development Philippines is lower-middle-income country. The country registered an average 6.2 percent from 2010-2015, significantly higher than the average annual growth of 4.5 percent in 2000-2009. The rate of economic growth rose to 6.8 percent in 2016, driven by robust private consumption, capital formation and expansion in public spending. Although inflation rate increased from 1.4 percent in 2015 to 1.8 percent in 2016 due to rising food prices, the inflation has remained below the Central Bank’s target band of 3.0 ± 1.0 percent for 2017 – 2018. However, the external sector remained weak in 2016. The exchange rate of the Peso against the dollar depreciated to its 10-year low last year, reflecting the prospects of U.S. rate hike. Nevertheless, the Peso gained some strength in 2017. The current account surplus fell sharply in 2016 due to trade deficit. Annual import growth accelerated to 3.5 percent in 2016 supported by increased investment and household income, while annual exports only grew by 0.1 percent due to weak recovery of the global economy and decreased demand of trading partners. B. Economic Indicators
Selected Macroeconomic Economic indicators (2015-2019)
Economic Indicators 2015 2016 2017* 2018* 2019* National income and prices (change %) Real GDP 5.9 6.8 6.9 6.9 6.8 CPI inflation (change %, annual average) 1.4 1.8 3.3 3.0 2.8 Central government operations (% of GDP) National government balance -0.9 -2.4 -3.0 -3.3 -3.5 External debt (% of GDP) 26.5 24.6 24.1 23.7 23.4 National government debt (% of GDP) 44.8 42.1 40.4 39.2 38.5 Money and credit Broad Money Liabilities (% change, end of period)
9.4 12.4 Foreign direct investment (US$ billion) 5.7 7.9 8.1 8.7 9.7 Reserves (US$ billions) 80.7 81.1 82.4 83.8 85.3 Current account balance (% of GDP) 2.9 0.2 0.2 0.5 0.7 Exchange rate (Pesos/$, period average) 45.5 49.8
Note: * denotes projected figures. Source: World Bank, Philippines economic update, April 2017. C. Economic Outlook and Risks
Looking ahead, the outlook of the Philippines economy remains favorable despite external headwinds. Real GDP growth is expected at 6.9 percent in 2017-2018, and 6.8 percent in 2019 supported by public infrastructure spending, strong private consumption and expected recovery of trading partners. External downside risks include negative impacts related to rising global interest rates and commodity prices. Domestic downside risk is the government’s ability to implementation of infrastructure investment commitment when it is as a main driver of growth in near-term.
58
On debt outlook, the public debt-to-GDP ratio fell to 42.1 percent of GDP in 2016 as GDP growth outpaced the growth of the debt stock. Debt sustainability has been improving for several years, highlighting the improved fiscal position of the Philippines economy. External debt fell sharply in the 2000s, from a peak of 76.4 percent of GDP in 2001 to 26.5 percent in 2015, due to strong output growth. The external debt is expected to fall further to reach 23.4 percent of GDP in 2019.1
1 World Bank Group, 2017. Philippines Economic Update, April 2017.