board of supervisors yolo county, california
TRANSCRIPT
BOARD OF SUPERVISORS Yolo County, California
To: Fin. Svcs.
CONSENT CALENDAR Excerpt of Minute Order No. 18-67 Item No. 18 , of the Board of Supervisors’ meeting of April 24, 2018.
MOTION: Rexroad. SECOND: Chamberlain. AYES: Saylor, Rexroad, Provenza, Chamberlain, Villegas.
Receive and file the County Treasurer's Investment Report for the quarter ended March 31, 2018. (No general fund impact) (Newens)
Approved recommended action on Consent.
18.
Consent-General Government # 18. Board of Supervisors Financial Services Meeting Date: 04/24/2018Brief Title: Treasurer's Investment Report for Quarter Ended March 31, 2018From: Howard Newens, Chief Financial Officer, Department of Financial
Services
Staff Contact: Edward Burnham, Accounting Manager, Department of FinancialServices, x8212
SubjectReceive and file the County Treasurer's Investment Report for the quarter ended March31, 2018. (No general fund impact) (Newens)
Recommended ActionReceive and file the Yolo County Treasurer's Report on Investments for the quarterended March 31, 2018.
Strategic Plan Goal(s)Operational Excellence
Reason for Recommended Action/BackgroundINVESTMENT PORTFOLIO
The county treasury investment portfolio is summarized in Att. A. Investment Summary and includes the Treasurer's Investment Pool and the investment accounts managed bythe Treasury that are not pooled together for investment returns. The pooled portfolioincludes county funds, deposits from special districts, and school districts totaling $450million as of March 31, 2018. The portfolio consisted of 5.6% ($25 million) in cash atbank; 37.7% ($170 million) in short term investments in government investment poolssuch as the Local Agency Investment Fund (LAIF) and the California Asset ManagementProgram (CAMP); 56.7% ($255 million) in an investment pool that is actively managed bya professional investment advisor, PFM Asset Management, LLP (PFM). Theseinvestments consist mostly of fixed income securities as authorized by government code,such as U.S. Treasuries; securities issued by federal agencies such as FNMA (FannieMae), FHLMC (Freddie Mac) and Federal Home Loan Bank; corporate notes;commercial papers; and certificates of deposit. The detail of investments in the Pooled

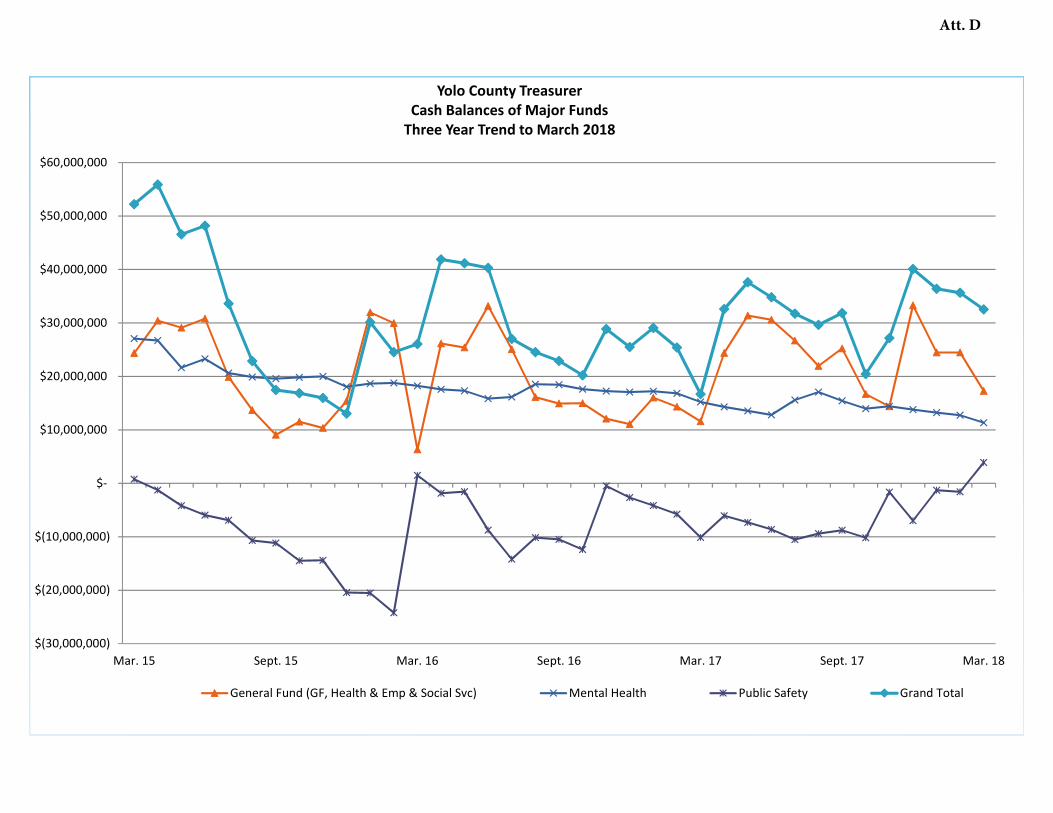
Portfolio is shown in Att. B. PFM Performance Report and the Nonpooled investmentholdings are shown in Att. C. Nonpooled Holdings. In their quarterly investment reviewfor the 1st quarter of calendar year 2018 (Att. B. PFM Investment PerformanceReport), PFM noted that economic themes carried over into 2018 still remain: healthyjob production, consistent GDP growth, positive corporate guidance, and heightenedconsumer confidence. With municipal market issuance down significantly year-to-date,opportunities to add to the sector remain limited. The short-term credit curve (under oneyear) steepened noticeably heading into the March Fed meeting and remained elevatedthrough quarter-end. CASH BALANCES The chart (Att. D. Cash Balances) depicts the cash balances of the three majoroperation funds of the County, and their combined balance. On March 31, 2018, thisunaudited balance was $32.5 million; decreased ($7.8) million from the prior quarter dueto normal operating revenues and expenditures. CERTIFICATION The Yolo County investment pool is in compliance with the Yolo County InvestmentPolicy. Our analysis indicates that the investment holdings in the Yolo CountyInvestment Pool are of proper amount and duration to meet the estimated cash flowrequirements of the County and all pool participants for the next six months, barringsubstantial cash payment deferrals from the State government or other unforeseen cashneeds.
Collaborations (including Board advisory groups and external partner agencies)Other agencies having deposits in the pool include: school districts, special districts, andcities. A copy of the report is posted and available on the Department of FinancialServices' website. The Board of Supervisors Investment Committee reviews theinvestment activity and strategy monthly; the Financial Oversight Committee reviewsinvestment performance quarterly. All reports from the County's investment advisor PFMAsset Management LLC are available in the County Treasurer's office.
Competitive Bid ProcessN/A
Fiscal InformationNo Fiscal Impact
Fiscal Impact of this ExpenditureTotal cost of recommended actionAmount budgeted for expenditureAdditional expenditure authority needed $0

On-going commitment (annual cost)
Source of Funds for this ExpenditureGeneral Fund
AttachmentsAtt. A. Investment Summary Att. B. PFM Performance ReportAtt. C. Nonpooled HoldingsAtt. D. Cash Balances
Form ReviewInbox Reviewed By DateHoward Newens Howard Newens 04/17/2018 08:32 PMFinancial Services Tom Haynes 04/18/2018 11:38 AMCounty Counsel Hope Welton 04/18/2018 12:35 PMForm Started By: Edward Burnham Started On: 04/10/2018 04:22 PMFinal Approval Date: 04/18/2018

March 31, 2018 February 28, 2018 January 31, 2018
GOVERNMENT INVESTMENT POOLSLocal Agency Investment Fund (LAIF) Accounts:
County Pooled Account 10,583,585$ 10,583,585$ 10,583,585$ Total Held in LAIF 10,583,585 10,583,585 10,583,585
California Asset Management Program (CAMP):County Pooled Account 159,261,923 114,225,337 134,591,244
Total Held in CAMP 159,261,923 114,225,337 134,591,244
Total Government Investment Pools 169,845,508 124,808,923 145,174,829
INVESTMENTS MANAGED BY PFM (NOTE 2)County Pooled Account at Market Value 254,121,110 255,630,815 257,749,093 Accrued Interest 907,810 1,093,816 1,143,907
Total Managed by PFM 255,028,920 256,724,631 258,893,001
CASH IN BANKSRiver City Bank - County Pool MMA 15,286,690 15,268,395 15,252,533 Bank of America - County Pool Checking Account 9,776,744 18,083,399 1,932,210
Total Cash in Banks 25,063,434 33,351,794 17,184,743
CASH IN TREASURY 82,522 95,026 20,245 Total Pooled Portfolio 450,020,384$ 414,980,373$ 421,272,818$
NOTES:
1
2
COUNTY OF YOLOTreasury Pooled Portfolio
Investment SummaryFor the Three Months Ended March 31, 2017
Market values are determined by PFM Asset Management LLC (PFM), and are not materially different from those reported by Bank of New York Mellon, the third party custodian of county investments.
The interest apportioned on an amortized cost basis for the quarter net of Treasury fees ended December 31, 2017 was an quarterly rate of 0.3155% which is an annualized rate of 1.2620%. The interest apportionment for the quarter ended March 31, 2018 will be completed and distributed in April 2018.
Att. A

March 31, 2018 February 28, 2018 January 31, 2018
GOVERNMENT INVESTMENT POOLSLocal Agency Investment Fund (LAIF) Accounts:
5,193,540$ 5,193,540$ 5,593,540$
7,191,815 7,191,815 3,791,815 Washington JUSD - Scholarship 40,932 40,932 40,932 Davis JUSD CFD #1 30,995 30,995 30,995 Davis JUSD CFD #2 2,718,699 2,718,699 2,718,699
Total Held in LAIF 15,175,981 15,175,981 12,175,981 California Asset Management Program (CAMP):
Willowbank Water 92,794 92,666 92,560 Total Held in CAMP 92,794 92,666 92,560
Total Government Investment Pools 15,268,775 15,268,647 12,268,541
INVESTMENTS MANAGED BY PFM (NOTE 1)Landfill Closure Trust Fund 17,003,439 16,950,385 17,036,906 Cache Creek 1,671,787 1,670,339 1,674,709 Demeter Fund 2,721,067 2,733,778 2,751,987 Ceres Endowment Account (NOTE 3) 8,670,529 8,683,551 8,877,746 2017A Lease Revenue Bonds 16,532,694 16,509,920 16,490,915
Reported by PFM at Market Value 46,599,516 46,547,973 46,832,262 Accrued Interest - Landfill Closure Trust Fund 84,131 71,116 49,343 Accrued Interest - Cache Creek 3,322 4,036 10,345 Accrued Interest - Demeter Fund 11,749 11,635 9,116 Accrued Interest - Ceres Endowment Account (NOTE 3) 47,743 35,722 41,701 Accrued Interest - 2017A Lease Revenue Bonds 22,774 19,006 20,959
Total Managed by PFM 46,769,236 46,689,488 46,963,725
INVESTMENTS MANAGED BY PARS (NOTE 2)PARS OPEB TRUST Account 10,469,901 10,586,305 10,859,376
Total Managed by PARS 10,469,901 10,586,305 10,859,376
CASH IN BANKSBank of New York Mellon - Demeter MMA 875,626 856,233 844,524
Total Cash in Banks 875,626 856,233 844,524
Total Non-Pooled Portfolio 73,383,538$ 73,400,673$ 70,936,166$
NOTES:
1
2
For the Three Months Ended March 31, 2017
Yolo County Public Agency Risk Management Insurance Authority
Sacramento-Yolo Mosquito & Vector Control District
Market values are determined by PFM Asset Management LLC (PFM), and are not materially different from those reported by Bank of New York Mellon, the third party custodian of county investments.
Market values are determined by Public Agency Retireement Services (PARS), and are not materially different from those reported by US BANK, the third party custodian of county investments.
Investment Summary
COUNTY OF YOLONon-Pooled Portfolio

3 In July 2002, the Board of Supervisors approved the investment of proceeds from the securitization of Tobacco Settlement Receipts in a Capital account and an Endowment Account. The Capital Account was used to finance part of the cost of the Bauer Building and the cost of the Energy Conservation Project and has been closed. The Endowment Account (shown above) is in the custody of a trustee and generates semi-annual deallocations that fund the Pomona Fund and are appropriated annually.
In April 2006, Yolo County received $9,139,612 from participation in the sale of Series 2006 Tobacco Securitization Program. These funds are earmarked for capital projects in accordance with bond documents. In August 2009 the Board approved the purchase of the Bauer Building using $9.7 million of the 2006 Capital Account funds. This account has been closed.
The Cares endowment has approximately $4M in money market securities that will be reinvested invested in longer duration securities in accordance with bond documents and as authorized by the Yolo County Investment Policy.

Investment Performance Review
Client Management Team
Sarah Meacham, Managing Director
Allison Kaune, Senior Managing Consultant
50 California Street, Suite 2300
San Francisco, CA 94111
415-982-5544
PFM Asset Management LLC
One Keystone Plaza, Suite 300
Harrisburg, PA 17101-2044
717-232-2723
For the Quarter Ended March 31, 2018
YOLO COUNTY
Att. B

Market Update

YOLO COUNTY
PFM Asset Management LLC
For the Quarter Ended March 31, 2018
2.27%
0.00%
0.50%
1.00%
1.50%
2.00%
2.50%
3.00%
3.50%
Ma
r '0
8
Ma
r '0
9
Ma
r '1
0
Ma
r '1
1
Ma
r '1
2
Ma
r '1
3
Ma
r '1
4
Ma
r '1
5
Ma
r '1
6
Ma
r '1
7
Ma
r '1
8
2-Year Treasury Yield
Source: Bloomberg, as of 3/31/2018.
Market Update
The 2-year Treasury yield continued to move higher throughout the first quarter of 2018, increasing 38 basis points (0.38%) to 2.27%, levels not seen since 2008.
The first quarter marked the seventh straight quarterly rise in the 2-year yield as the U.S. economy remained strong and the Federal Reserve continued on its path of quantitative tightening, raising the federal funds target rate by 25 basis points to a range of between 1.50% to 1.75% at its March meeting.
Short-Term Treasury Yields Continue to Rise
Average: 0.80%
42-year low: 0.15%
1
YOLO COUNTY
PFM Asset Management LLC
For the Quarter Ended March 31, 2018
Source: Bloomberg, as of 3/31/2018.
Market Update
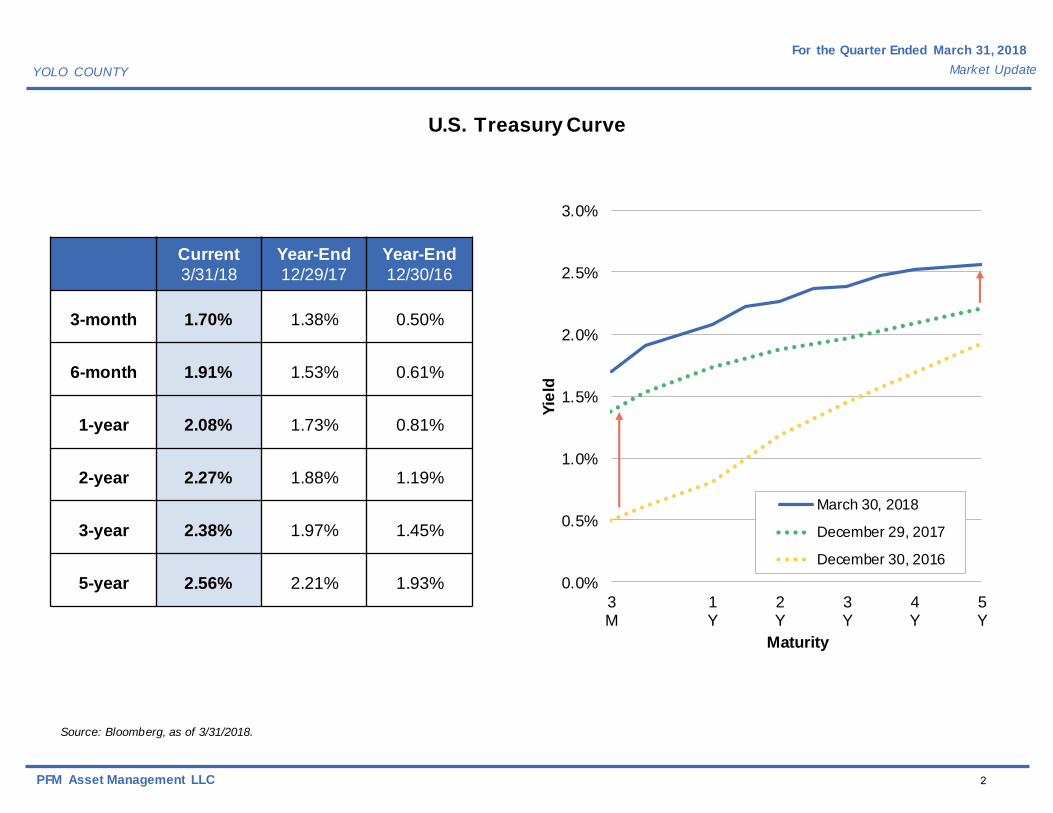
U.S. Treasury Curve
Current3/31/18
Year-End12/29/17
Year-End12/30/16
3-month 1.70% 1.38% 0.50%
6-month 1.91% 1.53% 0.61%
1-year 2.08% 1.73% 0.81%
2-year 2.27% 1.88% 1.19%
3-year 2.38% 1.97% 1.45%
5-year 2.56% 2.21% 1.93% 0.0%
0.5%
1.0%
1.5%
2.0%
2.5%
3.0%
3M
1Y
2Y
3Y
4Y
5Y
Yie
ld
Maturity
March 30, 2018
December 29, 2017
December 30, 2016
2

YOLO COUNTY
PFM Asset Management LLC
For the Quarter Ended March 31, 2018
2.9%
-2%
0%
2%
4%
6%
Q1
Q2
Q3
Q4
Q1
Q2
Q3
Q4
Q1
Q2
Q3
Q4
Q1
Q2
Q3
Q4
Q1
Q2
Q3
Q4
Q1
Q2
Q3
Q4
2013 2014 2015 2016 2017 2018
U.S. Real GDPQoQ, SAAR
Market Update
U.S. gross domestic product (GDP) grew at an annualized rate of 2.9% in the fourth quarter of 2017. Despite slowing slightly from more than 3% growth in both the second quarter and third quarters, the overall pace of economic activity remained solid as the economy grew at an average of 2.6% on a quarterly basis (annualized), the fastest pace since 2014.
Strong growth in consumer spending and business investment continued to fuel economic activity over the quarter, while significant declines in inventories and net exports were a drag on reported GDP in the fourth quarter.
Moderate U.S. Economic Expansion
Bloomberg Survey of
Economists
Source: Bloomberg, as of 3/31/2018.
Annual Average:2.7% 2.7% 2.6%
1.9%2.0%
3
YOLO COUNTY
PFM Asset Management LLC
For the Quarter Ended March 31, 2018
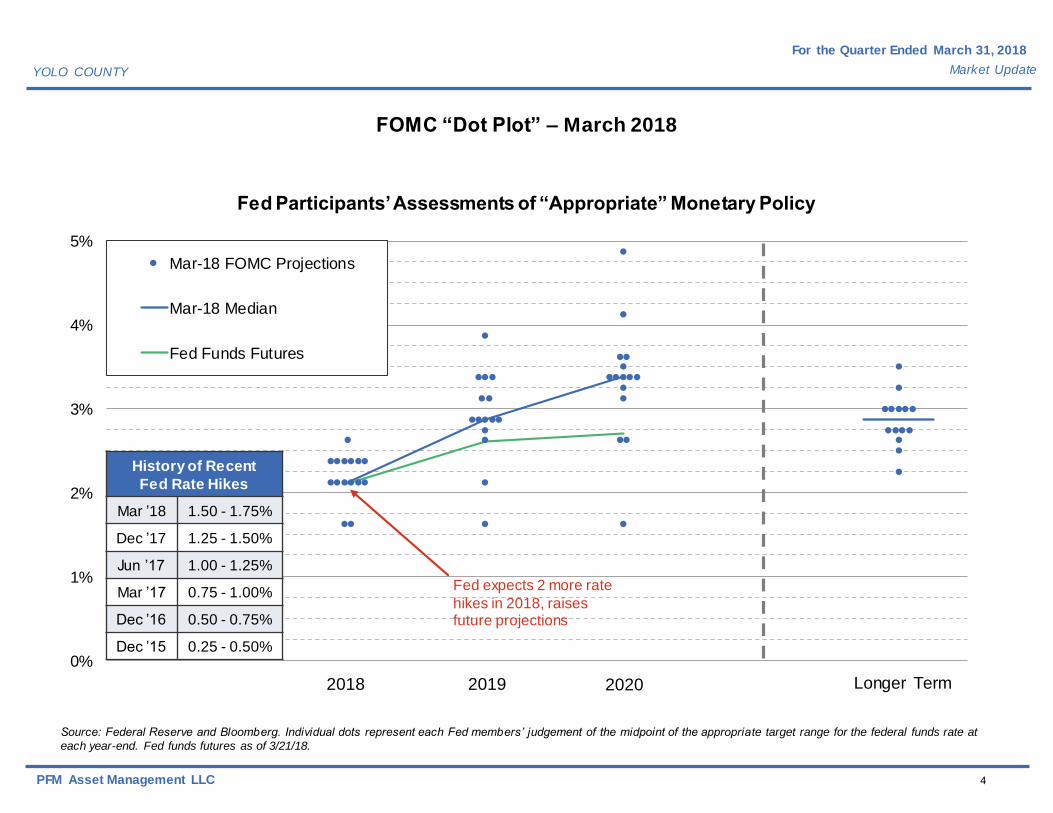
Source: Federal Reserve and Bloomberg. Individual dots represent each Fed members’ judgement of the midpoint of the appropriate target range for the federal funds rate at
each year-end. Fed funds futures as of 3/21/18.
Market Update
FOMC “Dot Plot” – March 2018
0%
1%
2%
3%
4%
5%
Fed Participants’ Assessments of “Appropriate” Monetary Policy
Mar-18 FOMC Projections
Mar-18 Median
Fed Funds Futures
Fed expects 2 more rate hikes in 2018, raises future projections
History of RecentFed Rate Hikes
Mar ’18 1.50 - 1.75%
Dec ’17 1.25 - 1.50%
Jun ’17 1.00 - 1.25%
Mar ’17 0.75 - 1.00%
Dec ’16 0.50 - 0.75%
Dec ’15 0.25 - 0.50%
2018 2019 2020 Longer Term
4

Investment Performance Review

YOLO COUNTY
PFM Asset Management LLC
For the Quarter Ended March 31, 2018
Portfolio Review
The laundry list of positive economic data is long and remains a key driver of economic growth, consumer confidence, and business optimism.
• GDP posted an upward revision to fourth quarter GDP to 2.9%.
• Estimates for 2018 GDP call for growth in the range of 2.7% to 2.8%.
• Jobs growth continued to be strong, averaging over 200,000 per month in the first quarter.
• The unemployment rate remained at 4.1% -- a 17-year low.
• Productivity hit a 2-year high.
• Manufacturing reached a 3-year high.
• Consumer confidence rebounded after a dampened fourth quarter and now sits at a 14-year high.
• Inflation, while below the Fed’s target of 2%, inched higher by most measures.
New Fed Chair Jay Powell made his first public address at February’s semi-annual monetary policy report to Congress. His maiden testimony generally hinted at a continuance of gradual rate hikes, along with an acknowledgement that “the economic outlook remains strong” and an expectation for inflation to move up and more closely approach the FOMC’s 2% objective.
The Fed remained true to its stated course, raising short-term rates by ¼ percent in March, and interest rates continued their ascent over the quarter. As a result, we strategically positioned the portfolio with a defensive duration bias relative to the benchmark to help insulate market values in the well-choreographed interest rate environment. But, with rates at or near multi-year highs, there were also opportunities to capture higher yields selectively in some parts of the yield curve.
Portfolio Recap
6

YOLO COUNTY
PFM Asset Management LLC
For the Quarter Ended March 31, 2018
Portfolio Review
The combined effects of less predictable U.S. politics and policy (e.g., tariffs, trade wars, Facebook, global relations, budget deficits, etc.) created an environment of heightened volatility. The “risk off” sentiment triggered wider credit spreads.
• Wider spreads caused corporate-related investments to underperform for the quarter. While the portfolio typically benefits from increased credit allocations, returns in the first quarter were negatively affected.
• Federal agency yield spreads remained very narrow throughout the quarter. New issue agencies continued to be our preferred – insome cases only -- outlet to add agencies at relatively attractive yields. Generally, the agency sector added modest positive excess returns in the first quarter (returns in excess of similar duration Treasuries) across much of the yield curve, benefitting portfolio performance.
• Supranational seasonal supply increased as expected in the quarter and we utilized the opportunity to increase allocations in the sector at attractive yield spreads. This incremental income helped boost returns in the sector.
• After yield spreads in the corporate sector reached another new post-recession low in January, we shifted our generally constructive view of the corporate sector to a slightly more defensive posture by holding current positions (and letting them drift shorter over time) rather than adding to allocations. In the latter half of the quarter, the story shifted abruptly as market volatility pushed credit spreads markedly wider through quarter-end. As a result, we began to add corporate exposure (including negotiable CDs) again.
• Asset-backed securities (ABS) were also impacted by adverse spread widening during the quarter, but prompted no change in our fundamental view of the sector.
Portfolio Recap Continued
7

YOLO COUNTY
PFM Asset Management LLC
For the Quarter Ended March 31, 2018
Portfolio Review
The economic themes that carried over into 2018 remain: healthy job production, consistent GDP growth, positive corporate guidance, and heightened consumer confidence. However, where complacency had characterized the global markets quarter after quarter, volatility roared back in the first quarter. While rising volatility increases some market risks, it can also create investment opportunities.
Our outlook for each of the major investment-grade fixed-income sectors are as follows:
• In the corporate sector, our view is that recent yield spread widening represents a modest normalization of spreads off of post-recession lows, as opposed to a weakening in fundamentals. As such, wider spreads present an opportunity to selectively add toallocations. While corporate fundamentals remain healthy and the outlook for the sector is still positive, careful issuer due diligencewill drive selection. In particular, we are closely watching the supply/demand impacts of corporate profit repatriation (prompted bythe December 2017 tax cuts), and signs of excessive balance sheet leverage in companies in certain industries.
• Negotiable CDs and asset-backed securities remain attractively-priced credit sectors and we will continue to source new exposure.
• Federal agency securities remain expensive, as spreads are in the low single digits across the much of the yield curve; however, byquarter-end, specific agency maturities (2- and 5-year) cheapened modestly, representing an opportunity to potentially increaseallocations.
• The expected spike in supranational issuance is approaching its seasonal slowdown. Over the next few months, this supplydynamic may nudge spreads temporarily wider and offer additional investment opportunities. Our current strategy calls forcontinuing to add to allocations of supranationals as an attractive alternative to Treasuries and agencies.
• With municipal market issuance down significantly year-to-date, opportunities to add to the sector remain limited. However,municipals provide positive diversification prospects and we will continue to seek out attractive issues in both the secondary andnew issue markets.
• The increasing pace of Fed balance sheet run-off in the MBS sector, coupled with an anticipated increase in seasonal supply,warrants a cautious approach to the sector.
• The short-term credit curve (under one year) steepened noticeably heading into the March Fed meeting and remained elevatedthrough quarter-end. With 6-month prime commercial paper and negotiable certificates of deposit spreads at 50 to 60 basis pointsover comparable Treasury securities, the sector appears very attractive and compensates investors for at least two more fed ratehikes in 2018.
Investment Strategy Outlook
8

YOLO COUNTY
For the Quarter Ended March 31, 2018
Fixed Income Management
The portfolio is in compliance with Yolo County’s Investment Policy and the California Government Code.
PFM Asset Management LLC
Details may not add to total due to rounding.
Security TypeMarket Value as of 3/31/18
% of Portfolio
% Change vs. 12/31/17
Permitted by Policy
In Compliance
U.S. Treasury $37,569,014 8.6% +1.5% 100%
Federal Agency $29,054,300 6.6% -0.6% 100%
Federal Agency CMOs $6,536,737 1.5% -0.3% 100%
Supranationals $26,733,469 6.1% +1.9% 30%
Negotiable CDs $56,573,526 12.9% +2.6% 30%
Corporate Notes $64,363,397 14.7% +0.9% 30%
Commercial Paper $10,247,966 2.3% +0.4% 40%
Asset-Backed Securities $23,042,702 5.2% +0.4% 20%
Securities Sub-Total $254,121,110 57.9%
Accrued Interest $907,810
Securities Total $255,028,920
CAMP $159,261,923 36.3% -8.1% 100%
LAIF - Total $25,759,566 5.9% +1.4% $65 millon per account
Total Investments $440,050,409 100.0%
9

YOLO COUNTY
For the Quarter Ended March 31, 2018
Portfolio Snapshot
Portfolio Statistics
As of March 31, 2018
$257,776,061
$255,028,920
$254,121,110
$907,810
-
Accrued Interest:
Cash:
Par Value:
Total Market Value:
Security Market Value:
$257,945,199
2.47%
1.84%
AAAverage Credit: *
Yield at Cost:
Amortized Cost:
Yield at Market:
Effective Duration: 2.02 Years
Duration to Worst: 2.10 Years
Average Maturity: 2.30 Years
Credit Quality (S&P Ratings)
8.6%
A
6.1%
A-
10.5%
A+
8.8%
A-1
2.5%
A-1+
1.0%
AA
9.0%
AA-
31.8%
AA+
15.8%
AAA
2.0%
BBB+***3.8%
Not Rated**
0%
5%
10%
15%
20%
25%
30%
35%
0 - 1 Year 1 - 2 Years 2 - 3 Years 3 - 4 Years 4 - 5 Years > 5 Years
15.7%
31.5%
20.3% 20.9%
11.6%
0.0%
Maturity Distribution
Sector Allocation
9.1%
Asset-Backed
22.3%
Certificate
of Deposit
4.0%
Commercial
Paper
25.3%
Corporate
2.6%
Federal
Agency/CMO
11.4%
Federal
Agency/GSE
10.5%
Supra-Sov /
Supra-Natl
Agency
14.8%
U.S.
Treasury
PFM Asset Management LLC
*An average of each security’s credit rating assigned a numeric value and adjusted for its relative weighting in the portfolio.**The "Not Rated" category comprises asset-backed securities rated Aaa by Moody's. ***The "BBB+" category comprises securities rated A or better by Moody's and/or Fitch.
10
YOLO COUNTY
For the Quarter Ended March 31, 2018
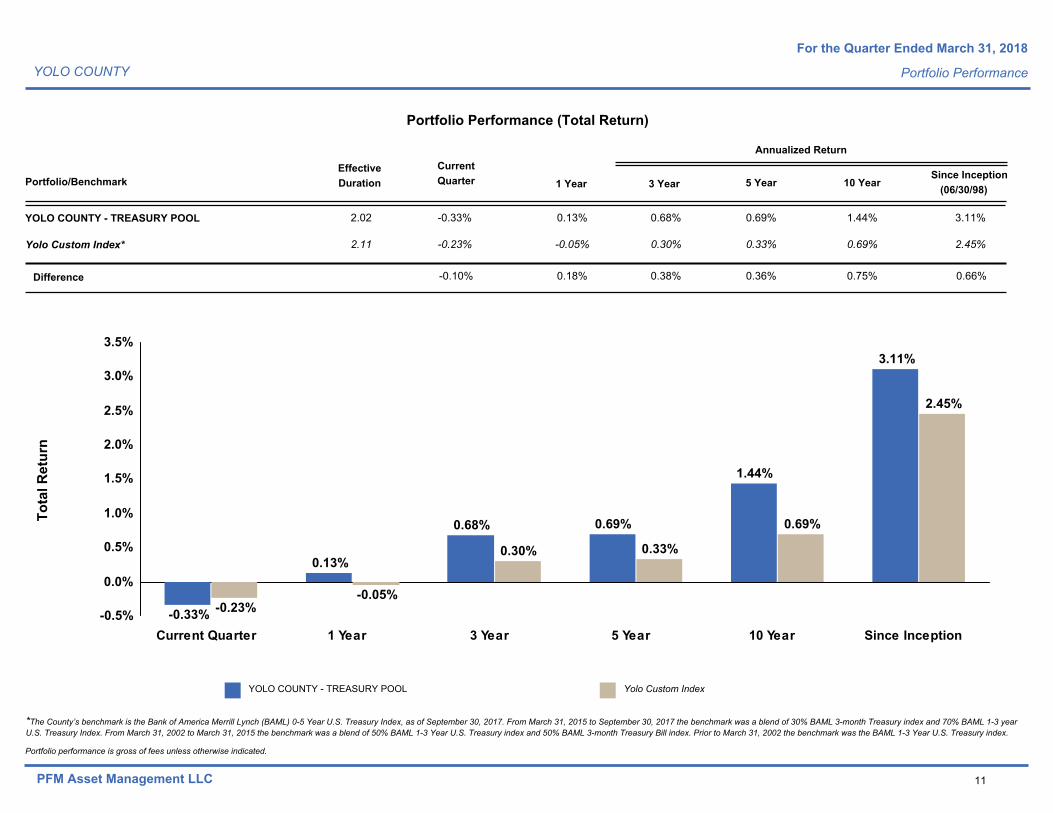
Portfolio Performance
Portfolio Performance (Total Return)
Effective
DurationPortfolio/Benchmark
Annualized Return
10 Year1 Year 3 Year 5 YearSince Inception
(06/30/98)
Current
Quarter
2.02 -0.33% 1.44%0.13% 0.68% 0.69% 3.11%YOLO COUNTY - TREASURY POOL
Yolo Custom Index* 2.11 -0.23% 0.69%-0.05% 0.30% 0.33% 2.45%
Difference 0.18%-0.10% 0.38% 0.36% 0.75% 0.66%
-0.5%
0.0%
0.5%
1.0%
1.5%
2.0%
2.5%
3.0%
3.5%
Current Quarter 1 Year 3 Year 5 Year 10 Year Since Inception
-0.33%
0.13%
0.68% 0.69%
1.44%
3.11%
-0.23%-0.05%
0.30% 0.33%
0.69%
2.45%
To
tal R
etu
rn
YOLO COUNTY - TREASURY POOL Yolo Custom Index
PFM Asset Management LLC
Portfolio performance is gross of fees unless otherwise indicated.
*The County’s benchmark is the Bank of America Merrill Lynch (BAML) 0-5 Year U.S. Treasury Index, as of September 30, 2017. From March 31, 2015 to September 30, 2017 the benchmark was a blend of 30% BAML 3-month Treasury index and 70% BAML 1-3 year U.S. Treasury Index. From March 31, 2002 to March 31, 2015 the benchmark was a blend of 50% BAML 1-3 Year U.S. Treasury index and 50% BAML 3-month Treasury Bill index. Prior to March 31, 2002 the benchmark was the BAML 1-3 Year U.S. Treasury index.
11

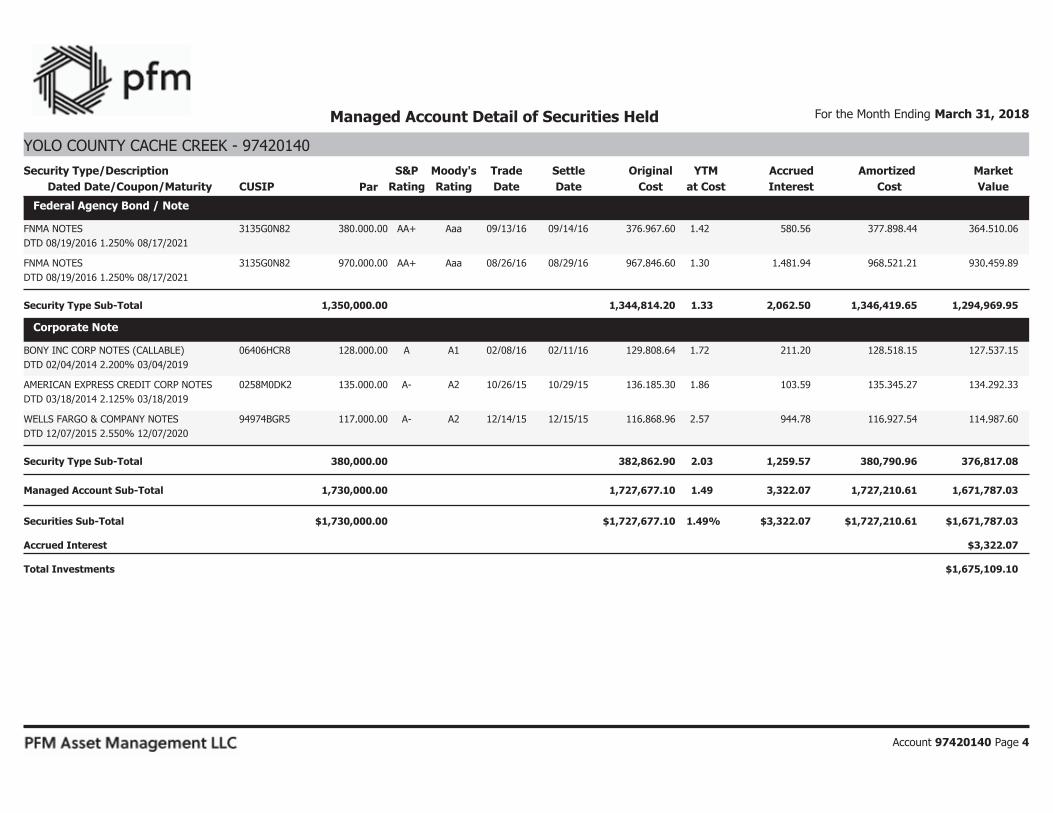
Portfolio Holdings

For the Month Ending March 31, 2018Managed Account Detail of Securities Held
Dated Date/Coupon/Maturity CUSIP Rating Rating Date Date Cost at Cost Interest Cost Value
YOLO COUNTY - TREASURY POOL Security Type/Description S&P Moody's Original YTM Accrued Amortized MarketTrade Settle
Par
U.S. Treasury Bond / Note
US TREASURY NOTES
DTD 08/17/2009 3.625% 08/15/2019
445,159.66 445,993.63 1,969.22 446,917.85 02/08/1802/07/18AaaAA+ 437,000.00 912828LJ7 2.10
US TREASURY NOTES
DTD 09/30/2015 1.375% 09/30/2020
1,142,075.61 1,156,096.66 43.95 1,150,484.76 03/17/1703/15/17AaaAA+ 1,170,000.00 912828L65 1.86
US TREASURY NOTES
DTD 05/31/2016 1.375% 05/31/2021
4,249,041.49 4,349,685.01 20,231.39 4,341,469.92 08/02/1708/01/17AaaAA+ 4,390,000.00 912828R77 1.67
US TREASURY NOTES
DTD 09/02/2014 2.000% 08/31/2021
2,752,966.00 2,804,112.31 4,860.87 2,805,153.71 11/01/1711/01/17AaaAA+ 2,795,000.00 912828D72 1.90
US TREASURY NOTES
DTD 10/31/2016 1.250% 10/31/2021
1,686,780.48 1,730,094.84 9,237.57 1,724,731.25 08/02/1708/01/17AaaAA+ 1,760,000.00 912828T67 1.74
US TREASURY N/B
DTD 11/30/2016 1.750% 11/30/2021
1,481,287.12 1,518,391.23 8,915.38 1,518,159.38 09/25/1709/25/17AaaAA+ 1,520,000.00 912828U65 1.78
US TREASURY NOTES
DTD 01/31/2017 1.875% 01/31/2022
3,655,266.56 3,734,195.74 11,622.93 3,733,133.59 07/11/1707/06/17AaaAA+ 3,740,000.00 912828V72 1.92
US TREASURY NOTES
DTD 03/31/2017 1.875% 03/31/2022
1,464,082.50 1,482,668.66 76.84 1,481,660.16 01/04/1801/03/18AaaAA+ 1,500,000.00 912828W89 2.18
US TREASURY NOTES
DTD 03/31/2017 1.875% 03/31/2022
3,689,487.90 3,785,462.33 193.65 3,786,349.22 07/17/1707/17/17AaaAA+ 3,780,000.00 912828W89 1.84
US TREASURY NOTES
DTD 03/31/2017 1.875% 03/31/2022
3,953,022.75 4,012,262.30 207.48 4,009,341.80 12/06/1712/01/17AaaAA+ 4,050,000.00 912828W89 2.12
US TREASURY NOTES
DTD 03/31/2015 1.750% 03/31/2022
5,004,352.85 5,161,309.66 246.24 5,162,875.00 08/31/1708/30/17AaaAA+ 5,150,000.00 912828J76 1.69
US TREASURY NOTES
DTD 07/31/2015 2.000% 07/31/2022
4,991,028.30 5,157,214.50 16,906.08 5,164,546.88 08/31/1708/30/17AaaAA+ 5,100,000.00 912828XQ8 1.73
US TREASURY NOTES
DTD 09/30/2015 1.750% 09/30/2022
3,054,462.32 3,135,608.18 151.09 3,133,090.63 10/06/1710/03/17AaaAA+ 3,160,000.00 912828L57 1.93
74,662.69 37,569,013.54 38,473,095.05 1.85 38,457,914.15 38,552,000.00 Security Type Sub-Total
13

For the Month Ending March 31, 2018Managed Account Detail of Securities Held
Dated Date/Coupon/Maturity CUSIP Rating Rating Date Date Cost at Cost Interest Cost Value
YOLO COUNTY - TREASURY POOL Security Type/Description S&P Moody's Original YTM Accrued Amortized MarketTrade Settle
Par
Supra-National Agency Bond / Note
INTER-AMERICAN DEVELOPMENT BANK
DTD 04/12/2016 1.000% 05/13/2019
3,451,934.50 3,496,157.98 13,416.67 3,489,500.00 04/12/1604/05/16AaaAAA 3,500,000.00 458182DX7 1.10
INTL BANK OF RECON AND DEV SN NOTE
DTD 07/13/2016 0.875% 08/15/2019
2,295,282.60 2,339,778.61 2,616.25 2,339,508.60 07/13/1607/06/16AaaAAA 2,340,000.00 459058FK4 0.88
INTL BANK OF RECONSTRUCTION&DEV
NOTES
DTD 10/07/2014 1.875% 10/07/2019
2,483,245.00 2,510,168.30 22,656.25 2,513,500.00 09/29/1709/27/17AaaAAA 2,500,000.00 459058DW0 1.60
INTL BANK OF RECONSTRUCTION AND DEV
NOTE
DTD 09/19/2017 1.561% 09/12/2020
4,876,375.00 4,990,100.35 4,119.31 4,988,000.00 09/19/1709/12/17AaaAAA 5,000,000.00 45905UP32 1.64
INTER-AMERICAN DEVELOPMENT BANK
DTD 11/08/2013 2.125% 11/09/2020
5,215,868.60 5,301,436.65 44,089.03 5,308,755.49 10/10/1710/02/17AaaAAA 5,260,000.00 4581X0CD8 1.81
INTERNATIONAL FINANCE CORPORATION
NOTE
DTD 01/25/2018 2.250% 01/25/2021
2,097,741.60 2,109,150.88 8,724.38 2,108,781.90 01/25/1801/18/18AaaAAA 2,115,000.00 45950KCM0 2.35
INTERNATIONAL FINANCE CORPORATION
NOTE
DTD 03/16/2018 2.635% 03/09/2021
3,875,922.09 3,887,121.05 4,270.90 3,887,082.50 03/16/1803/09/18AaaAAA 3,890,000.00 45950VLQ7 2.66
INTL BANK OF RECONSTRUCTION AND DEV
NOTE
DTD 01/26/2017 2.000% 01/26/2022
2,437,100.00 2,524,573.10 9,027.78 2,528,050.00 09/08/1709/06/17AaaAAA 2,500,000.00 459058FY4 1.73
108,920.57 26,733,469.39 27,158,486.92 1.75 27,163,178.49 27,105,000.00 Security Type Sub-Total
Federal Agency Collateralized Mortgage Obligation
FNMA SERIES 2015-M7 ASQ2
DTD 04/01/2015 1.550% 04/01/2018
6,242.01 6,253.41 8.08 6,315.92 04/30/1504/15/15AaaAA+ 6,253.41 3136ANJY4 0.83
FNMA SERIES 2015-M3 FA
DTD 02/01/2015 1.808% 06/01/2018
23,961.93 23,983.91 38.86 23,977.64 02/27/1502/12/15AaaAA+ 23,983.91 3136AMMC0 0.39
FNMA SERIES M4 FA
DTD 03/01/2015 1.798% 09/01/2018
177,330.89 177,495.39 265.97 177,449.89 03/31/1503/12/15AaaAA+ 177,495.39 3136AMTM1 0.38
14

For the Month Ending March 31, 2018Managed Account Detail of Securities Held
Dated Date/Coupon/Maturity CUSIP Rating Rating Date Date Cost at Cost Interest Cost Value
YOLO COUNTY - TREASURY POOL Security Type/Description S&P Moody's Original YTM Accrued Amortized MarketTrade Settle
Par
Federal Agency Collateralized Mortgage Obligation
FNMA SERIES 2015-M8 FA
DTD 05/01/2015 1.758% 11/01/2018
671,560.50 672,032.06 984.60 671,872.73 05/29/1505/13/15AaaAA+ 672,032.06 3136ANMF1 0.36
FNMA SERIES 2015-M15 ASQ2
DTD 11/01/2015 1.898% 01/01/2019
401,343.82 403,397.89 637.29 406,935.59 11/30/1511/06/15AaaAA+ 402,906.57 3136AQSW1 1.20
FNMA SERIES 2015-M10 FA
DTD 06/01/2015 1.838% 03/01/2019
720,446.47 721,349.82 1,104.95 721,141.07 06/30/1506/12/15AaaAA+ 721,349.82 3136ANA98 0.43
FNMA SERIES 2016-M9 ASQ2
DTD 06/01/2016 1.785% 06/01/2019
996,333.27 1,004,186.63 1,489.25 1,011,188.84 06/30/1606/09/16AaaAA+ 1,001,177.57 3136ASPX8 1.05
FANNIE MAE SERIES 2015-M13 ASQ2
DTD 10/01/2015 1.646% 09/01/2019
1,005,121.90 1,014,217.42 1,387.30 1,021,528.94 10/30/1510/07/15AaaAA+ 1,011,400.88 3136AQDQ0 1.08
FNMA SERIES 2015-M12 FA
DTD 09/01/2015 1.928% 04/01/2020
2,534,395.73 2,538,105.17 4,078.16 2,537,191.43 09/30/1509/10/15AaaAA+ 2,538,105.17 3136AP3Z3 0.54
9,994.46 6,536,736.52 6,561,021.70 0.71 6,577,602.05 6,554,704.78 Security Type Sub-Total
Federal Agency Bond / Note
FHLMC REFERENCE NOTE
DTD 07/20/2016 0.875% 07/19/2019
594,609.13 604,359.95 1,058.75 603,535.90 07/20/1607/19/16AaaAA+ 605,000.00 3137EAEB1 0.96
FHLMC REFERENCE NOTE
DTD 07/20/2016 0.875% 07/19/2019
5,189,316.00 5,271,925.51 9,240.00 5,262,787.20 10/05/1610/03/16AaaAA+ 5,280,000.00 3137EAEB1 0.99
FNMA BENCHMARK NOTE
DTD 08/02/2016 0.875% 08/02/2019
3,692,380.16 3,757,165.45 5,391.94 3,753,683.20 08/02/1607/29/16AaaAA+ 3,760,000.00 3135G0N33 0.93
FNMA NOTES
DTD 09/02/2016 1.000% 08/28/2019
6,156,134.08 6,255,360.15 5,738.33 6,250,234.40 09/02/1608/31/16AaaAA+ 6,260,000.00 3135G0P49 1.05
FREDDIE MAC GLOBAL NOTES
DTD 10/02/2012 1.250% 10/02/2019
1,103,206.72 1,116,462.84 6,961.11 1,114,668.80 06/23/1706/21/17AaaAA+ 1,120,000.00 3137EADM8 1.46
FANNIE MAE GLOBAL NOTES
DTD 10/25/2016 1.000% 10/24/2019
2,975,107.31 3,010,824.01 13,235.97 2,992,054.75 01/05/1701/03/17AaaAA+ 3,035,000.00 3135G0R39 1.52
15

For the Month Ending March 31, 2018Managed Account Detail of Securities Held
Dated Date/Coupon/Maturity CUSIP Rating Rating Date Date Cost at Cost Interest Cost Value
YOLO COUNTY - TREASURY POOL Security Type/Description S&P Moody's Original YTM Accrued Amortized MarketTrade Settle
Par
Federal Agency Bond / Note
FREDDIE MAC NOTES
DTD 01/17/2017 1.500% 01/17/2020
2,321,408.28 2,350,863.11 7,261.25 2,348,241.15 02/03/1702/01/17AaaAA+ 2,355,000.00 3137EAEE5 1.60
FREDDIE MAC NOTES
DTD 01/17/2017 1.500% 01/17/2020
4,189,378.00 4,248,584.16 13,104.17 4,247,790.00 04/05/1704/03/17AaaAA+ 4,250,000.00 3137EAEE5 1.52
FHLMC AGENCY NOTES
DTD 04/20/2017 1.375% 04/20/2020
2,452,322.50 2,494,109.00 15,373.26 2,491,450.00 04/20/1704/19/17AaaAA+ 2,500,000.00 3137EAEF2 1.49
FHLB NOTES
DTD 09/08/2017 1.375% 09/28/2020
380,437.98 383,606.04 44.69 382,999.50 01/04/1801/03/18AaaAA+ 390,000.00 3130ACE26 2.05
77,409.47 29,054,300.16 29,493,260.22 1.25 29,447,444.90 29,555,000.00 Security Type Sub-Total
Corporate Note
GENERAL ELEC CAP CORP GLOBAL NOTES
DTD 04/02/2013 1.625% 04/02/2018
625,000.00 625,001.88 5,049.91 626,812.50 07/07/1507/01/15A2A 625,000.00 36962G6W9 1.52
PEPSICO, INC CORP NOTES
DTD 04/30/2015 1.250% 04/30/2018
1,024,061.10 1,024,996.65 5,374.13 1,024,877.00 04/30/1504/27/15A1A+ 1,025,000.00 713448CR7 1.25
JOHN DEERE CAPITAL CORP NOTE
DTD 09/11/2015 1.750% 08/10/2018
4,352,577.21 4,364,459.57 10,821.56 4,360,722.30 09/11/1509/08/15A2A 4,365,000.00 24422ETA7 1.78
JOHN DEERE CAPITAL CORP NOTE
DTD 01/08/2016 1.950% 01/08/2019
1,239,340.23 1,244,980.44 5,597.31 1,244,925.30 01/08/1601/05/16A2A 1,245,000.00 24422ETE9 1.95
AMERICAN HONDA FINANCE CORP NOTES
DTD 02/23/2016 1.700% 02/22/2019
609,575.70 614,962.73 1,132.63 614,877.00 02/23/1602/18/16A2A+ 615,000.00 02665WBA8 1.71
BERKSHIRE HATHAWAY INC NOTES
DTD 03/15/2016 1.700% 03/15/2019
1,425,209.00 1,434,646.56 1,084.22 1,433,909.40 03/15/1603/08/16Aa2AA 1,435,000.00 084664CG4 1.73
BERKSHIRE HATHAWAY INC CORPORATE
NOTES
DTD 08/15/2016 1.300% 08/15/2019
1,178,258.40 1,199,461.94 1,993.33 1,198,836.00 08/15/1608/08/16Aa2AA 1,200,000.00 084664CK5 1.33
CISCO SYSTEMS INC CORP NOTES
DTD 09/20/2016 1.400% 09/20/2019
2,420,679.36 2,458,647.93 1,052.33 2,457,269.40 09/20/1609/13/16A1AA- 2,460,000.00 17275RBG6 1.44
16

For the Month Ending March 31, 2018Managed Account Detail of Securities Held
Dated Date/Coupon/Maturity CUSIP Rating Rating Date Date Cost at Cost Interest Cost Value
YOLO COUNTY - TREASURY POOL Security Type/Description S&P Moody's Original YTM Accrued Amortized MarketTrade Settle
Par
Corporate Note
WELLS FARGO & CO CORP BONDS
DTD 02/02/2015 2.150% 01/30/2020
2,953,101.00 2,995,503.87 10,929.17 2,992,740.00 02/03/1702/01/17A2A- 3,000,000.00 94974BGF1 2.23
APPLE INC BONDS
DTD 02/09/2017 1.900% 02/07/2020
3,464,780.13 3,503,926.59 9,989.25 3,503,282.55 02/09/1702/02/17Aa1AA+ 3,505,000.00 037833CK4 1.92
AMERICAN EXPRESS CREDIT (CALLABLE)
NOTE
DTD 03/03/2017 2.200% 03/03/2020
1,582,534.82 1,603,917.91 2,746.33 1,603,330.80 03/03/1702/28/17A2A- 1,605,000.00 0258M0EE5 2.24
TOYOTA MOTOR CREDIT CORP (CALLABLE)
DTD 04/17/2017 1.950% 04/17/2020
1,952,316.98 1,984,372.01 17,633.42 1,984,086.90 04/17/1704/11/17Aa3AA- 1,985,000.00 89236TDU6 1.97
UNILEVER CAPITAL CORP BONDS
DTD 05/05/2017 1.800% 05/05/2020
368,320.13 374,157.82 2,737.50 373,803.75 05/05/1705/02/17A1A+ 375,000.00 904764AV9 1.91
AMERICAN EXP CREDIT CORP NT
(CALLABLE)
DTD 05/26/2015 2.375% 05/26/2020
2,837,708.38 2,906,409.03 23,708.77 2,914,617.50 09/11/1709/07/17A2A- 2,875,000.00 0258M0DT3 1.85
IBM CREDIT CORP NOTE
DTD 09/08/2017 1.800% 01/20/2021
2,619,299.70 2,693,320.15 9,585.00 2,692,062.00 09/12/1709/08/17A1A+ 2,700,000.00 44932HAB9 1.89
BRANCH BANKING & TRUST (CALLABLE)
NOTES
DTD 10/26/2017 2.150% 02/01/2021
1,340,234.50 1,374,431.33 4,927.08 1,374,367.50 10/26/1710/23/17A2A- 1,375,000.00 05531FAZ6 2.17
JP MORGAN CHASE & CO CORP NT
(CALLABLE)
DTD 03/01/2016 2.550% 03/01/2021
2,976,424.55 3,040,279.64 6,428.13 3,043,936.50 07/13/1707/10/17A3A- 3,025,000.00 46625HQJ2 2.37
EXXON MOBIL CORPORATE (CALLABLE)
NOTES
DTD 03/03/2016 2.222% 03/01/2021
4,191,626.03 4,305,221.94 7,878.84 4,314,910.40 09/08/1709/06/17AaaAA+ 4,255,000.00 30231GAV4 1.80
BANK OF NEW YORK MELLON CORP
(CALLABLE)
DTD 02/19/2016 2.500% 04/15/2021
4,902,580.00 5,075,027.05 57,638.89 5,088,600.00 09/11/1709/07/17A1A 5,000,000.00 06406FAA1 1.99
BANK OF AMERICA CORP NOTE
DTD 04/19/2016 2.625% 04/19/2021
2,595,593.58 2,652,486.33 31,125.94 2,654,736.15 11/03/1711/01/17A3A- 2,635,000.00 06051GFW4 2.40
17

For the Month Ending March 31, 2018Managed Account Detail of Securities Held
Dated Date/Coupon/Maturity CUSIP Rating Rating Date Date Cost at Cost Interest Cost Value
YOLO COUNTY - TREASURY POOL Security Type/Description S&P Moody's Original YTM Accrued Amortized MarketTrade Settle
Par
Corporate Note
AMERICAN EXPRESS CREDIT (CALLABLE)
NOTES
DTD 05/05/2016 2.250% 05/05/2021
1,339,401.25 1,377,474.31 12,546.88 1,377,956.25 08/11/1708/08/17A2A- 1,375,000.00 0258M0EB1 2.19
AMERICAN HONDA FINANCE
DTD 07/12/2016 1.650% 07/12/2021
1,917,396.00 1,973,814.72 7,241.67 1,968,900.00 08/11/1708/08/17A2A+ 2,000,000.00 02665WBF7 2.06
GOLDMAN SACHS GROUP CORP NOTES
DTD 07/27/2011 5.250% 07/27/2021
2,520,736.54 2,584,750.52 22,213.33 2,608,218.20 11/07/1711/03/17A3BBB+ 2,380,000.00 38141GGQ1 2.53
AMERICAN HONDA FINANCE CORP NOTES
DTD 09/09/2016 1.700% 09/09/2021
2,392,857.50 2,479,314.43 2,597.22 2,476,050.00 09/08/1709/06/17A2A+ 2,500,000.00 02665WBG5 1.95
CITIGROUP INC CORP (CALLABLE) NOTE
DTD 12/08/2016 2.900% 12/08/2021
2,594,855.78 2,651,465.75 23,985.82 2,652,997.05 11/22/1711/20/17Baa1BBB+ 2,635,000.00 172967LC3 2.72
CHEVRON CORP CORP (CALLABLE) NOTES
DTD 03/03/2017 2.498% 03/03/2022
1,623,062.10 1,668,256.64 3,205.77 1,671,136.50 08/11/1708/08/17Aa2AA- 1,650,000.00 166764BN9 2.20
TOYOTA MOTOR CREDIT CORP
DTD 09/08/2017 2.150% 09/08/2022
3,272,265.40 3,392,705.23 4,670.28 3,391,840.00 09/12/1709/08/17Aa3AA- 3,400,000.00 89236TEC5 2.20
VISA INC (CALLABLE) NOTE
DTD 09/11/2017 2.150% 09/15/2022
2,601,795.60 2,685,651.55 2,580.00 2,684,070.00 09/25/1709/21/17A1A+ 2,700,000.00 92826CAG7 2.28
UNITED PARCEL SERVICE CORP NOTES
DTD 09/27/2012 2.450% 10/01/2022
1,441,805.64 1,443,722.76 18,130.00 1,443,162.80 03/05/1803/01/18A1A+ 1,480,000.00 911312AQ9 3.04
314,604.71 64,363,396.61 65,733,367.28 2.05 65,777,033.75 65,425,000.00 Security Type Sub-Total
Commercial Paper
ING (US) FUNDING LLC COMM PAPER
-- 0.000% 06/07/2018
2,748,623.28 2,749,212.98 0.00 2,746,315.00 03/14/1803/14/18P-1A-1 2,760,000.00 4497W1F76 2.11
JP MORGAN SECURITIES LLC COMM PAPER
DTD 10/23/2017 0.000% 07/20/2018
3,166,189.84 3,173,624.65 0.00 3,149,954.87 10/24/1710/24/17P-1A-1 3,190,000.00 46640QGL9 1.70
CREDIT AGRICOLE CIB NY COMM PAPER
DTD 01/25/2018 0.000% 07/24/2018
858,688.96 859,412.09 0.00 857,843.57 02/28/1802/28/18P-1A-1 865,000.00 22533UGQ0 2.06
18

For the Month Ending March 31, 2018Managed Account Detail of Securities Held
Dated Date/Coupon/Maturity CUSIP Rating Rating Date Date Cost at Cost Interest Cost Value
YOLO COUNTY - TREASURY POOL Security Type/Description S&P Moody's Original YTM Accrued Amortized MarketTrade Settle
Par
Commercial Paper
CREDIT AGRICOLE CIB NY COMM PAPER
DTD 01/25/2018 0.000% 07/24/2018
3,474,464.00 3,479,052.50 0.00 3,466,925.00 01/25/1801/25/18P-1A-1 3,500,000.00 22533UGQ0 1.91
0.00 10,247,966.08 10,261,302.22 1.91 10,221,038.44 10,315,000.00 Security Type Sub-Total
Certificate of Deposit
CANADIAN IMPERIAL BANK NY CD
DTD 12/05/2016 1.760% 11/30/2018
5,634,236.50 5,648,522.92 33,422.89 5,645,593.00 12/05/1612/01/16P-1A-1 5,650,000.00 13606A5Z7 1.78
SVENSKA HANDELSBANKEN NY LT CD
DTD 01/12/2017 1.890% 01/10/2019
6,413,316.38 6,445,000.00 27,407.36 6,445,000.00 01/12/1701/10/17P-1A-1+ 6,445,000.00 86958JHB8 1.91
BANK OF MONTREAL CHICAGO CERT DEPOS
DTD 02/09/2017 1.880% 02/07/2019
6,438,954.59 6,445,000.00 18,174.90 6,445,000.00 02/09/1702/08/17P-1A-1 6,445,000.00 06427KRC3 1.90
BANK OF NOVA SCOTIA HOUSTON LT CD
DTD 04/06/2017 1.910% 04/05/2019
4,972,020.00 5,000,000.00 47,219.44 5,000,000.00 04/06/1704/05/17A1A+ 5,000,000.00 06417GUE6 1.91
SUMITOMO MITSUI BANK NY CD
DTD 05/04/2017 2.050% 05/03/2019
5,481,866.50 5,500,000.00 46,665.97 5,500,000.00 05/04/1705/03/17A1A 5,500,000.00 86563YVN0 2.05
SKANDINAV ENSKILDA BANKEN NY CD
DTD 08/04/2017 1.840% 08/02/2019
4,848,547.05 4,998,692.85 14,822.22 4,998,050.00 08/04/1708/03/17Aa3A+ 5,000,000.00 83050FXT3 1.85
BANK OF TOKYO-MITSUBISHI NY CD
DTD 09/27/2017 2.070% 09/25/2019
2,674,784.70 2,700,000.00 28,876.50 2,700,000.00 09/27/1709/25/17A1A 2,700,000.00 06539RGM3 2.07
CREDIT SUISSE NEW YORK CERT DEPOS
DTD 02/08/2018 2.670% 02/07/2020
2,628,682.68 2,620,000.00 10,298.78 2,620,000.00 02/08/1802/07/18A1A 2,620,000.00 22549LFR1 2.67
NORDEA BANK AB NY CD
DTD 02/22/2018 2.720% 02/20/2020
3,898,156.61 3,910,000.00 11,521.47 3,910,000.00 02/22/1802/20/18Aa3AA- 3,910,000.00 65590ASN7 2.72
UBS AG STAMFORD CT LT CD
DTD 03/06/2018 2.900% 03/02/2020
3,918,089.69 3,890,000.00 8,147.39 3,890,000.00 03/06/1803/02/18Aa3A+ 3,890,000.00 90275DHG8 2.93
WESTPAC BANKING CORP NY CD
DTD 08/07/2017 2.050% 08/03/2020
4,435,814.68 4,490,000.00 13,806.75 4,490,000.00 08/07/1708/03/17Aa3AA- 4,490,000.00 96121T4A3 2.05
SWEDBANK (NEW YORK) CERT DEPOS
DTD 11/17/2017 2.270% 11/16/2020
5,229,056.45 5,315,000.00 45,243.94 5,315,000.00 11/17/1711/16/17Aa3AA- 5,315,000.00 87019U6D6 2.30
19

For the Month Ending March 31, 2018Managed Account Detail of Securities Held
Dated Date/Coupon/Maturity CUSIP Rating Rating Date Date Cost at Cost Interest Cost Value
YOLO COUNTY - TREASURY POOL Security Type/Description S&P Moody's Original YTM Accrued Amortized MarketTrade Settle
Par
Certificate of Deposit
305,607.61 56,573,525.83 56,962,215.77 2.12 56,958,643.00 56,965,000.00 Security Type Sub-Total
Asset-Backed Security / Collateralized Mortgage Obligation
HONDA ABS 2015-3 A3
DTD 08/19/2015 1.270% 04/18/2019
268,354.95 268,722.92 123.24 268,720.42 08/19/1508/12/15AaaNR 268,723.72 43814MAC1 1.27
CARMAX ABS 2016-3 A2
DTD 07/20/2016 1.170% 08/15/2019
138,567.87 138,625.23 72.09 138,618.67 07/20/1607/14/16NRAAA 138,629.99 14314EAB7 1.18
NISSAN ABS 2015-A A3
DTD 04/14/2015 1.050% 10/15/2019
376,035.77 376,996.22 175.94 376,939.46 04/14/1504/07/15AaaNR 377,018.70 65477UAC4 1.06
NISSAN ABS 2015-B A3
DTD 07/22/2015 1.340% 03/15/2020
1,082,751.00 1,088,081.31 648.03 1,088,025.85 07/22/1507/15/15AaaNR 1,088,112.35 65475WAD0 1.34
TOYOTA ABS 2016-A A3
DTD 03/02/2016 1.250% 03/15/2020
1,315,760.58 1,322,918.46 734.97 1,322,875.54 03/02/1602/23/16AaaAAA 1,322,950.55 89237KAD5 1.25
TOYOTA ABS 2016-C A3
DTD 08/10/2016 1.140% 08/15/2020
826,458.96 833,909.31 422.52 833,898.87 08/10/1608/01/16AaaAAA 833,921.22 89237WAD9 1.14
HYUNDAI ABS 2016-A A3
DTD 03/30/2016 1.560% 09/15/2020
855,144.53 859,915.21 596.27 859,833.16 03/30/1603/22/16AaaAAA 860,000.00 44930UAD8 1.57
NISSAN ABS 2016-B A3
DTD 04/27/2016 1.320% 01/15/2021
638,554.52 644,946.35 378.40 644,899.96 04/27/1604/18/16AaaNR 645,000.00 65478VAD9 1.33
TOYOTA ABS 2017-A A3
DTD 03/15/2017 1.730% 02/15/2021
692,657.07 699,926.65 538.22 699,917.61 03/15/1703/07/17AaaAAA 700,000.00 89238MAD0 1.74
JOHN DEERE ABS 2017-A A3
DTD 03/02/2017 1.780% 04/15/2021
643,024.92 649,913.19 514.22 649,907.44 03/02/1702/22/17AaaNR 650,000.00 47787XAC1 1.79
ALLY ABS 2017-1 A3
DTD 01/31/2017 1.700% 06/15/2021
920,734.50 929,941.58 702.67 929,918.72 01/31/1701/24/17AaaNR 930,000.00 02007PAC7 1.70
HONDA ABS 2017-1 A3
DTD 03/28/2017 1.720% 07/21/2021
1,250,826.81 1,264,924.73 604.39 1,264,924.73 03/28/1703/21/17AaaNR 1,265,000.00 43814TAC6 1.72
20

For the Month Ending March 31, 2018Managed Account Detail of Securities Held
Dated Date/Coupon/Maturity CUSIP Rating Rating Date Date Cost at Cost Interest Cost Value
YOLO COUNTY - TREASURY POOL Security Type/Description S&P Moody's Original YTM Accrued Amortized MarketTrade Settle
Par
Asset-Backed Security / Collateralized Mortgage Obligation
HYUNDAI ABS 2017-A A3
DTD 03/29/2017 1.760% 08/15/2021
1,168,574.48 1,184,904.13 926.93 1,184,904.13 03/29/1703/22/17NRAAA 1,185,000.00 44931PAD8 1.76
ALLY ABS 2017-2 A3
DTD 03/29/2017 1.780% 08/15/2021
2,183,572.91 2,204,802.70 1,744.40 2,204,740.03 03/29/1703/21/17AaaNR 2,205,000.00 02007HAC5 1.79
HONDA ABS 2017-2 A3
DTD 06/27/2017 1.680% 08/15/2021
2,707,700.33 2,749,762.13 2,053.33 2,749,762.13 06/27/1706/20/17AaaAAA 2,750,000.00 43811BAC8 1.68
JOHN DEERE ABS 2017-B A3
DTD 07/15/2017 1.820% 10/15/2021
787,885.52 799,950.70 647.11 799,941.44 07/18/1707/11/17AaaNR 800,000.00 47788BAD6 1.82
HAROT 2017-4 A3
DTD 11/29/2017 2.050% 11/21/2021
1,466,127.81 1,479,808.03 842.78 1,479,791.47 11/29/1711/22/17AaaNR 1,480,000.00 43813FAC7 2.06
TAOT 2017-D A3
DTD 11/15/2017 1.930% 01/15/2022
1,625,837.40 1,649,861.24 1,415.33 1,649,847.87 11/15/1711/07/17AaaAAA 1,650,000.00 89238KAD4 2.26
HYUNDAI ABS 2017-B A3
DTD 08/16/2017 1.770% 01/15/2022
2,060,194.72 2,094,686.69 1,648.07 2,094,636.94 08/16/1708/09/17AaaAAA 2,095,000.00 44932GAD7 1.78
ALLYA 2017-5 A3
DTD 11/22/2017 1.990% 03/15/2022
2,033,937.29 2,059,852.85 1,821.96 2,059,840.14 11/22/1711/14/17AaaAAA 2,060,000.00 02007YAC8 1.99
16,610.87 23,042,701.94 23,302,449.63 1.72 23,301,944.58 23,304,356.53 Security Type Sub-Total
257,776,061.31 257,904,799.36 1.84 907,810.38 257,945,198.79 254,121,110.07 Managed Account Sub-Total
$257,776,061.31 $257,904,799.36 $907,810.38 $257,945,198.79 $254,121,110.07 1.84%
$255,028,920.45
$907,810.38
Total Investments
Accrued Interest
Securities Sub-Total
21
YOLO COUNTY
For the Quarter Ended March 31, 2018
Appendix
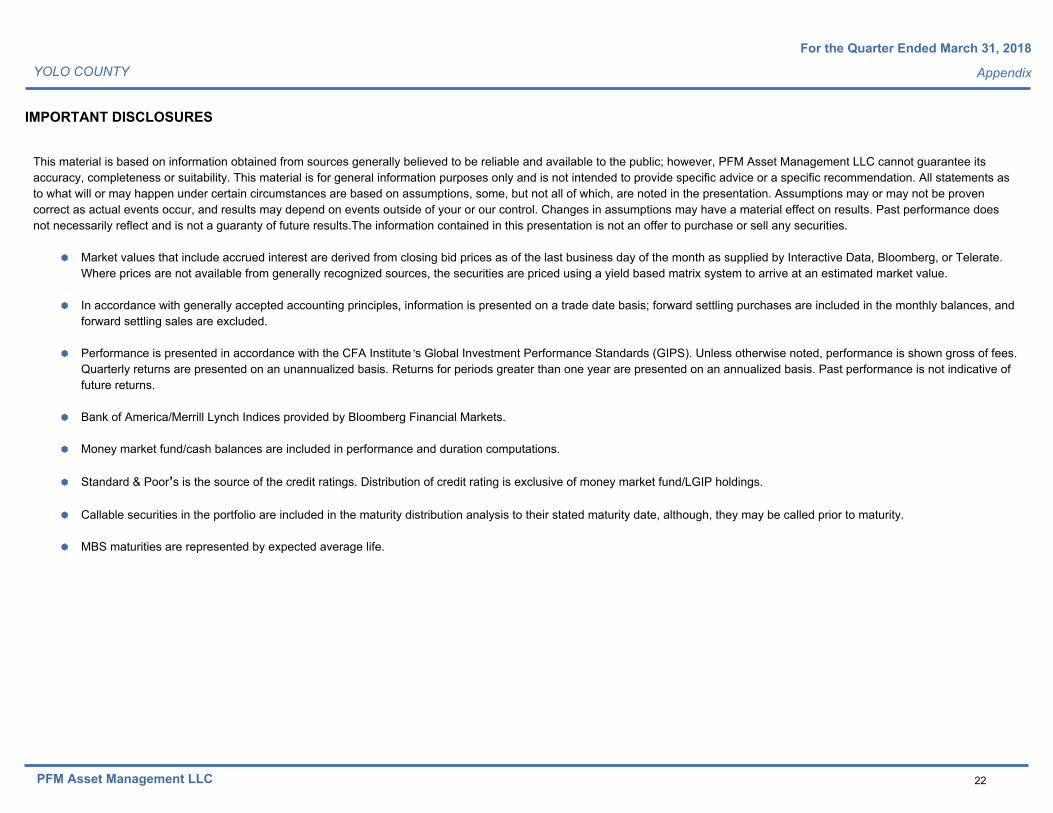
IMPORTANT DISCLOSURES
This material is based on information obtained from sources generally believed to be reliable and available to the public; however, PFM Asset Management LLC cannot guarantee its
accuracy, completeness or suitability. This material is for general information purposes only and is not intended to provide specific advice or a specific recommendation. All statements as
to what will or may happen under certain circumstances are based on assumptions, some, but not all of which, are noted in the presentation. Assumptions may or may not be proven
correct as actual events occur, and results may depend on events outside of your or our control. Changes in assumptions may have a material effect on results. Past performance does
not necessarily reflect and is not a guaranty of future results.The information contained in this presentation is not an offer to purchase or sell any securities.
Dime
à Market values that include accrued interest are derived from closing bid prices as of the last business day of the month as supplied by Interactive Data, Bloomberg, or Telerate.
Where prices are not available from generally recognized sources, the securities are priced using a yield based matrix system to arrive at an estimated market value.
à In accordance with generally accepted accounting principles, information is presented on a trade date basis; forward settling purchases are included in the monthly balances, and
forward settling sales are excluded.
à Performance is presented in accordance with the CFA Institute ’s Global Investment Performance Standards (GIPS). Unless otherwise noted, performance is shown gross of fees.
Quarterly returns are presented on an unannualized basis. Returns for periods greater than one year are presented on an annualized basis. Past performance is not indicative of
future returns.
à Bank of America/Merrill Lynch Indices provided by Bloomberg Financial Markets.
à Money market fund/cash balances are included in performance and duration computations.
à Standard & Poorʼs is the source of the credit ratings. Distribution of credit rating is exclusive of money market fund/LGIP holdings.
à Callable securities in the portfolio are included in the maturity distribution analysis to their stated maturity date, although, they may be called prior to maturity.
à MBS maturities are represented by expected average life.
PFM Asset Management LLC 22

YOLO COUNTY
For the Quarter Ended March 31, 2018
Appendix
GLOSSARY
à ACCRUED INTEREST: Interest that is due on a bond or other fixed income security since the last interest payment was made.
à AGENCIES: Federal agency securities and/or Government-sponsored enterprises.
à AMORTIZED COST: The original cost of the principal of the security is adjusted for the amount of the periodic reduction of any discount or premium from the purchase date until
the date of the report. Discount or premium with respect to short-term securities (those with less than one year to maturity at time of issuance) is amortized on a straight line basis.
Such discount or premium with respect to longer-term securities is amortized using the constant yield basis.
à BANKERS’ ACCEPTANCE: A draft or bill or exchange accepted by a bank or trust company. The accepting institution guarantees payment of the bill as well as the insurer.
à COMMERCIAL PAPER: An unsecured obligation issued by a corporation or bank to finance its short-term credit needs, such as accounts receivable and inventory.
à CONTRIBUTION TO DURATION: Represents each sector or maturity range ’s relative contribution to the overall duration of the portfolio measured as a percentage weighting. Since
duration is a key measure of interest rate sensitivity, the contribution to duration measures the relative amount or contribution of that sector or maturity range to the total rate
sensitivity of the portfolio.
à DURATION TO WORST: A measure of the sensitivity of a security ’s price to a change in interest rates, stated in years, computed from cash flows to the maturity date or to the put
date, whichever results in the highest yield to the investor.
à EFFECTIVE DURATION: A measure of the sensitivity of a security’s price to a change in interest rates, stated in years.
à EFFECTIVE YIELD: The total yield an investor receives in relation to the nominal yield or coupon of a bond. Effective yield takes into account the power of compounding on
investment returns, while ominal yield does not.
à FDIC: Federal Deposit Insurance Corporation. A federal agency that insures bank deposits to a specified amount.
à INTEREST RATE: Interest per year divided by principal amount and expressed as a percentage.
à MARKET VALUE: The value that would be received or paid for an investment in an orderly transaction between market participants at the measurement date.
à MATURITY: The date upon which the principal or stated value of an investment becomes due and payable.
à NEGOTIABLE CERTIFICATES OF DEPOSIT: A CD with a very large denomination, usually $1 million or more, that can be traded in secondary markets.
à PAR VALUE: The nominal dollar face amount of a security.
PFM Asset Management LLC 23

YOLO COUNTY
For the Quarter Ended March 31, 2018
Appendix
GLOSSARY
à PASS THROUGH SECURITY: A security representing pooled debt obligations that passes income from debtors to its shareholders. The most common type is the
mortgage-backed security.
à REPURCHASE AGREEMENTS: A holder of securities sells these securities to an investor with an agreement to repurchase them at a fixed price on a fixed date.
à SETTLE DATE: The date on which the transaction is settled and monies/securities are exchanged. If the settle date of the transaction (i.e., coupon payments and maturity
proceeds) occurs on a non-business day, the funds are exchanged on the next business day.
à TRADE DATE: The date on which the transaction occurred; however, the final consummation of the security transaction and payment has not yet taken place.
à UNSETTLED TRADE: A trade which has been executed; however, the final consummation of the security transaction and payment has not yet taken place.
à U.S. TREASURY: The department of the U.S. government that issues Treasury securities.
à YIELD: The rate of return based on the current market value, the annual interest receipts, maturity value, and the time period remaining until maturity, stated as a percentage on
an annualized basis.
à YTM AT COST: The yield to maturity at cost is the expected rate of return based on the original cost, the annual interest receipts, maturity value, and the time period from
purchase date to maturity, stated as a percentage on an annualized basis.
à YTM AT MARKET: The yield to maturity at market is the rate of return based on the current market value, the annual interest receipts, maturity value, and the time period
remaining until maturity, stated as a percentage on an annualized basis.
PFM Asset Management LLC 24

Att. C


$(30,000,000)
$(20,000,000)
$(10,000,000)
$‐
$10,000,000
$20,000,000
$30,000,000
$40,000,000
$50,000,000
$60,000,000
Mar. 15 Sept. 15 Mar. 16 Sept. 16 Mar. 17 Sept. 17 Mar. 18
Yolo County TreasurerCash Balances of Major FundsThree Year Trend to March 2018
General Fund (GF, Health & Emp & Social Svc) Mental Health Public Safety Grand Total
Att. D