board of directors committees of the board - · pdf filedata software research company pvt....
TRANSCRIPT

7th ANNUAL REPORT 2016-17
1
BOARD OF DIRECTORSMr. P. K. SrivastavaNon - Executive Chairman
Mr. Ranjit Singh*Executive Director and CEO
Mr. N. SrinivasanIndependent Non-Executive Director
Captain Bhupinder Singh KumarIndependent Non-Executive Director
Ms. Neelam Kapoor **Non-Executive Director
Captain Rahul Bhargava***Executive Director* Appointed as Executive Director and CEO with effect from September 22,
2016 in the place of Captain Anoop Kumar Sharma who ceased to act as Managing Director w.e.f. Septemebr 09, 2016.
** Appointed w.e.f. July 31, 2017 in the place of Ms. S. Gayathri who ceased to act as Director w.e.f. May 24, 2017.
*** Appointed w.e.f. November 14, 2017.
COMPANY SECRETARYMr. Awaneesh Srivastava
AUDITORSCNK & Associates LLP, Chartered Accountants(Firm Registration No. 101961W)Add.: Mistry Bhavan, 3rd Floor, Dinshaw Vachha Road, Churchgate, Mumbai - 400 020.
COMMITTEES OF THE BOARDAUDIT COMMITTEE Mr. N. Srinivasan (Chairman)Captain Bhupinder Singh KumarMs. Neelam Kapoor
STAKEHOLDERS RELATIONSHIP COMMITTEE Captain Bhupinder Singh Kumar (Chairman)Mr. Ranjit Singh
NOMINATION & REMUNERATION COMMITTEEMr. N. Srinivasan (Chairman)Captain Bhupinder Singh KumarMr. P. K. Srivastava
CORPORATE SOCIAL RESPONSIBILITY COMMITTEECaptain Bhupinder Singh Kumar (Chairman)Mr. Ranjit SinghMs. Neelam Kapoor
RISK MANAGEMENT COMMITTEE Captain Bhupinder Singh Kumar (Chairman)Mr. Ranjit SinghMr. Vikram Gupta
REGISTERED OFFICEEBTSL Premises, ER-2 Building (Admin. Building),Salaya, 44 KM, P.O. Box No. 7, Taluka Khambhalia,Devbhumi Dwarka District Jamnagar, Gujarat - 361 305
CORPORATE OFFICEEssar House11, K. K. MargMahalaxmiMumbai 400 034Maharashtra, IndiaE-mail: [email protected]
REGISTRAR & TRANSFER AGENTData Software Research Company Pvt. Limited19, Pycroft Garden Road, Off Haddows Road, Nungambakkam, Chennai - 600 006Ph.No.044-28213738 / 28214487 Fax No.044-28214636email.: [email protected]
CONTENTS
Page No. Page No.
Board of Directors 01 Notes forming part of the Standalone Financial Statements
47
Notice to Members 02 Auditors’ Report on Consolidated Financial Statements 91Director’s Report 08 Consolidated Balance Sheet 94Report on Corporate Governance 30 Consolidated Statement of Profit and Loss 95Auditor’s Report on Standalone Financial Statements 37 Consolidated Statement of Cash Flows 96Balance Sheet 42 Consolidated Statement of Changes in Equity 98Standalone Statement of Profit and Loss 43 Notes forming part of the Consolidated Financial
Statements99
Standalone Statement of Cash Flows 44 E-Mail Registration 149Standalone Statement of Changes in Equity 46 Proxy 151

2
NOTICE FOR ANNUAL GENERAL MEETING
Notice is hereby given that the Seventh Annual General Meeting (the Meeting) of the members of Essar Shipping Limited (the Company) will be held on December 29, 2017 at 2:00 p.m.at Registered Office of the Company at EBTSL Premises, ER-2 Building (Admin. Building), Salaya, 44 KM, P.O. Box No. 7, Taluka Khambhalia, Devbhumi Dwarka, Gujarat - 361 305, to transact the following businesses:
ORDINARY BUSINESS:1. To receive, consider and adopt:
a) The Audited Standalone Balance Sheet, Statement of Profit and Loss together with the Statement of Cash Flows and Statement of Changes in Equity of the Company for the financial year ended March 31, 2017, the reports of the Board of Directors and Auditors thereon; and
b) The Audited Consolidated Balance Sheet, Consolidated Statement of Profit and Loss together with the Consolidated Statement of Cash Flows and Consolidated Statement of Changes in Equity of the Company for the financial year ended March 31, 2017 and report of Auditors thereon.
2. To appoint a Director in place of Mr. P. K. Srivastava (DIN: 00843258), who retires by rotation and being eligible offers himself for re-appointment.
3. To re-appoint Auditors/ ratify the re-appointment of Auditors for the Financial Year 2017-18
SPECIAL BUSINESS4. To consider and if thought fit, to pass the following resolution as
a Special Resolution:
RESOLVED THAT pursuant to the provisions of Section 188 of the Companies Act,2013 (“the Act”) and Regulation 23 of the LODR regulation 2015 (including any statutory modification(s) or re-enactment thereof for the time being in force), approval of the members of the Company be and is hereby accorded to the Audit Committee and the Board of Directors to authorize the management of the Company to enter into agreement(s) and/or transaction(s), as may be appropriate, with the following Related Parties as defined under Section 2(76) of the Act and Clause 23 of LODR Regulation 2015 for sell, purchase, transfer or receipt of products, goods, materials, services or other obligations, if any,on such terms and conditions as may be mutually agreed upon between the Company and any of the Related Party, for the amount in aggregate not exceeding as mentioned against the name of each of the following Related Party during the period mentioned against the name of each Related Party:Sr.No.
Name ofRelatedParty
Nature ofTransaction(s)
Amount (`Rs. In crores)
2016-17
2017-18
From April 01, 2018 till the date of 8th Annual General Meeting to be held in Calendar Year 2018
1 EssarSteel IndiaLimited
Fleet operating and chartering services on Contract(s) of Affreightment and Spot fixture basis
387.08 500.00 250.00
Interest on inter-corporate deposits
13.98 15.00 8.00
Inter Corporate Deposits
NIL NIL NIL
2 EssarShipping(Cyprus)Limited
Direct Voyage Expenses
88.61 120.00 60.00
3 Arkay Logistics Limited
Chartering Services
72.64 100.00 50.00
“RESOLVED FURTHER THAT consent of the members of the Company be and is hereby accorded for ratification of the aforesaid related party transactions already entered into by Company exceeding the threshold limits as specified in Rule 15(3) of the Companies (Meetings of Board and its Powers) Rules, 2014 and which are material in nature in terms of Regulation 23 (1) of LODR Regulation 2015.
“RESOLVED FURTHER THAT the Board of Directors be and is hereby authorized to do all such acts and take all such steps as may be necessary, proper and expedient to give effect to this resolution.”
5. Appointment/Re-appointment of Independent Directors of the Company for a term of 5 years from the date of ensuing AGM.
To consider and if thought fit with or without modifications, the following resolution as a special resolution:
(a) “RESOLVED THAT pursuant to the provisions of Sections 149 and 152 of Companies Act, 2013 and regulations made thereunder, Mr. N. Srinivasan ( DIN: 00004195), a Non-Executive Independent Director of the Company, who has submitted a declaration that he meets the criteria of Independence, be and is hereby appointed as an Independent Director on the Board for a consecutive period of 5 years.”
(b) “RESOLVED THAT pursuant to the provisions of Sections 149 and 152 of Companies Act, 2013 and regulations made thereunder, Capt. Bhupinder Singh Kumar ( DIN: 00284649), a Non-Executive Independent Director of the Company, who has submitted a declaration that he meets the criteria of Independence, be and is hereby appointed as an Independent Director on the Board for a consecutive period of 5 years.”
“RESOLVED FURTHER THAT the Board of Directors be and is hereby authorized to do all such acts, deeds, matters and things as may be required to be done to give effect to this resolution and file the forms, resolutions etc. with ROC/MCA.”
6. Confirmation of appointment and remuneration of Mr. Ranjit Singh, Executive Director & CEO, appointed during the year as Additional Director under Executive category
To consider and if thought fit with or without modifications, the following resolution as a special resolution:
“RESOLVED THAT pursuant to the provisions of Sections 149, 178, 161 and 196 (4),197 and 203, read with Schedule V of the Companies Act, 2013 and other applicable provisions of the Act and regulations made thereunder and subject to approval of Central
7th ANNUAL REPORT 2016-17
3
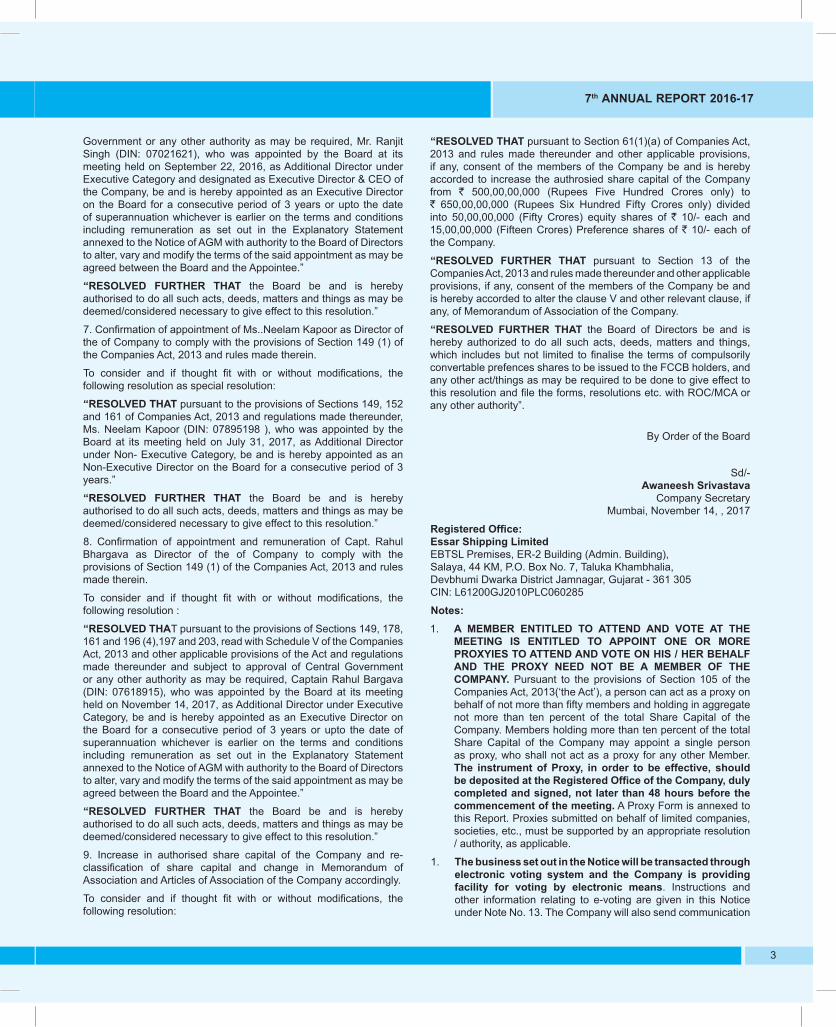
Government or any other authority as may be required, Mr. Ranjit Singh (DIN: 07021621), who was appointed by the Board at its meeting held on September 22, 2016, as Additional Director under Executive Category and designated as Executive Director & CEO of the Company, be and is hereby appointed as an Executive Director on the Board for a consecutive period of 3 years or upto the date of superannuation whichever is earlier on the terms and conditions including remuneration as set out in the Explanatory Statement annexed to the Notice of AGM with authority to the Board of Directors to alter, vary and modify the terms of the said appointment as may be agreed between the Board and the Appointee.”
“RESOLVED FURTHER THAT the Board be and is hereby authorised to do all such acts, deeds, matters and things as may be deemed/considered necessary to give effect to this resolution.”
7. Confirmation of appointment of Ms..Neelam Kapoor as Director of the of Company to comply with the provisions of Section 149 (1) of the Companies Act, 2013 and rules made therein.
To consider and if thought fit with or without modifications, the following resolution as special resolution:
“RESOLVED THAT pursuant to the provisions of Sections 149, 152 and 161 of Companies Act, 2013 and regulations made thereunder, Ms. Neelam Kapoor (DIN: 07895198 ), who was appointed by the Board at its meeting held on July 31, 2017, as Additional Director under Non- Executive Category, be and is hereby appointed as an Non-Executive Director on the Board for a consecutive period of 3 years.”
“RESOLVED FURTHER THAT the Board be and is hereby authorised to do all such acts, deeds, matters and things as may be deemed/considered necessary to give effect to this resolution.”
8. Confirmation of appointment and remuneration of Capt. Rahul Bhargava as Director of the of Company to comply with the provisions of Section 149 (1) of the Companies Act, 2013 and rules made therein.
To consider and if thought fit with or without modifications, the following resolution :
“RESOLVED THAT pursuant to the provisions of Sections 149, 178, 161 and 196 (4),197 and 203, read with Schedule V of the Companies Act, 2013 and other applicable provisions of the Act and regulations made thereunder and subject to approval of Central Government or any other authority as may be required, Captain Rahul Bargava (DIN: 07618915), who was appointed by the Board at its meeting held on November 14, 2017, as Additional Director under Executive Category, be and is hereby appointed as an Executive Director on the Board for a consecutive period of 3 years or upto the date of superannuation whichever is earlier on the terms and conditions including remuneration as set out in the Explanatory Statement annexed to the Notice of AGM with authority to the Board of Directors to alter, vary and modify the terms of the said appointment as may be agreed between the Board and the Appointee.”
“RESOLVED FURTHER THAT the Board be and is hereby authorised to do all such acts, deeds, matters and things as may be deemed/considered necessary to give effect to this resolution.”
9. Increase in authorised share capital of the Company and re-classification of share capital and change in Memorandum of Association and Articles of Association of the Company accordingly.
To consider and if thought fit with or without modifications, the following resolution:
“RESOLVED THAT pursuant to Section 61(1)(a) of Companies Act, 2013 and rules made thereunder and other applicable provisions, if any, consent of the members of the Company be and is hereby accorded to increase the authrosied share capital of the Company from ` 500,00,00,000 (Rupees Five Hundred Crores only) to ` 650,00,00,000 (Rupees Six Hundred Fifty Crores only) divided into 50,00,00,000 (Fifty Crores) equity shares of ` 10/- each and 15,00,00,000 (Fifteen Crores) Preference shares of ` 10/- each of the Company.
“RESOLVED FURTHER THAT pursuant to Section 13 of the Companies Act, 2013 and rules made thereunder and other applicable provisions, if any, consent of the members of the Company be and is hereby accorded to alter the clause V and other relevant clause, if any, of Memorandum of Association of the Company.
“RESOLVED FURTHER THAT the Board of Directors be and is hereby authorized to do all such acts, deeds, matters and things, which includes but not limited to finalise the terms of compulsorily convertable prefences shares to be issued to the FCCB holders, and any other act/things as may be required to be done to give effect to this resolution and file the forms, resolutions etc. with ROC/MCA or any other authority”.
By Order of the Board
Sd/-Awaneesh Srivastava
Company Secretary Mumbai, November 14, , 2017
Registered Office:Essar Shipping LimitedEBTSL Premises, ER-2 Building (Admin. Building),Salaya, 44 KM, P.O. Box No. 7, Taluka Khambhalia,Devbhumi Dwarka District Jamnagar, Gujarat - 361 305CIN: L61200GJ2010PLC060285
Notes:1. A MEMBER ENTITLED TO ATTEND AND VOTE AT THE
MEETING IS ENTITLED TO APPOINT ONE OR MORE PROXYIES TO ATTEND AND VOTE ON HIS / HER BEHALF AND THE PROXY NEED NOT BE A MEMBER OF THE COMPANY. Pursuant to the provisions of Section 105 of the Companies Act, 2013(‘the Act’), a person can act as a proxy on behalf of not more than fifty members and holding in aggregate not more than ten percent of the total Share Capital of the Company. Members holding more than ten percent of the total Share Capital of the Company may appoint a single person as proxy, who shall not act as a proxy for any other Member. The instrument of Proxy, in order to be effective, should be deposited at the Registered Office of the Company, duly completed and signed, not later than 48 hours before the commencement of the meeting. A Proxy Form is annexed to this Report. Proxies submitted on behalf of limited companies, societies, etc., must be supported by an appropriate resolution / authority, as applicable.
1. The business set out in the Notice will be transacted through electronic voting system and the Company is providing facility for voting by electronic means. Instructions and other information relating to e-voting are given in this Notice under Note No. 13. The Company will also send communication

4
relating to remote e-voting which inter alia would contain details about User ID and password along with a copy of this Notice to the members, separately.
2. Corporate members intending to send their authorised representatives to attend the Meeting are requested to send to the Company a certified true copy of the Board Resolution authorising their representative to attend and vote on their behalf at the Meeting.
3. In terms of Section 152 of the Companies Act, 2013, Mr. P.K. Srivastava (DIN: 00843258), Director, retires by rotation at the Meeting and being eligible, offers himself for reappointment. The Board of Directors of the Company recommends his re-appointment. Brief resume of the Director proposed to be re-appointed, nature of his expertise in specific functional areas, names of companies in which he hold Directorships, shareholding and relationships between Directors inter-se as stipulated under SEBI ( LODR) Regulation, 2015 , are provided in the explanatory statements annexed with the notice.
4. A Statement pursuant to Section 102(1) of the Companies Act, 2013, relating to the Special Business to be transacted at the Meeting is annexed hereto.
5. Members are requested to bring their attendance slip along with their copy of Annual Report to the Meeting.
6. In case of joint holders attending the Meeting, only such joint holder who is higher in the order of names will be entitled to vote.
7. Relevant documents referred to in the accompanying Notice and the Statement are open for inspection by the members at the Registered Office of the Company on all working days, except Saturdays, during business hours up to the date of the Meeting.
8. The Register of Members and Share Transfer Books of the Company shall remain close from, December 23, 2017 to December 29, 2017 (both days inclusive) for the purpose of Annual General Meeting.
9. Members who have not registered their e-mail addresses so far, are requested to register their e-mail address for receiving all communication including Annual Report, Notices, Circulars, etc.
10. The shares of the Company are under compulsory Demat trading. Members holding shares in physical form are requested to convert their shares into dematerialized form in their own interest and convenience purpose.
11. The members can attend the Meeting on December 29, 2017, at 2:00 p.m., in person or through proxy to vote on the resolutions set forth in the notice, if they are not able to exercise their votes through e-voting. The Scrutinizer shall submit the report for both physical and e-voting to the Board of Directors which shall be published on the website of the Company within 48 hours
12. Voting through electronic means:Pursuant to Section 108 of the Act, read with the Companies (Management and Administration) Rules, 2014 and Regulation 44 of SEBI (LODR) Regulations, 2015, the Company is pleased to provide the facility to Members to exercise their right to vote by electronic means (e-voting) in respect of the resolutions contained in this Notice.
The Members, whose names appear in the Register of Members / list of Beneficial Owners as on December 22, 2017 (cut-off date), are entitled to vote on the Resolutions set forth in this Notice.
Members who have acquired shares after the dispatch of the Annual Report and before the book closure may approach the Company for issuance of the User ID and Password for exercising their right to vote by electronic means.
The e-voting period will commence at 9.00 a.m. on, Tuesday, December 26, 2017 and will end at 5.00 p.m. on December 28 2017. The Company has appointed M/s. Martinho Ferrao & Associates, Practicing Company Secretary, to act as the Scrutinizer for conducting the scrutiny of the votes cast.
The Company is providing e-voting facility to its members to enable them to cast their votes electronically. The Company has entered into an arrangement with Central Depository Services (India) Limited (CDSL) for facilitating e-voting for AGM. Members are requested to carefully read the instructions for e-voting before casting their vote.
The instructions for shareholders voting electronically are as under:The instructions for shareholders voting electronically are as under:(i) The voting period begins on December 26, 2017 at 9:00 a.m.
and ends on December 28, 2017 at 5:00 p.m. (IST). During this period shareholders’ of the Company, holding shares either in physical form or in dematerialized form, as on the cut-off date (record date) of December 22, 2017, may cast their vote electronically. The e-voting module shall be disabled by CDSL for voting thereafter.
(ii) The shareholders should log on to the e-voting website www.evotingindia.com.
(iii) Click on Shareholders / Members
(iv) Now Enter your User ID
a. For CDSL: 16 digits beneficiary ID,
b. For NSDL: 8 Character DP ID followed by 8 Digits Client ID,
c. Members holding shares in Physical Form should enter Folio Number registered with the Company.
(v) Next enter the Image Verification as displayed and Click on Login.
(vi) If you are holding shares in demat form and had logged on to www.evotingindia.com and voted on an earlier voting of any company, then your existing password is to be used.
(vii) If you are a first time user follow the steps given below:
For Members holding shares in Demat Form and Physical FormPAN Enter your 10 digit alpha-numeric PAN issued by Income
Tax Department (Applicable for both demat shareholders as well as physical shareholders)• Members who have not updated their PAN with the
Company/Depository Participant are requested to use the first two letters of their name and the 8 digits of the sequence number in the PAN Field.
• In case the sequence number is less than 8 digits enter the applicable number of 0’s before the number after the first two characters of the name in CAPITAL letters. Eg. If your name is Ramesh Kumar with sequence number 1 then enter RA00000001 in the PAN field.

7th ANNUAL REPORT 2016-17
5
Dividend Bank Details OR Date of Birth (DOB)
Enter the Dividend Bank Details or Date of Birth (in dd/mm/yyyy format) as recorded in your demat ac-count or in the company records in order to login.• If both the details are not recorded with the depos-
itory or company please enter the member id / folio number in the Dividend Bank details field as men-tioned in instruction (iv).
(viii) After entering these details appropriately, click on “SUBMIT” tab.
(ix) Members holding shares in physical form will then directly reach the Company selection screen. However, members holding shares in demat form will now reach ‘Password Creation’ menu wherein they are required to mandatorily enter their login password in the new password field. Kindly note that this password is to be also used by the demat holders for voting for resolutions of any other company on which they are eligible to vote, provided that company opts for e-voting through CDSL platform. It is strongly recommended not to share your password with any other person and take utmost care to keep your password confidential.
(x) For Members holding shares in physical form, the details can be used only for e-voting on the resolutions contained in this Notice.
(xi) Click on the EVSN for the relevant <Company Name> on which you choose to vote.
(xii) On the voting page, you will see “RESOLUTION DESCRIPTION” and against the same the option “YES/ NO” for voting. Select the option YES or NO as desired. The option YES implies that you assent to the Resolution and option NO implies that you dissent to the Resolution.
(xiii) Click on the “RESOLUTIONS FILE LINK” if you wish to view the entire Resolution details.
(xiv) After selecting the resolution you have decided to vote on, click on “SUBMIT”. A confirmation box will be displayed. If you wish to confirm your vote, click on “OK”, else to change your vote, click on “CANCEL” and accordingly modify your vote.
(xv) Once you “CONFIRM” your vote on the resolution, you will not be allowed to modify your vote.
(xvi) You can also take out print of the voting done by you by clicking on “Click here to print” option on the Voting page.
(xvii) If a Demat account holder has forgotten the changed login password then enter the User ID and the image verification code and click on Forgot Password & enter the details as prompted by the system.
(xviii) Shareholders can also cast their vote using CDSL’s mobile app m-Voting available for android based mobiles. The m-Voting app can be downloaded from Google Play Store. Apple and Windows phone users can download the app from the App Store and the Windows Phone Store respectively. Please follow the instructions as prompted by the mobile app while voting on your mobile.
(xix) Note for Non – Individual Shareholders and Custodians
• Non-Individual shareholders (i.e. other than Individuals, HUF, NRI etc.) and Custodian are required to log on
to www.evotingindia.com and register themselves as Corporates.
• A scanned copy of the Registration Form bearing the stamp and sign of the entity should be emailed to [email protected].
• After receiving the login details a compliance user should be created using the admin login and password. The Compliance user would be able to link the account(s) for which they wish to vote on.
• The list of accounts should be mailed to helpdesk. [email protected] and on approval of the accounts they would be able to cast their vote.
• A scanned copy of the Board Resolution and Power of Attorney (POA) which they have issued in favour of the Custodian, if any, should be uploaded in PDF format in the system for the scrutinizer to verify the same.
(xx) In case you have any queries or issues regarding e-voting, you may refer the Frequently Asked Questions (“FAQs”) and e-voting manual available at www.evotingindia.com, under help section or write an email to helpdesk.evoting@ cdslindia.com.
EXPLANATORY STATEMENT PURSUANT TO SECTION 102 OF THE COMPANIES ACT, 2013
Item No. 4
The Company is an integrated logistics services provider engaged into the businesses of sea transportation, logistics services and oilfields services. The Company currently operates a diversified fleet of Very Large Crude Oil Carrier and bulk carriers including Capesize, mini-Capes, Supramaxes and Handysize bulk carriers. The Company in the ordinary course of its business provides sea transportation, logistics services and oilfields services to Essar Steel India Limited (ESIL) and Arkay Logistics Limited (ALL). They are companies engaged into manufacturing and Logisitics activities and require services of the Company for transportation of raw materials and finished goods. The fleet of the Company includes vessels owned by the Company as well as those taken on finance or operating lease. The Company is required to give/take vessels on hire to/from Essar Shipping (Cyprus) Limited (ESCL) for its business purposes.
ESIL, ALL and ESCL are Related Parties of the Company within the meaning of Section 2(76) of the Companies Act, 2013 and Regulation 23 of the SEBI (LODR) Regulations, 2015. Current and future transactions with ESIL, ALL and ESCL are/will be deemed to be ‘material’ in nature as defined in Regulation 23 of SEBI (LODR), Regulations 2015 as they may exceed 10% of the annual turnover of the Company consequent on future business projections. Thus, in terms of Section 188 of the Companies Act, 2013 and Regulation 23 of SEBI (LODR), Regulations 2015, these transactions would require the approval of the members by way of a Special Resolution.
The transactions entered during the year with the said related parties are in accordance with the approval taken from Shareholders in the last Annual General Meeting and approval taken from the audit committee at their respective meeting for the quarter in which the transaction took place.

6
The particulars of the contracts /arrangements /transactions are as under:
Name of the RelatedParty(ies)
Essar Steel India Limited, Arkay Logistics Limited and EssarShipping (Cyprus) Limited
Name of Director(s) or KMP who is/are related
None
Nature of Relationship Fellow Subsidiaries/ Associate Companies
Nature of contracts / arrangements /transactions
Providing Sea Transportation Service for transportation of raw materials and finished goods Giving/Taking vessels on hire
Material terms of the contracts /arrangements / Transactions
To be determined on an arm’s length basis
Monetary Value Amount mentioned in the resolution for corresponding period
Are the transactions in the ordinary course of business
Yes
Are the transactions on an arm’s length basis
Yes
Whether the transactions would meet the arm’s length standard in the opinion of theCompany’s Transfer PricingConsultants
Yes
Whether the transactions have been/would be approved by the Audit Committee and the Board ofDirectors of the Company
Yes
Any other information relevant or important for the members to make a decision on the proposed transactions
None
The monetary value of the transactions proposed is estimated on the basis of the Company’s current transactions and future business.
The Board is of the opinion that the transactions referred in the resolution would be in the best interest of the Company. The Board accordingly recommends the Special Resolution at Item No. 4 of the accompanying notice for your approval.
Item No.5.As per section 149 and 150 of the Companies Act, 2013, the Company is required to appoint Independent Directors. Mr. N. Srinivasan and Captain B. S. Kumar were appointed as Independent Directors of the Company in year 2014 and their tenure is being expired at the ensuing Annual General Meeting. The Company has received declarations from Mr. N. Srinivasan and Capt. B. S. Kumar that they meet the criteria of Independence.
Mr. N. SrinivasanMr. N. Srinivasan ( DIN: 00004195), has been a member of ICAI since 1955. Mr. Srinivasan was a senior partner in Fraser & Ross/Deloitte Haskins & Sells. He was Chairman of the Southern India Regional Council and Central Council Member of the Institute of Chartered Accountants of India.
Mr. N. Srinivasan is on the Board of Tractors and Farm Equipment Limited, The United Nilgiri Tea Estates Company Limited, GATI
Limited, Tafe Motors and Tractors Limited, The India Cements Limited, Essar Oilfield Services India Limited and SCM Microsystems (India) Private Limited.
Mr. N. Srinivasan doesn’t hold any shares in the Company.
Capt. Bhupinder Singh KumarCapt. Bhupinder Singh Kumar ( DIN:00284649) has vast experience of over 4 decades in the Ports and Shipping Sector duing which he has held key positions in the industry such as MD and CEO of Essar Group Companies, APJ Lines etc. He has played a key role in the development of Paradip Port, Hazira Port, Finolex Captive Jetty, Ratnagiri, Trustee/Director on Board of Mumbai Port Trust, Paradip Port Trust, besides being associated with Indian National, Shipowners Association, Steamship Mutual Bermuda Club, UK, Classification Societies, Visa Comptrade Ltd., Kolkata etc. He was a Shipping and Logistics Consultant/Adviser, and also on Panel of Arbitrators under Indian Council of Arbitrators and also an exclusive agent for ABEL Pumps Gmph, Germany in India.
Capt. Kumar is also an Independent Director on the Board of Essar Bulk Terminal Limited, Vadinar Oil Terminal Limited, Essar Bulk Terminal Paradip Limited and Essar Bulk Terminal ( Salaya) Limited.
Capt. Kumar doesn’t hold any shares in the Company.
The Company has received notice in writing from member(s) alongwith deposit of requisite amount, proposing the candidature of Mr. N. Srinivasan and Capt. Bhupinder Singh Kumar.
The Board of Directors is of opinion that Mr. N. Srinivasan and Capt. B.S. Kumar shall be able to contribute their knowledge, experience and expertise towards the growth of the Company.
Therefore the said resolutions at agenda no. 5 are proposed to be passed by the shareholders/members.
Item No.6.The Board of Directors at their meeting held on September 22, 2016, based on the recommendation of Nomination and Remuneration Committee had appointed Mr. Ranjit Singh (DIN:07021621) as Additional Director under executive Category and designated as Executive Director and CEO of the Company (Wholetime Key Managerial Personnel) for a period of 3 consecutive years or up to the date of the date of Superannuation whichever is earlier, at a gross remuneration of upto ` 1.64 Crores P.A. As per rules of the Company he will also be eligible for Provident Fund, Gratuity and Superannuation benefits which shall not be included for the purpose of calculation of the Managerial Remuneration.
Minimum Remuneration:If in any financial year during the currency of tenure of Mr. Ranjit Singh, the Company has no profits or inadequate profit, the Company will pay remuneration by way of salary, perquisites and allowance of upto ` 1.64 Crores P.A. in accordance with the Compliance of applicable provisions of section 196, 197 and 203 read with Schedule V of the Companies Act, 2013 and all other applicable provisions if any and rules made thereunder, with the approval of Central Government.
The aforesaid shall be treated as an abstract of the agreement between the Company and Mr. Ranjit Singh for the purpose of section 190 of Companies Act, 2013 and other applicable provisions of the Act.
As per provisions of the section 149, 152 and 161 of Companies Act, 2013 the Additional Director’s appointment needs to be regularized at the General Meeting.

7th ANNUAL REPORT 2016-17
7
Therefore the said resolutions at agenda item no. 6 are proposed to be passed by the shareholders/members.
Item No.7.The Board of Directors at their meeting held on July 31, 2017, based on the recommendation of Nomination and Remuneration Committee had appointed Ms. Neelam Kapoor (DIN: 07895198) as Additional Director under Non- Executive category for a period of 3 consecutive years. Ms. Kapoor, age 49 years, has Master Degree in Marketing and carries experience of approx. 19 years in the field of ITes & Education, Financial Services and Insurance, Publishing (Media) and Technology. As per provisions of the section 149, 152 and 161 of Companies Act, 2013 the additional director’s appointment needs to be regularized at the AGM.
Therefore the said resolutions at agenda no. 7 are proposed to be passed by the shareholders/members.
Item No.8.The Board of Directors at their meeting held on November 14, 2017, based on the recommendation of Nomination and Remuneration Committee had appointed Capt. Rahul Bhargava (DIN: 07618915) as Additional Director under executive Category and designated as Director- Commercial & Operations of the Company (Wholetime Key Managerial Personnel) for a period of 3 consecutive years or up to the date of the date of Superannuation whichever is earlier, at a gross remuneration of upto ` 0.97 Crore P.A. As per rules of the Company he will also be eligible for Provident Fund, Gratuity and Superannuation benefits which shall not be included for the purpose of calculation of the Managerial Remuneration.
Minimum Remuneration:If in any financial year during the currency of tenure of Capt. Rahul Bhargava, the Company has no profits or inadequate profit, the Company will pay remuneration by way of salary, perquisites and allowance of upto ` 0.97 Crore P.A. in accordance with the Compliance of applicable provisions of section 196, 197 and 203 read with Schedule V of the Companies Act, 2013 and all other applicable provisions if any and rules made thereunder, with the approval of Central Government.
The aforesaid shall be treated as an abstract of the agreement between the Company and Capt. Rahul Bhargava for the purpose of section 190 of Companies Act, 2013 and other applicable provisions of the Act.
As per provisions of the section 149, 152 and 161 of Companies Act, 2013 the Additional Director’s appointment needs to be regularized at the General Meeting. Therefore the said resolutions at agenda item no. 8 are proposed to be passed by the shareholders/members.
Item No. 9.On 24 August 2010, Essar Shipping Limited (ESL) issued Foreign Currency Convertible Bonds (FCCB’s) for US$ 240 million carrying interest @5% per annum payable semi annually. The FCCBs are convertible into fully-paid equity shares of ` 10 each of the Company or Compulsorily Convertible Preference Shares (CCPS), at the option of the FCCB holders at conversion price of ` 91.70 per share at a predetermined exchange rate of Rs. 46.94 per US$.
ESL proposes to issue Compulsorily Convertible Preference Shares (CCPS) to the FCCB holders. Issuance of CCPS will reduce current borrowings by Rs. 1,537 crores with a resultant increase in the Company’s net worth. This will also improve the health of the Company’s balance sheet by reducing the Company’s leverage.
The authorised share capital of the Company is Rs. 5,00,00,00,000/- (Rupees five hundred crore only) divided into 50,00,00,000 (Fifty Crore) equity shares of Rs. 10/- each. Considering the option of issuing the CCPS, the Share Capital of the Company needs to be increased and re-classified.
The proposed Authorised Share Capital and its re-classification will be as follows:
Existing Authorised Share Capital (in Rs.)
Equity/ Prefer-ence
Proposed Authorised Share Capital (in Rs.)
Proposed Equity/ Prefer-ence Shares
5,00,00,00,000 Equity 5,00,00,00,000 Equity Shares
1,50,00,00,000 Preference Shares
Therefore the said resolutions at agenda item no. 9 are proposed to be passed by the shareholders/members.
Details of Director seeking re-appointment at 7th Annual General Meeting in pursuance of SEBI (LODR) Regulations 2015.Mr. P K SrivastavaMr. P. K. Srivastava was appointed as Director at Annual General Meeting held on September 23, 2015 who shall retire by rotation under the provisions of section 152 has offered himself for re-appointment.
Mr. P. K. Srivastava, age 72 years, has around 50 years of experience in Shipping Industry and has also served as Chairman and Managing Director of Government owned undertaking, Shipping Corporation of India. He was group advisor (Trading & Shipping Division) of Emirates Trading Agency L.L.C., Dubai, UAE.
Mr. P. K. Srivastava is also Director on the Board of various Indian Public Limited Companies, viz., Essar Bulk Terminal Limited, Essar Ports Limited, Essar Oilfield Services India Limited, Essar Bulk Terminal Paradip Limited, Essar Paradip Terminals Limited, Essar Bulk Terminals (Salaya) Limited and Essar Vizag Terminals Limited.
Mr. P. K. Srivastava does not hold any shares in the Company.
The Company has received a notice in writing from a Member along with the deposit of requisite amount under Section 160 of the Act proposing the candidature of Mr. P K. Srivastava for the office of Director of the Company.
Keeping in view the expertise of Mr. P K. Srivastava the Board is of the opinion that the appointment of Mr. P K. Srivastava would be in the best interest of the Company. The Board accordingly recommends the resolution at Item No. 2 of the accompanying notice for your approval.
None of the Directors other than Mr. P K. Srivastava is concerned or interested in the resolution at Item No. 2 of the accompanying Notice.

8
To the Members of Essar Shipping Limited
Your Directors are pleased to present the Seventh Annual Report and Audited Financial Statements of the Company for the financial year ended March 31, 2017.
FINANCIAL RESULTS:The Company’s financial performance, for the year ended March 31, 2017 is summarized below:
` in Crore
Particulars
Consolidated Standalone
For the year ended 31-03-2017
For the Year
ended 31-03-2016
For theyear ended 31-03-2017
For the Year
ended 31-03-2016
Total Income 2125.38 1918.40 812.00 825.49Total Expenditure 1814.73 1441.06 438.86 523.45EBITDA 310.65 477.34 373.14 302.04Less: Interest & Finance charges 466.98 541.60 352.63 342.65Less: Provision for Depreciation 390.50 463.94 137.14 153.69Less: Exceptional Item - - - -Profit / (Loss) before Tax (546.84) (528.22) (116.63) (194.31)Less: Provision for Tax (37.85) (21.94) (2.65) (3.39)Profit / (Loss) for the year before share of profit of associate (584.69) (550.16) (119.28) (197.70)Add: Share of profit of associate 1.24 - - -Add: Other Comprehensive Income/loss (0.38) (8.54) (0.38) (8.54)Profit / (Loss) for the year (583.83) (558.71) (119.66) (206.24)
DIVIDENDIn view of loss during the year 2017 -18, the Board of Directors has not recommended any dividend for the year under review.
MANAGEMENT DISCUSSION AND ANALYSISOverview of the World Economy & Shipping Industry
Maritime transport is the backbone of globalization and lies at the heart of cross-border transport networks that support supply chains and enable international trade. An economic sector in its own right that generates employment, income and revenue. Transport – including maritime transport – is cross-cutting and permeates other sectors and activities. Maritime transport enables industrial development by supporting manufacturing growth; bringing together consumers and intermediate and capital goods industries; and promoting regional economic and trade integration. Falling short of expectations and below the pre financial crisis levels, growth in world GDP expanded by 2.5 per cent in 2016, the same rate as in 2014. Developing country trade was particularly weak in 2016, with
DIRECTORS’ REPORT
export and import volumes, respectively, expanding at the marginal rate of 0.4 per cent, a significant drop from growth in previous years
After a continued lackluster outturn in 2016, economic activity is projected to pick up pace in 2017 and 2018, especially in emerging market and developing economies. Growth rate is expected to be 3.6 percent in 2017, as estimated by International Monetary Fund the long-term growth prospects for seaborne trade and maritime businesses are positive. There are ample opportunities for developing countries to generate income and employment and help promote foreign trade.
The world shipping fleet grew by 3.5 per cent in 2016. This is the lowest growth rate since 2003, yet still higher than the 2.8 per cent growth in demand, leading to a continued situation of global overcapacity.
Maritime businessThe largest shipbuilding countries are China, Japan and the Republic of Korea, accounting for 91.4 per cent of gross tonnage. Most demolitions take place in Asia; four countries - Bangladesh, India, Pakistan and China - accounted for 95 per cent of ship scrapping gross tonnage. The largest suppliers of seafearers are China, Indonesia and the Philippines. China’s economy has slowed over the past few years, although it is still growing at a relatively high rate; GDP growth decelerated from 7.2 per cent in 2014 to 6.9 per cent in 2015. China may be said to be growing at two speeds, with its manufacturing sector facing overcapacity and limited growth, while its consumer-driven services sector is growing at a rapid pace (The Economist Intelligence Unit, 2016).China accounted for about 20 per cent of the slowdown in import growth of developing economies and countries with economies in transition in 2014–2015 (United Nations Department of Economic and Social Affairs, 2016). Dry cargo shipments account for 70.7 per cent of total seaborne trade volumes, while the remaining share is made up of tanker trade, including crude oil, petroleum products and gas.The slowdown in construction and infrastructure investment by China and the decline in steel output have affected iron ore trade, which accounted for 13.6 per cent of total seaborne trade in 2017. Minor bulk commodities (agribulks, metals and minerals and manufactures), many of which are also linked to steel production, are estimated to have increased by 1.5 per cent, supported, in particular, by growing exports of steel products from China. The tanker sector experienced one of its best performances since 2008. Cumulatively, gross petroleum import bill increased 16.55 per cent to $35.9 billion in the first five months of 2017-18 fiscal as compared to the corresponding period last year adding pressure on the country’s current account deficit which ballooned to $14.3 billion (2.4 per cent of GDP) in the first quarter ended June.Developing countries continued to contribute larger shares to the total volumes of international seaborne trade. Their contribution with regard to global goods loaded is estimated at 60 per cent, and their import demand as measured by the volume of goods unloaded increased, reaching 62 per cent.

7th ANNUAL REPORT 2016-17
9
Overview of the Indian EconomyNotwithstanding the current situation, the longer term outlook for the industry remains good. India’s population continues to expand, and emerging economies will continue to increase their requirements for the goods and raw materials that shipping transports so safely and efficiently. Emerging economies such as India have undertaken several initiatives such as development of coastal shipping, advanced technology ports, incentives to the domestic ship repair and ship building industry, port led development, revival of the manufacturing sector & infrastructure development of the country as a whole. Amongst the developing economies, IMF expects India to report the highest GDP growth of 6.7% in 2017-18.
As per the latest Global Economic Prospects (GEP) report by World Bank, India is leading the World Bank’s growth chart for major economies. India’s maritime trade is expected to grow at a CAGR of 9.6% increasing India’s share to the global sea borne trade to 17% by 2025. Thus, leading to an opportunity to increase cargo handling capacity from 1Bn MTPA to 2.5 Bn MTPA.
BUSINESS PERFORMANCE, OPPORTUNITIES AND OUTLOOKFreight rates and Maritime trade by Cargo type
In 2016, most shipping segments, except for tankers, suffered historic low levels of freight rates and weak earnings, triggered by weak demand and oversupply of new tonnage. The tanker market remained strong, mainly because of the continuing and exceptional fall in oil prices. The crude oil and product tanker markets enjoyed strong freight rates throughout, mainly triggered by a surge in seaborne oil trade and supported by a low supply of crude tanker fleet capacity. The same was not the case with dry bulk freight market, which was affected by the substantial slowdown in seaborne dry bulk trade and the influx of excess tonnage. Rates fluctuated around or below vessels’ operating costs across all segments.
(a) Tanker trade In 2016, oil remained the leading fuel, accounting for one third
of global energy consumption. Global oil consumption was supported by demand among members of the Organization for Economic Cooperation.
Global crude oil trade reversed the 2015 trend and expanded by 3.8 per cent in 2016, with total volumes reaching an estimated 1.77 billion tons. Global seaborne oil trade expanded faster than underlying oil demand, suggesting that end-user oil demand was not the only factor at play. Ample oil supply, low oil price levels, additions to refinery capacity, improved refinery margins and stock-building activity all contributed to the rise in crude oil volumes, which in turn led to infrastructure bottlenecks, delays and greater demand for oil storage.
India – the third largest importer of crude oil after the United States and China – increased its imports, while increasingly diversifying sources of supply, including Latin America and Western Africa.
All tanker segments performed well, benefiting from strong freight rates and low bunker prices, which resulted in strong
tanker earnings. Overall, average tanker earnings per vessel rose to an average of $31,036 per day, an increase of 73 per cent over 2014, the highest level since 2008 (Clarksons Research, 2016). The largest gains were observed in the very large crude carrier segment.
(b) Dry cargo trade: Major and minor dry bulk commodities and other dry cargo
Dry bulk freight rates plunged to a record low as weakening demand and strong supply created a high imbalance in market fundamentals. The dry cargo market was mainly affected by a substantial slowdown in seaborne dry bulk trade, with volumes contracting by 0.2 per cent as a result of limited growth in the iron ore trade and declining coal volumes. The increase in cancellation and scrapping activities helped to limit overall fleet growth to its slowest pace in 15 years (Clarksons Research, 2016) but it was not enough to bridge the gap between supply and demand and bring the sector back into balance. Given these challenging market conditions, the Baltic Exchange Dry Index reached several low levels. Earnings in the capsize segment staggered near $ 8,208/day which merely could meet average OPEX.
The concentrated growth, both in China and in two key commodities – iron ore and coal – heightened the vulnerability of shipping and seaborne trade to fluctuations affecting demand and to developments in China’s economy. This became evident in 2016, when China’s steel output, which accounted for nearly half of global output, declined (by 2.3 per cent) for the first time since 1981 (World Steel Association, 2016). Reduced steel production in China compressed the country’s demand for imports of iron ore, as well as other related commodities and metals.
(c) Structure of the world fleet The world fleet in terms of dwt grew by 3.6 per cent in the
12 months to January 2017. This growth rate is the same as 2015, yet still higher than the 3 per cent growth in demand, leading to a continued situation of global overcapacity.
As at January 2017, the top five ship owning economies in terms of dwt are Greece, Japan, China, Germany and Singapore, while the top five economies by flag of registration were Panama, Liberia, the Marshall Islands, Hong Kong (China) and Singapore. Despite uncertainties, the long-term growth prospects for seaborne trade and maritime businesses are positive.
In total, as at January 2017, the world commercial fleet consisted of 22,400 vessels, with a combined tonnage of 1.8 billion dwt.
In 2017, 91.3 per cent of shipbuilding by gross tonnage took place in only three countries, namely, China (36.1 per cent), the Republic of Korea (34.3 per cent) and Japan (20.9 per cent)
(d) Opportunities In 2016, world seaborne trade volumes surpassed 10 billion
tons - the first time in the records of UNCTAD (United Nations Conference of Trade & Development). The tanker trade

10
segment recorded its best performance since 2008, while growth in the dry cargo sector, including bulk commodities and containerized trade in commodities, fell short of expectations. While a slowdown in China is bad news for shipping, other countries have the potential to drive further growth. South-South trade is gaining momentum, and planned initiatives such as the One Belt, One Road Initiative and the Partnership for Quality Infrastructure, as well as the expanded Panama Canal and Suez Canal, all have the potential to affect seaborne trade, reshape world shipping networks and generate business opportunities. In parallel, trends such as the fourth industrial revolution, big data and electronic commerce are unfolding, and entail both challenges and opportunities for countries and maritime transport.
(e) Outlook The outlook for seaborne trade remains uncertain and
subject to downside risks, including weak global demand and investment, political uncertainties, such as the ongoing migration crisis, doubts about the future pace and direction of European integration and a further loss of momentum in developing economies. While a slowdown in China is bad news for shipping, developing countries other than China are increasingly entering the shipping scene and have the potential to drive further growth. The lifting of some sanctions on the Islamic Republic of Iran is expected to stimulate crude oil trade, as well as non-oil sectors.
Oilfields Services BusinessOffshore Segment:
Since 2014, low crude oil prices, reduced spending on exploration and production and increased efficiencies in the drilling industry has resulted in a huge number of drilling rigs out of work. This in turn has dramatically decreased asset values, particularly the offshore drilling sector. Time to time production cuts by OPEC has also failed to control the falling oil prices, which means that offshore drilling rig sector, hurt by low oil prices and overcapacity, is not set for a quick recovery in 2017. However, the distressed assets do offer opportunities to acquire world class offshore drilling assets at lucrative rates.
Crude Oil Price projections remain unpredictable given the current market scenario. Although, the markets may improve marginally in 2017, but most improvement will be focused on certain asset classes or regions. Since September 2014, rig utilization globally has fallen by 31 percent and rig day rates have followed suit, falling by more than 50 percent in some cases. The rig day rates have almost bottomed to the lowest commercial level and no further deterioration in day rates is expected.
According to the recent updates, the international offshore active rig count for March 2017 was 197, down almost 6.6% since March 2016. The rig count is expected to rise marginally by 4% by the year end however if the oil prices drop further, the active rig count may further reduce to adjust for the loss in revenue.
Onshore Segment:The onshore drilling services market in India is mainly driven by PSU majors such as ONGC, Oil India Limited and Indian Oil
Corporation Limited. In February 2017, the Government of India has approved award of 31 contract areas to highest ranked bidders as part of the Discovered Small Field (DSF) Bid Round 2016. Twenty three out of the thirty one contracts awarded are located onshore and are expected to commence operations by the beginning of the next year. The fields awarded in DSF round along with upcoming Open Acreage Licensing Policy (OALP) of the Government, are expected to generate lot of opportunities for utilizing the drilling rigs and associated services. Alternatively PSUs like ONGC and Oil India Limited are also expected to make substantial investments in exploration and development activities. Opportunities for deployment of the land rigs at overseas locations also needs to be considered. It is crucial to exploit the opportunities that are expected to come for ensuring long term cash flows to the company. As the gas based infrastructure of the country is improving, demand for natural gas is rising which will lead to boost the Shale gas and CBM drilling activities, providing further opportunities for deployment of land rigs.
SUBSIDIARIESAs on March 31, 2017, your Company has four direct subsidiaries and four indirect subsidiaries. Essar Oilfields Services Limited, Mauritius; Energy Transportation International Limited, Bermuda; Energy II Limited, Bermuda; and Essar Shipping DMCC are direct subsidiaries of the Company. Essar Oilfield Services India Limited, India, StarBit Oilfields Services India, Limited, Essar Oilfield Middle East DMCC, Dubai UAE, and Cosmic Drilling Services Limited are step down subsidiary of the Company.A report on the performance and financial position of each of the subsidiaries and associates companies as per the Companies Act, 2013 is provided as Annexure to this report and hence not repeated here for the sake of brevity. The Policy for determining material subsidiaries is available on Company’s website www.essar.com.
CONSOLIDATED FINANCIAL STATEMENTSIn accordance with the Companies Act, 2013 and Indian Accounting Standard (IND-AS) - 110 on Consolidated Financial Statements read with IND-AS - 28 on Accounting for Investments in Associates, the audited Consolidated Financial Statements are provided in the Annual Report. The audited Consolidated Financial Statements together with Auditors’ Report thereon form part of the Annual Report.
HUMAN RESOURCEYour Company believes that employee competence and motivation are necessary to achieve its business objectives. Your Company has undertaken many training initiatives to enhance technical and managerial competence of the employees and to further leverage their capabilities to enhance their performance. The Company has taken a series of initiatives to enhance emotional and intellectual engagement of employees. During the year under review, the Company held many employees engagement programs at the Company premises and outside. Families of employees were invited and attended these programs. The Company has policies on conduct, sexual harassment of women at workplace, whistle blower, corporate governance, insider trading etc. guiding the human assets of the Company. For the

7th ANNUAL REPORT 2016-17
11
year under review, there was no instance of the sexual harassment reported pursuant to the Sexual Harassment of Women at Workplace (Prevention, Prohibition and Redressal) Act, 2013.
DIRECTORSIn accordance with the provisions of the Companies Act, 2013 and the Article of Association of the Company, Mr. P K Srivastava retires by rotation at the ensuing Annual General Meeting and being eligible has offered himself for re-appointment. The Company has received requisite notice in writing from a member proposing Mr. P K Srivastava for appointment as Director.
In accordance with the provisions of section 149 and 152 of the Companies Act, 2013 and Rules made thereunder, Mr. N. Srinivasan and Capt. Bhupindar Singh Kumar, Independent Directors of the Company are completing their term at the ensuing Annual General Meeting, and are being proposed for the re-appointment.
The brief resume of the Director(s) being re-appointed, the nature of their expertise in specific functional areas, names of companies in which they hold directorships, their shareholding etc., are provided in the Notes to the Notice of the ensuing Annual General Meeting. Your Directors recommend their re-appointment at the ensuing Annual General Meeting.
The Company has received declarations from all the Independent Directors of the Company confirming that they meet with the criteria of independence as prescribed both under sub-section (6) of Section 149 of the Companies Act, 2013 and under Regulation 16 (b) (iv) of SEBI (LODR) Regulations, 2015.
The information on policy for performance evaluation of Independent Directors, Board, Committees and other individual directors; separate meeting of Independent Directors; familiarization programme for Independent Directors, etc. is provided under Corporate Governance Report annexed with this Report and the relevant policies are also available on the website of the Company www.essar.com.
BOARD MEETINGSDuring the year ended on March 31, 2017, Seven (7) meetings of the Board were held on May 25, 2016, June 23, 2016, September 08, 2016, September 22, 2016 December 13, 2016, February 14, 2017 and March 27, 2017.
DIRECTORS’ RESPONSIBILITY STATEMENTYour Directors state that:
(a) in the preparation of the annual accounts for the year ended March 31, 2017, the applicable accounting standards have been followed and there are no material departures from the same;
(b) the Directors have selected such accounting policies and applied them consistently and made judgments and estimates that are reasonable and prudent so as to give a true and fair view of the state of affairs of the Company as at March 31, 2017 and of the loss of the Company for the year ended on that date;
(c) the Directors have taken proper and sufficient care for the maintenance of adequate accounting records in accordance
with the provisions of the Companies Act, 2013 for safeguarding the assets of the Company and for preventing and detecting fraud and other irregularities;
(d) the Directors have prepared the annual accounts on a going concern basis. The Statutory Auditors have expressed an emphasis of matter on Going Concern in their Consolidated Audit Report relating to a stepdown subsidiary.
(e) the Directors have laid down internal financial controls followed by the Company and that such internal financial controls are adequate and were operating effectively as endorsed by Statutory Auditor in their separate report annexed to the Annual Report
(f) the Directors have devised proper systems to ensure compliance with the provisions of all applicable laws and that such systems were adequate and operating effectively.
RISK MANAGEMENTYour Company has a Risk Management Policy that outlines the framework and procedures to assess and mitigate the impact of risks, and to update the Board and the senior management on a periodical basis on the risk assessed, actions taken for mitigation and efficacy of mitigation measures. With efficient Risk Management Framework, your Company is able to manage:
(a) Economic Risks by entering into long term contracts with reputed global majors in each of its divisions thereby ensuring long term profitability of the Company and assured cash flows;
(b) Interest Rate Risk by undertaking suitable hedging strategies to overcome any adverse interest rate risks. It has formulated internal target rates at which any open interest rate risk can be hedged;
(c) Control over the operational matrix of various vessels to reduce cost and reduce downtime of vessels; and
(d) Control over various OPEX cost of the organization.
As per LODR, Regulation 2015, Compliance related with Risk Management Committee is required to be done by top 100 Companies as per list released by NSE, since our Company doesn’t fall in that category hence the Compliance of Risk Management was not needed but our Company do believe in mitigation/minimisation of risk therefore the management had put its best effort to minimise/mitigate the risk.
INTERNAL CONTROL SYSTEMS AND ITS ADEQUACYYour Company has a well-established framework of internal operational and financial controls, including suitable monitoring procedures systems which are adequate for the nature of its business and the size of its operations. The detailed report is given in Corporate Governance Report.
CORPORATE GOVERNANCEThe Company has complied with all mandatory provisions of SEBI (LODR) Regulations 2015, relating to Corporate Governance. A separate report on Corporate Governance as stipulated under the SEBI (LODR) Regulations, 2015 forms part of this Report. The requisite certificate from the Auditors of the Company regarding compliance with the conditions of corporate governance is attached to the report on Corporate Governance.

12
VIGIL MECHANISMThe Company has in compliance with Section 177 of the Companies Act, 2013 has established Vigil Mechanism by adopting the, ‘Whistle Blower Policy’, for Directors and Employees. The Whistle Blower Policy provides for adequate safeguards against victimization of persons who use such mechanism and have provision for direct access to the Chairperson of the Audit Committee in appropriate cases. A copy of the Whistle Blower Policy is available on the website of the Company www.essar.com.
CORPORATE SOCIAL RESPONSIBILITYThe Corporate Social Responsibility Committee comprises Captain B. S. Kumar – Chairman; Mr. Ranjit Singh; and Ms. Neelam Kapoor (Appointed w.e.f. July 31, 2017 in place of Ms. S Gayathri who has resigned on May 24, 2017).
Since the Company has incurred losses in proceeding three financial years hence it is not required to spend on CSR Activities.
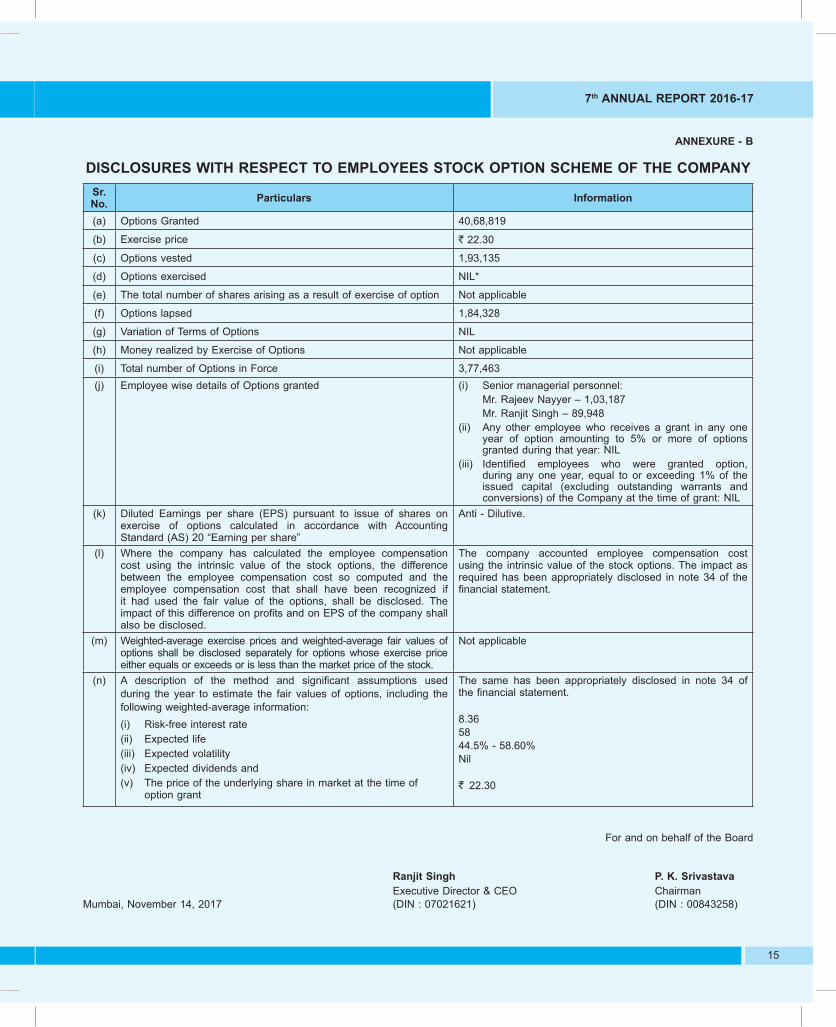
EMPLOYEE STOCK OPTION SCHEMEThe Company has implemented the “Essar Shipping Employees Stock Option Scheme-2011” (“Scheme”) in accordance with the Securities and Exchange Board of India (Employee Stock Option Scheme and Employee Stock Purchase Scheme) Guidelines, 1999 (“the SEBI Guidelines”). The Nomination and Remuneration Committee of the Board of Directors of the Company administers and monitors the Scheme. The applicable disclosures as stipulated under the SEBI Guidelines as at March 31, 2017 are provided in the Annexure - B to this Report.
AUDITORS Your Company’s Statutory Auditor, M/s. CNK & Associates LLP, (Registration No. 101961W) was appointed at 5th AGM of the Company for a period of 5 years.
The Board of Directors of the Company recommend M/s CNK & Associates LLP, Chartered Accountants, Mumbai, (Registration No.101961W) for ratification of re-appointment as Statutory Auditors of the Company by the Members at the ensuing Annual General Meeting. The Company has received letter from M/s CNK & Associates, Chartered Accountants, Mumbai to the effect that if their appointment is made, would be within the prescribed limits laid down under Section 141 (3)(g) of the Companies Act,2013 and they are not disqualified for such appointments under the provisions of applicable laws.
AUDITORS’ REPORT:Further with regard to the observations made in Annexure A to the Auditors’ Report, the management explanation is as under:
a) TDS & Service Tax dues:
The Company is making all efforts to clear outstanding statutory dues at earliest.
b) Regarding the dues to the Bank/FI/Debenture-holders
The Company is continuing its negotiation with lenders to refinance the existing loans with balance useful life of its asset, in view of depressed market conditions in the shipping industry.
The delay in repayment of instalments and Interest has been unavoidable due to cash flow mismatch and efforts are being made to avoid the recurrence thereof.
SECRETARIAL AUDITThe Board has appointed M/s. Martinho Ferrao & Associates, Practising Company Secretaries, to conduct Secretarial Audit for the financial year 2016-17. The Secretarial Audit Report for the financial year ended March 31, 2017 is annexed herewith marked as Annexure - C to this Report. The Secretarial Audit Report does not contain any qualification, reservation or adverse remark.
APPOINTMENT AND REMUNERATION POLICY FOR DIRECTORS AND SENIOR MANAGEMENTThe Board of Directors on recommendation of the Nomination & Remuneration Committee has adopted a policy for appointment of Directors, remuneration of Directors, Key Managerial Personnel and other employees. The brief details on the above are provided in Corporate Governance Report and the policy is available on the website of the Company www.essar.com. The details of remuneration as required to be disclosed pursuant to the Companies (Appointment and Remuneration of Managerial Personnel) Rules, 2014 are annexed as Annexure - D to this Report.
PARTICULARS OF EMPLOYEESIn terms of the provisions of Section 197(12) of the Companies Act, 2013 read with Rules 5(2) and 5(3) of the Companies (Appointment and Remuneration of Managerial Personnel) Rules, 2014, a statement showing the names and other particulars of the employees drawing remuneration in excess of the limits set out in the said rules together with disclosures pertaining to remuneration and other details as required under Section 197(12) of the Companies Act, 2013 read with Rule 5(1) of the Companies (Appointment and Remuneration of Managerial Personnel) Rules, 2014 are provided in the Annexure - E to this Report.
CONTRACTS AND ARRANGEMENTS WITH RELATED PARTIESAll contracts / arrangements / transactions entered by the Company during the financial year with related parties were in the ordinary course of business and on an arm’s length basis. During the year, the Company had entered into one or more contract / arrangement / transaction with Essar Steel India Limited, a Fellow Subsidiary which could be considered material in accordance with the policy of the Company on materiality of related party transactions.The Policy on materiality of related party transactions and dealing with related party transactions as approved by the Board may be accessed on the Company’s website www.essar.com. The information on each of the transactions with the related party as per the Companies Act, 2013 is provided in note 28 of notes forming part of the financial statement and hence not repeated. The disclosure required pursuant to clause (h) of sub-section (3) of Section 134 of the Companies Act, 2013 and Rule 8(2) of the Companies (Accounts) Rules, 2014 in Form AOC-2 is annexed herewith as Annexure - F to this Report.
7th ANNUAL REPORT 2016-17
13
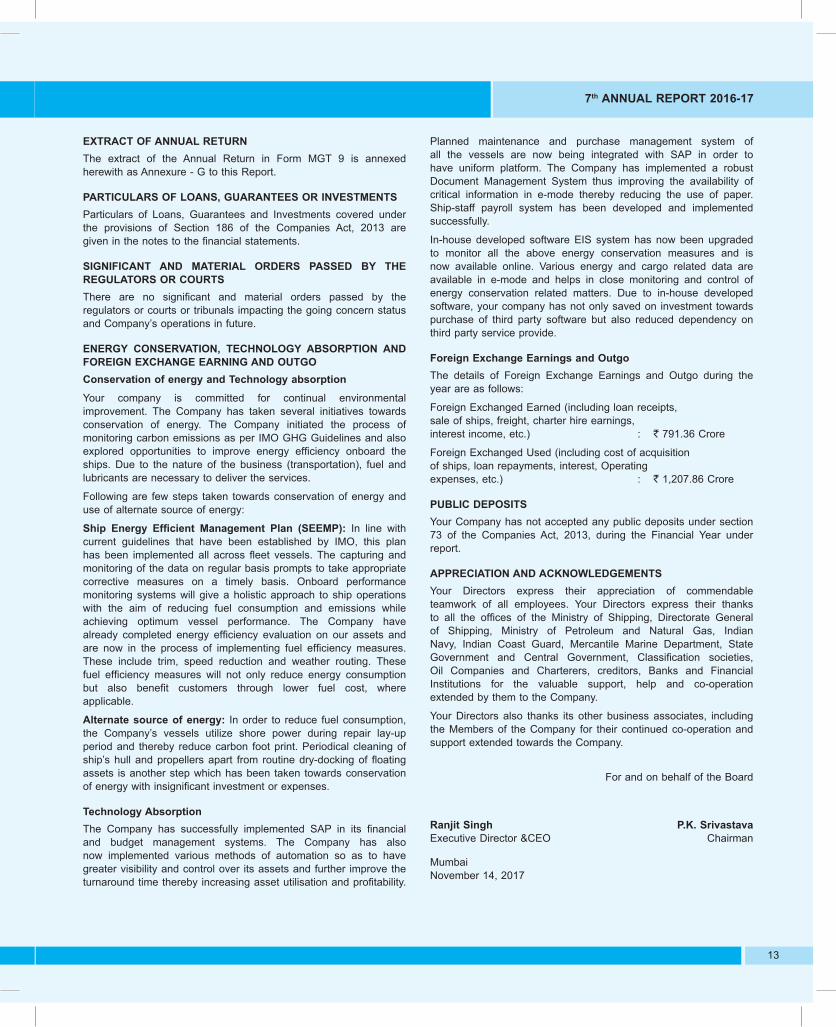
EXTRACT OF ANNUAL RETURNThe extract of the Annual Return in Form MGT 9 is annexed herewith as Annexure - G to this Report.
PARTICULARS OF LOANS, GUARANTEES OR INVESTMENTSParticulars of Loans, Guarantees and Investments covered under the provisions of Section 186 of the Companies Act, 2013 are given in the notes to the financial statements.
SIGNIFICANT AND MATERIAL ORDERS PASSED BY THE REGULATORS OR COURTSThere are no significant and material orders passed by the regulators or courts or tribunals impacting the going concern status and Company’s operations in future.
ENERGY CONSERVATION, TECHNOLOGY ABSORPTION AND FOREIGN EXCHANGE EARNING AND OUTGOConservation of energy and Technology absorption
Your company is committed for continual environmental improvement. The Company has taken several initiatives towards conservation of energy. The Company initiated the process of monitoring carbon emissions as per IMO GHG Guidelines and also explored opportunities to improve energy efficiency onboard the ships. Due to the nature of the business (transportation), fuel and lubricants are necessary to deliver the services.
Following are few steps taken towards conservation of energy and use of alternate source of energy:
Ship Energy Efficient Management Plan (SEEMP): In line with current guidelines that have been established by IMO, this plan has been implemented all across fleet vessels. The capturing and monitoring of the data on regular basis prompts to take appropriate corrective measures on a timely basis. Onboard performance monitoring systems will give a holistic approach to ship operations with the aim of reducing fuel consumption and emissions while achieving optimum vessel performance. The Company have already completed energy efficiency evaluation on our assets and are now in the process of implementing fuel efficiency measures. These include trim, speed reduction and weather routing. These fuel efficiency measures will not only reduce energy consumption but also benefit customers through lower fuel cost, where applicable.
Alternate source of energy: In order to reduce fuel consumption, the Company’s vessels utilize shore power during repair lay-up period and thereby reduce carbon foot print. Periodical cleaning of ship’s hull and propellers apart from routine dry-docking of floating assets is another step which has been taken towards conservation of energy with insignificant investment or expenses.
Technology AbsorptionThe Company has successfully implemented SAP in its financial and budget management systems. The Company has also now implemented various methods of automation so as to have greater visibility and control over its assets and further improve the turnaround time thereby increasing asset utilisation and profitability.
Planned maintenance and purchase management system of all the vessels are now being integrated with SAP in order to have uniform platform. The Company has implemented a robust Document Management System thus improving the availability of critical information in e-mode thereby reducing the use of paper. Ship-staff payroll system has been developed and implemented successfully.
In-house developed software EIS system has now been upgraded to monitor all the above energy conservation measures and is now available online. Various energy and cargo related data are available in e-mode and helps in close monitoring and control of energy conservation related matters. Due to in-house developed software, your company has not only saved on investment towards purchase of third party software but also reduced dependency on third party service provide.
Foreign Exchange Earnings and Outgo The details of Foreign Exchange Earnings and Outgo during the year are as follows:
Foreign Exchanged Earned (including loan receipts, sale of ships, freight, charter hire earnings, interest income, etc.) : ` 791.36 Crore
Foreign Exchanged Used (including cost of acquisition of ships, loan repayments, interest, Operating expenses, etc.) : ` 1,207.86 Crore
PUBLIC DEPOSITSYour Company has not accepted any public deposits under section 73 of the Companies Act, 2013, during the Financial Year under report.
APPRECIATION AND ACKNOWLEDGEMENTSYour Directors express their appreciation of commendable teamwork of all employees. Your Directors express their thanks to all the offices of the Ministry of Shipping, Directorate General of Shipping, Ministry of Petroleum and Natural Gas, Indian Navy, Indian Coast Guard, Mercantile Marine Department, State Government and Central Government, Classification societies, Oil Companies and Charterers, creditors, Banks and Financial Institutions for the valuable support, help and co-operation extended by them to the Company.
Your Directors also thanks its other business associates, including the Members of the Company for their continued co-operation and support extended towards the Company.
For and on behalf of the Board
Ranjit Singh P.K. SrivastavaExecutive Director &CEO Chairman
Mumbai November 14, 2017

14
ANNEXURE – A
ANNUAL REPORT ON CSR ACTIVITIES1. A brief outline of the Company’s CSR policy, including overview of projects or programs proposed to be undertaken and a reference to
the web-link to the CSR policy and projects or programs: Please refer relevant para in the main Report.
2. The Composition of the CSR Committee.
The Corporate Social Responsibility Committee comprises Captain B. S. Kumar – Chairman; Mr. Ranjit Singh; and Ms. Neelam Kapoor ( Appointed w.e.f. July 31, 2017 in the place of Ms. S. Gayathri**.)
**Ms. S. Gayathri ceased as Director of the Company w.e.f. May 24, 2017.
3. Average net profit of the Company for last three financial years : Net loss during last three years
4. Prescribed CSR Expenditure (two per cent. of the amount as in item 3 above) : Nil
5. Details of CSR spent during the financial year:
(a) Total amount to be spent for the financial year : Nil
(b) Amount unspent , if any : N.A.
(c) Manner in which the amount spent during the financial year is detailed below:
Sr. No
CSR project or activity identified
Sector In which the Project is covered
Projects or programs1. Local area or
other2. Specify the state
and district where projects or programs was undertaken
Amount outlay(budget)Project orPrograms wise
Amount spent on the projects or programsSub-heads:(1) Direct expenditure
on projects or programs
(2) Overheads
Cumulative expenditure upto the reporting period
Amount Spent: Direct or through implementing agency
---------Not Applicable---------
*Give details of Implementing Agency, if any.
6. Reasons for not spending the amount: Not Applicable
7. The Corporate Social Responsibility Committee hereby confirms that the implementation and monitoring of CSR Policy, is in compliance with CSR objectives and Policy of the Company.
Ranjit Singh Captain B. S. Kumar Executive Director & CEO Chairman CSR Committee (DIN: 07021621) (DIN: 00284649)
Mumbai, November 14, 2017
7th ANNUAL REPORT 2016-17
15
ANNEXURE - B
DISCLOSURES WITH RESPECT TO EMPLOYEES STOCK OPTION SCHEME OF THE COMPANYSr. No. Particulars Information
(a) Options Granted 40,68,819
(b) Exercise price ` 22.30
(c) Options vested 1,93,135
(d) Options exercised NIL*
(e) The total number of shares arising as a result of exercise of option Not applicable
(f) Options lapsed 1,84,328
(g) Variation of Terms of Options NIL
(h) Money realized by Exercise of Options Not applicable
(i) Total number of Options in Force 3,77,463 (j) Employee wise details of Options granted (i) Senior managerial personnel:
Mr. Rajeev Nayyer – 1,03,187 Mr. Ranjit Singh – 89,948 (ii) Any other employee who receives a grant in any one
year of option amounting to 5% or more of options granted during that year: NIL
(iii) Identified employees who were granted option, during any one year, equal to or exceeding 1% of the issued capital (excluding outstanding warrants and conversions) of the Company at the time of grant: NIL
(k) Diluted Earnings per share (EPS) pursuant to issue of shares on exercise of options calculated in accordance with Accounting Standard (AS) 20 “Earning per share”
Anti - Dilutive.
(l) Where the company has calculated the employee compensation cost using the intrinsic value of the stock options, the difference between the employee compensation cost so computed and the employee compensation cost that shall have been recognized if it had used the fair value of the options, shall be disclosed. The impact of this difference on profits and on EPS of the company shall also be disclosed.
The company accounted employee compensation cost using the intrinsic value of the stock options. The impact as required has been appropriately disclosed in note 34 of the financial statement.
(m) Weighted-average exercise prices and weighted-average fair values of options shall be disclosed separately for options whose exercise price either equals or exceeds or is less than the market price of the stock.
Not applicable
(n) A description of the method and significant assumptions used during the year to estimate the fair values of options, including the following weighted-average information:(i) Risk-free interest rate(ii) Expected life(iii) Expected volatility(iv) Expected dividends and(v) The price of the underlying share in market at the time of
option grant
The same has been appropriately disclosed in note 34 of the financial statement.
8.365844.5% - 58.60%Nil
` 22.30
For and on behalf of the Board
Ranjit Singh P. K. Srivastava Executive Director & CEO ChairmanMumbai, November 14, 2017 (DIN : 07021621) (DIN : 00843258)

16
ANNEXURE - C
SECRETARIAL AUDIT REPORTFOR THE FINANCIAL YEAR ENDED MARCH 31, 2017
[Pursuant to section 204(1) of the Companies Act, 2013 and rule No.9 of the Companies (Appointmentand Remuneration Personnel) Rules, 2014]
To,The Members,Essar Shipping Limited
We have conducted the secretarial audit of the compliance of applicable statutory provisions and the adherence to good corporate practices by Essar Shipping Limited (hereinafter called the Company). Secretarial Audit was conducted in a manner that provided us a reasonable basis for evaluating the corporate conducts/statutory compliances and expressing my opinion thereon.
Based on our verification of the Essar Shipping Limited books, papers, minute books, forms and returns filed and other records maintained by the company and also the information provided by the Company, its officers, agents and authorized representatives during the conduct of secretarial audit, we hereby report that in our opinion, the company has, during the audit period covering the financial year ended on 31st March, 2017, complied with the statutory provisions listed hereunder and also that the Company has proper Board-processes and compliance-mechanism in place to the extent, in the manner and subject to the reporting made hereinafter:
We have examined the books, papers, minute books, forms and returns filed and other records maintained by Essar Shipping Limited (“the Company”) for the financial year ended on 31st March, 2017 according to the provisions of:
(i) The Companies Act, 2013 (the Act) and the rules made thereunder;
(ii) The Securities Contracts (Regulation) Act, 1956 (‘SCRA’) and the rules made thereunder;
(iii) The Depositories Act, 1996 and the Regulations and Bye-laws framed thereunder;
(iv) Foreign Exchange Management Act, 1999 and the rules and regulations made thereunder to the extent of Foreign Direct Investment, Overseas Direct Investment and External Commercial Borrowings;
(v) The following Regulations and Guidelines prescribed under the Securities and Exchange Board of India Act, 1992 (‘SEBI Act’): --
a) The Securities and Exchange Board of India (Substantial Acquisition of Shares and Takeovers) Regulations, 2011;
b) The Securities and Exchange Board of India (Prohibition of Insider Trading) Regulations, 2015;
c) The Securities and Exchange Board of India (Issue of Capital and Disclosure Requirements)Regulations, 2009;
d) The Securities and Exchange Board of India (Share Based Employee Benefit)Regulation, 2014;
e) The Securities and Exchange Board of India (Issue and Listing of Debt Securities) Regulations, 2008;
f) The Securities and Exchange Board of India (Registrars to an Issue and Share Transfer Agents)Regulations, 1993 regarding the Companies Act and dealing with client; - Not applicable as the Company is not registered as Registrar to an issue and Share Transfer Agent during the financial year under review.
g) The Securities and Exchange Board of India (Delisting of Equity Shares) Regulations, 2009;and
h) The Securities and Exchange Board of India (Buyback of Securities) Regulations, 1998; - Not applicable as the Company has not bought back any of its securities during the financial year under review.
(vi) We have also examined the compliances of the provisions of the following other laws applicable specifically to the company wherein we have also relied on the compliance certificates issued by the head of the respective departments in addition to the checks carried out by us:
1. Merchant Shipping Act, 1958,
2. Seamen’s Provident Fund Act, 1966,
3. Multimodal Transportation of Goods Act, 1993,
4. Coasting Vessel Act, 1838,
5. Inland Vessels Act, 1917,
6. The Territorial Waters, Continental Shelf, Exclusive Economic Zone And Other Maritime Zones Act, 1976,

7th ANNUAL REPORT 2016-17
17
7. The Environment Protection Act, 1986,
8. The Indian Carriage of Goods by Sea Act, 1925,
9. The Sexual Harassment of Women at Workplace (Prevention, Prohibition and Redressal) Act, 2013 and Rules thereunder
We have also examined compliance with the applicable clauses of the following:
(i) Secretarial Standards issued by The Institute of Company Secretaries of India.
(ii) The Listing Agreements entered into by the Company with Bombay Stock Exchange and National Stock Exchange.
Based on our verification of the Company’s books, papers, minute books, forms and returns filed and other records maintained by the Company and also the information provided by the company, its officers, agents and its authorized representatives during the conduct of Secretarial Audit we hereby report that in our opinion during the period under review the Company has complied with the provisions of the Act, Rules, Regulations, Guidelines, Standards, etc. mentioned above.
We further report that:
1. The Board of Directors of the Company is duly constituted with proper balance of Executive Directors, Non-Executive Directors and Independent Directors. The changes in the composition of the Board of Directors that took place during the period under review were carried out in compliance with the provisions of the Act.
2. Adequate notice is given to all directors to schedule the Board Meetings, agenda and detailed notes on agenda were sent at least seven days in advance, and a system exists for seeking and obtaining further information and clarifications on the agenda items before the meeting and for meaningful participation at the meeting.
3. Unanimous decision is carried through at Board Meetings and the same are captured and recorded as part of the minutes.
We further report that during the period under audit the Company has shifted its registered office to EBTSL Premises, ER-2 Building (Admn. Building), Salaya 44 KM, P.B. No 7, Taluka Khambhalia, Devbhumi Dwarka Khambhalia, Jamnagar – 361305, Gujarat w.e.f. 14th February, 2017.
We further report that there are adequate systems and processes in the company commensurate with the size and operations of the company to monitor and ensure compliance with applicable laws, rules, regulations and guidelines.
We further report that during the audit period the Company has taken approval of shareholders in the AGM held on 10th August, 2016:
1. for Related Party Transactions.
2. for sale of upto 51% shares in Arkay Logistics Ltd. (Wholly owned subsidiary).
For MartinhoFerrao & AssociatesCompany Secretaries
Martinho FerraoProprietor
Place : Mumbai FCS No. 6221Dated : 2nd May, 2017 C P. No. 5676
This report is to be read with our letter which is annexed as Annexure A and forms an integral part of this report.
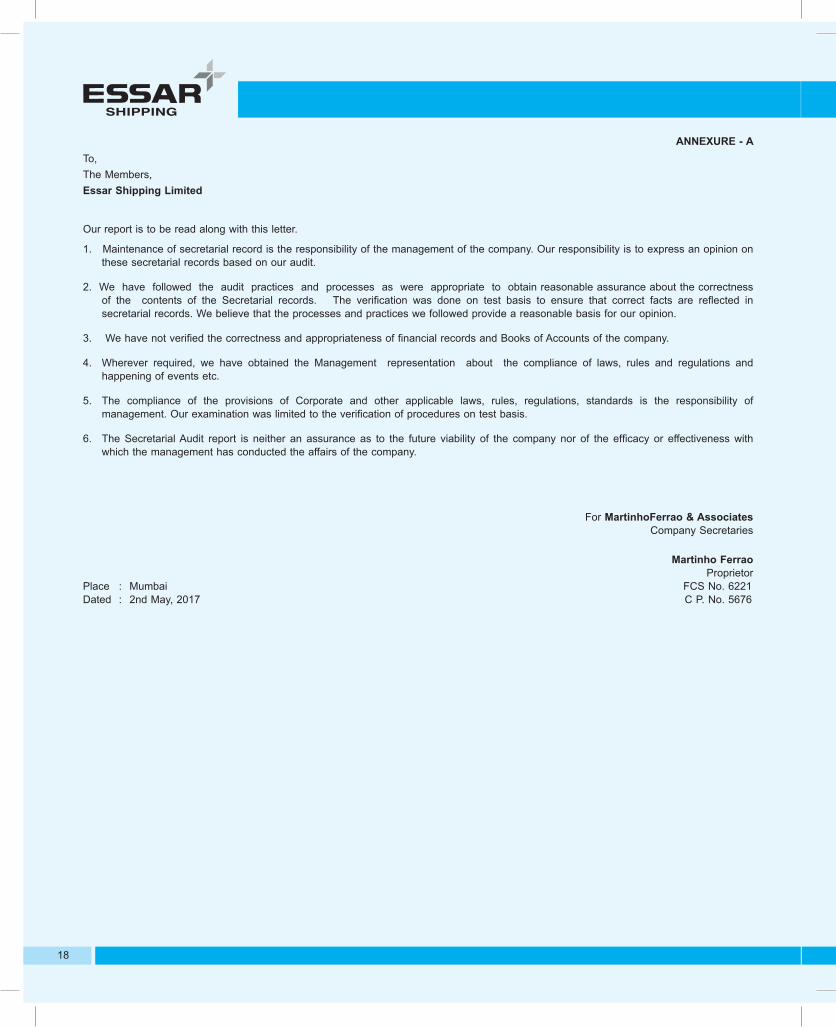
18
ANNEXURE - ATo,The Members,Essar Shipping Limited
Our report is to be read along with this letter.
1. Maintenance of secretarial record is the responsibility of the management of the company. Our responsibility is to express an opinion on these secretarial records based on our audit.
2. We have followed the audit practices and processes as were appropriate to obtain reasonable assurance about the correctness of the contents of the Secretarial records. The verification was done on test basis to ensure that correct facts are reflected in secretarial records. We believe that the processes and practices we followed provide a reasonable basis for our opinion.
3. We have not verified the correctness and appropriateness of financial records and Books of Accounts of the company.
4. Wherever required, we have obtained the Management representation about the compliance of laws, rules and regulations and happening of events etc.
5. The compliance of the provisions of Corporate and other applicable laws, rules, regulations, standards is the responsibility of management. Our examination was limited to the verification of procedures on test basis.
6. The Secretarial Audit report is neither an assurance as to the future viability of the company nor of the efficacy or effectiveness with which the management has conducted the affairs of the company.
For MartinhoFerrao & AssociatesCompany Secretaries
Martinho FerraoProprietor
Place : Mumbai FCS No. 6221Dated : 2nd May, 2017 C P. No. 5676

7th ANNUAL REPORT 2016-17
19
ANNEXURE - D
STATEMENT OF DISCLOSURE OF REMUNERATION UNDER SECTION 197 OF COMPANIES ACT, 2013 AND RULE 5(1) OF COMPANIES (APPOINTMENT AND REMUNERATION OF MANAGERIAL PERSONNEL) RULES, 2014.
1. Ratio of the remuneration of each Director to the median remuneration of the employees of the Company for the financial year 2016-17 and percentage increase in the remuneration of each Director and Key Managerial Personnel (KMP) during the financial year 2016 -17 are as follows:
Sr. No. Name of Director /KMP Designation
Ratio of remuneration of each Director to median
remuneration of employees
Percentage increase in remuneration
1 Mr. P. K. Srivastava Non-executive Chairman N.A.1 N.A. 1
2 *Capt. Anoop Kumar Sharma Managing Director 6.18:1 Nil3 **Ranjit Singh Executive Director & CEO 6.35:1 Nil4 Mr. N. Srinivasan Non-executive Director N.A. 1 N.A.1
5 Captain Bhupinder Singh Kumar Non-executive Director N.A. 1 N.A.1
6 Ms. S. Gayathri Non-executive Director N.A. 1 N.A. 1
7 Mr. Vikram Vinod Gupta Chief Financial Officer 4.18:1 Nil8 Mr. Awaneesh Srivastava Company Secretary 1.61:1 N.A.
* Resigned w.e.f. September 09, 2016
** Appointed as Executive Director & CEO with effect from September 22, 2016.1. During the year no remuneration was paid to Mr. P. K. Srivastava, Mr. N. Srinivasan, Captain Bhupinder Singh Kumar, and Ms.
S. Gayathri, however sitting fees was paid amounting to Rs. 4,30,000, Rs. 5,80,000, and Rs. 9,50,000 to Mr. P. K. Srivastava (Non-Executive Chairman), Mr. N. Srinivasan, Captain B. S. Kumar, (Independent Directors), respectively. No Sitting Fee was paid to Ms. S. Gayathri.
Notes: Considering the pattern of employment in the shipping business, the remuneration paid to members of the shipboard staff who have worked on board the Company’s ships for only a short period during the year have not been considered for the purpose of calculating median remuneration.
2. The percentage increase in the median remuneration of employees in the financial year 2016-17 was 7.0%.3. The Company had 50 employees excluding off-shore employees on the rolls of the Company as on March 31, 2017.4. Relationship between average increase in remuneration of employees and Company performance: The average increase in remuneration of employees was 7% during the financial year 2016-17. As per the performance evaluation policy of the Company, remuneration payable by the Company (including variable pay) is
linked to individual performance as well as performance of the Company. The performance of the Company is measured in terms of Revenue, EBITDA, PAT, Cash Accrual, Cost Control, Revenue
Sustainability, Safety, IT enablement, External Stakeholder Management, Risk Mitigation, Talent Management, CSR Initiatives, Industry Forums, and Adherence to regulatory requirements and Employee Engagement. The increase in remuneration of employees is in line with the performance of the Company and industry standards.
5. Comparison of remuneration of KMPs against the Company performance: The details of remuneration of KMPs have been elaborated in Form No. MGT 9 annexed to the Board Report. The average
increase in the remuneration of KMPs was 7% during the financial year 2016- 17.6. The Market Capitalization of the Company as on March 31, 2017 was 579.53 crore as compared to 518.48 crore as on March 31,
2016. The market price of the equity shares of the Company as on March 31, 2017 (closing) was Rs. 28.00 per share on Bombay Stock Exchange and was Rs. 28.00 per share on National Stock Exchange.
7. The key parameters for variable component of remuneration availed by the Directors:a. Performance of the Company as against Annual Business Plan.b. Individual Performance as per KPI measures in Balanced Score Card set in the beginning of year.
8. The ratio of remuneration of the highest paid Director to that of the employees who are not Directors but receive remuneration in excess of the highest paid Director during the year: Not applicable.
9. The Board of Directors hereby affirms that the remuneration is as per the remuneration policy of the Company.10. The statement pursuant to Rule (5)(2) is enclosed.
For and on behalf of the Board Ranjit Singh P. K. Srivastava (DIN : 07021621) (DIN : 00843258) Mumbai, November 14, 2017 Executive Director & CEO Chairman

20
ANNEXURE – E
STATEMENT OF PARTICULARS OF EMPLOYEES PURSUANT TO PROVISIONS OF SECTION 197(12) OF THE COMPANIES ACT 2013 READ WITH COMPANIES (APPOINTMENT AND REMUNERATION OF MANAGERIAL PERSONNEL) RULES, 2014
Name Age (Years) Qualification Designation
Date of Commencement of employment
Experience (Years)
Gross Remuneration
Previous Employment
Mr. Ranjit Singh* 56 Class I (Motor) Executive Director & CEO
02-May-2008 30 1,16,35,910 Qatar Shipping Co.
Mr. Vikram Gupta 39 B. Com.; MMS Chief Financial Officer
03-June-2002 15 76,09,712 N.A.
** Capt. Rahul Bhargava
57 Master Mariner Director- Commercial & Operations
11-Sep-2012 36 73,16,415 JSW Steel Ltd
Capt. Abhishek Arora 39 Master F.G. Master 04-March-1998 19 52,65,000 N.A.
Mr. Debasish Dey Biswas
61 M.E.O. Class 1 Chief Engineer 06-Dec-2012 20 52,00,000 Global Offshore Services
Mr. Arun Bhardwaj 56 Masters’ Equivalent Head-Safety, Quality & Corp. Relations
01-June-2004 30 50,49,204 Ind-Aust Maritime Pvt. Ltd.
Capt. Anup Mukherjee 61 Master F.G. Master 20-Jan-2012 25 50,44,000 N.A.
Capt. Piyush Khare 46 Master F.G. Master 24-Jan-2013 25 50,00,000 N.A.
Mr. R. Jagannathan 63 B.Com Head-Accounts 21-January-1976 42 47,20,000 N.A.
Mr. Balwant Singh 73 MEO Class 1 Chief Engineer 01-April-2015 30 46,40,000 Beacon Marine
*Appointed as ED & CEO w.e.f. September 22, 2016 (Salary is taken for entire year)** Appointed as Director w.e.f. November 14, 2017
1. No employee of the Company holds by himself/herself or along with his/her spouse and dependent children, not less than two percent of the equity shares of the Company.
2. No employee of the Company is a relative of any Director or Manager of the Company.
For and on behalf of the Board
Ranjit Singh P. K. Srivastava Executive Director & CEO ChairmanMumbai, November 14 , 2017 (DIN : 07021621) (DIN : 00843258)

7th ANNUAL REPORT 2016-17
21
ANNEXURE – F
Form No. AOC – 2(Pursuant to clause (h) of sub-section (3) of section 134 of the Act and Rule 8(2) of the Companies (Accounts) Rules, 2014)
Form for disclosure of particulars of contacts/arrangements entered into by the company with related parties referred to in sub-section (1) of section 188 of the Companies Act, 2013 including certain arms length transactions under third proviso thereto.1. Details of contacts or arrangements or transactions not at arm’s length basis:
Sr. No.
Name(s) of the related party and nature of relationship
Nature of contracts/
arrangements / transactions
Duration of the contracts/ arrangements/ transactions
Salient features of the contracts or arrangements or
transactions including the value, if any
Justification for entering into
such contracts or arrangements or
transactions
Date(s) of approval by the
Board
Amount paid as
advances, if any
Date on which the special resolution
was passed in general meeting as required undue first provisio to section
188NIL
2. Details of material contracts or arrangement or transactions at arm’s length basis:
Sr. No.
Name(s) of the related party
Nature of relationship
Nature of contracts/ arrangements/ transactions
Duration of the contracts/
arrangements / transactions
Salient terms of the contracts or arrangements or
transactions including the value, if any (` In
crore)
Date(s) of approval by the
Board, if any
Amount paid as advances,
if any
(` In crore)
1 Essar Oil Limited Fellow Subsidiary
Purchase of Fuel Oil 4.96 Nil
Aircraft usage charges 8.33
Interest on ICD 35.23 May 25, 2016
2 Essar Shipping (Cyprus) Limited
Fellow Subsidiary
Direct voyage expenses 88.61
3 Essar Steel India Limited
Fellow Subsidiary
Contract of Affreightment for 5 years for transportation of raw material and finished goods of Essar Steel India Limited resulting into fleet operating and chartering earnings of the Company.
COA Contract for 5 years and also on Spot fixture basis.
Freight for transportation of raw material and finished goods as per COA; and Spot fixture basis. Total Value: 387.08
July 04, 2011
Nov 09, 2011
May 21, 2015
Nil
Interest on Inter – Corporate Deposit
One Year, 13.98 – –
Inter – Corporate Deposit
One Year Inter Corporate Deposit of ` 114.41
In Board Meeting of respective
quarter
4 Arkay Logistics Limited*
Associate Logistics Service Spot 72.64 – –
*was subsidiary of ESL upto March 10, 2017
For and on behalf of the Board
Mr. Ranjit Singh P. K. Srivastava Executive Director & CEO ChairmanMumbai, November 14, 2017 (DIN : 07021621) (DIN : 00843258)
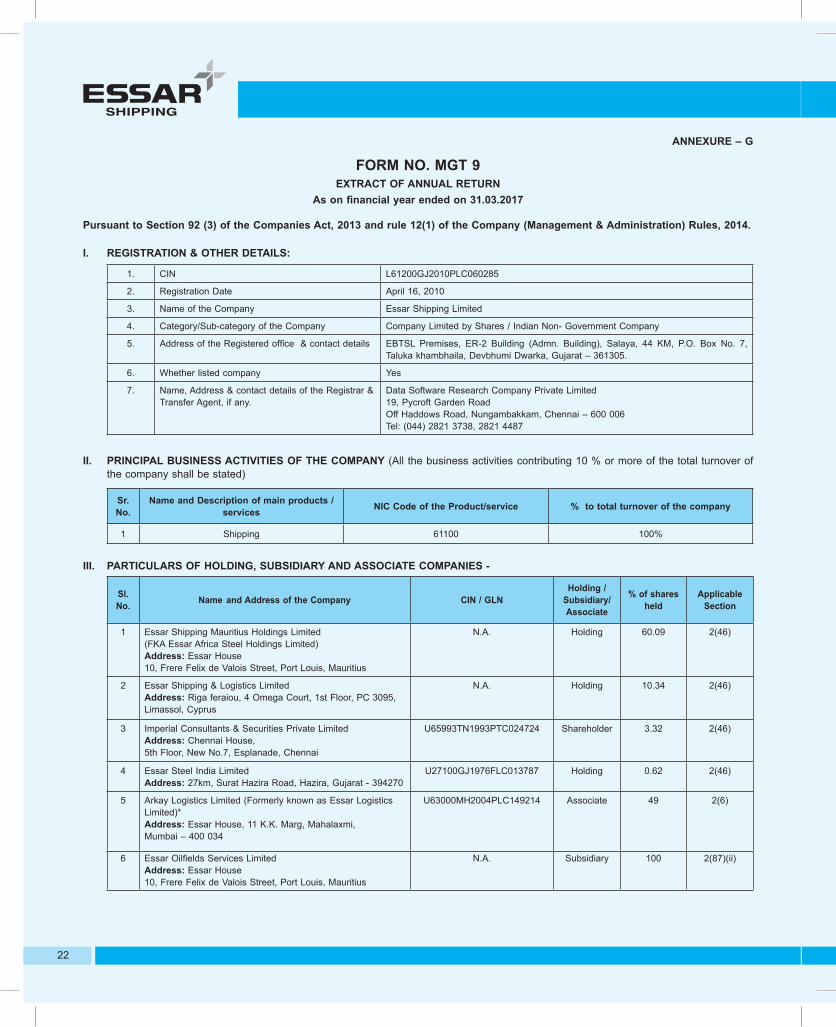
22
ANNEXURE – G
FORM NO. MGT 9EXTRACT OF ANNUAL RETURN
As on financial year ended on 31.03.2017
Pursuant to Section 92 (3) of the Companies Act, 2013 and rule 12(1) of the Company (Management & Administration) Rules, 2014.
I. REGISTRATION & OTHER DETAILS:
1. CIN L61200GJ2010PLC060285
2. Registration Date April 16, 2010
3. Name of the Company Essar Shipping Limited
4. Category/Sub-category of the Company Company Limited by Shares / Indian Non- Government Company
5. Address of the Registered office & contact details EBTSL Premises, ER-2 Building (Admn. Building), Salaya, 44 KM, P.O. Box No. 7, Taluka khambhaila, Devbhumi Dwarka, Gujarat – 361305.
6. Whether listed company Yes
7. Name, Address & contact details of the Registrar & Transfer Agent, if any.
Data Software Research Company Private Limited19, Pycroft Garden RoadOff Haddows Road, Nungambakkam, Chennai – 600 006Tel: (044) 2821 3738, 2821 4487
II. PRINCIPAL BUSINESS ACTIVITIES OF THE COMPANY (All the business activities contributing 10 % or more of the total turnover of the company shall be stated)
Sr. No.
Name and Description of main products / services NIC Code of the Product/service % to total turnover of the company
1 Shipping 61100 100%
III. PARTICULARS OF HOLDING, SUBSIDIARY AND ASSOCIATE COMPANIES -
Sl. No. Name and Address of the Company CIN / GLN
Holding / Subsidiary/ Associate
% of shares held
Applicable Section
1 Essar Shipping Mauritius Holdings Limited(FKA Essar Africa Steel Holdings Limited)Address: Essar House10, Frere Felix de Valois Street, Port Louis, Mauritius
N.A. Holding 60.09 2(46)
2 Essar Shipping & Logistics LimitedAddress: Riga feraiou, 4 Omega Court, 1st Floor, PC 3095, Limassol, Cyprus
N.A. Holding 10.34 2(46)
3 Imperial Consultants & Securities Private LimitedAddress: Chennai House,5th Floor, New No.7, Esplanade, Chennai
U65993TN1993PTC024724 Shareholder 3.32 2(46)
4 Essar Steel India LimitedAddress: 27km, Surat Hazira Road, Hazira, Gujarat - 394270
U27100GJ1976FLC013787 Holding 0.62 2(46)
5 Arkay Logistics Limited (Formerly known as Essar Logistics Limited)*Address: Essar House, 11 K.K. Marg, Mahalaxmi, Mumbai – 400 034
U63000MH2004PLC149214 Associate 49 2(6)
6 Essar Oilfields Services LimitedAddress: Essar House10, Frere Felix de Valois Street, Port Louis, Mauritius
N.A. Subsidiary 100 2(87)(ii)

7th ANNUAL REPORT 2016-17
23
Sl. No. Name and Address of the Company CIN / GLN
Holding / Subsidiary/ Associate
% of shares held
Applicable Section
7 Essar Oilfields Services India LimitedAddress: Essar House, 11 K.K. Marg, Mahalaxmi, Mumbai – 400 034
U93090MH2006PLC163779 Subsidiary 100 2(87)(ii)
8 Energy Transportation International LimitedAddress: Clarendon House2 Church Street Hamilton HM 11, Bermuda
N.A. Subsidiary 100 2(87)(ii)
9 Energy II LimitedAddress: Clarendon House2 Church Street, Hamilton HM 11 Bermuda
N.A. Subsidiary 100 2(87)(ii)
10 Essar Shipping DMCCAddress: Unit No: 30-01-1903Jewellery & Gemplex 3, Plot No: DMCC – PH2- J&GPlexSJewellery & Gemplex, Dubai, United Arab Emirates
N.A. Subsidiary 100 2(87)(ii)
11 Cosmic Drilling Services LimitedAddress: Essar House10, Frere Felix de Valois Street, Port Louis, Mauritius
N.A, Subsidiary 100 2(87)(ii)
12 Essar Oilfields Middle East DMCCAddress: Unit No: 30-01-1903Jewellery & Gemplex 3, Plot No: DMCC – PH2- J&GPlexSJewellery & Gemplex, Dubai, United Arab Emirates
N.A. Subsidiary 100 2(87)(ii)
13 Varada Drilling One Pte LimitedAddress: 50 Collyer Quay,#09-01 OUE Bayfront, Singapore 049321
N.A. Associate 28.57% 2(6)
14 Varada Drilling Two Pte LimitedAddress: 50 Collyer Quay,#09-01 OUE Bayfront, Singapore 049321
N.A. Associate 28.57% 2(6)
15 Starbit Oilfields Services India LimitedAddress: Essar House, 11, K. K. Marg, Mahalaxmi, Mumbai - 400 034.
U11200MH2016PLC280188 Subsidiary 100% 2(87)(ii)
*ceased as subsidiary w.e.f. March 10, 2017.
VI. SHARE HOLDING PATTERN (Equity Share Capital Breakup as percentage of Total Equity) Category-wise Share Holding
Category of Shareholders
No. of Shares held at the beginning of the year [As on 31-March-2016]
No. of Shares held at the end of the year [As on 31-March-2017] % Change
during the yearDemat Physical Total % of Total
Shares Demat Physical Total % of Total Shares
A. Promoters(1) Indian a) Individual/ HUF 0.00 0.00 0.00 0.00 0.00 0.00 0.00 0.00 0.00 b) Central Govt 0.00 0.00 0.00 0.00 0.00 0.00 0.00 0.00 0.00 c) State Govt(s) 0.00 0.00 0.00 0.00 0.00 0.00 0.00 0.00 0.00 d) Bodies Corp. 8,152,020 0.00 8,152,020 3.94 8,152,020 0.00 8,152,020 3.94 0.00 e) Banks / FI 0.00 0.00 0.00 0.00 0.00 0.00 0.00 0.00 0.00 f) Any other 0.00 0.00 0.00 0.00 0.00 0.00 0.00 0.00 0.00 Sub – total (A)(1):- 8,152,020 0.00 8,152,020 3.94 8,152,020 0.00 8,152,020 3.94 0.00(2) Foreign a) NRIs - Individuals 0.00 0.00 0.00 0.00 0.00 0.00 0.00 0.00 0.00 b) Other – Individuals 0.00 0.00 0.00 0.00 0.00 0.00 0.00 0.00 0.00 c) Bodies Corp. 14,57,68,806 0.00 14,57,68,806 70.43 14,57,68,806 0.00 14,57,68,806 70.43 0.00 d) Banks/FI 0.00 0.00 0.00 0.00 0.00 0.00 0.00 0.00 0.00 e) Any other 0.00 0.00 0.00 0.00 0.00 0.00 0.00 0.00 0.00 Sub-total (A)(2):- 14,57,68,806 0.00 14,57,68,806 70.43 14,57,68,806 0.00 14,57,68,806 70.43 0.00Total shareholding of Promoter (A) = (A)(1)+(A)(2) 153920826 0.00 153920826 74.37 153920826 0.00 153920826 74.37 0.00

24
Category of Shareholders
No. of Shares held at the beginning of the year [As on 31-March-2016]
No. of Shares held at the end of the year [As on 31-March-2017] % Change
during the yearDemat Physical Total % of Total
Shares Demat Physical Total % of Total Shares
B. Public Shareholding
1. Institutions
a) Mutual Funds 1657 16028 17685 0.01 1657 16028 17685 0.01 0.00
b) Banks / FI 1701 24426 26127 0.01 1354 24426 25780 0.01 1.32
c) Central Govt 0.00 0.00 0.00 0.00 0.00 0.00 0.00 0.00 0.00
d) State Govt(s) 0.00 0.00 0.00 0.00 0.00 0.00 0.00 0.00 0.00
e) Venture Capital Funds 0.00 0.00 0.00 0.00 0.00 0.00 0.00 0.00 0.00
f) Insurance Companies 120092 16 120108 0.05 120092 16 120108 0.06 0.00
g) FIIs 20069547 6152 20075699 9.69 8509450 6152 8515602 4.11 57.58
h) Foreign Venture Capital Funds
0.00 0.00 0.00 0.00 0.00 0.00 0.00 0.00 0.00
i) Others (specify) 0.00 0.00 0.00 0.00 0.00 0.00 0.00 0.00 0.00
Sub-total (B)(1):- 20192997 46622 20239619 9.76 8632533 46622 8679175 4.19 57.12
2. Non-Institutions
a) Bodies Corp. 11526894 45147 11572041 5.59 23385976 45126 23431102 11.32 102.48
i) Indian
ii) Overseas
b) Individuals
i) Individual shareholders holding nominal share capital upto ` 2 lakh 7978450 2339720 10318170 5.00 8107280 2288887 10396167 5.02 0.76
ii) Individual shareholders holding nominal share capital in excess of ` 2 lakh 8518182 0 8518182 3.03 8155800 0 8155800 3.94 4.25
c) Others (specify) 0.00 0.00 0.00 0.00 0.00 0.00 0.00 0.00 0.00
Non Resident Indians 594632 64298 658930 0.32 719388 63517 782905 0.38 18.81
Sub-total (B)(2):- 28618158 2449165 31067323 15.03 40368444 2397530 42765974 20.66 37.66
Total Public Shareholding (B)=(B)(1)+ (B)(2) 48811155 2495787 51306942 24.79 49000997 2444152 51445149 24.86 0.07
C. Shares held by Non-Promoter – Non – Public Shareholder
0.00 0.00 0.00 0.00 0.00 0.00 0.00 0.00 0.00
a) Custodian/DR Holder 0.00 0.00 0.00 0.00 0.00 0.00 0.00 0.00 0.00
b) Employee Benefit Trust [under SEBI (Share based Employee Benefit) Regulations, 2014
1748304 0.00 1748304 0.84 1610097 0.00 1610097 0.78 0.06
Total Non-Promoter – Non – Public Shareholding (C)
1748304 0.00 1748304 0.84 1610097 0.00 1610097 0.78 0.06
Grand Total (A+B+C) 204480285 2495787 206976072 100.00 204531920 2444152 206976072 100.00 0.1

7th ANNUAL REPORT 2016-17
25
B) Shareholding of Promoter
Sr. No. Shareholder’s Name
Shareholding at the beginning of the year Shareholding at the end of the year% change in share-holding
during the year
No. of Shares
% of total Shares of the
company
%of Shares Pledged /
encumbered to total shares
No. of Shares
% of total Shares of the
company
%of Shares Pledged /
encumbered to total shares
1 Essar Shipping Mauritius Holdings Limited (earlier known as Essar Africa Steel Holdings Limited) 0.00 0.00 0.00 124362408 60.09 100.00 100.00
2 Essar Steel India Limited 1273611 0.62 100.00 1273611 0.62 100.00 0.003 Imperial Consultants & Securities
Private Limited 6878409 3.35 99.01 6878409 3.32 99.010.00
4 Essar Shipping & Logistics Limited 21406365 10.43 100.00 21406365 10.34 100.00 0.005 Essar Ports & Shipping Limited 124362408 60.09 100.00 33 0.00 0.00 100.006 Essar Global Fund Limited 33 0.00 0.00 0.00 0.00 0.00 0.00
Total 153920826 74.49 99.96 153920826 74.37 99.96 0.00
C) Change in Promoters’ Shareholding (please specify, if there is no change)
Sr. No. Particulars
Shareholding at the beginning of the year (As on March 31,
2016)
Date wise Increase /
Decrease in Promoters
Shareholding during the year
Reasons for increase /
decrease (e.g. allotment /transfer /
bonus/ sweat equity etc.):
Shareholding at the end of the year (as on March 31,
2017)Cumulative Shareholding
during the year
No. of shares% of total
shares of thecompany
No. of shares
% of totalshares of the
companyNo. of shares
% of totalshares of the
company1 Essar Ports &
Shipping Limited 124362408 60.09(124362408) on
20.10.2016 Inter se transfer 33 0.00 0.00 0.00
33 on 03.03.2017 Bought 33 0.002 Essar Shipping &
Mauritius Holdings Limited (earlier known as Essar Africa Steel Holdings Limited)
0.00 0.00 124362408 on 20.10.2016 Inter se transfer 124362408 60.09 124362408 60.09
3 Essar Global Fund Limited 33 0.00 (33) on
03.03.2017 Inter se transfer 0 0.00 0.00 0.00
D) Shareholding Pattern of top ten Shareholders (Other than Directors, Promoters and Holders of GDRs and ADRs):
Sr. No.
For Each of the Top 10Shareholders
Shareholding at the beginningof the year(1-04-2016)/end of the year (31-03-2017) Date wise Increase/
Decrease in Shareholding
during the year
Reasons for increase/
decrease( e.g. allotment/ transfer/
bonus/ sweat equity etc):
Cumulative Shareholding during the Year
No. of shares as on April 01, 2016
% of totalshares of thecompany as on April 01,
2016
No. of Shares as on March 31, 2017
% of totalshares of thecompany, as on March 31,
2017
No. of shares% of total
shares of thecompany
1 India opportunities Growth fund Ltd 6427119 3.11 6427119 3.11 0.00 0.00 6427119 3.11
2 Leena V. Modi 3537000 1.71 3537000 1.71 0.00 0.00 3537000 1.713 Puran Associates Pvt Ltd 00 0.00 2849002 1.38 1200000 Bought 1200000 0.58
1347084 Bought 2547084 1.23111000 Bought 2658084 1.28100000 Bought 2758084 1.33
66668 Bought 2824752 1.3624250 Bought 2849002 1.38
4 VIC Enterprises Pvt Ltd 00 0.00 2848999 1.38 1200000 Bought 1200000 0.581347083 Bought 2547083 1.23
111000 Bought 2658083 1.28100000 Bought 2758083 1.33
66666 Bought 2824749 1.3624250 Bought 2848999 1.38

26
Sr. No.
For Each of the Top 10Shareholders
Shareholding at the beginningof the year(1-04-2016)/end of the year (31-03-2017) Date wise Increase/
Decrease in Shareholding
during the year
Reasons for increase/
decrease( e.g. allotment/ transfer/
bonus/ sweat equity etc):
Cumulative Shareholding during the Year
No. of shares as on April 01, 2016
% of totalshares of thecompany as on April 01,
2016
No. of Shares as on March 31, 2017
% of totalshares of thecompany, as on March 31,
2017
No. of shares% of total
shares of thecompany
5 M B Finmart Pvt Ltd 00 0.00 2843999 1.37 1200000 Bought 1200000 0.581333333 Bought 2533333 1.22
111000 Bought 2644333 1.28100000 Bought 2744333 1.32
39316 Bought 2783649 1.3427350 Bought 2810999 1.3533000 Bought 2843999 1.37
6 India Capital Markets Pvt Ltd 2750000 1.33 2750000 1.33 0.00 - 0.00 0.00
7 Kredence Multi Trading Limited 2675179 1.29 2675179 1.29 0.00 - 0.00 0.00
8 Vistra ITCL India Limited 1748304 0.84 1610097 0.78 138207 Sold 1610097 0.789 Globe Capital Market Ltd 1148446 0.55 1527345 0.74 24375 Bought 1172821 0.57
56802 Bought 1229623 0.59409704 Bought 1639327 0.79
24482 Bought 1663809 0.8026292 Bought 1690101 0.8147056 Bought 1737157 0.8391208 Bought 1828365 0.8837530 Bought 1865895 0.90
248744 Bought 2114639 1.025133 Bought 2119772 1.02
491514 Sold 1628258 0.79137205 Sold 1491053 0.72260238 Bought 1751291 0.84
74582 Sold 1676709 0.811799 Bought 1678508 0.81
11828 Sold 1666680 0.80139335 Sold 1527345 0.74
10 Corum Securities Pvt Ltd 2600000 1.26 1500000 0.73 2600000 Sold 00 0.001000000 Bought 1000000 0.48
500000 Bought 1500000 0.73
E) Shareholding of Directors and Key Managerial Personnel:None of the Directors and/or Key Managerial Personnel hold any share of the Company at the beginning, during or end of the year under review.
V) INDEBTEDNESS - Indebtedness of the Company including interest outstanding/accrued but not due for payment.
(Amount ` in crore)
Secured Loans excluding deposits
Unsecured Loans Deposits Total
Indebtedness
Indebtedness at the beginning of the financial yeari) Principal Amount 1,884.59 1,952.38 0 3,836.97
ii) Interest due but not paid 227.21 6.24 0 233.45
iii) Interest accrued but not due 6.49 24.14 0 30.63

7th ANNUAL REPORT 2016-17
27
Secured Loans excluding deposits
Unsecured Loans Deposits Total
Indebtedness
Total (i+ii+iii) 2,118.29 1,982.76 0 4,101.05
Change in Indebtedness during the financial year
* Addition 18.57 823.57 0 842.14
*Exchange difference 118.67 48.25 0 166.92* Reduction (425.99) (402.19) 0 (828.17)Net Change (288.75) 469.63 0 180.88Indebtedness at the end of the financial yeari) Principal Amount 1,467.59 2,388.86 0 3,856.46ii) Interest due but not paid 296.31 60.76 0 357.07iii) Interest accrued but not due 65.64 2.77 0 68.41 Total (i+ii+iii) 1,829.54 2,452.39 0 4,281.94
VI. REMUNERATION OF DIRECTORS AND KEY MANAGERIAL PERSONNEL-A. Remuneration to Managing Director, Whole-time Directors and/or Manager:
Sr. No.. Particulars of Remuneration
Name of MD/WTD/ED/Manager Total AmountRanjit Singh* - - -
1 Gross salary 49,16,670 - - - 49,16,670(a) Salary as per provisions contained in
section 17(1) of the Income-tax Act, 1961 - - - - -(b) Value of perquisites u/s 17(2) Income-tax
Act, 1961 - - - - -(c) Profits in lieu of salary under section 17(3)
Income- tax Act, 1961 - - - - -2 Stock Option - - - - -3 Sweat Equity - - - - -4 Commission
- as % of profit - others, specify… - - - - -
5 Others, please specify - - - - -Total (A) 49,16,670 - - - 49,16,670Ceiling as per the Act
* Appointment w.e.f 22 September, 2016
B. Remuneration to other directors
Sr. No.
Particulars of Remuneration Name of Directors Total Amount
1. Independent Directors Mr. N. Srinivasan Capt. B. S. KumarFee for attending board committee meetings
5,80,000 9,50,000 - 15,30,000
Commission - - - - -Others, please specify - - - - -Total (1) - 5,80,000 9,50,000 - 15,30,000

28
2. Other Non-Executive Directors
Mr. P. K. Srivastava Ms. S. Gayathri
Fee for attending board committee meetings 4,30,000 - - - 4,30,00Commission - - - - -Others, please specify - - - - -Total (2) 4,30,000 - - - 4,30,000Total (B)=(1+2) 4,30,000 5,80,000 9,50,0000 - 19,60,000Total ManagerialRemunerationOverall Ceiling as per the Act
Only Sitting fees is paid to Independent Directors
C. REMUNERATION TO KEY MANAGERIAL PERSONNEL OTHER THAN MD/MANAGER/WTD
Sr. No. Particulars of Remuneration
Key Managerial Personnel
MD/CEO* CS CFO Total1 Gross salary 49,16,670 29,45,563 76,09,712 1,54,71,945
(a) Salary as per provisions contained in section 17(1) of the Income-tax Act, 1961 49,16,670 29,45,563 76,09,712 1,54,71,945
(b) Value of perquisites u/s 17(2) Income-tax Act, 1961 Nil Nil Nil Nil
(c) Profits in lieu of salary under section 17(3) Income-tax Act, 1961 Nil Nil Nil Nil
2 Stock Option During the year Nil During the year Nil During the year Nil During the year Nil3 Sweat Equity During the year Nil During the year Nil During the year Nil During the year Nil4 Commission During the year Nil During the year Nil During the year Nil During the year Nil
- as % of profit During the year Nil During the year Nil During the year Nil During the year Nilothers, specify… During the year Nil During the year Nil During the year Nil During the year Nil
5 Others, please specify During the year Nil During the year Nil During the year Nil During the year NilTotal 49,16,670 29,45,563 76,09,712 1,54,71,945
* Appointed as Executive Director & CEO w.e.f September 22, 2016.
VII. PENALTIES / PUNISHMENT/ COMPOUNDING OF OFFENCESThere were no penalties/ punishment / compounding of offences imposed on the Company or any of the Directors or officers of the Company in the year under review.
For and on behalf of the Board
Ranjit Singh P. K. Srivastava Executive Director & CEO ChairmanMumbai, November 14, 2017 (DIN : 07021621) (DIN : 00843258)

7th ANNUAL REPORT 2016-17
29
ANNEXURE – H
Financial information of subsidiary companiesStatement pursuant to Section 129(3) of the Companies Act, 2013 related to subsidiary companies for the year ended 31 March 2017 are as follows:
(Rupees in crores except currency rates)
Particulars
Arkay Logistics Limited,
Mumbai up to 10 March
2017*
Energy Transportation International
Limited, Bermuda
Energy II Limited
Bermuda
Essar Oilfields Services Limited,
Mauritius
Essar Oilfields Services
India Limited, Mumbai
Essar Shipping
DMCC, Dubai
Reporting period for the subsidiary
31st March,2017
31st March,2017
31st March,2017
31st March,2017
31st March,2017
31st March,2017
Reporting currency INR US$ US$ US$ INR US$
Exchange rate as on the last date of the Financial year 64.8386 64.8386 64.8386 64.8386
Share capital (including share application money pending allotment) 85.76 264.83 1,094.68 968.53 242.13
Reserves & Surplus (132.13) 116.53 (1,116.09) (652.76) 20.23
Total assets 206.33 440.16 2,934.91 2,272.09 797.52
Total liabilities - 206.33 440.16 2,934.91 2,272.09 797.52
Details of investments (except investments in subsidiaries) 62.54
Turnover 1,233.36 72.70 296.54 39.55 105.03 45.03
Profit / (loss) before taxation 98.95 12.99 40.75 (883.71) (99.47) 18.50
Provision for taxation (34.91) - - (0.29)
Profit / (loss) after taxation 64.04 12.99 40.75 (884.00) (99.47) 18.50
% of shareholding 100% 100% 100% 100% 100% 100%
* On 10th March 2017, the Company sold a 51% stake in Arkay Logistics Limited to Imperial Consultants & Securities for a consideration of ` 155 crores, a premium of ` 117.77 crores over the cost of the investment. Therefore, only profit and loss account related information up to 10th March 2017 has been provided in this statement
** Starbit Oilfields Services India Limited, Essar Oilfields Middle East DMCC & Cosmic Drilling Services Limited have not been operational during the year, thus no financial statements have been prepared for these companies.

30
1. STATEMENT ON COMPANY’S PHILOSOPHY ON CODE OF CORPORATE GOVERNANCE
Your Company believes that adhering to global standards of Corporate Governance is essential to enhance Shareholders value and achieve long term corporate goals. The Company’s philosophy on Corporate Governance stresses the importance of transparency, accountability and protection of Shareholder interests.
2. BOARD OF DIRECTORS During the year 2016-17 your Company has an optimum
combination of executive, non-executive and Independent Directors on the Board of Directors (hereinafter referred to as Board).
Composition, Category, Other Directorship, Membership and Chairmanship of Committees
The composition of the Board, Category of Directors, Number of Directorship, Memberships and Chairmanships in public companies as on March 31, 2017 is as follows:
Name of the Director
Category of the Director
No. of other Directorship#
Committee positions@
Chairman Member
Mr. P. K. Srivastava
Non-Promoter Non-Executive
8 - -
Capt. Anoop Kumar Sharma (Managing Director)*
Non-Promoter Executive
1 - -
Mr. Ranjit Singh (ED& Chief Executive officer)**
Non-Promoter Executive
1 - -
Mr. N. Srinivasan
Independent Non-Executive
6 3 3
Captain Bhupinder Singh Kumar
Independent Non-Executive
6 5 1
Ms. S. Gayathri***
Non-Promoter Non-Executive
8 - 3
# Exclude Directorships in private limited companies, foreign companies and companies under Section 8 of the Companies Act, 2013.
@ Considered only Audit Committee and the Stakeholders’ Relationship Committee of public limited companies.
* Ceased as Managing Director w.e.f. September 09,2017
** Appointed as Director w.e.f. September 22, 2016.
*** Ceased as Director of the Company w.e.f May 24, 2017.
Attendance of Directors at Board Meetings and at the last Annual General Meeting (AGM)
During the year ended on March 31, 2017, seven (7) meetings of the Board were held on May 25, 2016, June 23, 2016, September 08, 2016, September 22, 2016, December 13, 2016, February 14, 2017 and March 27, 2017. The last Annual General Meeting (AGM) was held on August 10, 2016. The attendance of Directors at the Board meetings and the last AGM is as follow:
Name of the DirectorAttendance at Board
MeetingsAttendance at the last
AGMHeld Attended
Mr. P. K. Srivastava (DIN : 00843258)
7 7 Yes
Captain Anoop Kumar Sharma ** (DIN : 03531392)
3 3 Yes
Mr. N. Srinivasan (DIN: 00004195)
7 6 Yes
Captain Bhupinder Singh Kumar (DIN : 00284649)
7 7 Yes
Ms. S. Gayathri* (DIN : 07115908)
7 6 Yes
Mr. Ranjit Singh*** (DIN : 07021621)
3 3 NA
*Ceased from Directorship w.e.f May 24, 2017 ** Ceased from Directorship w.e.f September 09, 2016 *** Appointed w.e.f September 22, 2016
Separate Meeting of Independent Directors During the Financial Year ended March 31, 2017, the
Independent Directors met on February 14, 2017 and inter alia discussed the quality and timeliness of flow of information between the company management and the Board and overall performance of the Board which is essentially required for the Board to effectively and reasonably perform their duties.
Familiarization programmes for Independent Directors The Company has a policy to keep the Independent Directors
informed and updated about the business and operations of the Company as well as industries in which the Company operates, on a continuous basis. In addition to formal familiarization programmes, the interactions between various functional heads and the Independent Directors are generally facilitated on regular basis after the meetings of the Board and the Committees.
Code of Conduct All personnel to whom the Code of Conduct is applicable have
affirmed compliance with the Code of Conduct for the financial year ended March 31, 2017. A declaration to this effect, duly signed by the Executive Director & CEO is annexed hereto.
CORPORATE GOVERNANCE REPORT FOR THE YEAR 2016 - 17

7th ANNUAL REPORT 2016-17
31
Brief Resumes of Directors seeking Re-appointment at the Seventh Annual General Meeting of the Company in pursuance of Regulation 36(3)(a) of the SEBI (Listing Obligations and Disclosures Requirement) Regulations, 2015.
Mr. P. K. Srivastava Please refer the profile given in detail annexed with the notice
for Annual General Meeting.
Mr. P. K. Srivastava does not hold any shares in the Company.
Mr. N. Srinivasan
Please refer the profile given in detail annexed with the notice for Annual General Meeting.
Mr. N. Srinivasan does not hold any shares in the Company.
Capt. B. S. Kumar
Please refer the profile given in detail annexed with the notice for Annual General Meeting.
Capt. B. S. Kumar does not hold any shares in the Company.
3. AUDIT COMMITTEE The Audit Committee of the Company is mandated to perform
the functions specified under the Companies Act, 2013 and Regulation 18 of the SEBI (Listing Obligations and Disclosures Requirements) Regulations, 2015 and the Powers and Terms of Reference are in compliance with the requirements provided therein.
The detail of the composition and meetings of the Audit Committee are as follow:
Composition Meeting Dates and Attendance
May 25 2016
August 10, 2016
September 08, 2016
December 13, 2016
February 14, 2017
Mr. N. Srinivasan – Chairman*
Yes Yes Yes Yes Yes
Captain Bhupinder Singh Kumar – Member**
Yes Yes Yes Yes Yes
Ms. S. Gayathri - Member***
Yes Yes Yes Yes. Yes
* appointed as chairman of the committee w.e.f. September 22, 2016
** ceased to be chairman of the committee w.e.f. September 22, 2016
*** Ceased to be member w.e.f May 24, 2017
The Managing Director/ Executive Director & CEO, Chief Financial Officer, Head – Accounts, Financial Controller, Statutory Auditors and Internal Auditors attend the Audit Committee meetings. The Company Secretary is the Secretary to the Committee.
4. NOMINATION AND REMUNERATION COMMITTEE The terms of reference of Nomination and Remuneration
Committee includes inter-alia to formulate evaluation criteria and recommend to the Board from time to time on matters such as candidates for induction on the Board, compensation structure for Managing Director, Whole-time Director and Key Managerial Personnel and other Senior Executives and to administer and supervise the Employee Stock Option Scheme of the Company.
The detail of the composition and meetings of the Nomination and Remuneration Committee are as follow:
CompositionMeeting Dates and Attendance
August 10, 2016
September 22, 2016
Mr. N. Srinivasan – Chairman Yes Yes
Captain Bhupinder Singh Kumar - Member
Yes Yes
Mr. P. K. Srivastava – Member Yes Yes
Remuneration Policy The Nomination and Remuneration Committee of the Board is
constituted in compliance with the provisions of Section 178(1) of the Companies Act, 2013 and Regulation 19 of the SEBI (Listing Obligations and Disclosure Requirements) Regulations, 2015 The Committee is fully empowered to frame compensation structure for Directors and its review from time to time.
Remuneration to Directors is paid as determined by the Board on recommendation of the Nomination and Remuneration Committee and subject to such approval of Shareholders and Central Government as may be required in accordance with applicable provisions of the Companies Act, 2013 relating to managerial remuneration. The Company only pays sitting fees to Independent Directors and Non-executive Directors for attending meetings of the Board and Committees.
Details of Remuneration to Directors (Amount in Rupees)
Name of Director Basic Salary
Provident Fund
Allowances and other benefits
Sitting Fee Total
Mr. P. K. Srivastava
- - - 4,30,000 4,30,000
Mr. Ranjit Singh 1653750 198450 3064470 - 49,16,670
Capt. Anoop Sharma*
2890214 346827 8147575 113,84,616
Mr. N. Srinivasan - - - 5,80,000 5,80,000
Captain Bhupinder Singh Kumar
- - - 9,50,000 9,50,000
Ms. S. Gayathri** - - - - -
* Ceased to be Director w.e.f September 09, 2016** Ceased to be Director w.e.f May 24, 2017

32
During the year under review, no stock options were granted to any Director or employee of the Company. No Shares or Convertible Instruments are held by any Members of the Board except the Stock Options granted to the Executive Director(s) of the Company and its subsidiaries pursuant to the, `Essar Shipping Employees Stock Option Scheme – 2011’.
Performance Evaluation of Board and Directors The Company has detailed policy on performance evaluation
of the Board and individual Directors clearly setting the parameters for performance evaluation of Board and Directors.
Criteria for evaluationEvaluation of Board as a whole
The Independent Directors and the Nomination and Remuneration Committee while undertaking the Board evaluation decide on the criteria of evaluation of the Board and its Committees which among others include:
- the extent to which the Board and its Committees are successful in fulfilling their key roles and responsibilities.
- the extent to which individual directors contribute to the achievement of these objectives.
- the extent to which the Board and its Committees adhere to best practices in structure and procedure.
- the Committee will consider the balance of skills, experience, independence and knowledge requirements at Essar Shipping Ltd. Board and the diversity representation of the Board, including gender, how the Board works together as a unit, and other factors relevant to its effectiveness.
Non Executive Directors
The criteria for evaluation of Non-executive Directors are determined by the Nomination and Remuneration Committee. However, the actual evaluation process remains confidential and shall be a constructive mechanism to improve the effectiveness of the Board/Committees. An indicative list of factors that may be evaluated as part of this exercise is:
- Participation in meetings and contribution by director
- Commitment including guidance provided to senior management executives outsite of Board / Committee meetings
- Effective deployment of expertise and knowledge
- Effective management of relationship with stakeholders
- Integrity and maintenance of confidentiality
- Independence of behavior and judgement
- Impact and influence.
Executive Directors/ Managing Director
Balance Score Card is derived from Annual Business Plan and goals are aligned and cascaded across the organization, and linking to every Executive Director’s performance. Assessment parameters are defined for each of the goals and performance
will be measured against the goals at the end of each financial year. The compensation is finalized by the Nomination and Remuneration Committee based on evaluation of the individual director and the performance of the Company.
5. STAKEHOLDERS’ RELATIONSHIP COMMITTEE The Stakeholders’ Relationship Committee of the Board
is constituted in compliance with the provisions of Section 178(5) of the Companies Act, 2013 and Regulation 20 of the SEBI (Listing Obligations and Disclosures Requirement) Regulations, 2015. The Committee is fully empowered to consider and resolve grievances of security holders of the Company including complaints related to transfer of shares, non-receipt of Annual Report, Notices and other interests of the security holders. Periodic reports are placed for review by the Committee. The Stakeholders’ Relationship Committee comprises Captain B.S. Kumar and Mr. Ranjit Singh.
Captain B. S. Kumar, Non-executive Independent Director of the Company is heading the Committee as Chairman of the Committee and Company Secretary of the Company is Compliance Officer. During the year ended on March 31, 2017, four (4) meetings of the Committee were held on May 25, 2016, September 08, 2016, December 13, 2016 and February 14, 2017. The Company received a total of 128 complaints during the year 2016-17. All the complaints received during the year were redressed and no complaint was outstanding as on March 31, 2017.
6. GENERAL BODY MEETING Details of last three Annual General Meetings
FinancialYear
Meeting, Financial Year, Date and Time
Location and Nature of Transaction
2015-16 6th AGM on August 10, 2016 at 2:00 pm
Registered office of the Company, Jamnagar, GujaratSpecial Resolution passed in respect of following matters:- Approval for Related Party Transactions of
the Company - Approved- Approval for sale of upto 51% shares in
Arkay Logistics Limited (wholly owned subsidiary) - Approved
- Authorization to Board of Directors to fix charges for service of documents to member(s) through any particular mode – Disapproved
2014 - 15 5th AGM, on September 23, 2015 ( 3:00 p.m.)
Registered office of the Company, Jamnagar, GujaratSpecial Resolution passed in respect of following matters:- Approval for Related Party Transactions of
the Company- Approval for appointment of Ms. S.
Gayathri (DIN: 07115908) as a Non – Executive Director

7th ANNUAL REPORT 2016-17
33
2013-14 4th AGM, on September 26, 2014 (10:00 a.m.)
Registered office of the Company, Jamnagar, Gujarat.Special Resolution passed in the respect of following matters:- Approval for appointment of Mr. A. R.
Ramakrishnan (DIN: 00583765) as Managing Director for a period of 3(three) years.
- Approval for appointment of Captain Anoop Kumar Sharma (DIN: 03531392) as the Wholetime director for a period of 3 (three) years.
- Approval for borrowing moneys by the Board of Directors not exceed the sum of ` 5000,00,00,000/- (Rupees Five Thousand Crore only) over and above the aggregate paid-up capital of the Company and its free reserves.
- Approval for creating mortgages and/or charges, hypothecation, pledge and/or any other encumbrances on all or any of the movable and/or immovable properties of the Company, whosoever situated, both present and future.
7. DISCLOSURE
a) There were no transactions of material nature with its Promoters, the Directors or the Management, their subsidiaries or relatives, etc. that may have potential conflict with the interests of the Company at large. However, the Company has annexed to the accounts a list of related parties as per IndAS-24 and the transactions entered into with them.
b) There were no instances of non-compliances nor have any penalties, strictures been imposed by Stock Exchanges or SEBI or any statutory authority during the last 3 years on any matter related to capital markets.
c) The senior management has made disclosures to the Board relating to all material financial and commercial transactions stating that they did not have personal interest that could result in a conflict with the interest of the Company at large.
d) The Company has established a vigil mechanism (Whistle Blower Policy) for Directors and employees to report genuine concerns. The Whistle Blower Policy provides for adequate safeguards against victimisation of persons who use such mechanism and make provision for direct access to the Chairperson of the Audit Committee in appropriate or exceptional cases. No personnel has been denied access to the audit committee. A copy of the Whistle Blower Policy is available on the website of the Company: www.essar.com.
e) The Executive Director & CEO and the Chief Financial Officer have provided the Compliance Certificate to the Board of Directors as per regulation 17 (8) of the SEBI (Listing Obligations and Disclosure Requirements) Regulations, 2011 for the Financial Year ended March 31, 2017.
Risk Management The company has a Risk Management Policy Framework
for risk identification, assessment and control to effectively manage risks associated with the business of the company. The Company has Risk Management Committee comprising of two Directors of the Company and Chief Financial Officer.
Internal Finance Control and Risk Management Systems The Company has a well-established framework of internal
operational and financial controls, including suitable monitoring procedures systems which are adequate for the nature of its business and the size of its operations. The policies and procedures adopted by the Company ensure the orderly and efficient conduct of its business, including adherence to Company’s policies, safeguarding of its assets, prevention and detection of frauds and errors, accuracy and completeness of the accounting records, and timely preparation of reliable financial information. In addition to the external audit, the financial and operating controls of your Company are reviewed by Internal Auditors, who report their observations to the Audit Committee of the Board.
Subsidiary Monitoring Framework All the subsidiary companies of the company are managed
by their Board of Directors having the right and obligations to manage such Companies in the best interest of their stakeholders. As a majority Shareholder, the company at times nominates its representatives on the Boards of subsidiary companies and monitors the performance of such Companies, inter-alia, by the following means:
a) Mr. N. Srinivasan, an Independent Director of Essar Shipping Limited is on the Board of Essar Oilfields Services India Limited, a material non-listed Indian subsidiary;
b) The copies of the Minutes of the meetings of the Board of Directors of all the subsidiary companies are tabled before the Company’s Board on Quarterly Basis;
c) A statement containing all significant transactions and arrangements entered into by the unlisted subsidiary companies is placed before the Company’s Board; and
d) Financial Results summary are also tabled before the Company’s Board on quarterly basis.
8. MEANS OF COMMUNICATION
Financial Results and other Information about the Company
The Quarterly and Annual Financial Results are displayed on the Company’s website: www.essar.com.
Published in newspapers such as Business Standard and Jai Hind.
Presentation to Institutional Investors and to the Analyst
Press releases and presentations made to Institutional Investors and Analysts are displayed on the Company’s website: www.essar.com

34
Management Discussion & Analysis
Forms part of the Annual Report, which is mailed to the Shareholders of the Company
First Quarter Results On or before September 14, 2016*
Second Quarter Results On or before December 14, 2016*
Third Quarter Results On or before February 14, 2017
Annual Results for the Year On or before May 30, 2017
* As per SEBI Circular CIR/CFD/FAC/62/2016 dated July 05, 2016 for the Companies which has adopted IND-AS.
9. GENERAL SHAREHOLDERS INFORMATION Annual General Meeting details
Date December 29, 2017
Venue EBTSL Premises, ER-2 Building (Admin. Building), Salaya, 44 Km, P.O. Box No. 7, Taluka Khambhalia, Devbhumi Dwarka, Gujarat - 361305
Time 2.00 p.m.
Book Closure Dates
December 23, 2017 to December 29, 2017 (Both days inclusive)
Financial year: 1st April to 31st March
Listing on Stock Exchanges: The Ordinary Shares of the Company are listed and available for Trading on BSE Limited and the National Stock Exchange of India Limited. The Secured Non-convertible Debentures of the Company are listed on wholesale Debt Segment of the National Stock Exchange of India Limited (INE282A07039 and INE282A07047). The details of Stock Exchange and Securities listed are provided below:
National Stock Exchange of India Ltd. Exchange Plaza, Bandra Kurla Complex, Bandra East Mumbai – 400 051 Code: ESSARSHPNG
BSE Limited Phiroze Jeejeebhoy Towers Dalal Street, Mumbai – 400 001.
Code : 533704
The applicable listing fees have been paid to respective stock exchanges.
Market price data (High/Low) during each month in the Year 2016-17
BSE Limited National Stock Exchange of India Limited
Month Highest Lowest Month Highest LowestApril 2016 27.15 23.00 April 2016 26.85 23.30May 2016 28.50 24.65 May 2016 28.80 24.70June 2016 26.70 24.50 June 2016 28.00 24.20July 2016 31.15 25.00 July 2016 31.00 24.50August 2016 29.00 25.00 August 2016 29.50 25.00September 2016 31.00 24.40 September 2016 30.90 24.15October 2016 36.75 26.30 October 2016 36.70 26.30November 2016 32.00 24.90 November 2016 31.85 22.90December 2016 31.40 25.65 December 2016 31.35 26.45January 2017 29.70 25.65 January 2017 29.25 26.75February 2017 28.90 24.30 February 2017 29.50 26.10March 2017 32.25 26.65 March 2017 32.40 26.55Scrip Code: 533704 Scrip Code: ESSARSHPNG
Registrars and Share Transfer Agents
Data Software Research Company Private Limited 19, Pycrofts Garden Road, Off. Haddows Road, Nungambakkam, Chennai - 600 006 Ph.No.+91-44-28213738/28214487
Fax No.+91-44-28214636 E-mail: [email protected]
Share Transfer System The Share transfers are registered within an average period
of 15 days. Presently the Company dematerialises the Shares after getting the dematerialisation requests being generated by the Depository Participant.
Nomination Facility Shareholders holding shares in physical form and desirous of
Performance of share price in comparison to BSE Sensex
Performance of share price in comparison to Nifty
24000
25000
26000
27000
28000
29000
30000
31000
0
5
10
15
20
25
30
35
40
ESL BSE
Chart Title
0
5
10
15
20
25
30
35
40
ESL NSE
Chart Title
7000
7500
8000
8500
9000
9500
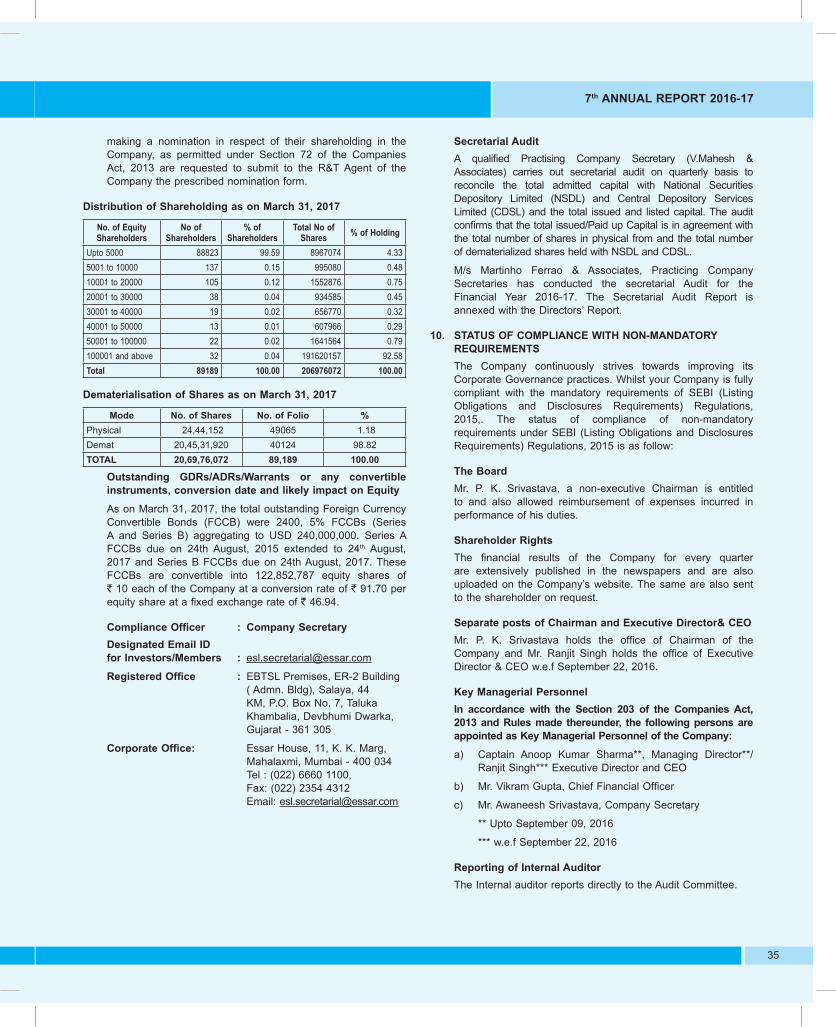
7th ANNUAL REPORT 2016-17
35
making a nomination in respect of their shareholding in the Company, as permitted under Section 72 of the Companies Act, 2013 are requested to submit to the R&T Agent of the Company the prescribed nomination form.
Distribution of Shareholding as on March 31, 2017
No. of Equity Shareholders
No of Shareholders
% of Shareholders
Total No of Shares % of Holding
Upto 5000 88823 99.59 8967074 4.335001 to 10000 137 0.15 995080 0.4810001 to 20000 105 0.12 1552876 0.7520001 to 30000 38 0.04 934585 0.4530001 to 40000 19 0.02 656770 0.3240001 to 50000 13 0.01 607966 0.2950001 to 100000 22 0.02 1641564 0.79100001 and above 32 0.04 191620157 92.58Total 89189 100.00 206976072 100.00
Dematerialisation of Shares as on March 31, 2017
Mode No. of Shares No. of Folio %Physical 24,44,152 49065 1.18Demat 20,45,31,920 40124 98.82TOTAL 20,69,76,072 89,189 100.00
Outstanding GDRs/ADRs/Warrants or any convertible instruments, conversion date and likely impact on Equity
As on March 31, 2017, the total outstanding Foreign Currency Convertible Bonds (FCCB) were 2400, 5% FCCBs (Series A and Series B) aggregating to USD 240,000,000. Series A FCCBs due on 24th August, 2015 extended to 24th August, 2017 and Series B FCCBs due on 24th August, 2017. These FCCBs are convertible into 122,852,787 equity shares of ` 10 each of the Company at a conversion rate of ` 91.70 per equity share at a fixed exchange rate of ` 46.94.
Compliance Officer : Company Secretary Designated Email ID for Investors/Members : [email protected]
Registered Office : EBTSL Premises, ER-2 Building ( Admn. Bldg), Salaya, 44 KM, P.O. Box No. 7, Taluka Khambalia, Devbhumi Dwarka, Gujarat - 361 305
Corporate Office: Essar House, 11, K. K. Marg, Mahalaxmi, Mumbai - 400 034
Tel : (022) 6660 1100, Fax: (022) 2354 4312 Email: [email protected]
Secretarial Audit A qualified Practising Company Secretary (V.Mahesh &
Associates) carries out secretarial audit on quarterly basis to reconcile the total admitted capital with National Securities Depository Limited (NSDL) and Central Depository Services Limited (CDSL) and the total issued and listed capital. The audit confirms that the total issued/Paid up Capital is in agreement with the total number of shares in physical from and the total number of dematerialized shares held with NSDL and CDSL.
M/s Martinho Ferrao & Associates, Practicing Company Secretaries has conducted the secretarial Audit for the Financial Year 2016-17. The Secretarial Audit Report is annexed with the Directors’ Report.
10. STATUS OF COMPLIANCE WITH NON-MANDATORY REQUIREMENTS
The Company continuously strives towards improving its Corporate Governance practices. Whilst your Company is fully compliant with the mandatory requirements of SEBI (Listing Obligations and Disclosures Requirements) Regulations, 2015,. The status of compliance of non-mandatory requirements under SEBI (Listing Obligations and Disclosures Requirements) Regulations, 2015 is as follow:
The Board Mr. P. K. Srivastava, a non-executive Chairman is entitled
to and also allowed reimbursement of expenses incurred in performance of his duties.
Shareholder Rights The financial results of the Company for every quarter
are extensively published in the newspapers and are also uploaded on the Company’s website. The same are also sent to the shareholder on request.
Separate posts of Chairman and Executive Director& CEO Mr. P. K. Srivastava holds the office of Chairman of the
Company and Mr. Ranjit Singh holds the office of Executive Director & CEO w.e.f September 22, 2016.
Key Managerial Personnel In accordance with the Section 203 of the Companies Act,
2013 and Rules made thereunder, the following persons are appointed as Key Managerial Personnel of the Company:
a) Captain Anoop Kumar Sharma**, Managing Director**/Ranjit Singh*** Executive Director and CEO
b) Mr. Vikram Gupta, Chief Financial Officer
c) Mr. Awaneesh Srivastava, Company Secretary
** Upto September 09, 2016
*** w.e.f September 22, 2016
Reporting of Internal Auditor The Internal auditor reports directly to the Audit Committee.

36
AUDITOR’S CERTIFICATE ON CORPORATE GOVERNANCETo,The Members,Essar Shipping LimitedWe have examined the compliance of conditions of Corporate Governance by Essar Shipping Limited (“the Company”), for the year ended 31st March, 2017, as stipulated in Regulation 17 to 27 and clause (b) to (i) of Regulation 46(2) and Para C and D of Schedule V of the SEBI (Listing Obligation and Disclosure Requirements) Regulations, 2015 (“the Listing Regulations”).The compliance of conditions of Corporate Governance is the responsibility of the Management. This responsibility includes design, implementation and maintenance of internal control and procedures to ensure the compliance with the conditions of the Corporate Governance stipulated in Listing Regulations. Our responsibility is limited to examining the procedures and implementation thereof, adopted by the Company for ensuring compliance with the conditions of Corporate Governance. It is neither an audit nor an expression of opinion on financial statements of the Company.We have examined the books of account and other relevant records and documents maintained by the Company for the purpose of providing reasonable assurance on the compliance with Corporate Governance requirements by the Company. We have carried out an examination of the relevant records of the Company in accordance with the Guidance Note on Certification of Corporate Governance issued by the Institute of Chartered Accountants of India (ICAI), the Standards on Auditing specified under Section 143(10) of the Companies Act 2013, in so far as applicable for the purpose of this certificate and as per the Guidance Note on Reports or Certificates for Special Purposes issued by the ICAI which requires that we comply with the ethical requirements of the Code of Ethics issued by the ICAI.We have complied with the relevant applicable requirements of the Standard on Quality Control (SQC) 1, Quality Control for Firms that perform Audits and Reviews of Historical Financial Information, and Other Assurance and Related Service Engagements.Based on our examination of the relevant records and according to the information and explanations provided to us and the representations provided by the Management, we certify that the Company has complied with the conditions of Corporate Governance as stipulated in regulations 17 to 27 and clauses (b) to (i) of Regulation 46(2) and Para C and D of Schedule V of the Listing Regulations during the year ended 31st March, 2017. We state that such compliance is neither an assurance as to the future viability of the Company nor the efficiency or effectiveness with which the Management has conducted the affairs of the Company.This certificate is issued solely for the purpose of complying with the aforesaid regulation and may not be suitable for any other purpose.For and on behalf ofFor C N K & Associates LLP Chartered Accountants Firm’s Registration No. 101961W/W-100036
Himanshu Kishnadwala Partner Membership No. 37391
Place : MumbaiDate : 26 May, 2017
DECLARATION ON COMPLIANCE OF THE COMPANY’S CODE OF CONDUCT TO THE MEMBERS OF THE ESSAR SHIPPING LIMITED
The Company has framed a specific code of Conduct for the Members of the Board and the Senior Management Personnel of the Company pursuant to Clause 49 of the Listing Agreement/Regulation 34(3), Schedule V of SEBI (Listing Obligations and Disclosure Requirements) Regulations, 2015, to further strengthen Corporate Governance practices in the Company.
All the Members of the Board and Senior Management Personnel of the Company have affirmed due observance of the said code of conduct in so far as it is applicable to them and there is no non-compliance thereof during the year ended March 31, 2017.
Ranjit Singh Executive Director & CEO
Place : MumbaiDate : 26 May, 2017
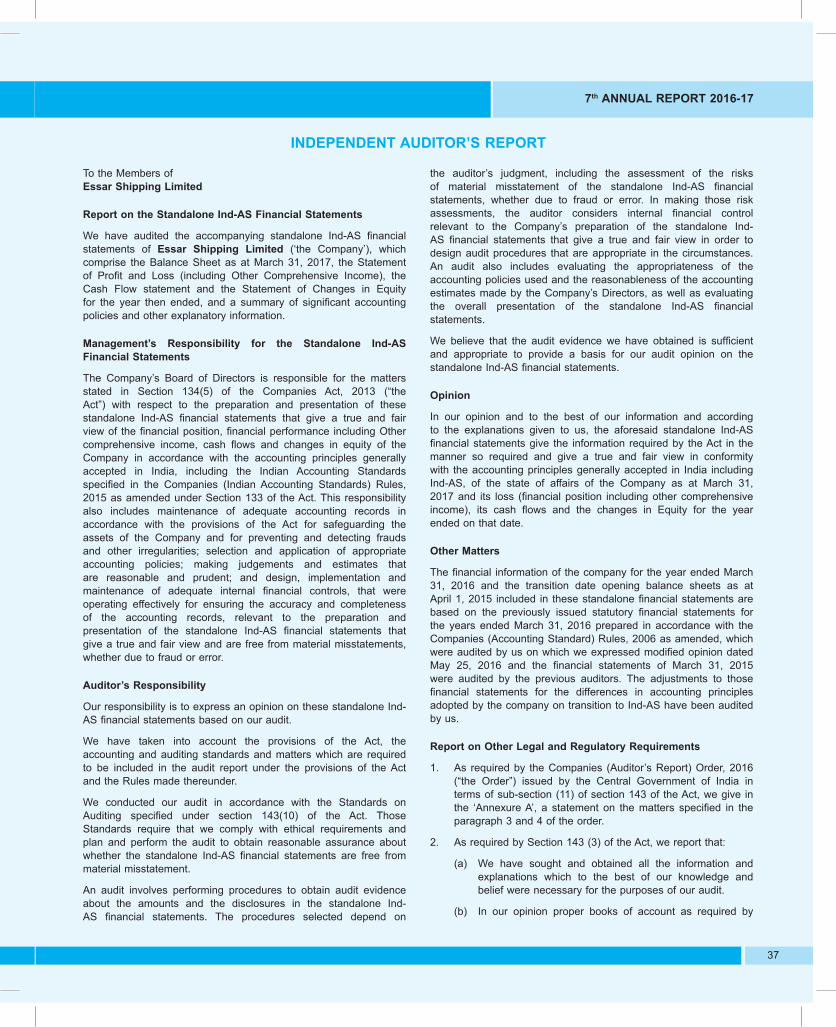
7th ANNUAL REPORT 2016-17
37
To the Members of Essar Shipping Limited
Report on the Standalone Ind-AS Financial Statements
We have audited the accompanying standalone Ind-AS financial statements of Essar Shipping Limited (‘the Company’), which comprise the Balance Sheet as at March 31, 2017, the Statement of Profit and Loss (including Other Comprehensive Income), the Cash Flow statement and the Statement of Changes in Equity for the year then ended, and a summary of significant accounting policies and other explanatory information.
Management’s Responsibility for the Standalone Ind-AS Financial Statements
The Company’s Board of Directors is responsible for the matters stated in Section 134(5) of the Companies Act, 2013 (“the Act”) with respect to the preparation and presentation of these standalone Ind-AS financial statements that give a true and fair view of the financial position, financial performance including Other comprehensive income, cash flows and changes in equity of the Company in accordance with the accounting principles generally accepted in India, including the Indian Accounting Standards specified in the Companies (Indian Accounting Standards) Rules, 2015 as amended under Section 133 of the Act. This responsibility also includes maintenance of adequate accounting records in accordance with the provisions of the Act for safeguarding the assets of the Company and for preventing and detecting frauds and other irregularities; selection and application of appropriate accounting policies; making judgements and estimates that are reasonable and prudent; and design, implementation and maintenance of adequate internal financial controls, that were operating effectively for ensuring the accuracy and completeness of the accounting records, relevant to the preparation and presentation of the standalone Ind-AS financial statements that give a true and fair view and are free from material misstatements, whether due to fraud or error.
Auditor’s Responsibility
Our responsibility is to express an opinion on these standalone Ind-AS financial statements based on our audit.
We have taken into account the provisions of the Act, the accounting and auditing standards and matters which are required to be included in the audit report under the provisions of the Act and the Rules made thereunder.
We conducted our audit in accordance with the Standards on Auditing specified under section 143(10) of the Act. Those Standards require that we comply with ethical requirements and plan and perform the audit to obtain reasonable assurance about whether the standalone Ind-AS financial statements are free from material misstatement.
An audit involves performing procedures to obtain audit evidence about the amounts and the disclosures in the standalone Ind-AS financial statements. The procedures selected depend on
the auditor’s judgment, including the assessment of the risks of material misstatement of the standalone Ind-AS financial statements, whether due to fraud or error. In making those risk assessments, the auditor considers internal financial control relevant to the Company’s preparation of the standalone Ind-AS financial statements that give a true and fair view in order to design audit procedures that are appropriate in the circumstances. An audit also includes evaluating the appropriateness of the accounting policies used and the reasonableness of the accounting estimates made by the Company’s Directors, as well as evaluating the overall presentation of the standalone Ind-AS financial statements.
We believe that the audit evidence we have obtained is sufficient and appropriate to provide a basis for our audit opinion on the standalone Ind-AS financial statements.
Opinion
In our opinion and to the best of our information and according to the explanations given to us, the aforesaid standalone Ind-AS financial statements give the information required by the Act in the manner so required and give a true and fair view in conformity with the accounting principles generally accepted in India including Ind-AS, of the state of affairs of the Company as at March 31, 2017 and its loss (financial position including other comprehensive income), its cash flows and the changes in Equity for the year ended on that date.
Other Matters
The financial information of the company for the year ended March 31, 2016 and the transition date opening balance sheets as at April 1, 2015 included in these standalone financial statements are based on the previously issued statutory financial statements for the years ended March 31, 2016 prepared in accordance with the Companies (Accounting Standard) Rules, 2006 as amended, which were audited by us on which we expressed modified opinion dated May 25, 2016 and the financial statements of March 31, 2015 were audited by the previous auditors. The adjustments to those financial statements for the differences in accounting principles adopted by the company on transition to Ind-AS have been audited by us.
Report on Other Legal and Regulatory Requirements
1. As required by the Companies (Auditor’s Report) Order, 2016 (“the Order”) issued by the Central Government of India in terms of sub-section (11) of section 143 of the Act, we give in the ‘Annexure A’, a statement on the matters specified in the paragraph 3 and 4 of the order.
2. As required by Section 143 (3) of the Act, we report that:
(a) We have sought and obtained all the information and explanations which to the best of our knowledge and belief were necessary for the purposes of our audit.
(b) In our opinion proper books of account as required by
INDEPENDENT AUDITOR’S REPORT
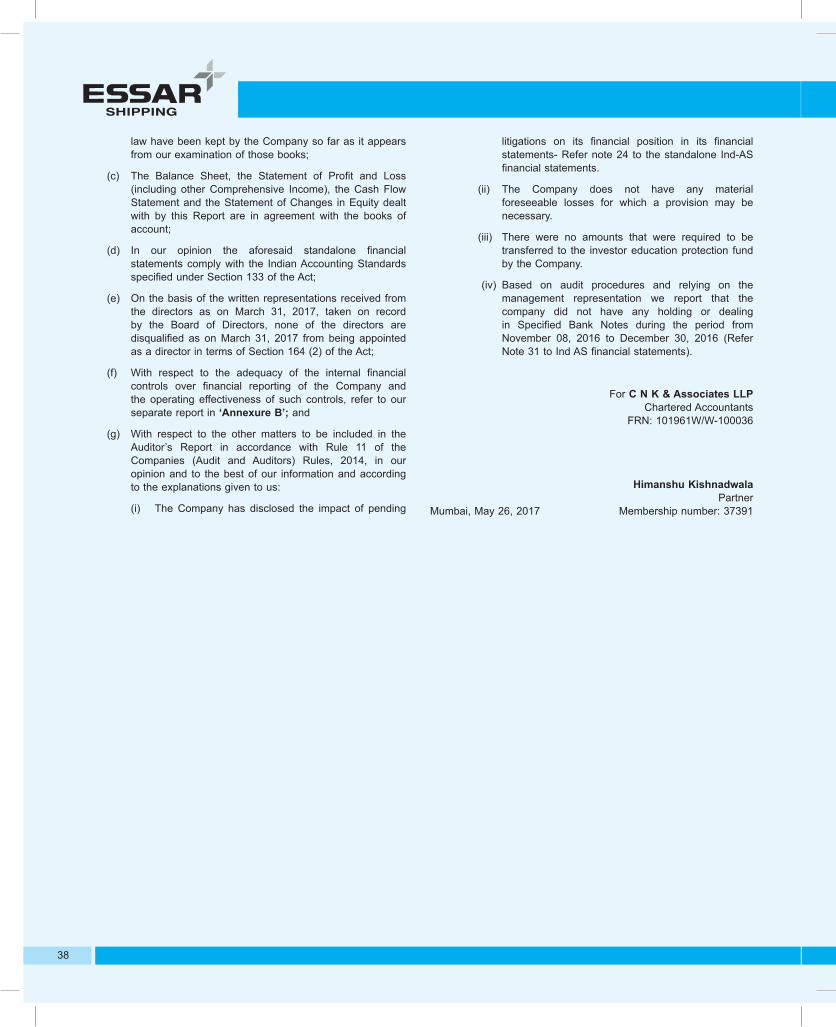
38
law have been kept by the Company so far as it appears from our examination of those books;
(c) The Balance Sheet, the Statement of Profit and Loss (including other Comprehensive Income), the Cash Flow Statement and the Statement of Changes in Equity dealt with by this Report are in agreement with the books of account;
(d) In our opinion the aforesaid standalone financial statements comply with the Indian Accounting Standards specified under Section 133 of the Act;
(e) On the basis of the written representations received from the directors as on March 31, 2017, taken on record by the Board of Directors, none of the directors are disqualified as on March 31, 2017 from being appointed as a director in terms of Section 164 (2) of the Act;
(f) With respect to the adequacy of the internal financial controls over financial reporting of the Company and the operating effectiveness of such controls, refer to our separate report in ‘Annexure B’; and
(g) With respect to the other matters to be included in the Auditor’s Report in accordance with Rule 11 of the Companies (Audit and Auditors) Rules, 2014, in our opinion and to the best of our information and according to the explanations given to us:
(i) The Company has disclosed the impact of pending
litigations on its financial position in its financial statements- Refer note 24 to the standalone Ind-AS financial statements.
(ii) The Company does not have any material foreseeable losses for which a provision may be necessary.
(iii) There were no amounts that were required to be transferred to the investor education protection fund by the Company.
(iv) Based on audit procedures and relying on the management representation we report that the company did not have any holding or dealing in Specified Bank Notes during the period from November 08, 2016 to December 30, 2016 (Refer Note 31 to Ind AS financial statements).
For C N K & Associates LLP Chartered Accountants
FRN: 101961W/W-100036
Himanshu Kishnadwala Partner
Mumbai, May 26, 2017 Membership number: 37391
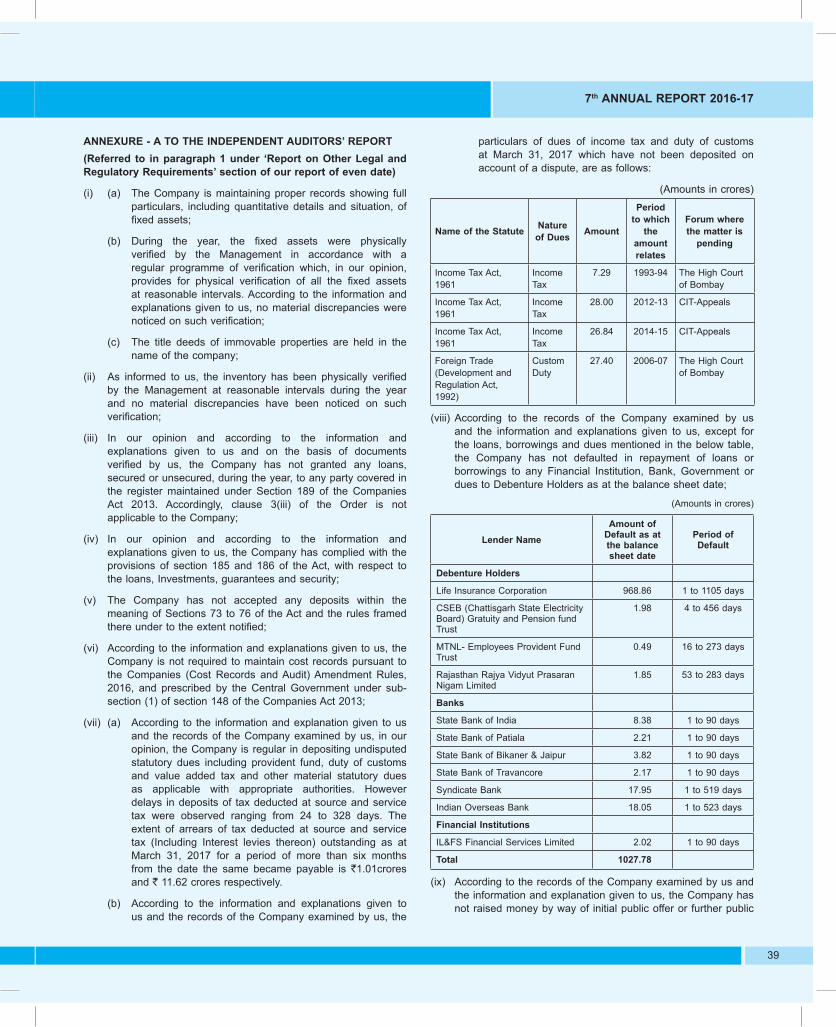
7th ANNUAL REPORT 2016-17
39
ANNEXURE - A TO THE INDEPENDENT AUDITORS’ REPORT(Referred to in paragraph 1 under ‘Report on Other Legal and Regulatory Requirements’ section of our report of even date)
(i) (a) The Company is maintaining proper records showing full particulars, including quantitative details and situation, of fixed assets;
(b) During the year, the fixed assets were physically verified by the Management in accordance with a regular programme of verification which, in our opinion, provides for physical verification of all the fixed assets at reasonable intervals. According to the information and explanations given to us, no material discrepancies were noticed on such verification;
(c) The title deeds of immovable properties are held in the name of the company;
(ii) As informed to us, the inventory has been physically verified by the Management at reasonable intervals during the year and no material discrepancies have been noticed on such verification;
(iii) In our opinion and according to the information and explanations given to us and on the basis of documents verified by us, the Company has not granted any loans, secured or unsecured, during the year, to any party covered in the register maintained under Section 189 of the Companies Act 2013. Accordingly, clause 3(iii) of the Order is not applicable to the Company;
(iv) In our opinion and according to the information and explanations given to us, the Company has complied with the provisions of section 185 and 186 of the Act, with respect to the loans, Investments, guarantees and security;
(v) The Company has not accepted any deposits within the meaning of Sections 73 to 76 of the Act and the rules framed there under to the extent notified;
(vi) According to the information and explanations given to us, the Company is not required to maintain cost records pursuant to the Companies (Cost Records and Audit) Amendment Rules, 2016, and prescribed by the Central Government under sub-section (1) of section 148 of the Companies Act 2013;
(vii) (a) According to the information and explanation given to us and the records of the Company examined by us, in our opinion, the Company is regular in depositing undisputed statutory dues including provident fund, duty of customs and value added tax and other material statutory dues as applicable with appropriate authorities. However delays in deposits of tax deducted at source and service tax were observed ranging from 24 to 328 days. The extent of arrears of tax deducted at source and service tax (Including Interest levies thereon) outstanding as at March 31, 2017 for a period of more than six months from the date the same became payable is `1.01crores and ` 11.62 crores respectively.
(b) According to the information and explanations given to us and the records of the Company examined by us, the
particulars of dues of income tax and duty of customs at March 31, 2017 which have not been deposited on account of a dispute, are as follows:
(Amounts in crores)
Name of the Statute Nature of Dues Amount
Period to which
the amount relates
Forum where the matter is
pending
Income Tax Act, 1961
Income Tax
7.29 1993-94 The High Court of Bombay
Income Tax Act, 1961
Income Tax
28.00 2012-13 CIT-Appeals
Income Tax Act, 1961
Income Tax
26.84 2014-15 CIT-Appeals
Foreign Trade (Development and Regulation Act, 1992)
Custom Duty
27.40 2006-07 The High Court of Bombay
(viii) According to the records of the Company examined by us and the information and explanations given to us, except for the loans, borrowings and dues mentioned in the below table, the Company has not defaulted in repayment of loans or borrowings to any Financial Institution, Bank, Government or dues to Debenture Holders as at the balance sheet date;
(Amounts in crores)
Lender NameAmount of
Default as at the balance sheet date
Period of Default
Debenture Holders
Life Insurance Corporation 968.86 1 to 1105 days
CSEB (Chattisgarh State Electricity Board) Gratuity and Pension fund Trust
1.98 4 to 456 days
MTNL- Employees Provident Fund Trust
0.49 16 to 273 days
Rajasthan Rajya Vidyut Prasaran Nigam Limited
1.85 53 to 283 days
Banks
State Bank of India 8.38 1 to 90 days
State Bank of Patiala 2.21 1 to 90 days
State Bank of Bikaner & Jaipur 3.82 1 to 90 days
State Bank of Travancore 2.17 1 to 90 days
Syndicate Bank 17.95 1 to 519 days
Indian Overseas Bank 18.05 1 to 523 days
Financial Institutions
IL&FS Financial Services Limited 2.02 1 to 90 days
Total 1027.78
(ix) According to the records of the Company examined by us and the information and explanation given to us, the Company has not raised money by way of initial public offer or further public

40
offer (including debt instruments) during the year and in case of term loans taken during the year, the same were applied for the purposes for which those were raised;
(x) According to the information and explanations given to us, no fraud by the Company or on the Company by its officers or employees has been noticed or reported during the course of our audit;
(xi) According to the records of the Company examined by us and the information and explanations given to us, the company has paid/provided for managerial remuneration in accordance with the requisite approvals mandated by the provisions of Section 197 read with Schedule V to the Companies Act, 2013; (also refer Note 33(b) of the standalone financial statements)
(xii) The Company is not a Nidhi company and therefore the provisions of clause 3 (xii) of the Order are not applicable to the company;
(xiii) According to the records of the Company examined by us and the information and explanation given to us, all transactions with the related parties are in compliance with sections 177 and 188 of Companies Act, 2013 where applicable and the details thereof have been disclosed in the Financial Statements etc., as required by the applicable accounting standards;
(xiv) The company has not made any preferential allotment or private placement of shares or fully or partly convertible debentures during the year under review. Therefore clause 3(xiv) is not applicable to the Company;
(xv) According to the information and explanations given to us and based on our examination of the records of the Company, the Company has not entered into non-cash transactions with directors or persons connected with him. Accordingly, clause 3(xv) of the Order is not applicable to the Company;
(xvi) According to the information and explanations given to us and based on our examination of the records of the Company, the Company is not required to be registered under section 45-IA of the Reserve Bank of India Act 1934.
For C N K & Associates LLP Chartered Accountants
FRN: 101961W/W-100036
Himanshu Kishnadwala Partner
Mumbai, May 26, 2017 Membership number: 37391

7th ANNUAL REPORT 2016-17
41
ANNEXURE - B TO THE AUDITORS’ REPORTReport on the Internal Financial Controls under Clause (i) of Sub-section 3 of Section 143 of the Companies Act, 2013 (“the Act”)
We have audited the internal financial controls over financial reporting of Essar Shipping Limited (“the Company”) as of March 31, 2017 in conjunction with our audit of the standalone Ind-AS financial statements of the Company for the year ended on that date.
Management’s Responsibility for Internal Financial ControlsThe Company’s management is responsible for establishing and maintaining internal financial controls based on the internal control over financial reporting criteria established by the Company considering the essential components of internal control stated in the Guidance Note on Audit of Internal Financial Controls over Financial Reporting issued by the Institute of Chartered Accountants of India (‘ICAI’). These responsibilities include the design, implementation and maintenance of adequate internal financial controls that were operating effectively for ensuring the orderly and efficient conduct of its business, including adherence to company’s policies, the safeguarding of its assets, the prevention and detection of frauds and errors, the accuracy and completeness of the accounting records, and the timely preparation of reliable financial information, as required under the Companies Act, 2013.
Auditors’ ResponsibilityOur responsibility is to express an opinion on the Company’s internal financial controls over financial reporting based on our audit. We conducted our audit in accordance with the Guidance Note on Audit of Internal Financial Controls over Financial Reporting (the “Guidance Note”) and the Standards on Auditing, issued by ICAI and deemed to be prescribed under section 143(10) of the Companies Act, 2013, to the extent applicable to an audit of internal financial controls, both applicable to an audit of Internal Financial Controls and, both issued by the Institute of Chartered Accountants of India. Those Standards and the Guidance Note require that we comply with ethical requirements and plan and perform the audit to obtain reasonable assurance about whether adequate internal financial controls over financial reporting was established and maintained and if such controls operated effectively in all material respects.
Our audit involves performing procedures to obtain audit evidence about the adequacy of the internal financial controls system over financial reporting and their operating effectiveness. Our audit of internal financial controls over financial reporting included obtaining an understanding of internal financial controls over financial reporting, assessing the risk that a material weakness exists, and testing and evaluating the design and operating effectiveness of internal control based on the assessed risk. The procedures selected depend on the auditor’s judgment, including the assessment of the risks of material misstatement of the financial statements, whether due to fraud or error.
We believe that the audit evidence we have obtained is sufficient and appropriate to provide a basis for our audit opinion on the
Company’s internal financial controls system over financial reporting.
Meaning of Internal Financial Controls over Financial ReportingA company’s internal financial control over financial reporting is a process designed to provide reasonable assurance regarding the reliability of financial reporting and the preparation of financial statements for external purposes in accordance with generally accepted accounting principles. A company’s internal financial control over financial reporting includes those policies and procedures that (1) pertain to the maintenance of records that, in reasonable detail, accurately and fairly reflect the transactions and dispositions of the assets of the company; (2) provide reasonable assurance that transactions are recorded as necessary to permit preparation of financial statements in accordance with generally accepted accounting principles, and that receipts and expenditures of the company are being made only in accordance with authorizations of management and directors of the company; and (3) provide reasonable assurance regarding prevention or timely detection of unauthorized acquisition, use, or disposition of the company’s assets that could have a material effect on the financial statements.
Inherent Limitations of Internal Financial Controls over Financial ReportingBecause of the inherent limitations of internal financial controls over financial reporting, including the possibility of collusion or improper management override of controls, material misstatements due to error or fraud may occur and not be detected. Also, projections of any evaluation of the internal financial controls over financial reporting to future periods are subject to the risk that the internal financial control over financial reporting may become inadequate because of changes in conditions, or that the degree of compliance with the policies or procedures may deteriorate.
OpinionIn our opinion, the Company has, in all material respects, an adequate internal financial controls system over financial reporting and such internal financial controls over financial reporting were operating effectively as at 31 March 2017, based on the internal control over financial reporting criteria established by the Company considering the essential components of internal control stated in the Guidance Note on Audit of Internal Financial Controls Over Financial Reporting issued by the Institute of Chartered Accountants of India.
For C N K & Associates LLP Chartered Accountants
FRN: 101961W/W-100036
Himanshu Kishnadwala Partner
Mumbai, May 26, 2017 Membership number: 37391

42
BALANCE SHEET AS AT 31ST MARCH, 2017(` in crore)
Note No.As at
31st March, 2017
As at 31st March,
2016
As at 1st April,
2015ASSETSNon-current assetsProperty, plant and equipment 2 1,175.90 1,294.72 1,500.43 Investments in subsidiaries and associates 3 3,649.68 3,289.64 2,511.83 Financial assetsi. Loans 4(b) – – 418.00 ii. Other financial assets 4(d) 9.34 20.11 25.76 Other non-current assets 5 8.92 18.55 6.62 Total non-current assets 4,843.84 4,623.03 4,462.64 Current assetsInventories 6 12.49 17.42 14.18 Investments in subsidiaries 3 759.00 1,164.64 1,099.03 Financial assetsi. Trade and other receivables 4(a) 275.90 127.74 117.75 ii. Cash and cash equivalents 4(c) 28.77 22.64 24.40 iii. Loans 4(b) 25.68 32.17 369.60 iv. Other financial assets 4(d) 46.91 14.29 8.80 Other current assets 7 342.26 351.33 49.27 Assets classified as held for sale 8 – 84.93 –Total current assets 1,491.01 1,815.15 1,683.03 Total assets 6,334.85 6,438.18 6,145.67
EQUITY AND LIABILITIESEquityEquity share capital 9(a) 206.98 206.98 205.23 Other equityEquity component of foreign currency convertible bonds 27.70 96.37 152.91 Reserves and surplus 9(b) 1,525.42 1,562.76 1,727.22 Total equity 1,760.10 1,866.11 2,085.36
LIABILITIESNon-current liabilitiesFinancial Liabilitiesi. Borrowings 10(a) 906.58 2,350.64 1,402.44 ii. Other financial liabilities 10(c) – – 44.49 iii. Derivative liability 11 – 22.11 12.88 Total non-current liabilities 906.58 2,372.75 1,459.81 Current liabilitiesFinancial liabilitiesi. Borrowings 10(a) 439.76 464.84 175.68 ii. Trade payables 10(b) 196.90 272.19 241.73 iii. Other financial liabilities 10(c) 2,955.49 1,304.21 2,108.16 Employee benefit obligations 12 5.66 5.16 5.52 Other current liabilities 13 70.36 152.92 69.41 Total current liabilities 3,668.17 2,199.32 2,600.50 Total liabilities 4,574.75 4,572.07 4,060.31 Total equity and liabilities 6,334.85 6,438.18 6,145.67
See accompanying notes 1 to 34 forming part of the standalone financial statements
As per our attached report of even date
For CNK & Associates LLP Chartered Accountants Firm Registration No.: 101961W/W100036
Himanshu Kishnadwala Partner Membership No.: 37391Mumbai, 26th May, 2017
For and on behalf of the Board
Ranjit Singh Executive Director & CEO (DIN: 07021621)
Vikram Gupta Chief Financial Officer
Mumbai, 26th May, 2017
N. Srinivasan Director (DIN: 00004195)
Awaneesh Srivastava Company SecretaryMembership No.: FCS 8513

7th ANNUAL REPORT 2016-17
43
STANDALONE STATEMENT OF PROFIT AND LOSS FOR THE YEAR ENDED 31ST MARCH, 2017(` in crore)
Particulars Note no. Year ended 31st March, 2017
Year ended 31st March, 2016
INCOME
Revenue from operations 14 657.74 728.70
Other income 15 6.33 60.17
Other gains / (losses)- net 16 147.93 36.62
Total income 812.00 825.49
Expenses:
Operating expenses 17 322.64 402.84
Employee benefits expenses 18 103.29 105.76
Finance costs 19 352.63 342.65
Depreciation 2 137.14 153.69
Other expenses 20 12.93 14.85
Total expenses 928.63 1,019.80
Loss before tax (116.63) (194.31)
Current tax 21 (2.65) (3.39)
Loss for the year (119.28) (197.70)
Other comprehensive income
Items that will not be reclassified subsequently to profit and loss account
Actuarial gain / (loss) (0.38) 0.70
Items that will be subsequently reclassified to profit and loss account
Fair value changes on derivatives designated as cash flow hedges – (9.24)
Total other comprehensive income (0.38) (8.54)
Total comprehensive loss for the year (119.66) (206.24)
Earnings per equity share (Face value of `10 each) :Basic and diluted (in `) 26 (5.78) (9.96)
See accompanying notes 1 to 34 forming part of the financial statements
As per our attached report of even date
For CNK & Associates LLP Chartered Accountants Firm Registration No.: 101961W/W100036
Himanshu Kishnadwala Partner Membership No.: 37391Mumbai, 26th May, 2017
For and on behalf of the Board
Ranjit Singh Executive Director & CEO (DIN: 07021621)
Vikram Gupta Chief Financial Officer
Mumbai, 26th May, 2017
N. Srinivasan Director (DIN: 00004195)
Awaneesh Srivastava Company SecretaryMembership No.: FCS 8513

44
STANDALONE STATEMENT OF CASH FLOWS FOR THE YEAR ENDED 31ST MARCH 2017(` in crore)
Particulars Year ended 31st March, 2017
Year ended 31st March, 2016
A CASH FLOW FROM OPERATING ACTIVITIES
Loss before tax (116.63) (194.31)
Adjustments for :
Depreciation 137.14 153.69
Finance costs 352.63 342.65
Interest income (1.42) (57.96)
Gain on foreclosure of finance leases – (53.27)
Gain on sale of investment in a subsidiary (117.77) –
(Gain) / loss on sale of other assets 2.33 (0.09)
Income from financial guarantee obligations (21.34) (16.77)
Amortisation of stock based employee compensation – (0.25)
Gain on buy-back of equity shares by a subsidiary – (5.81)
Provision for diminution in value of assets held for sale – 28.86
Unrealised foreign exchange gain (11.16) (14.06)
Operating profit before working capital changes 223.79 182.68
Changes in working capital:
(Increase) / Decrease in inventories 4.92 (3.24)
(Increase) / Decrease in trade receivables, loans and advances and other assets 79.52 (23.45)
Increase / (Decrease) in trade payables, other liabilities and short term provisions (91.51) 88.29
Cash generated from operations 216.73 244.28
Income taxes refunded / (paid), net (9.93) (15.30)
Net cash generated from operating activities 206.80 228.98
B CASH FLOW FROM INVESTING ACTIVITIES
Expenditure on property, plant and equipment (18.33) –
Proceeds from sale of property, plant and equipment 443.89 0.09
Advance received / (refunded) against asset held for sale (32.65) 32.65
Share Application money given to a subsidiary – (252.57)
Proceeds from redemption of investments in a subsidiary – 12.53
Fixed deposits placed for a period of more than three months (4.56) (6.94)
Loans and advances given to a subsidiary – (2.45)
Loans and advances repaid by a subsidiary – 53.80
Interest received 1.42 4.09
Net cash (used in) / generated from investing activities 389.78 (158.80)
C. CASH FLOW FROM FINANCING ACTIVITIES
Proceeds from long-term loans – 190.16

7th ANNUAL REPORT 2016-17
45
STANDALONE STATEMENT OF CASH FLOWS FOR THE YEAR ENDED 31ST MARCH 2017(` in crore)
Particulars Year ended 31st March, 2017
Year ended 31st March, 2016
Proceeds from short-term loans 18.57 49.05
Proceeds from intercorporate deposits 279.90 385.41
Issue of equity shares at a premium – 5.11
Repayment of intercorporate deposits (277.19) –
Repayment of long-term loans (380.21) (249.40)
Repayment of short-term loans (19.24) (12.18)
Repayment/cancellation of finance lease obligations (26.54) (199.74)
Finance costs paid (191.23) (235.35)
Net cash used in financing activities (595.94) (66.94)
INCREASE / (DECREASE) IN CASH AND CASH EQUIVALENTS 0.64 3.24
Unrealised foreign currency loss on cash and cash equivalents 0.94 0.01
Cash and cash equivalents at the beginning of the year 3.68 0.43
Cash and cash equivalents at the end of the year (refer note 4(c)) 5.26 3.68
Note:
Reconciliation between cash and cash equivalents and cash and bank balances.
Particulars As at 31st March, 2017
As at 31st March, 2016
Cash and cash equivalents as per cash flow statement 5.26 3.68
Add: margin money deposits not considered as cash and cash equivalents as per IND AS-7 23.52 18.96
Cash and bank balances (Restricted and Unrestricted) 28.77 22.64
Notes to the statement of cash flows and disclosure of non cash transactions1) The statement of cashflow is prepared in accordance with the format prescribed as per Ind-AS 72) “Other non-cash items” include excess provision written back, dimunition in value of investment, materials written off and
miscellaneous adjustments not affecting Cash Flow.3) During the year, the Company sold its investment in Arkay Logistics Limited for a consideration of ` 155 crores to an unrelated party.
Out of this, an amount of `124.73 crores was adjusted against borrowings (including interest accrued thereon) from Essar Steel India Limited by way of assignment of these borrowings to the unrelated party. This is a non cash transaction
4) During the year, the Company acquired two vessels on Finance Lease from Essar Shipping DMCC, Dubai. In accordance with Ind AS 107, this has been treated as a non cash transaction
5) In Part-A of the Cash Flow Statement, figures in brackets indicate deductions made from the Net Profit for deriving the net cash flow from operating activities. In Part-B and Part-C, figures in brackets indicate cash outflows.
See accompanying notes 1 to 34 forming part of the standalone financial statements
As per our attached report of even date
For CNK & Associates LLP Chartered Accountants Firm Registration No.: 101961W/W100036
Himanshu Kishnadwala Partner Membership No.: 37391Mumbai, 26th May, 2017
For and on behalf of the Board
Ranjit Singh Executive Director & CEO (DIN: 07021621)
Vikram Gupta Chief Financial Officer
Mumbai, 26th May, 2017
N. Srinivasan Director (DIN: 00004195)
Awaneesh Srivastava Company SecretaryMembership No.: FCS 8513

46
STANDALONE STATEMENT OF CHANGES IN EQUITY FOR THE YEAR ENDED 31ST MARCH, 2017
A. EQUITY SHARE CAPITAL(` in crore)
Particulars Equity Share Capital
Balance as on 1st April, 2015 205.23Exercise of stock options 1.75Balance as on 31st March, 2016 206.98Additions during the year -
Balance as on 31st March, 2017 206.98
B. OTHER EQUITY (` in crore)
Particulars
Equity compo-nent of foreign
currency con-
vertible bonds
Other equity
Total equity
Reserves and Surplus Other Comprehensive Income
Secu-rities
PremiumRetained Earnings
Deben-ture Re-
demption Reserve
Share options
out-standing reserve
Tonnage tax
(utilised) reserve
Tonnage tax
reserveGeneral reserve FCMITDA
Cash flow
hedge reserve
Other items
of other compre-hensive income
Balance as on 1st April, 2015
152.91 – (3,220.45) 55.00 1.47 20.00 45.00 4,835.22 3.86 (12.88) - 1,880.13
Exercise of stock options
– 3.36 – – (0.97) – – – – – – 2.39
Additions during the year
– – – – – – – – (6.30) (9.23) 0.70 (14.83)
Amortisation during the year
– – – – – – – – (10.86) – – (10.86)
Unwinding of discounted liability
(56.54) – 56.54 – – – – – – – – –
Loss for the year – (197.70) – – – – – – – – (197.70)Balance as on 31st March, 2016
96.37 3.36 (3,361.61) 55.00 0.50 20.00 45.00 4,835.22 (13.30) (22.11) 0.70 1,659.13
Additions during the year
– – – – 0.11 (20.00) – 20.00 2.52 22.11 (0.38) 24.36
Amortisation during the year
(11.09) (11.09)
Unwinding of discounted liability
(68.67) – 68.67 – – – – – – – – –
Loss for the year – – (119.28) – – – – – – – – (119.28)Balance as on 31st March, 2017
27.70 3.36 (3,412.22) 55.00 0.61 – 45.00 4,855.22 (21.87) – 0.32 1,553.12
Refer Note 9(b) for nature and purpose of reserves
See accompanying notes 1 to 34 forming part of the standalone financial statements
As per our attached report of even date
For CNK & Associates LLP Chartered Accountants Firm Registration No.: 101961W/W100036
Himanshu Kishnadwala Partner Membership No.: 37391Mumbai, 26th May, 2017
For and on behalf of the Board
Ranjit Singh Executive Director & CEO (DIN: 07021621)
Vikram Gupta Chief Financial Officer
Mumbai, 26th May, 2017
N. Srinivasan Director (DIN: 00004195)
Awaneesh Srivastava Company Secretary Membership No.: FCS 8513

7th ANNUAL REPORT 2016-17
47
NOTES FORMING PART OF THE STANDALONE FINANCIAL STATEMENTS
CORPORATE INFORMATIONEssar Shipping Limited (“the Company”) was incorporated in September 2010 and is listed on the Bombay Stock Exchange and National Stock Exchange in India. The Company is mainly engaged in fleet operating and chartering activities and operates international and coastal voyages. The Company has also directly and/or through its subsidiaries and associates invested in diverse business verticals viz. Fleet operating and chartering (tankers and dry bulkers), Oilfields services (land rigs and semi- submersible rig) and logistics services (trucks, trailers and tippers). The place of business of the Company is in Mumbai, India.
1. SIGNIFICANT ACCOUNTING POLICIESa) Basis of preparation
The financial statements of the Company have been prepared in accordance with Indian Accounting Standards (hereinafter referred to as Ind-AS) notified under section 133 of Companies Act, 2013 read with Companies (Indian Accounting Standards) Rules, 2015 and other relevant provisions of the Act.
These financial statements for the year ended 31st March, 2017 are the first financials with comparatives, prepared under Ind AS. For all previous periods including the year ended 31st March, 2016, the Company had prepared its financial statements in accordance with the accounting standards notified under section 133 of the Companies Act, 2013 read with Rule 7 of Companies (Accounting Standards) Rules,2014 (as amended) and other relevant provisions of the Act (hereinafter referred to as ‘Previous GAAP’) used for its statutory reporting requirement in India. Refer note 30 for an explanation of how the transition from previous GAAP to Ind AS has affected the Financial Position, Financial Performance and Cash Flows of the Company.
The company’s presentation and functional currency is Indian rupees.All amounts in these financial statements, except per share amounts and unless as stated otherwise, have been rounded off to two decimal places and have been presented in crores.
Authorisation of Financial Statements: The Financial Statements were authorized for issue in accordance with a resolution of the Board of Directors in its meeting held on 26th May, 2017.
Historical cost convention
The financial statements have been prepared on a historical cost basis, except for the following:
• Certain financial assets and liabilities including derivative instruments are measured at fair value.
• Assets held for sale are measured at the lower of carrying value and fair value less costs to sell.
• Defined benefit plans where plan assets measured at fair value.
Going concern basis of accounting
These accounts have been prepared on a going concern basis.
In assessing the Company’s going concern status, the Management has taken account of:
• the financial position of the Company;
• anticipated future trading performance;
• its bank and other facilities, including facilities in default, or due to expire within the next 12 months;
• its capital investment plans;
• the likelihood of any material adverse legal judgments.
Refer Note 29 for further details.
b) Use of estimates The estimates and judgements used in the preparation of
the financial statements are continuously evaluated by the Company and are based on historical experience and various other assumptions and factors (including expectations of future events) that the Company believes to be reasonable under the existing circumstances. Differences between actual results and estimates are recognised in the period in which the results are known/materialised. The management believes that the estimates used in the preparation of financial statements are prudent and reasonable.
The said estimates are based on the facts and events, that existed as at the reporting date, or that occurred after that date but provide additional evidence about conditions existing as at the reporting date.
Critical estimates and judgements This note provides an overview of the areas that involved a
higher degree of judgement or complexity, and items which are more likely to be materially adjusted due to estimates and assumptions turning out to be different than those originally assessed. Detailed information about each of these estimates and judgements is included in relevant notes together with information about the basis of calculation for each affected line item in the financial statements.
The areas involving critical estimates or judgement are: Estimation of Defined benefit obligation - refer note 12 Estimation of current tax expenses and Payable - refer note 21 Useful lives of property, plant and equipment- refer note 2 Impairment of investments in subsidiaries- refer note 3 Impairment of financial and non-financial assets- refer notes 4
and 5 Going Concern- refer note 29
c) Current versus non-current classification The company presents assets and liabilities in the balance
sheet based on current/ non-current classification.

48
All the assets and liabilities have been classified as current/non-current as per the Company’s normal operating cycle and other criteria set out in Division II to Schedule III of the Companies Act, 2013.
The operating cycle is the time between the acquisition of assets for processing and their realisation in cash or cash equivalents. Based on the nature of activities of the Company and the normal time between acquisition of assets and their realisation in cash or cash equivalents, the Company has determined its operating cycle as 12 months for the purpose of classification of its assets and liabilities as current and non-current.
d) Property, plant and equipment Freehold land is carried at historical cost. All other items of
property, plant and equipment (PPE) are stated at cost less accumulated depreciation and impairment losses, if any. Historical cost includes expenditure that is directly attributable to the acquisition of the item.
The cost of an item of PPE comprises its purchase price net of any trade discounts and rebates, any import duties and other taxes (other than those subsequently recoverable from the tax authorities), any directly attributable expenditure including brokerage and start-up costs on making the asset ready for its intended use, other incidental expenses and interest on borrowings attributable to acquisition of qualifying assets up to the date the asset is ready for its intended use.
Subsequent expenditure is capitalized only if it is probable that the future economic benefits associated with the expenditure will flow to the company.
On transition to Ind AS, the Company has elected to continue with the carrying value of all of its property, plant and equipment recognized as at 1st April 2015 measured as per the previous GAAP and use that carrying value as the deemed cost of the property, plant and equipment.
When significant parts of PPE are required to be replaced at intervals, company depreciates them separately based on their specific useful lives.
An item of property, plant and equipment and any significant part initially recognised is derecognised upon disposal or when no future economic benefits are expected from its use or disposal. Any gain or loss arising on de-recognition of the asset (calculated as the difference between the net disposal proceeds and the carrying amount of the asset) is included in the income statement when the asset is derecognised.
The residual values, useful lives and methods of depreciation of property, plant and equipment are reviewed at each financial year end and changes if any are accounted in line with revisions to accounting estimates.
Capital work in progress:
Capital work in progress is stated at cost, net of impairment losses, if any.
Depreciation:
Depreciation on PPE is provided as per straight line method as per the useful life prescribed in Schedule II of the Companies Act, 2013 except in case of following category of PPE in whose case the life of the items of PPE has been assessed as under based on technical advice, taking into account the nature of the asset, the estimated usage of the asset, the operating condition of the asset, past history of replacement, anticipated technological changes, manufacturer’s warranties and maintenance support etc.
Nature of Fixed Asset Useful LifeFleet- Bulk Carriers 25-30 years
Aircraft 17 years
Assets costing less than ` 5,000/- are fully depreciated in the year of capitalization. Depreciation on additions/deductions to PPE made during the year is provided on a pro-rata basis from / up to the date of such additions /deductions, as the case may be.
The property plant and equipment acquired under finance lease is depreciated over the asset’s useful life or over the shorter of the asset’s useful life and the lease term if there is no reasonable certainty that the Company will obtain ownership at the end of the lease term.
e) Borrowing costs General and specific borrowing costs that are directly
attributable to the acquisition, construction or production of a qualifying asset are capitalised during the period of time that is required to complete and prepare the asset for its intended use or sale. Borrowing costs directly attributable to the acquisition, construction or production of an asset that necessarily takes a substantial period of time to get ready for its intended use or sale are capitalised as part of the cost of the asset. All other borrowing costs are expensed in the period in which they occur. Borrowing costs consist of interest and other costs that an entity incurs in connection with the borrowing of funds. Borrowing cost also includes exchange differences to the extent regarded as an adjustment to the borrowing costs.
f) Assets held for sale Non-current assets are classified as held for sale if their
carrying amounts will be recovered through a sale transaction rather than through continuing use. This condition is regarded as met only when the sale is highly probable and the asset is available for immediate sale in its present condition subject only to terms that are usual and customary for sale of such assets.
Non-current assets classified as held for sale are measured at the lower of carrying amount and fair value less cost to sell.
Property, plant and equipment classified as held for sale are not depreciated.
g) Leases Where the Company as a lessor leases assets under finance

7th ANNUAL REPORT 2016-17
49
leases, such amounts are recognised as receivables at an amount equal to the net investment in the lease and the finance income is recognised based on a constant rate of return on the outstanding net investment.
Assets leased by the Company in its capacity as a lessee, where substantially all the risks and rewards of ownership vest in the Company are classified as finance leases. Such leases are capitalised at the inception of the lease at the lower of the fair value and the present value of the minimum lease payments and a liability is created for an equivalent amount. Each lease rental paid is allocated between the liability and the interest cost so as to obtain a constant periodic rate of interest on the outstanding liability for each year.
Lease arrangements where the risks and rewards incidental to ownership of an asset substantially vest with the lessor are recognised as operating leases. Lease rentals under operating leases are recognised in the Statement of Profit and Loss on a straight-line basis over the lease term.
h) Impairment of non-financial assets Non-financial assets other than inventories and non-current
assets held for sale are reviewed at each Balance Sheet date to determine whether there is any indication of impairment. If any such indication exists, or when annual impairment testing for an asset is required, the company estimates the asset’s recoverable amount. The recoverable amount is higher of asset’s or Cash-Generating Units (CGU) fair value less costs of disposal and its value in use. Recoverable amount is determined for an individual asset, unless the asset does not generate cash flows that are largely independent of those from other assets or group of assets.
When the carrying amount of an asset or CGU exceeds its recoverable amount, the asset is considered impaired and is written down to its recoverable amount.
i) Valuation of Inventory Cost includes all charges in bringing the inventories to their
present location and condition, including octroi and other levies, transit insurance and receiving charges and excluding rebated and discounts, if any. Inventories are valued at the lower of cost determined on first-in-first-out basis and the net realisable value after providing for obsolescence and other losses, where considered necessary. Cost of Inventories also include all other costs incurred in bringing the inventories at the present location and condition. Net realisable value is the estimated selling price in the ordinary course of business.
j) Revenue recognition Fleet operating earnings represent the value of charter hire
earnings, demurrage, freight earnings and fleet management fees, and are accounted on accrual basis. Freight earnings are recognised on a pro-rata basis for voyages in progress at balance sheet date after loading of the cargo is completed. Revenues and related expenses for voyages where cargo has not been loaded as on the balance sheet date are deferred and recognised in the following year.
Revenue is measured at the fair value of the consideration received or receivable, taking into account contractually defined terms of payment and excluding taxes or duties collected on behalf of the government.
Interest income Interest income is recognised on a time proportion basis
taking into account the amount outstanding and the rate applicable.
For all debt instruments measured either at amortised cost or at fair value through other comprehensive income, interest income is recorded using the effective interest rate (EIR).
Dividend income Dividend income is accounted for when the right to receive
the same is established, which is generally when shareholders approve the dividend.
Other Income Other income is accounted for on accrual basis except
where the receipt of income is uncertain in which case it is accounted for on receipt basis.
Insurance Claims Insurance claims are accounted for on the basis of claims
admitted / expected to be admitted and to the extent that the amount recoverable can be measured reliably and it is reasonable to expect ultimate collection.
k) Fleet operating expenses All expenses relating to the operation of the fleet including
crewing, insurance, stores, bunkers, charter hire and special survey costs, are expensed under fleet operating expenses on accrual basis. Dry-docking expenses are amortised over 30 months.
l) Employee benefits
i) Short term employee benefits The undiscounted amount of short-term employee
benefits expected to be paid in exchange for the services rendered by employees is recognised during the period when the employee renders the services. These benefits include compensated absences such as paid annual leave, and performance incentives.
ii) Long term employee benefits Compensated absences which are not expected to
occur within twelve months after the end of the period in which the employee renders the related services are recognised as a liability at the present value of the defined benefit obligation determined actuarially by using Projected Unit Credit Method at the balance sheet date.
iii) Post employment benefit plan The Company (employer) and the employees contribute
a specified percentage of eligible employees’ salary-

50
currently 12%, to the employer established provident fund “Essar Shipping Limited Employees Provident Fund” set up as an irrevocable trust by the Company. The Company is generally liable for annual contributions and any shortfall in the fund assets based on government specified minimum rates of return – currently @ 8.75%, and recognises such provident fund liability, considering fund as the defined benefit plan, based on an independent actuarial valuation carried out at every statutory year end using the Projected Unit Credit Method.
Provision for gratuity for floating staff is made as under:
(i) For offshore officers on actuarial valuation.
(ii) For offshore crew on accrual basis as per rules of the National Maritime Board and is charged to the Statement of Profit and Loss.
Contribution to defined contribution retirement benefit schemes are recognised as expense in the Statement of Profit and Loss, when employees have rendered services entitling them to contributions.
For defined benefit schemes, the cost of providing benefits is determined using the Projected Unit Credit Method, with actuarial valuations being carried out at each balance sheet date. Actuarial gains and losses are recognised in full in Other Comprehensive Income, for the period in which they occur. Past service cost is recognised immediately to the extent that the benefits are already vested, and is otherwise amortised on a straight line basis over the average period until the benefits become vested.
The retirement benefit obligation recognised in the balance sheet represents the present value of the defined benefit obligation and is adjusted both for unrecognised past service cost, and for the fair value of plan assets. Any asset resulting from this calculation is limited to the present value of available refunds and reductions in future contributions to the scheme, if lower.
iv) Employee Options The fair value of the options granted under the value
of the Company, Employee Option Plan is recognised as employee benefits expense with the corresponding increase in equity. The total amount to be expensed is determined by the reference to the fair value of the options granted:
- including any market conditions (e.g., the entity’s share price)
- excluding the impact of any service and non- market performance vesting conditions(profitability, sales growth targets and remaining an employee of the entity over the specified period), and
- including the impact of any non-vesting conditions (e.g. the requirement for the employee to save or hold shares for a specific period of time)
The total expense is recognised over the vesting period, which is the period over which all the specified vesting conditions are to be satisfied. At the end of each period, the entity revises its estimate of the number of options that are expected to vest based on the non-market vesting and service conditions. It recognises the impact of the revision to original estimates, if any, in profit or loss, with the corresponding adjustments to equity.
m) Foreign currencies(i) Functional and presentation currency
The Company’s financial statements are presented in Indian Rupee (INR), which is also the Company’s functional and presentation currency.
(ii) Transactions and balances
Transactions in foreign currencies are translated into functional currency using the exchange rate at the dates of the transactions. Foreign exchange gains and losses resulting from the settlement of such transactions and from the translation of monetary assets and liabilities denominated in foreign currencies at the year end exchange rates are generally recognised in Profit or loss. They are deferred in Equity if they relate to qualifying cash flow hedges. A monetary item for which settlement is neither planned nor likely to occur in the foreseeable future is considered as a part of the entity’s net investment in that foreign operations.
Foreign exchanges differences regarded as adjustments to borrowing costs are presented in the Statement of Profit and Loss, within finance cost. All other foreign exchange gains and losses as presented in the Statement of Profit and Loss on a net basis within other gains/(losses).
Non-monetary items measured at fair value in a foreign currency are translated using the exchange rates at the date when the fair value is determined. The gain or loss arising on translation of non-monetary items measured at fair value is treated in line with the recognition of the gain or loss on the change in fair value of the item (i.e., translation differences on items whose fair value gain or loss is recognised in OCI or profit or loss are also recognised in OCI or profit or loss, respectively).
Non-monetary items that are measured in terms of historical cost in a foreign currency, are translated using exchange rates on dates of initial recognition.
Exchange differences relating to Long term foreign currency monetary items are accounted in terms of para D13AA of Ind-AS 101 as under:
(i) In so far as they relate to the acquisition of a depreciable capital asset, such differences are added to/deducted from the cost of such capital asset and depreciated over the balance useful life of the asset
7th ANNUAL REPORT 2016-17
51
(ii) In other cases, such differences are accumulated in “Foreign currency Monetary Items Translation differences account and amortised in the Statement of Profit and Loss over the balance useful life of the long term foreign currency monetary item.
n) Investments in Subsidiaries and Associates Investments in subsidiaries and associates are recorded at
cost and reviewed for impairment at each reporting date.
o) Provisions and Contingencies Provisions are recognized when there is a present obligation
(legal or constructive) as a result of a past event, it is probable that an outflow of resources embodying economic benefits will be required to settle the obligation and a reliable estimate can be made of the amount of the obligation. Provisions are reviewed at each balance sheet date and are adjusted to reflect the current best estimate.
If the effect of the time value of money is material, provisions are discounted using a current pre-tax rate that reflects, when appropriate, the risks specific to the liability. When discounting is used, the increase in the provision due to the passage of time is recognised as a finance cost.
Contingent liabilities are disclosed when there is a possible obligation arising from past events, the existence of which will be confirmed only by the occurrence or non-occurrence of one or more uncertain future events not wholly within the control of the Company or a present obligation that arises from past events where it is either not probable that an outflow of resources will be required to settle or a reliable estimate of the amount cannot be made. Information on contingent liability is disclosed in the Notes to the Financial Statements.
Contingent assets are not recognised but disclosed when the inflow of economic benefits is probable. However, when the realisation of income is virtually certain, then the related asset is no longer a contingent asset, but it is recognised as an asset.
p) Fair value measurement Fair value is the price that would be received to sell an
asset or paid to transfer a liability in an orderly transaction between market participants at the measurement date. The fair value measurement is based on the presumption that the transaction to sell the asset or transfer the liability takes place either:
• In the principal market for the asset or liability, or
• In the absence of a principal market, in the most advantageous market which can be accessed by ESL for the asset or liability.
The fair value of an asset or a liability is measured using the assumptions that market participants would use when pricing the asset or liability, assuming that market participants act in their economic best interest.
ESL uses valuation techniques that are appropriate in the
circumstances and for which sufficient data are available to measure fair value, maximising the use of relevant observable inputs and minimising the use of unobservable inputs.
All assets and liabilities for which fair value is measured or disclosed in the financial statements are categorised within the fair value hierarchy, described as follows, based on the lowest level input that is significant to the fair value measurement as a whole:
• Level 1 Quoted (unadjusted) market prices in active markets for identical assets or liabilities
• Level 2 Valuation techniques for which the lowest level input that is significant to the fair value measurement is directly or indirectly observable
• Level 3 Valuation techniques for which the lowest level input that is significant to the fair value measurement is unobservable
For assets and liabilities that are recognised in the financial statements on a recurring basis, ESL determines whether transfers have occurred between levels in the hierarchy by re-assessing categorisation (based on the lowest level input that is significant to the fair value measurement as a whole) at the end of each reporting period.
q) Financial assets Initial recognition and measurement
All financial assets are recognised initially at fair value plus, in the case of financial assets not recorded at fair value through profit or loss, transaction costs that are attributable to the acquisition of the financial asset. Purchases or sales of financial assets that require delivery of assets within a time frame established by regulation or convention in the market place (regular way trades) are recognised on the trade date, i.e., the date that the Company commits to purchase or sell the asset.
Subsequent measurement
Subsequent measurement is determined with reference to the classification of the respective financial assets. Based on the business model for managing the financial assets and the contractual cash flow characteristics of the financial asset, the Company classifies financial assets as subsequently measured at amortised cost, fair value through Other Comprehensive Income or fair value through profit and loss.
Debt instruments at amortised cost
Debt instruments such as trade and other receivables, security deposits and loans given are measured at the amortised cost if both the following conditions are met:
• The asset is held within a business model whose objective is to hold assets for collecting contractual cash flows, and
• Contractual terms of the asset give rise on specified dates to cash flows that are solely payments of principal and interest (SPPI) on the principal amount outstanding.

52
After initial measurement, such financial assets are subsequently measured at amortised cost using the effective interest rate (EIR) method. Amortised cost is calculated by taking into account any discount or premium on acquisition and fees or costs that are an integral part of the EIR. The EIR amortisation is included in finance income in the profit or loss. The losses arising from impairment are recognised in the profit or loss.
Debt instrument at FVTOCI
A ‘debt instrument’ is classified as at the FVTOCI if both of the following criteria are met:
• The objective of the business model is achieved both by collecting contractual cash flows and selling the financial assets, and
• The asset’s contractual cash flows represent SPPI.
Debt instruments included within the FVTOCI category are measured initially as well as at each reporting date at fair value. Fair value movements are recognized in the other comprehensive income (OCI).
Debt instrument at FVTPL
FVTPL is a residual category for debt instruments excluding investments in subsidiary and associate companies. Any debt instrument, which does not meet the criteria for categorization as at amortized cost or as FVTOCI, is classified as at FVTPL.
After initial measurement, any fair value changes including any interest income, foreign exchange gain and losses, impairment losses and other net gains and losses are recognised in the Statement of Profit and Loss.
Equity investments
All equity investments in scope of Ind-AS 109 are measured at fair value. Equity instruments which are held for trading are classified as at FVTPL. For all other equity instruments, ESL decides to classify the same either as at FVTOCI or FVTPL. ESL makes such election on an instrument-by-instrument basis. The classification is made on initial recognition and is irrevocable.
Equity instruments included within the FVTPL category are measured at fair value with all changes recognized in the Profit or loss.
Derecognition
A financial asset is primarily derecognised when:
• The rights to receive cash flows from the asset have expired, or
• The Company has transferred its rights to receive cash flows from the asset or has assumed an obligation to pay the received cash flows in full without material delay to a third party under a ‘pass-through’ arrangement; and either
a) The Company has transferred substantially all
the risks and rewards of the asset, or
b) The Company has neither transferred nor retained substantially all the risks and rewards of the asset, but has transferred control of the asset.
On de-recognition, any gains or losses on all debt instruments (other than debt instruments measured at FVTOCI) and equity instruments (measured at FVTPL) are recognized in the Statement of Profit and Loss. Gains and losses in respect of debt instruments measured at FVTOCI and that are accumulated in OCI are reclassified to profit or loss on de-recognition. Gains or losses on equity instruments measured at FVTOCI that are recognized and accumulated in OCI are not reclassified to profit or loss on de-recognition
Impairment of financial assets
ESL applies expected credit loss (ECL) model for measurement and recognition of impairment loss on the following financial assets and credit risk exposure:
a) Financial assets that are debt instruments, and are measured at amortised cost e.g., loans, debt securities, deposits, trade receivables and bank balance.
b) Financial assets measured at fair value through other comprehensive income.
In case of other assets (listed as a) above), the company determines if there has been a significant increase in credit risk of the financial asset since initial recognition. If the credit risk of such assets has not increased significantly, an amount equal to 12-month ECL is measured and recognized as loss allowance. However, if credit risk has increased significantly, an amount equal to lifetime ECL is measured and recognized as loss allowance.
r) Financial liabilities Initial recognition and measurement
All financial liabilities are recognised initially at fair value and, in the case of loans and borrowings and payables, net of directly attributable transaction costs.
ESL’s financial liabilities include trade and other payables, loans and borrowings including bank overdrafts, and derivative financial instruments.
Subsequent measurement
The measurement of financial liabilities depends on their classification, as described below:
Financial liabilities at fair value through profit or loss
Financial liabilities at fair value through profit or loss include financial liabilities designated upon initial recognition as at fair value through profit or loss.
Financial liabilities designated upon initial recognition at fair
7th ANNUAL REPORT 2016-17
53
value through profit or loss are designated at the initial date of recognition, and only if the criteria in Ind-AS 109 are satisfied. For liabilities designated as FVTPL, fair value gains/ losses attributable to changes in own credit risk are recognized in OCI. These gains/ loss are not subsequently transferred to profit or loss. However, the company may transfer the cumulative gain or loss within equity. All other changes in fair value of such liability are recognised in the statement of profit or loss.
Financial liabilities at amortized cost
Financial liabilities classified and measured at amortised cost such as loans and borrowings are initially recognized at fair value, net of transaction cost incurred. After initial recognition, financial liabilities are subsequently measured at amortised cost using the Effective interest rate (EIR) method. Gains and losses are recognised in profit or loss when the liabilities are derecognised as well as through the EIR amortisation process.
Amortised cost is calculated by taking into account any discount or premium on acquisition and fees or costs that are an integral part of the EIR. The EIR amortisation is included as finance costs in the Statement of Profit and Loss.
Derecognition
A financial liability is derecognised when the obligation under the liability is discharged or cancelled or expires. When an existing financial liability is replaced by another from the same lender on substantially different terms, or the terms of an existing liability are substantially modified, such an exchange or modification is treated as the de-recognition of the original liability and the recognition of a new liability. The difference in the respective carrying amounts is recognised in the statement of profit or loss.
Financial guarantee obligation ESL’s investment include the effect of notional income from
financial guarantee obligations.
Derivative financial instruments ESL uses derivative financial instruments to manage the
commodity price risk and exposure on account of fluctuation in interest rate and foreign exchange rates. Such derivative financial instruments are initially recognized at fair value on the date on which a derivative contract is entered into and are subsequently measured at fair value with changes being recognized in Statement of Profit and Loss. Derivatives are carried as financial assets when the fair value is positive and as financial liabilities when the fair value is negative.
Any gains or losses arising from changes in the fair value of derivatives are taken through other comprehensive income.
Borrowings Borrowings are initially recognised at fair value, net of
transaction costs incurred. Borrowings are subsequently measured at amortised cost. Any differences between the
proceeds (net of transaction costs) and the redemption amount is recognised in Profit or loss over the period of the borrowing using the effective interest method. Fees paid on the establishment of loan facilities are recognised as transaction costs of the loan to the extent that it is probable that some or all of the facilities will be drawn down. In this case, the fee is deferred until the drawdown occurs.
The borrowings are removed from the Balance sheet when the obligation specified in the contract is discharged, cancelled or expired. The difference between the carrying amount of the financial liability that has been extinguished or transferred to another party and the consideration paid including any noncash asset transferred or liabilities assumed, is recognised in profit or loss as other gains/(losses).
Borrowings are classified as current liabilities unless the group has an unconditional right to defer settlement of the liability of atleast 12 months after the reporting period. Where there is a breach of a material provision of a long term loan arrangement on or before the end of the reporting period with the effect that the liability becomes payable on demand on the reporting date, the entity does not classify the liability as current, if the lender agreed, after the reporting period and before the approval of the financial statement for issue, not to demand payment as a consequence of the breach.
Foreign currency convertible bonds (FCCBs) FCCBs are separated into liability and equity components
based on the terms of the contract. On issuance of the FCCBs, the fair value of the liability component is determined using a market rate for an equivalent non-convertible instrument. This amount is classified as a financial liability measured at amortised cost (net of transaction costs) until it is extinguished on conversion or redemption. The remainder of the proceeds is allocated to the conversion option that is recognised and included in equity since conversion option meets Ind AS 32 criteria for fixed to fixed classification. Transaction costs are apportioned between the liability and equity components of the FCCBS based on the allocation of proceeds to the liability and equity components when the instruments are initially recognised.
Offsetting of financial instruments Financial assets and financial liabilities are offset and the net
amount is reported in the standalone balance sheet if there is a currently enforceable legal right to offset the recognised amounts and there is an intention to settle on a net basis, to realise the assets and settle the liabilities simultaneously. The legally enforceable right must not be contingent on future events and must be enforceable in the normal course of business and in the event of default, insolvency or bankruptcy of the company, or the counterparty.
s) Taxes on income Current tax is the amount of tax payable as per special
provisions relating to income of shipping companies under the Income Tax Act, 1961 on the basis of deemed tonnage income of the Company and tax payable on other taxable

54
income for the year determined in accordance with the applicable tax rates and provisions of the Income Tax Act, 1961 and other applicable tax laws.
Minimum Alternate Tax (MAT) paid in accordance with the tax laws, which gives future economic benefits in the form of adjustment to future income tax liability, is considered as an asset if there is convincing evidence that the Company will pay normal income tax. Accordingly, MAT is recognised as an asset in the Balance Sheet when it is highly probable that future economic benefit associated with it will flow to the Company.
Deferred tax is recognised on differences between the carrying amounts of assets and liabilities in the Balance sheet and the corresponding tax bases used in the computation of taxable profit and are accounted for using the liability method. Deferred tax liabilities are generally recognised for all taxable temporary differences, and deferred tax assets are generally recognized for all deductible temporary differences, carry forward tax losses and allowances to the extent that it is probable that future taxable profits will be available against which those deductible temporary differences, carry forward tax losses and allowances can be utilised. Deferred tax assets and liabilities are measured at the applicable tax rates. Deferred tax assets and deferred tax liabilities are off set, and presented as net.
Current and deferred tax relating to items directly recognised in reserves are recognised in reserves and not in the Statement of Profit and Loss.
Further, the company is paying taxes on the basis of deemed tonnage income therefore no impact on deferred tax.
t) Earnings per share Basic earnings per share is computed by dividing the profit /
(loss) after tax (including the post-tax effect of extraordinary items, if any) by the weighted average number of equity shares outstanding during the year. Diluted earnings per share is computed by dividing the profit / (loss) after tax (including the post-tax effect of extraordinary items, if any) as adjusted
for dividend, interest and other charges to expense or income (net of any attributable taxes) relating to the dilutive potential equity shares, by the weighted average number of equity shares considered for deriving basic earnings per share and the weighted average number of equity shares which could have been issued on the conversion of all dilutive potential equity shares.
Potential equity shares are deemed to be dilutive only if their conversion to equity shares would decrease the net profit per share from continuing ordinary operations. Potential dilutive equity shares are deemed to be converted as at the beginning of the period, unless they have been issued at a later date. The dilutive potential equity shares are adjusted for the proceeds receivable had the shares been actually issued at fair value (i.e. average market value of the outstanding shares). Dilutive potential equity shares are determined independently for each period presented. The number of equity shares and potentially dilutive equity shares are adjusted for share splits / reverse share splits and bonus shares, as appropriate.
u) Cash and Cash equivalents For the purpose of presentation in statement of cash flows,
cash and cash equivalents includes cash on hand, deposit held at call with financial institution, other short term, highly liquid investments with original maturities of 3 months or less that are readily convertible to known amounts of cash and which are subject to an insignificant risk of changes in value, and bank overdrafts. Bank Overdrafts are shown within borrowings in current liabilities in Balance sheet.
v) Cash flow statement Cash flows are reported using the indirect method, whereby
profit / (loss) before extraordinary items and tax is adjusted for the effects of transactions of non-cash nature and any deferrals or accruals of past or future cash receipts or payments. The cash flows from operating, investing and financing activities of the Company are segregated based on the available information.

7th ANNUAL REPORT 2016-17
55
NOTES FORMING PART OF THE STANDALONE FINANCIAL STATEMENTS FOR THE YEAR ENDED 31ST MARCH, 2017
2. PROPERTY, PLANT AND EQUIPMENT (` in crore)
Particulars Land Buildings Fleet Fleet
(taken on lease)
Aircraft Furniture
and fixtures
Vehicles Office equipment Total
As at 01..04.2015Gross Block 0.13 6.44 1,786.30 433.35 98.38 0.65 1.42 2.55 2,329.22
Accumulated Depreciation – 4.18 647.66 128.44 44.17 0.54 1.39 2.41 828.79
Deemed Cost as at 01.04.2015* 0.13 2.26 1,138.64 304.91 54.21 0.11 0.03 0.14 1,500.43 Additions – – 322.47 – – – – – 322.47
Exchange differences – – 36.58 13.65 – – – – 50.23
Transfer to assets held for sale – – (59.58) – (54.21) – – – (113.79)
Disposals – – (5.92) (318.56) – – – – (324.48)
As at 31.03.2016 0.13 2.26 1,432.19 – – 0.11 0.03 0.14 1,434.86 Additions – – 11.78 570.21 – – – 0.08 582.07
Exchange differences – – (3.79) – – – – – (3.79)
Disposals – – (579.41) – – – – – (579.41)
As at 31.03.2017 0.13 2.26 860.77 570.21 – 0.11 0.03 0.22 1,433.73 Accumulated DepreciationAs at 01.04.2015* – – – – – – – – –Additions – 0.47 139.52 7.64 5.91 0.05 0.03 0.07 153.69
Disposals – – – (7.64) (5.91) – – – (13.55)
As at 31.03.2016 – 0.47 139.52 – – 0.05 0.03 0.07 140.14 Additions – 0.48 115.91 20.66 – 0.04 – 0.05 137.14
Disposals – – (19.45) – – – – – (19.45)
As at 31.03.2017 – 0.95 235.98 20.66 – 0.09 0.03 0.12 257.83 Net BlockAs at 01.04.2015* 0.13 2.26 1,138.64 304.91 54.21 0.11 0.03 0.14 1,500.43 As at 31.03.2016 0.13 1.79 1,292.67 – – 0.06 0.00 0.07 1,294.72 As at 31.03.2017 0.13 1.31 624.79 549.55 – 0.02 0.00 0.10 1,175.90
*At deemed cost as per IND-AS 101. Refer Note 30 for further details.
(i) Leased assets The lease term in respect of assets acquired under finance leases expires within 10 years. Refer Note 23 for terms of leasing
arrangements and related disclosures.
(ii) Water treatment plant Items of Property, Plant and Equipment include a water treatment plant of value ` 38.84 crores given on lease. However, the gross
block of the same as on 1st April,2015 is Nil as per Ind-AS 101.
(iii) Assets given as security for borrowings Fleet and Land owned by the Company have been given to lenders as security for various borrowing facilities.
(iv) Impairment testing for fleet In view of pertinent slowdown in shipping industry, the Company has assessed ‘recoverable amount’ of each fleet by estimating their
“value in use”, in terms of IND-AS 36 “Impairment of Assets”. ‘Value in use’ is estimated by applying appropriate discount rate to projected net cash inflows having regard to existing long term contracts, expected tariff based on past trends and costs to operate the fleet which represents the mangement’s best estimate of the set of economic conditions that will exist over remaining useful life of each fleet. Based on the aforementioned assessment, it has been concluded that ‘recoverable amount’ of the fleet is higher than their respective carrying amount.

56
3. INVESTMENTS IN SUBSIDIARIES AND ASSOCIATES (` in crore)
Particulars
As at 31st March,
2017
As at 31st March,
2016
As at 1st April,
2015
a) Investments in equity shares of subsidiaries (unquoted, fully paid up)Nil (Previous year 73,000,000) Equity shares of `10/- each of Arkay Logistics Limited (refer foot note (i) and (ii) below) – 73.00 73.00 13,227,000 (Previous year 13,227,000) Equity shares of US$ 1/- each of Energy Transportation International Limited 67.66 67.66 67.66 40,845,026 (previous year 40,845,026) Equity shares of US$ 1 each of Energy II Limited 183.48 183.48 190.19 50 Equity shares of AED 1000/- each of Essar Shipping DMCC, Dubai* 4.37 0.09 – 246,600,001 Equity shares of US$1/- each of Essar Oilfields Services Limited, net of provision for diminution other than temporary in value amounting to `2,750 crore (refer foot note (iii) below)* 2,031.60 2,014.55 1,997.78 Total (a) 2,287.11 2,338.78 2,328.63
b) Investments in equity shares of associates (unquoted, fully paid up)35,770,000 Equity shares of `10/- each of Arkay Logistics Limited (refer foot note (i) and (ii) below) 35.77 – –Total (b) 35.77 – –
c) Investments in preference shares of subsidiaries (unquoted, fully paid up)19,873,227 (Previous year 19,873,227), 7% cumulative non convertible redeemable preference shares of US$ 10 each of Essar Oilfields Services Limited, redeemable on 24th November 2019 1,288.55 1,318.25 1,243.88 850,000 (Previous Year 850,000) 7% cumulative compulsorily convertible preference shares of US$ 10 each of Essar Oilfields Services Limited 38.25 38.25 38.25 75,90,00,000, (Previous year 75,90,00,000) 14.5% optionally convertible cumulative (redeemable) participating preference shares of `10 each of Essar Oilfield Services (India) Limited, redeemable on demand (previous year: repayable in four years) 759.00 759.00 –Total (c) 2,085.80 2,115.50 1,282.13 Total (a+b+c) 4,408.68 4,454.28 3,610.76 Aggregate amount of unquoted non - current investments 3,649.68 3,289.64 2,511.83 Current portion of unquoted investments 759.00 1,164.64 1,098.93 Aggregate amount of provision for diminution other than temporary in value of investments 2,750.00 2,750.00 2,750.00
Foot notes:(i) Negative lien undertaking on 49% shares has been issued in favour of lenders for the loan availed by Essar Global Fund
Limited, and or its subsidiaries, and 49% shares has been pledged in favour of IDBI Trusteeship Services Limited towards security for secured non convertible debentures of ` 700 crore.
(ii) On 10th March 2017, the Company sold 51% stake in Arkay Logistics Limited (ALL) to an unrelated party for a consideration of `155 crores. The resultant profit on sale of a subsidiary amounting to ` 117.77 crores is included under Other gains/losses. ALL, which was 100% owned by the Company up to the said date ceased to be a subsidiary and was treated as an associate thereafter.
(iii) The Company has completed the process of validating various operational assumptions impacting the estimated future cash flows from the operations of the Rigs of Essar Oilifields Services Limited, Mauritius and the consequent effect on the valuation of the subsidiary to determine that there is a decline, other than temporary, amounting to ` 2,750 crores in the value of the said investment. Consequent to the transitional provisions contained in IND AS 101, the said decline has been reduced from Investment in Subsidiaries with the resultant impact on Opening Retained Earnings as at 1st April, 2015 because on that date management had assessed the said investment as impaired although the process of quantifying the impact of the same was completed subsequently. To determine the said diminution, management engaged two expert valuers who used Discounted Cash Flow Forecasts to determine that out of the total investment of ` 4,747 crores, an amount of ` 1,997 crores was recoverable as at balance sheet date.
* These investments include the effect of notional income from financial guarantee obligations.

7th ANNUAL REPORT 2016-17
57
3. CURRENT INVESTMENTS (` in crore)
Particulars
As at 31st March,
2017
As at 31st March,
2016
As at 1st April,
2015
Investment in mutual fund (Unquoted, fully paid up) Nil (previous year Nil) units of `10 each of Union KBC Capital Protection Oriented Fund.
– – 0.10
Current Portion of long term investment 759.00 1,164.64 1,098.93
Total 759.00 1,164.64 1,099.03 Aggregate amount of unquoted current investment 759.00 1,164.64 1,099.03
4(a) TRADE AND OTHER RECEIVABLES (` in crore)
Particulars
As at 31st March,
2017
As at 31st March,
2016
As at 1st April,
2015
Unsecured, considered goodTrade receivables 7.16 31.83 12.68Receivables from related parties (refer note 28) 268.74 95.91 105.07Total receivables (Current) 275.90 127.74 117.75
Transferred receivables The carrying amounts of trade receivables include receivables which have been discounted with recourse. Therefore, the credit risk
for these receivables continues with the Company. Thus, the Company continues to recognise the transferred assets in their entirety in its balance sheet. The amount repayable under the bill discounting facility is presented as secured borrowing. The relevant carrying amounts are as follows:
(` in crore)
Particulars
As at 31st March,
2017
As at 31st March,
2016
As at 1st April,
2015
Total transferred receivables – 82.15 48.85Associated secured borrowing (note 10(a)) – 82.15 48.85
4(b) LOANS (CURRENT) (` in crore)
Particulars
As at 31st March,
2017
As at 31st March,
2016
As at 1st April,
2015
Unsecured, considered goodLoan to a subsidiary (including interest accrued thereon) 22.04 28.23 369.60 Loans to employees 3.64 3.94 –Total loans (Current) 25.68 32.17 369.60
LOANS (NON-CURRENT) (` in crore)
Particulars
As at 31st March,
2017
As at 31st March,
2016
As at 1st April,
2015
Loan to a subsidiary (including interest accrued thereon) – – 418.00 Total loans (Non-current) – – 418.00
Refer note 22 for disclosures relating to financial instruments.

58
4(c) CASH AND CASH EQUIVALENTS (` in crore)
Particulars
As at 31st March,
2017
As at 31st March,
2016
As at 1st April,
2015
Balances with banks in current accounts 5.26 3.68 0.43Margin money deposits (restricted, held as lien against bank guarantees) 23.52 18.96 23.97Total cash and cash equivalents 28.77 22.64 24.40
4(d) OTHER FINANCIAL ASSETS (CURRENT) (` in crore)
Particulars
As at 31st March,
2017
As at 31st March,
2016
As at 1st April,
2015
Bank deposits held as margin money, pledged against certain bank borrowingsReceivables on sale of fixed assets – – 0.20 Insurance claim receivable 8.62 6.46 0.03Interest accrued on fixed deposits 1.73 1.58 0.85Other receivable 30.31 - 4.72Security deposits 6.25 6.25 3.00 Total other financial assets (Current) 46.91 14.29 8.80
OTHER FINANCIAL ASSETS (NON-CURRENT) (` in crore)
Particulars
As at 31st March,
2017
As at 31st March,
2016
As at 1st April,
2015
Bank deposits held as margin money, pledged against certain bank borrowings 8.56 19.06 7.10Security deposits 0.78 1.06 18.66Total other financial assets (Non-current) 9.34 20.11 25.76
5. OTHER NON-CURRENT ASSETS (` in crore)
Particulars
As at 31st March,
2017
As at 31st March,
2016
As at 1st April,
2015
Income tax assets 8.89 18.50 6.52Prepayments 0.03 0.06 0.10Total other non-current assets 8.92 18.55 6.62
6. INVENTORIES (` in crore)
Particulars
As at 31st March,
2017
As at 31st March,
2016
As at 1st April,
2015
At lower of cost and net realisable valueFuel, oil and lubricants 12.49 17.42 14.18Total inventories 12.49 17.42 14.18

7th ANNUAL REPORT 2016-17
59
7. OTHER CURRENT ASSETS (` in crore)
Particulars
As at 31st March,
2017
As at 31st March,
2016
As at 1st April,
2015
Income tax assets 33.42 16.54 16.60
Unbilled revenue 25.78 53.38 7.34
Prepayments 2.53 6.53 6.08
CENVAT credit receivable 8.50 14.88 7.90
Advance towards equity 252.57 252.57 –
Advance for capital expenditure 3.20 – –
Other advances 16.27 7.43 11.35
Total other current assets 342.26 351.33 49.27
8. ASSETS CLASSFIED AS HELD FOR SALE (` in crore)
Particulars
As at 31st March,
2017
As at 31st March,
2016
As at 1st April,
2015
Fleet and Aircraft, at net realisable value or cost whichever is lower – 84.93 NIL
9. EQUITY SHARE CAPITAL AND OTHER EQUITY
9(a) Equity Share Capital
Particulars
As at 31st March, 2017
As at 31st March, 2016
As at 1st April, 2015
No of shares
Amount ` in crore
No of shares
Amount ` in crore
No of shares
Amount ` in crore
Authorised equity share capital
Equity shares of ` 10/- each 50,00,00,000 500.00 50,00,00,000 500.00 50,00,00,000 500.00
Issued, subscribed and paid-up capital
Equity shares of ` 10/- each 20,69,76,072 206.98 20,69,76,072 206.98 20,52,27,768 205.23
(i) Movements in equity share capital
Particulars
For the year ended 31st March, 2017
For the year ended 31st March, 2016
For the year ended 31st March, 2015
No of shares
Amount ` in crore
No of shares
Amount ` in crore
No of shares
Amount ` in crore
Opening balance 20,69,76,072 206.98 20,52,27,768 205.23 20,52,27,768 205.23
Issued during the year – – 17,48,304 1.75 – –
Closing balance 20,69,76,072 206.98 20,69,76,072 206.98 20,52,27,768 205.23
Terms and rights attached to equity sharesThe Company has only one class of equity shares having par value of ` 10/- per share. Each holder of the equity share is entitled to one vote per share. In the event of liquidation of the Company, the holders of equity shares will be entitled to receive remaining assets of the Company, after distribution of all preferential amounts. The distribution will be in proportion to the number of equity shares held by the shareholders.

60
(ii) Shares held by holding company /ultimate holding company, their subsidiaries and associates
ParticularsFor the year ended 31st March, 2017
For the year ended 31st March, 2016
For the year ended 31st March, 2015
Number ` in crore % Number ` in crore % Number ` in crore % a) Equity shares of `10/- each
Essar Shipping Mauritius Holdings Limited, the immediate holding company* (Formerly known as Essar Africa Steel Holdings Limited)
12,43,62,408 124.36 60.09% – – – – – –
Essar Ports & Shipping Limited, Mauritius, the immediate holding company
33 0.00 0.00% 12,43,62,408 124.36 60.60% 12,43,62,408 124.36 60.60%
Essar Shipping & Logistics Limited, Cyprus, the intermediate holding company
2,14,06,365 21.41 10.34% 2,14,06,365 21.41 10.43% 2,14,06,365 21.41 10.43%
Essar Global Fund Limited, Cayman Islands, the ultimate holding company
– – – 33 0.00 0.00% 33 0.00 0.00%
Essar Steel India Limited, India, fellow subsidiary
12,73,611 1.27 0.62% 12,73,611 1.27 0.62% 12,73,611 1.27 0.62%
14,70,42,417 147.04 71.05% 14,70,42,417 147.04 71.65% 14,70,42,417 147.04 71.65%b) Others (if holding shares more than 5%) – – – – – – – – –
There are no shareholders holding more than 5% shares in the Company except as disclosed above.
*With effect from 20th October, 2016
(iii) Aggregate number of bonus shares issued, shares issued for consideration other than cash and shares bought back during the period of five years immediately preceding the date of the Balance Sheet.
ParticularsYear (Aggregate no. of shares)
2016-17 2015-16 2014-15 2013-14 2012-13 2011-12Equity shares issued for consideration other than cash Issued as fully paid up pursuant to a Scheme of arrangement
– – – – – 20,52,27,768
Note:Shares reserved for issue under options(i) The Company has reserved issuance of 3,77,463 equity shares of ` 10 each for offering to eligible employees of the Company and its subsidiaries under
Employee Stock Options Scheme (ESOS). Refer note 27 for details.
(ii) 2,400 Foreign Currency Convertible Bonds (FCCB) are convertible into 122,852,787 equity shares, at the option of the holders, (previous year 122,852,787 equity shares) of ` 10/- each Refer foot note (i) (f) to note 10 (a) for details.
9(b) Reserves and surplus (` in crore)
Particulars
As at 31st March,
2017
As at 31st March,
2016
As at 1st April,
2015
Debenture redemption reserve 55.00 55.00 55.00 Share options outstanding account 0.61 0.50 1.47 Tonnage tax (utilised) reserve – 20.00 20.00 Tonnage tax reserve 45.00 45.00 45.00 Securities Premium 3.36 3.36 General reserve 4,855.22 4,835.22 4,835.22 Foreign currency monetary items translation difference account (FCMITDA) (21.87) (13.30) 3.86 Retained earnings (3,412.22) (3,361.61) (3,220.45)Other comprehensive income- Cash flow hedge reserve – (22.11) (12.88)- Other items of comprehensive income 0.32 0.70 –Total reserves and surplus 1,525.42 1,562.76 1,727.22

7th ANNUAL REPORT 2016-17
61
Debenture Redemption ReserveIn terms of rule 18(7) of the Companies (Share Capital and Debentures) Rules 2014, the Company is required to create a Debenture Redemption Reserve (DRR) of ` 185 crores (previous year: ` 185 crores) in respect of debentures issued and outstanding as of 31st March, 2017. However, in view of losses the Company has not created such DRR.
Share options outstanding reserveThis reserve contains the intrinsic value of unvested employee stock options
Tonnage tax (utilised) and Tonnage tax reserveThese reserves are mandatory under the Income Tax Act, 1961 for companies who opt for the Tonnage Tax scheme prescribed under the said Act.
General reserveThese were transferred to the Company at the time of its demerger from Essar Shipping Ports & Logistics Limited
Foreign currency monetary Items translation differences account or FCMITDAForeign currency losses relating to monetary items denominated in foreign currencies are accumulated in the FCMITDA and amortised over the term of the related monetary liabilities.
Cash flow hedge reserveThis records the movement in the value of cash flow hedges
Other items of comprehensive incomeThese are actuarial gains / (losses) on employee benefit obligations and Cash Flow hedges.
10(a) BORROWINGSLong term borrowings
(` in crore)
Particulars
Non - current Current As at
31st March 2017
As at 31st March
2016
As at 1st April
2015
As at 31st March
2017
As at 31st March
2016
As at 1st April
2015
Secured(a) Debentures
11.35%, 7,000 non convertible debentures of `10,00,000 each, secured by first charge on a bulk carrier of the Company, immovable property, six land rigs of a subsidiary, two tugs of a fellow subsidiary, mortgage of immovable property, first charge on eight barges and pledge of 49% of investment in equity shares of an associate (previous year: subsidiary) (Refer foot note i (a))
– – – 700.00 700.00 700.00
13.10 %, 190 non convertible debentures and 12.30% 205 non convertible debentures of ` 10,00,000 each, secured by mortgage of immovable property, repayable in single bullet payment.(refer foot note i (b) and (g))
– 39.50 39.50 19.00 – –
(b) Term loans (i) from banks
Rupee term loans [converted into foreign currency non resident (Bank) facility](secured by first charge on a very large crude carrier and its receivable)
130.29 259.54 278.06 25.76 43.93 38.32

62
(` in crore)
Particulars
Non - current Current As at
31st March 2017
As at 31st March
2016
As at 1st April
2015
As at 31st March
2017
As at 31st March
2016
As at 1st April
2015
Foreign currency term loans (secured by first charge on three (previous year five) bulk carriers and its receivables) (refer note i (g))
– 244.63 271.38 48.64 65.42 44.43
Rupee term loan (secured by first charge on a very large crude carrier and its receivable)
92.46 – – 17.70 – –
Rupee term loan (secured by six tugs and two barges of a subsidiary company)
130.00 223.38 119.38 26.00 49.96
Bills discounted facility(secured against receivables from a fellow subsidiary)
– – – – 82.15 48.85
(ii) from othersRupee term loan(secured by first charge on three mini bulkers and four tugs of an associate (previous year: subsidiary))
53.90 62.76 – 114.10 112.00 44.38
Rupee term loan (secured by assignment of rights under shipbuilding contract by the intermediate holding company with third party)
– – – – – 105.00
Total secured loans [A] 406.66 829.82 708.33 925.20 1,029.50 1,030.94 Unsecured
(a) Foreign currency convertible bonds (FCCBs) (refer note (i) (f) below)
– 1,495.62 544.53 1,528.43 – 804.74
(b) Finance lease obligations (refer note 23)
528.05 – 158.65 15.62 – 83.11
(c) Others – 43.05 13.79 45.76 28.30 20.69
Total unsecured loans [B] 528.05 1,538.67 716.97 1,589.81 28.30 908.54 Total [A+B] 934.71 2,368.49 1,425.30 2,515.02 1,057.80 1,939.48 Unamortised upfront fees 28.12 17.85 22.86 4.90 36.31 6.16
Total Long term Borrowings 906.58 2,350.64 1,402.44 Current maturities of long term borrowings included in Other financial liabilities
2,510.12 1,021.49 1,933.32
Short-term borrowings, Cash credit facility from a bank, repayable on demand (secured by first parri passu charge on a very large crude carrier)
53.76 54.43 50.68
Short-term loan(secured by subservient charge on present and future surplus cash flows of the Company)
25.00 25.00 125.00

7th ANNUAL REPORT 2016-17
63
(` in crore)
Particulars
Non - current Current As at
31st March 2017
As at 31st March
2016
As at 1st April
2015
As at 31st March
2017
As at 31st March
2016
As at 1st April
2015
Unsecured loans from others (previous year: fellow subsidiaries)
271.00 385.41 –
Long term loans classified as current owing to covenant defaults (Refer Note (i) g)
90.00 – –
Total short-term borrowings 439.76 464.84 175.68
Foot notes:- i) Repayment terms:
a) Secured debentures: 2,000 debentures issued on 25th March 2010 and 5,000 debentures issued on 22nd June 2009 are redeemable at the expiry of 10 years with put and call option exercisable after five years from their respective dates of issue. The Company has received notice from the debenture holder invoking the put option. The Company is in discussion with the debenture holder to waive the option and based on the said discussion, the management is reasonably confident that the debenture holder will waive the option and the debentures would be redeemed at the expiry of ten years from the date of their issue. However, the debentures have been classified as current liabilities till such waiver is received.
b) Secured debentures: 205 debentures issued on 01st February 2013 are redeemable at the expiry of 10 years from the date of issue and the holder of the debentures have the option to call after 5 years from the date of issue. 40 debentures issued on 12th October 2012, 50 debentures issued on 28th June 2012 and 100 debentures issued on 22nd June 2012 are redeemable at the expiry of 5 years from their respective date of issue.
c) Secured Rupee term loans from banks and others: Repayable in quarterly/monthly instalments starting from October, 2010 to December, 2019.
d) Secured foreign currency term loans from banks : Repayable in quarterly instalments starting from March, 2006 to July, 2019
e) Finance lease obligation: Repayable in monthly instalments starting from November 2016 to April, 2027.
f) Foreign currency convertible bonds: FCCBs of US$ 111,428,571 (Series B) due on 24th August, 2017 and US$ 128,571,429 (Series A) due on 24th August, 2015 got extended to 24th August, 2017, carry interest @5% per annum payable semi annually. The FCCBs are convertible into 122,852,787 fully-paid equity shares of ` 10 each of the Company, any time upto the date of maturity, at the option of the FCCB holders at conversion price of ` 91.70 per share at a predetermined exchange rate of ` 46.94 per US$. The FCCBs, if not converted till the maturity date, will be redeemed at par. The FCCB holder, an intermediate holding company, has already informed the Company of its intention to convert these FCCB’s into equity shares on the maturity date.
g) The classification of loans between current liabilities and non -current liabilities continues based on repayment schedule under respective agreements as no loans have been recalled due to non compliance of conditions under any of the loan agreements except in case of certain non current borrowings from banks amounting to ` 90 crores (consisting of long term debentures ` 20.5 crores and long term foreign currency loans ` 69.5 crores) where the lenders have not confirmed the loan balances on the balance sheet date
h) Interest rates: Loans availed from banks, financial institutions, NBFC’s and Alternate Investment Funds carry a weighted average interest rate of 8.06% per annum (previous year: 7.53% per annum)
i) Scheduled repayments: Contractual repayments in case of loans from banks, financial institutions, NBFC’s and Alternate Investment Funds are provided below:
(` in crore)
ParticularsAs at
31st March, 2017
As at 31st March,
2016
As at 1st April,
2015
Between one to three years 2,982.46 2,848.13 2,604.54
Between three to five years 660.98 186.97 246.62
Over five years 273.41 334.04 245.06

64
10(b) Trade payables (` in crore)
Particulars
As at 31st March,
2017
As at 31st March,
2016
As at 1st April,
2015
Trade payables:
- Dues to micro and small enterprises(refer note below) 0.16 0.04 0.07
- Other than micro and small enterprises 196.74 272.15 241.66
Total trade payables 196.90 272.19 241.73
Note: Micro and small enterprises under the Micro, Small and Medium Enterprises Development Act, 2006 have been determined based on the information available with the Company and the required disclosures are given below:
(` in crore)
Particulars
As at 31st March,
2017
As at 31st March,
2016
As at 1st April,
2015
Principal amount due and remaining unpaid 0.16 0.04 0.07
Interest due and unpaid on the above amount – – –
Interest paid by the Company in terms of section 16 of the Micro, Small and Medium enterprises Act, 2006
– – –
Payment made beyond the appointed day during the year – – –
Interest due and payable for the period of delay – – –
Interest accrued and remaining unpaid – – –
Amount of further interest remaining due and payable – – –
10(c) Other financial liabilitiesOther financial liabilities (current) (` in crore)
Particulars
As at 31st March,
2017
As at 31st March,
2016
As at 1st April,
2015
Current maturities of long term borrowings, including instalments overdue at the year end ` 842.49 crores (previous year: ` 827.67 crores)
2,510.12 1,021.49 1,933.32
Security deposit from related parties (Refer note 28) 1.50 13.50 4.50 Security deposit from others 12.00 –Interest accrued, including interest overdue at the year end ` 356.44 crores (previous year: ` 227.28 crores)
425.48 264.08 158.44
Temporary overdrawn bank balances – 0.05 2.73 Advance from customers 6.39 5.09 9.17Total other financial liabilities (current) 2,955.49 1,304.21 2,108.16
Other financial liabilities (Non-current) (` in crore)
Particulars
As at 31st March,
2017
As at 31st March,
2016
As at 1st April,
2015
Security deposit from related parties (Refer note 28) – – 9.00
Interest accrued – – 35.49
Total other financial liabilities (Non-current) – – 44.49

7th ANNUAL REPORT 2016-17
65
11. DERIVATIVE LIABILITY (` in crore)
Particulars
As at 31st March,
2017
As at 31st March,
2016
As at 1st April,
2015
Interest rate swaps – 22.11 12.88
Total derivative liabilities – 22.11 12.88
The Company follows hedge accounting principles for accounting of certain forward foreign exchange contracts to hedge the exchange risk pertaining to highly forecasted transactions. Accordingly mark to market losses of Nil (previous year ` 22.11) crore has been carried over to cash flow hedge reserve as of 31st March, 2016 for Currency Swap hedging.
12. EMPLOYEE BENEFIT OBLIGATIONS (` in crore)
Particulars
As at 31st March,
2017
As at 31st March,
2016
As at 1st April,
2015
Defined benefit plans 5.17 4.22 4.03
Defined contribution schemes 0.49 0.94 1.49
Total employee benefit obligations (Current) 5.66 5.16 5.52
I. Details of retirement plans:
The employees of the Company are members of a state – managed retirement benefit plans namely provident fund, gratuity fund and superannuation fund operated by the Government of India. The Company is required to contribute a specified percentage of payroll costs to the retirement benefit scheme to fund the benefits. The only obligation of the company with respect to the retirement benefit plan is to make the specified contributions.
The Company has recognised the following amounts in the Income Statement during the year under ‘Contribution to staff provident and other funds’ (refer note 18).
(` in crore)
Particulars
As at 31st March,
2017
As at 31st March,
2016
Employer’s contribution to gratuity fund (offshore crew staff) 0.21 0.25
Group accident policy cover (all employees) 0.01 0.01
Contribution to pension fund (offshore crew staff) 0.32 0.34
Employer’s contribution to provident fund (offshore crew staff) 0.26 0.24
Total 0.80 0.84
II. Defined benefit plans The company operates funded gratuity, non funded gratuity and funded provident fund plan for qualifying employees. Under the plans
the employees are entitled to retirement benefits depending upon the number of years of service rendered by them subject to minimum specified number of years of service. No other post retirement benefits are provided to these employees.
The actuarial valuation of plan assets and the present value of defined benefit obligation were carried out at March 31, 2017 by the certified actuarial valuer. The present value of the defined benefit obligation, related current service cost and past service cost were measured using the projected unit credit method.

66
(A) Movements in present value of defined benefit obligation (` in crore)
Particulars
Gratuity (funded) 31.03.17
Gratuity (non
funded) 31.03.17
Provident fund
(funded) 31.03.17
Gratuity (funded) 31.03.16
Gratuity (non-
funded) 31.03.16
Provident fund
(funded) 31.03.16
Obligations as at beginning of the year 1.67 3.74 36.74 2.08 3.30 41.08 Current service cost 0.09 0.50 0.83 0.10 0.31 1.00 Current service contribution- employee – – 1.00 – – 1.16 Interest cost 0.11 0.29 1.84 0.15 0.25 2.33 Transfer in – – 0.33 – – 0.46 Benefits paid (0.41) – (6.83) (0.39) (0.26) (9.48)Actuarial (gain)/loss 0.03 0.04 – (0.27) 0.14 0.19 Present value of defined benefit obligation as at end of the year
1.49 4.57 33.91 1.67 3.74 36.74
(B) Movements in the fair value of plan assets (` in crore)
Particulars
Gratuity (funded) 31.03.17
Provident fund
(funded) 31.03.17
Gratuity (funded) 31.03.16
Provident fund
(funded) 31.03.16
Fair value of plan assets at beginning of the year 1.19 36.74 1.43 41.08 Expected return on plan assets (0.02) – 0.11 –Actual return on plan assets 0.08 1.84 0.03 2.52 Actuarial gain/(loss) on plan assets – – 0.01 –Contributions by the employer 0.05 1.83 – 2.61 Other adjustments – 0.33 – –Benefits paid (0.41) (6.83) (0.39) (9.47)Fair value of plan assets as at end of the year 0.89 33.91 1.19 36.74
(C) Amount recognized in the balance sheet (` in crore)
Particulars
Gratuity (funded) 31.03.17
Gratuity (non
funded) 31.03.17
Provident fund
(funded) 31.03.17
Gratuity (funded) 31.03.16
Gratuity (non-
funded) 31.03.16
Provident fund
(funded) 31.03.16
Present value of defined benefit obligation as at end of the year
1.49 4.57 33.91 1.67 3.74 36.74
Fair value of plan assets as at end of the year
0.89 – 33.91 1.19 – 36.74
As at year end 0.60 4.57 – 0.48 3.74 –
(D) Amounts recognized in the Statement of Profit and Loss (` in crore)
Particulars
Gratuity (funded) 31.03.17
Gratuity (non
funded) 31.03.17
Provident fund
(funded) 31.03.17
Gratuity (funded) 31.03.16
Gratuity (non-
funded) 31.03.16
Provident fund
(funded) 31.03.16
Current service cost 0.09 0.50 0.83 0.10 0.31 1.00 Interest cost – 0.29 – – 0.25 2.33 Expected return on plan assets – – – – – (2.33)Net actuarial (gain)/loss recognized in the year
0.03 – – 0.05 – –
Total 0.12 0.79 0.83 0.15 0.57 1.00

7th ANNUAL REPORT 2016-17
67
(E) Amounts recognised in other comprehensive income (` in crore)
Particulars 31.03.17 31.03.16
Experience adjustments (0.38) 0.70
Total (0.38) 0.70
(F) Category of plan assets The Group’s plan assets in respect of gratuity are funded through the Group Gratuity Schemes of the Life Insurance Corporation of
India (LIC).
ParticularsGratuity (funded) 31.03.17
Provident fund
(funded) 31.03.17
Gratuity (funded) 31.03.16
Provident fund
(funded) 31.03.16
Administered by Life Insurance Corporation of India * 100.00% – 100.00% –
Government of India Securities – 52.19% – 40.00%
Public sector bonds / TDRs – 47.81% – 60.00%
* The Company is unable to obtain the details of plan assets from the Life Insurance Corporation of India and hence the disclosure thereof is not made.
(G) Sensitivity analysis (` in crore)
Particulars
Gratuity
(funded) 31.03.17
(funded) 31.03.16
DBO On base assumptions 1.49 4.57
A. Discount Rate 0.07 0.07
1. Effect due to 0.5% increase in discount rate (0.03) (0.17)
2. Effect due to 0.5% decrease in discount rate 0.03 0.18
B. Salary Escalation Rate 0.09 0.09
1. Effect due to 0.5% increase in salary escalation rate (0.02) 0.17
2. Effect due to 0.5% decrease in salary escalation rate 0.02 (0.16)
C. Withdrawal Rate 0.08 0.07
1. Effect due to 5% increase in withdrawal rate 0.01 (0.36)
2. Effect due to 5% decrease in withdrawal rate (0.02) 0.58
Risk Exposure - Asset VolatilityThe plan liabilities are calculated using a discount rate set with reference to bond yields; if plan assets underperform this yield, this will create a deficit. Most of the plan asset investments is in fixed income securities with high grades and in government securities. These are subject to interest rate risk and the fund manages interest rate risk derivatives to minimize risk to an acceptable level. A portion of the funds are invested in equity securities and in alternative investments % which have low correlation with equity securities. The equity securities are expected to earn a return in excess of the discount rate and contribute to the plan deficit.
(H) Actuarial assumptions Actuarial valuation as at the year-end was done in respect of the aforesaid defined benefit plans based on the following assumptions:
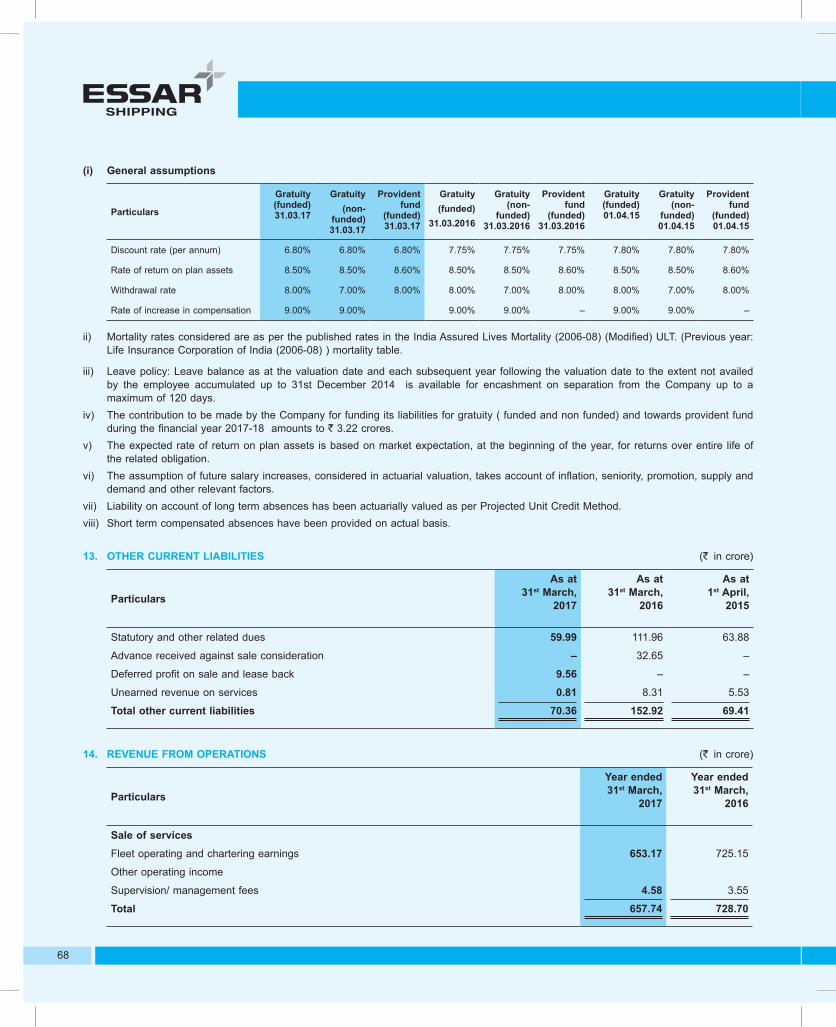
68
(i) General assumptions
Particulars
Gratuity (funded) 31.03.17
Gratuity(non-
funded) 31.03.17
Provident fund
(funded) 31.03.17
Gratuity(funded)
31.03.2016
Gratuity (non-
funded) 31.03.2016
Provident fund
(funded) 31.03.2016
Gratuity (funded) 01.04.15
Gratuity (non-
funded) 01.04.15
Provident fund
(funded) 01.04.15
Discount rate (per annum) 6.80% 6.80% 6.80% 7.75% 7.75% 7.75% 7.80% 7.80% 7.80%
Rate of return on plan assets 8.50% 8.50% 8.60% 8.50% 8.50% 8.60% 8.50% 8.50% 8.60%
Withdrawal rate 8.00% 7.00% 8.00% 8.00% 7.00% 8.00% 8.00% 7.00% 8.00%
Rate of increase in compensation 9.00% 9.00% 9.00% 9.00% – 9.00% 9.00% –
ii) Mortality rates considered are as per the published rates in the India Assured Lives Mortality (2006-08) (Modified) ULT. (Previous year: Life Insurance Corporation of India (2006-08) ) mortality table.
iii) Leave policy: Leave balance as at the valuation date and each subsequent year following the valuation date to the extent not availed by the employee accumulated up to 31st December 2014 is available for encashment on separation from the Company up to a maximum of 120 days.
iv) The contribution to be made by the Company for funding its liabilities for gratuity ( funded and non funded) and towards provident fund during the financial year 2017-18 amounts to ` 3.22 crores.
v) The expected rate of return on plan assets is based on market expectation, at the beginning of the year, for returns over entire life of the related obligation.
vi) The assumption of future salary increases, considered in actuarial valuation, takes account of inflation, seniority, promotion, supply and demand and other relevant factors.
vii) Liability on account of long term absences has been actuarially valued as per Projected Unit Credit Method.viii) Short term compensated absences have been provided on actual basis.
13. OTHER CURRENT LIABILITIES (` in crore)
Particulars
As at 31st March,
2017
As at 31st March,
2016
As at 1st April,
2015
Statutory and other related dues 59.99 111.96 63.88
Advance received against sale consideration – 32.65 –
Deferred profit on sale and lease back 9.56 – –
Unearned revenue on services 0.81 8.31 5.53
Total other current liabilities 70.36 152.92 69.41
14. REVENUE FROM OPERATIONS (` in crore)
Particulars
Year ended 31st March,
2017
Year ended 31st March,
2016
Sale of services
Fleet operating and chartering earnings 653.17 725.15
Other operating income
Supervision/ management fees 4.58 3.55
Total 657.74 728.70

7th ANNUAL REPORT 2016-17
69
15. OTHER INCOME (` in crore)
Particulars
Year ended 31st March,
2017
Year ended 31st March,
2016
Interest income
- from banks 1.42 2.95
- from related parties on intercorporate deposits (refer note 28) – 54.90
- from others – 0.11
Other non operating income 4.91 2.20
Total 6.33 60.17
16. OTHER GAINS / (LOSSES)-NET (` in crore)
Particulars
Year ended 31st March,
2017
Year ended 31st March,
2016
Gain on sale of stake in a subsidiary (refer note 4(a)) 117.77 –
Income from financial guarantee obligation 21.34 16.77
Diminution in value of fleet held for sale – (28.86)
Net gain/ (loss) on foreign currency translation and transactions 11.16 (10.46)
Gain on foreclosure of finance leases – 53.27
Gain on buy-back of equity shares by a subsidiary – 5.81
Loss on sale of fleet (2.33) –
Profit on sale of other assets – 0.09
Total 147.93 36.62
17. OPERATING EXPENSES (` in crore)
Particulars
Year ended 31st March,
2017
Year ended 31st March,
2016
Consumption of stores and spares 14.55 11.27
Consumption of fuel, oil and water 127.95 100.93
Direct voyage expenses 124.62 241.80
Commission, brokerage and agency fees 0.88 0.89
Standing costs 20.02 16.10
Insurance, protection and indemnity club fees 34.62 31.85
Total 322.64 402.84

70
18. EMPLOYEE BENEFITS EXPENSES (` in crore)
Particulars
Year ended 31st March,
2017
Year ended 31st March,
2016
Offshore staff Salaries, wages and bonus 79.69 76.03 Contribution to staff provident and other funds 1.71 1.58 Staff welfare expenses 8.49 10.72 Office staffSalaries, wages and bonus 11.18 13.93 Contribution to staff provident and other funds 0.49 1.52 Staff welfare expenses 1.63 1.73 Employee Stock Option Scheme (refer note 27) 0.10 0.25 Total 103.29 105.76
19. FINANCE COSTS (` in crore)
Particulars
Year ended 31st March,
2017
Year ended 31st March,
2016
Interest expense- on bank loans 61.95 59.13 - on loans from financial Institutions 34.59 36.57 - on finance lease obligations 5.49 0.28 - on foreign currency convertible bonds 56.39 91.93 - on debentures 106.38 95.83 - on others 77.01 50.54 Loan commitment / processing charges, guarantee fees and other charges 10.81 8.37 Total 352.63 342.65
20. OTHER EXPENSES (` in crore)
Particulars
Year ended 31st March,
2017
Year ended 31st March,
2016
Rent 2.73 4.78 Rates and taxes 0.02 0.15 Repairs and maintenance-buildings 0.09 0.04 -others 4.03 0.31 Legal and professional fees 2.77 6.50 Travelling and conveyance 1.44 1.34 Auditor's remuneration (refer note below) 0.33 0.26 Other establishment expenses 1.52 1.47 Total 12.93 14.86

7th ANNUAL REPORT 2016-17
71
NoteAuditor’s remuneration comprises (net of service tax)
Year ended 31st March,
2017
Year ended 31st March,
2016
As auditor 0.28 0.26 Reimbursement of expenses 0.01 0.01 For other services 0.04 –Total 0.33 0.26
21. INCOME TAXES Income tax expense recognised in the profit and loss account comprises of: (` in crore)
ParticularsYear ended 31st March,
2017
Year ended 31st March,
2016
Current income taxes 2.65 3.39 Income tax expense for the year 2.65 3.39 Effective tax rate (%) -2.27% -1.74%
The reconciliation of income tax expense applicable to accounting profit before income tax at statutory income tax rate to income tax expense at the Company’s effective income tax rate for the year ended 31st March, 2017 and 31st March, 2016 are as follows:
(` in crore)
ParticularsYear ended 31st March,
2017
Year ended 31st March,
2016
Loss before taxes (116.63) (194.31)Effective tax rate in India: Nil* – –Tax effect of adjustment for profits subject to tonnage tax regime / presumptive taxation (2.65) (3.39)Income tax expense recognised in the profit and loss account (2.65) (3.39)
*Note: In case of Indian shipping companies, tax expense is computed based on the gross tonnage of the vessels for the income subject to tonnage tax. In case of income not subject to tonnage tax, the same is calculated based on the taxable profits calculated in accordance with the local tax laws.
22. FINANCIAL INSTRUMENTS(i) Capital management The Company manages its capital to ensure that entities in the company will be able to continue as a going concern while maximising
the return to stakeholders through the optimisation of the debt and equity balance. The company’s overall strategy remains unchanged from 2015-16. The capital structure of the company consists of debt, which includes the borrowings including temporary overdrawn balance, cash and cash equivalents including short term bank deposits, equity comprising issued capital, reserves and non-controlling interests. The gearing ratio for the year is as under:
(` in crore)
ParticularsAs at
31st March, 2017
As at 31st March,
2016
As at 1st April,
2015
Debt (including borrowings from related and unrelated parties and finance lease obligations)
3,856.46 3,837.02 3,514.17
Less: Cash and cash equivalent including short term deposits (restricted) (28.77) (22.64) (24.40)Net debt (A) 3,827.69 3,814.38 3,489.77 Total equity (B) 1,760.10 1,866.11 2,085.36 Net debt to equity ratio (A/B) 2.17 2.04 1.67

72
(ii) Categories of financial instruments (` in crore)
ParticularsAs at 31st March 2017 As at 31st March 2016 As at 1st April 2015
Carrying value Fair value Carrying
value Fair value Carrying value Fair value
Financial assets:At amortised cost Cash and cash equivalents 28.77 28.77 22.64 22.64 24.40 24.40 Loans and other receivables 301.58 301.58 159.91 159.91 905.35 905.35 Other financial assets 56.25 56.25 34.40 34.40 34.56 34.56 Total 386.60 386.60 216.95 216.95 964.31 964.31
Financial liabilities:At amortised costBorrowings 3,312.79 3,312.79 3,837.02 3,837.02 3,272.41 3,272.41 Finance lease payables 543.67 543.67 – – 241.76 241.76 Trade and other payables 196.90 196.90 272.19 272.19 241.73 241.73 At fair value through profit and lossDerivatives – – 22.11 22.11 12.88 12.88 Other financial liabilities 445.37 445.37 282.67 282.67 216.60 216.60 Total 4,498.73 4,498.73 4,414.00 4,414.00 3,985.39 3,985.39
Fair value measurements recognised in the statement of financial position:The following table provides an analysis of financial instruments that are measured subsequent to initial recognition at fair value, grouped into Levels 1 to 3 based on the degree to which the fair value is observable.
- Level 1 fair value measurements are those derived from quoted prices (unadjusted) in active markets for identical assets or liabilities.
- Level 2 fair value measurements are those derived from inputs other than quoted prices included within Level 1 that are observable for the asset or liability, either directly (i.e. as prices) or indirectly (i.e. derived from prices).
- Level 3 fair value measurements are those derived from valuation techniques that include inputs for the asset or liability that are not based on observable market data (unobservable inputs).
(` in crore)
At 1st April, 2015 Level 1 Level 2 Level 3 Total
Financial assets at fair value through profit or lossInvestments in mutual funds 0.10 – – 0.10 Financial liabilities at fair value through profit or lossDerivative financial liabilities – 12.88 – 12.88
At 31st March, 2016 Level 1 Level 2 Level 3 Total
Finance liabilities at fair value through profit or lossDerivative financial liabilities – 22.11 – 22.11
At 31st March, 2017 Level 1 Level 2 Level 3 Total
Finance liabilities at fair value through profit or lossDerivative financial liabilities – – – –

7th ANNUAL REPORT 2016-17
73
The fair value of the financial assets and liabilities are included at the amount at which the instrument could be exchanged in a current transaction between willing parties, other than in a forced or liquidation sale. The following methods and assumptions were used to estimate the fair values:
a) Cash and short-term deposits, trade and other receivables, trade and other payables, and other current liabilities approximate their carrying amounts largely due to the short-term maturities or nature of these instruments.
b) The fair value of loans from banks and other financial indebtedness as well as other non current financial liabilities is estimated by discounting future cash flows using rates currently available for debt or similar terms and remaining maturities.
c) Derivative instruments have been fair valued on the reporting date on the basis of quotes provided by the third party qualified valuer / market participants.
(iii) Financial risk management objectives: The Company’s principal financial liabilities comprise of loan from banks and financial institutions, finance lease obligations, overdrafts
and trade payables. The main purpose of these financial liabilities is to raise finance for the Company’s operations. The Company has various financial assets such as trade receivables, cash and short term deposits, which arise directly from its operations.
The main risks arising from Company’s financial instruments are foreign currency risk, interest rate risk, credit risk and liquidity risk. The Board of Directors review and agree policies for managing each of these risks.
(iv) Foreign currency risk: Foreign currency risk mainly arises from transactions undertaken by an operating unit denominated in currencies other than its
functional currency. Exposure to foreign currency risk is partly mitigated by natural hedges of matching revenues and costs.
The carrying amounts of the Company’s financial assets and financial liabilities denominated in foreign currencies at the reporting date are as follows:
(` in crore)
ParticularsAs at 31st March 2017 As at 31st March 2016 As at 1st April 2015
Financial assets
Financial liabilities
Financial assets
Financial liabilities
Financial assets
Financial liabilities
United States Dollars (US$) 246.72 2,446.71 35.28 2,269.93 20.64 2,376.30
Currencies other than INR & US$ – 5.82 – 16.14 – 8.28
Total 246.72 2,452.53 35.28 2,286.07 20.64 2,384.58
The following table details the Company’s sensitivity to a 5% increase and decrease in the functional currency against the relevant foreign currencies of all the companies in the Company. 5% is the sensitivity rate used when reporting foreign currency risk internally to key management personnel and represents management’s assessment of the reasonably possible change in foreign exchange rates. The sensitivity analysis includes only outstanding foreign currency denominated monetary items and adjusts their translation at the period end for a 5% change in foreign currency rates. A positive number below indicates an increase in profit and other equity where the respective functional currency strengthens by 5% against the relevant foreign currency. For a 5% weakening of the functional currency against the relevant currency, there would be an equal and opposite impact on the profit and other equity, and the balances below would be negative.
(` in crore)
Particulars
As at 31st March,
2017
As at 31st March,
2016
As at 1st April,
2015
Impact on profit before taxUS$ impact (110.00) (111.73) (117.78)
(v) Interest rate risk: The Company is exposed to interest rate risk as entities in the Company borrow funds at floating interest rates. The interest rate risk
is managed by monitoring the Company’s level of borrowings periodically and structuring its borrowings on varying maturities and interest rate terms. The Company’s exposures to interest rates on financial assets and financial liabilities are detailed in the liquidity risk management section of this note.
Interest rate sensitivity analysis:
The sensitivity analysis below has been determined based on the exposure to interest rates at the balance sheet date. For floating rate liabilities, the analysis is prepared assuming the amount of liability outstanding at the balance sheet date was outstanding for the whole

74
year. A 50 basis point increase or decrease is used when reporting interest rate risk internally to key management personnel and represents management’s assessment of the reasonably possible change in interest rates.
If interest rates had been 50 basis points higher/lower and all other variables were held constant, the Company’s loss for the year ended March 31, 2017 would increase/decrease by `3.87 crores (previous year `6.08 crores). This is mainly attributable to the Company’s exposure to interest rates on its variable rate borrowings.
(vi) Other price risk: The Company is not exposed to any significant equity price risks arising from equity investments, as on 31st March 2017. Equity
investments are held for strategic rather than trading purposes. The Company does not actively trade these investments.
Equity price sensitivity analysis:
There is no exposure to equity price risks as at the reporting date or as at the previous reporting date.
(vii) Credit risk: The credit risk is primarily attributable to the Company’s trade and other receivables and guarantees given by the Company on behalf
of others. The amounts presented in this standalone statement of financial position are net of allowances for doubtful receivables, estimated by management based on prior experience and their assessment of the current economic environment. The maximum related party credit exposure at March 31, 2017 on account of carrying amount of advances /deposit, trade and other receivables and guarantees is disclosed in note 28 on related party transactions. Based on the creditworthiness of the related parties, financial strength of related parties and its parents and past history of recoveries from them, the credit risk is mitigated. Credit risk relating to unrelating parties is minimised as the Company deals only with reputed parties.
Cash and cash equivalents are held with reputable and credit-worthy banks.
(viii) Fair value of financial instruments: All financial assets are initially recognised at fair value of consideration paid. Subsequently, financial assets are carried at fair value or
amortized cost less impairment. Where non – derivative financial assets are carried at fair value, gains and losses on re- measurement are recognised directly in equity unless the financial assets have been designated as being held at fair value through profit or loss, in which case the gains and losses are recognised directly in the standalone Statement of Profit and Loss. Financial assets are designated as being held at fair value through profit or loss when it is necessary to reduce measurement inconsistency for related assets and liabilities. All financial liabilities other than derivatives are initially recognised at fair value of consideration received net of transaction costs as appropriate (initial cost) and subsequently carried at amortised cost.
(ix) Liquidity risk: Ultimate responsibility for liquidity risk management rests with the Board of Directors, which has built an appropriate liquidity risk
management framework for the management of the Company’s short, medium and long-term funding and liquidity management requirements. The Company manages liquidity risk by maintaining adequate reserves, banking facilities and reserve borrowing facilities, by continuously monitoring forecast and actual cash flows and matching the maturity profiles of financial assets and liabilities.
The Company monitors its risk of shortage of funds using a recurring liquidity planning tool. This tool considers the maturity of both its financial investments and financial assets (e.g. accounts receivables, other financial assets) and projected cash flows from operations, public offerings and refinancing of current borrowings.
Liquidity table:
The following tables detail the Company’s remaining contractual maturity for its financial liabilities. The tables have been drawn up based on the cash flows of financial liabilities based on the earliest date on which the Company can be required to pay:
(` in crore)
Particulars
As at 1st April, 2015 Within One
Year One to
five years More than five
years Total
` in crore
Financial instruments:Borrowings 2,032.05 1,021.59 245.06 3,298.70 Finance lease payables 83.11 158.65 – 241.76 Trade and other payables 241.73 – – 241.73 Derivatives – 12.88 – 12.88 Other financial liabilities 174.84 44.49 – 219.33 Total financial liabilities 2,531.73 1,237.61 245.06 4,014.40

7th ANNUAL REPORT 2016-17
75
(` in crore)
Particulars
As at 31st March, 2016 Within One
Year One to
five years More than five
years Total
Financial instruments:Borrowings 1,522.64 2,034.45 334.04 3,891.13 Trade and other payables 272.19 – – 272.19 Derivatives – 22.11 – 22.11 Other financial liabilities 282.72 – – 282.72 Total financial liabilities 2,077.55 2,056.56 334.04 4,468.15
(` in crore)
Particulars
As at 31st March, 2017 Within One
Year ` in crore
One to five years ` in crore
More than five years
` in crore
Total ` in
croreFinancial instruments:Borrowings 2,939.15 406.66 – 3,345.81 Finance lease 15.62 147.39 380.66 543.67 Trade and other payables 196.90 – – 196.90 Other financial liabilities 445.37 – – 445.37 Total financial liabilities 3,597.05 554.05 380.66 4,531.75
23. LEASES Details of leasing arrangements:
Finance leases : Company as a lessee (` in crore)
Particulars
- not later than one year
- later than one year but
not later than five years
- later than five years
Total
As at 31st March, 2017Future minimum lease payments 42.91 225.05 432.74 700.70 Unmatured finance charges 27.29 77.66 52.08 157.03 Present value of minimum lease payments 15.62 147.39 380.66 543.67
As at 31st March, 2016
Future minimum lease payments – – – –
Unmatured finance charges – – – –
Present value of minimum lease payments – – – –
As at 1st April, 2015
Future minimum lease payments 84.04 159.87 – 243.91
Unmatured finance charges 0.93 1.22 – 2.15
Present value of minimum lease payments 83.11 158.65 – 241.76
Operating leases : Company as a lesseeThe Company has not entered into any non-cancellable operating leases.

76
24. CONTINGENCIES Contingent liabiliteis to the extent not provided for (` in crore)
Claims against the Company not acknowledged as debtsAs at
31st March, 2017
As at 31st March,
2016
As at 1st April
2015 Guarantee given by a bank against disputed custom duty demand of ` 27.40 crore by DGFT
30.00 30.00 30.00
Income tax demand- appeal filed by the company with Commissioner of Income Tax-Appeals
54.84 – –
Income tax demand -appeal filed by the Income tax department in the High court of Bombay against the order of Appellate Tribunal in favour of the Company
7.29 7.29 7.29
` in crore
OthersAs at
31st March, 2017
As at 31st March,
2016
As at 1st April
2015 Corporate guarantees on behalf of subsidiaries* 1,137.01 712.02 592.03 *Includes corporate guarantees issued during the year on behalf of Essar Shipping DMCC for general business purposes amounting to ` 358 crores
Contingent AssetThe Company has received an award in its favour for an amount of ` 305.59 crores on account of arbitration initiated by the Company against a charterer for illegally terminating a Contract of Affreightment entered between the Company and the Charterer and no impact of the same has been considered in the financials as the Charterer has preferred an appeal against the said arbitration award.
25. SEGMENT REPORTING Business segment and geographical segment
Business segment The Company has only one reportable primary business segment of fleet operating and chartering.
Geographical segment The Company’s fleet operations are managed on a worldwide basis from India. The revenue from operations are identified as
geographical segment based on location of customers:(` in crore)
Revenue from operationsYear ended
31st March, 2017
Year ended 31st March,
2016India 473.23 527.63 East Africa 4.64 - Singapore 17.62 95.01 Cyprus 1.77 1.75 UAE 40.84 50.03 South Korea 5.90 28.14 Bermuda 113.74 26.13 TOTAL 657.74 728.70
The main operating assets represent floating fleet, which are not identifiable to any geographical location.

7th ANNUAL REPORT 2016-17
77
26. EARNINGS PER SHARE (` in crore)
ParticularsYear ended
31st March, 2017
Year ended 31st March,
2016Loss for the year (119.28) (197.70)Equity shares at the beginning of the year (nos.) 20,69,76,072 20,52,27,768 Equity shares issued during the year – 17,48,304 Equity shares at the end of the year (nos.) 20,69,76,072 20,69,76,072Weighted average equity shares for the purpose of calculating basic earnings per share (nos.) 20,69,76,072 20,52,99,420Weighted average equity shares for the purpose of calculating diluted earnings per share (nos.) 20,69,76,072 20,55,21,807Earnings per share-basic (face value of `10/- each) (`) (5.78) (9.96)Earnings per share-diluted (face value of `10/- each) (`) (5.78) (9.96)
Note:Equity shares to be issued upon conversion of FCCB and exercise of Employee Stock Option Scheme have not been considered for the purpose of calculation of weighted average number of diluted equity shares, as they are anti dilutive.
Disclosure under Regulation 34(3) of the SEBI (Listing Obligation and Disclosure Requirements), Regulations, 2015(` in crore)
Particulars
Year ended 31st March, 2017 Year ended 31st March, 2016Amount
outstandingMaximum
amount outstanding
Amount outstanding
Maximum amount
outstandingSubsidiary companiesa) Essar Oilfields Services India Limited 22.04 28.23 28.23 797.22
27. EMPLOYEE STOCK OPTION SCHEME In the Annual general meeting held on September 9, 2011, the shareholders approved the issue of Employee Stock options under the
Scheme titled “Essar Shipping Employee Stock options Scheme -2011” (hereafter named ESOS A). The ESOS A allows the issue of options to employees and executive Directors of the Company and its subsidiaries (whether in India or
abroad). Each option comprises one underlying equity share. As per the Scheme, the Compensation Committee grants the options to the employees deemed eligible. The exercise price of each
option shall be determined by the Compensation committee as per the said scheme. The options granted vest in a graded manner over a period of 5/4/3 years from the date of the grant in proportions specified in the Scheme. Options may be exercised within 7 years from the date of vesting. The Company has issued the said ESOS in two tranches on November 2, 2011 and February 8, 2012 at an exercise price of ` 22.30 each, the market price of the shares on the grant date of the ESOS was ` 22.30 per share and `31.30 per share respectively.
The difference between the market price of the share underlying the options granted on the date of grant of option and the exercise price of the option (being the intrinsic value of the option) representing Stock compensation expense is expensed over the vesting period.
Employee stock options details for ESOS A as on the Balance Sheet date are as follows:
Particulars
Year ended 31st March, 2017 Year ended 31st March, 2016Options
(Numbers)Weighted
average exercise price per option (`)
Options (Numbers)
Weighted average
exercise price per option (`)
Option outstanding at the beginning of the year 3,77,463 22.30 11,20,862 22.30 Granted during the year – 22.30 – 22.30 Vested during the year 1,93,135 22.30 4,68,949 22.30 Exercised during the year – 22.30 – 22.30 Lapsed during the year 1,84,328 22.30 2,74,450 22.30 Options outstanding at the end of the year – 22.30 3,77,463 22.30
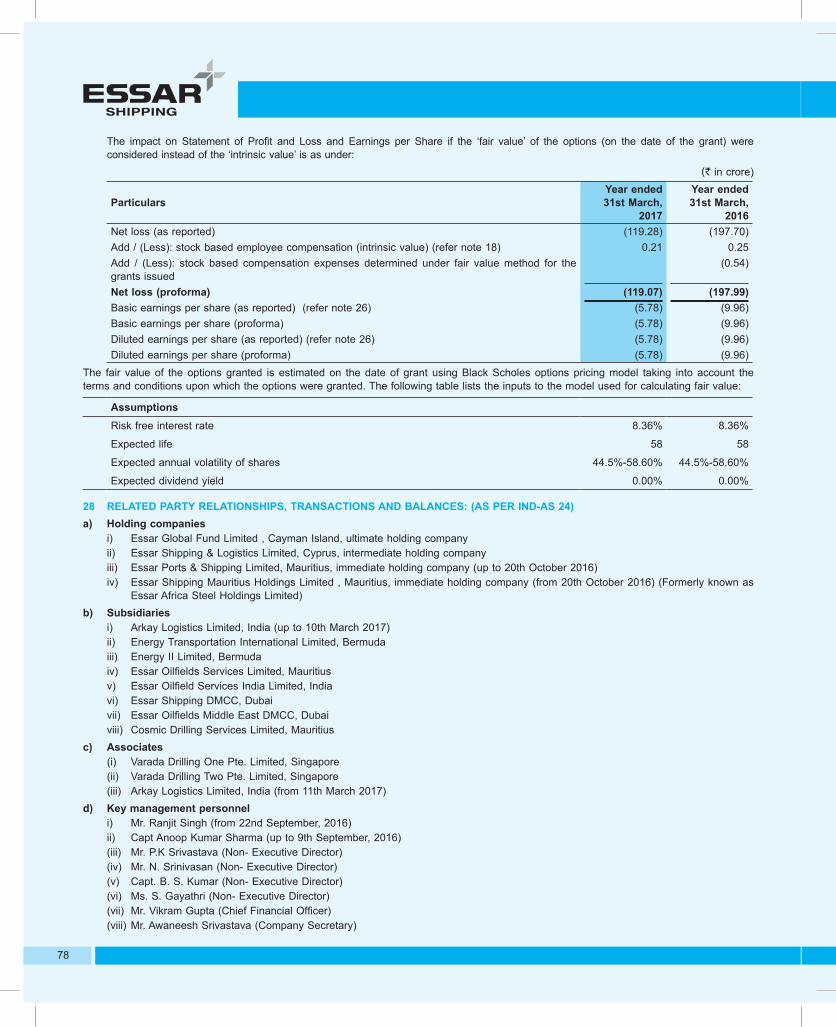
78
The impact on Statement of Profit and Loss and Earnings per Share if the ‘fair value’ of the options (on the date of the grant) were considered instead of the ‘intrinsic value’ is as under:
(` in crore)
ParticularsYear ended
31st March, 2017
Year ended 31st March,
2016Net loss (as reported) (119.28) (197.70)Add / (Less): stock based employee compensation (intrinsic value) (refer note 18) 0.21 0.25 Add / (Less): stock based compensation expenses determined under fair value method for the grants issued
(0.54)
Net loss (proforma) (119.07) (197.99)Basic earnings per share (as reported) (refer note 26) (5.78) (9.96)Basic earnings per share (proforma) (5.78) (9.96)Diluted earnings per share (as reported) (refer note 26) (5.78) (9.96)Diluted earnings per share (proforma) (5.78) (9.96)
The fair value of the options granted is estimated on the date of grant using Black Scholes options pricing model taking into account the terms and conditions upon which the options were granted. The following table lists the inputs to the model used for calculating fair value:
AssumptionsRisk free interest rate 8.36% 8.36%
Expected life 58 58
Expected annual volatility of shares 44.5%-58.60% 44.5%-58.60%
Expected dividend yield 0.00% 0.00%
28 RELATED PARTY RELATIONSHIPS, TRANSACTIONS AND BALANCES: (AS PER IND-AS 24)a) Holding companies
i) Essar Global Fund Limited , Cayman Island, ultimate holding companyii) Essar Shipping & Logistics Limited, Cyprus, intermediate holding company iii) Essar Ports & Shipping Limited, Mauritius, immediate holding company (up to 20th October 2016)iv) Essar Shipping Mauritius Holdings Limited , Mauritius, immediate holding company (from 20th October 2016) (Formerly known as
Essar Africa Steel Holdings Limited)b) Subsidiaries
i) Arkay Logistics Limited, India (up to 10th March 2017)ii) Energy Transportation International Limited, Bermudaiii) Energy II Limited, Bermudaiv) Essar Oilfields Services Limited, Mauritius v) Essar Oilfield Services India Limited, India vi) Essar Shipping DMCC, Dubaivii) Essar Oilfields Middle East DMCC, Dubaiviii) Cosmic Drilling Services Limited, Mauritius
c) Associates(i) Varada Drilling One Pte. Limited, Singapore(ii) Varada Drilling Two Pte. Limited, Singapore (iii) Arkay Logistics Limited, India (from 11th March 2017)
d) Key management personneli) Mr. Ranjit Singh (from 22nd September, 2016)ii) Capt Anoop Kumar Sharma (up to 9th September, 2016)(iii) Mr. P.K Srivastava (Non- Executive Director)(iv) Mr. N. Srinivasan (Non- Executive Director)(v) Capt. B. S. Kumar (Non- Executive Director)(vi) Ms. S. Gayathri (Non- Executive Director)(vii) Mr. Vikram Gupta (Chief Financial Officer)(viii) Mr. Awaneesh Srivastava (Company Secretary)

7th ANNUAL REPORT 2016-17
79
g) Details of transactions with related parties during the year
(` in crore)
Nature of transactions
Holding Companies Subsidiaries Fellow subsidiaries/Trust
Key Management Personnel Total
31st March,
2017
31st March,
2016
31st March,
2017
31st March,
2016
31st March,
2017
31st March,
2016
31st March,
2017
31st March,
2016
31st March,
2017
31st March,
2016 INCOMERevenue from operationsEssar Steel India Limited – – – – 387.08 446.93 – – 387.08 446.93 Essar Oil Limited – – – – – 0.31 – – – 0.31 Essar Power Gujarat Limited – – – – – – – – – –Arkay Logistics Limited – – – 70.65 72.64 – – – 72.64 70.65 Energy II Limited – – 112.18 24.59 – – – – 112.18 24.59 Energy Transportation International Limited
– – 1.57 1.56 – – – – 1.57 1.56
Essar Shipping & Logistics Limited
1.77 1.75 – – – – – – 1.77 1.75
Essar Ports Limited – – – – 0.24 0.24 – – 0.24 0.24 Total 1.77 1.75 113.74 96.80 459.96 447.48 – – 575.47 546.03 Interest income on intercorporate depositsEssar Oilfield Services India Limited
– – – 54.90 – – – 54.90
Guarantee commission receivedEssar Oilfields Services Limited
– – 0.87 0.85 – – – – 0.87 0.85
Dividend incomeEssar Oilfields Services Limited
– – – 1.37 – – – – – 1.37
Profit on buyback of long term investmentEnergy II Limited – – – 2.51 – – – – – 2.51 Gain on foreclosure of finance lease obligationEssar Shipping & Logistics Limited
– 53.27 – – – – – – – 53.27
Managerial remuneration #Ranjit Singh – – – – – – 0.49 – 0.49 –Captain Anoop Kumar Sharma
– – – – – – 1.26 1.66 1.26 1.66
Total – – – – – – 1.75 1.66 1.75 1.66 Director's Sitting FeesP.K. Srivastava – – – – – – 0.04 0.02 0.04 0.02 N.Srinivasan – – – – – – 0.06 0.07 0.06 0.07 Captain B.S. Kumar – – – – – – 0.10 0.10 0.10 0.10 Total – – – – – – 0.20 0.19 0.20 0.19 Purchase of fuel oilEssar Oil Limited – – – – 4.96 – – – 4.96 –Direct Voyage expensesEssar Shipping (Cyprus) Limited
– – – – 88.61 83.41 – – 88.61 83.41

80
(` in crore)
Nature of transactions
Holding Companies Subsidiaries Fellow subsidiaries/Trust
Key Management Personnel Total
31st March,
2017
31st March,
2016
31st March,
2017
31st March,
2016
31st March,
2017
31st March,
2016
31st March,
2017
31st March,
2016
31st March,
2017
31st March,
2016
Energy II Limited – – – 3.51 – – – – – 3.51 Arkay Logistics Limited – – – 0.09 0.20 – – – 0.20 0.09 Essar Bulk Terminal Limited
– – – – 0.26 0.22 – – 0.26 0.22
Total – – – 3.60 89.07 83.63 – – 89.07 87.24 Professional feesAegis Limited – – – – – 0.77 – – – 0.77 Aircraft usage charges reimbursedEssar Oil Limited – – – – 8.33 31.00 – – 8.33 31.00 Contribution to staff provident fundEssar Shipping Staff Provident Fund Trust
– – – – 0.95 1.08 – – 0.95 1.08
Interest on finance lease obligationsEssar Shipping & Logistics Limited
– 0.28 – – – – – – – 0.28
Essar Shipping DMCC – – 5.19 – – – – – 5.19 –Total – 0.28 5.19 – – – – – 5.19 0.28 Interest on intercorporate depositsVadinar Ports & Terminals Limited
– – – – 5.70 4.17 – – 5.70 4.17
Essar Steel India Limited – – – – 13.98 11.29 – – 13.98 11.29 Vadinar Power Company Limited
– – – – 4.17 – – – 4.17 –
Essar Oil Limited – – – – 35.23 7.03 – – 35.23 7.03 Total – – – – 59.09 22.48 – – 59.09 22.48 Buy back of long term investmentEnergy II Limited – – – 10.02 – – – – – 10.02 Sale and leaseback of vesselsEssar Shipping DMCC – – 570.21 – – – – – 570.21 –Loans and advances receivedVadinar Ports & Terminals Limited
– – – – – 43.05 – – – 43.05
Essar Steel India Limited – – – – – 114.41 – – – 114.41 Vadinar Power Company Limited
– – – – 2.71 – – – 2.71 –
Essar Oil Limited – – – – – 271.00 – – – 271.00 Total – – – – 2.71 428.46 – – 2.71 428.46 Loans and advances given

7th ANNUAL REPORT 2016-17
81
(` in crore)
Nature of transactions
Holding Companies Subsidiaries Fellow subsidiaries/Trust
Key Management Personnel Total
31st March,
2017
31st March,
2016
31st March,
2017
31st March,
2016
31st March,
2017
31st March,
2016
31st March,
2017
31st March,
2016
31st March,
2017
31st March,
2016
Energy Transportation International Limited
– – – – – – – – – –
Essar Oilfield Services India Limited
– – – 2.40 – – – – – 2.40
Essar Shipping DMCC – – – 0.11 – – – – – 0.11 Essar Shipping Employee Stock Options Trust
– – – – – 3.94 – – – 3.94
Total – – – 2.51 – 3.94 – – – 6.45 Advance for allotment of sharesEssar Shipping DMCC -Dubai
– – – 252.57 – – – – – 252.57
Investment in sharesEssar Shipping DMCC -Dubai (equity)
– – – 0.09 – – – – – 0.09
Essar Oilfield Services India Limited (preference)
– – – 759.00 – – – – – 759.00
Total – – – 759.09 – – – – – 759.09 Guarantees given on behalf of othersEssar Shipping DMCC – – 358.00 – – – – – 358.00 –Essar Oilfield Services India Limited
– – – 76.87 – – – – – 76.87
Essar Oilfield Services Limited
– – – 43.12 – – – – – 43.12
Total – – 358.00 119.99 – – – – 358.00 119.99 # does not include the amount payable towards gratuity and compensated absences by the Company, as the same is calculated for the Company
as a whole on actuarial basis.h) Outstanding balances with related parties:
(` in crore)
Nature of transactions
Holding Companies Subsidiary companies Fellow subsidiaries/Trust Key Management Personnel Total
31.03.17 31.03.16 01.04.15 31.03.17 31.03.16 01.04.15 31.03.17 31.03.16 01.04.15 31.03.17 31.03.16 01.04.15 31.03.17 31.03.16 01.04.15 Trade and other receivablesEssar Steel India Limited – – – – – – – – 55.16 – – – – – 55.16 Arkay Logistics Limited – – – – 9.27 – 33.18 – – – – – 33.18 9.27 –Essar Oilfields Services Limited
– – – – – 0.81 – – – – – – – – 0.81
Essar Oil Limited – – – – – – – 3.71 – – – – – 3.71 –Essar Shipping & Logistics Limited
2.15 0.44 – – – – – – – – – – 2.15 0.44 –
Essar Oilfield Services Limited
– – – 1.03 0.22 – – – – – – – 1.03 0.22 –
Energy Transportation International Limited
– – – – 0.12 – – – – – – – – 0.12 –
Essar Shipping DMCC – – – 203.76 – – – – – – – – 203.76 – –
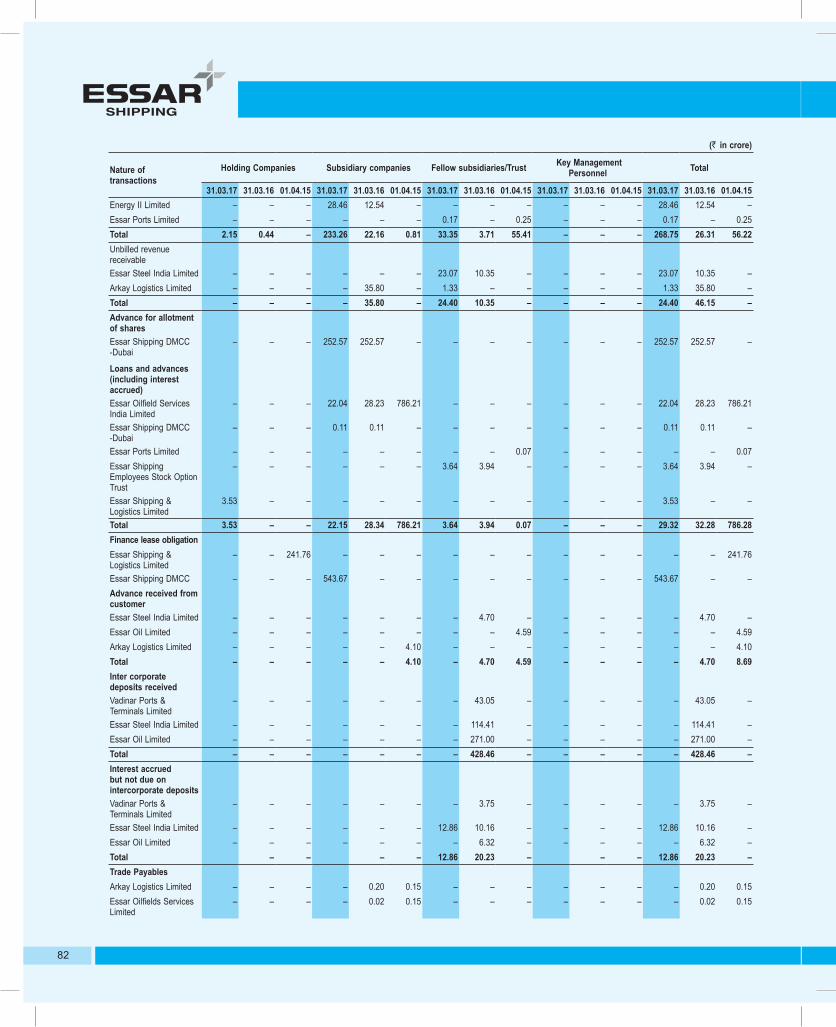
82
(` in crore)
Nature of transactions
Holding Companies Subsidiary companies Fellow subsidiaries/Trust Key Management Personnel Total
31.03.17 31.03.16 01.04.15 31.03.17 31.03.16 01.04.15 31.03.17 31.03.16 01.04.15 31.03.17 31.03.16 01.04.15 31.03.17 31.03.16 01.04.15 Energy II Limited – – – 28.46 12.54 – – – – – – – 28.46 12.54 –Essar Ports Limited – – – – – – 0.17 – 0.25 – – – 0.17 – 0.25 Total 2.15 0.44 – 233.26 22.16 0.81 33.35 3.71 55.41 – – – 268.75 26.31 56.22 Unbilled revenue receivableEssar Steel India Limited – – – – – – 23.07 10.35 – – – – 23.07 10.35 –Arkay Logistics Limited – – – – 35.80 – 1.33 – – – – – 1.33 35.80 –Total – – – – 35.80 – 24.40 10.35 – – – – 24.40 46.15 –Advance for allotment of sharesEssar Shipping DMCC -Dubai
– – – 252.57 252.57 – – – – – – – 252.57 252.57 –
Loans and advances (including interest accrued) Essar Oilfield Services India Limited
– – – 22.04 28.23 786.21 – – – – – – 22.04 28.23 786.21
Essar Shipping DMCC -Dubai
– – – 0.11 0.11 – – – – – – – 0.11 0.11 –
Essar Ports Limited – – – – – – – – 0.07 – – – – – 0.07 Essar Shipping Employees Stock Option Trust
– – – – – – 3.64 3.94 – – – – 3.64 3.94 –
Essar Shipping & Logistics Limited
3.53 – – – – – – – – – – – 3.53 – –
Total 3.53 – – 22.15 28.34 786.21 3.64 3.94 0.07 – – – 29.32 32.28 786.28 Finance lease obligationEssar Shipping & Logistics Limited
– – 241.76 – – – – – – – – – – – 241.76
Essar Shipping DMCC – – – 543.67 – – – – – – – – 543.67 – –Advance received from customerEssar Steel India Limited – – – – – – – 4.70 – – – – – 4.70 –Essar Oil Limited – – – – – – – – 4.59 – – – – – 4.59 Arkay Logistics Limited – – – – – 4.10 – – – – – – – – 4.10 Total – – – – – 4.10 – 4.70 4.59 – – – – 4.70 8.69 Inter corporate deposits received Vadinar Ports & Terminals Limited
– – – – – – – 43.05 – – – – – 43.05 –
Essar Steel India Limited – – – – – – – 114.41 – – – – – 114.41 –Essar Oil Limited – – – – – – – 271.00 – – – – – 271.00 –Total – – – – – – – 428.46 – – – – – 428.46 –Interest accrued but not due on intercorporate depositsVadinar Ports & Terminals Limited
– – – – – – – 3.75 – – – – – 3.75 –
Essar Steel India Limited – – – – – – 12.86 10.16 – – – – 12.86 10.16 –Essar Oil Limited – – – – – – – 6.32 – – – – – 6.32 –Total – – – – 12.86 20.23 – – – 12.86 20.23 –Trade PayablesArkay Logistics Limited – – – – 0.20 0.15 – – – – – – – 0.20 0.15 Essar Oilfields Services Limited
– – – – 0.02 0.15 – – – – – – – 0.02 0.15

7th ANNUAL REPORT 2016-17
83
(` in crore)
Nature of transactions
Holding Companies Subsidiary companies Fellow subsidiaries/Trust Key Management Personnel Total
31.03.17 31.03.16 01.04.15 31.03.17 31.03.16 01.04.15 31.03.17 31.03.16 01.04.15 31.03.17 31.03.16 01.04.15 31.03.17 31.03.16 01.04.15 Energy Transportation International Limited
– – – 3.26 – – – – – – – – 3.26 – –
Energy II Limited – – – – – 1.82 – – – – – – – – 1.82 Essar Shipping Staff Provident Fund
– – – – – – 0.13 0.18 – – – – 0.13 0.18 –
Essar Bulk Terminal Limited
– – – – – – – 3.22 3.31 – – – – 3.22 3.31
Aegis Limited – – – – – – – 0.02 0.76 – – – – 0.02 0.76 Essar Ports Limited – – – – – – – 0.09 – – – – – 0.09 –Essar Power Gujarat Limited
– – – – – – – 0.01 – – – – – 0.01 –
Essar Shipping & Logistics Limited
– 1.48 – – – – – – – – – – – 1.48 –
Essar Shipping Cyprus Limited
– – – – – – 0.04 48.16 57.71 – – – 0.04 48.16 57.71
Essar Steel India Limited – – – – – – 17.48 – – – – – 17.48 – –Essar Projects India Limited
– – – – – – – – 0.10 – – – – – 0.10
Essar Oil Limited – – – – – – – 32.50 32.40 – – – – 32.50 32.40 Vadinar Oil Terminal Limited
– – – – – – – 0.02 0.02 – – – – 0.02 0.02
Total – 1.48 – 3.26 0.22 2.12 17.65 84.18 94.30 – – – 20.91 85.88 96.42 Interest accrued on finance lease obligationEssar Shipping & Logistics Limited
– – 0.38 – – – – – – – – – – – 0.38
Essar Shipping DMCC – – – 1.00 – – – – – – – – 1.00 – –Total – – 0.38 1.00 – – – – – – – – 1.00 – 0.38 Security deposit receivedEssar Oil Limited – – – – – – – 9.00 9.00 – – – – 9.00 9.00 Vadinar Oil Terminal Limited
– – – – – – – 1.50 1.50 – – – – 1.50 1.50
Vadinar Ports & Terminals Limited
– – – – – – – 1.50 1.50 – – – – 1.50 1.50
Essar Bulk Terminal Limited
– – – – – – 1.50 1.50 1.50 – – – 1.50 1.50 1.50
Total – – – – – – 1.50 13.50 13.50 – – – 1.50 13.50 13.50 Guarantees given on behalf of othersEssar Shipping DMCC – – – 348.00 – – – – – – – – 348.00 – –Essar Oilfield Services India Limited
– – – 753.08 668.90 592.03 – – – – – – 753.08 668.90 592.03
Essar Oilfields Services Limited
– – – 43.12 43.12 – – – – – – – 43.12 43.12 –
Total – – – 1,144.20 712.02 592.03 – – – – – – 1,144.20 712.02 592.03
Note1) Transactions with related parties are conducted at arms length pricing
2) Vide an assignment agreement dated 31st March 2017, certain related party creditors of the Company assigned and transferred all rights, title and interest in the monies receivable from the Company to an unrelated party. These payables include intercorporate deposits, interest accrued thereon, security deposits and trade as well as non-trade payables. The total payables so assigned are disclosed in the table below:

84
Related Party ` in croreEssar Oil Limited (EOL) 352
Vadinar Oil Terminal Limited (VOTL) 55
Vadinar Power Company Limited (VPCL) 7
Total 412
Consequent to the assignment as aforesaid, the Company has no amounts payable to EOL, VOTL and VPCL as at 31st March 2017
29. GOING CONCERN At 31st March 2017, the Current Liabilities of the Company exceed its Current Assets. The Management has taken the following
initiatives in order to meet its short term liabilities in a timely manner: 1) Borrowings from related parties and others (including FCCB’s) amounting to ` 2,157 crores are proposed to be converted to equity instruments. 2) Borrowings from a bank amounting to ` 170 crores were repaid subsequent to balance sheet date through a Standby Letter of Credit facility availed by a foreign subsidiary 3) Borrowings amounting to ` 90 crores have been classified to current owing to convenant breaches as mandated by IND-AS 1. Based on the above actions to be taken, management is confident that it will be able to meet its current obligations as and when they fall due for payment. Accordingly, these financial statements have been prepared on a Going Concern basis.
30. TRANSITION TO IND AS These are the Company’s first standalone financial statements prepared in accordance with IND-AS.
The Company has adopted Indian Accounting Standards (Ind AS) notified by the Ministry of Corporate Affairs with effect from 1st April, 2016, with a transition date of 1st April, 2015. Ind AS 101-First-time Adoption of Indian Accounting Standards requires that all Ind AS standards and interpretations that are issued and effective for the first Ind AS financial statements which is for the year ended 31st March, 2017 for the company, be applied retrospectively and consistently for all financial years presented. Consequently, in preparing these Ind AS financial statements, the Company has availed certain exemptions and complied with the mandatory exceptions provided in Ind AS 101, as explained below. The resulting difference in the carrying values of the assets and liabilities as at the transition date between the Ind AS and Previous GAAP have been recognised directly in equity (retained earnings or another appropriate category of equity).
A. Exemptions and exceptions availed Set out below are the applicable IND-AS 101 optional exemptions and mandatory exceptions applied in the transition from previous
GAAP to IND-AS.
A.1 IND-AS optional exemptionsA.1.1 Deemed Cost IND-AS 101 permits a first – time adopter to elect to continue with the carrying value for all of its property, plant and equipment as
recognized in the financial statements as at the date of transition to IND-AS, measured as per the previous GAAP and use that as its deemed cost as at the date of transition.
A.2 IND-AS mandatory exceptions
A.2.1 Estimates An entity’s estimates in accordance with IND-ASs at the date of transition to IND-AS shall be consistent with estimates made for
the same date in accordance with previous GAAP (after adjustments to reflect any difference in accounting policies), unless there is objective evidence that those estimates were in error.
IND-AS estimates as at 1st April, 2015 are consistent with the estimates as at the same date made in conformity with previous GAAP. The company made estimates for following items in accordance with IND-AS at the date of transition as these were not required under previous GAAP:
Impairment of financial assets based on expected credit loss model.
A.2.2 De-recognition of financial assets and liabilities IND-AS 101 requires a first – time adopter to apply the de-recognition provisions of IND-AS 109 prospectively for transactions
occurring on or after the date of transition to IND-AS. However, IND-AS 101 allows a first – time adopter to apply the de – recognition requirements in IND-AS 109 retrospectively from a date of the entity’s choosing, provided that the information needed to apply IND-AS 109 to financial assets and financial liabilities derecognized as a result of past transactions was obtained at the time of initially accounting for those transactions.

7th ANNUAL REPORT 2016-17
85
The company has elected to apply the de-recognition provisions of IND-AS 109 prospectively from the date of transition to IND-AS.
A.2.3 Classification and measurement of financial assets IND-AS 101 requires an entity to assess classification and measurement of financial assets (investment in debt instruments) on the
basis of the facts and circumstances that exist at the date of transition to IND-AS.
A.2.4 Investments in subsidiaries and associates IND-AS 101 allows an entity to account for investment in subsidiaries and associates at cost or in accordance with IND-AS 109. The
Company has opted to recognise these investments at cost
A.2.5 Foreign Currency Monetary Items In terms of para D13AA of Ind-AS 101,the company may continue to account for foreign exchange differences relating to long-term
foreign currency monetary items as per previous IGAAP. The company has elected to apply the same.
B: Reconciliation between previous GAAP and IND-AS IND-AS 101 requires an entity to reconcile equity, total comprehensive income and cash flows for prior periods. The following tables
represent the reconciliations from previous GAAP to IND-AS.
Reconciliation of equity as at date of transition (1st April, 2015) (` in crore)
ParticularsNotes to first-time adoption
Previous GAAP*
Adjustments IND-AS
ASSETSNon-current assetsProperty, plant and equipment 6 1,500.43 – 1,500.43 Investments in subsidiaries and associates 1 5,261.83 (2,750.00) 2,511.83 Financial assetsi. Loans 418.00 – 418.00 ii. Other financial assets 25.76 – 25.76 Other non-current assets 2 29.48 (22.86) 6.62 Total non-current assets 7,235.50 (2,772.86) 4,462.64 Current assetsInventories 14.18 – 14.18 Investments in subsidiaries 1,099.03 – 1,099.03 Financial assetsi. Trade and other receivables 3 68.90 48.85 117.75 ii. Cash and cash equivalents 24.40 – 24.40 iii. Loans 369.60 – 369.60 iv. Other financial assets 2 14.96 (6.16) 8.80 Other current assets 4 172.06 (122.79) 49.27 Total current assets 1,763.13 (80.10) 1,683.03 Total assets 8,998.63 (2,852.96) 6,145.67
EQUITY AND LIABILITIESEquityEquity share capital 205.23 – 205.23 Other equityEquity component of foreign currency convertible bonds 5 – 152.91 152.91 Reserves and surplus 8 4,600.01 (2,872.79) 1,727.22 Total equity 4,805.24 (2,719.88) 2,085.36 LIABILITIESNon-current liabilitiesFinancial Liabilities

86
ParticularsNotes to first-time adoption
Previous GAAP*
Adjustments IND-AS
i. Borrowings 2 and 5 1,578.21 (175.77) 1,402.44 ii. Other financial liabilities 44.49 – 44.49 iii. Derivative liability 12.88 – 12.88 Employee benefit obligations – – –Other non-current liabilities – – –Total non-current liabilities 1,635.58 (175.77) 1,459.81 Current liabilitiesFinancial liabilitiesi. Borrowings 175.68 – 175.68 ii. Trade payables 241.73 – 241.73 iii. Other financial liabilities 2 and 3 2,065.47 42.69 2,108.16 Employee benefit obligations 5.52 – 5.52 Other current liabilities 69.41 – 69.41 Total current liabilities 2,557.81 42.69 2,600.50 Total liabilities 4,193.39 (133.08) 4,060.31 Total equity and liabilities 8,998.63 (2,852.96) 6,145.67
Reconciliation of balance sheet as at 31st March 2016 (` in crore)
ParticularsNotes to first-time adoption
Previous GAAP*
Adjustments IND-AS
ASSETS Non-current assetsProperty, plant and equipment 6 1,287.79 6.93 1,294.72 Investments in subsidiaries and associates 1 and 7 6,022.87 (2,733.23) 3,289.64 Financial assetsi. Loans – – –ii. Other financial assets 2 37.96 (17.85) 20.11 Other non-current assets 18.55 – 18.55 Total non-current assets 7,367.17 (2,744.15) 4,623.02 Current assetsInventories 17.42 – 17.42 Investments in subsidiaries 1,164.64 – 1,164.64 Financial assetsi. Trade and other receivables 3 45.59 82.15 127.74 ii. Cash and cash equivalents 22.64 – 22.64 iii. Loans 32.17 – 32.17 iv. Other financial assets 2 50.60 (36.31) 14.29 Other current assets 4 479.17 (127.84) 351.33
1,812.23 (82.00) 1,730.23 Assets classified as held for sale 84.93 – 84.93 Total current assets 1,897.16 (82.00) 1,815.16 Total assets 9,264.33 (2,826.15) 6,438.18
EQUITY AND LIABILITIESEquityEquity share capital 206.98 – 206.98 Other equity

7th ANNUAL REPORT 2016-17
87
ParticularsNotes to first-time adoption
Previous GAAP*
Adjustments IND-AS
Equity component of foreign currency convertible bonds 5 – 96.37 96.37 Reserves and surplus 8 4,416.92 (2,854.16) 1,562.76 Total equity 4,623.90 (2,757.79) 1,866.11 LIABILITIESNon-current liabilitiesFinancial Liabilitiesi. Borrowings 2 and 5 2,464.86 (114.22) 2,350.64 ii. Other financial liabilities –iii. Derivative liability 22.11 – 22.11 Total non-current liabilities 2,486.97 (114.22) 2,372.75 Current liabilitiesFinancial liabilitiesi. Borrowings 464.84 – 464.84 ii. Trade payables 272.19 – 272.19 iii. Other financial liabilities 2 and 3 1,258.35 45.86 1,304.21 Employee benefit obligations 5.16 – 5.16 Other current liabilities 152.92 – 152.92 Total current liabilities 2,153.46 45.86 2,199.32 Total liabilities 4,640.43 (68.36) 4,572.07 Total equity and liabilities 9,264.33 (2,826.15) 6,438.18
Reconciliation of Statement of Profit and Loss for the year ended 31st March 2016 (` in crore)
ParticularsNotes to first-time adoption
Previous GAAP*
Adjustments IND-AS
Continuing operationsRevenue from operations 728.70 - 728.70 Other income 60.17 - 60.17 Other gains / (losses)- net 5 and 7 65.37 (28.74) 36.62 Total income 854.23 (28.74) 825.49 ExpensesOperating expenses 6 414.39 (11.55) 402.84 Employee benefits expenses 105.76 - 105.76 Finance costs 5 280.37 62.28 342.65 Depreciation 6 149.07 4.62 153.69 Other expenses 14.85 - 14.85 Total expenses 964.45 55.35 1,019.80 Loss before tax (110.22) (84.09) (194.31)Current tax (3.39) - (3.39)Loss for the year (113.61) (84.09) (197.70)Other comprehensive incomeItems that will not be reclassified subsequently to profit and loss account
9 – – 0.70
Actuarial gain / (loss)Items that will be subsequently reclassified to profit and loss accountFair value changes on derivatives designated as cash flow hedges 9 – (9.24)Total other comprehensive income – – (8.54)Total comprehensive loss for the year (113.61) (84.09) (206.24)

88
Reconciliation of Other Comprehensive Income (` in crore)
Particulars
Notes to first- time adoption
For the year ended
31st March 2016
Net Loss under previous GAAP (113.62)Unwinding of interest on foreign currency convertible bonds 5 (62.28)
Foreign currency monetary items translation differences 5 (39.74)
Income from Financial Guarantee Obligations 7 16.77
Drydocking costs amortised over 30 months under Ind AS 6 6.94
Foreign currency differences 5 (5.77)
Net Loss for the period under Ind AS (197.70)Other comprehensive income 9 (8.54)
Net Comprehensive Loss for the year under Ind AS (206.24)
*Note: The previous GAAP figures have been reclassified to conform to IND-AS presentation requirements for the purposes of this note.
(` in crore)
Reconciliation of total equity Notes to first-time
adoptionAs at 31st March,
2016 As at 31st
March, 2015
Total equity (shareholders' funds as per previous GAAP) 4,623.90 4,805.24 Less: Impairment of investment in Essar Oilfields Services Limited 1 (2,750.00) (2,750.00)
Less: Write-off of unamortised operating lease rentals 4 (122.79) (122.79)
Add: Equity component of foreign currency convertible bonds 5 96.37 152.91
Less: Foreign currency monetary items translation differences 5 11.69 –
Add: Drydocking costs amortised over 30 months 6 6.94 –
Total adjustments (2,757.79) (2,719.88)Total equity as per IND-AS 1,866.11 2,085.36
Notes to first time adoptionThe following explains the material adjustments made during transition from previous GAAP to Ind AS:
Note 1: Investments in subsidiariesIND-AS 101 allows investments in subsidiaries to be considered at deemed cost or fair value on the date of transition. Accordingly, investments in all subsidiaries were considered at deemed cost as at the date of transition to IND-AS. However, management was aware of a diminution other than temporary in the carrying value of the company’s investment in its wholly-owned subsidiary Essar Oilfields Services Limited Mauritius amounting to ` 4,747 crores.
Therefore, on the basis of a report provided by an independent valuer, it was concluded that the said investment was impaired by ` 2,750 crores i.e. the investment’s fair value was ` 1,997 crores as at 1st April, 2015. Accordingly, the said investment appears in the transition balance sheet at ` 1,997 crores after an impairment of ` 2,750 crores with the consequent reduction of ` 2,750 crores in Retained Earnings.
Note 2: BorrowingsIND-AS 109 requires transaction costs incurred towards origination of borrowings to be deducted from the carrying amount of borrowings on initial recognition. These costs are recognized in the profit or loss over the tenure of the borrowing as part of the interest expense by applying the effective interest rate method.
Under previous GAAP, these transaction costs were charged to profit or loss over the tenure of the borrowing on a straight line basis. Also, under previous GAAP, the unamortised transaction costs were grouped under Current/Non-Current Assets depending on the amortisation period. Consequent to transition to IND-AS, unamortised transaction costs amounting to ` 29.02 crores now appear as a reduction from Borrowings.

7th ANNUAL REPORT 2016-17
89
Note 3: Recognition of financial assets derecognised in previous GAAPThe previous GAAP allowed trade receivables to be derecognised in case they were discounted with recourse. However, IND-AS 109 prohibits the same. Accordingly, as at 1st April, 2015, trade receivables amounting to ` 48.85 crores which were derecognised under the previous GAAP, were re-instated with a corresponding impact on other current financial liabilities
Note 4: Unamortised operating lease rentals written offThe company had entered into long term non-cancellable operating lease agreements in respect of six vessels. On 31st March, 2015, the Company requested the lessor to cancel the agreement. This was duly accepted by the lessor. Under previous GAAP, these operating lease rentals were being expensed on a straight line basis. Consequent to the cancellation as aforesaid, the unamortised operating lease rentals were written off with a corresponding impact on Retained Earnings.
Note 5: Foreign currency convertible bonds split into equity and debt componentsUnder previous GAAP, foreign currency convertible bonds amounting to USD 240 million were treated as borrowings. IND-AS 32 requires such compound instruments to be split into debt and equity components.
As at 1st April, 2015, the debt component of the converible bonds was USD 215.57 million while the equity component was USD 24.43 million. Accordingly, an amount of ` 152.91 crores has been recognised as equity component of the said foreign currency convertible bond by debiting borrowings.
Note 6: Dry-docking costsThese were debited to the Statement of Profit and Loss under the previous GAAP. Under IND-AS, the Company has deferred these costs over 30 months.
Note 7: Income from financial guarantee obligationUnder Ind AS, income from financial guarantee obligation has been recognised at 2% of the Guarantee outstanding as at balance sheet date.
Note 8: Retained Earnings.Retained earnings as at 1st April, 2015 has been adjusted consequent to the above IND-AS transition adjustments.
Note 9: Other Comprehensive IncomeUnder Ind AS, all items of income and expense recognised in a period should be included in profit or loss for the period, unless a standard equires or permits otherwise. Items of income and expense that are not recognised in profit or loss but are shown in the Statement of Profit and Loss as ‘other comprehensive income’ includes remeasurements of defined benefit plans and movement in cash flow hedge reserve. The concept of other comprehensive income did not exist under previous GAAP.
Note 10: Impact on Statement of Cash FlowsThe Ind AS adjustments are non cash adjustments. Consequently, Ind AS adoption has no impact on the net cash flow for the year ended 31st March, 2016 as compared with the previous GAAP.
31. DISCLOSURE RELATING TO SPECIFIED BANK NOTES During the year, the Company had no specified bank notes (SBNs) and other denomination notes as defined in the MCA notification
G.S.R. 308(E) dated 31st March, 2017. For the purpose of this clause ‘Specified Bank Notes’ shall have the same meaning provided in the notification of the Government of India, in the Ministry of Finance, Department of Economic Affairs number S.O. 3407(E), dated the 8th November, 2016.
32. EXPENDITURE ON CORPORATE SOCIAL RESPONSIBILITY (CSR) In pursuance of the provisions of the Companies Act, 2013 and CSR Policy of the Company it is required to spend two percent of the
average net profits for the three immediately preceding financial years towards CSR activities. Due to the occurrence of net losses in the three preceding financial years, the contribution towards CSR activities during the year is Nil. However, Company will incur the sum on CSR activities as soon as the financial position of the Company is improved
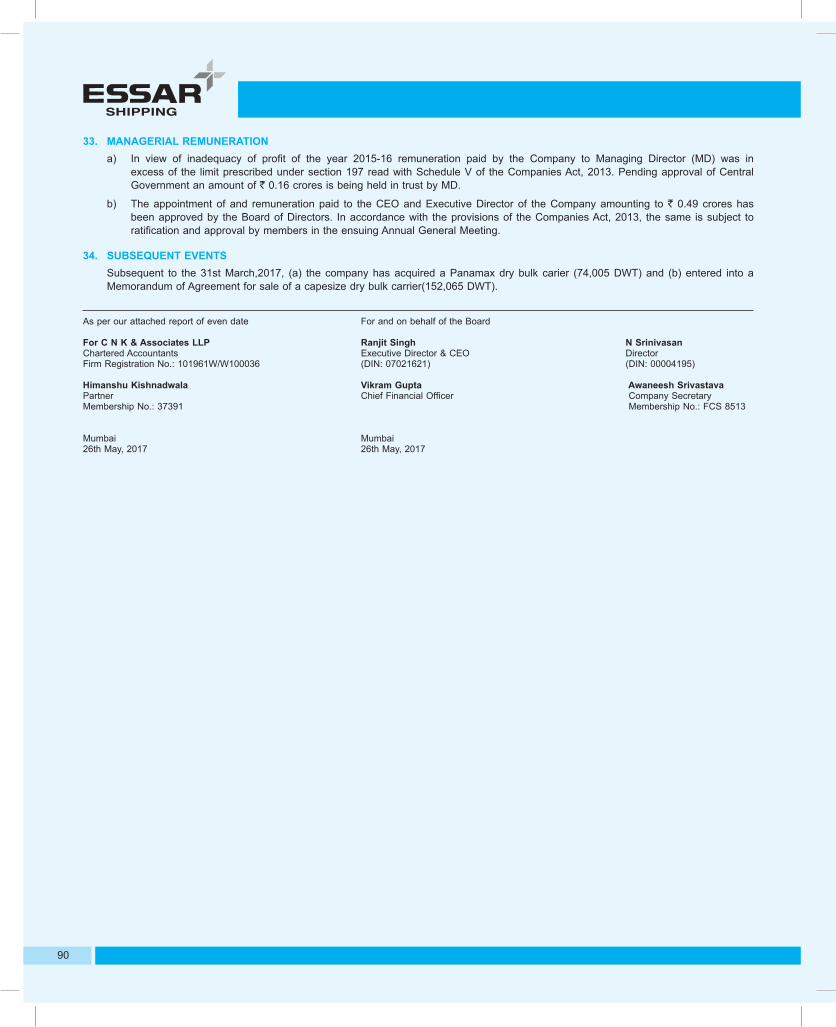
90
33. MANAGERIAL REMUNERATIONa) In view of inadequacy of profit of the year 2015-16 remuneration paid by the Company to Managing Director (MD) was in
excess of the limit prescribed under section 197 read with Schedule V of the Companies Act, 2013. Pending approval of Central Government an amount of ` 0.16 crores is being held in trust by MD.
b) The appointment of and remuneration paid to the CEO and Executive Director of the Company amounting to ` 0.49 crores has been approved by the Board of Directors. In accordance with the provisions of the Companies Act, 2013, the same is subject to ratification and approval by members in the ensuing Annual General Meeting.
34. SUBSEQUENT EVENTS Subsequent to the 31st March,2017, (a) the company has acquired a Panamax dry bulk carier (74,005 DWT) and (b) entered into a
Memorandum of Agreement for sale of a capesize dry bulk carrier(152,065 DWT).
As per our attached report of even date For and on behalf of the Board
For C N K & Associates LLP Ranjit Singh N Srinivasan Chartered Accountants Executive Director & CEO Director Firm Registration No.: 101961W/W100036 (DIN: 07021621) (DIN: 00004195)
Himanshu Kishnadwala Vikram Gupta Awaneesh Srivastava Partner Chief Financial Officer Company SecretaryMembership No.: 37391 Membership No.: FCS 8513 Mumbai Mumbai26th May, 2017 26th May, 2017

7th ANNUAL REPORT 2016-17
91
To the Members of Essar Shipping Limited
Report on the Consolidated Ind-AS Financial StatementsWe have audited the accompanying consolidated Ind-AS financial statements of Essar Shipping Limited (hereinafter referred to as “the Holding Company”) and its subsidiaries (the Holding Company and its subsidiaries together referred to as “the Group”) and its associates comprising of the Consolidated Balance Sheet as at March 31, 2017, the Consolidated Statement of Profit and Loss (including other comprehensive income) , the Consolidated Cash Flow statement and Consolidated Statement Of Changes in Equity for the year then ended, and a summary of significant accounting policies and other explanatory information (hereinafter referred to as “the consolidated financial statements”).
Management’s Responsibility for the Consolidated Financial StatementsThe Holding Company’s Board of Directors is responsible for the preparation of these Consolidated Financial statements in terms of the requirements of the Companies Act, 2013 (hereinafter referred to as “the Act”) that give a true and fair view of the consolidated financial position, consolidated financial performance including other comprehensive income, consolidated cash flows and consolidated changes in equity of the Group including its associates in accordance with the accounting principles generally accepted in India, including the Indian Accounting Standards specified under Section 133 of the Act, read with the relevant rules issued thereunder The respective Board of Directors of the companies included in the Group are responsible for maintenance of adequate accounting records in accordance with the provisions of the Act for safeguarding the assets of the Group and for preventing and detecting frauds and other irregularities; the selection and application of appropriate accounting policies; making judgments and estimates that are reasonable and prudent; and the design, implementation and maintenance of adequate internal financial controls, that were operating effectively for ensuring the accuracy and completeness of the accounting records, relevant to the preparation and presentation of the financial statements that give a true and fair view and are free from material misstatement, whether due to fraud or error, which have been used for the purpose of preparation of the consolidated financial statements by the Board of Directors of the Holding Company, as aforesaid.
Auditor’s ResponsibilityOur responsibility is to express an opinion on these consolidated financial statements based on our audit.While conducting the audit, we have taken into account the provisions of the Act, the accounting and auditing standards and matters which are required to be included in the audit report under the provisions of the Act and the Rules made thereunder.We conducted our audit of the consolidated financial statements in accordance with the Standards on Auditing specified under section 143(10) of the Act and other applicable pronouncements issued by Institute of Chartered Accountants Of India. Those Standards and pronouncements require that we comply with ethical requirements and plan and perform the audit to obtain reasonable assurance
INDEPENDENT AUDITOR’S REPORT
about whether the consolidated financial statements are free from material misstatement.An audit involves performing procedures to obtain audit evidence about the amounts and the disclosures in the consolidated Ind-AS financial statements. The procedures selected depend on the auditor’s judgment, including the assessment of the risks of material misstatement of the consolidated financial statements, whether due to fraud or error. In making those risk assessments, the auditor considers internal financial control relevant to the Holding Company’s preparation of the consolidated financial statements that give a true and fair view in order to design audit procedures that are appropriate in the circumstances. An audit also includes evaluating the appropriateness of the accounting policies used and the reasonableness of the accounting estimates made by the Holding Company’s Board of Directors, as well as evaluating the overall presentation of the consolidated financial statements.We believe that except for the matter described in Basis for Qualified opinion paragraph, the audit evidence obtained by us and the audit evidence obtained by the other auditors in terms of their reports referred to in sub-paragraph (a) of the Other Matters paragraph below, is sufficient and appropriate to provide a basis for our qualified audit opinion on the consolidated financial statements.
Basis for Qualified OpinionAttention is invited to Note 34 of the Consolidated Financial Statements regarding the ongoing assessment of possible impairment of rigs in a step down subsidiary, having carrying amount of ` 114.99 crores (including Capital work-in-progress of ` 79.16 crores), as at March 31, 2017 in terms of Indian Accounting Standard (Ind-AS) 36- Impairment of Assets as notified pursuant section 133 of the Companies Act, 2013 read with relevant rules issued thereunder.
Qualified OpinionIn our opinion and to the best of our information and according to the explanations given to us, except for the possible effects of the matters described in the Basis for Qualified Opinion paragraph above read with Note 34 of the Consolidated Financial Statements, the aforesaid consolidated financial statements give the information required by the Act in the manner so required and give a true and fair view in conformity with the accounting principles generally accepted in India, of the consolidated state of affairs of the Group and its associates as at March 31, 2017 and their consolidated loss(including other comprehensive income) their consolidated cash flows and the consolidated changes in equity for the year ended on that date.
Emphasis of matterIn case of a step down subsidiary, the auditors have pointed out that the concerned financial statements have been prepared on going concern basis, in view of the representation by the management that it is confident of convincing the respective lenders for reschedulement of its borrowings and to roll over its short term borrowings outside India against facilities sanctioned by Indian lenders to address cash flow mismatches.Our opinion is not modified in respect of this Matter.

92
Other Mattersa) We did not audit the financial statements of one subsidiary,
whose financial statements reflect total assets of ` 2,934.91 crores as at 31 March, 2017 and total revenues of ` 39.55 crores for the year ended 31 March 2017, as considered in the consolidated financial statements. These financial statements and other financial information have been audited by other auditor whose reports have been furnished to us by the Management and our opinion on the consolidated financial statements, in so far as it relates to the amounts and disclosures included in respect of this subsidiary, is based solely on the reports of the other auditor.
b) The consolidated financial statements also includes unaudited figures in respect of two associates whose financial statements reflect total assets of ` 3,312.47 crores as on 31st March,2017 and total revenue of ` Nil for the year ended on 31st March,2017. These financial statements are unaudited and have been furnished to us by the Management and our opinion on the consolidated financial statements, in so far as it relates to the amounts and disclosures included in respect of these two associates is based solely on such unaudited financial statements. In our opinion and according to the information and explanations given to us by the Management, these unaudited financial statements are not material to the Group.
c) Our opinion on the consolidated financial statements, and our report on Other Legal and Regulatory Requirements below is not modified in respect of the above matters with respect to our reliance on the work done and the reports of the other auditor and the unaudited financial statements certified by the Management.
Report on Other Legal and Regulatory Requirements1. As required by Section 143 (3) of the Act, we report, to the
extent applicable that: (a) We have sought and, except for the possible effects
of the matter described in Basis for Qualified Opinion paragraph above, obtained all the information and explanations which to the best of our knowledge and belief were necessary for the purposes of our audit of the aforesaid consolidated financial statements.
(b) In our opinion, except for the possible effects of the matter described in Basis for Qualified Opinion paragraph above, proper books of account as required by law relating to preparation of the aforesaid consolidated financial statements have been kept by the Holding company, its subsidiaries included in the group and associate companies so far as it appears from our examination of those books and the reports of the other auditors.
(c) The Consolidated Balance Sheet, the Consolidated Statement of Profit and Loss(including other comprehensive income), the Consolidated Cash Flow Statement and the consolidated changes in equity dealt with by this Report are in agreement with the relevant books of account maintained for the purpose of preparation of the consolidated financial statements.
(d) In our opinion, except for the possible effects of the matter described in Basis for Qualified Opinion paragraph
above, the aforesaid consolidated financial statements comply with the Accounting Standards specified under Section 133 of the Act, read with the relevant rules issued there under;
(e) The matter described in the Basis for Qualified Opinion paragraph above, in our opinion, may have an adverse effect on the functioning of the Group.
(f) On the basis of the written representations received from the directors of the Holding Company as on March 31, 2017, taken on record by the Board of Directors of the Holding Company and its subsidiaries incorporated in India, none of the directors are disqualified as on March 31, 2017 from being appointed as directors in terms of Section 164 (2) of the Act;
(g) The qualification relating to the maintenance of accounts and other matters connected therewith is as stated in the Basis for Qualified Opinion paragraph above
(h) With respect to the adequacy of the internal financial controls over financial reporting of the Group and the operating effectiveness of such controls, refer to our separate report in ‘Annexure A’; and
(i) With respect to the other matters to be included in the Auditor’s Report in accordance with Rule 11 of the Companies (Audit and Auditors) Rules, 2014, in our opinion and to the best of our information and according to the explanations given to us:
(i) The consolidated financial statements disclose the impact of pending litigations as at 31 March, 2017 on the consolidated financial position of the Group and its associates-Refer note 24 to the consolidated financial statements.
(ii) Provision has been made in the consolidated financial statements, as required under the applicable law or accounting standards, for material foreseeable losses, if any, on long term contracts including derivative contracts- Refer note 11 to the consolidated financial statements.
(iii) There were no amounts that were required to be transferred to the investor education protection fund by the Holding Company and its subsidiary companies incorporated in India.
(iv) The Group has provided requisite disclosures in its financial statements as to holdings as well as specified dealings in Specified Bank Notes during the period from November 08, 2016 to December 30, 2016 with respect to the holding company and subsidiaries incorporated in India. Based on the audit procedures performed by us, we report that the disclosures are in accordance with the books of accounts maintained by the Group. (Refer note no. 32 to the consolidated financial statements).
For C N K & Associates LLP Chartered Accountants
Firm’s registration number: 101961W/W-100036
Himanshu Kishnadwala Mumbai Partner May 26, 2017 Membership number: 37391

7th ANNUAL REPORT 2016-17
93
ANNEXURE - A TO THE INDEPENDENT AUDITORS’ REPORTReport on the Internal Financial Controls under Clause (i) of Sub-section 3 of Section 143 of the Companies Act, 2013 (“the Act”)In conjunction with our audit of the consolidated financial statements of Essar Shipping Limited (“the Holding Company’) for the year ended March 31, 2017, we have audited the internal financial controls over financial reporting of the Holding Company and its subsidiary companies incorporated in India as of that date.
Management’s Responsibility for Internal Financial ControlsThe respective Board of Directors of the Holding company and its subsidiary companies, incorporated in India, are responsible for establishing and maintaining internal financial controls based on the internal controls over financial reporting criteria established by the company considering the essential components of internal controls stated in the Guidance Note on Audit of Internal Financial Controls Over Financial Reporting issued by the Institute of Chartered Accountants of India (ICAI). These responsibilities include the design, implementation and maintenance of adequate internal financial controls that were operating effectively for ensuring the orderly and efficient conduct of its business, including adherence to the respective company’s policies, the safeguarding of its assets, the prevention and detection of frauds and errors, the accuracy and completeness of the accounting records, and the timely preparation of reliable financial information, as required under the Act.
Auditors’ ResponsibilityOur responsibility is to express an opinion on the Company’s internal financial controls over financial reporting based on our audit. We conducted our audit in accordance with the Guidance Note on Audit of Internal Financial Controls over Financial Reporting (the “Guidance Note”) and the Standards on Auditing, issued by ICAI and deemed to be prescribed under section 143(10) of the Companies Act, 2013, to the extent applicable to an audit of internal financial controls, both issued by the Institute of Chartered Accountants of India. Those Standards and the Guidance Note require that we comply with ethical requirements and plan and perform the audit to obtain reasonable assurance about whether adequate internal financial controls over financial reporting was established and maintained and if such controls operated effectively in all material respects.Our audit involves performing procedures to obtain audit evidence about the adequacy of the internal financial controls system over financial reporting and their operating effectiveness. Our audit of internal financial controls over financial reporting included obtaining an understanding of internal financial controls over financial reporting, assessing the risk that a material weakness exists, and testing and evaluating the design and operating effectiveness of internal control based on the assessed risk. The procedures selected depend on the auditor’s judgment, including the assessment of the risks of material misstatement of the financial statements, whether due to fraud or error.We believe that the audit evidence we have obtained is sufficient and appropriate to provide a basis for our audit opinion on the Company’s internal financial controls system over financial reporting.
Meaning of Internal Financial Controls over Financial ReportingA company’s internal financial control over financial reporting is a process designed to provide reasonable assurance regarding the reliability of financial reporting and the preparation of financial statements for external purposes in accordance with generally accepted accounting principles. A company’s internal financial control over financial reporting includes those policies and procedures that (1) pertain to the maintenance of records that, in reasonable detail, accurately and fairly reflect the transactions and dispositions of the assets of the company; (2) provide reasonable assurance that transactions are recorded as necessary to permit preparation of financial statements in accordance with generally accepted accounting principles, and that receipts and expenditures of the company are being made only in accordance with authorizations of management and directors of the company; and (3) provide reasonable assurance regarding prevention or timely detection of unauthorized acquisition, use, or disposition of the company’s assets that could have a material effect on the financial statements.
Inherent Limitations of Internal Financial Controls over Financial ReportingBecause of the inherent limitations of internal financial controls over financial reporting, including the possibility of collusion or improper management override of controls, material misstatements due to error or fraud may occur and not be detected. Also, projections of any evaluation of the internal financial controls over financial reporting to future periods are subject to the risk that the internal financial control over financial reporting may become inadequate because of changes in conditions, or that the degree of compliance with the policies or procedures may deteriorate.
Basis for Qualified OpinionIn case of a step down subsidiary, although mitigating controls exist, the preventive controls with respect to Inventory and Treasury modules need to be strengthened.
Qualified OpinionIn our opinion and to the best of our information and according to the explanations given to us, except for the possible effects of the matters described in the Basis for Qualified Opinion paragraph above, the Holding Company and its subsidiary companies, incorporated in India have, in all material respects, an adequate internal financial controls system over financial reporting and such internal financial controls over financial reporting were operating effectively as at 31 March 2017, based on the internal control over financial reporting criteria established by the Company considering the essential components of internal control stated in the Guidance Note on Audit of Internal Financial Controls Over Financial Reporting issued by the Institute of Chartered Accountants of India.
For C N K & Associates LLP Chartered Accountants
Firm’s registration number: 101961W/W-100036
Himanshu Kishnadwala Mumbai Partner May 26, 2017 Membership number: 37391

94
CONSOLIDATED BALANCE SHEET AS AT 31ST MARCH, 2017(` in crore)
Particulars Notes As at 31st March, 2017
As at 31st March, 2016
As at 1st April, 2015
ASSETSNon-current assetsProperty, plant and equipment 2(a) 3,226.28 3,698.06 4,088.00Capital work-in-progress 2(a) 136.51 79.04 78.37Goodwill on consolidation 2(b) 2,609.04 2,750.87 2,408.86Investments in associates 3(a) 37.01 – –Financial assetsi. Other financial assets 4(d) 18.22 25.30 74.97Other non-current assets 5 116.25 138.50 125.59Total non-current assets 6,143.31 6,691.77 6,775.79Current assetsInventories 6 74.97 87.24 77.93Financial assetsi. Other Investments 3(b) – – 0.10ii. Trade and other receivables 4(a) 119.69 335.24 340.53iii. Cash and cash equivalents 4(c) 39.85 35.00 43.62iv. Loans 4(b) 987.26 1,051.05 955.54v. Other financial assets 4(d) 2,043.78 1,783.08 1,662.03Other current assets 7 87.29 94.74 87.21Assets classified as held for sale 8 – 84.93 –Total current assets 3,352.84 3,471.29 3,166.96Total assets 9,496.15 10,163.05 9,942.75
EQUITY AND LIABILITIESEquityEquity share capital 9(a) 206.98 206.98 205.23Other equityEquity component of foreign currency convertible bonds 27.70 96.37 152.91Reserves and surplus 9(b) 2,400.20 3,029.24 3,172.56Total equity 2,634.88 3,332.59 3,530.70LIABILITIESNon-current liabilitiesFinancial Liabilitiesi. Borrowings 10(a) 793.66 3,097.54 2,275.62ii. Other financial liabilities 10(c) – 6.04 50.64iii. Derivative liability 11 1.88 30.57 26.80Deferred tax liabilities 20 – 15.49 17.40Total non-current liabilities 795.54 3,149.64 2,370.46Current liabilitiesFinancial liabilitiesi. Borrowings 10(a) 1,178.67 511.41 241.58ii. Trade payables 10(b) 414.30 733.53 763.80iii. Other financial liabilities 10(c) 4,313.87 2,148.83 2,846.35Employee benefit obligations 12 6.12 5.97 7.26Current tax liabilities 22.24 25.71 33.33Other current liabilities 13 130.54 255.37 149.27Total current liabilities 6,065.74 3,680.82 4,041.59Total liabilities 6,861.27 6,830.46 6,412.05Total equity and liabilities 9,496.15 10,163.05 9,942.75
See accompanying notes 1 to 35 forming part of the consolidated financial statements
As per our attached report of even date For and on behalf of the Board
For C N K & Associates LLP Chartered Accountants Firm Registration No.: 101961W/W100036
Ranjit Singh Executive Director & CEO (DIN: 07021621)
N Srinivasan Director (DIN: 00004195)
Himanshu Kishnadwala Partner Membership No.: 37391
Vikram Gupta Chief Financial Officer
Awaneesh Srivastava Company Secretary Membership No.: FCS 8513
Mumbai, 26th May, 2017 Mumbai, 26th May, 2017

7th ANNUAL REPORT 2016-17
95
CONSOLIDATED STATEMENT OF PROFIT AND LOSS FOR THE YEAR ENDED 31ST MARCH, 2017(` in crore)
Particulars Note No. Year ended 31st March, 2017
Year ended 31st March, 2016
INCOMERevenue from operations 14 2,193.98 1,719.63
Other income 15 (68.60) 198.77
Total income 2,125.38 1,918.40
ExpensesOperating expenses 16 1,556.40 1,218.93
Employee benefits expenses 17 212.66 136.70
Finance costs 18 466.98 541.60
Depreciation 2(a) 390.50 463.94
Other expenses 19 45.67 85.43
Total expenses 2,672.21 2,446.61
Loss before tax (546.83) (528.22)
Current tax 20 (38.63) (23.86)
Deferred Tax 20 0.78 1.92
Loss for the year before share in profit of associates (584.68) (550.16)
Share in profit of associates 1.24 –
Loss for the year (583.44) (550.16)
Other comprehensive incomeItems that will not be reclassified subsequently to profit and loss account
Actuarial gain / (loss) (0.38) 0.70
Items that will be subsequently reclassified to profit and loss account
Fair value changes on derivatives designated as cash flow hedges – (9.24)
Total other comprehensive income (0.38) (8.54)
Total comprehensive loss for the year (583.82) (558.70)
Earnings per equity share (Face value of `10 each) :
Basic and diluted ( in `) 25 (28.19) (26.77)
See accompanying notes 1 to 35 forming part of the consolidated financial statements
As per our attached report of even date For and on behalf of the Board
For C N K & Associates LLP Chartered Accountants Firm Registration No.: 101961W/W100036
Ranjit Singh Executive Director & CEO (DIN: 07021621)
N Srinivasan Director (DIN: 00004195)
Himanshu Kishnadwala Partner Membership No.: 37391
Vikram Gupta Chief Financial Officer
Awaneesh Srivastava Company Secretary Membership No.: FCS 8513
Mumbai, 26th May, 2017 Mumbai, 26th May, 2017

96
CONSOLIDATED STATEMENT OF CASH FLOWS FOR THE YEAR ENDED 31ST MARCH, 2017(` in crore)
Particulars Year ended 31st March, 2017
Year ended 31st March, 2016
A CASH FLOW FROM OPERATING ACTIVITIES
Loss before tax (546.83) (528.22)
Adjustments for :
Depreciation 390.50 463.94
Finance costs 466.98 541.60
Interest income (79.06) (85.70)
Loss on disposal of a subsidiary 143.25 –
Gain on foreclosure of finance leases – (53.27)
Amortisation of stock based employee compensation – (0.25)
Bad debts written off – 8.34
Provision for diminution in value of assets held for sale – 28.86
Unrealised foreign exchange loss (6.78) (36.81)
Operating profit before working capital changes 368.06 338.50
Changes in working capital:
(Increase) / Decrease in inventories (10.40) (6.44)
(Increase) / Decrease in trade receivables, loans and advances and other assets (25.11) 75.85
Increase / (Decrease) in trade payables, other liabilities and short term provisions (12.98) (18.27)
Cash generated from operations 319.56 389.64
Income taxes refunded / (paid), net (12.09) (44.15)
Net cash generated from operating activities 307.48 345.49
B CASH FLOW FROM INVESTING ACTIVITIES
Expenditure on property, plant and equipment (38.96) (8.04)
Proceeds from sale of property, plant and equipment 70.69 1.35
Cash relating to the disposed subsidiary (37.59) -
Advance received / (refunded) against asset held for sale – 32.65
Fixed deposits matured for a period of more than three months – 9.59
Fixed deposits placed for a period of more than three months (35.20) (14.94)
Loans and advances given to a body corporate – (504.05)
Loans and advances repaid by a body corporate – 418.33
Interest received 53.62 92.56
Net cash (used in) / generated from investing activities 12.56 27.45

7th ANNUAL REPORT 2016-17
97
Particulars Year ended 31st March, 2017
Year ended 31st March, 2016
C. CASH FLOW FROM FINANCING ACTIVITIESProceeds from long-term loans 343.08 715.77
Proceeds from short-term loans 18.57 52.80
Proceeds from intercorporate deposits 279.90 –
Issue of equity shares at a premium – 5.11
Repayment of intercorporate deposits (277.19) –
Repayment of long-term loans (402.28) (322.50)
Repayment of short-term loans (19.24) (12.18)
Repayment/cancellation of finance lease obligations (26.54) (244.16)
Repayment of unsecured loans - (203.71)
Finance costs paid (201.16) (364.85)
Net cash used in financing activities (284.85) (373.72)
INCREASE / (DECREASE) IN CASH AND CASH EQUIVALENTS 35.19 (0.78)Foreign currency translation reserve (3.15) (1.44)
Cash and cash equivalents at the beginning of the year 12.76 14.98
Cash and cash equivalents at the end of the year (refer note 4(c)) 44.80 12.76
Note: Reconciliation between cash and cash equivalents and cash and bank balances.
Particulars As at 31st March, 2017
As at 31st March, 2016
Cash and cash equivalents as per cash flow statement 14.49 12.76Add: margin money deposits not considered as cash and cash equivalents as per IND AS-7 25.36 22.24
Cash and bank balances (Restricted and Unrestricted) 39.85 35.00
Notes to the statement of cash flows and disclosure of non cash transactions
1) The statement of cash flow is prepared in accordance with the format prescribed as per Ind-AS 7
2) Other non-cash items” include excess provision written back, materials written off and miscellaneous adjustments not affecting Cash Flow.
3) Other non-cash items” also includes 5,000 0% optionally convertible debentures of ` 1,00,000/- each issued during the year by a debtor to Arkay Logistics Limited (subsidiary upto 10th March,2017) not affecting cash flow.
4) During the year, the Group sold its investment in Arkay Logistics Limited for a consideration of ` 155 crores to an unrelated party. Out of this, an amount of `124.73 crores was adjusted against borrowings (including interest accrued thereon) from Essar Steel India Limited by way of assignment of these borrowings to the unrelated party. This is a non cash transaction
5) In Part-A of the Cash Flow Statement, figures in brackets indicate deductions made from the Net Profit for deriving the net cash flow from operating activities. In Part-B and Part-C, figures in brackets indicate cash outflows.
See accompanying notes 1 to 35 forming part of the consolidated financial statements
As per our attached report of even date For and on behalf of the Board
For C N K & Associates LLP Chartered Accountants Firm Registration No.: 101961W/W100036
Ranjit Singh Executive Director & CEO (DIN: 07021621)
N Srinivasan Director (DIN: 00004195)
Himanshu Kishnadwala Partner Membership No.: 37391
Vikram Gupta Chief Financial Officer
Awaneesh Srivastava Company Secretary Membership No.: FCS 8513
Mumbai, 26th May, 2017 Mumbai, 26th May, 2017

98
CONSOLIDATED STATEMENT OF CHANGES IN EQUITY FOR THE YEAR ENDED 31ST MARCH, 2017
A. EQUITY SHARE CAPITAL(` in crore)
Particulars Equity Share Capital
Balance as on 1st April, 2015 205.23Exercise of stock options 1.75Balance as on 31st March, 2016 206.98Additions during the year –
Balance as on 31st March, 2017 206.98
B. OTHER EQUITY (` in crore)
Particulars
Equity component of foreign currency
convertible bonds
Other equity
Total equity
Reserves and Surplus Other Comprehensive Income
Securities Premium
Retained Earnings
Debenture Redemption
Reserve
Share options
outstanding reserve
Tonnage tax (utilised) reserve
Tonnage tax reserve
Foreign currency
translation reserve
General reserve FCMITDA
Cash flow hedge
reserve
Other items of other
comprehensive income
Balance as on 1st April, 2015 152.91 – (1,776.34) 55.00 1.47 20.00 45.00 – 4,835.22 5.09 (12.88) – 3,325.47
Exercise of stock options – 3.36 – – (0.97) – – – – – – – 2.39Additions during the year – – – – – – – 373.61 – (7.53) (9.23) 0.70 357.55Amortisation during the year – – – – – – – – (9.64) – (9.64)Unwinding of discounted liability (56.54) – 56.54 – – – – – – – – – –Loss for the year – – (550.16) – – – – – – – – – (550.16)
Balance as on 31st March, 2016 96.37 3.36 (2,269.96) 55.00 0.50 20.00 45.00 373.61 4,835.22 (12.08) (22.11) 0.70 3,125.61
Additions during the year – – – – 0.11 (20.00) – (126.32) 20.00 2.52 22.11 (0.38) (101.96)Amortisation during the year (12.31) (12.31)Unwinding of discounted liability (68.67) – 68.67 – – – – – – – – –
Loss for the year – – (583.44) – – – – – – – – – (583.44)Balance as on 31st March, 2017 27.70 3.36 (2,784.73) 55.00 0.61 - 45.00 247.29 4,855.22 (21.87) - 0.32 2,427.90
Refer Note 9(b) for nature and purpose of reserves
See accompanying notes 1 to 35 forming part of the consolidated financial statements
As per our attached report of even date For and on behalf of the Board
For C N K & Associates LLP Chartered Accountants Firm Registration No.: 101961W/W100036
Ranjit Singh Executive Director & CEO (DIN: 07021621)
N Srinivasan Director (DIN: 00004195)
Himanshu Kishnadwala Partner Membership No.: 37391
Vikram Gupta Chief Financial Officer
Awaneesh Srivastava Company Secretary Membership No.: FCS 8513
Mumbai, 26th May, 2017 Mumbai, 26th May, 2017

7th ANNUAL REPORT 2016-17
99
NOTES TO FINANCIAL STATEMENTS FOR THE YEAR ENDED 31ST MARCH, 2017
CORPORATE INFORMATIONEssar Shipping Limited (“the Company”) was incorporated in September 2010 and is listed on the Bombay Stock Exchange and National Stock Exchange in India. The Company is mainly engaged in fleet operating and chartering activities and operates in international and coastal voyages. The Company has also directly and/or through its subsidiaries and associates (hereinafter referred to as “the Group”) invested in diverse business verticals viz. Fleet operating and chartering (tankers and dry bulkers), oilfields services (land rigs and semi- submersible rig) and logistics services (trucks, trailers and tippers). The place of business of the Company is in Mumbai, India.
1) BASIS OF CONSOLIDATION AND SIGNIFICANT ACCOUNTING POLICIES
a) BASIS OF PREPARATION The consolidated financial statements of the Group have been
prepared in accordance with Indian Accounting Standards (hereinafter referred to as Ind-AS) notified under section 133 of Companies Act, 2013 read with the relevant rules issued thereunder.
The consolidated financial statements for the year ended 31st March, 2017 are the first consolidated financials with comparatives, prepared under Ind AS. For all previous periods including the year ended 31st March, 2016, the Group had prepared its consolidated financial statements in accordance with the accounting standards notified under section 133 of the Companies Act, 2013 read with Rule 7 of Companies (Accounting Standards) Rules, 2014 (as amended) and other relevant provisions of the Act (hereinafter referred to as ‘Previous GAAP’) used for its statutory reporting requirement in India. Refer note 30 for an explanation of how the transition from previous GAAP to Ind AS has affected the Consolidated Financial Position, Consolidated Financial Performance and Cash Flows of the Group.
The Group’s presentation currency is Indian Rupees. All amounts in these financial statements, except per share amounts and unless as stated otherwise, have been rounded off to two decimal places and have been presented in crores.
Authorisation of Financial Statements: The Consolidated Financial Statements were authorized for issue in accordance with a resolution of the Board of Directors in its meeting held on 26th May, 2017.
Historical cost convention The consolidated financial statements have been prepared on
a historical cost basis, except for the following: • Certain financial assets and liabilities including derivative
instruments are measured at fair value. • Assets held for sale are measured at the lower of
carrying value and fair value less costs to sell. • Defined benefit plans where plan assets measured at fair
value. Going concern basis of accounting These accounts have been prepared on a going concern
basis. In assessing the Group’s going concern status, the
Management has taken account of: • the financial position of the Group; • anticipated future trading performance; • its bank and other facilities, including facilities in default,
or due to expire within the next 12 months; • its capital investment plans; • the likelihood of any material adverse legal judgments. Refer Note 29 for further details.
PRINCIPLES OF CONSOLIDATION The consolidated financial statements relate to Essar
Shipping Limited, (the ‘Company’), its subsidiary companies and the Group’s share of profit / loss in its associates. The consolidated financial statements have been prepared in accordance with the requirements of Ind AS 110, ‘Consolidated Financial Statements’ on the following basis:
1) The financial statements of the subsidiary companies and associates used in the consolidation are drawn upto the same reporting date as that of the Company i.e., 31 March, 2017. These have been consolidated based on latest available financial statements.
2) The financial statements of the Company and its subsidiary companies have been combined on a line-by-line basis by adding together like items of assets, liabilities, income and expenses, after eliminating intra-group balances, intra-group transactions and resulting unrealised profits or losses, unless cost cannot be recovered.
3) The consolidated financial statements include the share of profit / loss of the associate companies which have been accounted for using equity method as per Ind-AS 28 Accounting for Investments in Associates in Consolidated Financial Statements. Accordingly, the share of profit/ loss of each of the associate companies (the loss being restricted to the cost of investment) has been added to / deducted from the cost of investments.
The excess of cost to the Group of its investments in the subsidiary companies over its share of equity of the subsidiary companies, at the dates on which the investments in the subsidiary companies were made, is recognised as ‘Goodwill’ being an asset in the consolidated financial statements and is tested for impairment at each balance sheet date and impairment loss, if any, is provided for. On the other hand, where the share of equity in the subsidiary companies as on the date of investment is in excess of cost of investments of the Group, it is recognised as ‘Capital Reserve’ and shown under the head ‘Reserves & Surplus’, in the consolidated financial statements. The ‘Goodwill’ / ‘Capital Reserve’ is determined separately for each subsidiary company and such amounts are not set off between different entities.
4) The difference between the cost of investment in the associate and the share of net assets at the time of acquisition of shares in the associate is identified in the consolidated financial statements as Goodwill or Capital reserve as the case may be.

100
5) Following subsidiary companies and associates have been considered in the preparation of the consolidated financial statements:
Name of the entity
Relation-ship
Country of Incor-poration
Owner-ship held
by
% of Holding and voting power either directly or indirectly through
subsidiary as at31st March,
201731st March,
2016Arkay Logistics Limited (“ALL”) (Note i)
Associate/ Subsidiary
India ESL 49% 100%
Essar Oilfields Services Limited (“EOSL”)
Subsidiary Mauritius ESL 100% 100%
Essar Oilfield Services India Limited (“EOSIL”)
Subsidiary India EOSL 100% 100%
Energy Transportation International Limited (“ETIL”)
Subsidiary Bermuda ESL 100% 100%
Energy II Limited (“EIIL”)
Subsidiary Bermuda ESL 100% 100%
Essar Shipping DMCC (“ES DMCC”)
Subsidiary United Arab Emirates
ESL 100% 100%
Essar Oilfields Middle East DMCC (Note ii)
Subsidiary Dubai EOSL 100% 100%
Cosmic Drilling Services Limited (“CDSL”) (Note ii)
Subsidiary Mauritius EOSL 100% 100%
Varada Drilling One Pte Limited (Note iii & iv)
Associate Singapore EOSIL 28.57% 28.57%
Varada Drilling Two Pte Limited (Note iii & iv)
Associate Singapore EOSIL 28.57% 28.57%
Notes: i. On 10th March, 2017, the Company sold a 51% stake in
its wholly-owned subsidiary, Arkay Logistics Limited (ALL) for a consideration of ` 155 crores, thereby losing control over the same.
ii. Essar Oilfields Middle East DMCC and Cosmic Drilling Services Limited have not been operational during the year. Hence, the same have not been considered for consolidation since no financial statements have been prepared and the impact thereof are not expected to be material.
iii. The financial statements of Varada Drilling One Pte Limited and Varada Drilling Two Pte Limited considered for the purpose of preparation of Consolidated Financial Statements are based on the unaudited financials certified by the respective managements.
b) USE OF ESTIMATES The estimates and judgements used in the preparation of
the financial statements are continuously evaluated by the
Group and are based on historical experience and various other assumptions and factors (including expectations of future events) that the Group believes to be reasonable under the existing circumstances. Differences between actual results and estimates are recognised in the period in which the results are known/ materialised. The management believes that the estimates used in the preparation of financial statements are prudent and reasonable.
The said estimates are based on the facts and events, that existed as at the reporting date, or that occurred after that date but provide additional evidence about conditions existing as at the reporting date.
Critical estimates and judgements This note provides an overview of the areas that involved a
higher degree of judgment or complexity, and items which are more likely to be materially adjusted due to estimates and assumptions turning out to be different than those originally assessed. Detailed information about each of these estimates and judgements is included in relevant notes together with information about the basis of calculation for each affected line item in the financial statements.
The areas involving critical estimates or judgement are: Estimation of Defined benefit obligation - refer note 12 Estimation of current tax/ deferred tax expenses and payable -
refer note 20 Useful lives of property, plant and equipment- refer note 2(a) Impairment of Goodwill- refer note 2(b) Impairment of financial and non-financial assets- refer notes 4
and 5 Going Concern- refer note 29
c) CURRENT VERSUS NON-CURRENT CLASSIFICATION The Group presents assets and liabilities in the balance sheet
based on current/ non-current classification. All the assets and liabilities have been classified as current/
non-current as per the Group’s normal operating cycle and other criteria set out in Division II to Schedule III of the Companies Act, 2013.
The operating cycle is the time between the acquisition of assets for processing and their realisation in cash or cash equivalents. Based on the nature of activities of the Group and the normal time between acquisition of assets and their realisation in cash or cash equivalents, the Company has determined its operating cycle as 12 months for the purpose of classification of its assets and liabilities as current and non-current.
d) PROPERTY, PLANT AND EQUIPMENT Freehold land is carried at historical cost. All other items of
property, plant and equipment (PPE) are stated at cost less accumulated depreciation and impairment losses, if any. Historical cost includes expenditure that is directly attributable to the acquisition of the item.
The cost of an item of PPE comprises its purchase price net of any trade discounts and rebates, any import duties and other taxes (other than those subsequently recoverable from the tax authorities), any directly attributable expenditure including brokerage and start-up costs on making the asset ready for its intended use, other incidental expenses and interest on borrowings attributable to acquisition of qualifying
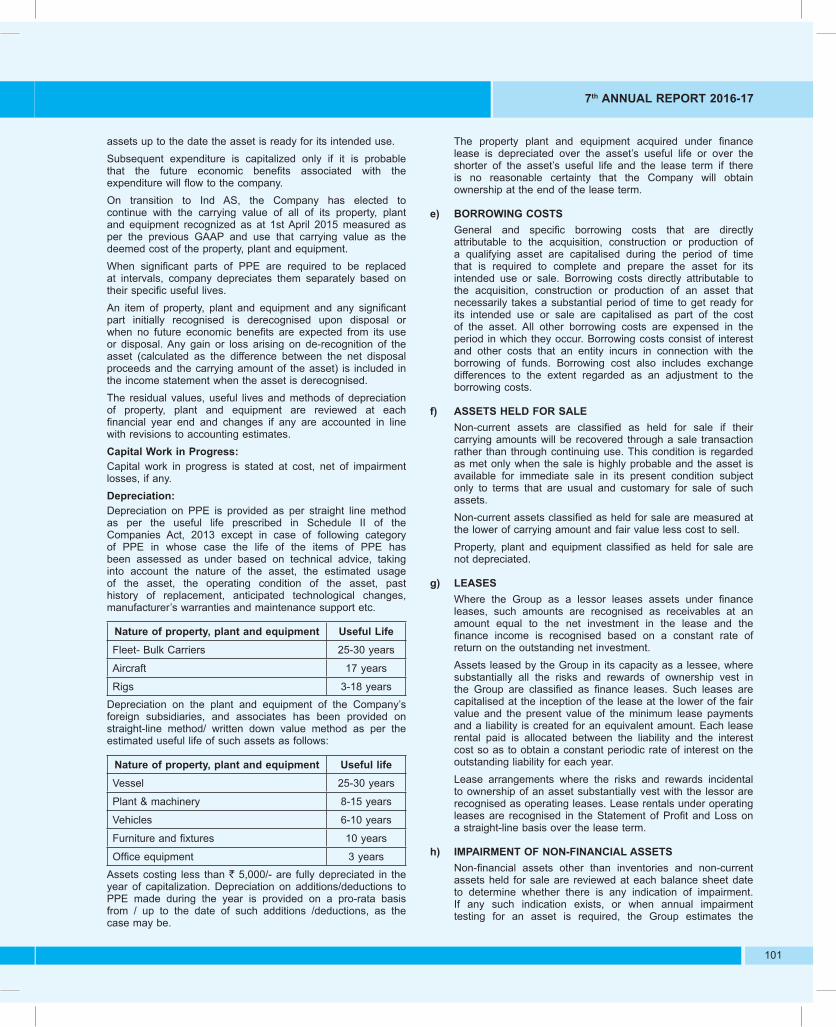
7th ANNUAL REPORT 2016-17
101
assets up to the date the asset is ready for its intended use. Subsequent expenditure is capitalized only if it is probable
that the future economic benefits associated with the expenditure will flow to the company.
On transition to Ind AS, the Company has elected to continue with the carrying value of all of its property, plant and equipment recognized as at 1st April 2015 measured as per the previous GAAP and use that carrying value as the deemed cost of the property, plant and equipment.
When significant parts of PPE are required to be replaced at intervals, company depreciates them separately based on their specific useful lives.
An item of property, plant and equipment and any significant part initially recognised is derecognised upon disposal or when no future economic benefits are expected from its use or disposal. Any gain or loss arising on de-recognition of the asset (calculated as the difference between the net disposal proceeds and the carrying amount of the asset) is included in the income statement when the asset is derecognised.
The residual values, useful lives and methods of depreciation of property, plant and equipment are reviewed at each financial year end and changes if any are accounted in line with revisions to accounting estimates.
Capital Work in Progress: Capital work in progress is stated at cost, net of impairment
losses, if any. Depreciation: Depreciation on PPE is provided as per straight line method
as per the useful life prescribed in Schedule II of the Companies Act, 2013 except in case of following category of PPE in whose case the life of the items of PPE has been assessed as under based on technical advice, taking into account the nature of the asset, the estimated usage of the asset, the operating condition of the asset, past history of replacement, anticipated technological changes, manufacturer’s warranties and maintenance support etc.
Nature of property, plant and equipment Useful LifeFleet- Bulk Carriers 25-30 years
Aircraft 17 years
Rigs 3-18 years Depreciation on the plant and equipment of the Company’s
foreign subsidiaries, and associates has been provided on straight-line method/ written down value method as per the estimated useful life of such assets as follows:
Nature of property, plant and equipment Useful lifeVessel 25-30 years
Plant & machinery 8-15 years
Vehicles 6-10 years
Furniture and fixtures 10 years
Office equipment 3 years Assets costing less than ` 5,000/- are fully depreciated in the
year of capitalization. Depreciation on additions/deductions to PPE made during the year is provided on a pro-rata basis from / up to the date of such additions /deductions, as the case may be.
The property plant and equipment acquired under finance lease is depreciated over the asset’s useful life or over the shorter of the asset’s useful life and the lease term if there is no reasonable certainty that the Company will obtain ownership at the end of the lease term.
e) BORROWING COSTS General and specific borrowing costs that are directly
attributable to the acquisition, construction or production of a qualifying asset are capitalised during the period of time that is required to complete and prepare the asset for its intended use or sale. Borrowing costs directly attributable to the acquisition, construction or production of an asset that necessarily takes a substantial period of time to get ready for its intended use or sale are capitalised as part of the cost of the asset. All other borrowing costs are expensed in the period in which they occur. Borrowing costs consist of interest and other costs that an entity incurs in connection with the borrowing of funds. Borrowing cost also includes exchange differences to the extent regarded as an adjustment to the borrowing costs.
f) ASSETS HELD FOR SALE Non-current assets are classified as held for sale if their
carrying amounts will be recovered through a sale transaction rather than through continuing use. This condition is regarded as met only when the sale is highly probable and the asset is available for immediate sale in its present condition subject only to terms that are usual and customary for sale of such assets.
Non-current assets classified as held for sale are measured at the lower of carrying amount and fair value less cost to sell.
Property, plant and equipment classified as held for sale are not depreciated.
g) LEASES Where the Group as a lessor leases assets under finance
leases, such amounts are recognised as receivables at an amount equal to the net investment in the lease and the finance income is recognised based on a constant rate of return on the outstanding net investment.
Assets leased by the Group in its capacity as a lessee, where substantially all the risks and rewards of ownership vest in the Group are classified as finance leases. Such leases are capitalised at the inception of the lease at the lower of the fair value and the present value of the minimum lease payments and a liability is created for an equivalent amount. Each lease rental paid is allocated between the liability and the interest cost so as to obtain a constant periodic rate of interest on the outstanding liability for each year.
Lease arrangements where the risks and rewards incidental to ownership of an asset substantially vest with the lessor are recognised as operating leases. Lease rentals under operating leases are recognised in the Statement of Profit and Loss on a straight-line basis over the lease term.
h) IMPAIRMENT OF NON-FINANCIAL ASSETS Non-financial assets other than inventories and non-current
assets held for sale are reviewed at each balance sheet date to determine whether there is any indication of impairment. If any such indication exists, or when annual impairment testing for an asset is required, the Group estimates the

102
asset’s recoverable amount. The recoverable amount is higher of asset’s or Cash-Generating Units (CGU) fair value less costs of disposal and its value in use. Recoverable amount is determined for an individual asset, unless the asset does not generate cash flows that are largely independent of those from other assets or group of assets.
When the carrying amount of an asset or CGU exceeds its recoverable amount, the asset is considered impaired and is written down to its recoverable amount.
i) VALUATION OF INVENTORY Cost includes all charges in bringing the inventories to their
present location and condition, including octroi and other levies, transit insurance and receiving charges and excluding rebated and discounts, if any. Inventories are valued at the lower of cost determined on first-in-first-out basis and the net realisable value after providing for obsolescence and other losses, where considered necessary. Net realisable value is the estimated selling price in the ordinary course of business.
j) REVENUE RECOGNITION Fleet operating earnings represent the value of charter hire
earnings, demurrage, freight earnings, fleet management fees and lighterage earnings, and are accounted on accrual basis. Freight earnings are recognised on a pro-rata basis for voyages in progress at balance sheet date after loading of the cargo is completed. Revenues and related expenses for voyages where cargo has not been loaded as on the balance sheet date are deferred and recognised in the following year. Lighterage is recognised on the basis of unloading of entire cargo.
Freight earnings, stevedoring and lighterage are recognised on a pro-rata basis for voyages in progress at balance sheet date after loading / unloading of the cargo is completed; revenues and related expenses for voyages where cargo has not been loaded / unloaded as on the balance sheet date are deferred and recognised in the following year.
Income from drilling and production services is recognised as earned, based on contractual daily rates billed on monthly basis. Mobilization / demobilization fees received, if any, is recognised as earned in the year of mobilization / demobilization.
Revenue on transactions of rendering other services is recognised under the completed service contract method. Performance is regarded as achieved when the services are rendered and no significant uncertainty exists regarding the amount of consideration that will be derived from rendering of services.
Interest income Interest income is recognised on a time proportion basis
taking into account the amount outstanding and the rate applicable.
For all debt instruments measured either at amortised cost or at fair value through other comprehensive income, interest income is recorded using the effective interest rate (EIR).
Dividend income Dividend income is accounted for when the right to receive
the same is established, which is generally when shareholders approve the dividend.
Other Income Other income is accounted for on accrual basis except
where the receipt of income is uncertain in which case it is accounted for on receipt basis.
Insurance Claims Insurance claims are accounted for on the basis of claims
admitted / expected to be admitted and to the extent that the amount recoverable can be measured reliably and it is reasonable to expect ultimate collection.
k) OPERATING EXPENSES All expenses relating to the operation including crewing,
insurance, stores, bunkers, charter hire and special survey costs, rig operating expenses, mobilization and de-mobilization charges, transportation and catering are expensed under operating expenses on accrual basis. Dry-docking expenses are amortised over 30 months.
l) EMPLOYEE BENEFITS i) Short term employee benefits The undiscounted amount of short-term employee
benefits expected to be paid in exchange for the services rendered by employees is recognised during the period when the employee renders the services. These benefits include compensated absences such as paid annual leave, and performance incentives.
ii) Long term employee benefits Compensated absences which are not expected to
occur within twelve months after the end of the period in which the employee renders the related services are recognised as a liability at the present value of the defined benefit obligation determined actuarially by using Projected Unit Credit Method at the balance sheet date.
iii) Post employment benefit plan The Holding company (employer) and the employees
contribute a specified percentage of eligible employees’ salary- currently 12%, to the employer established provident fund “Essar Shipping Limited Employees Provident Fund” set up as an irrevocable trust by the Parent company. In case of subsidiaries, contribution is made to the established Government Provident fund. The Group is generally liable for annual contributions and any shortfall in the fund assets and recognises such provident fund liability, considering fund as the defined benefit plan, based on an independent actuarial valuation carried out at every statutory year end using the Projected Unit Credit Method.
Provision for gratuity for the staff is made as under: (i) For offshore officers on actuarial valuation. (ii) For offshore crew on accrual basis as per rules of
the National Maritime Board and is charged to the Statement of Profit and Loss.
Contribution to defined contribution retirement benefit schemes are recognised as expense in the Statement of Profit and Loss, when employees have rendered services entitling them to contributions.
For defined benefit schemes, the cost of providing benefits is determined using the Projected Unit Credit Method, with actuarial valuations being carried out at each balance sheet date. Actuarial gains and losses

7th ANNUAL REPORT 2016-17
103
are recognised in full in Other Comprehensive Income, for the period in which they occur. Past service cost is recognised immediately to the extent that the benefits are already vested, and is otherwise amortised on a straight line basis over the average period until the benefits become vested.
The retirement benefit obligation recognised in the balance sheet represents the present value of the defined benefit obligation and is adjusted both for unrecognised past service cost, and for the fair value of plan assets. Any asset resulting from this calculation is limited to the present value of available refunds and reductions in future contributions to the scheme, if lower.
iv) Employee Options The fair value of the options granted under the value
of the Company, Employee Option Plan is recognised as employee benefits expense with the corresponding increase in equity. The total amount to be expensed is determined by the reference to the fair value of the options granted:
– including any market conditions (e.g., the entity’s share price)
– excluding the impact of any service and non- market performance vesting conditions(profitability, sales growth targets and remaining an employee of the entity over the specified period), and
– including the impact of any non-vesting conditions (e.g. the requirement for the employee to save or holding shares for the specific period of time)
The total expense is recognised over the vesting period, which is the period over which all the specified vesting conditions are to be satisfied. At the end of each period, the entity revises its estimate of the number of options that are expected to vest based on the non-market vesting and service conditions. It recognises the impact of the revision to original estimates, if any, in profit or loss, with the corresponding adjustments to equity.
m) FOREIGN CURRENCIES (i) Functional and presentation currency The Company’s financial statements are presented
in Indian Rupee (INR), which is also the Company’s functional and presentation currency.
(ii) Transaction and balances Transactions in foreign currencies are translated into
functional currency using the exchange rate at the dates of the transactions. Foreign exchange gains and losses resulting from the settlement of such transactions and from the translation of monetary assets and liabilities denominated in foreign currencies at the year end exchange rates are generally recognised in Profit or loss. They are deferred in Equity if they relate to qualifying cash flow hedges. A monetary item for which settlement is neither planned nor likely to occur in the foreseeable future is considered as a part of the entity’s net investment in those foreign operations.
Foreign exchanges differences regarded as adjustments to borrowing costs are presented in the Statement of Profit and Loss, within finance cost. All other foreign exchange gains and losses as presented in the Statement of Profit and Loss on a net basis within other
gains/ (losses). Non-monetary items measured at fair value in a foreign
currency are translated using the exchange rates at the date when the fair value is determined. The gain or loss arising on translation of non-monetary items measured at fair value is treated in line with the recognition of the gain or loss on the change in fair value of the item (i.e., translation differences on items whose fair value gain or loss is recognised in OCI or profit or loss are also recognised in OCI or profit or loss, respectively).
Non-monetary items that are measured in terms of historical cost in a foreign currency, are translated using exchange rates on dates of initial recognition.
Exchange differences relating to Long term foreign currency monetary items are accounted in terms of Para D13AA of Ind-AS 101 as under:
(i) In so far as they relate to the acquisition of a depreciable capital asset, such differences are added to/deducted from the cost of such capital asset and depreciated over the balance useful life of the asset
(ii) In other cases, such differences are accumulated in “Foreign currency Monetary Items Translation differences account and amortised in the Statement of Profit and Loss over the balance useful life of the long term foreign currency monetary item.
n) PROVISIONS AND CONTINGENCIES Provisions are recognized when there is a present obligation
(legal or constructive) as a result of a past event, it is probable that an outflow of resources embodying economic benefits will be required to settle the obligation and a reliable estimate can be made of the amount of the obligation. Provisions are reviewed at each balance sheet date and are adjusted to reflect the current best estimate.
If the effect of the time value of money is material, provisions are discounted using a current pre-tax rate that reflects, when appropriate, the risks specific to the liability. When discounting is used, the increase in the provision due to the passage of time is recognised as a finance cost.
Contingent liabilities are disclosed when there is a possible obligation arising from past events, the existence of which will be confirmed only by the occurrence or non-occurrence of one or more uncertain future events not wholly within the control of the Company or a present obligation that arises from past events where it is either not probable that an outflow of resources will be required to settle or a reliable estimate of the amount cannot be made. Information on contingent liability is disclosed in the Notes to the Financial Statements.
Contingent assets are not recognised but disclosed when the inflow of economic benefits is probable. However, when the realisation of income is virtually certain, then the related asset is no longer a contingent asset, but it is recognised as an asset.
o) FAIR VALUE MEASUREMENT Fair value is the price that would be received to sell an
asset or paid to transfer a liability in an orderly transaction between market participants at the measurement date. The fair value measurement is based on the presumption that the transaction to sell the asset or transfer the liability takes place either:

104
• In the principal market for the asset or liability, or • In the absence of a principal market, in the most
advantageous market which can be accessed by the Group for the asset or liability.
The fair value of an asset or a liability is measured using the assumptions that market participants would use when pricing the asset or liability, assuming that market participants act in their economic best interest.
The Group uses valuation techniques that are appropriate in the circumstances and for which sufficient data are available to measure fair value, maximising the use of relevant observable inputs and minimising the use of unobservable inputs.
All assets and liabilities for which fair value is measured or disclosed in the financial statements are categorised within the fair value hierarchy, described as follows, based on the lowest level input that is significant to the fair value measurement as a whole:
• Level 1 Quoted (unadjusted) market prices in active markets for identical assets or liabilities
• Level 2 Valuation techniques for which the lowest level input that is significant to the fair value measurement is directly or indirectly observable
• Level 3 Valuation techniques for which the lowest level input that is significant to the fair value measurement is unobservable
For assets and liabilities that are recognised in the financial statements on a recurring basis, the Group determines whether transfers have occurred between levels in the hierarchy by re-assessing categorisation (based on the lowest level input that is significant to the fair value measurement as a whole) at the end of each reporting period.
p) FINANCIAL ASSETS Initial recognition and measurement All financial assets are recognised initially at fair value plus,
in the case of financial assets not recorded at fair value through profit or loss, transaction costs that are attributable to the acquisition of the financial asset. Purchases or sales of financial assets that require delivery of assets within a time frame established by regulation or convention in the market place (regular way trades) are recognised on the trade date, i.e., the date that the Company commits to purchase or sell the asset.
Subsequent measurement Subsequent measurement is determined with reference to
the classification of the respective financial assets. Based on the business model for managing the financial assets and the contractual cash flow characteristics of the financial asset, the Company classifies financial assets as subsequently measured at amortised cost, fair value through Other Comprehensive Income or fair value through profit and loss.
Debt instruments at amortised cost Debt instruments such as trade and other receivables, security
deposits and loans given are measured at the amortised cost if both the following conditions are met:
• The asset is held within a business model whose objective is to hold assets for collecting contractual cash flows, and
• Contractual terms of the asset give rise on specified dates to cash flows that are solely payments of principal and interest (SPPI) on the principal amount outstanding.
After initial measurement, such financial assets are subsequently measured at amortised cost using the effective interest rate (EIR) method. Amortised cost is calculated by taking into account any discount or premium on acquisition and fees or costs that are an integral part of the EIR. The EIR amortisation is included in finance income in the profit or loss. The losses arising from impairment are recognised in the profit or loss.
Debt instrument at FVTOCI A ‘debt instrument’ is classified as at the FVTOCI if both of the
following criteria are met: • The objective of the business model is achieved both by
collecting contractual cash flows and selling the financial assets, and
• The asset’s contractual cash flows represent SPPI. Debt instruments included within the FVTOCI category are
measured initially as well as at each reporting date at fair value. Fair value movements are recognized in the other comprehensive income (OCI).
Debt instrument at FVTPL FVTPL is a residual category for debt instruments excluding
investments in subsidiary and associate companies. Any debt instrument, which does not meet the criteria for categorization as at amortized cost or as FVTOCI, is classified as at FVTPL.
After initial measurement, any fair value changes including any interest income, foreign exchange gain and losses, impairment losses and other net gains and losses are recognised in the Statement of Profit and Loss.
Equity investments All equity investments in scope of Ind-AS 109 are measured
at fair value. Equity instruments which are held for trading are classified as at FVTPL. For all other equity instruments, ESL decides to classify the same either as at FVTOCI or FVTPL. The Group makes such election on an instrument-by-instrument basis. The classification is made on initial recognition and is irrevocable.
Equity instruments included within the FVTPL category are measured at fair value with all changes recognized in the Profit or loss.
Derecognition A financial asset is primarily derecognised when: • The rights to receive cash flows from the asset have
expired, or • The Company has transferred its rights to receive cash
flows from the asset or has assumed an obligation to pay the received cash flows in full without material delay to a third party under a ‘pass-through’ arrangement; and either
a) The Company has transferred substantially all the risks and rewards of the asset, or
b) The Company has neither transferred nor retained substantially all the risks and rewards of the asset, but has transferred control of the asset.

7th ANNUAL REPORT 2016-17
105
On de-recognition, any gains or losses on all debt instruments (other than debt instruments measured at FVTOCI) and equity instruments (measured at FVTPL) are recognized in the Statement of Profit and Loss. Gains and losses in respect of debt instruments measured at FVTOCI and that are accumulated in OCI are reclassified to profit or loss on de-recognition. Gains or losses on equity instruments measured at FVTOCI that are recognized and accumulated in OCI are not reclassified to profit or loss on de-recognition
Impairment of financial assets The Group applies expected credit loss (ECL) model for
measurement and recognition of impairment loss on the following financial assets and credit risk exposure:
a) Financial assets that are debt instruments, and are measured at amortised cost e.g., loans, debt securities, deposits, trade receivables and bank balance.
b) Financial assets measured at fair value through other comprehensive income.
In case of other assets, the Group determines the loss allowance based on the quantum of increase in credit risk of the financial assets since initial recognition. If the credit risks have increased significantly, an appropriate amount is recognized as a loss allowance based on the expected credit methods.
q) FINANCIAL LIABILITIES Initial recognition and measurement All financial liabilities are recognised initially at fair value and,
in the case of loans and borrowings and payables, net of directly attributable transaction costs.
The Group’s financial liabilities include trade and other payables, loans and borrowings including bank overdrafts, and derivative financial instruments.
Subsequent measurement The measurement of financial liabilities depends on their
classification, as described below: Financial liabilities at fair value through profit or loss Financial liabilities at fair value through profit or loss include
financial liabilities designated upon initial recognition as at fair value through profit or loss.
Financial liabilities designated upon initial recognition at fair value through profit or loss are designated at the initial date of recognition, and only if the criteria in Ind-AS 109 are satisfied. For liabilities designated as FVTPL, fair value gains/ losses attributable to changes in own credit risks are recognized in OCI. These gains/ loss are not subsequently transferred to profit or loss. However, the company may transfer the cumulative gain or loss within equity. All other changes in fair value of such liability are recognised in the statement of profit or loss.
Financial liabilities at amortized cost Financial liabilities classified and measured at amortised cost
such as loans and borrowings are initially recognized at fair value, net of transaction cost incurred. After initial recognition, financial liabilities are subsequently measured at amortised cost using the Effective interest rate (EIR) method. Gains and losses are recognised in profit or loss when the liabilities are derecognised as well as through the EIR amortisation process.
Amortised cost is calculated by taking into account any discount or premium on acquisition and fees or costs that are an integral part of the EIR. The EIR amortisation is included as finance costs in the Statement of Profit and Loss.
Derecognition A financial liability is derecognised when the obligation under
the liability is discharged or cancelled or expired. When an existing financial liability is replaced by another from the same lender on substantially different terms, or the terms of an existing liability are substantially modified, such an exchange or modification is treated as the de-recognition of the original liability and the recognition of a new liability. The difference in the respective carrying amounts is recognised in the statement of profit or loss.
Derivative financial instruments The Group uses derivative financial instruments to manage
the commodity price risk and exposure on account of fluctuation in interest rate and foreign exchange rates. Such derivative financial instruments are initially recognized at fair value on the date on which a derivative contract is entered into and are subsequently measured at fair value with changes being recognized in Statement of Profit and Loss. Derivatives are carried as financial assets when the fair value is positive and as financial liabilities when the fair value is negative.
Any gains or losses arising from changes in the fair value of derivatives are taken through other comprehensive income.
Borrowings Borrowings are initially recognised at fair value, net of
transaction costs incurred. Borrowings are subsequently measured at amortised cost. Any differences between the proceeds (net of transaction costs) and the redemption amount is recognised in Profit or loss over the period of the borrowing using the effective interest method. Fees paid on the establishment of loan facilities are recognised as transaction costs of the loan to the extent that it is probable that some or all of the facilities will be drawn down. In this case, the fee is deferred until the drawdown occurs.
The borrowings are removed from the Balance sheet when the obligation specified in the contract is discharged, cancelled or expired. The difference between the carrying amount of the financial liability that has been extinguished or transferred to another party and the consideration paid including any noncash asset transferred or liabilities assumed, is recognised in profit or loss as other gains/(losses).
Borrowings are classified as current liabilities unless the group has an unconditional right to defer settlement of the liability of atleast 12 months after the reporting period. Where there is a breach of a material provision of a long term loan arrangement on or before the end of the reporting period with the effect that the liability becomes payable on demand on the reporting date, the entity does not classify the liability as current, if the lender agreed, after the reporting period and before the approval of the financial statement for issue, not to demand payment as a consequence of the breach.
Foreign currency convertible bonds (FCCBs) FCCBs are separated into liability and equity components
based on the terms of the contract. On issuance of the FCCBs, the fair value of the liability component is determined

106
using a market rate for an equivalent non-convertible instrument. This amount is classified as a financial liability measured at amortised cost (net of transaction costs) until it is extinguished on conversion or redemption. The remainder of the proceeds is allocated to the conversion option that is recognised and included in equity since conversion option meets Ind AS 32 criteria for fixed to fixed classification. Transaction costs are apportioned between the liability and equity components of the FCCBs based on the allocation of proceeds to the liability and equity components when the instruments are initially recognised.
Offsetting of financial instruments Financial assets and financial liabilities are offset and the net
amount is reported in the consolidated balance sheet if there is a currently enforceable legal right to offset the recognised amounts and there is an intention to settle on a net basis, to realise the assets and settle the liabilities simultaneously. The legally enforceable right must not be contingent on future events and must be enforceable in the normal course of business and in the event of default, insolvency or bankruptcy of the company, or the counterparty.
r) TAXES ON INCOME Current tax is the amount of tax payable as per special
provisions relating to income of shipping companies under the Income Tax Act, 1961 on the basis of deemed tonnage income of the Group and tax payable on other taxable income for the year determined in accordance with the applicable tax rates and provisions of the Income Tax Act, 1961 and other applicable tax laws.
Minimum Alternate Tax (MAT) paid in accordance with the tax laws, which gives future economic benefits in the form of adjustment to future income tax liability, is considered as an asset if there is convincing evidence that the Group will pay normal income tax. Accordingly, MAT is recognised as an asset in the Balance Sheet when it is highly probable that future economic benefit associated with it will flow to the Group.
Deferred tax is recognised on differences between the carrying amounts of assets and liabilities in the Balance sheet and the corresponding tax bases used in the computation of taxable profit and are accounted for using the liability method. Deferred tax liabilities are generally recognised for all taxable temporary differences, and deferred tax assets are generally recognized for all deductible temporary differences, carry forward tax losses and allowances to the extent that it is probable that future taxable profits will be available against which those deductible temporary differences, carry forward tax losses and allowances can be utilised. Deferred tax assets and liabilities are measured at the applicable tax rates. Deferred tax assets and deferred tax liabilities are off set, and presented as net.
Current and deferred tax relating to items directly recognised in reserves is recognised in reserves and not in the Statement of Profit and Loss.
Further, the holding company is paying taxes on the basis of deemed tonnage income therefore no impact on deferred tax.
r) EARNINGS PER SHARE Basic earnings per share is computed by dividing the profit /
(loss) after tax (including the post-tax effect of extraordinary
items, if any) by the weighted average number of equity shares outstanding during the year. Diluted earnings per share is computed by dividing the profit / (loss) after tax (including the post-tax effect of extraordinary items, if any) as adjusted for dividend, interest and other charges to expense or income (net of any attributable taxes) relating to the dilutive potential equity shares, by the weighted average number of equity shares considered for deriving basic earnings per share and the weighted average number of equity shares which could have been issued on the conversion of all dilutive potential equity shares.
Potential equity shares are deemed to be dilutive only if their conversion to equity shares would decrease the net profit per share from continuing ordinary operations. Potential dilutive equity shares are deemed to be converted as at the beginning of the period, unless they have been issued at a later date. The dilutive potential equity shares are adjusted for the proceeds receivable had the shares been actually issued at fair value (i.e. average market value of the outstanding shares). Dilutive potential equity shares are determined independently for each period presented. The number of equity shares and potentially dilutive equity shares are adjusted for share splits / reverse share splits and bonus shares, as appropriate.
s) CASH AND CASH EQUIVALENTS For the purpose of presentation in statement of cash flows,
cash and cash equivalents includes cash on hand, deposit held at call with financial institution, other short term, highly liquid investments with original maturities of 3 months or less that are readily convertible to known amounts of cash and which are subject to an insignificant risk of changes in value, and bank overdrafts. Bank Overdrafts are shown within borrowings in current liabilities in Balance sheet.
t) CASH FLOW STATEMENT Cash flows are reported using the indirect method, whereby
profit / (loss) before extraordinary items and tax is adjusted for the effects of transactions of non-cash nature and any deferrals or accruals of past or future cash receipts or payments. The cash flows from operating, investing and financing activities of the Group are segregated based on the available information.
u) OPERATING SEGMENTS The Board of Directors of the Company is considered to be
the ‘Chief Operating Decision Maker’ (CODM) as defined in Ind AS 108. The operating segment is the level at which discrete financial information is available. The CODM allocates resources and assesses performance at this level. The Group has identified following reportable segments:
i. Fleet operating and chartering ii. Logistics services iii. Oilfields services Geographical segments The CODM has also identified the reportable geographical
segments in presenting the segment revenue based on the various risk bearing economic environments in which the Group operates. Revenue from foreign countries has been separately disclosed based on the materiality of the amount of revenue.

7th ANNUAL REPORT 2016-17
107
2(a) PROPERTY, PLANT AND EQUIPMENT(` in crore)
Particulars Land Buildings FleetFleet
(taken on lease)
Plant and equipment Aircraft
Furniture and
fixturesVehicles Office
equipment TotalCapital Work in
ProgressAs at 01.04.2015Gross Block 0.18 6.43 2,042.50 851.42 3,672.54 98.38 1.69 48.05 5.41 6,726.60 78.37Accumulated Depreciation – 4.18 799.37 335.84 1,411.81 44.16 1.40 37.37 4.47 2,638.60 –
Deemed Cost as at 01.04.2015* 0.18 2.25 1,243.13 515.58 2,260.73 54.22 0.29 10.68 0.94 4,088.00 78.37
Additions – – 14.24 – 6.71 – 0.03 – 0.27 21.24 0.67Exchange differences – – 36.58 13.65 – – – – – 50.22 –Foreign currency translation differences
– – – 19.10 177.26 – – – 0.03 196.39 –
Transfer to assets held for sale – – (59.58) – – (54.22) – – – (113.80) –Disposals – – (1.43) (0.02) – – (4.27) (0.24) (5.95) –
As at 31.03.2016 0.18 2.25 1,232.93 548.33 2,444.68 – 0.32 6.41 1.00 4,236.10 79.04
Additions – – 19.13 – 2.03 – 0.07 2.83 0.25 24.31 58.54Transfers – – – – 1.07 – – – – 1.07 (1.07)Exchange differences – – (3.76) – – – – – (3.76) –Foreign currency translation differences
– – (7.61) – (17.61) – – – – – –
Disposal of a subsidiary (0.05) – (89.49) – (5.96) – – (3.92) (0.36) (99.78) –Disposals – – – – – – – – – –
As at 31.03.2017 0.13 2.25 1,151.20 548.33 2,424.21 – 0.39 5.31 0.90 4,132.71 136.51
Accumulated DepreciationAs at 01.04.2015* – – – – – – – – – –Additions – 0.47 150.06 31.93 269.93 5.91 0.19 5.17 0.28 463.94 –Foreign currency translation differences
– – 5.89 6.74 71.35 – – – 0.02 84.00 –
Disposals – – (0.13) – (5.91) (0.19) (3.68) – (9.91) –
As at 31.03.2016 – 0.47 155.82 38.67 341.28 – – 1.49 0.30 538.04 –
Additions – 0.48 125.93 45.55 214.54 – 0.15 3.63 0.22 390.50 –Foreign currency translation differences – – (6.69) (15.41) – – – (22.10) –Disposals – – – – – – – – – – –
As at 31.03.2017 – 0.96 275.06 84.23 540.41 – 0.15 5.12 0.51 906.43 –
Net BlockAs at 01.04.2015* 0.18 2.25 1,243.13 515.58 2,260.73 54.22 0.29 10.68 0.94 4,088.00 78.37
As at 31.03.2016 0.18 1.78 1,077.11 509.66 2,103.41 – 0.32 4.92 0.70 3,698.06 79.04
As at 31.03.2017 0.13 1.29 876.14 464.10 1,883.80 – 0.24 0.19 0.38 3,226.28 136.51
*At deemed cost as per IND-AS 101. Refer Note 30 for further details.
(i) Leased assets The lease term in respect of assets acquired under finance leases expires within 2 years. Refer Note 23 for terms of leasing
arrangements and related disclosures.

108
(ii) Water treatment plant Items of Property, Plant and Equipment include a water treatment plant of value ` 38.84 crores given on lease. However, the
gross block of the same as on 1st April,2015 is Nil as per Ind-AS 101.
(iii) Assets given as security for borrowings a) Fleet and Land owned by the Company have been given to lenders as security for various borrowing facilities. b) Five Rigs owned by a subsidiary have been given to its lenders as security for various borrowing facilities. c) Six Land Rigs of a subsidiary have been secured against 11.35% secured non Convertible Debenture issue by the Company
(iv) Interest capitalised Addition to Capital work in progress includes capitalisation of Interest related to Jackup Rigs.
(v) Impairment testing a) Fleet: In view of pertinent slowdown in shipping industry, the Company has assessed ‘recoverable amount’ of each fleet
by estimating their “value in use”, in terms of IND-AS 36 “Impairment of Assets”. ‘Value in use’ is estimated by applying appropriate discount rate to projected net cash inflows having regard to existing long term contracts, expected tariff based on past trends and costs to operate the fleet which represents the management’s best estimate of the set of economic conditions that will exist over remaining useful life of each fleet. Based on the aforementioned assessment, it has been concluded that ‘recoverable amount’ of the fleet is higher than their respective carrying amount.
b) Rigs: Certain Rigs of a subsidiary with carrying amount of ` 114.99 crores (Including capital work in progress of ` 79.16 crores) as at 31st March 2017, which have not been deployed for extended period of time are impaired in terms of Indian Accounting Standard (Ind AS) 36, Impairment of Assets. Management of the subsidiary has not concluded the process of validating various operational assumptions impacting the recoverable amounts of the aforesaid Rigs and thus the impaired value of the aforesaid Rigs is not available as at balance sheet date.
2(B) GOODWILL ON CONSOLIDATION(` in crore)
Particulars As at 31st March, 2017
As at 31st March, 2016
As at 1st April, 2015
Opening balance * 2,750.87 2,408.86 2,408.86Foreign currency translation differences (136.57) 342.01 –Disposal of a subsidiary (5.26) – –
Closing balance 2,609.04 2,750.87 2,408.86
Goodwill is tested for impairment at each balance sheet date. On 1st April, 2015, out of the total carrying value of Goodwill of ` 5,725.86 crores, the Group assessed the fair value of Goodwill pertaining to a subsidiary having carrying value of ` 5720.66 to be lower by ` 3,317 crores. This impairment was recorded by reducing the Opening Retained Earnings as per the transition provisions contained in Ind AS-101.
3(a) INVESTMENTS IN ASSOCIATES(` in crore)
Particulars As at 31st March, 2017
As at 31st March, 2016
As at 1st April, 2015
Unquoted, fully paid up35,770,000 Equity shares of `10/- each of Arkay Logistics Limited (associate since 10th March 2017)
37.01 – –
5,000,000 Equity shares of US$1 each of Varada Drilling One Pte Limited, Singapore, net of provision for diminution other than temporary in the value of the investment ` 31.24 crores*
– – –
5,000,000 Equity shares of US$1 each of Varada Drilling Two Pte Limited, Singapore, net of provision for diminution other than temporary in the value of the investment ` 31.24 crores*
– – –
Total 37.01 – –

7th ANNUAL REPORT 2016-17
109
*In accordance with the transitional provisions contained in Ind-AS 101, the Group’s investments in Varada Drilling One Pte Limited and Varada Drilling Two Pte Limited have been fully impaired as the said investments were not recoverable owing to the persistent downturn in the Rig Operating business. The impairment in case of each of the two associates amounted to ` 31.24 crores. The total impairment loss of ` 62.48 crores was recognised in Opening Retained Earnings as at 1st April, 2015. After marking down these investments to Nil, the Group has discontinued recognition of its share of losses incurred by these companies till they earn sufficient profits to erase the deficit incurred in previous accounting periods.
Information about the associates
Name of the Company Country of Incorporation and Principal Activities
Proportion of equity interestAs at
31st March, 2017
%
As at 31st March,
2016 %
As at 1st April, 2015
%
Arkay Logistics Limited India, multi-modal transport services 49.00% – –Varada Drilling One Pte Limited Singapore, Rig operating and chartering services 28.57% 28.57% 28.57%Varada Drilling One Pte Limited Singapore, Rig operating and chartering services 28.57% 28.57% 28.57%
The carrying value of the Group’s investment in Arkay Logistics Limited is derived as follows:(` in crore)
Particulars As at 31st March, 2017
As at 31st March, 2016
As at 1st April, 2015
Opening balance – – –
Addition during the year (on 10th March 2017) 35.77 – –
Share of profit for the period 10th March 2017 to 31st March 2017 1.24 – –
Closing balance 37.01 – –
3(b) OTHER INVESTMENTS(` in crore)
Particulars As at 31st March, 2017
As at 31st March, 2016
As at 1st April, 2015
Nil (previous year Nil) units of `10 each of Union KBC Capital Protection Oriented Fund.
– – 0.10
Total other investments (Current) – – 0.10
4(a) TRADE AND OTHER RECEIVABLES(` in crore)
Particulars As at 31st March, 2017
As at 31st March, 2016
As at 1st April, 2015
Unsecured
Trade receivables, considered good 63.88 237.71 218.17
Trade receivables, considered doubtful 132.85 135.42 121.38
Receivables from related parties (refer note 28) 55.81 97.53 122.36
Less: Allowance for doubtful debts (132.85) (135.42) (121.38)
Total receivables (Current) 119.69 335.24 340.53
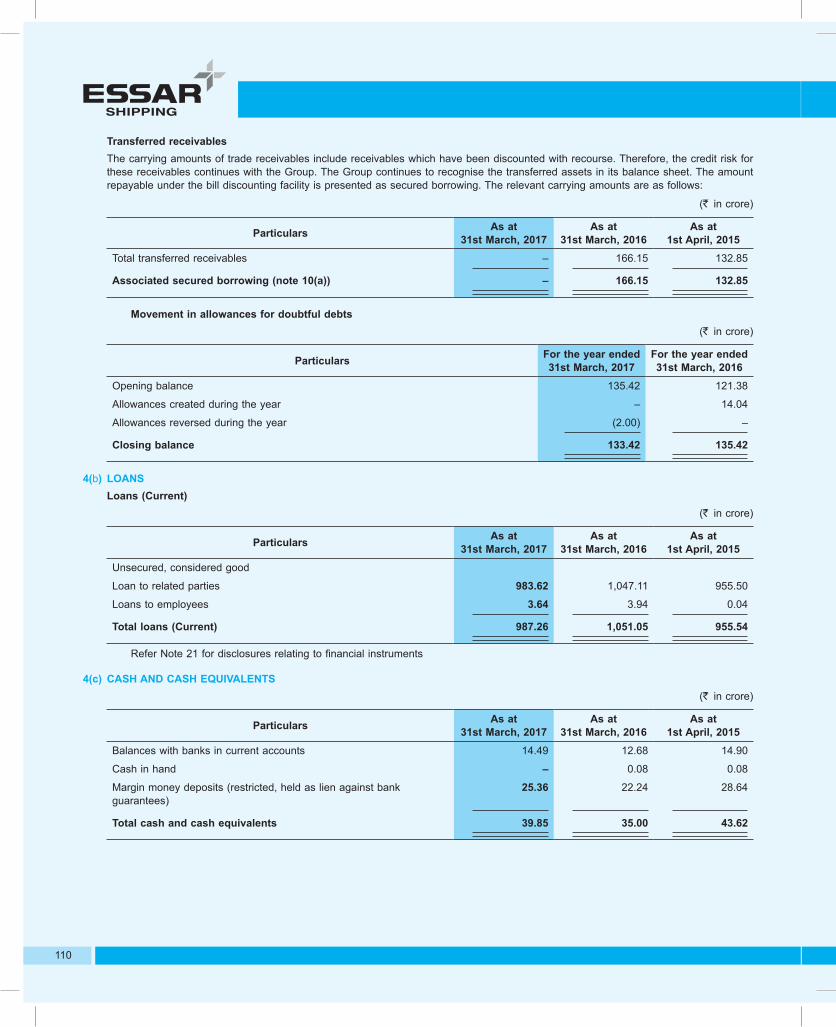
110
Transferred receivables The carrying amounts of trade receivables include receivables which have been discounted with recourse. Therefore, the credit risk for
these receivables continues with the Group. The Group continues to recognise the transferred assets in its balance sheet. The amount repayable under the bill discounting facility is presented as secured borrowing. The relevant carrying amounts are as follows:
(` in crore)
Particulars As at 31st March, 2017
As at 31st March, 2016
As at 1st April, 2015
Total transferred receivables – 166.15 132.85
Associated secured borrowing (note 10(a)) – 166.15 132.85
Movement in allowances for doubtful debts(` in crore)
Particulars For the year ended 31st March, 2017
For the year ended 31st March, 2016
Opening balance 135.42 121.38
Allowances created during the year – 14.04
Allowances reversed during the year (2.00) –
Closing balance 133.42 135.42
4(b) LOANS Loans (Current)
(` in crore)
Particulars As at 31st March, 2017
As at 31st March, 2016
As at 1st April, 2015
Unsecured, considered good
Loan to related parties 983.62 1,047.11 955.50
Loans to employees 3.64 3.94 0.04
Total loans (Current) 987.26 1,051.05 955.54
Refer Note 21 for disclosures relating to financial instruments
4(c) CASH AND CASH EQUIVALENTS(` in crore)
Particulars As at 31st March, 2017
As at 31st March, 2016
As at 1st April, 2015
Balances with banks in current accounts 14.49 12.68 14.90
Cash in hand – 0.08 0.08
Margin money deposits (restricted, held as lien against bank guarantees)
25.36 22.24 28.64
Total cash and cash equivalents 39.85 35.00 43.62

7th ANNUAL REPORT 2016-17
111
4(d) OTHER FINANCIAL ASSETS Other financial assets (current)
(` in crore)
Particulars As at 31st March, 2017
As at 31st March, 2016
As at 1st April, 2015
Receivables on sale of items of PPE – – 0.20
Insurance claim receivable 8.62 6.56 47.72
Advances to others 115.03 115.20 75.04
Interest accrued 173.00 147.57 154.43
Bills receivable – 6.25 0.06
Other advances 16.43 167.18 52.70
Receivable on sale of investments 33.51 – –
Receivables from related parties 1,690.30 1,333.58 1,328.20
Security deposits 6.89 6.73 3.68
Total other financial assets (Current) 2,043.78 1,783.08 1,662.03
Other financial assets (Non-current)(` in crore)
Particulars As at 31st March, 2017
As at 31st March, 2016
As at 1st April, 2015
Bank deposits held as margin money, pledged against certain bank borrowings
8.56 19.06 7.30
Income tax assets 8.89 – 0.18
Receivables from related parties – – 43.81
Security deposits 0.78 6.24 23.68
Total other financial assets (Non-current) 18.22 25.30 74.97
5 OTHER NON-CURRENT ASSETS(` in crore)
Particulars As at 31st March, 2017
As at 31st March, 2016
As at 1st April, 2015
Capital advances 116.22 116.22 116.00
Income tax assets – 22.22 9.48
Prepayments 0.03 0.06 0.10
Total other non-current assets 116.25 138.50 125.59
6 INVENTORIES(` in crore)
Particulars As at 31st March, 2017
As at 31st March, 2016
As at 1st April, 2015
At lower of cost and net realisable valueStores and spares 57.72 69.83 63.75
Fuel, oil and lubricants 17.25 17.42 14.18
Total inventories 74.97 87.24 77.93

112
7 OTHER CURRENT ASSETS(` in crore)
Particulars As at 31st March, 2017
As at 31st March, 2016
As at 1st April, 2015
Income tax assets 36.16 16.54 16.60
Unbilled revenue 27.84 30.24 34.61
Prepayments 3.84 13.22 11.01
CENVAT credit receivable 19.46 34.75 24.99
Total other current assets 87.29 94.74 87.21
8 ASSETS CLASSIFIED AS HELD FOR SALE(` in crore)
Particulars As at 31st March, 2017
As at 31st March, 2016
As at 1st April, 2015
Fleet and Aircraft, at net realisable value or cost whichever is lower – 84.93 –
9 EQUITY SHARE CAPITAL AND OTHER EQUITY
(a) Equity share capital
Particulars As at 31st March, 2017
As at 31st March, 2016
As at 1st April, 2015
No of shares
Amount (` in crore)
No of shares
Amount (` in crore)
No of shares
Amount (` in crore)
Authorised equity share capital
Equity shares of ` 10/- each 500,000,000 500.00 500,000,000 500.00 500,000,000 500.00
Issued, subscribed and paid-up capital
Equity shares of ` 10/- each 206,976,072 206.98 206,976,072 206.98 205,227,768 205.23
(i) Movements in equity share capital
Particulars For the year ended 31st March, 2017
For the year ended 31st March, 2016
For the year ended 1st April, 2015
No of shares
Amount (` in crore)
No of shares
Amount (` in crore)
No of shares
Amount (` in crore)
Opening balance 206,976,072 206.98 205,227,768 205.23 205,227,768 205.23
Issued during the year – – 1,748,304 1.75 – –
Closing balance 206,976,072 206.98 206,976,072 206.98 205,227,768 205.23
Terms and rights attached to equity shares
The Company has only one class of equity shares having par value of ` 10/- per share. Each holder of the equity share is entitled to one vote per share. In the event of liquidation of the Company, the holders of equity shares will be entitled to receive remaining assets of the Company, after distribution of all preferential amounts. The distribution will be in proportion to the number of equity shares held by the shareholders.

7th ANNUAL REPORT 2016-17
113
(ii) Shares held by holding company /ultimate holding company, their subsidiaries and associates
Particulars As at 31st March, 2017
As at 31st March, 2016
As at 1st April, 2015
No of shares
(` in crore) % No of
shares(` in
crore) % No of shares
(` in crore) %
a) Equity shares of `10/- eachEssar Shipping Mauritius Holdings Limited, the immediate holding company (Formerly known as Essar Africa Steel Holdings Limited)”
124,362,408 124.36 60.09% – – – – – –
Essar Ports & Shipping Limited, Mauritius, the immediate holding company
33 0.00 0.00% 124,362,408 124.36 60.60% 124,362,408 124.36 60.60%
Essar Shipping & Logistics Limited, Cyprus, the intermediate holding company
21,406,365 21.41 10.34% 21,406,365 21.41 10.43% 21,406,365 21.41 10.43%
Essar Global Fund Limited, Cayman Islands, the ultimate holding company
– – – 33 0.00 0.00% 33 0.00 0.00%
Essar Steel India Limited, India, fellow subsidiary
1,273,611 1.27 0.62% 1,273,611 1.27 0.62% 1,273,611 1.27 0.62%
147,042,417 147.04 71.05% 147,042,417 147.04 71.65% 147,042,417 147.04 71.65%
b) Others (if holding shares more than 5%)
– – – – – – – – –
There are no shareholders holding more than 5% shares in the Company except as disclosed above.
*With effect from 20th October, 2016
(iii) Aggregate number of bonus shares issued, shares issued for consideration other than cash and shares bought back during the period of five years immediately preceding the date of the Balance Sheet.
Particulars Year (Aggregate no. of shares)2016-17 2015-16 2014-15 2013-14 2012-13 2011-12
Equity shares issued for consideration other than cash
Issued as fully paid up pursuant to a Scheme of arrangement
– – – – – 205,227,768
Note:
Shares reserved for issue under options
(i) The Company has reserved issuance of 3,77,463 equity shares of ` 10 each for offering to eligible employees of the Company and its subsidiaries under Employee Stock Options Scheme (ESOS). Refer note 26 for details.
(ii) 2,400 Foreign Currency Convertible Bonds (FCCB) are convertible into 122,852,787 equity shares, at the option of the holders, (previous year 122,852,787 equity shares) of ` 10/- each Refer foot note (i) (f) to note 10 (a) for details.

114
9 (b) RESERVES AND SURPLUS(` in crore)
Particulars As at 31st March, 2017
As at 31st March, 2016
As at 1st April, 2015
Debenture redemption reserve 55.00 55.00 55.00
Share options outstanding account 0.61 0.50 1.47
Tonnage tax (utilised) reserve – 20.00 20.00
Tonnage tax reserve 45.00 45.00 45.00
Securities Premium 3.36 3.36 –
General reserve 4,855.22 4,835.22 4,835.22
Foreign currency translation reserve 247.29 373.61 –
Foreign currency monetary items translation difference account (FCMITDA)
(21.87) (13.31) 5.09
Retained earnings (2,784.74) (2,268.73) (1,776.34)
Other comprehensive income
-Cash flow hedge reserve – (22.11) (12.88)
-Other items of comprehensive income 0.32 0.70 –
Total reserves and surplus 2,400.20 3,029.24 3,172.56
Debenture Redemption Reserve In terms of rule 18(7) of the Companies (Share Capital and Debentures) Rules 2014, the Company is required to create a
Debenture Redemption Reserve (DRR) of ` 185 crores (previous year:` 185 crores) in respect of debentures issued and outstanding as of 31st March, 2017. However, in view of losses the Company has not created such DRR.
Share options outstanding reserve This reserve represents the intrinsic value of unvested employee stock options
Tonnage tax (utilised) and Tonnage tax reserve These reserves are mandatory as per the provisions of the Section 115VT of the Income Tax Act, 1961 for companies who opt for
the Tonnage Tax scheme prescribed under the said Act.
General reserve This reserve represents amounts transferred to the Company at the time of its demerger from Essar Shipping Ports & Logistics
Limited
Foreign currency translation reserve This reserve records the impact of translation of the financial statements of foreign subsidiaries from their respective reporting
currencies to the Indian Rupee.
Foreign currency monetary Items translation differences account or FCMITDA This reserve represents Foreign currency losses relating to monetary items denominated in foreign currencies transferred to the
FCMITDA and amortised over the term of the related monetary liabilities.
Cash flow hedge reserve Cash flow hedge reserve records the movement in the value of cash flow hedges
Other items of comprehensive income Other items of comprehensive income includes actuarial gains / (losses) on employee benefit obligations and Cash Flow hedges.
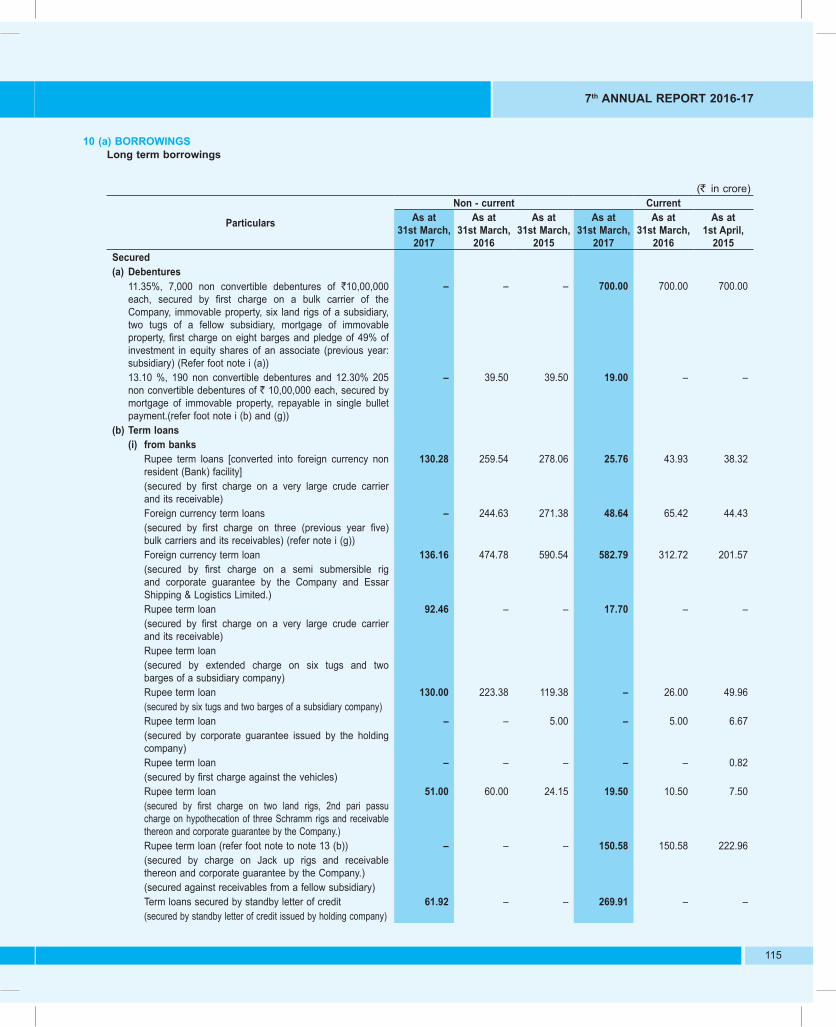
7th ANNUAL REPORT 2016-17
115
10 (a) BORROWINGS Long term borrowings
(` in crore)
Particulars
Non - current CurrentAs at
31st March, 2017
As at 31st March,
2016
As at 31st March,
2015
As at 31st March,
2017
As at 31st March,
2016
As at 1st April,
2015Secured(a) Debentures
11.35%, 7,000 non convertible debentures of `10,00,000 each, secured by first charge on a bulk carrier of the Company, immovable property, six land rigs of a subsidiary, two tugs of a fellow subsidiary, mortgage of immovable property, first charge on eight barges and pledge of 49% of investment in equity shares of an associate (previous year: subsidiary) (Refer foot note i (a))
– – – 700.00 700.00 700.00
13.10 %, 190 non convertible debentures and 12.30% 205 non convertible debentures of ` 10,00,000 each, secured by mortgage of immovable property, repayable in single bullet payment.(refer foot note i (b) and (g))
– 39.50 39.50 19.00 – –
(b) Term loans (i) from banks
Rupee term loans [converted into foreign currency non resident (Bank) facility]
130.28 259.54 278.06 25.76 43.93 38.32
(secured by first charge on a very large crude carrier and its receivable)Foreign currency term loans – 244.63 271.38 48.64 65.42 44.43(secured by first charge on three (previous year five) bulk carriers and its receivables) (refer note i (g))Foreign currency term loan 136.16 474.78 590.54 582.79 312.72 201.57(secured by first charge on a semi submersible rig and corporate guarantee by the Company and Essar Shipping & Logistics Limited.)Rupee term loan 92.46 – – 17.70 – –(secured by first charge on a very large crude carrier and its receivable)Rupee term loan(secured by extended charge on six tugs and two barges of a subsidiary company)Rupee term loan 130.00 223.38 119.38 – 26.00 49.96(secured by six tugs and two barges of a subsidiary company)Rupee term loan – – 5.00 – 5.00 6.67(secured by corporate guarantee issued by the holding company)Rupee term loan – – – – – 0.82(secured by first charge against the vehicles)Rupee term loan 51.00 60.00 24.15 19.50 10.50 7.50(secured by first charge on two land rigs, 2nd pari passu charge on hypothecation of three Schramm rigs and receivable thereon and corporate guarantee by the Company.)Rupee term loan (refer foot note to note 13 (b)) – – – 150.58 150.58 222.96(secured by charge on Jack up rigs and receivable thereon and corporate guarantee by the Company.)(secured against receivables from a fellow subsidiary)Term loans secured by standby letter of credit 61.92 – – 269.91 – –(secured by standby letter of credit issued by holding company)

116
(` in crore)
Particulars
Non - current CurrentAs at
31st March, 2017
As at 31st March,
2016
As at 31st March,
2015
As at 31st March,
2017
As at 31st March,
2016
As at 1st April,
2015 (ii) from financial institutions
Rupee term loan – – – 75.00 75.00 75.00(secured by corporate guarantee by a subsidiary)Rupee term loan 46.06 48.04 59.69 1.24 13.91 9.52(secured by first pari passu charge by way of hypothecation on three mobile rigs and receivables there on and corporate guarantee by the Company).
(iii) from othersRupee term loan 53.90 62.76 – 114.10 112.00 44.38(secured by first charge on three mini bulkers and four tugs of an associate (previous year: subsidiary))Rupee term loan (secured by assignment of rights under shipbuilding contract by the intermediate holding company with third party)
– – – – – 105.00
Bills discounted facility – – – – 166.15 132.85
Total secured loans [A] 701.78 1,412.62 1,387.70 2,024.23 1,681.21 1,638.97
Unsecured(a) Foreign currency convertible bonds (FCCBs) (refer note (i)
(f) below)– 1,495.62 544.53 1,528.43 – 804.74
(b) Finance lease obligations (refer note 22) 120.56 172.06 365.17 47.60 46.82 125.58(c) Others – 43.05 13.79 45.76 28.3 20.69
Total unsecured loans [B] 120.56 1,710.73 923.49 1,621.79 75.12 951.01
Total [A+B] 822.35 3,123.35 2,311.19 3,646.03 1,756.33 2,589.98
Unamortised upfront fees 28.69 25.81 35.57 5.07 41.24 11.12
Total long term borrowings 793.66 3,097.54 2,275.62
Current maturities of long term borrowings included in Other financial liabilities
3,640.96 1,715.09 2,578.86
Short-term borrowings,Cash credit facility from a bank, repayable on demand 53.76 54.43 50.68(secured by first pari passu charge on a very large crude carrier)Rupee short-term loan 392.22 – 39.41(secured by first charge on six land rigs and receivables thereon, corporate guarantee of the Company)Short term loan from others 25.00 25.00 137.00(secured by subservient charge on present and future surplus cash flows of the Company)Unsecured loans from related parties 146.31 418.27 3.99Unsecured loans from others 271.00 13.71 10.50Redeemable preference shares held by an associate, repayable on demand
116.00 – –
Redeemable preference shares held by others, repayable on demand
84.39 – –
Long term borrowings classified as current due to covenant breaches
90.00 – –
Total short-term borrowings 1,178.67 511.41 241.58

7th ANNUAL REPORT 2016-17
117
Foot notes:- i) Repayment terms: a) Secured debentures: 2,000 debentures issued on 25th March 2010 and 5,000 debentures issued on 22nd June 2009 are
redeemable at the expiry of 10 years with put and call option exercisable after five years from their respective dates of issue. The Company has received notice from the debenture holder invoking the put option. The Company is in discussion with the debenture holder to waive the option and based on the said discussion, the management is reasonably confident that the debenture holder will waive the option and the debentures would be redeemed at the expiry of ten years from the date of their issue. However, the debentures have been classified as current liabilities till such waiver is received.
b) Secured debentures: 205 debentures issued on 01st February 2013 are redeemable at the expiry of 10 years from the date of issue and the holder of the debentures have the option to call after 5 years from the date of issue. 40 debentures issued on 12th October 2012, 50 debentures issued on 28th June 2012 and 100 debentures issued on 22nd June 2012 are redeemable at the expiry of 5 years from their respective date of issue.
c) Secured Rupee term loans from banks and others: Repayable in quarterly, monthly and bi-annual instalments starting from June 2010 to June 2022.
d) Secured foreign currency term loans from banks : Repayable in quarterly instalments starting from March, 2006 to July, 2019
e) Finance lease obligation: Repayable in monthly instalments ending in March 2019. f) Foreign currency convertible bonds: FCCBs of US$ 111,428,571 (Series B) due on 24th August, 2017 and US$
128,571,429 (Series A) due on 24th August, 2015 got extended to 24th August, 2017, carry interest @5% per annum payable semi annually. The FCCBs are convertible into 122,852,787 fully-paid equity shares of ` 10 each of the Company, any time upto the date of maturity, at the option of the FCCB holders at conversion price of ` 91.70 per share at a predetermined exchange rate of ` 46.94 per US$. The FCCBs, if not converted till the maturity date, will be redeemed at par. The FCCB holder, an intermediate holding company, has already informed the Company of its intention to convert these FCCB’s into equity shares on the maturity date.
g) The classification of loans between current liabilities and non -current liabilities continues based on repayment schedule under respective agreements as no loans have been recalled due to non compliance of conditions under any of the loan agreements except in case of certain non current borrowings from banks amounting to ` 90 crores (consisting of long term debentures ` 20.50 crores and long term foreign currency loans ` 69.50 crores) where the lenders have not confirmed the loan balances on the balance sheet date
h) Interest rates: Loans availed from banks, financial institutions, NBFC’s and Alternate Investment Funds carry a weighted average interest rate of 9.34% per annum (previous year: 7.95% per annum)
i) Scheduled repayments: Refer Liquidity Risk table at Note 21(ix)
10(b) TRADE PAYABLES (` in crore)
Particulars As at 31st March, 2017
As at 31st March, 2016
As at 1st April, 2015
Trade payables:- Dues to micro and small enterprises(refer note below) 0.16 0.04 0.89- Other than micro and small enterprises 414.14 733.49 762.91
Total trade payables 414.30 733.53 763.80
Note: Micro and small enterprises under the Micro, Small and Medium Enterprises Development Act, 2006 have been determined based on the information available with the Group . This has been relied upon by the auditors.
10(c) OTHER FINANCIAL LIABILITIES Other financial liabilities (non- current) (` in crore)
Particulars As at 31st March, 2017
As at 31st March, 2016
As at 1st April, 2015
Security deposit from related parties (Refer note 28) – 5.00 14.00Security deposit from others – 1.04 1.14Interest accrued – – 35.50
Total other financial liabilities (non-current) – 6.04 50.64

118
Other financial liabilities (current) (` in crore)
Particulars As at 31st March, 2017
As at 31st March, 2016
As at 1st April, 2015
Current maturities of long term borrowings, including instalments overdue at the year end ` 1,682.18 crores (previous year: ` 1,068.27 crores)
3,640.96 1,715.09 2,578.86
Security deposit from related parties (Refer note 28) 13.50 13.50 4.50
Interest accrued, including interest overdue at the year end ` 515.92 crores (previous year: ` 314.53 crores)
620.53 380.91 226.41
Temporary overdrawn bank balances – 0.05 2.73
Advance from customers 38.88 39.28 33.84
Total other financial liabilities (current) 4,313.87 2,148.83 2,846.35
11 DERIVATIVE LIABILITY (` in crore)
Particulars As at 31st March, 2017
As at 31st March, 2016
As at 1st April, 2015
Interest rate swaps 1.88 30.57 26.80
Total derivative liabilities (non-current) 1.88 30.57 26.80
The Group follows hedge accounting principles for accounting of certain forward foreign exchange contracts to hedge the exchange risk pertaining to highly forecasted transactions. Accordingly mark to market losses of Nil (previous year ` 22.11 crore) has been carried over to cash flow hedge reserve as of 31st March, 2016 for Currency Swap hedging.
12 EMPLOYEE BENEFIT OBLIGATIONS (` in crore)
Particulars As at 31st March, 2017
As at 31st March, 2016
As at 1st April, 2015
Defined benefit plans 5.46 4.75 4.50
Defined contribution schemes 0.66 1.22 2.75
Total employee benefit obligations (Current) 6.12 5.97 7.26
I. Details of retirement plans: The employees of the Group are members of a state – managed retirement benefit plans namely provident fund, gratuity fund and
superannuation fund operated by the Government of India. The Group is required to contribute a specified percentage of payroll costs to the retirement benefit scheme to fund the benefits. The only obligation of the Group with respect to the retirement benefit plan is to make the specified contributions.
The Group has recognised the following amounts in the Income Statement during the year under ‘Contribution to staff provident and other funds’ (refer note 17)
(` in crore)
Particulars Year ended 31st March, 2017
Year ended 31st March, 2016
Employer’s contribution to gratuity fund (offshore crew staff) 0.26 0.75
Group accident policy cover (all employees) 0.03 0.03
Contribution to pension fund (offshore crew staff) 0.64 0.65
Employer’s contribution to superannuation fund (office staff) – 0.01
Employer’s contribution to provident fund (offshore crew staff) 1.29 1.00
Total 2.22 2.44
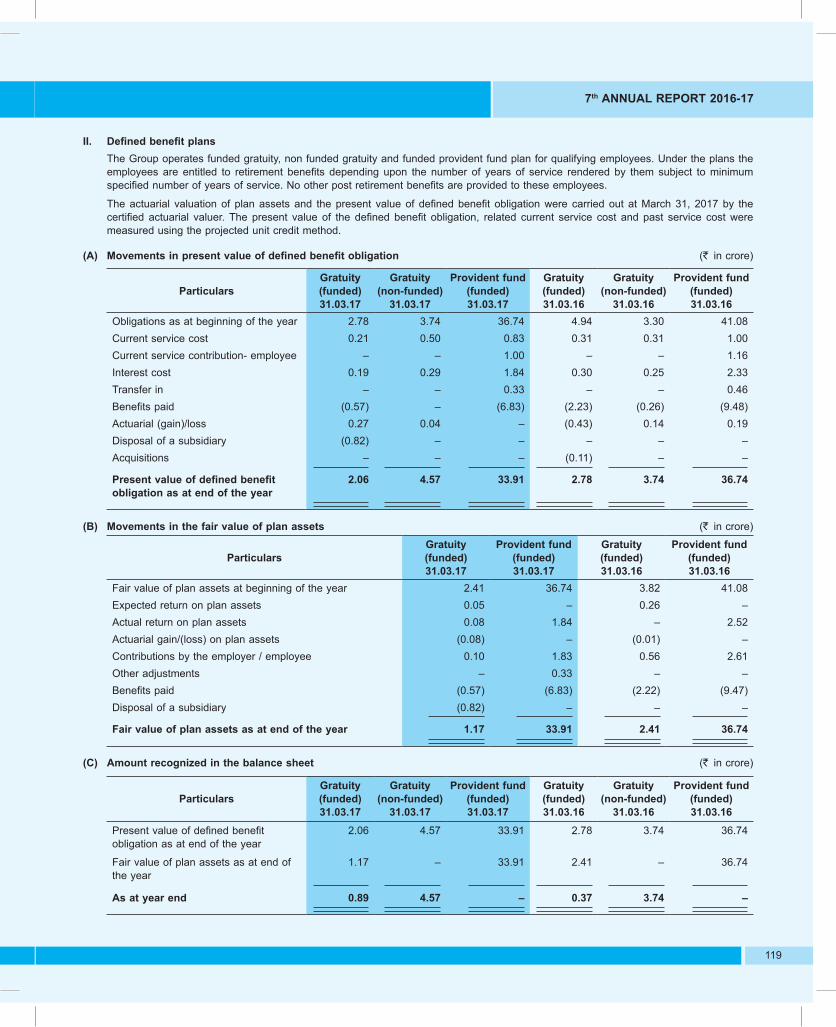
7th ANNUAL REPORT 2016-17
119
II. Defined benefit plans The Group operates funded gratuity, non funded gratuity and funded provident fund plan for qualifying employees. Under the plans the
employees are entitled to retirement benefits depending upon the number of years of service rendered by them subject to minimum specified number of years of service. No other post retirement benefits are provided to these employees.
The actuarial valuation of plan assets and the present value of defined benefit obligation were carried out at March 31, 2017 by the certified actuarial valuer. The present value of the defined benefit obligation, related current service cost and past service cost were measured using the projected unit credit method.
(A) Movements in present value of defined benefit obligation (` in crore)
ParticularsGratuity (funded) 31.03.17
Gratuity (non-funded)
31.03.17
Provident fund (funded) 31.03.17
Gratuity (funded) 31.03.16
Gratuity (non-funded)
31.03.16
Provident fund (funded) 31.03.16
Obligations as at beginning of the year 2.78 3.74 36.74 4.94 3.30 41.08Current service cost 0.21 0.50 0.83 0.31 0.31 1.00Current service contribution- employee – – 1.00 – – 1.16Interest cost 0.19 0.29 1.84 0.30 0.25 2.33Transfer in – – 0.33 – – 0.46Benefits paid (0.57) – (6.83) (2.23) (0.26) (9.48)Actuarial (gain)/loss 0.27 0.04 – (0.43) 0.14 0.19Disposal of a subsidiary (0.82) – – – – –Acquisitions – – – (0.11) – –
Present value of defined benefit obligation as at end of the year
2.06 4.57 33.91 2.78 3.74 36.74
(B) Movements in the fair value of plan assets (` in crore)
ParticularsGratuity (funded) 31.03.17
Provident fund (funded) 31.03.17
Gratuity (funded) 31.03.16
Provident fund (funded) 31.03.16
Fair value of plan assets at beginning of the year 2.41 36.74 3.82 41.08Expected return on plan assets 0.05 – 0.26 –Actual return on plan assets 0.08 1.84 – 2.52Actuarial gain/(loss) on plan assets (0.08) – (0.01) –Contributions by the employer / employee 0.10 1.83 0.56 2.61Other adjustments – 0.33 – –Benefits paid (0.57) (6.83) (2.22) (9.47)Disposal of a subsidiary (0.82) – – –
Fair value of plan assets as at end of the year 1.17 33.91 2.41 36.74
(C) Amount recognized in the balance sheet (` in crore)
ParticularsGratuity (funded) 31.03.17
Gratuity (non-funded)
31.03.17
Provident fund (funded) 31.03.17
Gratuity (funded) 31.03.16
Gratuity (non-funded)
31.03.16
Provident fund (funded) 31.03.16
Present value of defined benefit obligation as at end of the year
2.06 4.57 33.91 2.78 3.74 36.74
Fair value of plan assets as at end of the year
1.17 – 33.91 2.41 – 36.74
As at year end 0.89 4.57 – 0.37 3.74 –

120
(D) Amounts recognized in the Statement of Profit and Loss(` in crore)
ParticularsGratuity (funded) 31.03.17
Gratuity (non-funded)
31.03.17
Provident fund (funded) 31.03.17
Gratuity (funded) 31.03.16
Gratuity (non-funded)
31.03.16
Provident fund (funded) 31.03.16
Current service cost 0.22 0.50 0.83 0.31 0.31 1.00
Interest cost 0.03 0.29 – 0.15 0.25 2.33
Expected return on plan assets – – – 0.09 – (2.33)
Net actuarial (gain)/loss recognized in the year
(0.03) – – (0.08) – –
Total 0.22 0.79 0.83 0.47 0.56 1.00
(E) Amounts recognised in other comprehensive income(` in crore)
Particulars 31.03.17 31.03.16Experience adjustments (0.38) 0.70
Total (0.38) 0.70
(F) Category of plan assets The Group’s plan assets in respect of gratuity are funded through the Group Gratuity Schemes of the Life Insurance Corporation of
India (LIC).
ParticularsGratuity (funded) 31.03.17
Provident fund (funded) 31.03.17
Gratuity (funded) 31.03.16
Provident fund (funded) 31.03.16
Administered by Life Insurance Corporation of India * 100.00% – 100.00% –Government of India Securities – 52.19% – 40.00%Public sector bonds / TDRs – 47.81% – 60.00%
*The Group is unable to obtain the details of plan assets from the Life Insurance Corporation of India and hence the disclosure thereof is not made.
(G) Sensitivity analysis (` in crore)
Particulars 31.03.17 31.03.16DBO On base assumptions 2.06 4.57A. Discount Rate 6.80% 6.80%
1. Effect due to 0.5% increase in discount rate (0.04) (0.17)2. Effect due to 0.5% decrease in discount rate 0.04 0.18
B. Salary Escalation Rate 9.00% 9.00%1. Effect due to 0.5% increase in salary escalation rate (0.01) 0.172. Effect due to 0.5% decrease in salary escalation rate 0.01 (0.16)
C. Withdrawal Rate 9.00% 7.00%1. Effect due to 0.5% increase in withdrawal rate 0.01 (0.36)2. Effect due to 0.5% decrease in withdrawal rate (0.03) 0.58
Risk Exposure - Asset Volatility 1) Interest Rate Risk The defined benefit obligation calculated use a discount rate based on government bond. If bond yield falls, the defined benefit
obligation with tend to increase.

7th ANNUAL REPORT 2016-17
121
2) Salary Inflation Risk Higher than expected increase in salary will increase the defined benefit obligation.
3) Demographic Risk This is the risk of variability of result due to unsystematic nature of decrements that include mortality, withdrawal, disability and
retirement. The effect of this decrements on defined benefit obligation is not straight forward and depends upon combination of salary increase, discount rate and vesting criteria. It is important not to over state withdrawals because in the financial analysis the retirement benefit of a short career employee typically cost less per year as compared to a long service employee.
(H) Actuarial assumptions Actuarial valuation as at the year-end was done in respect of the aforesaid defined benefit plans based on the following assumptions:
i) General assumptions
ParticularsGratuity (funded) 31.03.17
Gratuity (non-funded)
31.03.17
Provident fund (funded) 31.03.17
Gratuity (funded) 31.03.16
Gratuity (non-funded)
31.03.16
Provident fund (funded) 31.03.16
Discount rate (per annum) 6.80% 6.80% 6.80% 7.75% 7.75% 7.75%Rate of return on plan assets 8.50% 8.50% 8.60% 8.50% 8.50% 8.60%Withdrawal rate 8 - 10% 7.00% 8.00% 8 - 10% 7.00% 8.00%Rate of increase in compensation 9.00% 9.00% 9.00% 9.00% –
ii) Mortality rates considered are as per the published rates in the India Assured Lives Mortality (2006-08) (Modified) ULT. (Previous year: Life Insurance Corporation of India (2006-08) ) mortality table.
iii) Leave policy: Leave balance as at the valuation date and each subsequent year following the valuation date to the extent not availed by the employee accumulated up to 31st December 2014 is available for encashment on separation from the Group up to a maximum of 120 days.
iv) The contribution to be made by the Group for funding its liabilities for gratuity ( funded and non funded) and towards provident fund during the financial year 2017-18 amounts to ` 3.22 crores.
v) The expected rate of return on plan assets is based on market expectation, at the beginning of the year, for returns over entire life of the related obligation.
vi) The assumption of future salary increases, considered in actuarial valuation, takes account of inflation, seniority, promotion, supply and demand and other relevant factors.
vii) Liability on account of long term absences has been actuarially valued as per Projected Unit Credit Method.
viii) Short term compensated absences have been provided on actual basis.
13 OTHER CURRENT LIABILITIES(` in crore)
Particulars As at 31st March, 2017
As at 31st March, 2016
As at 1st April, 2015
Statutory and other related dues 73.50 154.51 78.76
Advance received against sale consideration – 32.65 –
Payables in respect of capital goods 22.96 31.87 35.48
Deferred profit on sale and lease back 9.56 0.60 1.61
Other payable 20.76 27.42 27.93
Unearned revenue on services 3.76 8.33 5.49
Total other current liabilities 130.54 255.37 149.27

122
14 REVENUE FROM OPERATIONS(` in crore)
Particulars Year ended 31st March, 2017
Year ended 31st March, 2016
Sale of servicesFleet operating and chartering earnings 932.93 752.35
Logistics services 1,160.73 858.17
Rig operating and chartering earnings 94.14 103.48
Other operating incomeProfit on sale of vessels 0.60 1.01
Scrap sales 2.26 1.37
Supervision/ management fees 3.32 3.25
Total 2,193.98 1,719.63
15 OTHER INCOME(` in crore)
Particulars Year ended 31st March, 2017
Year ended 31st March, 2016
Interest income
from banks 2.13 3.31
– from related parties on intercorporate deposits (refer note 28) 58.22 72.97
– from others 18.70 9.42
Loss on disposal of a subsidiary (refer note 4(a)) (143.25) –
Diminution in value of fleet held for sale – (28.86)
Net gain/ (loss) on foreign currency translation and transactions (24.30) 72.49
Gain on foreclosure of finance leases – 53.27
Profit/ (loss) on sale of other assets (1.83) 0.09
Other non operating income 21.72 16.08
Total (68.60) 198.77
16 OPERATING EXPENSES(` in crore)
Particulars Year ended 31st March, 2017
Year ended 31st March, 2016
Consumption of stores and spares 189.06 127.16
Consumption of fuel, oil and water 166.36 113.50
Direct voyage expenses 1,080.13 882.07
Commission, brokerage and agency fees 2.24 2.97
Standing costs 74.53 50.70
Insurance, protection and indemnity club fees 44.07 42.54
Total 1,556.40 1,218.93

7th ANNUAL REPORT 2016-17
123
17 EMPLOYEE BENEFITS EXPENSES (` in crore)
Particulars Year ended 31st March, 2017
Year ended 31st March, 2016
Offshore staffSalaries, wages and bonus 99.78 92.64
Contribution to staff provident and other funds 2.35 2.12
Staff welfare expenses 9.30 11.96
Office staffSalaries, wages and bonus 96.01 24.77
Contribution to staff provident and other funds 1.84 1.90
Staff welfare expenses 3.27 3.06
Employee Stock Option Scheme (refer note 26) 0.10 0.25
Total 212.66 136.70
18 FINANCE COSTS (` in crore)
Particulars Year ended 31st March, 2017
Year ended 31st March, 2016
Interest expense
– on bank loans 139.33 159.05
– on loans from financial Institutions 41.45 63.46
– on finance lease obligations 10.29 12.29
– on foreign currency convertible bonds 56.39 91.93
– on debentures 106.38 95.83
– on others 94.75 100.39
Loan commitment / processing charges, guarantee fees and other charges 18.39 18.66
Total 466.98 541.60
19 OTHER EXPENSES (` in crore)
Particulars Year ended 31st March, 2017
Year ended 31st March, 2016
Rent 3.84 6.26
Rates and taxes 0.03 0.15
Repairs and maintenance
-buildings 0.46 0.34
-others 5.53 2.11
Legal and professional fees 25.80 15.05
Travelling and conveyance 4.36 2.68
Auditor’s remuneration (refer note below) 0.57 0.59
Bad debts written off 1.17 8.34
Other establishment expenses 3.93 49.91
Total 45.67 85.43

124
(` in crore)
Note: Auditor’s remuneration comprises (net of service tax) Year ended 31st March, 2017
Year ended 31st March, 2016
As auditor 0.34 0.26Reimbursement of expenses – 0.01For audit of subsidiaries 0.02 0.26For other services 0.21 0.06
Total 0.57 0.59
20 INCOME TAXES Income tax expense recognised in the profit and loss account comprises of: (` in crore)
Particulars Year ended 31st March, 2017
Year ended 31st March, 2016
Current income taxes (38.63) (23.86)Deferred income taxes 0.78 1.92
Income tax expense for the year (37.85) (21.94)
The reconciliation of income tax expense applicable to accounting profit before income tax at statutory income tax rate to income tax expense at the Group’s effective income tax rate for the year ended 31st March, 2017 and 31st March, 2016 are as follows:
(` in crore)
Particulars Year ended 31st March, 2017
Year ended 31st March, 2016
Loss before taxes (546.83) (528.22)Statutory Income Tax Rate 34.6% 34.6%
Effective tax rate* 0% 0%
*Effective tax rate is Nil on account of losses during the year
One of the subsidiaries of the Company has unused tax losses amounting to ` 454 crores as at 31st March, 2017 (previous year: ` 418 crores) (including unabsorbed depreciation. Deferred tax assets have not been recognised in respect of these unused tax losses because of lack of reasonable certainty that, in view of the prevailing business situation in the sector in which the subsidiary operates, taxable profit will be available against which such losses can be set off.
Deferred Tax Assets and Liabilities (` in crore)
Particulars As at 31st March, 2017
As at 31st March, 2016
As at 1st April, 2015
Deferred tax liabilities – 34.18 40.33
Deferred tax assets – 18.69 22.93
Deferred tax liabilities (Net) – 15.49 17.40
Movement in Deferred Tax Liabilities (Net) (` in crore)
Particulars Year ended 31st March, 2017
Year ended 31st March, 2016
Opening Balance 15.49 17.40Charged to the profit and loss account 0.78 (1.91)Transferred on disposal of a subsidiary (16.27) –
Closing Balance – 15.49

7th ANNUAL REPORT 2016-17
125
Components of Deferred Tax Assets and Liabilities(` in crore)
Particulars As at 31st March, 2017
As at 31st March, 2016
As at 1st April, 2015
Deferred Tax LiabilitiesProperty, plant and equipment – 34.18 40.33
Total – 34.18 40.33Deferred Tax AssetsDisallowances under income tax laws – 3.85 3.68
Unutilised tax losses- depreciation – 14.22 18.63
Employee benefits – 0.62 0.62
Total – 18.69 22.93
Break-up of deferred tax (expense)/income recognised in the consolidated profit and loss account(` in crore)
Particulars Year ended 31st March, 2017
Year ended 31st March, 2016
Property, plant and equipment (0.70) 6.15
Employee benefit obligations (0.08)Disallowances under income tax laws – 0.17
Unutilised tax losses- depreciation – (4.41)
Closing Balance (0.78) 1.91
21 FINANCIAL INSTRUMENTS
(i) Capital management The Group manages its capital to ensure that entities in the Group will be able to continue as a going concern while maximising the
return to stakeholders through the optimisation of the debt and equity balance. The Group’s overall strategy remains unchanged from 2015-16. The capital structure of the Group consists of debt, which includes the borrowings including temporary overdrawn balance, cash and cash equivalents including short term bank deposits, equity comprising issued capital, reserves and non-controlling interests. The gearing ratio for the year is as under:
(` in crore)
Particulars As at 31st March, 2017
As at 31st March, 2016
As at 1st April, 2015
Debt (including borrowings from related and unrelated parties and finance lease obligations)
5,613.29 5,324.03 5,096.06
Less: Cash and cash equivalent including short term deposits (restricted)
(39.85) (35.00) (43.62)
Net debt (A) 5,573.43 5,289.03 5,052.44
Total equity (B) 2,634.88 3,332.59 3,530.70
Net debt to equity ratio (A/B) 2.12 1.59 1.43

126
(ii) Categories of financial instruments(` in crore)
Particulars
As at 31st March, 2017
As at 31st March, 2016
As at 1st April, 2015
Carrying value Fair value Carrying
value Fair value Carrying value Fair value
Financial assets:At amortised costCash and cash equivalents 39.85 39.85 35.00 35.00 43.62 43.62
Loans and other receivables 1,106.94 1,106.94 1,386.29 1,386.29 1,296.07 1,296.07
Other financial assets 2,062.00 2,062.00 1,808.38 1,808.38 1,737.01 1,737.01
At fair value through profit and lossOther investments – – – 0.10 0.10
Total 3,208.80 3,208.80 3,229.67 3,229.67 3,076.80 3,076.80
Financial liabilities:
At amortised costBorrowings 5,445.12 5,445.12 5,105.16 5,105.16 4,605.31 4,605.31
Finance lease payables 168.17 168.17 218.87 218.87 490.75 490.75
Trade and other payables 414.30 414.30 733.53 733.53 763.80 763.80
At fair value through profit and lossDerivatives 1.88 1.88 30.57 30.57 26.80 26.80
Other financial liabilities 672.91 672.91 439.78 439.78 318.13 318.13
Total 6,702.38 6,702.38 6,527.91 6,527.91 6,204.79 6,204.79
Fair value measurements recognised in the statement of financial position:
The following table provides an analysis of financial instruments that are measured subsequent to initial recognition at fair value, grouped into Levels 1 to 3 based on the degree to which the fair value is observable.
– Level 1 fair value measurements are those derived from quoted prices (unadjusted) in active markets for identical assets or liabilities.
– Level 2 fair value measurements are those derived from inputs other than quoted prices included within Level 1 that are observable for the asset or liability, either directly (i.e. as prices) or indirectly (i.e. derived from prices).
– Level 3 fair value measurements are those derived from valuation techniques that include inputs for the asset or liability that are not based on observable market data (unobservable inputs).
(` in crore)
At 1st April, 2015 Level 1 Level 2 Level 3 TotalFinancial assets at fair value through profit and lossInvestments in mutual funds 0.10 – – 0.10
Total 0.10 – – 0.10
Financial liabilities at fair value through profit and lossDerivative financial liabilities – 26.80 – 26.80
Total – 26.80 – 26.80

7th ANNUAL REPORT 2016-17
127
(` in crore)
At 31st March, 2016 Level 1 Level 2 Level 3 TotalFinancial liabilities at fair value through profit and lossDerivative financial liabilities – 30.57 – 30.57
Total – 30.57 – 30.57
(` in crore)
At 31st March, 2017 Level 1 Level 2 Level 3 TotalFinancial liabilities at fair value through profit and lossDerivative financial liabilities – 1.88 – 1.88
Total – 1.88 – 1.88
The fair value of the financial assets and liabilities are included at the amount at which the instrument could be exchanged in a current transaction between willing parties, other than in a forced or liquidation sale. The following methods and assumptions were used to estimate the fair values:
a) Cash and short-term deposits, trade and other receivables, trade and other payables, and other current liabilities approximate their carrying amounts largely due to the short-term maturities or nature of these instruments.
b) The fair value of loans from banks and other financial indebtedness as well as other non current financial liabilities is estimated by discounting future cash flows using rates currently available for debt or similar terms and remaining maturities.
c) Derivative instruments have been fair valued on the reporting date on the basis of quotes provided by the third party qualified valuer / market participants.
(iii) Financial risk management objectives: The Group’s principal financial liabilities comprise of loan from banks and financial institutions, finance lease obligations, overdrafts and
trade payables. The main purpose of these financial liabilities is to raise finance for the Group’s operations. The Group has various financial assets such as trade receivables, cash and short term deposits, which arise directly from its operations.
The main risks arising from Group’s financial instruments are foreign currency risk, interest rate risk, credit risk and liquidity risk. The policies for managing the risks are as reviewed and approved by the Board of Directors.
(iv) Foreign currency risk: Foreign currency risk mainly arises from transactions undertaken by an operating unit denominated in currencies other than its
functional currency. Exposure to foreign currency risk is partly mitigated by natural hedges of matching revenues and costs.
The carrying amounts of the Group’s financial assets and financial liabilities denominated in foreign currencies at the reporting date are as follows:
(` in crore)
Particulars
As at 31st March, 2017
As at 31st March, 2016
As at 1st April, 2015
Financial assets
Financial liabilities
Financial assets
Financial liabilities
Financial assets
Financial liabilities
United States Dollars (US$) 1,370.56 2,449.44 1,396.04 2,284.03 1390.74 2,387.92
Currencies other than INR & US$ 16.76 15.60 5.05 28.32 3.64 20.38
Total 1,387.32 2,465.04 1,401.10 2,312.36 1,394.38 2,408.30
The following table details the Group’s sensitivity to a 5% increase and decrease in the functional currency against the relevant foreign currencies of all the companies in the Group. 5% is the sensitivity rate used when reporting foreign currency risk internally to key management personnel and represents management’s assessment of the reasonably possible change in foreign exchange rates. The sensitivity analysis includes only outstanding foreign currency denominated monetary items and adjusts their translation at the period end for a 5% change in foreign currency rates. A positive number below indicates an increase in profit and other equity where the respective functional currency strengthens by 5% against the relevant foreign currency. For a 5% weakening of the functional currency against the relevant currency, there would be an equal and opposite impact on the profit and other equity, and the balances below would be negative.

128
(` in crore)
Particulars As at 31st March, 2017
As at 31st March, 2016
As at 1st April, 2015
US$ impact (53.89) (45.56) (50.70)
(v) Interest rate risk: The Group is exposed to interest rate risk as entities in the Group borrow funds at floating interest rates. The interest rate risk
is managed by monitoring the Group’s level of borrowings periodically and structuring its borrowings on varying maturities and interest rate terms. The Group’s exposures to interest rates on financial assets and financial liabilities are detailed in the liquidity risk management section of this note.
Interest rate sensitivity analysis: The sensitivity analysis below has been determined based on the exposure to interest rates at the balance sheet date. For floating rate
liabilities, the analysis is prepared assuming the amount of liability outstanding at the balance sheet date was outstanding for the whole year. A 50 basis point increase or decrease is used when reporting interest rate risk internally to key management personnel and represents management’s assessment of the reasonably possible change in interest rates.
If interest rates had been 50 basis points higher/lower and all other variables were held constant, the Group’s loss for the year ended March 31, 2017 would increase/decrease by `12.90 crores (previous year `11.69 crores). This is mainly attributable to the Group’s exposure to interest rates on its variable rate borrowings
(vi) Other price risk: The Group is not exposed to any significant equity price risks arising from equity investments, as on 31st March 2017. Equity
investments are held for strategic rather than trading purposes. The Group does not actively trade these investments.
Equity price sensitivity analysis: There is no exposure to equity price risks as at the reporting date or as at the previous reporting date.
(vii) Credit risk: The credit risk is primarily attributable to the Group’s trade and other receivables and guarantees given by the Group on behalf
of others. The amounts presented in this standalone statement of financial position are net of allowances for doubtful receivables, estimated by management based on prior experience and their assessment of the current economic environment. The maximum related party credit exposure at March 31, 2017 on account of carrying amount of advances /deposit, trade and other receivables and guarantees is disclosed in note 28 on related party transactions. Based on the creditworthiness of the related parties, financial strength of related parties and its parents and past history of recoveries from them, the credit risk is mitigated. Credit risk relating to unrelated parties is minimised as the Group deals only with reputed parties.
Cash and cash equivalents are held with reputable and credit-worthy banks.
(viii) Fair value of financial instruments: All financial assets are initially recognised at fair value of consideration paid. Subsequently, financial assets are carried at fair value or
amortized cost less impairment. Where non – derivative financial assets are carried at fair value, gains and losses on re- measurement are recognised directly in equity unless the financial assets have been designated as being held at fair value through profit or loss, in which case the gains and losses are recognised directly in the standalone Statement of Profit and Loss. Financial assets are designated as being held at fair value through profit or loss when it is necessary to reduce measurement inconsistency for related assets and liabilities. All financial liabilities other than derivatives are initially recognised at fair value of consideration received net of transaction costs as appropriate (initial cost) and subsequently carried at amortised cost.
(ix) Liquidity risk: Ultimate responsibility for liquidity risk management rests with the Board of Directors, which has built an appropriate liquidity risk
management framework for the management of the Group’s short, medium and long-term funding and liquidity management requirements. The Group manages liquidity risk by maintaining adequate reserves, banking facilities and reserve borrowing facilities, by continuously monitoring forecast and actual cash flows and matching the maturity profiles of financial assets and liabilities.
The Group monitors its risk of shortage of funds using a recurring liquidity planning tool. This tool considers the maturity of both its financial investments and financial assets (e.g. accounts receivables, other financial assets) and projected cash flows from operations, public offerings and refinancing of current borrowings.
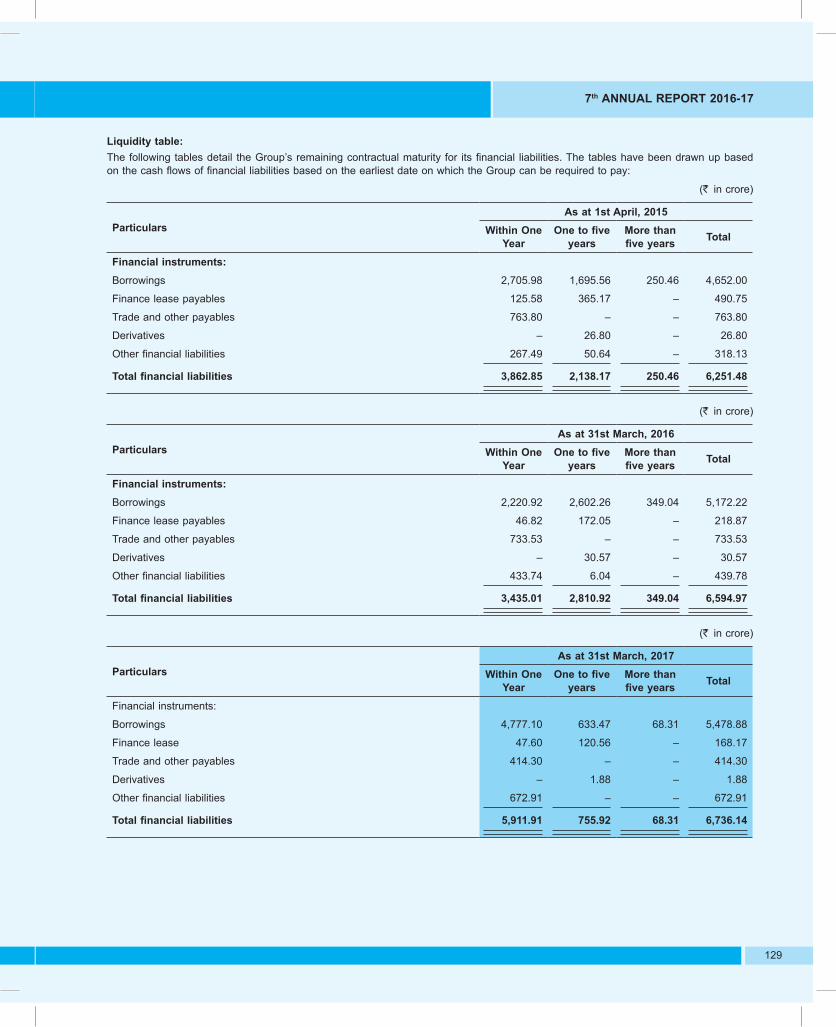
7th ANNUAL REPORT 2016-17
129
Liquidity table: The following tables detail the Group’s remaining contractual maturity for its financial liabilities. The tables have been drawn up based
on the cash flows of financial liabilities based on the earliest date on which the Group can be required to pay:
(` in crore)
ParticularsAs at 1st April, 2015
Within One Year
One to five years
More than five years Total
Financial instruments:Borrowings 2,705.98 1,695.56 250.46 4,652.00
Finance lease payables 125.58 365.17 – 490.75
Trade and other payables 763.80 – – 763.80
Derivatives – 26.80 – 26.80
Other financial liabilities 267.49 50.64 – 318.13
Total financial liabilities 3,862.85 2,138.17 250.46 6,251.48
(` in crore)
ParticularsAs at 31st March, 2016
Within One Year
One to five years
More than five years Total
Financial instruments:Borrowings 2,220.92 2,602.26 349.04 5,172.22
Finance lease payables 46.82 172.05 – 218.87
Trade and other payables 733.53 – – 733.53
Derivatives – 30.57 – 30.57
Other financial liabilities 433.74 6.04 – 439.78
Total financial liabilities 3,435.01 2,810.92 349.04 6,594.97
(` in crore)
ParticularsAs at 31st March, 2017
Within One Year
One to five years
More than five years Total
Financial instruments:
Borrowings 4,777.10 633.47 68.31 5,478.88
Finance lease 47.60 120.56 – 168.17
Trade and other payables 414.30 – – 414.30
Derivatives – 1.88 – 1.88
Other financial liabilities 672.91 – – 672.91
Total financial liabilities 5,911.91 755.92 68.31 6,736.14

130
22. LEASES Details of leasing arrangements:
Finance leases : Group as a lessee (` in crore)
Particulars - not later than one year
- later than one year but not later than five years
- later than five years Total
As at 31st March, 2017Future minimum lease payments 47.60 120.57 – 168.17Unmatured finance charges 7.33 – – 7.34
Present value of minimum lease payments 40.27 120.57 – 160.83
As at 31st March, 2016Future minimum lease payments 46.82 172.05 – 218.87Unmatured finance charges 9.88 7.49 – 17.37
Present value of minimum lease payments 36.94 164.56 – 201.50
As at 1st April, 2015Future minimum lease payments 125.58 365.17 – 490.75Unmatured finance charges 12.40 17.62 – 30.02
Present value of minimum lease payments 113.18 347.55 – 460.73
Operating leases : Group as a lessee (` in crore)
Particulars - not later than one year
- later than one year but not later than five years
- later than five years Total
Committed liability for future lease rental chargesAs at 31st March, 2017 – – – –As at 31st March, 2016 1.06 3.12 – 4.18As at 1st April, 2015 4.53 4.32 – 8.85
23. CONTINGENCIES Contingent liabilities (to the extent not provided for) (` in crore)
With respect to pending litigations As at 31st March, 2017
As at 31st March, 2016
As at 1st April 2015
Guarantee given by a bank against disputed custom duty demand of ` 27.40 crore by DGFT
30.00 30.00 30.00
Income tax demand -appeal filed by the Income tax department in the High court of Bombay against the order of Appellate Tribunal in favour of the Group
7.29 7.29 7.29
Income tax demand- appeal filed by the Group with Commissioner of Income Tax-Appeals
54.84 – –
Disputed service tax demand – 15.60 65.23
(` in crore)
Others As at 31st March, 2017
As at 31st March, 2016
As at 1st April 2015
Guarantees given by banks 63.54 64.70 18.91
Guarantees given on behalf of Associates* – 330.79 238.22
Claims against the Group not acknowledged as debt 49.45 27.96 15.30
* The Group has issued SBLCs in favour of its associates viz. Varada Drilling One Pte. Limited & Varada Drilling Two Pte. Limited. During the year, due to non fulfilment of debts by associates the lenders of the associates had invoked the SBLCs.

7th ANNUAL REPORT 2016-17
131
Contingent Asset The Group has received an award in its favour for an amount of ` 305.59 crores on account of arbitration initiated by the Group
against a charterer for illegally terminating a Contract of Affreightment entered between the Group and the Charterer and no impact of the same has been considered in the financials as the Charterer has preferred an appeal against the said arbitration award.
24. SEGMENT REPORTINGA. Basis for segmentation The Group has the following three reportable segments based on the information reviewed by the Group’s Chief Operating Decision
Maker (‘CODM’). a) Fleet operating and chartering b) Logistics services c) Oilfields services
Segments have been identified taking into account the organisational structure, nature of services, different risks and internal reporting system.
The Board of Directors of the Company is considered to be the CODM which is responsible for allocating resources and assessing performance of the operating segments.
B. Business segment
(` in crore)
Particulars Year ended 31st March, 2017
Year ended 31st March, 2016
Segment revenueOperating IncomeFleet operating and chartering 982.40 973.18Logistics services 1,233.36 861.61Oilfields services 97.39 185.35
Total 2,313.15 2,020.14Less : Inter segment revenue (187.77) (101.74)
Total Income 2,125.38 1,918.40
Segment resultsFleet operating and chartering 34.79 273.51Logistic services 150.11 85.60Oilfields services (264.76) (345.73)
Profit from operation before interest and finance charges (79.86) 13.38Less: Unallocated interest and finance expense (466.98) (541.60)
Loss before exceptional item and tax (546.84) (528.22)Less: Income tax (37.85) (21.94)
Loss after tax for the year before share in profit of associates (584.69) (550.17)Share in profit of associates 1.24
Loss for the year (583.45) (550.17)
Segment assetsFleet operating and chartering 1,763.31 1,860.83Logistics services – 381.97Oilfields services 6,475.70 6,652.74Unallocable 642.76 1,366.39
Total assets 8,881.77 10,261.93

132
(` in crore)
Particulars Year ended 31st March, 2017
Year ended 31st March, 2016
Segment liabilitiesFleet operating and chartering 414.98 517.50Logistics services – 320.06Oilfields services 218.61 345.61Unallocable – 422.13
Total segment liabilities 633.59 1,605.30Add: Total borrowings 5,674.72 5,321.30
Total Liabilities 6,308.31 6,926.60
Property, plant and equipment acquired during the year*Fleet operating and chartering 581.01 387.04Logistics services 11.64 13.93Oilfields services 1.87 67.27
Total 594.52 468.24DepreciationFleet operating and chartering 164.44 206.32Logistics services 16.91 23.19Oilfields services 209.16 234.43
Total 390.50 463.94
* Additions to the fixed assets shown above are excluding exchange difference, capital work in progress and expenditure during construction.
C. Geographical informationThe geographical information analyses the Group’s revenue by the country of domicile and other countries. In presenting the geographical information, segment revenue has been based on the geographic selling location.
(` in crore)
Particulars Year ended 31st March, 2017
Year ended 31st March, 2016
India 1,881.14 1,434.70
South Korea 64.22 43.82
Singapore 129.79 114.10
Bermuda 17.84 –
Cyprus 1.77 1.75
United Kingdom 14.03 71.15
United Arab Emirates 78.68 51.83
Switzerland 0.55 –
East Africa 4.64 –
Rest of the world 1.32 2.28
TOTAL 2,193.98 1,719.63
The main operating assets represent floating fleet, rigs and logistics equipment which are not identifiable to any geographical location.
D. Information about major customers 80% of the operating income of the Group (previous year: 72%) was derived from a single customer based in India. The Group
provides both Fleet operating and chartering and Logistics services to the said customer

7th ANNUAL REPORT 2016-17
133
25. EARNINGS PER SHARE: The calculation of the basic and diluted earnings per share is based on the following data:
(` in crore)
Particulars Year ended 31st March, 2017
Year ended 31st March, 2016
Loss for the year (583.44) (550.16)
Equity shares at the beginning of the year (nos.) 206,976,072.00 205,227,768.00
Equity shares issued during the year – 1,748,304.00
Equity shares at the end of the year (nos.) 206,976,072.00 206,976,072.00
Weighted average equity shares for the purpose of calculating basic earnings per share (nos.)
206,976,072.00 205,299,420.00
Weighted average equity shares for the purpose of calculating diluted earnings per share (nos.)
206,976,072.00 205,521,807.00
Earnings per share-basic (face value of `10/- each) (`) (28.19) (26.77)
Earnings per share-diluted (face value of `10/- each) (`) (28.19) (26.77)
Note: Equity shares to be issued upon conversion of FCCB and exercise of Employee Stock Option Scheme have not been considered for
the purpose of calculation of weighted average number of diluted equity shares, as they are anti dilutive.
26. EMPLOYEE STOCK OPTION SCHEME In the Annual general meeting held on September 9, 2011, the shareholders approved the issue of Employee Stock options under the
Scheme titled “Essar Shipping Employee Stock options Scheme -2011” (hereafter named ESOS A).
The ESOS A allows the issue of options to employees and executive Directors of the Group and its subsidiaries (whether in India or abroad). Each option comprises one underlying equity share.
As per the Scheme, the Compensation Committee grants the options to the employees deemed eligible. The exercise price of each option shall be determined by the Compensation committee as per the said scheme. The options granted vest in a graded manner over a period of 5/4/3 years from the date of the grant in proportions specified in the Scheme. Options may be exercised within 7 years from the date of vesting. The Group has issued the said ESOS in two tranches on November 2, 2011 and February 8, 2012 at an exercise price of ` 22.30 each, the market price of the shares on the grant date of the ESOS was ` 22.30 per share and `31.30 per share respectively.
The difference between the market price of the share underlying the options granted on the date of grant of option and the exercise price of the option (being the intrinsic value of the option) representing Stock compensation expense is expensed over the vesting period.
Employee stock options details for ESOS A as on the Balance Sheet date are as follows:
Particulars
Year ended 31st March, 2017 Year ended 31st March, 2016Options
(Numbers)Weighted
average exercise price per option (`)
Options (Numbers)
Weighted average
exercise price per option (`)
Option outstanding at the beginning of the year 3,77,463 22.30 11,20,862 22.30 Granted during the year – 22.30 – 22.30 Vested during the year 1,93,135 22.30 4,68,949 22.30 Exercised during the year – 22.30 – 22.30 Lapsed during the year 1,84,328 22.30 2,74,450 22.30 Options outstanding at the end of the year – 22.30 3,77,463 22.30
The impact on Statement of Profit and Loss and Earnings per Share if the ‘fair value’ of the options (on the date of the grant) were considered instead of the ‘intrinsic value’ is as under:

134
(` in crore)
Particulars Year ended 31st March, 2017
Year ended 31st March, 2016
Net loss (as reported) (583.44) (550.16)Add / (Less): stock based employee compensation (intrinsic value) (refer note 18) 0.21 0.25
Add / (Less): stock based compensation expenses determined under fair value method for the grants issued
– (0.54)
Net loss (proforma) (583.24) (550.45)Basic earnings per share (as reported) (refer note 26) (28.19) (26.77)
Basic earnings per share (proforma) (28.19) (26.77)
Diluted earnings per share (as reported) (refer note 26) (28.19) (26.77)
Diluted earnings per share (proforma) (28.19) (26.77)
The fair value of the options granted is estimated on the date of grant using Black Scholes options pricing model taking into account the terms and conditions upon which the options were granted. The following table lists the inputs to the model used for calculating fair value:
AssumptionsRisk free interest rate 8.36% 8.36%
Expected life 58 58
Expected annual volatility of shares 44.5%-58.60% 44.5%-58.60%
Expected dividend yield 0.00% 0.00%
27. DISPOSAL OF A SUBSIDIARY On 10th March, 2017, the Company sold a 51% stake in its wholly-owned subsidiary, Arkay Logistics Limited (ALL) for a consideration
of ` 155 crores, thereby losing control over the same. The summary of the fair value of the assets and liabilities of Arkay Logistics Limited on the date of disposal is provided below:
Particulars ` in croreNon current assets 489.30
Current assets 591.42
Total assets 1,080.72
Non current liabilities 102.07
Current liabilities 393.84
Total liabilities 495.91
Net assets 584.81
51% of the Net assets 298.25Sale consideration 155.00
Loss on disposal of subsidiary (disclosed in Other Gains / (Losses) 143.25
Note: ALL was a subsidiary of Essar Shipping Limited till 10th March, 2017. Thereafter, it became the associate of the Company. For the purpose of consolidation, ALL was consolidated as a subsidiary till the date of its disposal, i.e, 10th March, 2017., post which it has been consolidated under Equity Method

7th ANNUAL REPORT 2016-17
135
28 RELATED PARTY RELATIONSHIPS, TRANSACTIONS AND BALANCES
a) Holding companies : i) Essar Global Fund Limited , Cayman Island, ultimate holding company ii) Essar Shipping & Logistics Limited, Cyprus, intermediate holding company iii) Essar Ports & Shipping Limited, Mauritius, immediate holding company (up to 20th October 2016) iv) Essar Shipping Mauritius Holdings Limited , Mauritius, immediate holding company (from 20th October 2016) (Formerly known as
Essar Africa Steel Holdings Limited)
b) Associates i) Varada Drilling One Pte. Limited ii) Varada Drilling Two Pte. Limited iii) Arkay Logistics Limited (from 11th March, 2017)
c) Key management personnel i) Mr. Ranjit Singh (CEO from 22nd September, 2016) ii) Capt. Anoop Kumar Sharma (CEO up to 9th September, 2016) iii) Mr. Rajeev Nayyer - ( Whole-time Director & CEO ) iv) Mr. Vikram Gupta (Chief Financial Officer) v) Mr. V Sethuraman - ( CFO up to August 31, 2016 ) iv) Mr. Prasad Venkata Devatha (CFO from October 15, 2016) v) Mr. Amit Agarwal (Chief Financial Officer) vi) Mr. P.K Srivastava (Non- Executive Director) vii) Mr. N. Srinivasan (Non- Executive Director) viii) Capt. B. S. Kumar (Non- Executive Director) ix) Ms. S. Gayathri (Non- Executive Director) x) Mr. Dinesh Pande ( Non-Executive Independent Director ) xi) Mrs. Suparna Singh ( Non-Executive Women Director ) xii) Mr. A. K. Musaddy (Whole time director) xiii) Ms. Kalpana Gurumoorthy (Whole time director) xiv) Capt. Subhas Das (Non-executive director) xv) Mr. Deepak B. Berry (Non-executive director) xvi) Mr. Surinder Kumar Bhatia (Independent Directors) xvii) Mr. Chandikeshwar Sharma (Independent Directors) xviii) Mr. Awaneesh Srivastava (Company Secretary) xix) Mr. Habib Jan ( Company Secretary ) xx) Mr. Bhavin Seth (Company Secretary)
d) Relative of key management personnel Mr Amit Musaddy
e) Fellow subsidiaries/ Other related parties: i) Essar Shipping (Cyprus) Limited xvi) PT. Essar Indonesia ii) Essar Steel India Limited xvii) Essar Bulk Terminal Limited iii) Essar Power Gujarat Limited xviii) Essar Bulk Terminal Paradip Limited iv) Vadinar Power Company Limited xix) Essar Bulk Terminal (Salaya) Limited v) Vadinar Oil Terminal Limited xx) Essar Power Jharkhand Limited vi) Vadinar Ports & Terminals Limited xxi) Essar Windpower Private Limited vii) Essar Oil Limited xxii) Essar Power M.P. Limited viii) Essar Projects India Limited xxiii) Essar Steel Minnesota LLC, Minnesota ix) Aegis Limited xxiv) Essar Projects (PNG) Limited x) Equinox Business Parks Private Limited xxv) Essar Power Limited

136
xi) Essar Power Canada Limited xxvi) Essar Ports Limited xii) Energy Holdco Mauritius Limited xiii) Essar Offshore Subsea Limited xiv) Essar Steel Logistics Limited xv) Essar Global Services Limited
f) Trusts: i) Essar Shipping Staff Provident Fund Trust ii) Essar Shipping Employee Stock Options Trust
g) Details of transactions with related parties during the year
(` in crore)
Nature of transactionsHolding
companiesOther related parties/
TrustKey Management
Personnel Total
31.03.17 31.03.16 31.03.17 31.03.16 31.03.17 31.03.16 31.03.17 31.03.16INCOMERevenue from operationsEssar Steel India Limited – – 1,762.36 1,236.33 – – 1,762.36 1,236.33Essar Power Gujarat Limited – – – 4.46 – – – 4.46Essar Shipping & Logistics Limited 1.77 1.75 – – – – 1.77 1.75Essar Power Orissa Limited – – 0.14 0.03 – – 0.14 0.03Essar Power M P Limited – – – 0.03 – – – 0.03Essar Ports Limited – – 0.24 0.24 – – 0.24 0.24Essar Oil Limited – – 32.30 33.85 – – 32.30 33.85Essar Bulk Terminal Limited – – 67.47 44.20 – – 67.47 44.20Essar Power Limited – – 0.06 – – – 0.06Essar Projects (India) Limited – – – 2.00 – – – 2.00Arkay Logistics Limited – – 2.40 – – – 2.40 –
Equipment lease rental incomeEssar Oil Limited – – 1.54 1.77 – – 1.54 1.77
Interest incomeEssar Shipping & Logistics Limited 56.51 57.39 – – – 56.51 57.39Essar Shipping Cyprus Limited – 0.62 0.89 – – 0.62 0.89Essar Global Fund Limited 1.14 3.85 – – – 1.14 3.85Varada Drilling One Pte Limited – 0.03 – – – 0.03 –Varada Drilling Two Pte Limited – 0.03 – – – 0.03 –Essar Capital Holdings Limited – 12.70 – – – 12.70 –Essar Projects (India) Limited – 0.01 – – – 0.01Essar Steel India Limited – 10.17 – – – 10.17Essar Offshore Subsea Limited – – 0.08 – – 0.08
Other IncomeVarada Drilling One Pte Limited – 1.34 – – – 1.34Varada Drilling Two Pte Limited – 1.34 – – – 1.34Arkay Logistics Limited 0.05 – 0.05 –
Gain on foreclosure of finance obligationEssar Shipping & Logistics Limited 53.27 – – – – – 53.27
Managerial remuneration #Anoop Kumar Sharma – – – 1.26 1.66 1.26 1.66Ranjit Singh – – – 0.49 – 0.49 –

7th ANNUAL REPORT 2016-17
137
(` in crore)
Nature of transactionsHolding
companiesOther related parties/
TrustKey Management
Personnel Total
31.03.17 31.03.16 31.03.17 31.03.16 31.03.17 31.03.16 31.03.17 31.03.16A. K. Musaddy – – – – 1.12 1.39 1.12 1.39Rahul Himatsingka – – – – 0.53 – 0.53Kalpana Gurumoorthy – – – – 0.14 0.13 0.14 0.13Rajeev Nayyar – – – – 0.11 0.09 0.11 0.09
Directors Sitting FeesP.K. Srivastava – – – – 0.06 0.03 0.06 0.03N.Srinivasan – – – – 0.09 0.11 0.09 0.11Capt. B. S. Kumar – – – – 0.10 0.10 0.10 0.10Dinesh Pandey – – – – 0.02 0.04 0.02 0.04Capt. Surinder Bhatia – – – – 0.05 0.03 0.05 0.03Chandikeshwar Sharma – – – – 0.01 0.03 0.01 0.03
Remuneration to relative of KMPAmit Musaddy – – – 0.10 0.29 0.10 0.29
Purchase of fuel oilEssar Oil Limited – – 75.05 47.50 – – 75.05 47.50
Purchase of stores and sparesEssar Steel India Limited – – 5.91 1.46 – – 5.91 1.46
Fixed assets including capital advancesEssar Projects India Limited – – 0.01 – – – 0.01 –Essar Off Shore Subsea Ltd – – 30.00 – – – 30.00 –Direct Voyage expenses – – – – – – –Essar Bulk Terminal Limited – – 44.07 0.32 – – 44.07 0.32Arkay Logistics Limited 0.02 – 0.02 –Freight/ hire charges – – – – – – – –Essar Ports Limited – – – 7.56 – – – 7.56Essar Bulk Terminal Limited – – 0.17 – – – 0.17 –Essar Offshore Subsea Limited – – 2.05 – – – 2.05 –Essar Shipping (Cyprus) Limited – – 88.61 83.41 – – 88.61 83.41
Bad DebtsEssar Power M.P. Limited 0.01 0.01 –
RentEquinox Business Parks Pvt. Ltd – – 0.36 0.88 – – 0.36 0.88Essar Steel India Limited – – 0.46 0.09 – – 0.46 0.09Reversal of Rent – – –Equinox Business Parks Pvt. Ltd – – 4.96 – – – 4.96 –Repair and maintenance – – –Essar Steel India Limited – – – 0.03 – – – 0.03Essar Projects (India) Limited – – 0.04 0.36 – – 0.04 0.36Reimbursement of expenses – –Essar Steel India Limited – – – 1.46 – – – 1.46Professional / Management fees – – –Aegis Limited – – – 2.02 – – – 2.02Essar Capital (Mauritius) Limited – – 0.37 0.20 – – 0.37 0.20Essar Oil Limited – – 0.01 0.02 – – 0.01 0.02

138
(` in crore)
Nature of transactionsHolding
companiesOther related parties/
TrustKey Management
Personnel Total
31.03.17 31.03.16 31.03.17 31.03.16 31.03.17 31.03.16 31.03.17 31.03.16Aircraft usage charges reimbursedEssar Oil Limited – – 8.33 31.00 – – 8.33 31.00
Interest expensesVadinar Power Company Limited – – 4.17 – – – 4.17 –Vadinar Ports and Terminals Limited – – 5.70 4.17 – – 5.70 4.17Essar Steel India Limited – – 13.98 11.29 – – 13.98 11.29Essar Oil Limited – – 35.23 7.03 – – 35.23 7.03Essar Shipping & Logistics Limited 0.22 – – – – 0.22 –Essar Holdco Mauritius Limited – – 2.02 2.02 –Essar Oil Limited – – 0.65 0.89 – – 0.65 0.89Aegis Limited – – 4.14 2.32 – – 4.14 2.32Arkay Logistics Limited – – 0.71 – – – 0.71 –
Contribution to staff provident fundEssar Shipping Staff Provident Fund 0.95 1.08 – – 0.95 1.08Interest on finance lease obligationEssar Shipping & Logistics Limited – 0.28 – – – – – 0.28Advance received from customerEssar Oil Limited – – – 25.91 – – – 25.91
Loans and advances givenVarada Drilling One Pte Limited – – 0.69 – – – 0.69 –Varada Drilling Two Pte Limited 0.79 0.79 –Essar Steel India Limited – – 200.30 – – – 200.30Essar Shipping & Logistics Limited 2.83 11.18 – – – – 2.83 11.18Essar Shipping Employee Stock Options Trust – 3.94 – 3.94Essar Bulk Terminal Paradeep Limited 2.20 – 2.20 –Essar Power Limited 3.00 – 3.00 –
Loans and advances receivedAegis Limited – – 31.00 – – – 31.00Essar Power Canada Limited – – 4.31 – – – 4.31Vadinar Ports and Terminals Limited – – 43.05 – – – 43.05Essar Steel Limited – – 114.41 – – – 114.41Essar Oil Limited – – 271.00 – – – 271.00Energy Holdco Mauritius Limited – 142.95 – – 142.95 –Essar Shipping & Logistics Limited 3.77 – – – – – 3.77 –
Loans and advances refundedEssar Shipping & Logistics Limited 3.85 – – – – – 3.85 –Essar Power Canada Limited 1.01 – – – 1.01 –
Guarantee given on behalf of associatesVarada Drilling One Pte Limited – – – 46.28 – – – 46.28Varada Drilling Two Pte Limited – – – 46.28 – – – 46.28
Guarantee invocationVarada Drilling One Pte Limited – – 196.24 – – – 196.24 –Varada Drilling Two Pte Limited – – 196.24 – – – 196.24 –
# Does not include the amount payable towards gratuity and compensated absences by the Company as the same is calculated for the Company as a whole on actuarial basis.

7th ANNUAL REPORT 2016-17
139
h) Outstanding balances with related parties
(` in crore)
Nature of transactionsHolding companies Other related parties/ Trust Key Management Personnel Total
31.03.17 31.03.16 01.04.15 31.03.17 31.03.16 01.04.15 31.03.17 31.03.16 01.04.15 31.03.17 31.03.16 01.04.15Trade receivablesEssar Steel India Limited – – 19.27 52.37 83.74 – – 19.27 52.37 83.74Essar Oil Limited – – – 8.53 5.40 – – – 8.53 5.40Essar Steel Logistics Limited – – – 6.58 – – – – 6.58 –Essar Projects (India) Limited – – – 21.56 21.89 – – – 21.56 21.89Arkay Logistics Limited – – 34.23 – – – – 34.23 – –Essar Bulk Terminal ( Salaya) Limited – – – 0.46 0.46 – – – 0.46 0.46Essar Power Gujarat Limited – – – – 2.11 – – – – 2.11Vadinar Power Company Limited – – – 0.21 0.21 – – – 0.21 0.21Essar Shipping & Logistics Limited 2.15 2.45 1.91 – – – 2.15 2.45 1.91Essar Ports Limited – – 0.17 – 0.25 – – 0.17 – 0.25Essar Power Jharkhand Limited – – – 5.12 6.12 – – – 5.12 6.12Essar Power M. P. Limited – – – 0.26 0.27 – – – 0.26 0.27
Unbilled revenue receivableEssar Steel India Limited – – 23.07 10.35 – – – 23.07 – –Arkay Logistics Limited 1.33 – – 1.33 – –
Other receivablesVarada Drilling One Pte Limited – – 840.79 660.76 661.74 840.79 660.76 661.74Varada Drilling Two Pte Limited – – 843.26 663.29 661.74 – – 843.26 663.29 661.74Essar Projects (India) Limited – – – – 0.11 – – – – 0.11Essar Offshore Subsea Limited – – – 0.02 0.02 – – – 0.02 0.02
Loans and advances (including interest accrued)Essar Global Fund Limited 4.91 29.44 61.21 – – – 4.91 29.44 61.21Essar Shipping & Logistics Limited 895.40 877.74 855.95 – – – 895.40 877.74 855.95Essar Shipping (Cyprus) Limited – – 9.87 14.85 13.96 – – 9.87 14.85 13.96Energy Holdco Mauritius Limited – – – 9.54 – – – – 9.54 –Varada Drilling One Pte Limited 0.72 – – 0.72 – –Varada Drilling Two Pte Limited – – 0.82 – – – – 0.82 – –Essar Capital Holdings Limited – – 245.08 247.61 – – – 245.08 247.61 –Essar Ports Limited – – 0.07 0.07Essar Projects India Limited – – 0.22 0.22Essar Steel India Limited – – 171.89 171.89Essar Shipping Employees Stock Option Trust 3.64 3.94 – –
Advance received from CustomerEssar Oil Limited – – 10.62 22.03 14.69 – – 10.62 22.03 14.69Essar Steel India Limited – – – 4.70 – – – – – –
Trade payablesEssar Steel India Limited – – 17.48 6.18 – – – 17.48 6.18 –Essar Bulk Terminal Limited – – – 3.22 3.31 – – – 3.22 3.31Arkay Logistics Limited 1.56 – – 1.56 – –Aegis Limited – – – 2.88 2.63 – – – 2.88 2.63

140
(` in crore)
Nature of transactionsHolding companies Other related parties/ Trust Key Management Personnel Total
31.03.17 31.03.16 01.04.15 31.03.17 31.03.16 01.04.15 31.03.17 31.03.16 01.04.15 31.03.17 31.03.16 01.04.15Essar Projects (India) Limited – – 4.93 6.13 2.99 – – 4.93 6.13 2.99Equinox Business Parks Pvt. Limited – – 0.58 5.78 4.77 – – 0.58 5.78 4.77Essar Oil Limited – – – 32.50 33.16 – – – 32.50 33.16Essar Shipping & Logistics Limited 1.48 – – – – – 1.48 –Essar Shipping (Cyprus) Limited – – 0.04 48.16 57.71 – – 0.04 48.16 57.71Essar Capital (Mauritius Limited – – 0.39 0.14 0.06 – – 0.39 0.14 0.06Essar Steel Logistics Limited – – 0.06 0.06 0.06 – – 0.06 0.06 0.06Essar Ports Limited – – – 13.01 0.94 – – – 13.01 0.94Essar Power Gujarat Limited – – – 0.01 – – – – 0.01 –Vadinar Oil Terminal Limited – – – 0.02 0.02 – – – 0.02 0.02Essar Staff Provident Fund 0.13 0.18 – – – 0.13 0.18 –
Security deposit receivedEssar Oil Limited – – – 9.00 9.00 – – – 9.00 9.00Essar Steel India Limited – – – 5.00 5.00 – – – 5.00 5.00Vadinar Oil Terminal Limited – – – 1.50 1.50 – – – 1.50 1.50Vadinar Ports & Terminals Limited – – – 1.50 1.50 – – – 1.50 1.50Essar Bulk Terminal Limited – – 1.50 1.50 1.50 – – 1.50 1.50 1.50Essar Offshore Subsea Limited – – 0.94 – – 0.94
Loans and advances receivedEssar Shipping & Logistics Limited 2.48 2.56 3.99 – – – 2.48 2.56 3.99Vadinar Ports & Terminals Limited – – – 43.05 – – – – 43.05 –Essar Steel India Limited – – – 114.41 – – – – 114.41 –Essar Oil Limited – – – 272.56 – – – – 272.56 –Essar Steel Minnesota LLC – – – 1.53 – – – – 1.53 –Essar Power Canada Limited – – – 0.99 – – – – 0.99 –Aegis Limited – – – 30.30 – – – – 30.30 –Arkay Logistics Limited – – 20.48 – – – – 20.48 – –Essar Holdco Mauritius Limited 136.57 – – – – 136.57 – –
Interest accrued but not due on loans (ICD)Vadinar Ports & Terminals Limited – – – 3.75 – – – – 3.75 –Essar Steel India Limited – – 12.86 10.16 – – – 12.86 10.16 –Essar Oil Limited – – 1.74 6.32 – – – 1.74 6.32 –Aegis Limited – – – 2.09 – – – – 2.09 –
Finance Lease obligationEssar Shipping & Logistics Limited – – 241.76 – – 241.76Guarantee given by othersEssar Shipping & Logistics Limited 1,296.77 1,326.66 – – – 1,296.77 1,326.66 –
Guarantee given on behalf of associatesVarada Drilling One Pte Limited – – – 165.39 119.11 – – – 165.39 119.11Varada Drilling Two Pte Limited – – – 165.39 119.11 – – – 165.39 119.11
Note
1) Transactions with related parties are conducted at arms length pricing
2) Vide assignment agreements , certain related party creditors of the Group assigned and transferred all rights, title and interest

7th ANNUAL REPORT 2016-17
141
in the monies receivable from the Group to unrelated parties. These payables include intercorporate deposits, interest accrued thereon, security deposits and trade as well as non-trade payables. The total payables so assigned are disclosed in the table below:
S. No. Company Name ` in crore1 Essar Oil Limited (EOL) 3522 Vadinar Oil Terminal Limited (VOTL) 553 Vadinar Power Company Limited (VPCL) 74 Essar Steel India Limited 65 Aegis Limited 376 Essar Projects India Limited 1
Total 458
Consequent to the assignment as aforesaid, the Company has no amounts payable to EOL, VOTL and VPCL as at 31st March 2017
29. GOING CONCERN At 31st March 2017, the Current Liabilities of the Group exceed its Current Assets. The Management has taken the following initiatives
in order to meet its short term liabilities in a timely manner:
1) Borrowings from related parties and others (including FCCB’s) amounting to ` 2,157 cores are proposed to be converted to equity instruments.
2) a. Borrowings amounting to ` 90 crores have been classified to current owing to covenant breaches as mandated by IND-AS 1.
b. Borrowings amounting to ` 270 crores are current.
However, management is confident of having them rolled over for another year.
3) Preference shares from related and unrelated parties amounting to ` 200 crores are repayable on demand. However, these parties are highly unlikely to demand payment for the same within one year.
4) Borrowings amounting to ` 170 crores classified as current have been refinanced by the Group subsequent to balance sheet date so that there are no repayments over a ten year period.
However, the Group is confident that it will be able to meet its financial obligations in the foreseeable future, and accordingly the consolidated financial statements have been prepared on a Going Concern basis.
30. TRANSITION TO IND AS These are the Group’s first consolidated financial statements prepared in accordance with IND-AS.
The Group has adopted Indian Accounting Standards (Ind AS) notified by the Ministry of Corporate Affairs with effect from 1st April, 2016, with a transition date of 1st April, 2015. Ind AS 101-First-time Adoption of Indian Accounting Standards requires that all Ind AS standards and interpretations that are issued and effective for the first Ind AS financial statements which is for the year ended 31st March, 2017 for the Group, be applied retrospectively and consistently for all financial years presented. Consequently, in preparing these Ind AS financial statements, the Group has availed certain exemptions and complied with the mandatory exceptions provided in Ind AS 101, as explained below. The resulting difference in the carrying values of the assets and liabilities as at the transition date between the Ind AS and Previous GAAP have been recognised directly in equity (retained earnings or another appropriate category of equity).
A. Exemptions and exceptions availed Set out below are the applicable IND-AS 101 optional exemptions and mandatory exceptions applied in the transition from previous
GAAP to IND-AS.
A.1 IND-AS optional exemptions
A.1.1 Deemed Cost
IND-AS 101 permits a first – time adopter to elect to continue with the carrying value for all of its property, plant and equipment as recognized in the financial statements as at the date of transition to IND-AS, measured as per the previous GAAP and use that as its deemed cost as at the date of transition.

142
A.1.2 Cumulative translation differences
IND-AS 101 permits that a first time adopter may consider cumulative translation differences for all foreign operations as Nil.
A.2 IND-AS mandatory exceptions
A.2.1 Estimates
An entity’s estimates in accordance with IND-ASs at the date of transition to IND-AS shall be consistent with estimates made for the same date in accordance with previous GAAP (after adjustments to reflect any difference in accounting policies), unless there is objective evidence that those estimates were in error.
IND-AS estimates as at 1st April, 2015 are consistent with the estimates as at the same date made in conformity with previous GAAP. The Group made estimates for following items in accordance with IND-AS at the date of transition as these were not required under previous GAAP:
– Impairment of financial assets based on expected credit loss model.
A.2.2 De-recognition of financial assets and liabilities
IND-AS 101 requires a first – time adopter to apply the de-recognition provisions of IND-AS 109 prospectively for transactions occurring on or after the date of transition to IND-AS. However, IND-AS 101 allows a first – time adopter to apply the de – recognition requirements in IND-AS 109 retrospectively from a date of the entity’s choosing, provided that the information needed to apply IND-AS 109 to financial assets and financial liabilities derecognized as a result of past transactions was obtained at the time of initially accounting for those transactions.
The Group has elected to apply the de-recognition provisions of IND-AS 109 prospectively from the date of transition to IND-AS.
A.2.3 Classification and measurement of financial assets
IND-AS 101 requires an entity to assess classification and measurement of financial assets (investment in debt instruments) on the basis of the facts and circumstances that exist at the date of transition to IND-AS.
A.2.4 Investments in associates
IND-AS 101 allows an entity to account for investment in associates at cost or in accordance with IND-AS 109. The Group has opted to recognise these investments at cost
A.2.5 Foreign Currency Monetary Items
In terms of Para D13AA of Ind-AS 101,the Group may continue to account for foreign exchange differences relating to long-term foreign currency monetary items as per previous IGAAP. The Group has elected to apply the same.
B) Reconciliation between previous GAAP and IND-AS IND-AS 101 requires an entity to reconcile equity, total comprehensive income and cash flows for prior periods. The following tables
represent the reconciliations from previous GAAP to IND-AS.
Reconciliation of equity as at 1st April, 2015
(` in crore)
Particulars Notes to first-time adoption
Previous GAAP* Adjustments IND-AS
ASSETSNon-current assetsProperty, plant and equipment 4,088.00 4,088.00Capital work-in-progress 78.37 78.37Goodwill on consolidation 1 5,725.86 (3,317.00) 2,408.86Investment in associates 62.48 (62.48) –Financial assets
i. Loans – –ii. Other financial assets 74.97 74.97
Other non-current assets 2 161.16 (35.57) 125.59
Total non-current assets 10,190.84 (3,415.05) 6,775.79

7th ANNUAL REPORT 2016-17
143
(` in crore)
Particulars Notes to first-time adoption
Previous GAAP* Adjustments IND-AS
Current assetsInventories 77.93 77.93Financial assets
i. Other Investments 0.10 – 0.10ii. Trade receivables 3 207.78 132.75 340.53iii. Cash and cash equivalents 43.62 – 43.62iv. Loans 955.54 – 955.54v. Other financial assets 2 1,673.15 (11.12) 1,662.03
Other current assets 4 210.00 (122.79) 87.21
Total current assets 3,168.13 (1.16) 3,166.96
Total assets 13,358.96 (3,416.21) 9,942.75
EQUITY AND LIABILITIESEquityEquity share capital 205.23 205.23Other equity
Equity component of foreign currency convertible bonds 5 – 152.91 152.91Reserves and surplus 7 6,674.82 (3,502.26) 3,172.56
Total equity 6,880.05 (3,349.35) 3,530.70
LIABILITIESNon-current liabilitiesFinancial Liabilities
i. Borrowings 2 2,464.11 (188.49) 2,275.62ii. Other financial liabilities 50.64 50.64
Derivative liability 26.80 26.80Deferred tax liabilities 17.40 17.40
Total non-current liabilities 2,558.95 (188.49) 2,370.46
Current liabilitiesFinancial liabilities
i. Borrowings 241.58 241.58ii. Trade payables 763.80 763.80iii. Other financial liabilities 2 2,724.72 121.63 2,846.35
Employee benefit obligations 7.26 7.26Current tax liabilities 33.33 33.33Other current liabilities 149.27 149.27
Total current liabilities 3,919.96 121.63 4,041.59
Total liabilities 6,478.91 (66.86) 6,412.05
Total equity and liabilities 13,358.96 (3,416.21) 9,942.75

144
Reconciliation of Consolidated Balance Sheet as at 31st March 2016
(` in crore)
Particulars Notes to first-time adoption
Previous GAAP* Adjustments IND-AS
ASSETSNon-current assetsProperty, plant and equipment 3,689.52 8.54 3,698.06Capital work-in-progress 79.04 79.04Goodwill on consolidation 1 6,067.87 (3,317.00) 2,750.87Investment in associates 62.51 (62.51) –Financial assets
i. Other financial assets 25.30 25.30Other non-current assets 2 164.31 (25.81) 138.50
Total non-current assets 10,088.55 (3,396.78) 6,691.77
Current assetsInventories 87.25 87.25Financial assets
i. Trade receivables 3 169.09 166.15 335.24ii. Cash and cash equivalents 35.00 35.00iii. Loans 1,051.05 1,051.05iv. Other financial assets 2 1,824.31 (41.24) 1,783.08
Other current assets 4 222.58 (127.84) 94.74
Total current assets 3,389.28 (2.93) 3,386.35Assets classified as held for sale 84.93 84.93
Total current assets 3,474.21 (2.93) 3,471.28
Total assets 13,562.76 (3,399.71) 10,163.05
EQUITY AND LIABILITIESEquityEquity share capital 206.98 206.98Other equity
Equity component of foreign currency convertible bonds 5 – 96.37 96.37Reserves and surplus 7 6,526.62 (3,497.38) 3,029.24
Total equity 6,733.60 (3,401.01) 3,332.59
LIABILITIESNon-current liabilitiesFinancial Liabilities
i. Borrowings 2 3,219.73 (122.19) 3,097.54ii. Other financial liabilities 6.04 6.04
Derivative liability 30.57 30.57Deferred tax liabilities 15.49 15.49
Total non-current liabilities 3,271.83 (122.19) 3,149.64

7th ANNUAL REPORT 2016-17
145
(` in crore)
Particulars Notes to first-time adoption
Previous GAAP* Adjustments IND-AS
Current liabilitiesFinancial liabilities
i. Borrowings 511.41 511.41ii. Trade payables 733.53 733.53iii. Other financial liabilities 2 2,025.34 123.49 2,148.83
Employee benefit obligations 5.97 5.97Current tax liabilities 25.71 25.71Other current liabilities 255.37 255.37
Total current liabilities 3,557.33 123.49 3,680.82
Total liabilities 6,829.16 1.30 6,830.46
Total equity and liabilities 13,562.76 (3,399.71) 10,163.05
Reconciliation of Consolidated Statement of Profit and Loss for the year ended 31st March 2016
(` in crore)
Particulars Notes to first-time adoption
Previous GAAP* Adjustments IND-AS
Continuing operationsRevenue from operations 1,719.63 – 1,719.63Other income 5 237.07 (38.30) 198.77
Total income 1,956.70 (38.30) 1,918.40
ExpensesOperating expenses 6 1,228.12 (9.19) 1,218.93Employee benefits expenses 136.70 – 136.70Finance costs 5 479.32 62.28 541.60Depreciation 6 458.25 5.69 463.94Other expenses 85.43 85.43
Total expenses 2,387.82 58.78 2,446.61
Loss before tax (431.13) (97.08) (528.22)Income tax expense (21.94) – (21.94)
Loss for the year before share in loss of associate (453.07) (97.08) (550.16)
Share in loss of associate (0.03) 0.03 –
Loss for the year (453.10) (97.05) (550.16)
Other comprehensive incomeItems that will not be reclassified subsequently to profit and loss account
8 – 0.70 0.70
Actuarial gain / (loss)Items that will be subsequently reclassified to profit and loss accountFair value changes on derivatives designated as cash flow hedges 8 – (9.24) (9.24)
Total other comprehensive income – (8.54) (8.54)
Total comprehensive loss for the year (453.07) (105.62) (558.70)

146
Reconciliation of Other Comprehensive Income
(` in crore)
Particulars Notes to first- time adoption
For the year ended 31st March 2016
Net Loss under previous GAAP (453.10)
Share in loss of associate 0.03Unwinding of interest on foreign currency convertible bonds 5 (62.28)Foreign currency monetary items translation differences 5 (38.30)Dry-docking costs amortised over 30 months under Ind AS 6 8.54Amortisation of operating lease expenses 4 (5.05)
Net Loss for the period under Ind AS (550.16)
Other comprehensive income 8 (8.54)
Net Comprehensive Loss for the year under Ind AS (558.70)
*Note: The previous GAAP figures have been reclassified to conform to IND-AS presentation requirements for the purposes of this note.
Reconciliation of total equity
(` in crore)
Particulars Notes to first- time adoption
For the year ended 31st March 2016
For the year ended 31st March 2015
Total equity (shareholders’ funds as per previous GAAP) 6,733.60 6,880.05
Less: Impairment of Goodwill on consolidation 1 (3,317.00) (3,317.00)Less: Impairment of investment in associates 1 (62.47) (62.47)Less: Write-off of unamortised operating lease rentals 4 (127.84) (122.79)Add: Equity component of foreign currency convertible bonds 5 96.37 152.91Add: Dry-docking costs amortised over 30 months 6 8.54 –Others 1.39 –
Total adjustments (3,401.01) (3,349.35)
Total equity as per IND-AS 3,332.59 3,530.70
Notes to first time adoption The following explains the material adjustments made during transition from previous GAAP to Ind AS:
Note 1: Goodwill on consolidation and Investment in Associates IND-AS 101 allows investments in subsidiaries to be considered at deemed cost or fair value on the date of transition. Accordingly,
investments in all subsidiaries were considered at deemed cost as at the date of transition to IND-AS. However, management was aware of a diminution other than temporary in the carrying value of the Group’s investment in its wholly-owned subsidiary Essar Oilfields Services Limited Mauritius amounting to ` 4,747 crores.
Therefore, on the basis of a report provided by an independent valuer, it was concluded that the said investment was impaired as at 1st April, 2015. The impairment of investment in Essar Oilfields Services Limited, Mauritius has resulted in an impairment in Goodwill relating to the said subsidiary to the extent of ` 3,317 crores.
The Group has also fair valued Investments in Associates amounting to ` 62.47 crores to Nil as at 1st April, 2015 and the resultant provision for impairment in these associates has been recognised in opening Retained Earnings.
Note 2: Borrowings IND-AS 109 requires transaction costs incurred towards origination of borrowings to be deducted from the carrying amount of
borrowings on initial recognition. These costs are recognized in the profit or loss over the tenure of the borrowing as part of the interest expense by applying the effective interest rate method.

7th ANNUAL REPORT 2016-17
147
Under previous GAAP, these transaction costs were charged to profit or loss over the tenure of the borrowing on a straight line basis. Also, under previous GAAP, the unamortised transaction costs were grouped under Current/Non-Current Assets depending on the amortisation period. Consequent to transition to IND-AS, unamortised transaction costs amounting to ` 46.69 crores now appear as a reduction from Borrowings.
Note 3: Recognition of financial assets derecognised in previous GAAP The previous GAAP allowed trade receivables to be derecognised in case they were discounted with recourse. However, IND-AS 109
prohibits the same. Accordingly, as at 1st April, 2015, trade receivables amounting to ` 132.85 crores which were derecognised under the previous GAAP, were re-instated with a corresponding impact on other current financial liabilities
Note 4: Unamortised operating lease rentals written off The Group had entered into long term non-cancellable operating lease agreements in respect of six vessels. On 31st March, 2015,
the Group requested the lessor to cancel the agreement. This was duly accepted by the lessor. Under previous GAAP, these operating lease rentals were being expensed on a straight line basis. Consequent to the cancellation as aforesaid, the unamortised operating lease rentals were written off with a corresponding impact on Retained Earnings.
Note 5: Foreign currency convertible bonds split into equity and debt components Under previous GAAP, foreign currency convertible bonds amounting to USD 240 million were treated as borrowings. IND-AS 32
requires such compound instruments to be split into debt and equity components.
As at 1st April, 2015, the debt component of the convertible bonds was USD 215.57 million while the equity component was USD 24.43 million. Accordingly, an amount of ` 152.91 crores has been recognised as equity component of the said foreign currency convertible bond by reducing the same from borrowings.
Note 6: Dry-docking costs These were debited to the Statement of Profit and Loss under the previous GAAP. Under IND-AS, the Group has deferred these costs
over 30 months.
Note 7: Retained Earnings. Retained earnings as at 1st April, 2015 has been adjusted consequent to the above IND-AS transition adjustments.
Note 8: Other Comprehensive Income Under Ind AS, all items of income and expense recognised in a period should be included in profit or loss for the period, unless a
standard enquires or permits otherwise. Items of income and expense that are not recognised in profit or loss but are shown in the Statement of Profit and Loss as ‘other comprehensive income’ includes remeasurements of defined benefit plans and movement in cash flow hedge reserve. The concept of other comprehensive income did not exist under previous GAAP.
Note 9: Impact on Statement of Cash Flows The Ind AS adjustments are non cash adjustments. Consequently, Ind AS adoption has no impact on the net cash flow for the year
ended 31st March, 2016 as compared with the previous GAAP.
31. DISCLOSURE RELATING TO SPECIFIED BANK NOTES During the year, one of the Company’s subsidiaries had specified bank notes (SBNs) and other denomination notes as defined in the
MCA notification G.S.R. 308(E) dated 31st March, 2017. For the purpose of this clause ‘Specified Bank Notes’ shall have the same meaning provided in the notification of the Government of India, in the Ministry of Finance, Department of Economic Affairs number S.O. 3407(E), dated the 8th November, 2016. Further details in this regard are provided below:
Particulars SBNsOther
Denomination notes
Total (`)
Closing cash in hand as on 08.11.2016 100,000 1,155,839 1,255,839(+) Permitted receipts 0 338,000 338,000(-) Permitted Payments 0 (493,049) (493,049)(-) Amount deposited in banks (100,000) – (100,000)
Closing cash in hand as on 30.12.2016 – 1,000,790 1,000,790

148
32. ADDITIONAL INFORMATION AS REQUIRED UNDER SCHEDULE III TO THE COMPANIES ACT, 2013
Name of the entity in the Group
Net Assets i.e. total assets minus total
liabilitiesShare in profit and loss Share in other
comprehensive incomeShare in total
comprehensive income
As a % of Consolidated
net assets
Amount (` Crores)
As a % of Consolidated
net assets
Amount (` Crores)
As a % of Consolidated
net assets
Amount (` Crores)
As a % of Consolidated
net assets
Amount (` Crores)
ParentEssar Shipping Limited -1.01% (26.17) 106.51% (622.73) 100% –0.38 106.50% (623.11)SubsidiariesIndianEssar Oilfield Services India Limited 29.12% 756.59 17.47% (102.15) – – 17.46% (102.15)Arkay Logistics Limited (subsidiary up to 10th March 2017)
– – -28.57% 167.05 -28.55% 167.05
ForeignEssar Oilfields Services Limited 58.24% 1,549.88 36.48% (213.31) – – 36.46% (213.31)Energy Transportation International Limited -0.21% (5.45) -2.76% 16.13 – – -2.76% 16.13Energy II Limited 11.76% 305.55 -26.19% 153.10 – – -26.17% 153.10Essar Shipping DMCC 0.67% 17.47 -2.95% 17.23 – – -2.94% 17.23Cosmic Drilling Services Limited – –Essar Oilfields Services Middle East DMCC – –AssociatesIndianArkay Logistics Limited (w.e.f. 11th March 2017)
1.42% 37.01 @ 1.24 @ 1.24
ForeignVarada Drilling One Pte Limited @ – @ – @ –Varada Drilling Two Pte Limited @ – @ – @ –@- Less than 1%
33. ONGOING ASSESSMENT OF IMPAIRMENT OF RIGS Certain Rigs owned by the Group with a carrying value of ` 114.99 crores (Including capital work in progress of ` 79.16 crores) as
at March 31, 2017, have not been deployed for an extended period of time. The Management is in the process of validating various operational assumptions impacting the estimated future cash flows from operation of the aforesaid Rigs to determine whether there is an impairment in the value of the same. Pending conclusion of the said assessment, no impairment expense has been recorded in respect of these Rigs.
34. SUBSEQUENT EVENTSSubsequent to the 31st March,2017, (a) the Group has acquired a Panamax dry bulk carier (74,005 DWT) and (b) entered into a Memorandum of Agreement for sale of a capesize dry bulk carrier(152,065 DWT).
35. The figures of the previous period(s) / year have been regrouped/reclassifed wherever necessary in conformity with current year’s classifications.
As per our attached report of even date For and on behalf of the Board
For C N K & Associates LLP Chartered Accountants Firm Registration No.: 101961W/W100036
Ranjit Singh Executive Director & CEO (DIN: 07021621)
N Srinivasan Director (DIN: 00004195)
Himanshu Kishnadwala Partner Membership No.: 37391
Vikram Gupta Chief Financial Officer
Awaneesh Srivastava Company Secretary Membership No.: FCS 8513
Mumbai, 26th May, 2017 Mumbai, 26th May, 2017

GREEN INITIATIVE
The Ministry of Corporate Affairs taken a Green Initiative in Corporate Governance by allowing paperless Compliance by Companies Accordingly, Companies can now send various documents electronically to those shareholders who register their email addresses.
To receive all communications including Annual Report by e-mail:
• Holdersofshares inphysical formarerequested tofillup thepostagepre-paide-mail registration formsetoutbelowandsend it tothe Share transfer agents, M/s Data Software Research Company Private Limited.
• Membersholdingsharesindematformmayregistertheire-mailIDswiththeCompanyortheirDepositoryParticipant.
E-MAIL REGISTRATION
To
Data Software Research Company Private LimitedUnit:ESSARSHIPPINGLIMITED19, Pycrofts Garden Road,OffHaddowsRoadNungambakkam,Chennai-600006
Dear Sir/s,
Re: Registration of e-mail ID for receiving communications in electronic form
In order to receive all communications from the Company including the documents relating to Annual and other General meetings of the Company, such asNotices, Explanatory Statement(s) thereto, Financial Statements, Directors’ Reports,Auditor’s Reports etc. throughe-mail, please register my e-mail ID, set-out below, in your records for sending communication through e-mail:
FolioNo* :
Nameof1stRegisteredHolder* :
NameofJointHolder(s) :
Address :
Pin Code :
E-mailID(toberegistered) :
ContactTel.Nos. : Mobile :
Landline :
Date:…………………………..Signatureoffirstholder*………………………………………
Important Notes:
1) Fieldsmarked*aremandatoryforregistrationofthee-mailID
2) Onregistration,allthecommunicationswillbesenttothee-mailIDregisteredinthefolio
3) TheformisalsoavailableonthewebsiteoftheCompanywww.essar.com
4) Anychangeine-mailID,fromtimetotime,maypleaseberegisteredintherecordsoftheCompany.
Demat of shares: I would like to know the procedure to demat my physically held shares of Essar Shipping Limited. Please contact at my above contact number. Yes No

BUSINESS REPLY INLAND LETTER
Postagewill be
paid by theAddressee
BusinessReplyPermitNo.TN/CH/(C)/BRP/996Greams Road P.O.Chennai-600006
Nopostagestamp
necessary‘if’posted inINDIA
To,Data Software Research CompanyPrivate LimitedUnit: Essar Shipping Limited19, Pycrofts Garden RoadOffHaddowsRoadNungambakkam,Chennai-600006
2stFold
1stFold

ESSAR SHIPPING LIMITEDRegistered Office: EBTSL Premises, ER-2 Building (Admin. Building), Salaya, 44 KM, P.O. Box No. 7, Taluka Khambhalia,
Devbhumi Dwarka, Gujarat - 361 305 CIN: L61200GJ2010PLC060285.
Attendance SlipMember’s Folio No. : ________________________
and/or
DP ID No./Client ID No.* : ________________________
7th Annual General MeetingTime : 2:00 p.m.Date : Friday, December 29, 2017Venue : EBTSL Premises, ER-2 Building (Admin. Building), Salaya, 44 KM, P.O. Box No. 7, Taluka Khambhalia, Devbhumi Dwarka, Gujarat - 361 305
NOTE:1. Admission restricted to Members/Proxies only.2. Shareholder / Proxy holder wishing to attend the Meeting must bring
this Attendance Slip to the meeting and hand it over at the entrance* Applicable for Investors holding share(s) in electronic form.Please cut here and bring the above attendance slip to the meeting
Member [NAME IN CAPITAL LETTERS]
Proxy [NAME IN CAPITAL LETTERS]I hereby record my presence at the 7th AGM of the Company
Signature of Member/Proxy
ESSAR SHIPPING LIMITEDRegistered Office: EBTSL Premises, ER-2 Building (Admin. Building), Salaya, 44 KM, P.O. Box No. 7, Taluka Khambhalia,
Devbhumi Dwarka, Gujarat - 361 305 CIN: L61200GJ2010PLC060285.
FORM MGT 11 Proxy Form
[Pursuant to Section 105 (6) of the Companies Act, 2013 and Rule 19(3) of the Companies (Management and Administration) Rules, 2014]
Name of the Member(s)
Registered Address
Email ID
Folio No. / DP ID No. & Client ID
I/We, being the Member(s), holding..................... Shares of the above named Company, hereby appoint.
1. Name .................................................................................................... Address ....................................................................................
.................................................................................................................................................................................................................
Email id ................................................................................................. Signature ..................................................................................
or failing him
2. Name .................................................................................................... Address ....................................................................................
.................................................................................................................................................................................................................
Email id ................................................................................................. Signature ..................................................................................
or failing him
3. Name .................................................................................................... Address ....................................................................................
.................................................................................................................................................................................................................
Email id ................................................................................................. Signature ..................................................................................
As my / our proxy to attend and vote (on a poll) for me / us and on my / our behalf at the 7th Annual General Meeting of the Company, to be held on
(Contd.……)
ELECTRONIC VOTING PARTICULARS
EVSN (E-voting Sequence Number) USER ID PAN/SEQUENCE NO171130010
Note: The Voting period starts from 9:00 a.m. (IST) on December 26, 2017 and ends at 5:00 p.m. (IST) on December 28, 2017. Thereafter, the voting, module shall be disabled by CDSL. Kindly refer to the e-voting instructions in the Notice.

Friday, December 29, 2017 at 2:00 p.m. at the Registered Office of the Company, EBTSL Premises, ER-2 Building (Admin. Building), Salaya, 44 KM, P.O. Box No. 7, Taluka Khambhalia, Devbhumi Dwarka, Gujarat - 361 305 and at any adjournment thereof in respect of such resolutions as are indicated below:
Resolution Number Resolution Type of
ResolutionOptional*
For Against1 a) Adoption of the Audited Standalone Balance Sheet, Statement of Profit and Loss together
with the Statement of Cash Flows and Statement of Changes in Equity of the Company for the financial year ended March 31, 2017, the reports of the Board of Directors and Auditors thereon; and
Ordinary
b) Adoption of the Audited Consolidated Balance Sheet, Consolidated Statement of Profit and Loss together with the Consolidated Statement of Cash Flows and Consolidated Statement of Changes in Equity of the Company for the financial year ended March 31, 2017 and report of Auditors thereon.
Ordinary
2 To appoint a Director in place of Mr. P. K. Srivastava (DIN: 00843258), who retires by rotation and being eligible offers himself for re-appointment.
Ordinary
3 To re-appoint Auditors/ ratify the re-appointment of Auditors for the Financial Year 2017-18 Ordinary4 To approve the Related party Transactions of the Company Special5 To appoint/Re-appoint Independent Directors of the Company for a term of 5 years from the
date of ensuing AGM.Special
6 To Confirm the appointment and remuneration of Mr. Ranjit Singh, Executive Director & CEO, appointed during the year as Additional Director under Executive category
Special
7 To Confirm the appointment of Ms..Neelam Kapoor as Director of the of Company to comply with the provisions of Section 149 (1) of the Companies Act, 2013 and rules made therein.
Special
8 To Confirm the appointment and remuneration of Capt. Rahul Bhargava as Director of the of Company to comply with the provisions of Section 149 (1) of the Companies Act, 2013 and rules made therein.
Special
9 To increase the authorised share capital of the Company and re-classification of share capital and change in Memorandum of Association and Articles of Association of the Company accordingly.
Special
Signed this....................................................day of ..................... 2017
Signature of the Member .......................................................................
Signature of the Proxy Holder................................................................
Notes:
1. * This is only optional. Please put ‘X’ in the Box in the appropriate column against the respective resolution. If you leave the ‘For’ or ‘Against’ column blank against any or all the resolutions, your Proxy will be entitled to vote in the manner as he/she thinks appropriate.
2. This form of proxy in order to be effective should be duly completed and deposited at the Registered Office of the Company, not less than 48 hours before the commencement of the Meeting
Affix ` 1Revenue
Stamp

ESSA
R S
HIP
PIN
G L
IMIT
EDSi
xth
Annu
al G
ener
al M
eetin
g ve
nue
- Rou
te M
ap
(ESS
AR
SH
IPPI
NG
LIM
ITED
)


NOTES

NOTES