board of director composition and financial … "board of director composition and financial...
TRANSCRIPT

"BOARD OF DIRECTOR COMPOSITION AND FINANCIAL
PERFORMANCE IN A SARBANES-OXLEY WORLD"
2010
Academy of Business and Economics Journal 10 (5), 56-74
Raymond K. Van Ness, Ph.D., State University of New York at Albany
Paul Miesing, Ph.D., State University of New York at Albany
Jaeyoung Kang, Ph.D. ABD, Iona College, Hagan School of Business
ABSTRACT
The purpose of this study is to contribute to the literature by examining the influence of
corporate boards on firm financial performance in the new era of Sarbanes-Oxley (SOX).
Integrating the key characteristics of the SOX regulations, we compare board compositions
to firm performance by expanding the traditional one or two measures to five. We found
that duality, occupational expertise, board size, and board tenure were significant
influences on firm financial performance. Suggestions for further study were made.
Keywords: Corporate Governance, Boards of Directors, SOX, Financial Performance
Background Research Issue: This study provides additional insight to the influence of corporate board
composition on firm financial performance. The analysis occurs in a Sarbanes-Oxley (SOX)
environment and expands the areas of performance measurement from the traditional one or two
variables to five.
Research Findings/Insights: Results indicate that board size and heterogeneity of director
expertise are positively related to revenue growth, whereas the ratio of directors with education
expertise and the ratio of directors of finance expertise have a negative effect on this
performance measure. The results show that both CEO/COB duality and average tenure of
board of directors have a positive effect on return on asset growth. We found that board size is
negatively related to the debt to asset ratio but negatively related to free cash flow-to-net income
while heterogeneity of tenure of board members is positively related to this same performance
measure. We found no significant impact of outside directors, gender, or average board age on
financial performance.
Theoretical/Academic Implications: Composition of boards has different financial performance
results.
Practitioner/Policy Implications: Sarbanes-Oxley has increased top management transparency
and personal accountability. Yet, depending on the desired financial results, companies need to
carefully consider their board’s makeup.

2
"Board of Director Composition and Financial Performance
in a Sarbanes-Oxley World"
INTRODUCTION
Corporate boards of directors have been the focus of a steady stream of management
research for more than a century, providing a rich base to the governance literature. Perhaps the
steadfast interest in board research is sustained by such issues as the important governance
oversight role that boards are expected to play, the presumed frequency with which they are
negligent in this role, and their association with high-profile corporate failures. Additionally,
large bloc investors such as public pensions may also serve as a magnet for researchers since
their objection to board independence often captures mass media attention (Brickley, Coles, &
Jarrell, 1997). Nevertheless, despite the unwavering interest and voluminous research into the
relationship between corporate boards and firm performance, empirical results display a
remarkable lack of consensus (Zajac & Westphal, 1996).
Studies finding boards have little or no influence on firm performance confirm the
historical perception of board failure. For example, over seventy-five years ago Berle and Means
(1932) postulated that corporate boards had neither the incentive nor the ability to objectively
represent the interests of shareholders. They believed that rather than provide independent
oversight for top management decision making, corporate boards would simply affirm executive
decisions. Decades later, Boulton (1978) concluded that boards had failed to evolve much
beyond a passive, rubber-stamping committee for management, in essence being indolent.
Barnhart, Marr, and Rosenstein (1994) found little evidence to suggest that board composition is
important to the quality of overall firm performance. A meta-analysis conducted by Dalton,
Daily, Ellstrand, and Johnson (1998) found little correlation between board composition and
corporate financial performance among 54 empirical studies and no correlation between
leadership structure (e.g. duality) and financial performance among 31 empirical studies.
Some researchers, who initially believed that they had identified a link between corporate
boards and firm performance, discounted that notion after considering additional factors. For
example, Kesner and Johnson (1990) found that boards with a greater proportion of inside
directors tended to be involved in more fiduciary-failure lawsuits, presumably demonstrating lax
oversight. However, the difference could be accounted for by factoring the outcome of those
lawsuits. The lawsuits may have been motivated by the appearance of board impropriety rather
than any real evidence that a board dominated by insiders adversely affects performance. Despite
the voluminous studies confirming torpid boards, the literature also contains a prominent set of
studies concluding that independent boards have influenced management behavior and affected
corporate performance in significant ways. There is also evidence suggesting that proactive
boards are associated with strong financial performance (c.f., Pearce & Zahra, 1991; Stearns &
Mizruchi, 1993).
The literature offers a range of plausible explanations for the disparate findings between
studies, including the following: (1) corporate financial performance is simultaneously affected
by multiple factors thus any association with boards is spurious (Hermalin & Weisbach, 2003);
(2) when boards meet infrequently they are unlikely to sustain any meaningful influence over

3
corporate performance (Mace, 1986; Useem, 2006); (3) the vast number of board meetings
generally result in little or no meaningful action when they are fundamentally cosmetic
(Baldwin, Bagley, & Quinn, 2003; Lorsch & MacIver, 1989); and (4) boards perform indolently
when they lack incentives to operate otherwise (Hayward & Hambrick, 1997).
The literature also suggests two key plausible avenues for future investigations. The first
relates to possibly missed results when studies rely on too few areas for performance
measurement or use a one-dimensional analysis (Fligstein & Brantley, 1992; Ittner, Larcker, &
Rajan, 1997; Van Ness & Seifert, 2007). The second relates to timing, insofar that current studies
may yield different results because of the enactment and maturation of the Sarbanes-Oxley Act
(SOX) of 2002. Our study capitalizes on both of these considerations as we expand performance
measurement from the traditional one or two variables to five. Further, we focus our
investigation on the 2005-2007 timeframe to ensure a longer exposure of corporate boards to
SOX.
Sarbanes-Oxley: New Rules for Corporate Board Governance
The Sarbanes-Oxley Act of 2002 (SOX) may be one of the most important securities
legislation affecting publicly-traded companies since the formation of the Securities and
Exchange Commission in 1934. The United States law was enacted on July 30, 2002 in response
to multiple corporate scandals. It was designed, in part, to alter the behavior of corporate
directors (Buccino & Shannon, 2003; Klein, 2003). Among other things, SOX affects the duties
and responsibilities of officers and directors. The law has multiple sections, but two are
particularly noteworthy: 404 which relates to the assessment of internal control and 802 which
addresses criminal penalties for violations.1 Some scholars believe the adoption of SOX was a
knee-jerk reaction to the collapse of corporations such as Enron and WorldCom (Brown, 2006),
while others acknowledge the act is clearly affecting corporate boards but question the
cost/benefit aspects of its enactment (Linck, Netter, & Yang, 2008).
Boards are legally bound to be fully informed about critical corporation conditions and
financial reporting. Audit committees must be comprised of independent directors to ensure that
the company has an adequate system of internal controls, duly monitors potential problems, and
preserves the integrity of financial reports. They are to oversee the financial reporting process
and confirm the appointment of the independent auditing firm. Additionally, they are responsible
for discharging independent auditors when appropriate.
There are substantial penalties associated with boards that fail to exercise due diligence.
SOX makes it easier to prosecute securities fraud, particularly financial fraud. SOX also attempts
to reassert board independence from corporate management (Klein, 2003). The Act places
greater responsibility on senior management and directors, particularly independent directors.
The independent directors on the audit committee are to be substantially more diligent in
overseeing and monitoring the financial reporting process, establishing internal controls, and
assuring performance transparency. SOX provides teeth for civil and criminal enforcement over
the conduct of corporate boards. These new pressures on boards will continue to alter the role of
directors (Buccino & Shannon, 2003). The majority of prior studies were conducted either before
or shortly after the enactment of the SOX Act, therefore a current investigation offers the
potential for an entirely new set of results. We believe the timing and the use of a broader set of

4
financial performance measures yield findings that are a valuable contribution to the literature on
corporate governance.
The Variables, Hypotheses, and Data
Our areas of assessment were targeted at five dimensions of performance that cover a
broad spectrum of accounting and marketing measures: corporate growth, profitability and asset
utilization, leverage, market confidence, and liquidity. We examine several aspects (and
attributes) of board composition to observe how they influence these various performance
measures. The independent variables are: duality, proportion of outside directors,
gender/diversity, board members average age, average board tenure, board size, and occupational
expertise. Table 1 summarizes these independent variables along with contradictory performance
expectations. We elaborate these independent variables followed by the dependent variables.
TABLE 1
Board Characteristics and Contrary Financial Performance Determinants
CE
O/C
OB
Duali
ty
AGENCY THEORY: Combining the
positions of CEO with the position
of COB constrains the board
members, threatens independence,
and underperform those which are
separate
STEWARDSHIP THEORY: Insiders are
competent and reliable advocates
for shareholders’ interests, leading
to stronger performance
Pro
port
ion
of
Outs
ide
Dir
ecto
rs
INSIDE DIRECTORS: Appearance of
impropriety, less able to resist the
will of the COB, benefits from
increasing risk by pursuing more
speculative opportunities for growth
INDEPENDENT OUTSIDE DIRECTORS:
More effective monitors of
management and financial
reporting, better corporate credit
ratings, and antitakeover
amendments lead to stronger
corporate performance and larger
shareholder returns
Gen
der
WOMEN ON CORPORATE BOARDS:
New perspective and inspire
workforce diversity lead to stronger
financial performance
WOMEN ON CORPORATE BOARDS:
Tends to decrease as the number of
board insiders increases, perhaps
seen as tokenism or window-
dressing
Age
YOUNGER BOARD MEMBERS:
Superior technical knowledge, more
amenable to change, greater
receptivity to risk-taking, more
innovative, and more efficient in
governance oversight
OLDER BOARDS MEMBERS:
Experience, greater independence,
and long-term connections lead to
stronger corporate performance
Ten
ure
RECENT MEMBERS: Tend to make
tentative decisions and incomplete
analysis, and are susceptible to
social pressures
LONGER-TENURE MEMBERS:
Insulated against social isolation
and develop a sense of camaraderie,
hence better able to evaluate top
management proposals
5
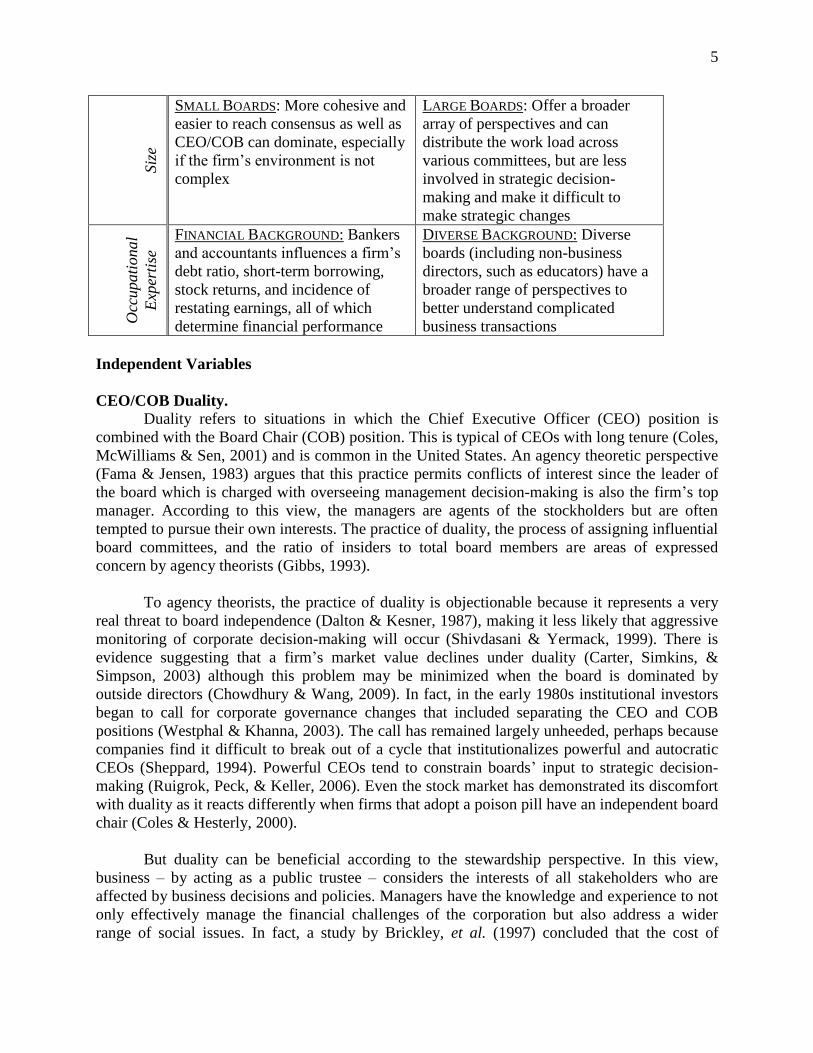
Siz
e
SMALL BOARDS: More cohesive and
easier to reach consensus as well as
CEO/COB can dominate, especially
if the firm’s environment is not
complex
LARGE BOARDS: Offer a broader
array of perspectives and can
distribute the work load across
various committees, but are less
involved in strategic decision-
making and make it difficult to
make strategic changes
Occ
upati
onal
Exp
erti
se
FINANCIAL BACKGROUND: Bankers
and accountants influences a firm’s
debt ratio, short-term borrowing,
stock returns, and incidence of
restating earnings, all of which
determine financial performance
DIVERSE BACKGROUND: Diverse
boards (including non-business
directors, such as educators) have a
broader range of perspectives to
better understand complicated
business transactions
Independent Variables
CEO/COB Duality. Duality refers to situations in which the Chief Executive Officer (CEO) position is
combined with the Board Chair (COB) position. This is typical of CEOs with long tenure (Coles,
McWilliams & Sen, 2001) and is common in the United States. An agency theoretic perspective
(Fama & Jensen, 1983) argues that this practice permits conflicts of interest since the leader of
the board which is charged with overseeing management decision-making is also the firm’s top
manager. According to this view, the managers are agents of the stockholders but are often
tempted to pursue their own interests. The practice of duality, the process of assigning influential
board committees, and the ratio of insiders to total board members are areas of expressed
concern by agency theorists (Gibbs, 1993).
To agency theorists, the practice of duality is objectionable because it represents a very
real threat to board independence (Dalton & Kesner, 1987), making it less likely that aggressive
monitoring of corporate decision-making will occur (Shivdasani & Yermack, 1999). There is
evidence suggesting that a firm’s market value declines under duality (Carter, Simkins, &
Simpson, 2003) although this problem may be minimized when the board is dominated by
outside directors (Chowdhury & Wang, 2009). In fact, in the early 1980s institutional investors
began to call for corporate governance changes that included separating the CEO and COB
positions (Westphal & Khanna, 2003). The call has remained largely unheeded, perhaps because
companies find it difficult to break out of a cycle that institutionalizes powerful and autocratic
CEOs (Sheppard, 1994). Powerful CEOs tend to constrain boards’ input to strategic decision-
making (Ruigrok, Peck, & Keller, 2006). Even the stock market has demonstrated its discomfort
with duality as it reacts differently when firms that adopt a poison pill have an independent board
chair (Coles & Hesterly, 2000).
But duality can be beneficial according to the stewardship perspective. In this view,
business – by acting as a public trustee – considers the interests of all stakeholders who are
affected by business decisions and policies. Managers have the knowledge and experience to not
only effectively manage the financial challenges of the corporation but also address a wider
range of social issues. In fact, a study by Brickley, et al. (1997) concluded that the cost of

6
separating the roles of CEO from COB is greater than the benefits from doing so. Donaldson and
Davis (1991) found that firms with duality actually enhanced shareholder wealth and increased
ROE when compared to firms with independent COBs. They found no evidence to suggest that a
unitary leadership structure is associated with substandard accounting or market performance
measures. Boyd (1995) concluded that duality is actually advantageous in situations of resource
scarcity or high complexity. In fact, in these situations, a large number of boards tie executive
compensation packages to market performance (Conyon & Peck, 1998). Acknowledging the
incongruent findings in the literature, we form our hypothesis based on agency theory:
H1: Firms practicing duality will be associated with a stronger positive performance in
revenue change, return on assets change, and price-to-book change.
We used a dummy variable to indicate CEO/COB duality, coded as 1 when a firm’s CEO
also served as a chairman of the board and it 0 otherwise (Zajac & Westphal, 1994).
Proportion of Outside Directors
Many scholars, financial analysts, and investors consider outside directors to be better
representatives of shareholder interests than inside directors (Carter, et al., 2003) and studies
have found their relationship to be stronger with overall corporate performance (Pearce & Zahra,
1992; Perry & Shivdasani, 2005) and larger shareholder returns (Shivdasani & Yermack, 1999).
Not surprisingly, the number of outside board members tends to increase immediately after a
firm performs poorly (Hermalin & Weisbach, 1988) and they are associated with improved
performance during periods of corporate restructuring (Perry & Shivdasani, 2005). Conversely,
market reaction to a firm's defensive action against a hostile takeover bid was negatively affected
when the board was dominated by insiders (McWilliams & Sen, 1997). Board independence was
clearly addressed in SOX, which specifies that members of a board’s audit committee must be
outside, independent directors (Klein, 2003).
Outside directors have been shown to strongly resist certain actions that may have
benefited corporate executives at the expense of shareholders. For example, Beasley (1996)
investigated 150 firms, half having fraudulent issues pertaining to their financial statements and
half without such incidence of financial fraud. He found that the no-fraud firms had a higher
percentage of outside directors to inside directors. A study by Beekes, Pope, and Young (2004)
found that outside directors were more likely to publicly acknowledge bad news relating to
corporate earnings than were inside directors.
Some researchers believe that outside directors are better monitors of financial reporting
(Klein, 2003) which can be associated with a range of other benefits. For example, firms with a
greater proportion of outside directors tend to have better corporate credit ratings (Ashbaugh-
Skaife, Collins, & LaFond, 2006). Outside directors who were experienced executives are more
likely to resist greenmail (Kosnik, 1987; Kosnik, 1990), which is the private repurchase of
company stock at a premium price paid to an apparent corporate raider to terminate what
management considers a hostile takeover attempt. Additionally, outside directors are more likely
to tie executive compensation to market performance (Conyon & Peck, 1998) rather than to
increases in firm size through corporate acquisitions (Wright, Kroll, & Elenkov, 2002). Outside
directors have also been shown to more carefully monitor acquisitions, particularly when they

7
involve diversifying away from core competencies that are not in the best long-term interest of
firms (Zajac & Westphal, 1996).
Board insiders may, for personal pecuniary reasons, engage in risks that are absent of
genuine growth opportunities (Wright, Ferris, Sarin, & Awasthi, 1996). Providing favored
subordinates with implicit status rewards might also be a strategic maneuver of the CEO/COB to
expand power over the board (Baysinger & Butler, 1985). In general, outside directors have the
capacity to be more effective monitors of management behavior (Bhagat & Black, 2002; Kaplan
& Minton, 1994) as suggested by our hypothesis:
H2: Firms with a higher percentage of outside directors will be associated with stronger
positive performance in each of the five areas of performance measurement.
The proportion of outside directors was measured as the percentage of outside directors
on the board. To identify outside directors, we compared the board directors with executives of
each firm.
Gender/Diversity
Resource-dependence theory views organizations in terms of their ability to attract,
utilize, and maintain a stream of resources from their external environment (Pfeffer & Salancik,
1978). Corporate boards are part of the resource stream since they bring bundles of knowledge,
experience, ideas, and professional contacts (Carpenter, Geletkanycz, & Sanders, 2004). Boards
that include women and individuals of varying races, ethnicities, and other minority
characteristics broaden a firm’s resources and augment the range of perspectives for the
problem-solving and strategic planning process (Ruigrok, Peck, & Tacheva, 2007). We rely on
gender as a measure of diversity.
Historically, women and minorities have not been strongly represented in corporate
governance. However, the situation began to change slightly in the 1990s when an appreciable
increase in the number of women serving on corporate boards began to occur (Farrell & Hersch,
2005). Female board members have since brought a new perspective to boards’ deliberation
process as well as inspiring workforce diversity (Carter, et al., 2003). Even prior to the 1990s it
was noted that once on corporate boards, women were proactive and willing to sit on important
action committees (Kesner, 1988). A high level of board diversity (both women and minorities)
has been found to be positively related to profit levels (Van der Walt, Ingley, Shergill, &
Townsend, 2006), greater returns on equity (ROE), larger total returns to shareholders (Burke,
2000; Farrell & Hersch, 2005), and greater returns on assets (ROA) (Carter, et al., 2003).
In addition to financial benefits, women have been associated with stronger satisfaction
of organizational commitments (Siciliano, 1996) and a social balance in governance oversight
(Erhardt, Werbel, & Shrader, 2003). The positive influences of women board members have not
been lost on nominating committees. Although the size of corporate boards has decreased, the
number of women serving on those boards has increased (Farrell & Hersch, 2005). This leads to
our next hypothesis:
8
H3: Firms with a greater proportion of female to total directors will be associated with
stronger financial performance in a cross-section of industries in each of the five
measurement categories.
Gender was identified by several sources such as annual reports, director biographies, and
company Websites. The number of female directors was then divided by total number of
directors.
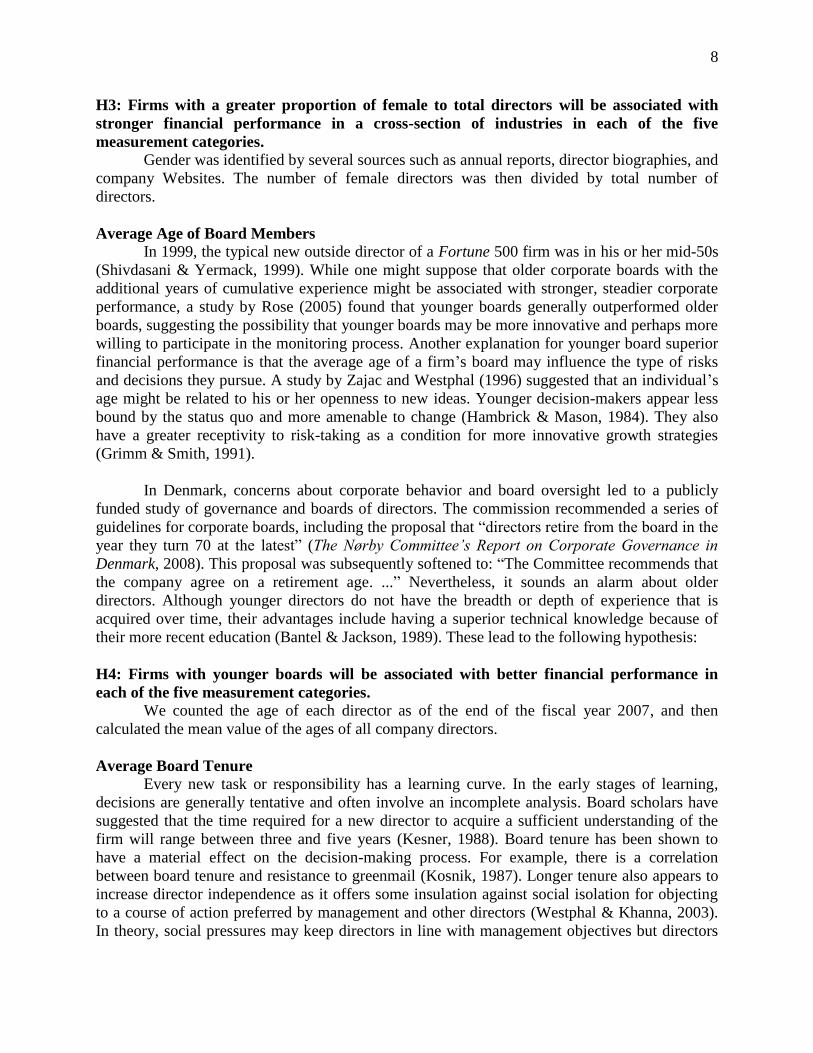
Average Age of Board Members In 1999, the typical new outside director of a Fortune 500 firm was in his or her mid-50s
(Shivdasani & Yermack, 1999). While one might suppose that older corporate boards with the
additional years of cumulative experience might be associated with stronger, steadier corporate
performance, a study by Rose (2005) found that younger boards generally outperformed older
boards, suggesting the possibility that younger boards may be more innovative and perhaps more
willing to participate in the monitoring process. Another explanation for younger board superior
financial performance is that the average age of a firm’s board may influence the type of risks
and decisions they pursue. A study by Zajac and Westphal (1996) suggested that an individual’s
age might be related to his or her openness to new ideas. Younger decision-makers appear less
bound by the status quo and more amenable to change (Hambrick & Mason, 1984). They also
have a greater receptivity to risk-taking as a condition for more innovative growth strategies
(Grimm & Smith, 1991).
In Denmark, concerns about corporate behavior and board oversight led to a publicly
funded study of governance and boards of directors. The commission recommended a series of
guidelines for corporate boards, including the proposal that “directors retire from the board in the
year they turn 70 at the latest” (The Nørby Committee’s Report on Corporate Governance in
Denmark, 2008). This proposal was subsequently softened to: “The Committee recommends that
the company agree on a retirement age. ...” Nevertheless, it sounds an alarm about older
directors. Although younger directors do not have the breadth or depth of experience that is
acquired over time, their advantages include having a superior technical knowledge because of
their more recent education (Bantel & Jackson, 1989). These lead to the following hypothesis:
H4: Firms with younger boards will be associated with better financial performance in
each of the five measurement categories.
We counted the age of each director as of the end of the fiscal year 2007, and then
calculated the mean value of the ages of all company directors.
Average Board Tenure Every new task or responsibility has a learning curve. In the early stages of learning,
decisions are generally tentative and often involve an incomplete analysis. Board scholars have
suggested that the time required for a new director to acquire a sufficient understanding of the
firm will range between three and five years (Kesner, 1988). Board tenure has been shown to
have a material effect on the decision-making process. For example, there is a correlation
between board tenure and resistance to greenmail (Kosnik, 1987). Longer tenure also appears to
increase director independence as it offers some insulation against social isolation for objecting
to a course of action preferred by management and other directors (Westphal & Khanna, 2003).
In theory, social pressures may keep directors in line with management objectives but directors

9
with longer tenure appear less constrained. Interestingly, not only has longer tenure been shown
to improve financial performance but also board members who share similar tenure tend to
develop a sense of camaraderie and collectively they are better able to evaluate top management
proposals (Kosnik, 1990). However, longer average tenure does not necessarily suggest that
tenure homogeneity is most desirable. Heterogeneity of board tenure may ensure a greater influx
of new ideas for dealing with previously unforeseen threats or new opportunities. Hence, our
next hypotheses:
H5a: Firms whose boards have longer average tenure will be associated with a stronger
positive performance in each of the five areas of measurement.
H5b: Boards with heterogeneous tenure will be associated with positive performance in
each of the five areas of measurement.
Board director tenure refers to the number of years an individual has been a member on
the board of directors. To measure the tenure of each director, we found how long each director
had served on the board and averaged their tenure. Tenure heterogeneity was measured as
coefficients of variation (their respective standard deviations divided by their means). Allison
(1978) reviewed inequality measures and found that coefficient of variation is preferred to
standard deviation or variance for interval-level variables because these are sensitive to relative
rather than absolute differences (Allison, 1978).
Board Size The size of the board has been shown to influence its ability to oversee corporate
governance. Larger boards often display dysfunctional characteristics (Jensen, 1993; Khanchel,
2007) while smaller boards are more effective in carrying out their governance oversight
responsibilities (Lipton & Lorsch, 1992). Hermalin and Weisbach (2003) concluded that
although the empirical literature does not infer a relationship between board composition and
firm performance, board size is negatively related to corporate performance. For instance,
Yermack (1996) found that profitability and financial efficiency ratios decrease as a board’s size
increases, while Eisenberg, Sundgren, and Wells (1998) similarly discovered that an increase in
board size can be associated with a decrease in firm value.
There are various explanations as to why the size of the board might impact a firm’s
financial performance. Board size may reflect the complexity of a firm’s environment (Sanders
& Carpenter, 1998) which is inherently challenging. Board size also influences it cohesiveness
(Barnhart, et al., 1994). Although large boards may increase the quality of decision-making since
they offer a broader array of perspectives, their size may hinder the ability to reach a consensus
(Forbes & Milliken, 1999). Similarly, large boards are less involved in strategic decision-making
(Judge & Zeithaml, 1992) and make it difficult to make strategic changes (Golden & Zajac,
2001). These lead to the following hypothesis:
H6: Firms with smaller boards will be associated with positive performance in each of the
five measurement categories.
Total number of directors was used to measure the size of the board.

10
Occupational Expertise Differences among corporate directors are most properly viewed in terms of their
experience and expertise (Baysinger & Butler, 1985). Rather than considering the board
exclusively in terms of being a uniform group and focusing specifically on structural and
demographic characteristics, researchers should also integrate measures of board diversity by
investigating occupational and functional backgrounds (Goodstein, Gautam, & Boeker, 1994).
Excluding occupational expertise from the investigation can be problematic since the
background and experience of board members can influence their understanding of complicated
business transactions and bias their decisions (Kesner, 1988). For instance, educators (frequently
college presidents) are added to boards but their lack of business experience could impair their
understanding of business intricacies and negatively sway their board contribution. Average
board tenure may also influence the decision-making process. Kosnik (1990) found that as
average board tenure increases, the occupational expertise of board members becomes more
homogeneous perhaps suggesting a reduction in the range of decision-making perspectives.
Studies that have investigated the influence of occupational expertise have frequently
focused on individuals with banking and/or other financial expertise. While there is wide
agreement that banking/financial board members influence debt ratios, there is some
disagreement about the actual direction of that influence. Byrd and Mizruchi (2005) linked them
to negative effects on debt ratios (i.e., higher levels of debt) and Mizruchi, Sterns, and Marquis
(2006) linked them to a firm’s continued borrowing. Stearns and Mizruchi (1993) found the
presence of money market bankers or investment bankers on corporate boards to be positively
associated with a firm’s short-term borrowing. A study by Kroszner and Strahan (2001) agreed
that these individuals influence debt ratios but they disagree on the direction, finding that
banking/financial expertise are associated with a low reliance on short-term financing.
Boards with banking/financial expertise have been linked to market advantages and to
consistent financial reporting. For example, Krosner and Strahan, (2001b) found that bankers and
others with financial experience on corporate boards are associated with stable stock returns and
Agrawal and Chadha (2005) found them to be associated with a lower incidence of restated
earnings. These lead to our final hypotheses:
H7a: Firms with a greater number of educators on their board will be associated with
lower levels of performance in each of the five measurement categories.
H7b: Firms with a greater number of bankers, financial, and financial professionals on
their board will be associated with lower levels of leverage.
H7c: Boards that have greater heterogeneous occupational expertise will be associated with
a positive performance in each of the five measurement areas.

11
We divided occupational expertise into education, finance, and others. We classified each
executive’s occupational expertise into one of these categories based on each director’s
biography which is available through diverse public sources. To calculate the percentage of
directors with education expertise, the number of directors who have worked for a college or
university was divided by the total number of directors. To calculate the percentage of directors
with finance expertise, the number of directors who have worked for a financial institution, bank,
or accounting firm was divided by the total number of directors. Occupational expertise
heterogeneity was calculated using the Herfindahl-Hirschman heterogeneity index which has
often been used for categorical variables (Blau, 1977). This index is calculated as 1- i
2,
where pi is the proportion of directors in the ith
category. The index can have values from 0 to 1,
with values close to 1 indicating heterogeneity in occupational expertise among directors. On the
other hand, values close to 0 indicate homogeneity in occupational diversity.
Dependent Variables
As mentioned previously, this study separately examines five performance measures as
the dependent variables to expand our understanding of effects that board characteristics have on
diverse performance measures. For each dependent variable, we calculated the change from 2006
to 2007.
Revenue
Revenue is a measure of a firm’s size. Change in revenue is a key measure of a firm’s
performance (Chowdhury & Wang, 2009) as well as generally considered to be a primary driver
of corporate profitability. We calculate firm revenue growth in 2006 and 2007 and then calculate
the change of revenue growth from 2006 to 2007.
Return on Assets (ROA)
Return on assets is both a measure of profitability and asset utilization and has been used
in a number of recent studies (c.f., Byrd & Mizruchi, 2005; Erhardt, et al., 2003; McDonald,
Khanna, & Westphal, 2008; Rose, 2005; Sanders & Hambrick, 2007). The profit earned for each
dollar of assets invested in the business can be compared on a year-over-year basis and to an
industry-wide average to assess how effectively the corporate assets were used to generate
profits. We calculated changes in the ROA by comparing each firm’s ROA in 2006 and 2007.
Financial Leverage
Financial leverage is a measure of the extent to which a firm relies on creditors for
funding. Firms use financial leverage as a means of increasing investment returns but excessive
leverage can be problematic. We selected the debt-to-asset ratio to assess financial leverage.
Financial institutions use debt ratios as one measure of a firm's credit worthiness and they prefer
borrowing companies to have a lower ratio (Stearns, 1986). We compute each firm’s debt-to-
assets ratio in 2006 and 2007 to obtain relative changes.
Market Price to Book Ratio
The price-to-book value is a market-based measure (McDonald, Khanna, & Westphal,
2008) that is an important component of the corporate performance assessment process (Beekes,
et al., 2004). It adds a market confidence dimension to accounting measures and has been
documented to be an indicator of long-term performance (Fama & French, 1992). It is also

12
preferable to the commonly-used Tobin’s “q” measure since it is directly observable and easily
measured (Barnhart, et al., 1994; McGahan, 1999). Tobin’s “q” has subjective elements that
have stimulated a fair number of critics. For example, Barnhart, et al. (1994) concluded that the
“q” may have consistency problems since it is not directly observable and its operational
definitions are not agreed upon. We calculate the price-to-book ratio by dividing fiscal year
closing stock price by the per share equity in 2006 and 2007. Then we calculate the growth.
Free Cash Flow to Net Income
Operating cash flow, or the ability of a corporation to produce funds from its routine
operations, is important to its sustained viability (Ittner, et al., 1997; Ullmann, 1985). Free cash
flow is derived from operating cash flows. Free cash flow cannot be observed directly (Gibbs,
1993), but it is commonly computed by deducting the cost of acquiring necessary capital assets
and cash dividends from operating cash flow. Firms with substantial free cash flow are able to
gamble on promising but currently unprofitable projects. However, exuberance over free cash
flow may lead management to engage in over-diversification and other unproductive activities
(Jensen, 1986). In fact, there is sufficient evidence to suggest that firms with very high free cash
flow actually benefit less from revenue increases than those with smaller amounts of free cash
flow (Brush, Bromiley, & Hendrickx, 2000). In other words, profitability suffers. Perhaps the
strategic gambling associated with high cash flow unduly increases cost and expense loads.
Although previous studies (c.f., Baliga, Moyer, & Rao, 1996) have compared cash flows to
revenue (sales), we relied on the Jensen (1986) hypothesis and the findings of Gibbs (1993) and
Brush, et al. (2000) in computing the ratio of free cash flow to net income. We subtract capital
expenditure and cash dividends from operating activity net cash flow to calculate free cash flow.
This value was divided by net income. We then calculate the growth rate.
Control Variables
We included several control variables that may influence financial performance. First, we
controlled for firm size effect because economies of scale and market power may affect the
change of financial performance. The number of employees is one of the common measures of
firm size (Konrad & Mangel, 2000). We measured firm size as the logarithm of total number of
employees. Second, we controlled for lagged financial performance. The change of current
year’s performance may be influenced by the previous year’s performance level. Since our
performance measures are year-to-year changes, these base variables for the five performance
measures might explain relative magnitudes of change. Third, industry effect was controlled for
because it has been argued to be a major determinant of financial performance and its changes
may vary across industries (Porter, 2008). For this reason, we used the two digit NAICS code to
classify our industry dummy variable since they are categorical.
Data Sources and Sample
We tested our hypotheses with data from Standard and Poor’s (S&P) 500 companies.
This study focuses on S&P 500, the most widely-followed index of large-capitalization U.S.
securities and is considered to be an indicator of the state of the American economy. We
obtained the S&P 500 index as of December 31, 2007 and randomly selected 200 companies. All
of our data were collected from the post-implementation of SOX. Our analysis was specifically
confined to the years of 2006 and 2007 to ensure the maximum length of time for SOX to take
effect. Consistent with Hermalin and Weisbach (1988), we restricted our analysis primarily to
13
non-regulated industries since boards of directors for regulated firms may be systematically
different from boards of directors of non-regulated firms (Baysinger & Zardkoohi, 1986;
Subhramanyam, Rangan, & Rosenstein, 1997). Therefore, we eliminated all financial
institutions, insurance companies, and real estate firms defined as SIC codes 6000-6799 and all
utilities (i.e., electric, gas, and sanitary services) defined within the 4900 SIC codes (Farrell &
Hersch, 2005).
Two university seniors collected demographic and board configuration data. They used
diverse public archival sources such as annual reports, 10Ks, company Websites, magazines, and
news releases to gather information on each firm’s board of directors. One doctoral student
checked the data and corrected errors. We collected financial performance data from
COMPUSTAT for 2006 and 2007 to measure changes of financial performance over the period.
Firms with missing data were excluded from the sample. Final sample size varies from 185 to
188 because the number of firms with missing data differs across dependent variables. The final
sample of companies operates in 20 different two-digit North America Industry Classification
System (NAICS) industries.
RESULTS
We used ordinary least square (OLS) regression analysis in SPSS (Windows 13.0
version) to test our hypotheses. Before conducting the main analyses, we checked assumptions
for multiple regression analysis. First, no extreme outlier was detected through graphical
representation of data. The data shows that some variables do not meet normality assumption.
We corrected this problem as follows: logarithm transformation was used for previous year sales,
previous year ROA, tenure diversity, price to book ratio, and number of employees; square root
transformation was used for average tenure; and inverse transformation was employed for
outside ratio, gender ratio, and percentage of directors with education background. The
plus/minus signs were corrected for the inverse transformed variables so that we can properly
interpret the results. Graphical plots with these transformed variables showed that there is no
major concern about linearity assumptions. We also checked for multicollinearity with variance
inflation factors (VIFs). The VIF values were less than 2 for all the variables we included in the
regression model. These VIF values indicate that multicollinearity is not a problem for this
analysis as the VIF values are below the recommended cutoff of 10 (Cohen & Cohen, 2003).
Table 2 shows descriptive statistics and correlations for all variables.

14
TABLE 2
Descriptive Statistics and Pairwise Pearson Correlations Mean SD 1 2 3 4 5 6 7 8 9 10
1. Revenue growth
change -.07 .31 1
2. ROA change -.00 .08 -.05 1
3. Finance leverage
change .02 .14 .06 -.00 1
4. Free cash flow
change .97 7.58 .06 .13 -.01 1
5. Price to book ratio change
-2.01 22.70 .15* .05 -.10 .01 1
6. Duality .65 .48 -.03 .16* -.05 .03 -.04 1
7. Ratio of outside directors
.81 .10 -.06 -.06 -.20** .05 -.04 .22** 1
8. Ratio of Female
directors .14 .09 -.10 .10 -.11 .16* -.08 .02 .06 1
9. Average age 59.90 3.68 .17* .15* .00 .01 -.02 .02 .04 -.02 1
10. Average tenure 7.87 3.27 .12 .16* .14* -.03 .00 -.10 -.36** -.00 .36** 1
11. Tenure heterogeneity .74 .26 .04 .11 -.08 .04 .08 -.08 -.04 .09 -.14* .13 12. Board size 10.48 2.15 .09 -.01 -.28** -.07 .09 .03 .22* .19* .09 .04
13. Ratio of directors
with education expertise
.08 .09 -.08 .12 -.08 -.03 .01 -.04 -.07 .17* .16* .01
14. Ratio of directors with finance
expertise
.36 .17 -.04 -.06 .03 .02 -.14 -.15* -.03 -.03 -.17* -.18*
15. Expertise diversitya .47 .12 .08 .02 -.09 -.01 -.00 -.13 -.01 .16* .06 -.02 16. Number of
employees 36.15 48.92 .12 -.00 -.06 -.04 .06 .15* .05 .08 .02 .101
17. Previous year sales net ($million)
7906 18181 -.10 .01 -.09 -.04 .03 .16* .18* .11 .02 -.11
18. Previous year ROA .02 .08 .07 -.27** .34** -.13 -.19* -.06 -.09 -.14 .06 .04
19. Previous year
financial leverage -.02 .14 -.03 -.01 -.25** .01 -.06 .04 .26** .21** -.04 -.16*
20. Previous year free
cash flow to income -.85 7.46 -.06 -.13 .02 -.98** -.01 -.03 -.05 -.16* -.01 .02
21. Previous year price
to book ratio 2.85 13.60 -.17* -.04 .07 .00 -.95** .04 . 06 .11 -.00 -.02
a While we hypothesize about homogeneity, we actually measure heterogeneity (i.e., diversity).
*Correlation is significant at the 0.05 level (2-tailed).
**Correlation is significant at the 0.01 level (2-tailed).
TABLE 2
Descriptive Statistics and Pairwise Pearson Correlations (Continued)
11 12 13 14 15 16 17 18 19 20 21
12. Board size .16* 1
13. Ratio of directors
with education
expertise
-.06 .08 1
14. Ratio of directors
with finance expertise -.03 -.16* -.06 1
15. Expertise diversity .01 .15* .49** .34** 1 16. Number of employees .04 .21** .03 -.15* .02 1
17. Previous year sales
net ($million) -.01 .26** .03 -.15* -.04 .42** 1
18. Previous year ROA -.28** -.23** -.10 .06 -.08 -.03 -.01 1
19. Previous year
financial leverage -.03 .21** .11 -.04 .19* .12 .14 -.20* 1
20. Previous year free
cash flow to income -.04 .03 .03 .00 -.01 .04 .04 .13 -.03 1
21. Previous year price to book ratio
-.13 -.12 -.01 .14 .00 -.06 -.04 .25** .13 -.00 1
*Correlation is significant at the 0.05 level (2-tailed).
**Correlation is significant at the 0.01 level (2-tailed).

15
We used hierarchical regression analysis in two comparison models for each firm
performance variable. In the first model, the number of employees and industry dummy variables
were entered to control for firm size effect and industry specific effect on firm performance. In
the second model, the hypothesized variables are also entered to show how much variance they
explain over the control variables. Table 3 presents the results of our multiple regression
analyses for the second model.2 The R-square change in the second models over the control
models showed our hypothesized board of director compositions are significant in explaining
changes in revenue, ROA, financial leverage, and free cash flow-to-income during 2006-2007;
they do not, however, explain changes in price-to-book ratios during the same time period.
Moreover, initial levels of sales, ROA, and free cash flow-to-income are also significant in
explaining the subsequent year’s percent increase. We examine each hypothesized board
characteristic further below.
TABLE 3
Results of OLS Multiple Regression Analysis for Each Performance Measurea
Variables (with hypothesized relationships in
parentheses)
Performance Measures
Revenue ∆ 06-07 ROA ∆ 06-07
Financial Leverage
∆ 06-07
Free Cash Flow-to-
Income ∆ 06-07
Price-to-Book Ratio
∆ 06-07a
Controls:
Industry dummies Included Included Included Included Included
Number of employeesb .009 (.023) -.011 (.007) -.013 (.012) -.057 (.133) .093 (1.064)
Hypotheses:
H1: Duality ( )d -.010 (.035) .044** (.015) -.012 (.026) .441 (.296) .818 (2.347)
H2: Ratio of outside directorsb ( ) -2.604 (3.069) -.210 (1.281) -1.349 (2.272) 1.996 (25.492) 40.313 (204.557)
H3: Ratio of female directorsb ( ) .588 (.856) .289 (.357) -.475 (.636) 4.669 (7.171) -83.981 (56.513)
H4: Average age ( ) .006 (.005) .001 (.002) -.001 (.004) -.007 (.041) -.089 (.326)
H5a: Average tenureb ( ) -.061† (.033) .031* (.014) .043† (.024) -.317 (.274) .069 (2.208)
H5b: Tenure heterogeneityb ( ) -.029 (.046) .011 (.019) -.041 (.033) .899* (.379) .650 (3.084)
H6: Board size ( ) .024** (.008) -.003 (.003) -.012* (.006) -.138* (.067) -.207 (.536)
H7a: Ratio of directors with education expertiseb
( ) -1.712* (.858) .392 (.359) -.088 (.624) 6.282 (7.127) 17.465 (57.628)
H7b: Ratio of directors with finance expertise
( ) -.218* (.106) .011 (.044) .022 (.077) .669 (.880) -5.966 (7.109)
H7c: Expertise heterogeneity ( ) .377* (.166) -.010 (.069) -.081 (.121) -.875 (1.371) 12.041 (11.035)
Base Measures:
Previous year sales netb ($million) -.045* (.022)
Previous year ROAb -1.867*** (.316)
Previous year financial leverage -.110† (.067)
Previous year free cash flow-to-incomeb -.999*** (.017)
Previous year price to book ratio -94.184*** (5.389)
Significance:
F 1.064 2.208*** 1.319 132.270*** 14.320***
R2 .175 .305 .208 .984 .742
∆ R2 (vs. control modelC) .122* .259*** .108* .846*** .568
N 187 188 188 187 186 a Standard errors are in parentheses;
b Transformed variables;
c Control model includes industry
effect and size effect; d Hypothesized relationship with dependent variables
† p < .1 *P < .05 ** p < .01 ***p < .001

16
Hypothesis 1 predicts CEO/COB duality will be positively related to stronger financial
performance. Our empirical result shows that the coefficient for CEO/COB duality is positive
and statistically significant with ROA change (β= .044, p < .01). Hence, when the CEO also
serves as the board chairperson assets are more efficiently utilized in that the firm’s ROA is
likely to increase. Thus, hypothesis 1 is partially supported.
Hypotheses 5 dealt with board tenure. Hypothesis 5a predicts that average tenure of board
of directors will have a positive influence on financial performance. Our empirical result shows
that the coefficient for average tenure of board members is positively and statistically significant
with ROA change (β =.031, p < .05). Hence, as board members gain experience with the
company, familiarity with their responsibilities, and comfort with working with each other the
firm is more likely to efficiently utilize its assets. Thus, hypothesis 5a is partially supported.
Hypothesis 5b predicts a positive relationship between tenure heterogeneity among board
members and financial performance. Our empirical result shows that the coefficient for tenure
heterogeneity among board members is positive and statistically significant with the ratio of free
cash flow to net income change (β = .899, p < .05). This result implies that when directors’
tenures are dissimilar, a firm tends to maximize its unencumbered operating funds. Thus,
hypothesis 5b is partially supported.
Hypothesis 6 predicts that small size board will be associated with positive financial
performance. Our results provide mixed findings. First, contrary to our expectation board size is
positively related to revenue growth (β =.024, p <.01) in that larger boards actually tend to
actually increase revenues. Second, our results display a negative and statistically significant
relationship between board size and the financial leverage (β = -.012, p < .05) meaning that
smaller boards actually tend to increase their debt-to-asset ratio. Finally, our findings also show a
negative and statistically significant relationship between board size and the free cash flow-to-
net-income (β = -.138, p < .05) indicating that smaller boards do indeed tend to increase
unencumbered operating funds. Hence, these results partially support hypothesis 6.
Hypotheses 7 dealt with board expertise. Hypothesis 7a predicts a negative relationship
between the proportion of directors having education expertise and financial performance, and
indeed the results show a negative and statistically significant relationship between proportion of
board members with education expertise and the revenue growth (β = -1.712, p < .05) indicating
that revenue growth tends to decrease when boards are comprised of more directors having
education expertise. Thus, hypothesis 7a was partially supported. Hypothesis 7b predicts a
negative relationship between the proportion of directors with finance expertise and firm
leverage, but the results show a negative and statistically significant relationship between
proportion of board members with finance expertise and the revenue growth (β = -.218, p<.05)
indicating that revenue decreases with a greater number of bankers, accountants, and financial
professionals on boards. Hypothesis 7c predicts that boards having greater heterogeneous
occupational expertise will have greater performance and our results show a positive and
statistically significant relationship between board member heterogeneity and revenue growth (β
= .377, p < .05) indicating that revenue growth tends to increase when board members have
diverse occupational backgrounds. Thus, hypothesis 7c is partially supported.

17
Other hypotheses regarding ratio of outside directors, ratio of female directors, and
average age of directors were not supported. Figure 1 summarizes the findings of this study by
presenting only the variables deemed to be significant along with their means.
FIGURE 1
Significant Multiple Regression Results
(Means in Parentheses)
Discussion
The purpose of this study was to examine how corporate board composition might
influence firm financial performance in the current Sarbanes-Oxley environment. The SOX
securities legislation directly and significantly addresses board actions and responsibilities
(Klein, 2003) and there are clear and significant civil and criminal penalties associated with
boards that fail to comply (Buccino & Shannon, 2003). In other words, although board
composition and firm financial performance has been studied at length in the past, the new
legislation may have motivated a new set of behaviors by corporate boards. Our study is different
from others in not only timing but also in the number of measurement areas that we tested. Many
prior studies focused on one or two performance dimensions. Relying on a small number of
measures to investigate performance increases the potential for discovery oversight. We used
four accounting and one market measure.

18
Our results confirmed several of our hypotheses as well as provide several surprise
findings. Interestingly, despite previous findings that boards with a greater number of outside
directors have a positive influence on performance, we found no such relationship. We also
found no significant influence on performance associated with gender or average board age. On
the other hand, duality, occupational expertise, board size, and board tenure were among the
significant linkages to financial performance. We briefly note these four board characteristics.
Duality was shown to have a positive influence on growth in return on assets. While it is
difficult to fully understand this relationship, we speculate that there may be more harmony
between corporate boards and executive management when the CEO is also the COB. Since
return on assets benefits shareholders in both profitability and in asset utilization, it is likely to be
a concern to the board. Additionally, executive compensation packages are frequently tied to
profitability (Conyon & Peck, 1998) which is a key component of the ROA measurement.
Board expertise was also found to influence performance in interesting ways. Boards
with educators as members were associated with negative influences on revenue growth. Since
many educators on corporate boards presumably have minimum exposure to the intricacies of
business transactions, it is possible that they may be decision-apprehensive and thus influencing
a slower, more conservative approach to corporate revenue expansion. We found that the ratio of
directors with finance expertise decreases revenue growth. While further research may be
necessary to explain this finding, one plausible way is to consider director’s approach to new
business opportunities. Revenue growth through market expansion often requires entrepreneurial
efforts. It is possible directors with finance expertise are more analytical and more sensitive to
risk that stockholders will bear. Thus, they are less likely to allow firms to take entrepreneurial
initiatives, which results in loss of opportunities for revenue growth. Our result shows that
heterogeneity of director expertise increases revenue growth. This findings show that diverse
ideas generated from diverse perspectives can help firms to identify new opportunities in firm
growth. Board size also influenced performance in interesting ways. As board size increases,
financial leverage as measured by the debt-to-asset ratio decreases. The literature suggests that
larger boards may hamper consensus building (Forbes & Milliken, 1999), thus debt-funded
projects may be a victim of board indecisiveness.
Our findings indicate that the board of directors with high average tenure is positively
related to ROA. Our conjecture to explain this finding is that the high tenure of BODs in a firm
may enable them to develop better understanding on the process, routine, and strategy of the
firm. They also become familiar with their roles and responsibilities as directors. This
understanding helps them to make better decisions on how to use the firm’s assets for the greater
profitability. Finally, boards with diverse tenure were found to be associated with a positive
influence on free cash flow (FCF). It is possible that heterogeneity of tenure leads to a greater
array of ideas thereby delaying action on certain capital projects. Since FCF is commonly
calculated as net income plus amortization/depreciation minus changes in working capital and
capital expenditures, delayed capital expenditures would lead to greater free cash flow.

19
Limitations and Suggestions for Future Research
As with any research, there are some inherent limitations with our findings. First, we
could find only limited support for our hypotheses. Also, even when we found statistically
significant results, they existed for only one or a couple of dependent variables. Furthermore, we
have a significantly inflated Type I error rate because of the relatively large number of
hypothesized relationships. However, even after using a modified Bonferroni adjustment
(Jaccard & Wan, 1996) to control for this, all the identified relationships are still statistically
significant. It may be constructive in future research to collapse the dependent variables into a
single comprehensive performance construct. As an example, a composite measure of
performance, like Tobin’s “q” (Tobin, 1969), could be used as the dependent variable.
The level of analysis could also be considered a weakness with the study. A critical
assumption in linear regression is the independence of error terms. However, the data within our
sample has a nested structure. As such, the businesses are nested within industries which are
nested within economic sectors. The error terms are not necessarily independent because of this
structure. Although we attempted to mitigate this weakness by using several control variables, it
may be worthwhile to evaluate the data with a program designed to correct for the nested
structure (e.g., hierarchical linear modeling).
In summary, although only a few of our hypothesized relationships were supported by the
data we were able to find preliminary support indicating some of the impacts that board
composition has on firm financial performance. The relationship between these variables has
garnered increased attention under the Sarbanes-Oxley environment. Undoubtedly the recent
economic meltdown will bring more attention to the relationship between corporate boards and
firm financial performance and we encourage other researchers to build on our findings to
develop even greater insights of how board composition influences firm financial performance.
1 More information on SOX can be found at http://www.sec.gov/spotlight/soxcomp.htm.
2 We only report the second model due to space limitation. The control model results are
available from authors upon request.

20
REFERENCES
Agrawal, A., & Chadha, S. 2005. Corporate governance and accounting scandals. Journal of
Law and Economics, 68: 371-406.
Allison, P. D. 1978. Measures of inequality. American Sociological Review, 43 (6): 865–880.
Ashbaugh-Skaife, H., Collins, D., & LaFond, R. 2006. The effects of corporate governance on
firms’ credit ratings. Science Digest, 42: 203-243.
Baldwin, C, Bagley, C., & Quinn, J. 2003. M&A legal context: Basic framework for corporate
governance. Harvard Business School Press, 9-803-200 Rev. October 30.
Baliga, B., Moyer, R., & Rao, R. 1996. CEO Duality and Firm Performance: What’s the fuss?
Strategic Management Journal, 17: 41-53.
Bantel, K., & Jackson, S. 1989. Top management and innovations in banking: Does the
composition of the top management team make a difference? Strategic Management
Journal, 10: 107-124.
Barnhart, S., Marr, M., & Rosenstein, S. 1994. Firm performance and board composition: Some
new evidence. Managerial and Decision Economics, 15 (4): 329-340.
Baysinger, B., & Butler, H. 1985. Corporate governance and the board of directors: Performance
effects of changes in board composition. Journal of Law, Economics and
Organizations, 1 (1): 101-124.
Baysinger, B., & Zardkoohi, A. 1986. Technology, residual claimants and corporate control.
Journal of Law, Economics, and Organization, 2 (2): 339-349.
Beasley, M. 1996. An empirical analysis of the relation between the board of director
composition and financial statement fraud. The Accounting Review, 71 (4): 443-465.
Beekes, W., Pope, P., & Young, S. 2004. The link between earnings timeliness, earnings
conservatism, and board composition: Evidence from the U.K. Corporate Governance,
12 (1): 47-59.
Berle, A., & Means, G. 1932/1968. The modern corporation and private property, New York:
Macmillan Publishing Co. (originally published in 1932).
Bhagat, S., & Black, B. 2002. The non-correlation between board independence and long-term
firm performance. Journal of Corporation Law, 27: 231-273.
Blau, P. M. 1977. Inequality and heterogeneity. Glencoe, IL: Free Press.

21
Boulton, W. 1978. The evolving board: A look at the board’s changing roles and information
needs. Academy of Management Review, 3: 827-836.
Boyd, B. 1995. CEO duality and firm performance: A contingency model. Strategic
Management Journal, 16: 301-312.
Brickley, J., Coles, J., & Jarrell, G. 1997. Leadership structure: Separating the CEO and
chairman of the board. Journal of Corporate Finance, 3: 189-220.
Brown, J. 2006. Criticizing the critics: Sarbanes-Oxley and quack corporate governance.
Marquette Law Review, 90 (2): 309-333.
Brush, T., Bromiley, P., & Hendrickx, M. 2000. The free cash flow hypothesis for sales growth
and firm performance. Strategic Management Journal, 21: 455-472.
Buccino, G., & Shannon, J. 2003. The changing role of the board of directors: Sarbanes-Oxley
reflects demands for increased security. Turnaround Management Association (available
at: http://www.turnaround.org/Publications/Articles.aspx?objectID=2672 accessed on
April 3, 2009).
Burke and M. Mattis (Eds.), Women on corporate boards of directors: 157-167. Netherlands:
Kluwer Academic Publishers.
Byrd, D., & Mizruchi, M. 2005. Bankers on the board and the debt ratio of firms. Journal of
Corporate Finance, 11: 129-173.
Carpenter, M., Geletkanycz, M., & Sanders, W. 2004. Upper echelons research revisited:
Antecedents, elements, and consequences of top management team composition. Journal
of Management, 30 (6): 747-778.
Carter, D., Simkins, B., & Simpson, W. 2003. Corporate governance, board diversity, and firm
value. The Financial Review, 38: 33-53.
Chowdhury, S., & Wang, E. 2009 Institutional activism types and CEO compensation: A time-
series analysis of large Canadian corporations. Journal of Management, 35 (1):36.
Cohen, J. Cohen, P. West. S. G., and Aiken L. S. 2003. Applied multiple regression/correlation
analysis for behavioral science (3rd
ed.). Mahwah, NJ: Lawrence Erlbaum Associates
Publishers.
Coles, J., & Hesterly, W. 2000. Independence of the chairman and board composition: Firm
choices and shareholder value. Journal of Management, 26 (2): 195-214.
Coles, J., McWilliams, V., & Sen, N. 2001. An examination of the relationship of governance
mechanisms to performance. Journal of Management, 27: 23-50.

22
Conyon, M., & Peck, S. 1998. Board control, remuneration committees, and top management
compensation. Academy of Management Journal, 41: 146-157.
Dalton, D., & Kesner, I. 1987. Composition and CEO duality in boards of directors: An
international perspective. Journal of International Business Studies, 18 (3): 33-42.
Dalton, D., Daily, C., Ellstrand, A., & Johnson, J. 1998. Meta-analytic reviews of board
composition, leadership structure, and financial performance. Strategic Management
Journal, 19: 269-290.
Donaldson, I., and Davis, J. 1991. Stewardship or agency theory: CEO governance and
shareholder returns. Australian Journal of Management, 16: 49-64.
Eisenberg, T., Sundgren, S., & Wells, M. 1998. Larger board size and decreasing firm value in
small firms. Journal of Financial Economics, 48 (4): 35-54.
Erhardt, N., Werbel, J., & Shrader, C. 2003. Board of director diversity and firm financial
performance. Corporate Governance, 11 (2): 102-111.
Fama, E., & French, K. 1992. The cross-section of expected returns. Journal of Finance, 47:
427-465.
Fama, E., & Jensen, M. 1983. Agency problems and residual claims. Journal of Law and
Economics, 26: 301-326.
Farrell, K., & Hersch, P. 2005. Additions to corporate boards: The effect of gender. Journal of
Corporate Finance, 11: 85-106.
Fligstein, N., & Brantley, P. 1992. Bank control, owner control, or organizational dynamics:
Who controls the large modern corporation? The American Journal of Sociology, 98 (2):
280-307.
Forbes, D., & Milliken, F. 1999. Cognition and corporate governance: Understanding board of
directors as strategic decision-making groups. Academy of Management Review, 24:
489-505.
Gibbs, P. 1993. Determinants of corporate restructuring: The relative importance of corporate
governance, takeover threat, and free cash flow. Strategic Management Journal, 14: 51-
68.
Golden, B., & Zajac, E. 2001. When will boards influence strategy? Inclination x power =
strategic change. Strategic Management Journal, 22: 1087-1111.
Goodstein, J., Gautam, K., & Boeker, W. 1994. The effects of board size and diversity on
strategic change. Strategic Management Journal, 15: 241-250.

23
Grimm, C., & Smith, K. 1991. Management and organizational change: A note on the railroad
industry. Strategic Management Journal, 12: 557-562.
Hambrick, D., & Mason, P. 1984. Upper echelon: The organization as a reflection of its top
managers. Academy of Management Review, 9: 193-206.
Hayward, M., & Hambrick, D. 1997. Explaining the premiums paid for large acquisitions:
Evidence of CEO hubris. Administrative Science Quarterly, 42: 103-127.
Hermalin, B., & Weisbach, M. 1988. The determinants of board composition. Journal of
Economics, 19 (4): 589-606.
Hermalin, B., & Weisbach, M. 2003. Boards of directors as an endogenously determined
institution: A survey of the economic literature. Economic Policy Review, 1: 7-26.
Ittner, C., Larcker, D., & Rajan, M. 1997. The choice of performance measures in annual bonus
contracts. The Accounting Review, 72 (2): 231-255.
Jaccard, J., & Wan, C. K. 1996. LISREL approaches to interaction effects in multiple
regression. Thousand Oaks, CA: Sage Publications.
Jensen, M. 1986. Agency costs of free cash flow, corporate finance, and takeovers. American
Economic Review, 76: 323-329.
Jensen, M. 1993. The modern industrial revolution, exit, and the failure of internal control
mechanisms. Journal of Finance, 48 (3): 831-880.
Judge, W., & Zeithaml, C. 1992. Institutional and strategic choice perspectives on board
involvement in the strategic decision process. Academy of Management Journal, 35:
766-794.
Kaplan, S., & Minton, B. 1994. Appointments of outsiders to Japanese boards: Determinants and
implications for managers. Journal of Financial Economics, 36 (2): 225-258.
Kesner, I. 1988. Directors’ characteristics and committee membership: An investigation of type,
occupation, tenure, and gender. Academy of Management Journal, 31: 66-84.
Kesner, I., & Johnson, R. 1990. An investigation of the relationship between board composition
and stockholder suits. Strategic Management Journal, 11: 327-336.
Khanchel, I. 2007. Corporate governance: Measurement and determinant analysis. Managerial
Auditing Journal, 22 (8): 740-760.
Klein, A. 2003. Likely effects of stock exchange governance proposals and Sarbanes-Oxley on
corporate boards and financial reporting. Accounting Horizons, 17 (4): 343-355.
24
Konrad, A., & Mangel, R. 2000. The impact of worklife programs on firm productivity.
Strategic Management Journal, 21: 1225-1238.
Kosnik, R. 1987. Greenmail: A study of board performance in corporate governance.
Administrative Science Quarterly, 32: 163-185.
Kosnik, R. 1990. Effect of board demography and directors’ incentives on corporate greenmail
decisions. Academy of Management, 33: 129-50.
Kroszner, R., & Strahan, P. 2001a. Bankers on boards: Monitoring, conflicts of interest, and
lender liability. Journal of Financial Economics, 62: 415-452.
Kroszner, R., & Strahan, P. 2001b. Throwing good money after bad? Board connections and
conflicts in bank lending. Working Paper Series (Alfred P. Sloan Foundation) The
Wharton Financial Institution Center; The Wharton School, University of
Pennsylvania, 02-12, August 2001.
Linck, J., Netter, J., & Yang, T. 2008. The effects and unintended consequences of the Sarbanes-
Oxley Act on the supply and demand for directors. Review of Financial Studies
(forthcoming), published online August 28.
Lipton, M., & Lorsch, J. 1992. A modest proposal for improved corporate governance. Business
Lawyer, 48 (1): 59-77.
Lorsch, J., & MacIver, E. 1989. Pawns or potentates: The reality of America’s corporate
boards. Boston: Harvard Business School Press.
Mace, M. 1986. Directors: Myth and reality. Boston: Harvard Business School Press.
McDonald, M., Khanna, P., & Westphal, J. 2008. Getting them to think outside the circle:
Corporate governance, CEOs’ external advice networks, and firm performance. Academy
of Management Journal, 51: 453-475.
McGahan, A. 1999. The performance of U.S. corporations: 1981-1994. Journal of Industrial
Economics, 47: 373-398.
McWilliams, V., & Sen, N. 1997. Board monitoring and antitakeover amendments. Journal of
Financial and Quantitative Analysis, 32 (4): 491-505.
Mizruchi, M., Stearns, L., & Marquis, C. 2006. The conditional nature of embeddedness: A
study of borrowing by large U.S. firms, 1973-1994. American Sociological Review, 71
(2): 310-333.
Non, M., & Franses, P. 2007. Interlocking boards and firm performance: Evidence from a new
panel database. Tinbergen Institute Discussion Paper, Rotterdam, The Netherlands.

25
Pearce, A., & Zahra, S. 1991. The relative power of CEOs and board of directors: Associations
with corporate performance. Strategic Management Journal, 12: 135-153.
Pearce, A., & Zahra, S. 1992. Board composition from a strategic contingency perspective.
Journal of Management Studies, 29 (4): 411-438.
Perry, T., and Shivdasani, A. 2005. Do boards affect performance? Evidence from corporate
restructuring. Journal of Business, 78 (4): 1403-1431.
Pfeffer, J., & Salancik, G. 1978. The external control of organizations: A resource-dependency
perspective of organizations. New York: Harper & Row.
Porter, M.E. 2008. The five competitive forces that shape strategy. Harvard Business Review,
86 (1) (January): 78-93.
Rose, C. 2005. The composition of semi-two-tier corporate boards and firm performance.
Corporate Governance, 13 (5): 691-701.
Ruigrok, W., Peck, S., & Keller, H. 2006. Board characteristics and involvement in strategic
decision making: Evidence from Swiss companies. Journal of Management Studies, 43
(5): 1201-1226.
Ruigrok, W., Peck, S., & Tacheva, S. 2007. Nationality and gender diversity on Swiss corporate
boards. Corporate Governance, 15 (4): 546-557.
Sanders, W., & Carpenter, M. 1998. Internationalization and firm governance: The roles of CEO
compensation, top team composition, and board structure. Academy of Management
Journal, 41: 158-178.
Sanders, W., & Hambrick, D. 2007. Swinging for the fences: The effects of CEO stock options
on company risk taking and performance. Academy of Management Journal, 50: 1055-
1078.
Sheppard, J. 1994. Strategy and bankruptcy: An exploration into organizational death. Journal
of Management, 20: 795-833.
Shivdasani, A., & Yermack, D. 1999. CEO involvement in the selection of new board members:
An empirical analysis. Journal of Finance, 54 (5): 1829-1853.
Siciliano, J. 1996. The relationship of board member diversity to organizational performance.
Journal of Business Ethics, 15: 1313-1320.
Stearns, L. 1986. Capital market effects on external control of corporations. Theory and Society,
15 (2): 45-75.

26
Stearns, L., & Mizruchi, M. 1993. Board composition and corporate financing: The impact of
financial institution representation on borrowing. Academy of Management Journal, 36:
603-618.
Subhramanyam, V., Rangan, N., & Rosenstein, S. 1997. The role of outside directors in bank
acquisitions. Financial Management, 26 (3): 23-36.
The Nørby Committee’s Report on Corporate Governance in Denmark. 2008. The Copenhagen
Stock Exchange Committee on Corporate Governance (available at
http://www.eogs.dk/graphics/Corporategovernance/CG%20recommendations%2015122008.pdf)
Tobin, J. 1969. A general equilibrium approach to monetary theory. Journal of Money Credit
and Banking, 1: 15-29.
Ullmann, A. 1985. Data in search of a theory: A critical examination of the relationships among
social performance, social disclosure, and economic performance of U.S. firms. Academy
of Management Review, 10: 540-557.
Useem, M. 2006. How well-run boards make decisions. Harvard Business Review (November):
130-138.
Van der Walt, N., Ingley, C., Shergill, G., & Townsend, A. 2006. Board configuration: Are
diverse boards better boards?” Corporate Governance, 6 (2): 129-147.
Van Ness, R., & Seifert, C. 2007. Boards of directors and corporate performance: An analysis
model. Journal of Business Research, 7 (3): 11-21.
Westphal, J., & Khanna, P. 2003. Keeping directors in line: Social distancing as a control
mechanism in the corporate elite. Administrative Science Quarterly, 48: 361-398.
Wright, P., Ferris, S., Sarin, A., & Awasthi, V. 1996. Impact of corporate insider, blockholder,
and institutional equity ownership on firm risk taking. Academy of Management
Journal, 39: 441-463.
Wright, P., Kroll, M., & Elenkov, D. 2002. Acquisition returns, increase in firm size, and chief
executive officer compensation: The moderating role of monitoring. Academy of
Management Journal, 45: 599-608.
Yermack, D. 1996. Higher market valuation of companies with a small board of directors.
Journal of Financial Economics, 40: 185-211.
Zajac, E., & Westphal, J. 1994. The costs and benefits of managerial incentives and monitoring
in large U.S. corporations: When is more not better?” Strategic Management Journal,
15: 121-142.

27
Zajac, E., & Westphal, J. 1996. Director reputation, CEO-board power, and the dynamics of
board interlocks. Administrative Science Quarterly, 41: 507-529.