board mission and goals - sdpbc web cms · board mission and goals ... arthur c. johnson, ph.d....
TRANSCRIPT


BOARD MISSION AND GOALS The School Board of Palm Beach County is committed to excellence in education and preparation of all our students with the knowledge, skills, and ethics required for responsible citizenship and productive employment.
LITERACY ACHIEVEMENT ENVIRONMENT CURRICULUM STAFF DEVELOPMENT MANAGEMENT PARTNERING

THE SCHOOL BOARD OF PALM BEACH COUNTY, FLORIDA
SUPERINTENDENT'S OFFICE 3340 FOREST HILL BOULEVARD, C-316 WEST PALM BEACH, FL 33406-5869 (561) 434-8200 FAX (561) 434-8571
ARTHUR C. JOHNSON, Ph.D. SUPERINTENDENT
THOMAS E. LYNCH CHAIRMAN
JODY GLEASON VICE CHAIRMAN
PAULETTE BURDICK WILLIAM G. GRAHAM DR. SANDRA S. RICHMOND DEBRA L. ROBINSON, M.D. SUSAN WHELCHEL
October 24,2001
Dear Parents, Staff, and Community:
The School District of Palm Beach County is pleased to present the Fiscal Year 2002-2006 Five Year Facility Plan and the FY 2002 Capital Budget. Like last year, this plan is evolutionary and is a continuation of previous Five Year Plans and builds on the Board approved FY 2001 plan.
It addresses current and projected space needs, meets Concurrency, as required, in August 2004, and continues our massive effort to address the Board's additional priorities for maintaining and upgrading older facilities. To meet concurrency, the District's new construction program is accelerated. It also requires boundary changes to balance enrollments to attain the 1 10 per cent or less enrollment at all schools and it challenges the District's construction management capabilities.
The magnitude and success of the capital programs is evident with the opening of seven new and replacement schools in August 2000, adding 6,600 new seats. Six new schools were opened in August 2001 with 7,800 new seats. Six new schools and six modernization/replacement schools will open in August 2002 with 8,240 new seats. From August 2000 to August 2002 we will increase the capacity of our school system by eighteen percent. At this time, our major modernization/replacement program is proceeding in accordance with the Board approved plan. We must continue this aggressive program to house the growing student population as supported by the recent release of the 2000 census data. Student enrollment is projected to grow in excess of 3,500 students annually.

The comprehensive modernization program for our older schools, major maintenance projects, projects to upgrade obsolete equipment, and upgrading technology have been well received by the community. In fact, this Five Year Plan requests a second needs assessment to evaluate the next wave of our older facilities for modernization. The Board must maintain these initiatives to assure facility equity for all constituents.
This Plan proposes the continuation of Certificates of Participation (COPS) funding to finance the difference between current revenues and expenditures. However, as our debt service increases, we should maintain our options for future revenue sources.
Overall, current projects have been completed on time and within budget supporting our commitment to the Palm Beach County community.
We look forward to a successful year.
Sincerely, /'
V Arthur C. ~ohg/on, Ph.D. Superintendent


TABLE OF CONTENTS
Alphabetical Listing of Schools
Overview of This Plan
Summary of Capital Improvement Plan
Summary of Estimated Revenue for Fiscal Years 2002 - 2006
Chapter 1 : Planning Context
Chapter 2: Facilities Planning Components
Chapter 3: Recommendations and Issues
Chapter 4: Planning Zones and Schools Data
Chapter 5: Project Description Forms
Chapter 6: Concurrency Service Areas and School Enrollment
Appendix A: Program Capacity Tables
Appendix B: Glossary of Terms
I
111
IV
M


Alphabetical Listing of Middle Schools Alphabetical Listing of High Schools
Page Bear Lakes .................................................................................................... 4-8 Boca Raton ................................................................................................ 4-26 Carver ....................................................................................................... 4-24 Christa McAuliffe ......................................................................................... 4-20 Congress .................................................................................................. 4-22
.................................................................................................... Conniston 4-1 4 Crestwood ................................................................................................... 4-1 0 Eagles Landing ...................................................................................... 4-30 H.L. Watkins ............................................................................................... 4-6 John F . Kennedy ...................................................................................... 4-36 Jefferson Davis ..................................................................................... 4-16 Jupiter ........................................................................................................... 4-2 Lake Shore ............................................................................................ 4-32 Lake Worth .................................................................................................. 4-1 8 Lantana ....................................................................................................... 4-1 8 Loggers Run ........................................................................................ 4-30 Middle School of the Arts ......................................................................... 4-38 Odyssey (96BB) .......................................................................................... 4-22 Okeeheelee ................................................................................................. 4-16 Omni ........................................................................................................... 4-28 Pahokee MiddleISr . (7-8) ............................................................................ 4-34 Polo Park Middle ........................................................................................ 4-12 Roosevelt .............................................................................................. 4-36 Watson B . Duncan .................................................................................... 4 4 Wellington Landings ............................................................................... 4-1 2 Western Pines ............................................................................................. 4-10 Woodlands .................................................................................................. 4-20
Page Alexander W . Dreyfoos School of the Arts ................................................. 4-38 Atlantic .................................................................................................... 4-24 Boca Raton ................................................................................................. 4-26 Boynton Beach (91 111) .............................................................................. 4-22
.................................................................................................... Forest Hill 4-14 Glades Central ............................................................................................ 4-32 John I . Leonard ........................................................................................... 4-16 Jupiter ........................................................................................................... 4-2 Lake Worth .................................................................................................. 4-18 Olympic Heights .......................................................................................... 4-30 Pahokee MiddleISr . (9-12) .......................................................................... 4-34 Palm Beach Gardens .................................................................................... 4-6 Palm Beach Lakes ........................................................................................ 4-8 Royal Palm Beach High ........................................................................ 4-10 Santaluces .................................................................................................. 4-20 Spanish River .............................................................................................. 4-28 Suncoast ..................................................................................................... 4-38 Wellington ................................................................................................ 4-12 William T . Dwyer .......................................................................................... 4 4
Special and Alternative Schools
.......................................................................................... Charter Schools 445 Delray Full Service Center .................................................................... 442 Gold Coast Community School ................................................................ 441 High Ridge .................................................................................................. 441 Indian Ridge School .............................................................................. 441 Inlet Grove (North Tech Ed Center) ............................................................ 444 Preschool Programs ................................................................................... 443 Roosevelt Service Center ........................................................................... 442 Royal Palm School ...................................................................................... 441 West Area School of Choice ....................................................................... 441 South Area Middle School of Choice .......................................................... 441 South Technical Education Center ............................................................. 4-44 West Technical Education Center ............................................................ 4-44
Dept. of Facilities Planning


OVERVIEW OF THIS PLAN
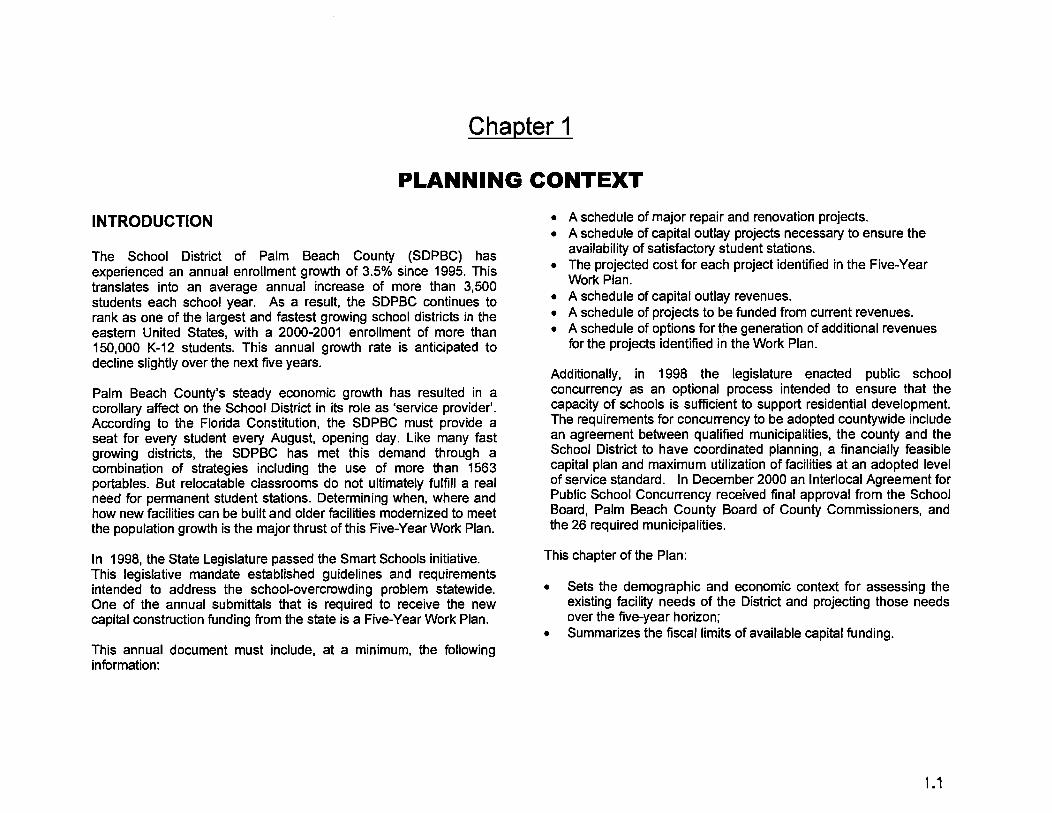
The Palm Beach County School District's Five-Year Work Plan has been developed in accordance with the requirements of Florida Department of Education guidelines. This Work Plan integrates the facilities planning program with the annual capital budgeting process and the District's educational programming strategies. The document contains 5 major sections.
Chapter 1 summarizes the economic forces and demographic trends that affect educational facilities planning for the School District of Palm Beach County (SDPBC). This chapter also highlights the fiscal considerations that are relevant to the development of the Work Plan, including information on the District's revenue sources, construction costs, fiscal climate, and the opportunities and constraints presented by Florida Statutes.
Chapter 2 describes facility-planning components as they relate to the Five-Year Work Plan. Outlined in this chapter are the enrollment forecasting methodology, formulas for capacity calculation, educational program considerations, and the basis for evaluation of facilities solutions.
Chapter 3 summarizes this year's request through 6 goals. It describes the facilities planning goals and strategies to reach them and summarizes the FY 2002-2006 recommendations for individual schools.
Chapter 4, organized by Planning Zone, provides enrollment information, facilities information, project proposals for individual schools, and a map of the school zones in a geographic sequence from north to south.
Chapter 5 contains the Project Description Forms (PDFs) which display pertinent information for all recommended projects in the Work Plan. It is important to note that although planning zone organization is used for presentation of information, planning decisions may cross these planning boundaries to meet program and facilities needs for all District students.
Chapter 6 contains the enrollment and utilization by Concurrency Service Area (CSA) tables. Also included is a table highlighting the material amendments to the FY 2001-2005 Capital Plan.

Summary of Capital Improvement Program
Prior to FY FY FY FY FY FY Project Total 2001 2001 2002 2003 2004 2005 2006 Beyond
Prior FY Approved Projects
Classrooms First
Lake Worth High Additions Ph 2 31,081 ,I 1.5 29,669,166 1,344,666
Subtotal Prior M Approved Projects 31,081,1l5 29,669,166 1,344,666
67,283
67,283
New Schools
Boynton Beach High (91-111) 51,270,488 48,194,595 2,867,448
Odyssey Community Middle (96-BB) 21,449,2@ 19,493,470 1,799,905
Subtotal Classrooms First 76$Fl9,@B 67,68B,065 4,667,353
Acreage Area Elem (00-Q)
Acreage Area Middle (99-HH)
Boca Raton Area Middle (98-GG)
BoyntonIDelray Area Elem (97-M)
BoyntonIDelray Area Elem (98-1)
Central WPB Area High (98-JJJ)
Discovery Key Elem (96-L)
Frontier Elem (96-8)
Jupiter Area Elem School (96-A)
Jupiter Area Middle (98-FF)
Okeechobee Elem School (96-D)
Pleasant City Area Elem (98-N)
Sunrise Park Elem (96-H)
Village Academy Secondary Level
W Palm Beach Area Elem (97-4
208,445
155,833
364,278
Dept. of Facilities Planning

Prior to FY Project TQQC 2001 2001
W Palm Beach Area Middle (98-EE) 22,125,758
West BocalDelray Area HS (01 -LLL) 51,211,116
West Boynton High (91-EEE) 51,211,1.46
West Lake WorthlLantana Elern(O1-R) 1 1,968,344
Western Communities Elem (96J) 12,530,402 12,028,954
Western Lake Worth Area Middle (98-11) 22,385,346
Subtotal New Schools 409;996$?34 120,100,821 69,573,647
2002 2003 2004 2005 2006 Beyond 21,694,192 431,566
Modernizations, Additions, and Replacements
Addison Mizner Elementary Remodeling 2,450,306 2,294,069 50,272
Atlantic High Modernization 48,886,047 100,000
Auditoriums-High Schools 15,057,5W)
Belvedere Elementary Modernization 8,9,@6
Boca Raton Elementary Modernization 10,323,425 225,709 9,734,938
Boca Raton High Modernization 49;5&193 2,934,695
Career Academies Modifications A,soOJ@ 1,500,000 1,000,000
Central Bus Compound ir;m$aSS Conniston Middle Modernization 21,495,929 19,424,695
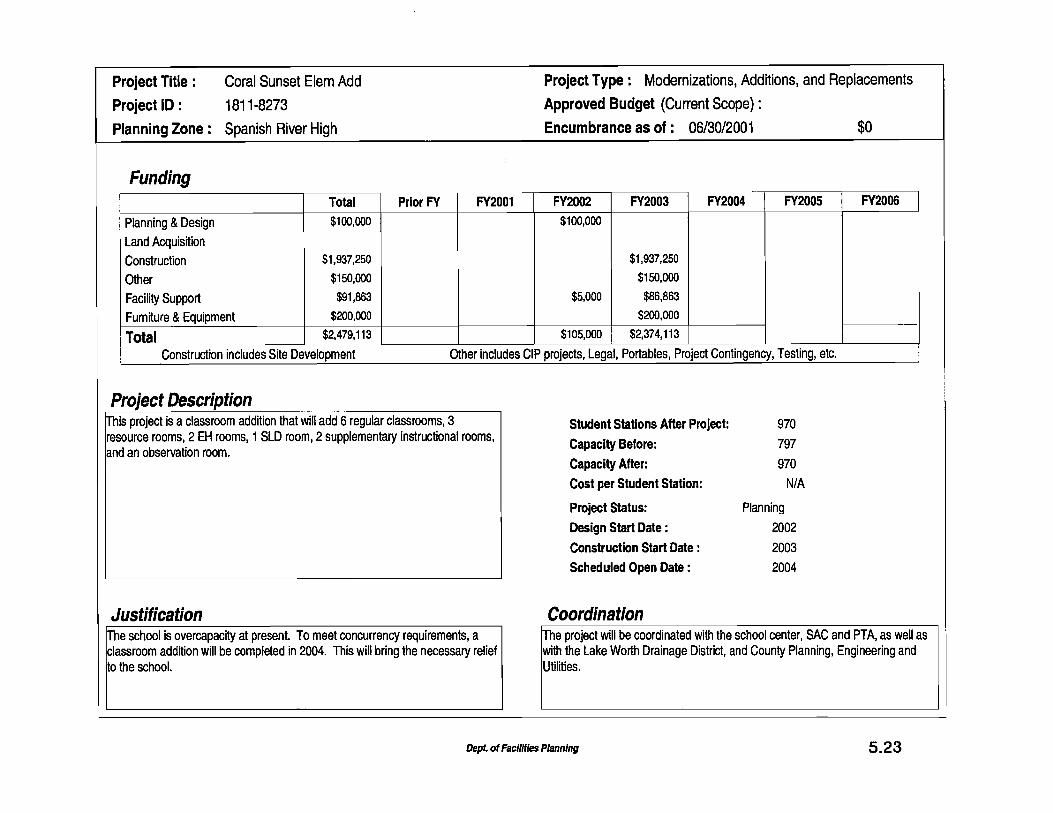
Coral Sunset Elem Add 2;470,113
Dreyfoos SOA Addition 5,637222 Forest Hill Elementary Modernization 12,232,362 170 11,777,968
Forest Hill High Modernization 38,013,091 304,518 2,095,240
Future School Modernizations 270,132,404 907,665
Greenacres Elementary Modernization 8,442,977
H.L. Watkins Middle School Modernization 21,928,000 100,000
Hammock Point Elem Add 1,322;912
John I. Leonard High Modernization 54,614JS Jupiter Elementary Modernization 10,175,353 9,200
Jupiter High Modernization 51,416,742 46,544,464 101,129
K-3 Class Size Reduction 9,929,759 7,054,617 2,518,282
Lake Park Elementary Modernization 10,253,209 9,764,628 6,995 I
Dept. of Facilities Planning
v

Prior to FY FY FY FY FY FY
Needs Assessments
Palm Beach Public Modernization
Palm Springs Elementary Modemization
Project Tatai 2001 2001 2002 2003 2004 2005 2006 Beyond
Palmetto Elementary Modernization
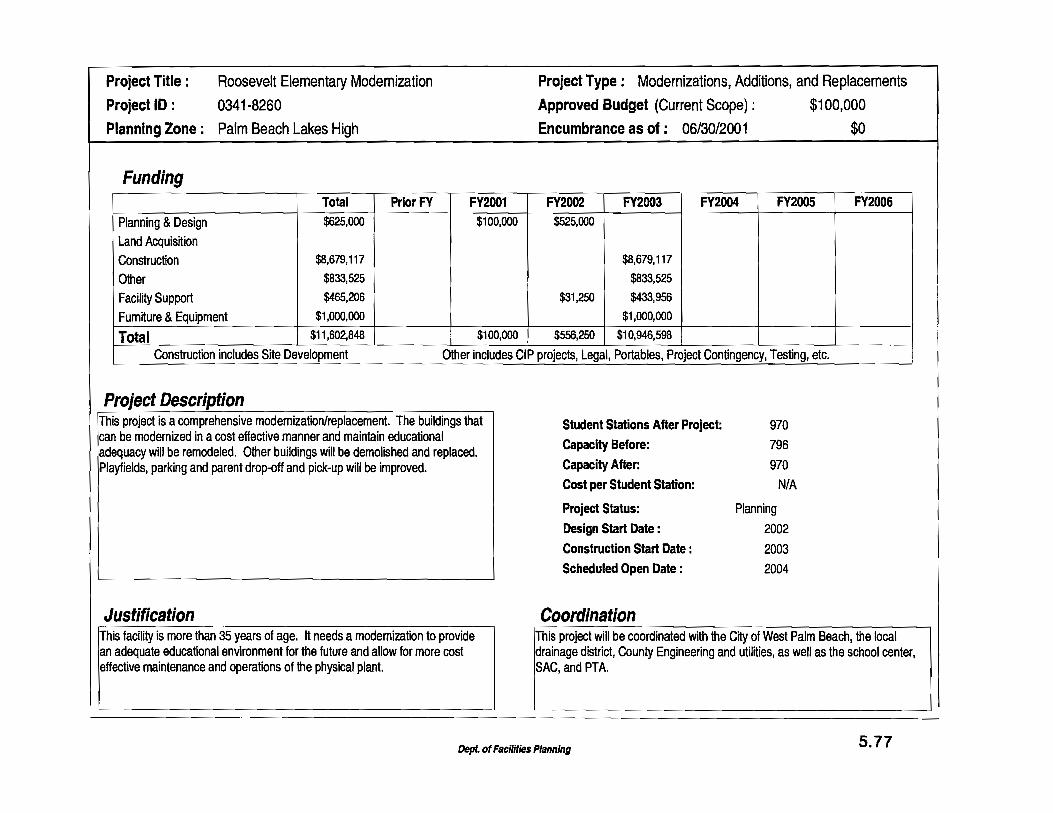
Roosevelt Elementary Modemization
S.D.Spady Elementary School Addition
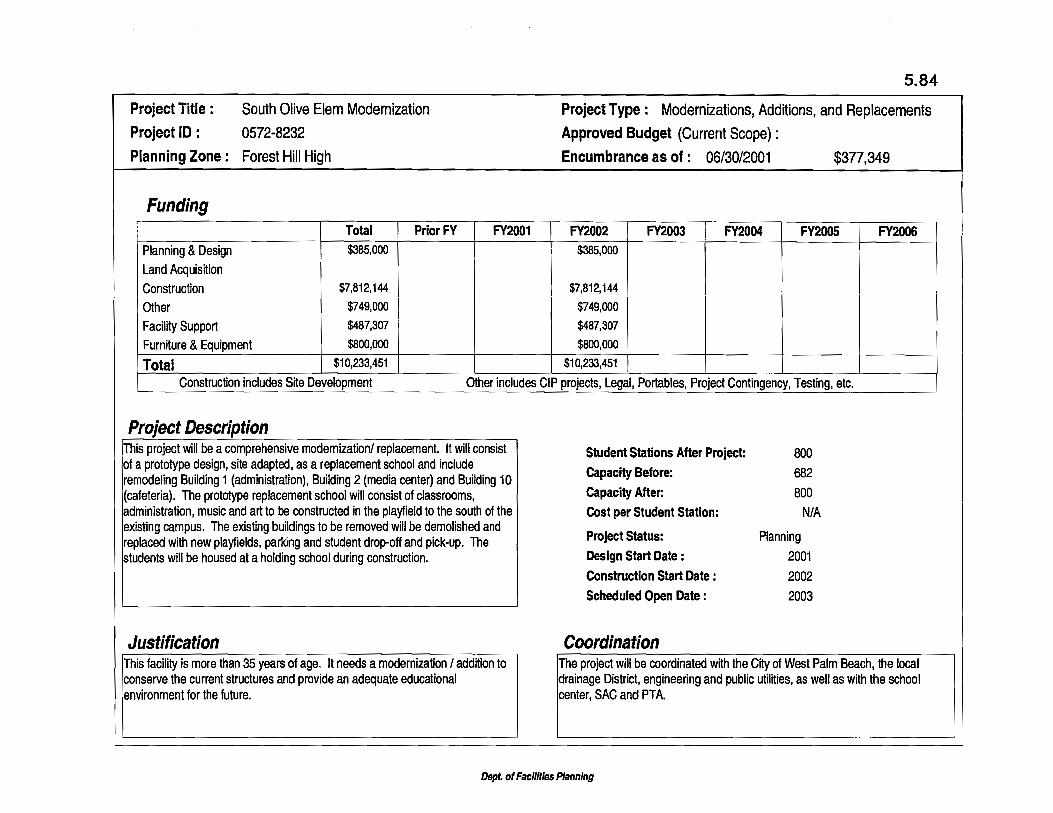
South Olive Elem Modernization
Stadiums - High Schools
U.B. KinseylPalmview Elem Modemization
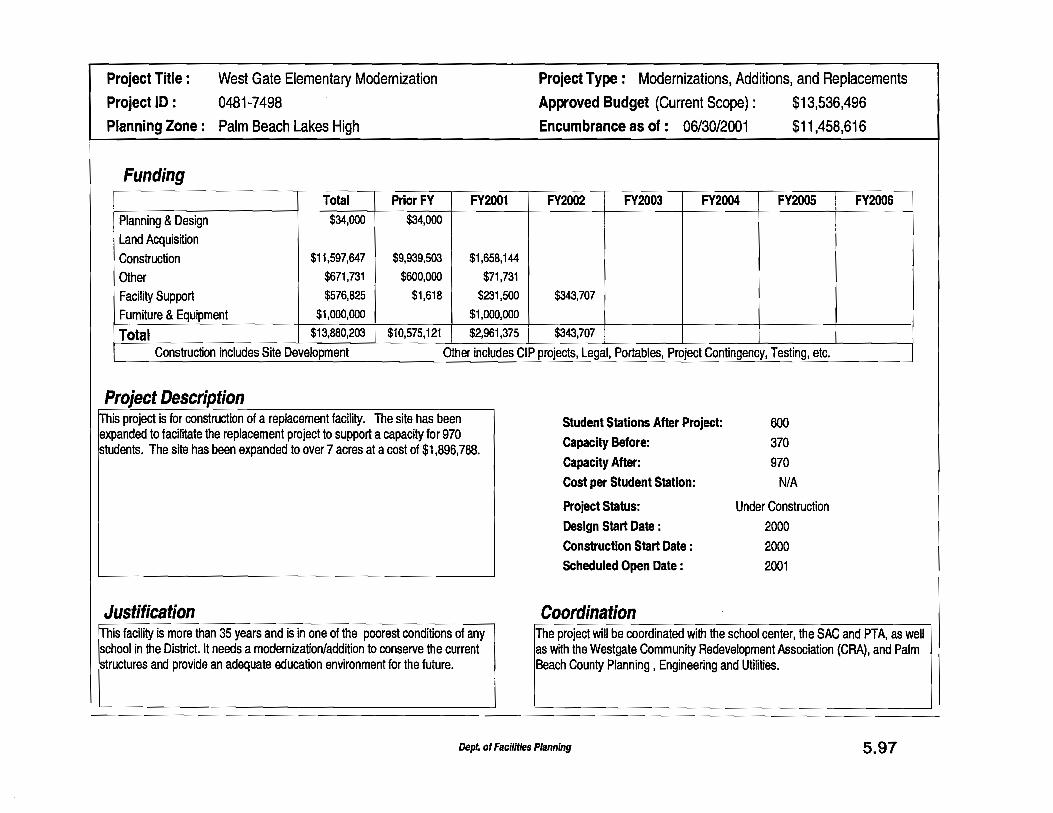
West Gate Elementary Modemization
Wm. T. Dwyer High - Classroom Addition
Lake Worth High Addition Ph 3 4,750,2OQ 4,524,000
Lantana Middle Replacement l6,559,597
Subtotal Modernizations, Additions, and Replacements 775j82b$49 93,339,594 58,619,707 b49,856,156 164,717,943 121,339,473 133,716,753 54,238,723
226,200
16,308,540 251,057
Site Acquisition
Major Maintenance
Site Acquisition - Existing Schools 13,?592,Q75 3,549,434 92,641
Site Acquisition - New Schools 61,436;446 3,993,875 13,574,350
Subtotal Site Acquisition 15,028,521 7,543,309 13,666,991
3,950,000 1,500,000 1,500,000 1,500,000 1,500,000
20,624,025 6,974,210 5,488,612 5,386,784 5,394,590
24,574,025 8,474,210 6,988,612 6,886,784 6,894,590
Dept. of Facllitles Planning
ADA Compliance 5,9$0,175 594,308 601,867
Facilities Management Misc. Projects 366,045 160,045
Fire & Life Safety Systems 7,019,632 970,828 571,804
Health Clinic Compliance 1,600,tND 100,000 500,000
Kitchen HVAC 2,7?0,437 80,074 1 ,I 90,363 Major Renovations & Systems Replacements 59,23f,W 534,267 7,186,829
Masonry Remediation Project 2,038,370 41 6,080 1,622,290
Minor Building AdditionsISpace Renovations 36,764318 2,452,093 1,948,225
PECO Maintenance Projects 36,759,148 5,784,465
897,000 933,000 969,000 1,015,000 900,000
50,000 50,000 50,000 50,000
1,178,000 1,161,000 1,138,000 1,000,000 1,000,000
500,000 200,000 100,000 100,000 100,000
1,500,000
10,110,000 10,900,000 10,400,000 10,300,000 9,800,000
6,979,000 6,113,000 6,329,000 6,614,000 6,329,000
7,412,011 6,341,479 5,855,527 5,674,801 5,690,865

Prior to FY FY FY FY FY FY
Title 9 Gender Equity
Traffic Improvements
Project a 2001 2001 2002 2003 2004 2005 2006 Beyond
Subtotal Maior Maintenance 2M.842243 8,796,432 25,810,728 1 35,206,011 33,524,479 32,832,727 32,745,001 31,866,865
Playground Replacement and Resurfacing 2,744,372 446,114 478,258
Roof Replacement 40,666869 2,539,584 4,961,885
Portables
1,170,000 350,000 100,000 100,000 100,000
4,560,000 6,726,000 7,291,200 7,291,200 7,297,000
Educational Technology
Relocatables - Leasing 4j0B,,806 52,938 295,868
Relocatables - Relocation 35,820,1@ 1,088,427 2,331,708
Relocatables - Replacement 33,2@047 5,285,047
Subtotal Portables 73,128,988 1,141,365 7,912,623
1,300,000 1,000,000 700,000 500,000 175,000
8,000,000 6,400,000 6,100,000 6,100,000 5,800,000
7,000,000 7,000,000 7,000,000 7,000,000
16,300,000 14,400,000 13,800,000 13,600,000 5,975,000
Application Systems Z,t$ift;SQg 1,921,181 5,102,108
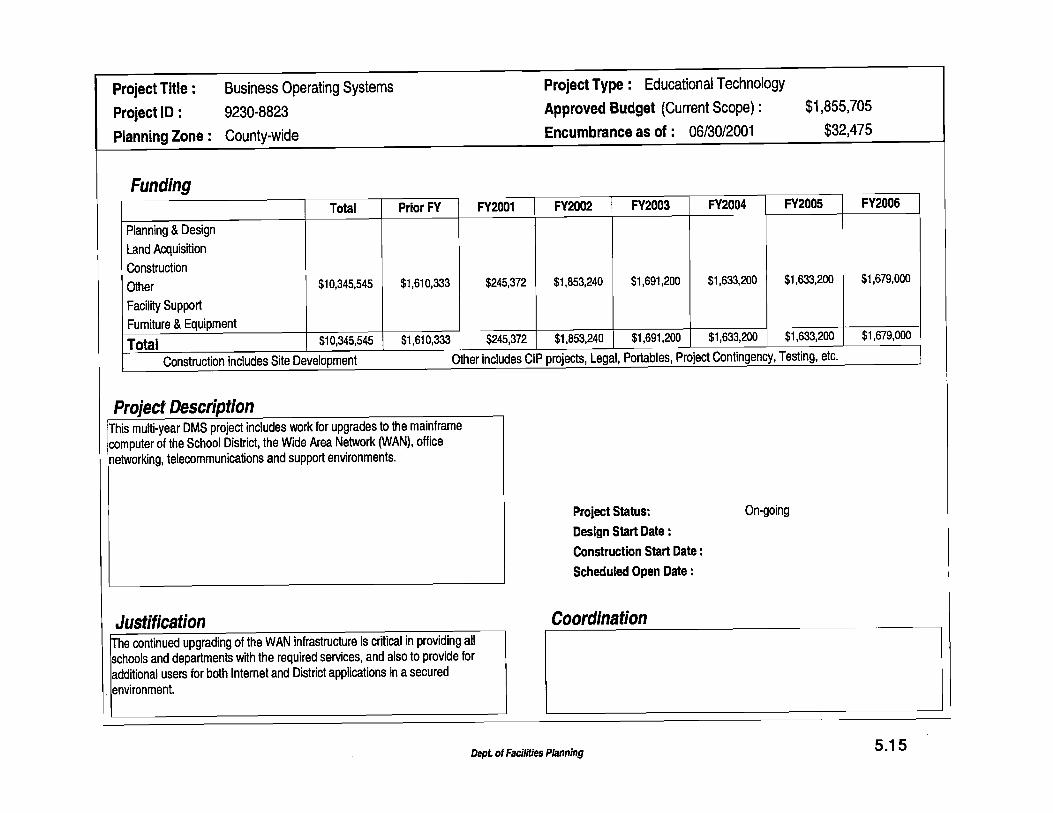
Business Operating Systems 10,%&45 1,610,333 245,372
Electronic Imaging Storage & Retrieval &9kJ$)9 715,691
Instructional Technology Elem. Schools 23,13I,W9 573,588 1,865,221
Instructional Technology High Schools 14,887,074 705,922 524,832
Instructional Technology Middle Schools t6,799;6$5 150,956 1,068,659
School Center Administrative Technology 18358,983 721,308 2,247,025
Subtotal Educational Technology 1 (18;589,264 6,398,979 1 1,053,217
Instructional Media Services
School BusesNehicles
School Center Security
4,252,640 3,466,640 2,689,000 2,500,000 2,500,000
1,853,240 1,691,200 1,633,200 1,633,200 1,679,000
92,108 347,000 265,000 185,000 330,000
5,421,340 3,951,000 3,822,560 3,469,900 4,728,000
1,359,160 6,917,500 3,050,940 949,200 1,379,520
2,271,800 3,121,250 4,055,300 4,260,360 1,871,360
3,603,000 3,111,500 2,292,000 3,299,000 3,085,150
18,853,288 22,606,090 17,808,000 16,296,660 1 5,573,030
Equipment
Dept. of Facilities Planning
VI I
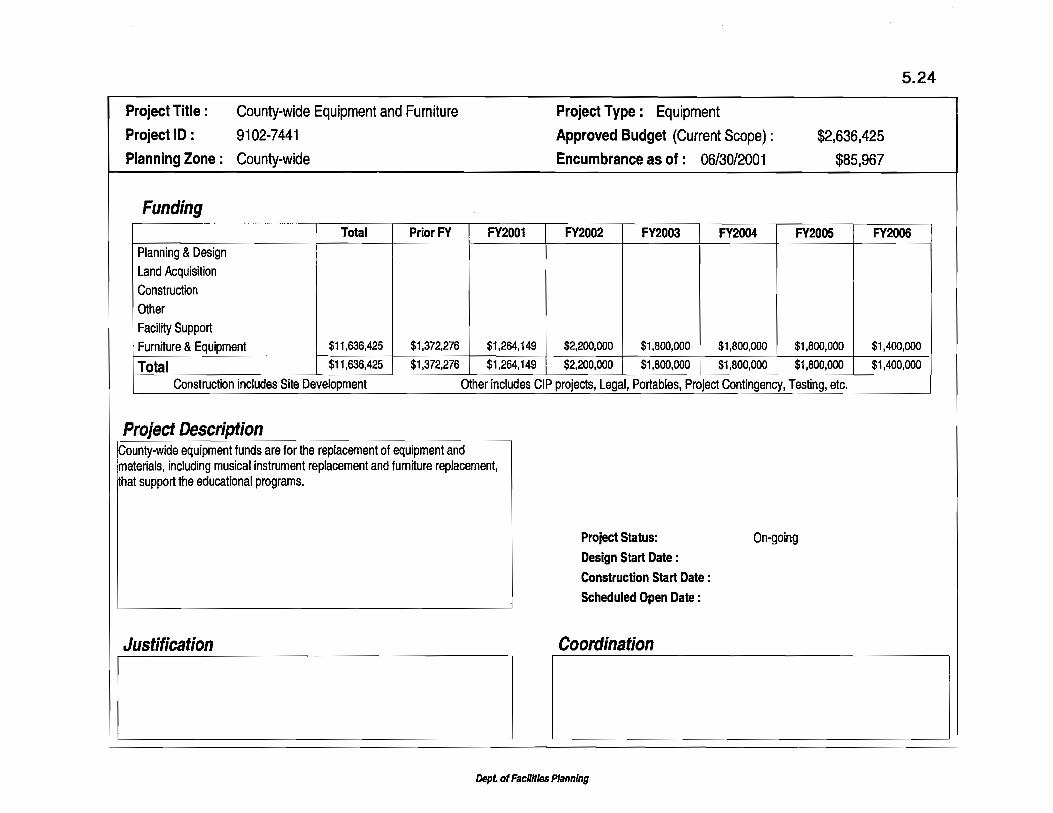
County-wide Equipment and Furniture 11,636,425 1,372,276 1,264,149
Covered Playgrounds 248,077 248,077
Equity Funds 748,628 5,672 492,956
2,200,000 1,800,000 1,800,000 1,800,000 1,400,000
250,000
Prior to FY FY FY FY FY FY Project Total,,, 2001 2001 2002 2003 2004 2005 2006 Beyond
I
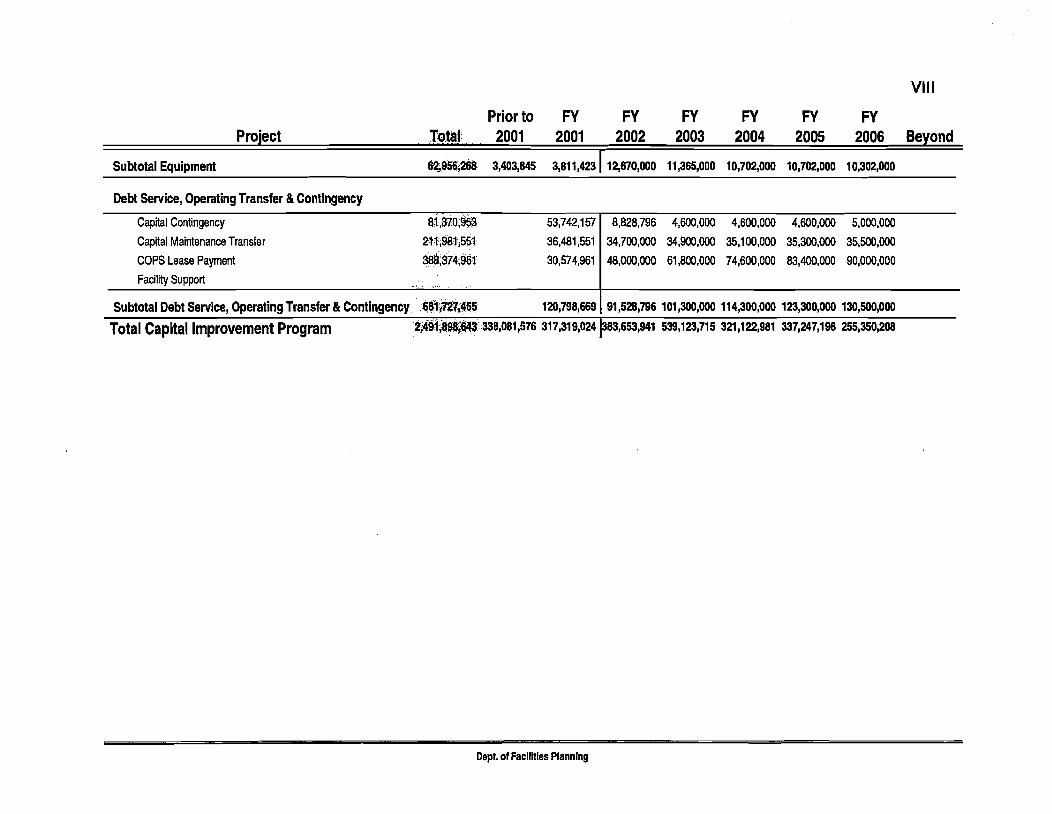
Subtotal Equipment 62,956,268 3,403,845 $81 1,423 1 12,670,000 11,365,000 10,702,000 10,702,000 10,302,000
Debt Service, Operating Transfer & Contingency
Capital Contingency 81,370,953 53,742,157
Capital Maintenance Transfer 21 1,981,551 36,481,551
COPS Lease Payment 388,374,961 30,574,961
Facility Support
Subtotal Debt Service, Operating Transfer & Contingency 681im7,465 120,798,659 1 91,528,796 101,300,WO 114,300,0W 123,300,000 130,500,000
Total Capital Improvement Program 2;4913~,w S8,OBl ,576 31 731 9,024 P~~,~S,MI ~ ~ ~ ~ 1 2 3 , 7 1 5 321,122,981 337,247,198 2s!i,3501208
Dept. of Facilles Planning

Summary of Estimated Revenue for Fiscal Years 2001 - 2006
Prior to FY FY FY FY FY FY Estimated Revenue Total 2001 2001 2002 2003 2004 2005 2006 Beyond
*
Local Sources
State
Special Millage 975,571,232 139,666,290
Impact Fees 49,493,500 9,493,500
Interest Income 46,762,366 16,762,366
Misc Local Revenue
Carry-over (general) 1 11,,096,921
Revenue Prior to 2000 338,081,576 338,081,576
Subtotal Local Sources 1 ,!i213095,595 338,081,576 165,922,156
151,304,942 158,800,000 166,800,000 175,100,000 183,900,000
8,000,000 8,000,000 8,000,000 8,000,000 8,000,000
10,000,000 5,000,000 5,000,000 5,000,000 5,000,000
49,435,409 14,254,699 18,364,757 16,892,712 12,149,344
21 8,740,351 186,054,699 198,164,757 204,992,712 209,049,344
Proposed COPSlBond Proceeds
Class Size Reduction
CO & DS 4,31Q$62 810,662
COB1 Bonds
Effort Index
PECO Bonds - Const. 56,%,667 8,499,185
PECO Bonds - Maint. 38,914,940 7,940,257
SIT Awards 3,W,OOO
Subtotal State 102,759;269 17,250,104
COPS Proceeds 8~ ,133 ,n9 134,146,764 1138,228,761 333,417,708 108,525,333 120,011,545 33,803,668
700,000 700,000 700,000 700,000 700,000
17,572,818 11,609,829 6,877,364 5,868,140 6,106,331
7,412,011 6,341,479 5,855,527 5,674,801 5,690,865
1,000,000 1,000,000 1,000,000
26,664,829 19,651,308 14,432,891 12,242,941 12,497,196
Subtotal s s ~ , l 3 3 , ~ 9 134,146,764 11 38,228,761 333,417,708 108,525,333 120,011,545 33,803,668
Dept. of Facilities Planning
I X

U)
L
a, m
3
$ "j 5
0)
>
2 5 r
L
ii 9 ii
a, a, c
5 : g
' C
C
0
.- u
2 u
5'"
g
0%
;
.G 5 .c.
m~ "
j~
~'
'
.c. ",5
%
=
E'
f p g2 g e ,3 Q
ez
~8 '7,s - $25.~
ss
gg
.c
.L
0
"0
-B
cn
!E
m 0 C
E
2
e.
4.
~~
. .u,
u,
.c.
EE
Zo
0 n
o,
I!
.%.S
u-
03
. a,
a, a,.%
oO
,s
33
,E
- .--
.- U
UU
Q
aE
aa
,a
,a
,
m nx
rr
r2
- .-
L 0 0 0.c
. m
Q)
OU
)U
)U
)L
Ze
Sa
aa
~
ea
im
* r
Om
.3F
O
cu
~c
uc
n3
>a,
"j
,iz 9
- P
",-E
.$
m g
s.9 a,
7,
CC
Ca
,S
?%
j
e"
g5
"~
- m
3r
BZ
cu
07,s
2 a," o
a,
SE
Sii
= 0
U)
or
am
m
.g
zy
s EZ
3 0-
a, %'-
0~
",o
r x
ma s m
m
+a
,b
u,L
a,'
2: 2 =
ai a,.-
rm
2
EZ
a,
a
.s .= .: a
55
g
7, .'"
93
u, 2 E
.ZL
o
go
m
sz
ag
a,
,me
>; V
),
Q~
$
Y("
O7
Jii
~E
.G
g
au
.5
,
an
3 ,.-
a,=
ga
,a,
5 c"2
" n
u a,.&
$2
6- a, cn
cn- ("5
m
e= 0
5
0.%2 , g
27
,oF
l.k
3 a,
.c.
.%
O
ma, a
,E.E
.u
,;i;san
3 K
%E
g;
E
='
cU
tj9
mm
g
a, .s
rS
SW
2
+ .u,
,j O
n5
8 g,_.$%
S ' .u, g
a, .E r-=
,q
++.so 0

DEMOGRAPHIC CONTEXT
Population growth in the Palm Beach County Metro area has been extraordinary. Since 1940, the County has nearly doubled in population every 20 years. The 2000 population is over 1,130,000. At the end of the planning period (FY2006), this number is projected to be more than 1.16 million accounting for 70% of the Treasure Coast's projected regional population of approximately 1.5 million persons in 2006. The Bureau of Economic and Business Research (BEBR) estimates that the County will grow, approximately 20,000 persons per year during the planning period. Over the 20-year long- range period (2000-2020), the County will grow by 221 thousand households, capturing 22% of Southeast Florida's growth. This observation is supported by an examination of births for Palm Beach County shown in Figure 1. For the last 10 years, the number of resident births has remained relatively stable, between 12,000 and 13,000 per year. In the same period, the County's actual population has increased from 817,528 to 1,131,184, a 38% increase.
Almost 25% of the population of the County is age 65 or older, and the median age is 42.5, almost 8 years higher than the national average of 32.8. Of the estimated 1,130,000 residents of Palm Beach County, 28% are age 29 - 44.
Racially, the County's demographic composition has been experiencing significant increases in Hispanic, and moderate increases in African American and other groups of the general population over the last decade. Since 1990, the number of Hispanic persons increased by 74,062 or 111%. The number of persons of other races (other than White or Hispanic) increased by 80.5% or 105,690 persons.
ECONOMIC CONTEXT
Since 1980, Florida's economy has grown at an average annual rate of more than 4%. Although the Palm Beach County economy is based primarily on agriculture, tourism, construction and out-of-state transfer payments to retirees, the regional economic base now supports industrial and commercial trade, both international and
domestic. In fact, Florida in general, and South Florida in particular, has developed into an international economic hub, with a gross state product of $380 billion.
PALM BEACH COUNTY BIRTH DATA Based on Annual Resident Births
Figure 1
HNumberdBirthsCorrespondingtoSchool I i
I Enhance Dates 94/95 throlcgh 04105 1 I I i
Palm Beach County has experienced steady and significant economic growth since the mid-eighties, a trend expected to continue for the Five-Year Planning period. The four major billion- dollar industries are tourism, construction, agriculture, and education. The School District alone pumps over one billion dollars back into the local economy, with a workforce of just over 17,000 employees.

In addition, the County continues to grow in five industry clusters including: aerospace and engineering; telecommunications; services; agriculture 1 food processing; and, medical 1 pharmaceutical. The County's land area of 2,000 square miles sustains a current labor force of approximately 500,000. One indicator of the area's economic health, consistent with national trends, is an approximate 4.0% unemployment rate, mirrored by an annual 4.0% job creation rate. Through the long-range planning period (1995-2020) Palm Beach County is predicted to grow by 316,895 jobs. The County per capita income continues to exceed the national average income, ranking 2nd out of 315 metropolitan areas in the United States (behind San Francisco.)
ENROLLMENT PROJECTIONS
The demographic and economic profiles of the County provide the basis for projecting school enrollments and future capacity demand. In general, the average annual enrollment increases are expected to continue for the next 3 years, particularly in the middle and high school age ranges. In the out years of the plan, this trend will moderate slightly. (See Figures 2, 3 and 4.)
Figure 2 - - - .- - . . . - - . - . . - - - - - -- - - -- . , - - .. . . . - - . -
i SDPBC Grades 9-12 Enrollment 1995196 to 2004105 i
Actual 150,000
I Projected i
Figure 3
SDPBC Grades 6-8 Enrollment 1995196 to 2004105
I Actual /4m
Projected
Figure 4
I SDPBC Grades K-5 Enrollment 1995196 to 2004105
; b Q ) Q ) O r N r n 8 2 $ $ $ $ s g s S z P L-.. . -- E L . 0 o _ . o o 0

The School District of Palm Beach County, the largest geographic school district east of the Mississippi River, will con2nue to experience enrollment growth at a rate that ranks it the 6 fastest growing school district in the United States. The School District has been growing at an average rate of more than 3,500 new students a year during the last 10 years. Since 1985, the School District's student population has grown from 77,748 students to 150,941 students in 2000-2001. Over the next 5 years, the School District's Pre K-12 enrollment is projected to increase by 10,000 +I- students to nearly 160,000. As expected total enrollment figures have closely tracked the general population trends mentioned earlier. Figure 5 compares the Five-Year Work Plan projections with those prepared by the State Department of Education (DOE).
Figure 5 -. . -- . . - - - - -- - - - . . - -. - - -
1 SDPBC Actual & Projected Enrollment , I
! i Actual Projected
-0- 5-Year Plan Actual & Projected - - O - - DOE Actual & Projected !
L-. 1
As Figures 6 and 7 indicate, the School District's student population mirrors a diverse, multi-ethnic profile of the County. This student composition should continue relatively unchanged for the planning period except for significant increases in the percentage of Hispanic students.
Figure 6
! SDPBC Enrollment by RaceIEthnic Group i
Socioeconomic diversity in student population of the School District has also been increasing. Notwithstanding the robust economy of recent years, the School District retains a significant "Free and Reduced Meals Program" (FARMS) participation rate, which has increased from 32% to 42% since 1990 as indicated in Figure 7.

Projected Revenues Figure 7
Free and Reduced Food Program !
1990191 to 199912000 I
! I
FISCAL REALITIES
The School District continues to evaluate its resources. It will be important to determine the cost of the plan, the District's ability to fund the improvements and the timeframe for generating future revenues.
This Five-Year Work Plan presents a compelling justification for a construction program that will reduce current backlog, provide for future demand, and correct facility inequities. The needs are long- standing and long term. The District needs additional resources to pay for developing a financially feasible Capital Facilities Work Plan. The District has the ability to utilize Certificates of Participation to assist the funding of the FY 2002 Capital Budget.
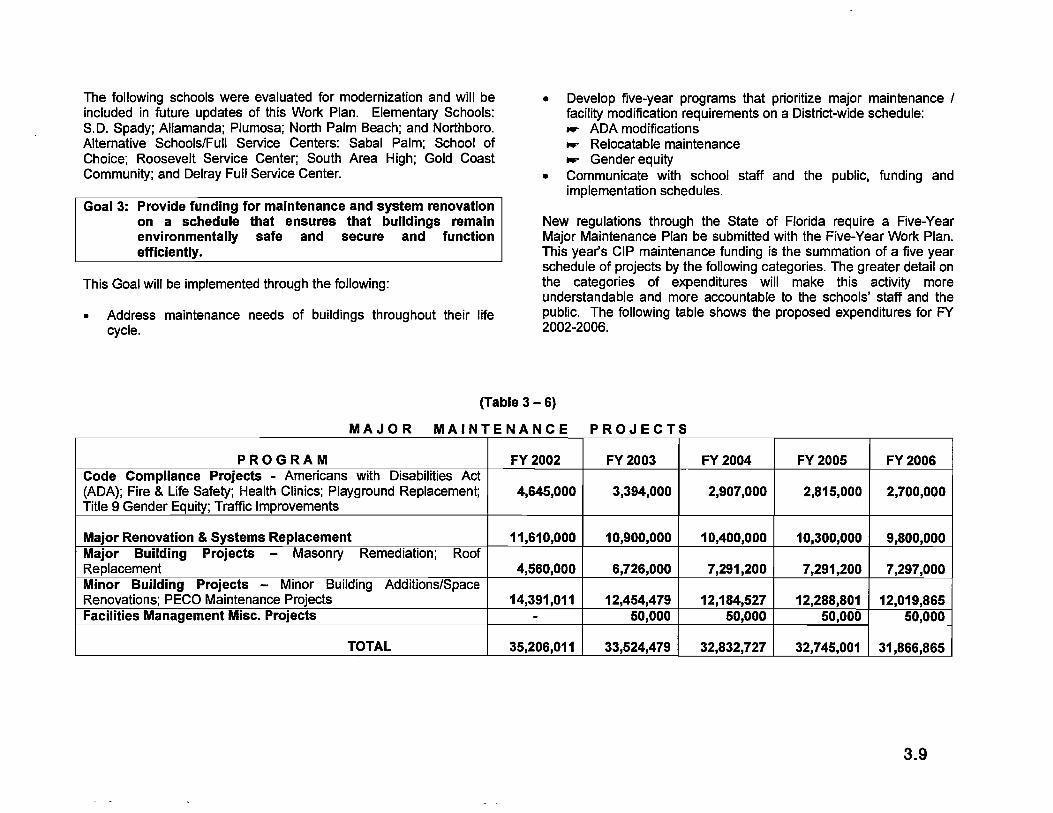
Table 1 compares the projected five-year expenditures to projected revenue. Known capital revenue from all sources is expected to decrease from $209 million in FY 2001 to $199 million in FY 2002. Special appropriations (capital maintenance transfer, District-wide projects, technology, equipment), new construction and modernizations total approximately $1.8 billion for the Five Year planning period. This proposed expenditure schedule will leave the District $765 million dollars in deficit for the five years. The District will need to consider a variety of alternative funding strategies.
Alternative Funding Options
Although the State of Florida annually funds a portion of the capital construction budget, these funds, even when combined with local millage dollars, will be inadequate to construct the state-approved, facility recommendations contained in the Educational Plant Survey. Clearly, additional funding options must be fully considered. These options and their potential revenue generating capacity are discussed in the following paragraphs. More than one option may be an optimal solution.
Certificates of Participation (COPs)
COPs are a form of lease purchase financing that has gained general approval in recent years. The School Board could issue an additional $765million in (COPs) to fund the deficit through FY2006. Issuance of COPs does not require voter approval. COPs can be used to acquire land and construct new schools, additions or replacement schools. The lease payments are paid over a 15 to 30- year period. COPs can also, under certain conditions, be used for the modernization of existing facilities and the purchase of equipment. When used for such purposes, the lease payments are paid over a 3 to 5-year period. The issuance of COPs for any reason does increase the District's debt sewice. With the new issue proposed in FY2002, 33% of the special millage revenue received will be used for COPs debt sewice.

Comparison of Five Year Work Plan Expenditures and Revenue
CONSTRUCTION
Projected State and Local Revenue
Proposed Five Year Expenditures Anticipated Alternative Funding Source Needs
PUBLIC SCHOOL CONCURRENCY The commercial construction and home building industries in South Florida continues to experience strong volumes of new work. This unprecedented regional growth is expected to continue, affecting both the home building and commercial construction sectors and specifically also school construction. The recent availability of privately held property for commercial and housing development has the potential of exacerbating this growth pattern for several years.
FY 2002
245,425,180
383,653,941
(138,228,761)
Because of this regional growth, the construction industry has been beset by a continuing shortage of specialized skilled labor, which often translates into higher labor costs and schedule slowdowns. While construction costs have been marked by regular increases over the past several years, and the County so far has seen a steady but recurring escalation in both prices for certain commodities and specialized skill labor areas. The Five Year Work Plan Project budgets for new schools beyond FY2002 have been based on construction cost guidelines established under the State's Frugal Schools program. Each project estimate will be reviewed annually during the annual planning process to assure continuing cost containment and on-time completion.
The 1998 Florida Legislature enacted legislation amending Ch.163., F.S. establishing optional requirements for the implementation of a public school concurrency process. It is based upon a financially feasible capital plan and provides for coordinated planning among the School District, the County and local governments to ensure that school capacity, at the adopted level of service standard is available at the time of impact of residential development.
FY 2003
205,706,007
539,123,715
(333,417,708)
The school concurrency process will ensure availability of capacity to meet the anticipated enrollment with permanent student stations. Implementing public school concurrency will result in a more predictable process for the assignment of students upon space becoming available and a greater reliability on achieving and maintaining balanced school utilization. The parties will jointly establish a process for the preparation, amendment and joint approval of a public school capital facilities program through the local governments' comprehensive plans. The process will define the geographic application of concurrency, establish criteria and standards for the establishment and modification of school concurrency service areas, and incorporate the criteria and
FY 2004
21 2,597,648
321,122,981
(108,525,333)
FY 2005
217,235,653
337,247,198
(120,011,545)
FY 2006
221,546,540
255,350,208
(33,803,668)

standards into the local governments' comprehensive plans. It will year projects. The backlogged and projected school capacity needs, establish a uniform procedure for implementing the concurrency created by demographic and economic trends beyond the control of program that provides for the evaluation of development applications the School Board, emphasize the importance of coordinated for compliance with school concurrency requirements and provide an planning and policy making to prevent a future recurrence of the opportunity for the District to review and comment on the effect of present backlog. If an unexpected economic event occurs, the Work comprehensive plan amendments and rezonings on public school Plan can be readily adjusted to respond to the new realities, facilities planning. It will also establish an impartial group to provide whatever they may be. for the monitoring and evaluation of the concurrency program.
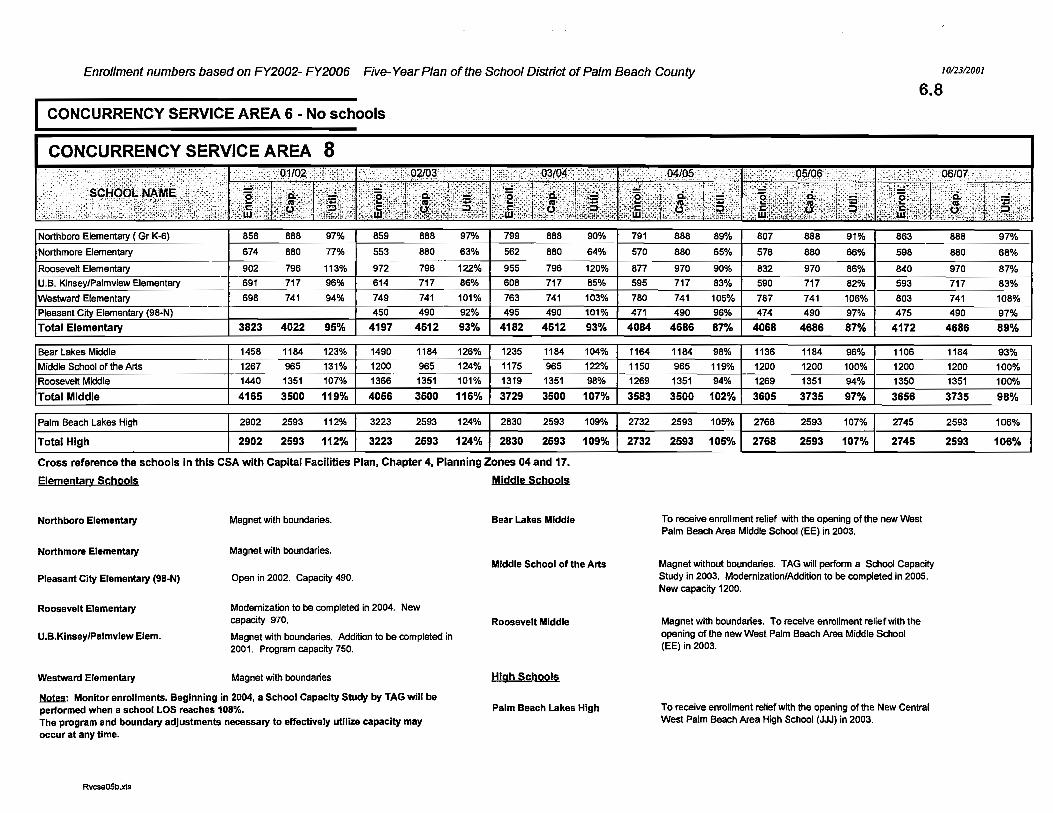
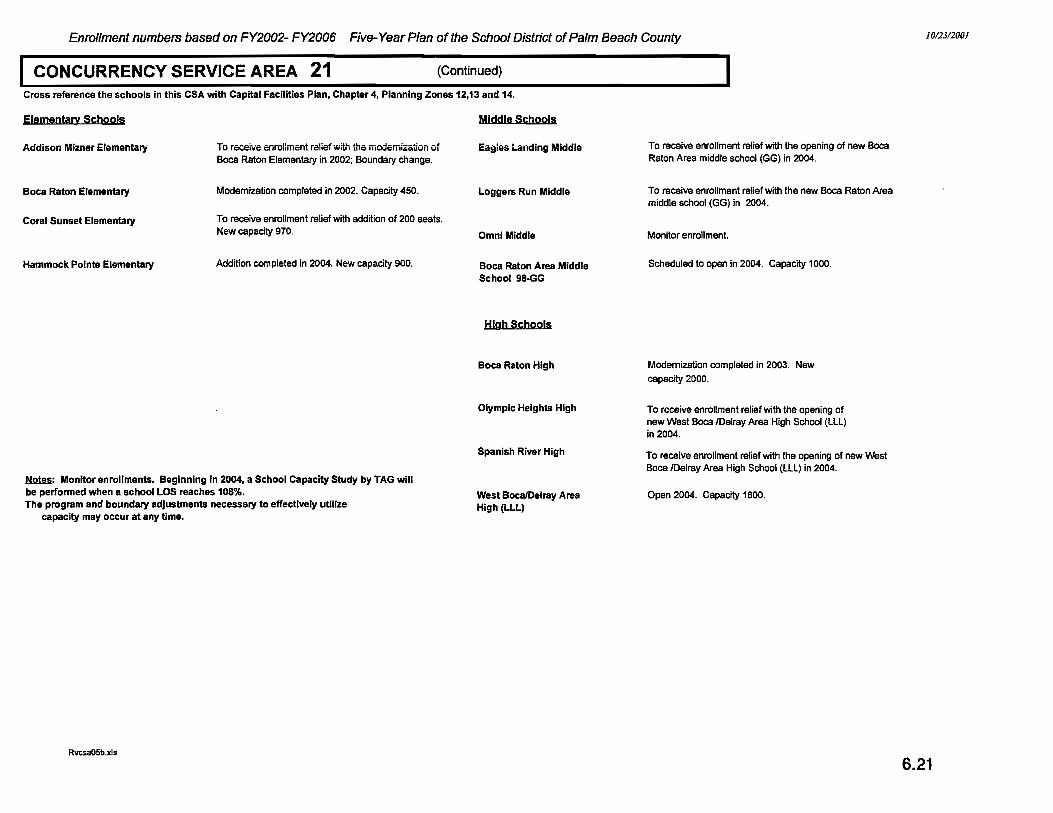
The School Board of Palm Beach County, the Board of County Commissioners, and 26 participating municipalities within Palm Beach County have approved the implementation of public school concurrency. For concurrency to become effective, the local governments must adopt consistent public school facilities elements and incorporate the School District's capital improvement program summary in their comprehensive plans. The adoption process is anticipated to be completed in late 2001, with school concurrency commencing in the spring of 2002. Chapter 6 lists the twenty-one (21) Concurrency Service Areas (CSAs), and shows how the District will meet the requirements of the Interlocal Agreement by 2004.
CONCLUSION
The demographic, economic and corresponding enrollment trends identified present a picture of continued growth and corresponding school facility demand for the five-year planning period. However, it is equally clear that economic and other forces beyond the control of local policy makers can cause an overnight downturn. South Florida, in particular, has been extremely vulnerable to the periodic volatility of the construction and tourism sectors. Gas prices, high interest rates, the weather and crime - all have been blamed in recent years for the "down times" of a fragile economic base.
All of which underscores the wisdom of an annual planning process that is continuing with this Five-Year Work Plan. The Plan lays out a clear road map to address the twin needs of growth and modernization. Additional funding will be required to build some out -


Chapter 2
FACILITIES PLANNING COMPONENTS
Introduction
The Five-Year Work Plan is the foundation block of an annual planning process that allows the School District to effectively address changing enrollment patterns, meet the requirements of concurrency, and sustain the facility requirements of high quality educational programs. This process, as outlined below, is designed to increase public understanding of the School District's needs and constraints and to reflect the consistent application of widely accepted goals and strategies.
". . , .... ... ...,I :\8. ..~.%,v
: . : ; : ; : : : , , , * . ' . :?,';.i*'.*".>;:'. .., . ... . . : '...'. '"';~,:'l~;; "... .' . :'. .- 1-. * ,.,, ~:;;f;~;;;~~jg~s~ep$?~~:4h:.e~fln~~a1~)?:~~nn~fl~~~~~~ii;'~~@t~~~~~@y"$$g&~ .:,.,-,.,,... .. . . ... . - . .-..-..-. ... ... .. . .... --. ... . .,. . . I ~.:'l~.:\ >. .. &. ... .> .... . :;;.:,+ .. ..., . . .-...., .....,. ... .,. .. ., .!:... . .'... .- . .,. . - .-:. .. ... . . A. .... .,.r..::: . . , , . ,.
Developing I revising, as required, the 5 year enrollment projections on a school-by-school basis. Updating school facilities and program information, as warranted. Developing I confirming capital and non-capital solutions to meeting facility needs. Assessing the fiscal environment. Adjusting the Five-Year Work Plan, as required. Finalizing the Capital Improvement Program (CIP). Adopting the Capital Budget for the next fiscal year.
This chapter focuses on each of the building blocks used to develop the Five-Year Work Plan.
Enrollment Forecasting
The forecasting of school enrollment requires the analysis of multiple data sources including birthrates, the demographic make-up of neighborhoods, local and regional economic and housing trends,
program and boundary changes and an empirical understanding of individual communities. School population projections are most reliable when enrollment is projected for large geographic areas for one or two years in the future; for example, the district-wide projections for next year are expected to have a higher degree of certainty than the fifth year estimates. Conversely, accuracy diminishes as the geographic area becomes smaller and the forecast is for more distant points in the future, thereby requiring adjustments in the out years of the Work Plan.
In accordance with Florida Department of Education guidelines, the School District of Palm Beach County annually prepares or updates enrollment forecasts following a study of local government area and school level trends. A history of each school's grade-by-grade enrollment is compiled and analyzed. This history reveals patterns in the "aging" or progression (less out-migration factors) of students from one grade to the next. These patterns are extrapolated to develop a school's basic forecast. This approach, termed the Cohort-Survivorship Model, is the most widely applied forecasting method for schools.
Enrollment projections for the School District are prepared in the Fall using the actual "first nine weeks" membership information. The Cohort-Survivorship method "ages" students ahead through the grade levels and calculates a ratio based on a five year history. This ratio is then applied to future years.
However, the data yielded by the basic survivorship model is only the foundation for the enrollment projections. The model data must then be compared to projected county population growth associated with new housing starts and County in-migration rates. Population projection data derived from the County's Traffic Analysis Zones (TAZs) is proportionately matched to school attendance zone data to provide an indication of future growth patterns.

The most difficult segment of the K-12 population to predict is each year's kindergarten class. In order to project the kindergarten population for each year of the Work Plan, statistical profiles of residential birth data are drawn, then matched to anticipated growth patterns and applied to individual schools.
Finally, the District-wide forecast is compared to the Department of Education (DOE) forecast for the School District of Palm Beach County. To the extent feasible, the forecasts are then reconciled. Any remaining differences should be explainable in light of specific Palm Beach County data.
Recognizing the uncertainty that surrounds long-term forecasts and to a lesser extent, near horizon projections, the District needs to annually review the enrollment projections for adjustments. Demographic shifts are expected in high growth counties like Palm Beach; in addition, annual changes in school programs can generate near-term facility needs. Staff works closely with school principals and local government planners to encourage an on-going exchange of information that fosters proactive planning rather than reactive problem solving.
Upon adoption of school concurrency the local governments and School District will establish a process by which they shall agree and base their planning on consistent population projections. Through coordination, the School District and local governments will share information related to existing and planned public school facilities based on projected student growth. Concurrency requires the local governments to provide the District with their overall population projections and proposals for residential development, and infrastructure required for public school facilities. Concurrency establishes a planning process based on enrollment projections, which will encourage the location of public schools proximate to urban residential areas and the co-location of schools with other public facilities to the extent possible.
Capacity Analysis
The Palm Beach County School District uses the Florida Inventory of School Houses (FISH) capacity information for each school, which is determined by the Florida Department of Education (FDOE) in accordance with the following guidelines:
FISH Capacity defined
FISH (School) Capacity is "the numberofstudents that may be housed in a facility (school) at any given time based on a utilization percentage of the number of existing satisfactory student stations".
It is a product of the number of classrooms at a school and the student stations assigned to each room type. The capacity of some spaces is modified for actual square footage of the teaching space.
Teaching stations are roughly defined as being 600 square feet or more with a teacher and students regularly assigned to the space. No capacity is assigned to small instructional spaces and specialized classroom (labs) including art, music, resource, speech, etc.
Program Capacity defined
The School District is required to use the FISH capacity on all planning documents for state purposes. However, this capacity often does not reflect the actual programs at the schools and the impact of changing demographics.
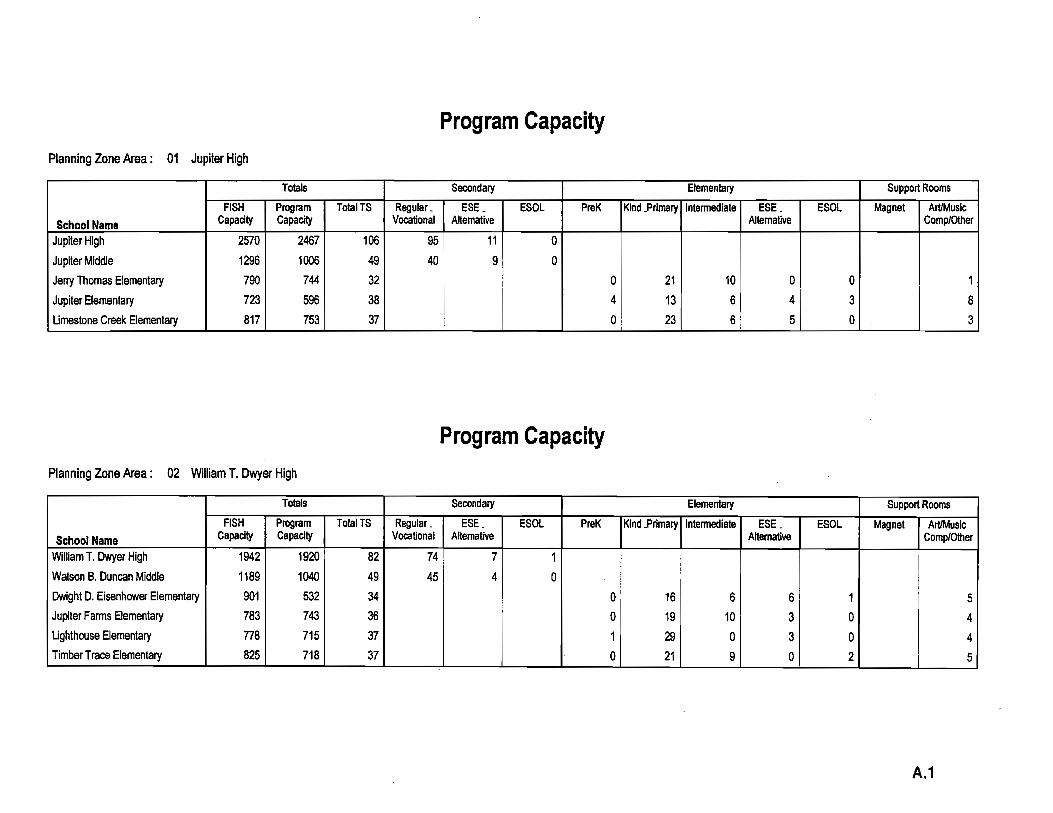
This year's Five Year Work Plan explores a different kind of school capacity. Tables provided in Appendix B display a suggested "Program Capacity" for each school. Program capacity can be defined as "the number of students that may be housed at a facility given the current educational programs."

The recommended program capacity is calculated in a manner similar to the FlSH calculation. Classrooms (600 square feet or greater) are multiplied by a class size factor and, in the case of secondary schools, by an overall utilization rate. A comparison of the FlSH to the recommended program capacity calculation is shown in the following tables.
In the School District of Palm Beach County, ESOL teachers are allocated a classroom for instruction. The State does not. In this District, classrooms are allocated for State and Federally supported Pre-K programs. The State does not. In this District, some magnet schools are allocated special labs to support their magnet programs. The State does not recognize the needs of magnet programs. Program capacity reflects the actual room uses and program delivery.
Program capacity differs from the State FlSH in two ways. 1) The class size factors and utilization levels are lower and 2) all the District's special and supplemental programs are recognized as legitimate classroom uses.
Middle Schools Elementary Schools
The recommended class sizes reflected in the tables are an approximation of actual average class sizes in 2000. These numbers are lower than the initial budget allocation for most schools and are significantly lower for schools that receive federal or other supplemental teaching staff such as Title 1 schools. Average class sizes are reduced each time a supplemental teacher (ESE, ESOL, DOP, Vocational, Title 1, etc.) is factored in with the classroom teachers.

High Schools
Program capacities are presented in this Five Year Work Plan as a planning tool. If the District hopes to remove relocatable classrooms from many school sites, it must consider the program capacity along with the FISH capacity.
Utilization
In an elementary school the students are generally assigned to one classroom throughout the day and the optimal school capacity is 100% equivalent to the number of student stations. This is so because the major factors that determine the capacity are the actual number of student stations, the number of teaching stations and the capacity of the Core facilities (Cafeteria, Media Center, and Administrative areas).
At the middle and high school levels students move from classroom to classroom depending on the subjects taken. Thus, scheduling is a factor in calculating capacity as well as the number of teaching and student stations. Experience has shown that the not all classrooms can be utilized every period of the day. The number of students that may
be housed in a facility at any given time is based on a utilization percentage of the total number of satisfactory student stations.
The State recommends a 90% utilization of middle schools and 90-95% for large high schools. Therefore, total "student stations" reflects 100% of the seats at the school building while "capacity" represents the total student stations at a maximum utilization of 90-95%. The Five Year Plan attempts to use "capacity" consistently throughout the document.
Concerns have been raised by many middle schools staff that 90% utilization does not allow for the implementation of the middle school program. Using a traditional teaming concept, utilization would need to be at approximately 85%. Therefore the program capacity calculation recommends a lower utilization than is currently supported by the State.
Utilization and Concurrency
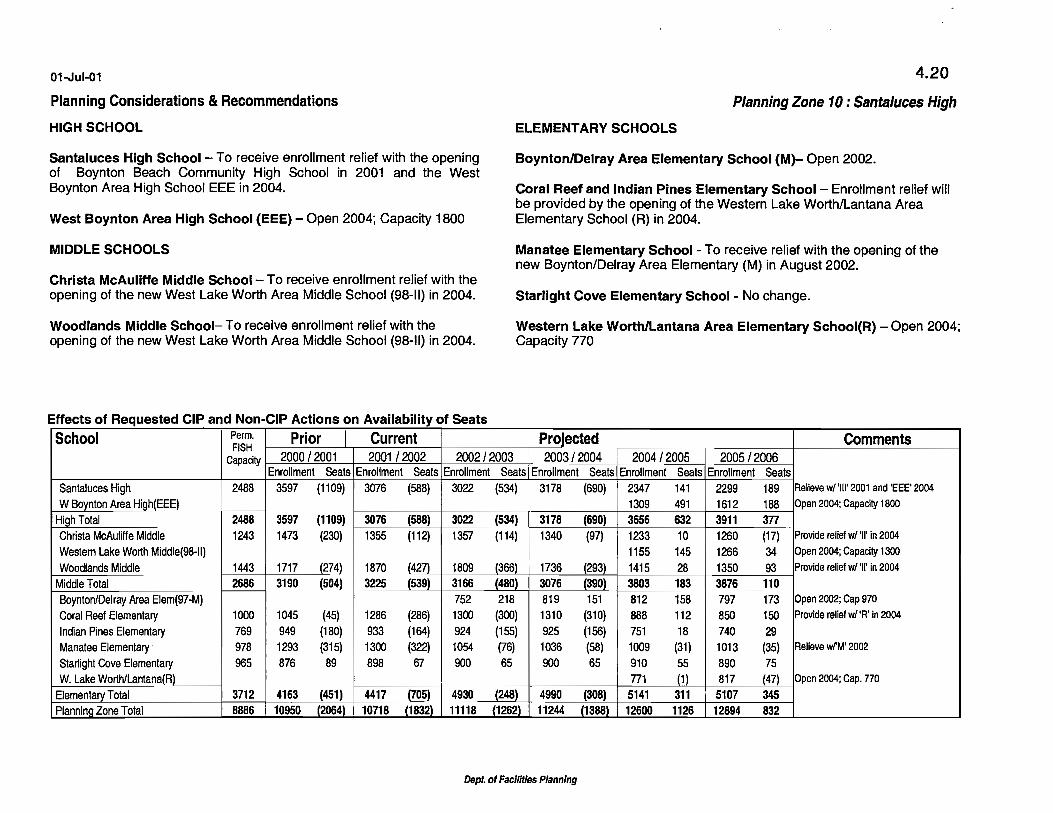
School concurrency requires that each school achieve and maintain a satisfactory Level of Service (LOS), which is expressed as a percentage of capacity to enrollment. The adopted LOS for all schools of each type is 110%. Based on the District's Five Year Plan a tiered level of service will be followed until 2004 when the final 110% is expected to be achieved.
Beginning in 2004, individual schools may exceed the 110% LOS, but be no greater than 120%. This will be allowed only after a study is completed by the Technical Advisory Group (TAG), which determines if the school can function efficiently at the higher LOS.
Chapter 6 shows the projected utilization of all schools by Concurrency Service Areas. At this time not all schools are reflecting a utilization of 1 lo%, however, in accordance with the approved Inter-local Agreement between the School Board, Board of County Commissioners and the municipalities, the District has committed to bring all schools into compliance by 2004. Therefore, this Five Year Plan reflects a recommended resolution of space needs within a financially feasible plan to meet the District's

concurrency requirement. Concurrency also requires an annual ten and twenty year work plan based upon projections and facility needs for general planning purposes.
Other Program Considerations
Educational program changes impact both space needs and space design. To effectively plan for school facilities requires long range planning for educational programs such as magnets, school choice, special or supplemental programs for exceptional students and early childhood programs. In addition, class size, the number of teaching stations funded by the state and scheduling I operational decisions all directly impact school facility needs.
Some of these educational plans are not in place as this Five-Year Work Plan is prepared. The annual planning process used to update this plan will insure that these new educational components are integrated into future Work Plans as they are adopted.
Modernization
Schools being built in Palm Beach County today are expected to provide an appropriate learning environment for children through the year 2030. During that building life cycle, they must be expandable, contractible and adaptable.
As new schools are built in growing communities to address space needs, funds must be dedicated to revitalize and preserve existing schools in older communities. Quality schools are key elements in the viability and livability of older neighborhoods. These schools and their communities cannot wait until space needs are addressed throughout the County.
This Five-Year Work Plan balances the building of new space with the modernization of existing schools through a systematic program of modernization upon reaching 35 years of age.
Modernization is defined herein as "a comprehensive upgrading of an existing school to "like new" school standards". It is the replacement or rehabilitation of all major physical systems (HVAC, windows, lighting, work surfaces, etc.). It is also the expansion and remodeling of spaces to comply with current facilities standards. A modernization addresses the school building as an integrated system and considers such issues as delivery of the instructional program, student circulation around the campus, the relationships of core facilities, security concerns, and site access. A modernized school is expected to begin its life cycle again almost as though it were a new building.
A modernization may include all the buildings on a campus or only one or several buildings. Feasibility studies should be conducted one year prior to the beginning of planning to determine the cost, feasibility, and scope of a modernization. Where the cost is estimated to exceed 75- 80% of the cost of a new school, the School District should consider replacing the affected buildings.
One of the most difficult aspects of a modernization program is the housing of students and staff during the modernization of their facility. Options include moving students to a holding facility, rebuilding on another part of the site or phasing the project using relocatable classrooms. As a schedule is prepared, the availability and functionality of a holding facility will be important considerations.
In last year's Capital Improvement Program, more than 42 schools were identified as being 35 years old or older and have been scheduled for modernization. Some of these schools have had significant upgrades through previous projects; others have had only minor additions or remodeling. An extensive analysis of these schools has been completed and provided the basis for recommendations through FY 2006.

This year's Capital Improvement Program is requesting funding in FY 2002 to evaluate an additional 17 schools for scheduling for a future modernization.
Major Maintenance Program
Buildings and their major components have a limited life cycle that begins with the opening of a new school and culminates in a modernization or replacement. As building components reach the end of their useful life, they become operationally unreliable, often energy inefficient and require excessive maintenance time and money.
The School District of Palm Beach County provides for the maintenance of school buildings through the support of the operating and capital budgets. District-wide projects ensure the routine maintenance, repair, and replacement of building components such as roofs, HVAC systems, etc.
Five-Year Plans continue to be developed for each of the projects listed below.
Americans with Disabilities Act Compliance - Federal and State Law require accessibility for all School District activities. Since not all facilities will be included in a modernization program, this initiative retrofits buildings to be in compliance with the laws.
Fire and Life Safety Systems -This project targets updating or replacement of fire and safety systems to meet code updates and insure safe environments at older schools.
Gender Equity - The District is committed to providing equitable athletic facilities in high schools across both genders. This project began in FY 1999 to fund modifications andlor new athletic facilities where needed to ensure that Title 9 equity issues are addressed.
Major Maintenance and Systems Replacement - This project funds space renovations of $500,000 or more and major systems replacement (for example, a complete replacement of an HVAC system) costing one million dollars or more. Kitchen HVAC projects area included in this category.
Minor Building Additions and Space Renovations - This project provides for continuation of minor modifications to accommodate educational programs in facilities that are not identified for modernization or replacement and includes Planned Asset Replacement (PAR).
PECO Maintenance - This is a state funded project to fund the maintenance of our schools.
Playground Replacement & Resurfacing -Many elementary schools installed playground equipment in the last 15-20 years that is now considered unsafe. This project is intended to replace all the unsafe equipment.
Roof Replacement - This project will continue the program of roof replacements in facilities that are not identified for modernization or replacement.
Traffic Improvements -This project will fund projects to address on- site vehicular circulation concerns and off-site traffic signals
Health Clinic Compliance - This project will provide funds to renovate space in existing schools to support full-time health care professionals.

Information Technology
The School District of Palm Beach County relies on data to make informed decisions for both business and instruction. The roll of technology is to provide business systems that allow District users immediate access to accurate information, productivity software, and instructional software to enhance the teachingllearning process. Many District initiatives have received both national and international recognition. The Capital Improvements Program, in conjunction with the Department of Education's Annual Award of Public School Technology Funds, supports the infrastructure, equipment and software necessary to make the technology program viable each year according to the District's Technology Plan.
Currently, all Palm Beach County schools are connected through their school's Local Area Network (LAN) to the District's W~de Area Network (WAN) providing access to information via the mainframe, Internet, and intranet in a secure manner. District users depend on the information provided via these networks (growth of on line activity since 1997 has more than quadrupled). Continued movement from paper to electronic and user-friendly formats provides users with current information available at their fingertips.
With foresight and commitment the School District has completed the technological foundation for a 21st~entury.~chool System. But it is not done yet! The changing face of technology will require a systematic technology replacement and upgrades will into the foreseeable future to ensure appropriate response time.
County-wide Equipment and Materials
The CIP includes a reliable fund source to insure a systematic approach to equipment replacement. This category includes the replacement of vehicles, buses, furniture and multi-media equipment.
Since FY93, the Board has allocated "equity funds" to be used to address the inequities that exist between older and newer schools in terms of equipment and facilities. The funds are used for additional or replacement furniture, equipment and for minor facilities improvements.
As the District continues to modernize its older buildings, there will be less need for an equity project to fund small-scale improvements.
The regular maintenance and replacement of materials and equipment to support the educational programs is important to the viability of older schools.


Chapter 3
Introduction These recommendations and goals are the foundation of the Five-
This chapter provides a summary of the recommendations in the Five- Year Work Plan and the continuation of a systematic, consistent Year Work Plan. The recommendations are grouped under the process for addressing the long-range facilities needs of the entire following goals: School District. As such, they are more than just a response to
Goal I: Build space for students and programs to meet Concurrency by 2004; plan the use of temporary space to meet peak enrollment periods; evaluate other solutions to capital needs, such as boundary or program changes, to determine if funds can be redirected to achieve educational success for every student.
Goal 2: Modernize the oldest schools on a systematic schedule to guarantee safe, up-to-date facilities that meet diverse educational program needs.
Goal 3: Provide funding for maintenance and system renovation on a schedule that ensures that buildings remain environmentally safe and secure and function efficiently.
Goal 4: Implement an integrated Instructional Technology Plan (Board adopted 7/97) to give all students and staff members continuing access to contemporary educational technology.
Goal 5: Provide for the systematic replacement of equipment and materials to support the educational program and transportation needs of a growing county.
Goal 6: Develop a long-range facilities plan that is fiscally responsible.
Florida's legislative mandates o; long standing capacity needs; in fact, they comprise the District's balanced plan to relieve crowded schools, to upgrade older facilities, to meet technological challenges and to efficiently care for the District's facility heritage.
The recommendations in the FY2002-2006 Work Plan continue to support
A greater emphasis on building new schools versus expanding existing schools that require expensive core space additions.
A parallel and structured modernization program.
A focus on instructional programs as the cornerstones of facility planning and design.
A significant increase in funds available for major construction projects by reducing capital funds for maintenance and support.
This Five-Year Work Plan is an update of the FY 2001-2005 Five- Year Work Plan. Most of the changes from the previous plan relate to the modernization program and the "roll-in" of another year. Changes will be highlighted in the following sections.
Implementing the Goals Goal I: Build space for students and programs to meet
concurrency by 2004; plan the use'of temporary space to meet peak enrollment periods; evaluate other solutions to capital needs, such as boundary or program changes, to determine if funds can be redirected to achieve educational success for every student.
To carry out this Goal, the Plan incorporates the following strategies: Construction of new schools and additions, reducing the use of relocatable (portable) classrooms district wide by at least 45% by 2006. Prioritize projects by most over utilized; considering site and core space 1 capacity constraints, to the extent feasible, Expand core spaces (media centers, dining areas, administration and support spaces, and assembly spaces) as needed. Where site constraints limit facility expansion, reduce enrollment through student reassignments. Plan for expandable, contractible, and adaptable buildings; evaluate the economics of modular construction in growth areas. Consider non-traditional buildings and sites in areas where land is not available; public /private partnerships should be actively pursued. Incorporate long-range planning for magnets 1 choice, alternative programs, and Exceptional Student Education (ESE) programs as updated in March of each year. As space and funds become available, implement Board priorities and legislative mandates for R Class size reduction R Other programs as determined by the Board. Develop articulation patterns that support cohesive communities as boundaries are modified. Purchase new sites necessary to support this Five-Year Plan and future needs and expand existing smaller sites in coastal communities. Assure gender equity.
Approximately 38% of the funds in the FY 2002-2006 CIP are dedicated to building new capacity to relieve crowded schools. The plan includes sixteen (16) new schools - 3 new high schools, 5 new middle schools and 8 new elementary schools. (See maps for general location.)
The plan also includes proposed classroom additions/modernizations at twenty-two (22) schools as follows: four high schools (Atlantic, Forest Hill, Lake Worth, and Wm. T. Dwyer), five middle schools (Boca Raton, Congress, Conniston, Lantana and Middle School of the Arts), and thirteen-elementary schools (Belvedere, Boca Raton, Coral Sunset, Forest Hill, Hammock Pointe, Jupiter, Lake Park, Palmetto, Palm Springs, Roosevelt, South Olive, U.B.Kinsey1 Palmview and West Gate). These projects will include core and program support space comparable to new schools of similar size.
In 2000 the State Legislature passed legislation requiring School Districts to construct "small" schools. School Districts will be required to construct elementary schools no larger than 500 students; middle schools no larger than 700 students; and high schools no larger than 900 students if the planned schools are not under design contract by July 1, 2003. In the FY 2002 - 2006 Five Year Plan all new school projects will be in process prior to this date. However, this legislative requirement may effect future planning documents.
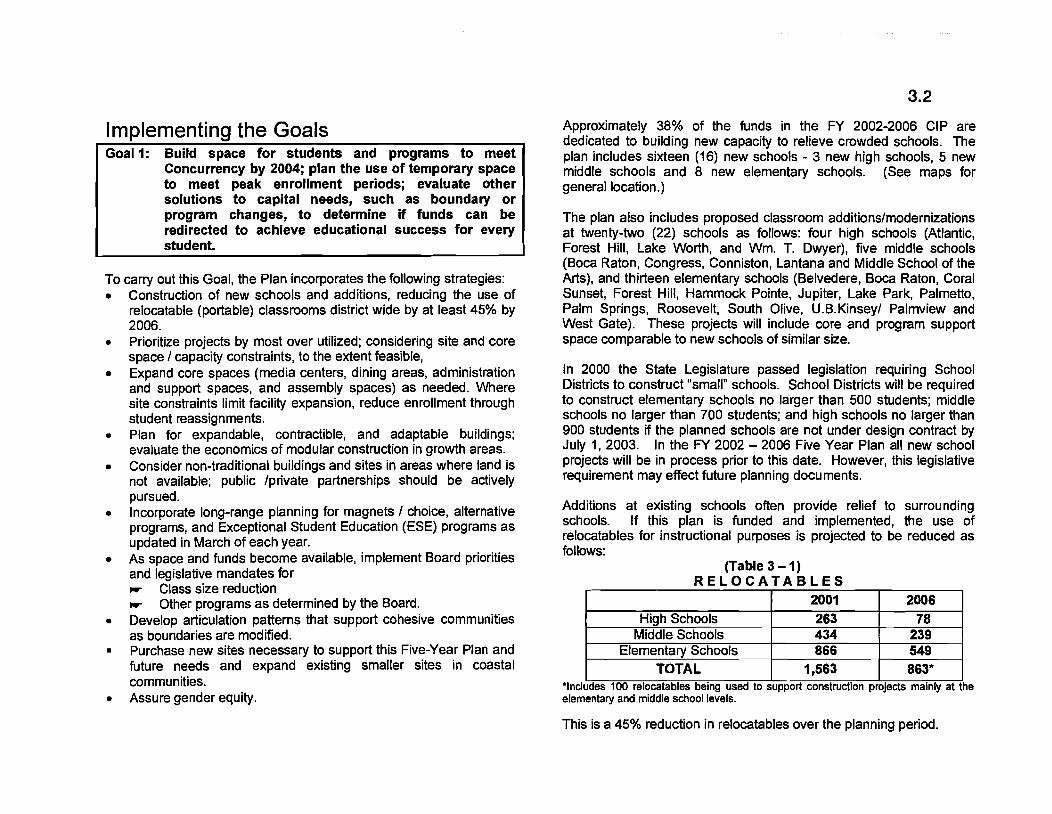
Additions at existing schools often provide relief to surrounding schools. If this plan is funded and implemented, the use of relocatables for instructional purposes is projected to be reduced as follows:
(Table 3-1) R E L O C A T A B L E S
I I
'Includes 100 relocatables being used to support construction projects mainly at the elementary and middle school levels.
Hiah Schools
This is a 45% reduction in relocatables over the planning period.
239 549 863*
~ i c k l e Schools 1
2001 263
Elementary Schools TOTAL
2006 78
434 866
1,563

The following tables (3-2; 3-3; 3-4) summarize the recommended capacity increases of 32,353 student seats included in this plan.
(Table 3 - 2) N E W H I G H S C H O O L C A P A C I T Y
Addition of Capacity
Opened1 Completed
Planning Number
Lake Worth -
Boynton Beach
Central West 98-JJJ Aug 2003 Palm Beach Lakes Palm Beach Wellington Area + , / John I. Leonard
T / P. B. Gardens Wm. T. Dwyer i ! 2003 1 558 i Wm. T. Dqer ---r--L-l ,- -
!
Atlantic 12 I Aug 2004 i 253 I-- !
I --+-------- +
i !
Forest Hill -- I - + ---- 4 Aug 2 0 0 4 1 - 206 [ West BocalDelray / L
i j Olympic Heights Area 1 01-LLL 1 Aug 2 0 1 1,800 Spanish River
-. -------C Atlantic
West Boynton ! 1 , Area / 91-EEE / Aug 2004 / 1,800 1 , Santaluces Lake
Additional1 New
Capacity
Total Capacity Added
Enrollment Relief To
10,073