board level employee representation, … of employee ownership/users/2010_ceo... · 1 board level...
TRANSCRIPT

1
BOARD LEVEL EMPLOYEE REPRESENTATION,
EXECUTIVE REMUNERATION AND FIRM PERFORMANCE IN
LARGE EUROPEAN COMPANIES
Sigurt Vitols
March 2010
The author gratefully acknowledges the support of the Hans Böckler Foundation for this research project. Thanks to members of the SEEurope network for answering specialized questions on employee representation systems in their countries and to Tomaso Duso and Joe Clogherty for advice on econometrics. Special thanks go to Aline Conchon for extensive help on sources for identifying board level employee representatives and to Norbert Kluge for extensive advice on studying worker participation.

2
Abstract
Although there is a large literature on the remuneration of managers and a growing number of econometric studies on the effects of board level employee representation (BLER) on company performance, only a handful of studies have focused on the relationship between these two issues. Furthermore, the vast majority of studies in both areas are on the national level and cross-national comparative literature is just emerging. This paper aims at helping fill this gap by summarizing the results of an analysis of the impact of board level employee representation (BLER) on the structure and level of management remuneration and on company performance in the 600 largest listed European companies. The main findings are that there is a strong and statistically significant negative relationship between BLER in a company on the one hand and the use of stock options as well as total CEO remuneration on the other hand. In other words, BLER is associated with less frequent use of stock options and lower total CEO remuneration. Furthermore, BLER does not have a negative impact on operating performance (specifically on return on assets or ROA) or on stock market valuation (specifically on the Price/Book Ratio). These results also hold when accounting for endogeneity. However, difficulties in controlling for country-specific effects raise issues regarding the direction of causality and possible unobserved effects. The lack of a simple causal link from BLER to executive remuneration suggests a new research agenda exploring the complex relationships between worker participation and various components of company culture and behavior, based on both newer statistical methods such as latent variable analysis and on case studies of causal mechanisms.

3
1. Introduction
Although there is a large literature on the remuneration of managers and a growing number of
econometric studies on the effects of board level employee representation (BLER) on
company performance, only a handful of studies have focused on the relationship between
these two issues (see literature review below for a discussion of these). Furthermore, the vast
majority of studies in both areas are on the national level and comparative literature in this
area is just emerging.
In principle, however, worker participation could have a large influence on the structure and
level of executive remuneration. In the interests of a healthy company culture and working
climate, worker representatives have an interest in keeping the pay gap between rank-and-file
workers and top management from getting too large. Furthermore they have an interest in
aligning the incentives of management and workers to avoid situations where workers get hurt
but managers do better (e.g. when there are large scale layoffs but stock price and thus the
value of stock-oriented incentives goes up). Finally, in contrast to the short-term orientation of
institutional investors, workers have a long-term interest in the company and will therefore be
critical of short-term incentives for management.
This paper summarizes the results of a study of the impact of board level employee
representation (BLER) on the structure and level of management remuneration in large
European companies. Specifically, the presence or absence of a representative of workers on a
company board (i.e. the company board in a one-tier board system or in either the supervisory
or executive board in a two-tier board system) is treated as a dichotomous variable in a set of
regression models. These models are designed to identify the determinants of four kinds of
dependent variables: 1) whether or not stock options are used in the remuneration of top

4
management at a company and 2) the level of total annual remuneration of the CEO at a
company (including base salary, bonus, long term incentives, stock options and stock).
Finally, given the interest in previous studies in the impact of codetermination on economic
performance, models for the determinants both 3) operating performance (return on assets or
ROA) and 4) stock market valuation (P/B or Price/Book Ratio) were also analyzed. These
models were estimated for a dataset for 2005-2008 based on the 600 largest European listed
companies (STOXX 600), with size being defined by free float market capitalization at the
end of December 2008.
The main findings of the study are that there is a strong and statistically significant negative
relationship between BLER in a company on the one hand and the use of stock options as well
as total CEO remuneration on the other hand. In other words, BLER is associated with less
frequent use of stock options and lower total CEO remuneration. Furthermore, BLER does not
have a negative impact on operating performance (specifically on ROA) or on stock market
valuation (specifically on the Price/Book Ratio). These results also hold when accounting for
endogeneity. However, difficulties in controlling for country-specific effects raise issues
regarding the direction of causality and possible unobserved effects. The lack of a simple
causal link from BLER to executive remuneration suggests a new research agenda exploring
the complex relationships between worker participation and various components of company
culture and behavior, based on both case studies and newer statistical methods such as latent
variable analysis.
This paper first gives a brief overview of the main findings of the literatures on executive
remuneration and codetermination and reviews the few studies which examine the
relationship between the two. The paper then discusses the data sources and methodology

5
used in the study, followed by sections discussing the results of the analysis and implications
for future research.
2. Literature Review
In part due to the large increases in management pay over the past decades an enormous
literature on the determinants of director’s pay has emerged (see e.g. Murphy 1998 and Otten
2007 for reviews). Much of this literature is based on studies of the US, due to stronger
disclosure requirements there for listed companies and the availability of databases containing
this data (e.g. Execucomp). These studies show that a number of structural variables (e.g.
company size and main sector of activity) play an important role in explaining the level of
management pay. However, even when taking these into account, the “unexplained variance”
is quite high, leading to a search for additional factors that might explain systematic variation
(Otten 2007). Another puzzle is created by the great increase in management remuneration
over the past decades, especially in its “variable” components, which far outstrips the increase
in other factors such as company size or stock market value. Although this increase has been
defended by some who claim that the increased costs of remuneration have been more than
paid for through more efficient contracting and governance structures, an increasing number
of contributions have become quite critical of these trends and questioned whether modern
compensation systems are really efficient and in the interests of stakeholder groups other than
managers. The most prominent contribution here is Pay without Performance (Bebchuk and
Fried 2004) as well as subsequent studies by these authors which show that management
remuneration is weakly (if at best) tied to real economic value added.
Particularly controversial is the use of stock options in director remuneration packages.
Initially the literature was very much dominated by the view of Michael Jensen and his

6
collaborators that stock options are an efficient way of overcoming the conflicts of interest
between shareholders and managers (see e.g. Baker et al. 1998). In recent years however the
use of stock options has become quite controversial, with critics arguing that they create an
incentive for boosting short-term share price performance – if necessary through fraudulent
means – at the possible expense of longer-term investment and performance (Marquandt et al.
2009; Albuquerque 2009). A number of studies have linked stock options with certain
unsavory practices, including accounting fraud, cutting of R&D expenditures to meet
financial analyst expectations, and the “back-dating” of the initial grant of options to the date
when share price is lowest (Armstrong et al. 2009). Supporters of stock options claim that the
problems were caused by the improper design of stock option plans and could theoretically be
remedied through well-structured plans (e.g. Jensen et al. 2004). However, critics have argued
that the lack of “downside” risk together with unlimited profit potential in stock options
creates an asymmetric incentive for managers, which is not compatible with the interests of
other stakeholders, particularly in the case of the banking industry (Bebchuk and Spamann
2009).
With the exception of the UK, which also has had stricter requirements for transparency on
remuneration of top executives for a number of years, earlier research on other countries as
well as cross-national comparisons was hampered by a lack of good data. Outside of the US
and UK companies were typically not required to disclose remuneration on an individual
basis. In Germany, for example, prior to corporate governance reform in the early 2000s,
companies were only required to report aggregate pay for the management boards. A further
question was on what components were actually included in this lump sum, since the rules on
reporting pension contributions, the value of non-financial perks, and stock option packages
were not clearly defined.

7
This situation has however improved as many countries have increased their remuneration
reporting requirements in recent years, particularly for the top-paid executive in companies
listed on the stock market. A number of new studies have emerged based on this data, many
of these focusing on the puzzle of why US firms pay their executives much more than
companies based in other countries (Otto and Heugens 2007; Brenner and Schwalbach 2008;
Fernandes et al. 2009).
The literature on the effect of BLER on managerial compensation is much smaller in contrast.
For Germany Vitols (2008) finds that strong board level codetermination is associated with
lower CEO pay and a lower proportion of equity-oriented pay. However, using a different
measure of codetermination strength and a different time period, Hörisch (2009) finds no
significant effect on average pay in the management board. In a study on US companies
Gomez and Tzioumis (2006) find that union representation at companies is associated with
lower total compensation and variable pay, without a loss of performance sensitivity. What is
particularly interesting about this study is that this association exists, even without
representation of workers on company boards, where presumably decisions about
management compensation are made.
The literature on BLER effects on company performance in Germany is larger, though still
not nearly as large as the literature on the effect of works councils on various measures of
performance. The methodologies used and the dependent variables examined are quite varied.
However, a recent comprehensive review of the econometric literature on BLER in Germany
shows that, on the whole, worker representation has no negative effects on company
performance (Jirjahn 2006), with the majority of studies on operative performance showing
positive effects.

8
A somewhat different approach looking at the association between BLER and performance at
the country level also finds a positive correlation between strong rights and good
performance. The Kluge/Stollt classification of board level rights in European countries has
been used in at least two studies: Belloc (2009) found a positive relationship between extent
of rights and innovative activity, and Vitols (2005) also found a positive relationship with a
variety of economic and social indicators. The European Participation Index (EPI), developed
by Vitols/Kluge/Stollt, uses the Kluge/Stollt classification as one of three dimensions of
worker participation, the other two being participation at the plant level and participation
through collective bargaining. The group of EU countries scoring highest on this index
perform much better on a broad range of indicators of the Lisbon strategy (economic, social
and environmental) than the group of countries scoring lower (ETUI 2009).
3. Hypotheses
Based on this review of the literature, the following hypotheses are derived for testing in this
study. In each case the hypotheses assume “other things being equal”, i.e. other factors
influencing management remuneration or company performance (e.g. company size or sector)
are held constant.
The first set of hypotheses are derived from worker representatives’ interests in a) orienting
management away from share price and towards “real” performance indicators, b) keeping the
gap between top management and worker pay from getting too large and c) trying to avoid
situations where management benefits when workers get hurt. Since workers can use their
board level representation as a means of influencing management pay along these lines, the
following two hypotheses can be derived:

9
Hypothesis 1a: Companies with BLER are less likely to have a stock option program.
Hypothesis 1b: Total CEO pay is lower at companies with BLER.
The second set of hypotheses are derived from the widespread belief that two tier systems are
better at monitoring management than one tier systems, since two tier systems are in principle
more independent of top management than one board systems (where the main board is often
chaired by the CEO). Thus two tier systems will be in less need of stock options to control
management behavior, and also top management will be less able to extract rents (i.e. higher
pay then justified by performance).
Hypothesis 2a: Companies with a two tier board structure will be less likely to have a
stock option program than companies with a single tier board structure.
Hypothesis 2b: Companies with a two tier board structure will be associated with a
lower level of total CEO pay than would be the case with a single board structure.
It is frequently argued in the literature that large shareholders have both an interest in and
incentive to closely monitor management as well as the power to influence management.
Therefore we derive the third set of hypotheses which are closely related to the second set of
hypotheses.
Hypothesis 3a: The presence of a large shareholder will be associated with a lower
probability of having a stock option program.
Hypothesis 3b: The presence of a large shareholder will be associated with a lower
total level of CEO pay.
In the newer literature it is argued that shareholders without board representation have little
ability to influence management remuneration. Based on this belief a number of institutional

10
investors are demanding the right to vote on remuneration policy for executive directors at the
annual shareholder meeting. A few of countries have introduced this obligation into company
law. Therefore we expect that:
Hypothesis 4a: Companies with headquarters in countries in which shareholders have
strong rights on remuneration policy determination (“say on pay”) will be less likely to
have a stock option program than companies in countries where shareholders have no
legal rights over remuneration policy.
Hypothesis 4b: Companies with headquarters in countries in which shareholders have
strong rights on remuneration policy determination (“say on pay”) will have lower
total pay for their CEOs than is the case in companies located in countries where
shareholders have no legal rights over remuneration policy.
And finally, based on the numerous studies on BLER and economic performance in Germany
(and to a lesser extent in other countries) which indicate no negative impact of BLER on
company performance, we derive the following set of hypotheses:
Hypothesis 5: Companies with BLER will not be less profitable than companies
without BLER
Hypothesis 6: Companies with BLER will not have a lower stock market valuation
than companies with BLER
4. Data and Methodology
The sample examined in this study included the largest 600 listed companies in Europe at the
end of December 2008. Size here is defined by free float market capitalization, i.e. the market
value of shares outstanding which are not held by large investors. This list is maintained by

11
Dow Jones for its STOXX index series, in this case for the STOXX600 index which includes
the EU15 countries, Switzerland, Norway and Iceland. In all, companies from 17 countries
were included in the study, since Iceland had no companies in the list at the end of 2008 (see
table 1).1 This list includes basic data for each company, including the home country, main
sector of activity and the percentage of shares not owned by large investors (“free float”).
[Table 1 about here]
The countries most heavily represented in the sample were, in order, the UK (159 companies),
France (82), Germany (61) and Switzerland (53). One interesting fact is the imperfect
correlation between country size and the number of companies in the sample: whereas the UK
and Italy have roughly the same populations, the UK has almost five times as many
companies in the sample as Italy. Similarly, although Switzerland is much smaller than
Germany, it has almost as many companies in the sample as Germany. This reflects the
different economic structures in the countries as well as the different degrees of
internationalization of their companies.
In addition data was gathered on the board structure and composition of the 600 companies.
The main sources of data for these variables were the online database BoardEx, company
annual reports and company websites. For this study, of primary relevance was whether the
company had a single or dual board structure and whether employee representatives are
included as voting members of these boards.
Single or dual board structures
1 Four Icelandic banks included in the middle of the decade were dropped from the list due to financial difficulties during the financial crisis.

12
In single board systems top executives responsible for the day-to-day management of the
company are included in the board, whereas in dual board systems day-to-day managers are
on the executive board but not included in the supervisory board, which in theory oversees the
executive board and decides the company’s strategy.2 Whereas in the past all listed companies
in most countries had either single or dual board structures, the situation has become more
complex in recent years. Some countries have introduced options for companies to choose
between single and dual board structures. Some companies that are formally single tier have
also excluded day-to-day managers from their company board, in effect creating a dual tier
structure. In this study the variable used here was a dichotomous variable labeled
TWOTIER, which is coded 1 if there is a two tier board structure, and 0 for a one tier board
structure.
BLER systems
BLER systems vary highly from country to country (see Figure 1; for more detail on countries
see HBF/ETUI 2004). Four of the countries in the sample (UK, Switzerland, Belgium and
Italy) have no formal rules for BLER, but the other 13 countries have legislation regulating
BLER, ranging from mandatory inclusion of worker representatives in all companies with
specific legal structures above a certain threshold (e.g. Germany) to voluntary systems
depending on worker initiative and, in some cases, agreement by management and/or
shareholders (e.g. France and Finland). In some countries BLER is mainly restricted to state-
owned or recently privatized companies. In some countries the parameters of BLER system
are clearly defined by legislation and court decisions (e.g. Germany) whereas in other systems
different options are allowed (e.g. France). Finally the mode by which employee
2 Some companies in the sample with significant state ownership had a third board mainly composed of political representatives and appointees. These were treated in the same category as two-tier boards due to the exclusion of executives from the highest supervisory boards.

13
representatives are chosen varies highly from country to country; whereas some
representatives are elected by the workforce in other countries they are appointed by trade
unions or works councils. In our sample a few SEs (European Companies) were also included,
which are enabled by European legislation, and in which BLER is determined through
negotiations between management and labor representatives. The number of BLER included
also varied widely, ranging from one member in some cases to half of the board members
(which is the case in German companies with over 2,000 workers employed domestically).
[Figure 1 and Table 2 about here]
For this study BLER was determined to be present if one or more of the voting members of
either the company board (in single board systems) or the supervisory or executive board (in
dual board systems) was either elected by workers in the company or appointed by trade
unions. This definition excludes the following types of employee representatives who are
observers at board meetings (e.g. workers councilors at many French companies) or elected
representatives of employee shareholders (who are also present at a number of French and
other companies). This definition also excludes Dutch companies. Dutch law allows works
councils to nominate a candidate for the board to the shareholder assembly. However this
person cannot be a member of the workforce or a trade union official, and furthermore the
shareholder assembly has the right to turn down this nomination. In practice these works
council-nominated members are not identified as such in company reports or company
websites. Finally, this provision does not apply to Dutch companies with the majority of their
employment outside of the Netherlands, which is the case for most Dutch companies in this
sample.
14
Due to the heterogeneity of industrial relations systems in the 17 countries the prevalence of
BLER varied greatly across countries in our sample. Whereas 93 percent of the German
companies and 82 percent of the Austrian, Danish and Norwegian companies had BLER,
seven countries in the sample had no companies with BLER. In all 22 percent of the
companies had BLER according to the definition used in this study.3 Since companies with
BLER were on average larger than companies without BLER, the percentage of employees in
the sample working for companies with BLER was 30 percent, i.e. considerably higher than
the percentage of companies.
In summary BLER is a binary variable coded 1 if there is at least one employee
representative included as a voting member of a key company board, and 0 if this is not the
case.
Remuneration Data
For this study two types of dependent variables for remuneration were utilized: 1) existence of
stock option plans for managers and 2) total remuneration for the CEO.
The presence of stock option programs as part of the compensation of managers is relatively
transparent, since in all the countries under examination management must get approval from
the shareholders for measures that may affect company capital and the value of stock. Stock
option programs are one of these types of measures, since the granting of a large number of
stock options potentially creates a large liability for the company if these stock options are
actually exercised. Furthermore, the European Union has required all listed companies to
adopt international accounting standards, and one component of these standards requires 3 This percentage reflects the bias in the sample towards the UK companies, which has a disproportionate number of large listed companies but no formal BLER system.

15
companies to disclose the costs of stock option programs. The European Federation of
Employee Share Ownership (EFES) 2008 survey, which covers 2533 company groups in
Europe, includes information about whether or not the company has a stock option plan. Thus,
although individual-level details on remuneration may not be available, the EFES survey
provides information on the use of stock options at 563 (or 94 percent) of the 600 companies
in the study.
A second dependent variable is the total annual remuneration of the CEO. The four years
2005 to 2008 were examined. Where available, data was gathered on the total annual
compensation of the CEO and its breakdown into the following major categories: salary,
bonus, long term incentive program (LTIP), stock options, stock, pension contribution and
additional benefits (e.g. company car, company housing, etc.). The main sources of this
remuneration data were the online data base BoardEx (which breaks down remuneration into
the categories just mentioned, when available) and company annual reports.
In practice reporting requirements for executive remuneration vary quite widely among the
countries in the sample. In some countries detailed reporting on remuneration systems and
levels is required for a number of top executives (e.g. UK). In other countries reporting for
individual managers is not required (e.g. Greece and Portugal). Instead, a total figure may be
given for the executive board, in the extreme case with no breakdown between the different
components. In between, some countries require disclosure only for the highest-paid manager
(e.g. Switzerland).
However, more disclosure requirements have been imposed over time in many of the
countries in the sample, and a number of larger listed companies voluntarily disclose more
remuneration information than is legally required.

16
As a result, individual-level information on CEO remuneration is available for at least one of
the four years under examination for exactly 500 (or 83 percent) of the 600 companies in the
study. At one extreme at least one year of CEO remuneration information is available for all
or practically all companies Ireland, the UK, the Netherlands, Denmark and Sweden.4 At the
other extreme in Portugal, Greece and Luxembourg only one of the relevant companies in
each of the countries has provided individual-level data on CEO compensation.
For the large majority of the companies in the sample, it is therefore possible to construct two
remuneration variables for use in statistical analysis.
The first remuneration variable, which is labeled STOCKOP, is a dichotomous variable
coded 1 if the company had a stock option plan in place for management in 2007/2008, and 0
if there was no management stock option plan.
The second remuneration variable is TOTALPAY, which includes the sum of the salary,
bonus, ancillary incentives, long term incentive payments, and the estimated value of stock
options -- these variables are labeled SALARY, BONUS, OTHER, LTIPS, and
ESTIMATED.5
TOTALPAY = SALARY + BONUS + OTHER + LTIPS + ESTIMATED
4 In some of these countries one or two companies may not have the data required, for example if the companies were listed only one year and the CEO was not employed continuously during the year. 5 Pension plan contributions and stock grants were excluded from this variable due to the highly inconsistent reporting practices not only between but also within countries. Thus TOTALPAY will be an understatement of true total CEO compensation in many companies.

17
In the regression estimations the logarithm of TOTALPAY was used, which was labeled
LOGTOTPAY.
In addition to the variables BLER, LOGTOTAL and STOCKOP a number of control
variables were used:
• Sector: Industry dummy variables for each of the 1-digit SIC industries based on the
main activity of the company were included. SIC0 is treated as the benchmark,
leaving nine dummy variables (SIC1 to SIC9) for the analysis.
• Country: To control for country effects dummy variables were included for each of
the countries, with the exception of the UK which was used as the benchmark
country. Companies were coded based on which country their headquarters were
based in. In all sixteen dummy variables were included: AUSTRIA, BELGIUM,
SWITZERLAND, GERMANY, DENMARK, SPAIN, FINLAND, FRANCE,
GREECE, IRELAND, ITALY, LUXEMBOURG, NETHERLANDS,
NORWAY, PORTUGAL and SWEDEN.
• Capital Market Size: Given the significant impact that size of company has on
remuneration practices a control variable was included based on the standardized
value of the logarithm of the stock market value of shares outstanding (market
capitalization) in billion euros LOGMCAPBEUR. This information is included in
the company files provided by Dow Jones.
• Product Market Size: As an alternative measure of size the total annual sales of the
company was taken. This is defined as the standardized value of the logarithm of

18
sales in million euros LOGSALES. This information was derived from
COMPUSTAT and from company annual reports.
• Ownership structure: Since the incentives and abilities of shareholders to monitor and
control managers is dependent upon the presence or absence of large shareholders, a
variable was included which measures significance of large shareholders in the
shareholding structure. The variable FREEFLOAT measures the proportion of
shares not held by large shareholders non-institutional investors, large being defined
as at least 5 percent of shares. The variable FREEFLOAT is thus an inverse measure
of the importance of large shareholders and ranges from 1 (100 percent freefloat i.e.
no large shareholders) to 0.05 (i.e. 95 percent of shares are held by one or more large
shareholders). By definition companies must have at least 5 percent freefloat to be
included in the STOXX 600 index. Information on this variable is included in the
company files provided by Dow Jones.
• Employment Size: Given that is only a partial correlation between different measures
of company size, the most common of which are stock market value (i.e. market
capitalization), sales, and number of employees, an alternative measure of company
size was included, labeled LOGEMP. This is defined as the standardized logarithm
of the number of employees working at a company in question. Some companies
have very few employees but a very high stock market value (e.g. listed private
equity companies), whereas some highly labor-intensive, low-productivity companies
have a large number of employees but a low stock market value (e.g. postal delivery).
Data for this variable was obtained from COMPUSTAT as well as from company
annual reports.

19
• Minority shareholder influence: There is a growing debate on the effects of giving
shareholders a larger say in the determination of management pay (“say on pay”). In
fact shareholders have some say over stock-market oriented components of
management pay (stock-option or share-based compensation) since shareholders
have a right to vote on policies affecting share capital. However, some institutional
investors are demanding stronger rights for shareholders through either non-binding
or binding votes in shareholders’ meetings over remuneration policies. Information
on the current legal framework for regulating management remuneration in EU
member states is summarized in Ferrarini et al (2009). Answers to a detailed
questionnaire submitted to experts in each country are available in the internet under
http://www.ecgi.org/remuneration/ecgi_ research.htm. Based on Ferrarini et al (2009)
and the questionnaire answers a dummy variable labeled SAYONPAY was defined
and coded “1” in countries which have strong shareholder rights on management pay
in 2007/2008 (the UK, Netherlands and Sweden), and otherwise with a “0”.
• Instrumental variables: In order to deal with the issue of potential endogeneity in the
relationship between BLER and CEO remuneration a number of additional variables
were defined. These could in theory function as instruments which predict BLER but
should be uncorrelated with the error term in the explanatory equation for
remuneration. Drawing on the literature on worker participation three instruments
were defined: STRIGHTS is based on a classification by Kluge and Stollt of EU
member states according to the strength and extensiveness of rights for board level
employee representation; this variable is coded “1” if the home country of the
relevant company has extensive BLER rights, “0” otherwise (see here www.worker-
participation.eu). In this study the following countries were identified as having such
strong rights: Austria, Denmark, Germany, Finland, Sweden and Norway. STATE is
20
coded if “1” if the largest shareholder of the company in question is a state entity
(either national, regional or local), “0” otherwise. BLER rights in some countries are
stronger for companies with significant state ownership or for recently privatized
companies (many of which still have a partial state ownership stake). Finally the
alternative measure of company size LOGEMP is also used here since BLER rights
in many countries exist for companies above a certain size (e.g. 500 domestic
employees for one-third BLER in Germany).
• Profitability: This variable is included both as a determinant of total pay (since
variable pay can be expected to be at least in part dependent upon the level of
profitability at a company) and as a dependent variable as a key measure of company
performance. In this study profitability is operationalized as return on assets or ROA,
the annual net income at a company divided by the total assets of the company at the
beginning of the fiscal year. To reduce the problem of outliers this variable was
winsorized at the 0.01 level.
• Stock market valuation: Given the interest in the potential influence of BLER on
stock market valuation the variable PBRAT was defined as the market value of the
company’s shares divided by the book (i.e. accounting) value of the company (total
assets minus total liabilities) at the end of the company’s fiscal year. This so-called
Price/Book Ratio is a measure of stock market valuation commonly used by investors
to identify over- or undervalued companies. To reduce the problem of outliers this
variable was also winsorized at the 0.01 level.

21
Models
The approach used in this paper is to estimate a series of regression equations based on the
appropriate functional form of the dependent and independent variables (Wooldridge 2002;
Rabe-Hesketh and Skrondal 2005):
Stock options
For STOCKOP both a probit and a bivariate probit estimation was used for two reasons.
Firstly both the dependent variable STOCKOP and the main independent variable of interest
BLER are dichotomous variables. In the main equation we are estimating the probability
(between 0 and 100 percent) of a company having a stock option program. Second the issue of
potential endogeneity requires a methodology for identifying the presence of and dealing with
this problem. The bivariate probit model allows for simultaneous estimation including the
potentially endogenous variable BLER in both the main equation and as a dependent variable
in the second equation, and a test statistic (Wald test) indicates whether endogeneity should be
a concern.
The main equation thus is specified as follows:
(1) STOCKOP = Constant + BLER + FREEFLOAT + TWOTIER + LOGMCAPEUR + Industry dummies
A second variant of this main equation also includes the variable SAYONPAY to measure the
potential impact of strong shareholder rights on pay over remuneration outcomes:
(2) STOCKOP = Constant + BLER + FREEFLOAT + TWOTIER + SAYONPAY + LOGMCAPEUR + Industry dummies

22
The second equation in the bivariate probit estimation includes BLER as a dependent variable
and the three instruments discussed above on the right hand side of the equation:
(3) BLER = constant + STRIGHTS + STATE + LOGEMP
Along with the bivariate probit estimation a test for whether or not the residuals of the two
equations are uncorrelated (Wald Test) can be generated. A positive result for this test would
suggest the lack of endogeneity for BLER, whereas a negative result would suggest that
BLER is endogenenous.
Total CEO Pay
A second set of equations focus on the total annual CEO remuneration at a company,
operationalized as LOGTOT or the logarithm of total CEO pay. Given observations on the
same set of companies over a number of years (2005-2008) these as well as the subsequent set
of equations can be estimated in both panel and pooled form. Drawing on the relevant
literature discussed in section 2 and the hypotheses developed in section 3, the following
models were estimated:
(4) LOGTOT = constant + BLER + ROA + FREEFLOAT + TWOTIER + LOGMCAPEUR + Industry dummies + Year dummies (5) LOGTOT = constant + BLER + ROA + FREEFLOAT + TWOTIER + SAYONPAY + LOGMCAPEUR + Industry dummies + Year dummies (6) BLER = constant + STRIGHTS + STATE + LOGEMP

23
Similar to the case of the models for STOCKOP, variants were defined both including and
excluding SAYONPAY. Given the potential impact on profitability on total pay (since this
may be included as a component of variable pay) a control variable was also included for the
profit rate ROA. To deal with the potential endogeneity problem, the same instruments were
used for BLER (6) as in equation (3).
Profitability (ROA)
A third set of equations are designed to estimate if BLER has an impact on the operating
performance of companies, measured in terms of return on assets (ROA). Variants with and
without SAYONPAY are included (equations 7 and 8).
(7) ROA = constant + BLER + FREEFLOAT + TWOTIER + LOGMCAPEUR + Industry dummies + Year dummies (8) ROA = constant + BLER + FREEFLOAT + TWOTIER + LOGMCAPEUR + SAYONPAY + Industry dummies + Year dummies
(9) BLER = constant + STRIGHTS + STATE + LOGEMP
In addition the same instruments as in the first two sets of equations are used for an
Instrumental Variables estimation (equation 9).
Stock market valuation (PBRAT)
The final set of equations are designed to measure the impact of BLER on stock market
valuation, measured in terms of the Price/Book value of the company PBRAT. As with the
first three sets of equations, variants are defined both including and excluding SAYONPAY.

24
(10) PBRAT = constant + BLER + FREEFLOAT + TWOTIER + LOGMCAPEUR + Industry dummies + Year dummies (11) PBRAT = constant + BLER + FREEFLOAT + TWOTIER + LOGMCAPEUR + Industry dummies + Year dummies
(12) BLER = constant + STRIGHTS + STATE + LOGEMP
In addition the same instruments are used for an Instrumental Variables estimation (equation
12).

25
5. Results
The results for the four sets of estimates (stock options, total CEO pay, profitability and stock
market valuation) are discussed in turn.
Stock options
Table 4 reports the results of a probit estimation of the determinants of stock option plans for
top managers in our sample companies (STOCKOP). Two models are estimated, one
including (Model 1) and one excluding (Model 2) SAYONPAY. For both variants, in the
main equation the variable BLER the coefficient is both negative and significant (at the 0.05
level), which is in line with Hypothesis 1a, that is, BLER is associated with a lower
probability of using stock options. The variable TWOTIER is not significant in both models,
which is surprising given the strong expectation that two tier boards will better be able to
monitor and control top executives (Hypothesis 2a). In both models the variable
FREEFLOAT is both positive and highly significant (at the 0.01 level), which is consistent
with the hypothesis that the presence of a large shareholder will be associated with a lower
probability of having a stock option plan (Hypothesis 3a). In model 2, the results for the
variable SAYONPAY are surprising since the coefficient is significant and positive,
contradicting the expectations of Hypothesis 4a and suggesting that greater shareholder rights
on pay are actually associated with a higher probability of having a stock option plan
(Hypothesis 4a).
Among the control variables the size variable LOGMCAPBEUR is, as expected, positively
related with the probability of having a stock option program. Industry effects were
surprisingly weak; only one industry dummy variable (SIC7) was significant, and this at the

26
relatively weak level of 0.1. The models were therefore re-estimated excluding the industry
dummies, with the results essentially similar (table 5).
In econometric studies of this type it has become commonplace to account for the possibility
of endogeneity, in this case being the possibility that there is a simultaneous determination of
STOCKOP and BLER or that there is an unobserved variable affecting both of these. For the
case of dichotomous dependent variables a bivariate probit model is appropriate for
controlling for this, using the potentially endogenous variable as a dependent variable in the
second equation.
The results of this procedure are reported in tables 6 and 7. In both sets of models, in the
second equation the instruments for BLER are all highly significant and the signs are in line
with expectations from the literature. For both sets of models the Wald test for rho = 0 (that is,
uncorrelated residuals in the two equations) is insignificant, indicating that the instruments are
appropriate. The results for the main independent variables are essentially similar to the
simple probit estimations reported above. While the coefficient of BLER still has the expected
sign (negative), its significance has dropped from 0.05 to 0.10.
Total CEO Pay
A second set of equations estimates the determinants of total annual CEO pay, operationalized
as the logarithm of total remuneration LOGTOT. Table 8 reports the results of a random
effects panel estimate of the determinants of LOGTOT. The Sargan-Hansen and
Breusch/Pagan LM tests indicate that the random effects estimation is preferable compared to
fixed effects and OLS estimations. In line with Hypothesis 1b, the coefficient for BLER is

27
negative and signicant at the 0.01 level, i.e. BLER is associated with lower levels of total
CEO remuneration.
Similar to the estimations for stock options, the presence of a large shareholder is associated
with a lower level of total CEO pay (Hypothesis 3b). The effect of a two tier board structure,
however, depends upon whether SAYONPAY is included or not. When SAYONPAY is
included (Model 2), TWOTIER is negative and significant (supporting Hypothesis 2b).
However, when SAYONPAY is included it becomes significant and positive (contradicting
Hypothesis 4b) and TWOTIER becomes insignificant (contradicting Hypothesis 2b).
Among the control variables the measure of company size LOGSALES is positive and
significant, and a number of industry and year dummies are significant. Wald tests indicate
that both sets of dummies should be retained. In particular the annual dummies are significant
and show an increase in pay between 2005-2007 but a significant decrease in the crisis year
2008.
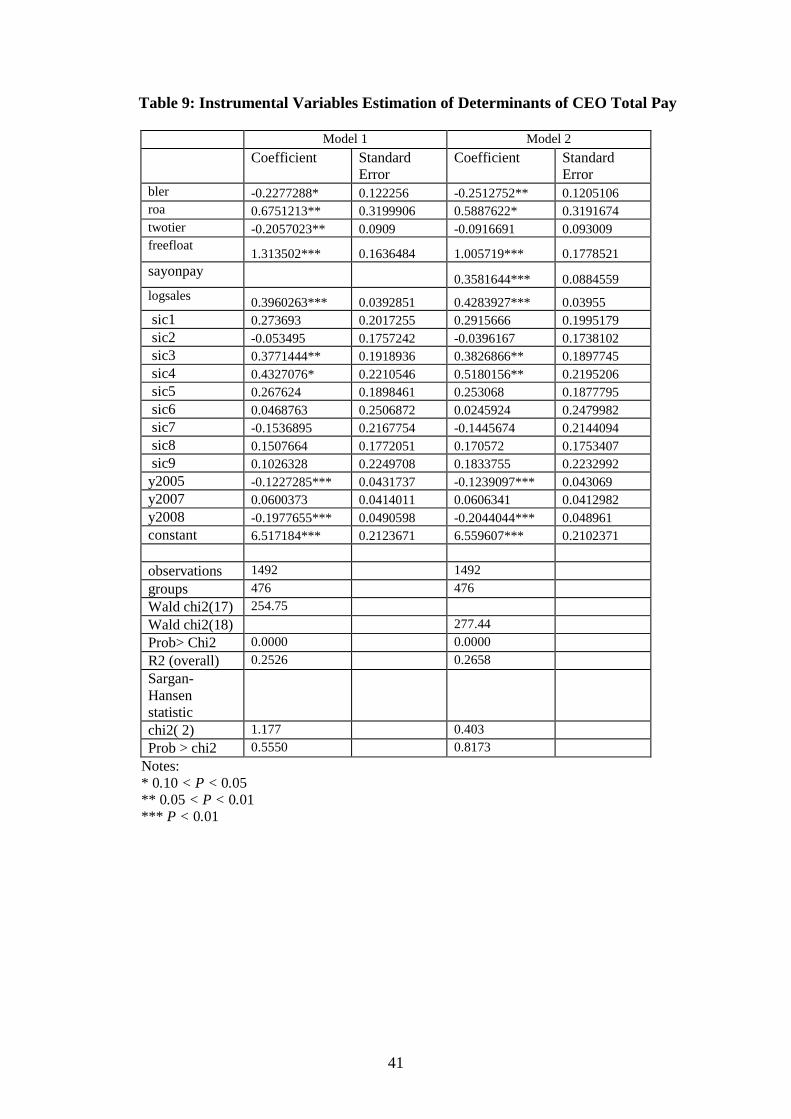
An instrumental variables estimation with the same instruments used for the stock option
estimations comes to the same conclusions regarding the hypotheses. The significance of
BLER even increases to the 0.05 level in Model 2 of the IV estimation. The Sargan-Hansen
statistic indicates the appropriateness of the instruments.
Return on Assets (ROA)
The results of the random effects panel estimates of the determinants of ROA are reported in
table 10. In line with Hypothesis 5 the coefficient of BLER is insignificant, i.e. BLER does
not decrease profitability. Interestingly, larger companies seem to be less profitable, given that

28
LOGSALES has a negative and significant coefficient. A number of industry and year
dummies are significant and Wald tests indicate the appropriateness of keeping these
dummies in the estimation.
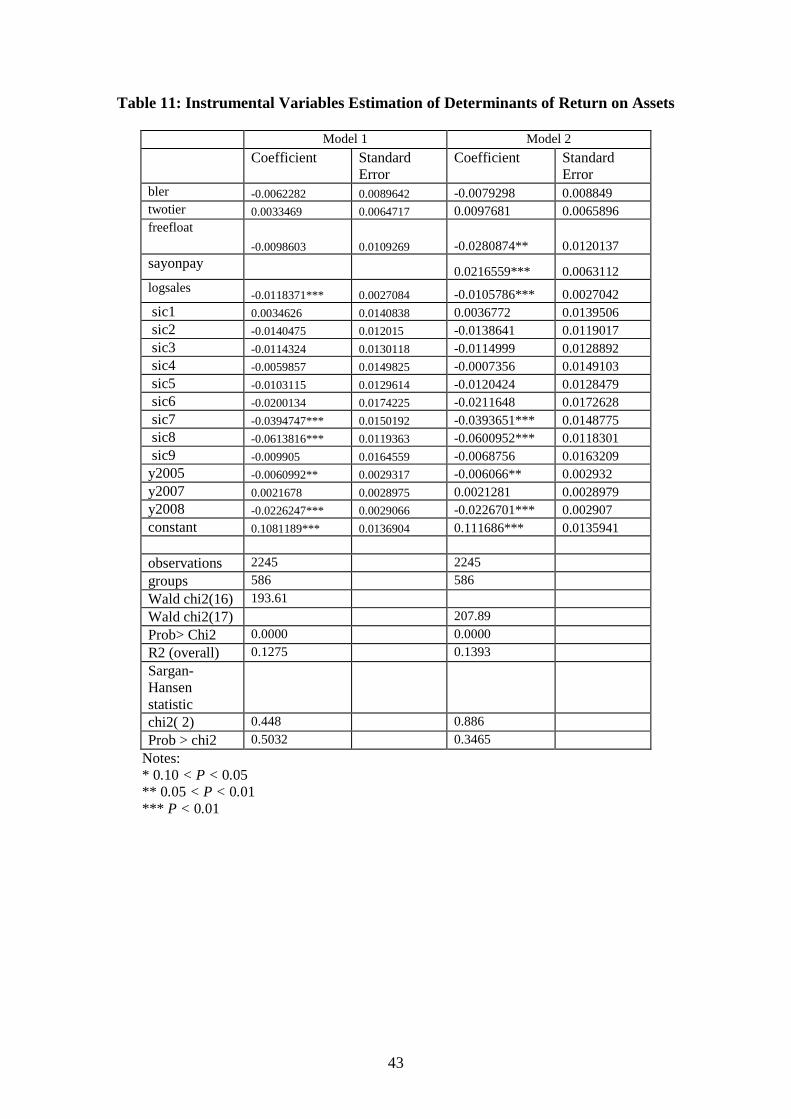
For the IV regression the same set of three instruments for BLER were included as in the
previous sets of equations. For this estimation, however, the Sargan-Hansen statistic was
significant, indicating the inappropriateness of this combination of instruments. The IV
equation was re-estimated with different subsets of these instruments. The Sargan-Hansen test
indicates that it is appropriate to keep STRIGHTS and STATE in the estimation and to
exclude the third instrument LOGEMP. The IV regression reported in table 11 confirms the
insignificance of BLER and thus Hypothesis 5.
Stock Market Valuation (PBRAT)
The final set of random effects panel estimations also show that BLER is not associated with
a lower stock market valuation PBRAT, i.e. in line with Hypothesis 6. The coefficient of
BLER is not significant in the results reported in table 12. The effects of the other variables
have broadly similar effects on PBRAT as they did on ROA. The IV estimates, for which the
two instruments STRIGHTS and STATE are appropriate, also support Hypothesis 6 (i.e. no
negative effects of BLER on stock market valuation.
Country Effects
In all of the above models estimations were also run including country effects in the form of
dummy variables. However, the instability of results question the appropriateness of the
inclusion of the country dummies in these estimations. In the probit estimates many countries

29
were dropped due to the perfect predictions generated by some of the variables. In the random
effects estimates many coefficients were quite unstable from one model specification to the
other. This is perhaps not surprising given the high correlation of country and presence of
BLER; table 2 reports a strong polarization between on the one hand countries in which all or
almost all companies have BLER and on the other hand countries where no or almost no
companies have BLER.
6. Discussion and Conclusions
The results of the econometric analysis reported here provide evidence that board level
employee representation (BLER) is significantly associated with certain management
remuneration practices, specifically with a lower probability of using stock options and a
lower level of CEO total pay. At the same time BLER does not appear to be associated with a
lower level of profitability or stock market valuation. Given the public criticism of the use of
stock options and high levels of CEO pay, BLER thus appears in a favorable light in terms of
controlling these controversial practices.
While these results are noteworthy, at the same time caution regarding inferences on the
direction of causality should be exercised. While in principle the inclusion of country
dummies would be desirable in order to isolate country-specific effects (and thus possible
unobserved variables that influence both BLER and the dependent variables measured), the
polarization between countries with extensive BLER and those without makes it difficult to
isolate these country-specific effects.

30
For future research these results would suggest that a larger sample of companies be
examined, particularly in countries where there is a more even mix between companies with
and without BLER.
A further possibility for future research would be to use an approach which has not yet been
applied to this area, namely the estimation of so-called latent variable models. This approach
treats different company types (e.g. "solidaristic" versus "competitive", "shareholder" versus
"stakeholder") as unobservable variables, for which however different indicators exist (e.g.
existence of worker participation, reporting on sustainability performance). The use of the
latent variable approach would help deal with the tricky question of causality. This approach
could be supplemented with case studies of BLER in companies to examine how causal
mechanisms work in practice.

31
Table 1: Company Sample Characteristics and Remuneration Data Availability
Country Firms in sample
Total employment (in millions)
% firms with BLER
% employes covered by BLER
% firms with CEO remuneration information
% firms with stock option information
AT 11 1.6 82% 80% 45% 100% BE 17 2.6 0% 0% 82% 76% CH 53 7.4 4% 2% 70% 85% DE 61 24.9 93% 98% 90% 98% DK 17 1.7 82% 58% 47% 100% ES 37 7.0 0% 0% 62% 97% FI 18 2.1 11% 8% 78% 100% FR 82 31.8 15% 20% 96% 91% GB 159 36.0 0% 0% 99% 95% GR 12 1.1 17% 30% 8% 100% IE 7 0.9 0% 0% 100% 100% IT 37 6.5 0% 0% 76% 97% LU 3 1.7 33% 99% 33% 100% NL 29 9.0 0% 0% 97% 93% NO 11 1.0 82% 97% 82% 100% PT 11 1.1 0% 0% 9% 91% SE 35 6.0 69% 96% 94% 89% Total 600 142.3 22% 30% 83% 94%

32
Figure 1: Map of BLER Rights in Europe
Source: Kluge and Stollt (2010), from www.worker-participation.eu
33
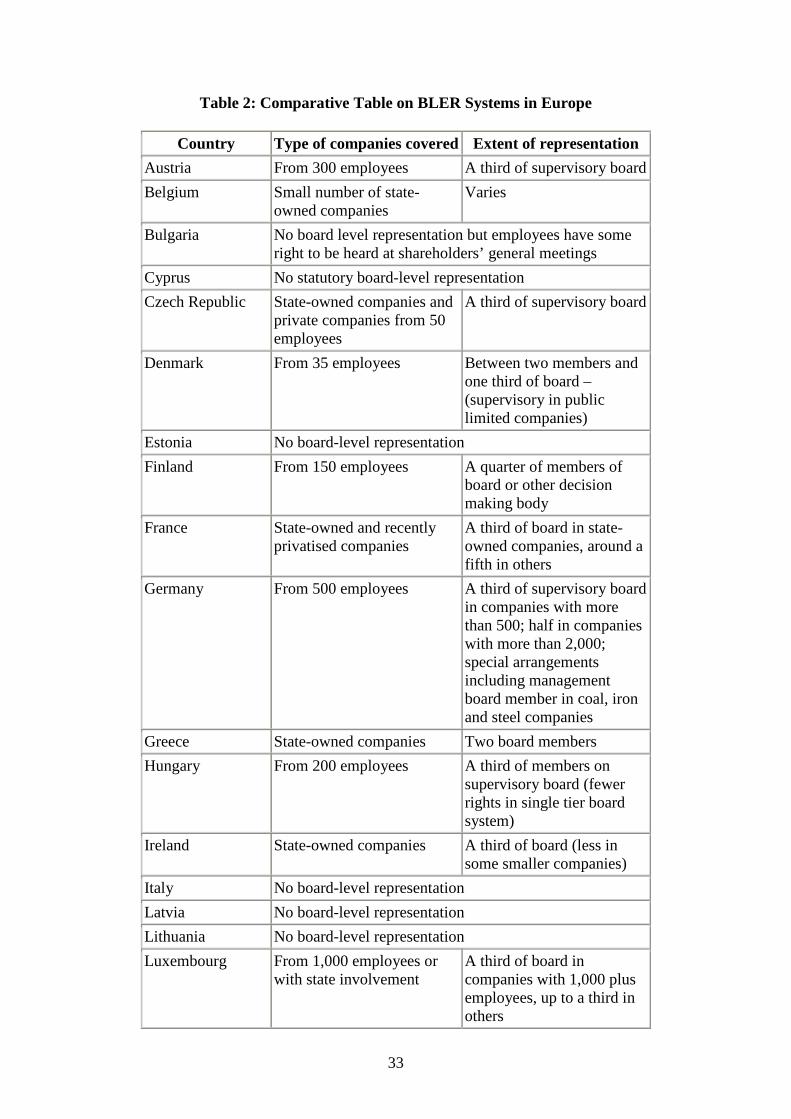
Table 2: Comparative Table on BLER Systems in Europe
Country Type of companies covered Extent of representation
Austria From 300 employees A third of supervisory board
Belgium Small number of state-owned companies
Varies
Bulgaria No board level representation but employees have some right to be heard at shareholders’ general meetings
Cyprus No statutory board-level representation
Czech Republic State-owned companies and private companies from 50 employees
A third of supervisory board
Denmark From 35 employees Between two members and one third of board – (supervisory in public limited companies)
Estonia No board-level representation
Finland From 150 employees A quarter of members of board or other decision making body
France State-owned and recently privatised companies
A third of board in state-owned companies, around a fifth in others
Germany From 500 employees A third of supervisory board in companies with more than 500; half in companies with more than 2,000; special arrangements including management board member in coal, iron and steel companies
Greece State-owned companies Two board members
Hungary From 200 employees A third of members on supervisory board (fewer rights in single tier board system)
Ireland State-owned companies A third of board (less in some smaller companies)
Italy No board-level representation
Latvia No board-level representation
Lithuania No board-level representation
Luxembourg From 1,000 employees or with state involvement
A third of board in companies with 1,000 plus employees, up to a third in others
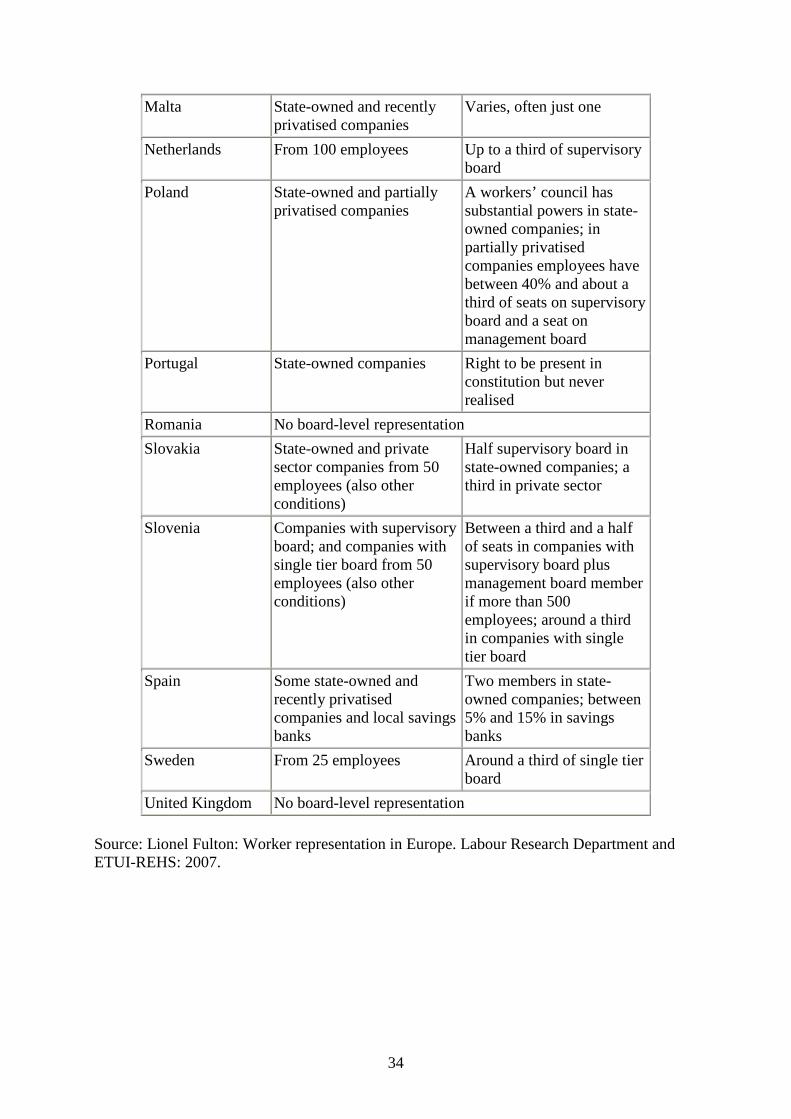
34
Malta State-owned and recently privatised companies
Varies, often just one
Netherlands From 100 employees Up to a third of supervisory board
Poland State-owned and partially privatised companies
A workers’ council has substantial powers in state-owned companies; in partially privatised companies employees have between 40% and about a third of seats on supervisory board and a seat on management board
Portugal State-owned companies Right to be present in constitution but never realised
Romania No board-level representation
Slovakia State-owned and private sector companies from 50 employees (also other conditions)
Half supervisory board in state-owned companies; a third in private sector
Slovenia Companies with supervisory board; and companies with single tier board from 50 employees (also other conditions)
Between a third and a half of seats in companies with supervisory board plus management board member if more than 500 employees; around a third in companies with single tier board
Spain Some state-owned and recently privatised companies and local savings banks
Two members in state-owned companies; between 5% and 15% in savings banks
Sweden From 25 employees Around a third of single tier board
United Kingdom No board-level representation
Source: Lionel Fulton: Worker representation in Europe. Labour Research Department and ETUI-REHS: 2007.
35
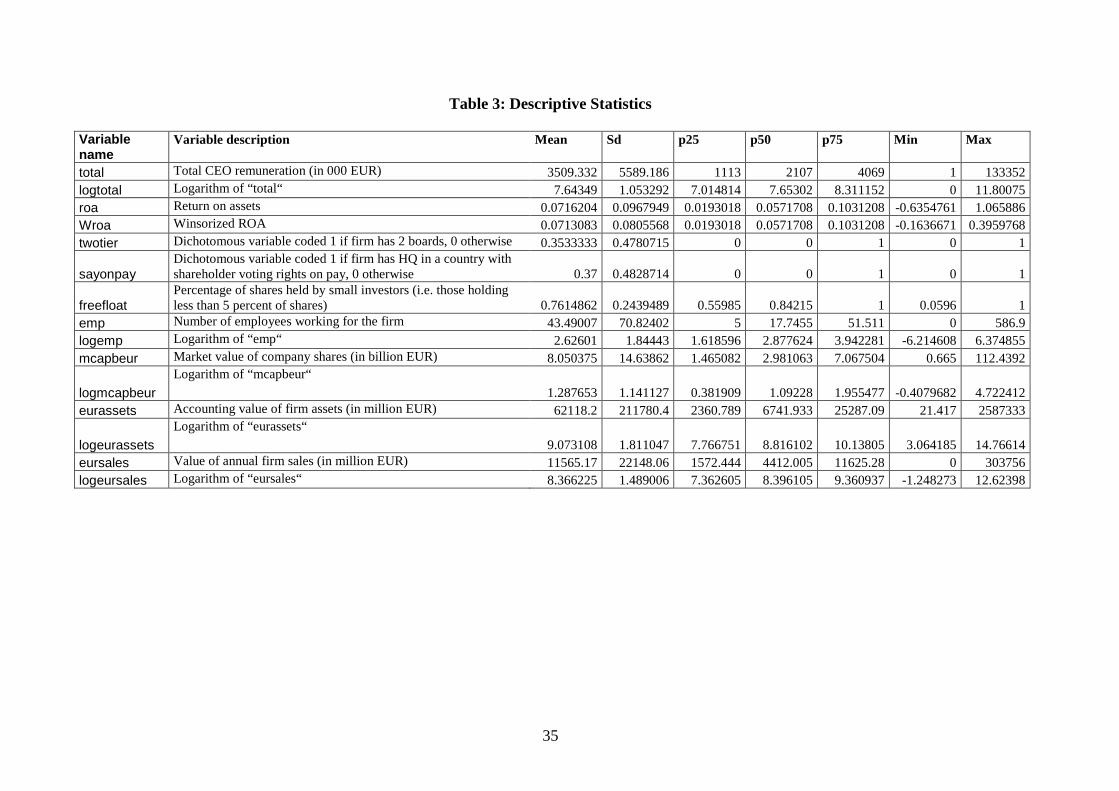
Table 3: Descriptive Statistics Variable name
Variable description Mean
Sd
p25
p50
p75
Min
Max
total Total CEO remuneration (in 000 EUR) 3509.332 5589.186 1113 2107 4069 1 133352 logtotal Logarithm of “total“ 7.64349 1.053292 7.014814 7.65302 8.311152 0 11.80075 roa Return on assets 0.0716204 0.0967949 0.0193018 0.0571708 0.1031208 -0.6354761 1.065886 Wroa Winsorized ROA 0.0713083 0.0805568 0.0193018 0.0571708 0.1031208 -0.1636671 0.3959768 twotier Dichotomous variable coded 1 if firm has 2 boards, 0 otherwise 0.3533333 0.4780715 0 0 1 0 1
sayonpay Dichotomous variable coded 1 if firm has HQ in a country with shareholder voting rights on pay, 0 otherwise 0.37 0.4828714 0 0 1 0 1
freefloat Percentage of shares held by small investors (i.e. those holding less than 5 percent of shares) 0.7614862 0.2439489 0.55985 0.84215 1 0.0596 1
emp Number of employees working for the firm 43.49007 70.82402 5 17.7455 51.511 0 586.9 logemp Logarithm of “emp“ 2.62601 1.84443 1.618596 2.877624 3.942281 -6.214608 6.374855 mcapbeur Market value of company shares (in billion EUR) 8.050375 14.63862 1.465082 2.981063 7.067504 0.665 112.4392
logmcapbeur Logarithm of “mcapbeur“
1.287653 1.141127 0.381909 1.09228 1.955477 -0.4079682 4.722412 eurassets Accounting value of firm assets (in million EUR) 62118.2 211780.4 2360.789 6741.933 25287.09 21.417 2587333
logeurassets Logarithm of “eurassets“
9.073108 1.811047 7.766751 8.816102 10.13805 3.064185 14.76614 eursales Value of annual firm sales (in million EUR) 11565.17 22148.06 1572.444 4412.005 11625.28 0 303756 logeursales Logarithm of “eursales“ 8.366225 1.489006 7.362605 8.396105 9.360937 -1.248273 12.62398

36
Table 4: Probit Model Estimates of Determinants of Stock Option Plans
Model 1 Model 2 Coefficient
Standard Error
Coefficient
Standard Error
stockop bler -0.3976705** 0.1876138 -0.4040116** 0.1885384 twotier -0.0996402 0.1706845 -0.0139153 0.1749466 newfloat 2.112904*** 0.3060675 1.793799*** 0.3309137
logmcapbeur 0.3045527*** 0.0929291 0.3245963*** 0.0937483
sayonpay 0.4879964*** 0.2002691
sic1 0.3982081 0.3905475 0.4170108 0.3925865
sic2 0.1867035 0.314327 0.1914877 0.3175727
sic3 0.3248379 0.3548426 0.3255323 0.3579638
sic4 0.0877631 0.4045225 0.1747762 0.4092249
sic5 0.4676409 0.3524601 0.4602896 0.3568837
sic6 0.7198369 0.5615731 0.7296268 0.5711883
sic7 -0.5553179 0.3762417 -0.556284 0.3803376
sic8 -0.126692 0.3049944 -0.1082346 0.3082254
constant -0.407997 0.3402889 -0.3530785 0.3427184
observations 539 539
Log likelihood -189.88096 -186.78532
LR chi2(12) 83.31
LR chi2(13) 89.50
Prob> Chi2 0.0000 0.000
Pseudo R2 0.1799 0.1933
Wald Test of Industry Dummies = 0
chi2( 8) 15.66 15.07
Prob > chi2 0.0475 0.0578
Notes: * 0.10 < P < 0.05 ** 0 .05 < P < 0.01 *** P < 0.01

37
Table 5: Probit Model Estimates of Determinants of Stock Option Plans (Excluding Industry Dummy Variables)
Model 1 Model 2 Coefficient
Standard Error
Coefficient
Standard Error
stockop bler -0.3079879* 0.1799417 -0.3114365* 0.1808138 twotier -0.1175261 0.1646457 -0.0306696 0.1690928 freefloat 2.113289*** 0.296306 1.796116*** 0.3186618
logmcapbeur 0.2558155*** 0.0858878 0.2725675*** 0.0865408
sayonpay 0.4991798*** 0.1952045
constant -0.3239397 0.2179744 -0.2632146 0.218729
observations 539 539
Log likelihood
-197.98341 -194.55921
LR chi2(4) 67.11
LR chi2(5) 73.95
Prob> Chi2 0.0000 0.0000
Pseudo R2 0.1449 0.1597
Notes: * 0.10 < P < 0.05 ** 0 .05 < P < 0.01 *** P < 0.01

38
Table 6: Bivariate Probit Model Estimates of Determinants of Stock Option Plans
Model 1 Model 2 Variable
Coefficient
Standard Error
Coefficient
Standard Error
stockop bler -0.5180534** 0.2383711 -0.5672103** 0.2434667 twotier -0.1130946 0.1846552 -0.0101447 0.1929137 freefloat 2.181573*** 0.3257442 1.898354*** 0.3485644 logmcapbeur 0.2749508*** 0.0954743 0.3014553*** 0.0968052 sayonpay 0.444568** 0.2048114 sic1 0.3126468 0.4024957 0.32637 0.4033692 sic2 0.1964898 0.3336423 0.1985037 0.3356186 sic3 0.2419178 0.3685819 0.2367628 0.3704601 sic4 0.0355557 0.4136045 0.1175459 0.4167114 sic5 0.3065162 0.3695201 0.2931771 0.3727524 sic6 0.6663021 0.5736608 0.6582237 0.5816721 sic7 -0.7367873* 0.3958398 -0.7540144* 0.3988066 sic8 -0.1915306 0.3263611 -0.1914453 0.3286696 sic9 6.435395 27197.14 6.490611 29115.61 constant -0.3489824 0.3651925 -0.3021743 0.3661483 bler strights 3.145124*** 0.2134134 3.148204*** 0.2132692 stateown 1.284199*** 0.2725525 1.280199*** 0.2722669 logemp 0.4302858*** 0.1167012 0.4286153*** 0.1167485 constant -2.119025*** 0.1545224 -2.119614*** 0.154601 observations 535 535 Log likelihood -274.30319 -271.87883 Wald Chi2(16) 289.51 Wald Chi2(17) 292.45 Prob> Chi2 0.0000 0.0000 Wald Test of Industry Dummies = 0
chi2( 9) 15.97 15.98 Prob > chi2 0.0674* 0.0672* rho 0.221257 0.2013774 .278083 .2010943 Wald Test of rho=0
chi2(1) 1.22697 1.92791 Prob > chi2 0.2680 0.1650
Notes: * 0.10 < P < 0.05 ** 0 .05 < P < 0.01 *** P < 0.01

39
Table 7: Bivariate Probit Model Estimates of Determinants of Stock Option Plans (Excluding Industry Dummy Variables)
Model 1 Model 2 Variable
Coefficient
Standard Error
Coefficient
Standard Error
stockop bler -0.3754958* 0.2272985 -0.4106296* 0.2311286 twotier -0.1364672 0.1780906 -0.0454203 0.1856719 freefloat 2.185397*** 0.310687 1.937757*** 0.3314057 logmcapbeur 0.1945908** 0.0862559 0.2120022** 0.0870451 sayonpay 0.4035189* 0.1985141 constant -0.3082887 0.2327125 -0.2688969 0.232663 bler strights 3.144218*** 0.2136969 3.146743*** 0.2136643 stateown 1.291855*** 0.2726663 1.293551*** 0.2724032 logemp 0.4315102*** 0.1169195 0.4297097*** 0.1170298 constant -2.119486*** 0.1545656 -2.12082*** 0.154679 observations 535 535 Log likelihood -285.7772 -283.64605 Wald Chi2(7) 276.86 Wald Chi2(8) 279.27 Prob> Chi2 0.0000 0.0000 rho .1235492 .1956383 .172194 .1960211 Wald Test of rho=0
chi2(1) .404666 .781526 Prob > chi2 0.5247 0.3767
Notes: * 0.10 < P < 0.05 ** 0 .05 < P < 0.01 *** P < 0.01

40
Table 8: Random Effects Model Estimates of Determinants of Total CEO Pay
Model 1 Model 2 Coefficient
Standard Error
Coefficient
Standard Error
bler -0.1843415* 0.1005971 -0.1707753* 0.0989992 roa 0.7153959** 0.3165728 0.635261** 0.3159089 twotier -0.2201528** 0.0874089 -0.1225217 0.0894764 freefloat
1.316022*** 0.1627639 1.020965*** 0.176797 sayonpay
0.3494464*** 0.0886808 logsales 0.3874485*** 0.0388842 0.4165189*** 0.0389793 sic1 0.2427695 0.2015895 0.2528678 0.1982641 sic2 -0.082274 0.1750798 -0.0721938 0.1721838 sic3 0.349792* 0.1917406 0.3517623* 0.1885467 sic4 0.4010124* 0.2214578 0.478602** 0.2186343 sic5 0.2651024 0.1885819 0.253258 0.1854758 sic6 0.024163 0.2516736 -0.0016386 0.247584 sic7 -0.2089332 0.2166138 -0.2033514 0.2130436 sic8 0.1277206 0.1763995 0.1466086 0.1735579 sic9 0.0862317 0.2250692 0.1602717 0.2220697 y2005 -0.1291282*** 0.0423442 -0.1305937*** 0.0423637 y2007 0.0586539 0.0408273 0.0596364 0.0408423 y2008 -0.2008048*** 0.0486532 -0.206895*** 0.0486845 constant 6.53472*** 0.2093462 6.570914*** 0.2062526
observations 1516 1516
groups 479 479
Wald chi2(17) 256.42
Wald chi2(18) 278.63
Prob> Chi2 0.0000 0.0000
R2 (overall) 0.2519 0.2648
Wald Test of Industry Dummies = 0
chi2( 9) 22.57 24.69
Prob > chi2 0.0072 0.0033
Wald Test of Year Dummies = 0
chi2( 3) 39.38 41.09
Prob > chi2 0.0000 0.0000
Sargan-Hansen statistic
chi2( 5) 8.755 7.942
Prob > chi2 0.1192 0.1595
Breusch/Pagan LM test
chi2( 1) 581.63 579.30
Prob > chi2 0.0000 0.0000
Notes: * 0.10 < P < 0.05 ** 0 .05 < P < 0.01 *** P < 0.01
41
Table 9: Instrumental Variables Estimation of Determinants of CEO Total Pay
Model 1 Model 2 Coefficient
Standard Error
Coefficient
Standard Error
bler -0.2277288* 0.122256 -0.2512752** 0.1205106 roa 0.6751213** 0.3199906 0.5887622* 0.3191674 twotier -0.2057023** 0.0909 -0.0916691 0.093009 freefloat
1.313502*** 0.1636484 1.005719*** 0.1778521 sayonpay
0.3581644*** 0.0884559 logsales 0.3960263*** 0.0392851 0.4283927*** 0.03955 sic1 0.273693 0.2017255 0.2915666 0.1995179 sic2 -0.053495 0.1757242 -0.0396167 0.1738102 sic3 0.3771444** 0.1918936 0.3826866** 0.1897745 sic4 0.4327076* 0.2210546 0.5180156** 0.2195206 sic5 0.267624 0.1898461 0.253068 0.1877795 sic6 0.0468763 0.2506872 0.0245924 0.2479982 sic7 -0.1536895 0.2167754 -0.1445674 0.2144094 sic8 0.1507664 0.1772051 0.170572 0.1753407 sic9 0.1026328 0.2249708 0.1833755 0.2232992 y2005 -0.1227285*** 0.0431737 -0.1239097*** 0.043069 y2007 0.0600373 0.0414011 0.0606341 0.0412982 y2008 -0.1977655*** 0.0490598 -0.2044044*** 0.048961 constant 6.517184*** 0.2123671 6.559607*** 0.2102371
observations 1492 1492
groups 476 476
Wald chi2(17) 254.75
Wald chi2(18) 277.44
Prob> Chi2 0.0000 0.0000
R2 (overall) 0.2526 0.2658
Sargan-Hansen statistic
chi2( 2) 1.177 0.403
Prob > chi2 0.5550 0.8173
Notes: * 0.10 < P < 0.05 ** 0 .05 < P < 0.01 *** P < 0.01

42
Table 10: Random Effects Model Estimates of Determinants of Return on Assets
Model 1 Model 2 Coefficient
Standard Error
Coefficient
Standard Error
bler -0.0001144 0.0071216 0.0005987 0.0070581 twotier 0.0010039 0.0061666 0.0065605 0.0063193 freefloat
-0.0091256 0.0109978 -0.0272515** 0.0121031 sayonpay
0.0218855*** 0.0063629 logsales -0.0121593*** 0.0027103 -0.0110275*** 0.0027077 sic1 0.0025241 0.0141755 0.0023652 0.014043 sic2 -0.0143851 0.0121112 -0.0143397 0.0119981 sic3 -0.011853 0.0131148 -0.012092 0.0129923 sic4 -0.0067262 0.0150911 -0.001729 0.0150216 sic5 -0.0101122 0.013069 -0.0117869 0.0129557 sic6 -0.020606 0.0175601 -0.0220063 0.0174004 sic7 -0.039821*** 0.0151415 -0.0398515*** 0.0149999 sic8 -0.061352*** 0.0120361 -0.0600463*** 0.0119299 sic9 -0.010421 0.0165864 -0.0075754 0.0164524 y2005 -0.0061136** 0.0029229 -0.0060854** 0.0029226 y2007 0.0021881 0.0028888 0.0021549 0.0028885 y2008 -0.0226025*** 0.0028979 -0.0226394*** 0.0028975 constant 0.107236*** 0.0137798 0.1104942*** 0.0136857
observations 2245 2245
groups 546 546
Wald chi2(16) 191.97
Wald chi2(17) 205.74
Prob> Chi2 0.0000 0.0000
R2 (overall) 0.1284 0.1410
Wald Test of Industry Dummies = 0
chi2( 9) 72.23 71.41
Prob > chi2 0.0000 0.0000
Wald Test of Year Dummies = 0
chi2( 3) 89.46 89.63
Prob > chi2 0.0000 0.0000
Sargan-Hansen statistic
chi2( 4) 12.915 12.643
Prob > chi2 0.0117 0.0132
Breusch/Pagan LM test
chi2( 1) 1043.99 1016.50
Prob > chi2 0.0000 0.0000
Notes: * 0.10 < P < 0.05 ** 0 .05 < P < 0.01 *** P < 0.01
43
Table 11: Instrumental Variables Estimation of Determinants of Return on Assets
Model 1 Model 2 Coefficient
Standard Error
Coefficient
Standard Error
bler -0.0062282 0.0089642 -0.0079298 0.008849 twotier 0.0033469 0.0064717 0.0097681 0.0065896 freefloat
-0.0098603 0.0109269 -0.0280874** 0.0120137 sayonpay
0.0216559*** 0.0063112 logsales
-0.0118371*** 0.0027084 -0.0105786*** 0.0027042 sic1 0.0034626 0.0140838 0.0036772 0.0139506 sic2 -0.0140475 0.012015 -0.0138641 0.0119017 sic3 -0.0114324 0.0130118 -0.0114999 0.0128892 sic4 -0.0059857 0.0149825 -0.0007356 0.0149103 sic5 -0.0103115 0.0129614 -0.0120424 0.0128479 sic6 -0.0200134 0.0174225 -0.0211648 0.0172628 sic7 -0.0394747*** 0.0150192 -0.0393651*** 0.0148775 sic8 -0.0613816*** 0.0119363 -0.0600952*** 0.0118301 sic9 -0.009905 0.0164559 -0.0068756 0.0163209 y2005 -0.0060992** 0.0029317 -0.006066** 0.002932 y2007 0.0021678 0.0028975 0.0021281 0.0028979 y2008 -0.0226247*** 0.0029066 -0.0226701*** 0.002907 constant 0.1081189*** 0.0136904 0.111686*** 0.0135941
observations 2245 2245
groups 586 586
Wald chi2(16) 193.61
Wald chi2(17) 207.89
Prob> Chi2 0.0000 0.0000
R2 (overall) 0.1275 0.1393
Sargan-Hansen statistic
chi2( 2) 0.448 0.886
Prob > chi2 0.5032 0.3465
Notes: * 0.10 < P < 0.05 ** 0 .05 < P < 0.01 *** P < 0.01

44
Table 12: Random Effects Model Estimates of Determinants of Price/Book Value
Model 1 Model 2 Coefficient
Standard Error
Coefficient
Standard Error
bler 0.0988676 0.2800947 0.1049742 0.2801416 twotier -0.1186595 0.2421153 -0.073878 0.2502128 newfloat
-0.8562278** 0.4315834 -1.001773** 0.4781547
sayonpay 0.1769692 0.2506378
logsales -1.364484*** 0.0947131 -1.357776*** 0.095112
sic1 -0.5592787 0.5570766 -0.5598881 0.5568862
sic2 0.0000794 0.4757927 0.0018114 0.4756366
sic3 0.0002112 0.5155335 -0.0009745 0.5153592
sic4 1.197109** 0.5920521 1.235725** 0.5943408
sic5 -0.1130216 0.5139181 -0.125965 0.5140618
sic6 0.5465334 0.6903824 0.5362103 0.6902934
sic7 0.0179851 0.5949366 0.0188984 0.5947349
sic8 -1.504644*** 0.4730645 -1.493382*** 0.4731767
sic9 -0.1750907 0.6521106 -0.1526569 0.6526548
y2005 -0.0645815 0.1073626 -0.0642658 0.1073843
y2007 -0.5997589*** 0.1074155 -0.6000644*** 0.1074371
y2008 -0.5915638*** 0.1076704 -0.5919452*** 0.1076923
constant 3.716614*** 0.5392511 3.741906*** 0.5402443
observations 2840 2840
groups 569 569
Wald chi2(16) 369.86
Wald chi2(17) 370.35
Prob> Chi2 0.0000 0.0000
R2 (overall) 0.1615 0.1625
Wald Test of Industry Dummies = 0
chi2( 9) 50.26 50.32
Prob > chi2 0.0000 0.0000
Wald Test of Year Dummies = 0
chi2( 3) 51.38 51.44
Prob > chi2 0.0000 0.0000
Sargan-Hansen statistic
chi2( 4) 91.807 92.931
Prob > chi2 0.0000 0.0000
Breusch/Pagan LM test
chi2( 1) 1549.62 1540.96
Prob > chi2 0.0000 0.0000
Notes: * 0.10 < P < 0.05 ** 0 .05 < P < 0.01 *** P < 0.01

45
Table 13: Instrumental Variables Estimation of Determinants of Price/Book Value
Model 1 Model 2 Coefficient
Standard Error
Coefficient
Standard Error
bler -0.0466987 0.3563154 -0.0598326 0.3547968 twotier -0.0629062 0.2563877 -0.0120255 0.2631818 newfloat
-0.873662** 0.4323445 -1.017695** 0.4784739 sayonpay
0.1723684 0.2506412 logsales -1.35649*** 0.0954498 -1.348723*** 0.09579 sic1 -0.536665 0.5580735 -0.5343681 0.5577543 sic2 0.0086001 0.4759181 0.0113808 0.4756669 sic3 0.0104894 0.5157167 0.0106009 0.5154411 sic4 1.215227** 0.5926193 1.255312** 0.5947196 sic5 -0.1174649 0.513907 -0.1307194 0.5139475 sic6 0.5604439 0.690635 0.5520898 0.6904192 sic7 0.0268345 0.5950267 0.0288113 0.5947087 sic8 -1.50499*** 0.473015 -1.494113*** 0.4730389 sic9 -0.1621629 0.6523342 -0.1385831 0.6527255 y2005 -0.0642589 0.1073728 -0.0639019 0.1074013 y2007 -0.6002751*** 0.1074274 -0.6006521*** 0.1074555 y2008 -0.5922292*** 0.1076841 -0.5927026*** 0.1077125 constant 3.737348*** 0.5401037 3.764753*** 0.5409232
observations 2840 2840
groups 569 569
Wald chi2(16) 369.74
Wald chi2(17) 370.24
Prob> Chi2 0.0000 0.0000
R2 (overall) 0.1617 0.1627
Sargan-Hansen statistic
chi2( 2) 0.053 0.031
Prob > chi2 0.8176 0.8593
Notes: * 0.10 < P < 0.05 ** 0 .05 < P < 0.01 *** P < 0.01

46
REFERENCES Albuquerque, Ana M., De Franco, Gus and Verdi, Rodrigo S., Peer Choice in CEO Compensation (July 21, 2009). AFA 2010 Atlanta Meetings Paper. Available at SSRN: http://ssrn.com/abstract=1362047 Armstrong, Chris S., Jagolinzer, Alan D. and Larcker, David F., Chief Executive Officer Equity Incentives and Accounting Irregularities (September 7, 2009). Rock Center for Corporate Governance at Stanford University Working Paper No. 4. Available at SSRN: http://ssrn.com/abstract=1132411 Baker, George P., Jensen, Michael C. and Murphy, Kevin J., Compensation and Incentives: Practice vs. Theory. Michael C. Jensen, FOUNDATIONS OF ORGANIZATIONAL STRATEGY, Harvard University Press, 1998; Journal of Finance, Vol. 63, No. 3, pp. 593-616, July 1998. Available at SSRN: http://ssrn.com/abstract=94029 or doi:10.2139/ssrn.94029 Bebchuk, Lucian A. and Fried, Jesse (2004). Pay without Performance. Cambridge USA: Harvard University Press. Bebchuk, Lucian A. and Spamann, Holger, Regulating Bankers' Pay (October 1, 2009). Georgetown Law Journal, Vol. 98, No. 2, pp. 247-287, 2010; Harvard Law and Economics Discussion Paper No. 641. Available at SSRN: http://ssrn.com/abstract=1410072 Belloc, Filippo, The Dark Side of Shareholder Protection: Cross-Country Evidence from Innovation Performance (August 14, 2009). Quaderni del Dipartimento di Economia Politica No. 583/2010, University of Siena. Available at SSRN: http://ssrn.com/abstract=1452743 Brenner, Steffen H. and Schwalbach, Joachim, Legal Institutions, Board Diligence, and Top Executive Pay (2008). Available at SSRN: http://ssrn.com/abstract=1100670 European Trade Union Institute (ETUI) (2009) Benchmarking Working Europe 2009. Brussels: ETUI. Fernandes, Nuno G., Ferreira, Miguel A., Matos, Pedro P. and Murphy, Kevin J., The Pay Divide: (Why) are U.S. Top Executives Paid More? (June 29, 2009). EFA 2009 Bergen Meetings Paper; ECGI - Finance Working Paper No. 255/2009. Available at SSRN: http://ssrn.com/abstract=1341639 Ferrarini, Guido A., Moloney, Niamh and Ungureanu, Maria-Cristina, Understanding Directors' Pay in Europe: A Comparative and Empirical Analysis (June 9, 2009). ECGI - Law Working Paper No. 126/2009. Available at SSRN: http://ssrn.com/abstract=1418463 Fulton, Lionel: Worker representation in Europe. Labour Research Department and ETUI-REHS: 2007. Gomez, Rafael and Tzioumis, Konstantinos (2006) What do unions do to CEO compensation? CEP Discussion Paper 720. London: Centre for Economic Performance. Hans Böckler Foundation / European Trade Union Institute (eds.) (2004) Workers’ participation at board level in the EU-15 countries. Reports on the national systems and practices. Brussels: ETUI.

47
Hörisch, Felix (2009). Unternehmensmitbestimmung im nationalen und internationalen Vergleich. Berlin: LIT Verlag. Jensen, Michael C., Murphy, Kevin J. and Wruck, Eric G., Remuneration: Where We've Been, How We Got to Here, What are the Problems, and How to Fix Them (July 12, 2004). Harvard NOM Working Paper No. 04-28; ECGI - Finance Working Paper No. 44/2004. Available at SSRN: http://ssrn.com/abstract=561305 or doi:10.2139/ssrn.561305 Marquardt, Carol A., Tan, Christine E.L. and Young, Susan M., Accelerated Share Repurchases, Bonus Compensation, and CEO Horizons (February 19, 2009). Available at SSRN: http://ssrn.com/abstract=1346624 Murphy, Kevin J., Executive Compensation (April 1998). Available at SSRN: http://ssrn.com/abstract=163914 or doi:10.2139/ssrn.163914 Otten, Jordan, Theories on Executive Pay: A Literature Overview and Critical Assessment (December 2007). Available at SSRN: http://ssrn.com/abstract=1088272 Otten, Jordan and Heugens, Pursey P.M.A.R., Extending the Managerial Power Theory of Executive Pay: A Cross National Test (August 2007, 12). ERIM Report Series Reference No. ERS-2007-090-ORG. Available at SSRN: http://ssrn.com/abstract=1088215 Rabe-Hesketh, Sophia and Skrondal, Anders (2005) Multilevel and Longitudinal Modeling Using Stata. College Station USA: Stata Press. Thomas, Randall S., International Executive Pay: Current Practices and Future Trends (September 8, 2008). Randall S. Thomas, INTERNATIONAL EXECUTIVE PAY: CURRENT PRACTICES AND FUTURE TRENDS, Elgar Publishing, 2009; Vanderbilt Law and Economics Research Paper No. 08-26. Available at SSRN: http://ssrn.com/abstract=1265122 Vitols, Sigurt (2005) Prospects for trade unions in the evolving European system of corporate governance. Brussels: ETUI. Vitols, Sigurt (2006) Ökonomische Auswirkungen der paritätischen Mitbestimmung: eine ökonometrische Studie. Gutachten im Auftrag des DGB-Bundesvorstandes, Bereich Mitbestimmung und Politik. Berlin: DGB. Vitols, Sigurt (2008) Beteiligung der Arbeitnehmervertreter in Aufsichtsratsausschüssen: Auswirkungen auf Unternehmensperformanz und Vorstandsvergütung. Studie im Auftrag der Hans-Böckler-Stiftung. Düsseldorf: Hans-Böckler-Stiftung. Wooldridge, Jeffrey M. (2002) Econometric Analysis of Cross Section and Panel Data. Cambridge USA: MIT Press.