bnp paribas focused 25 equity fund - … paribas focused 25 equity fund an open ended equity scheme...
TRANSCRIPT

NFO OPENS: SEPTEMBER 15, 2017
NFO CLOSES: SEPTEMBER 29, 2017
BNP PARIBAS FOCUSED 25 EQUITY FUND AN OPEN ENDED EQUITY SCHEME

Table of Content
2
Section 1 Why Equities?
• Macro View
• Structural Opportunities
• Where is the Earnings Growth?
Section 2 Why Focus Fund?
• Concentration vs Other Strategies
Section 3 BNP Paribas Focused 25 Equity Fund
• Fund Features
• Why Us?
• Team

WHY EQUITIES?
SECTION 1
3

MACRO VIEW 1
4

2014-2017: Good Macro but weak Micro
5
Centre and State Fiscal Deficit (% of GDP) Elusive Earnings Recovery
7
10
3
-4
7
-6
-4
-2
0
2
4
6
8
10
12
FY13 FY14 FY15 FY16 FY17
Source: Company Data, CLSA
NIFTY Earnings Growth (% YoY)
Source: RBI, CEIC, UBS Estimates
0%
2%
4%
6%
8%
10%
FY
06
FY
07
FY
08
FY
09
FY
10
FY
11
FY
12
FY
13
FY
14
FY
15
FY
16
FY
17E
FY
18E
State's fiscal deficit Centre's fiscal deficitas % of GDP

6
The Way Forward
G C I + + + GDP = (X-M)
Imports-Exports
Not much hope
here
Discretionary
consumption
may help get
the growth
on track
With less than
70% capacity
utilization and
levered balance
sheets do not
expect private
sector
investment
Government
spending has
to increase to
offset weak
consumption
and private
investment
This is very
critical
Seventh pay
commission and
farm loan waiver
to aid
consumption
The GDP constituents are changing now
7
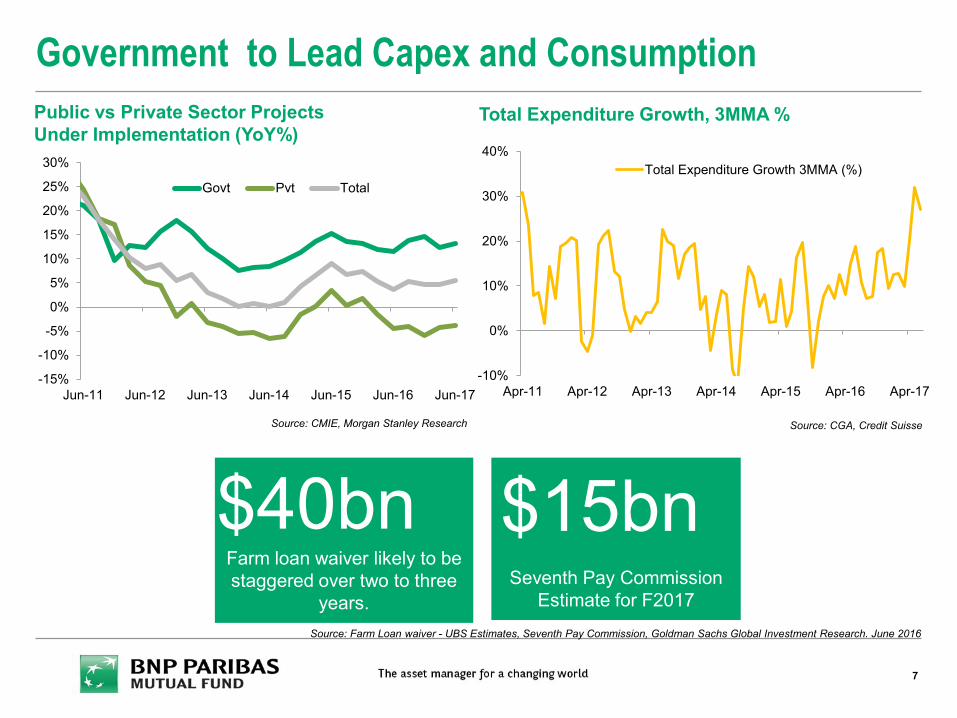
Government to Lead Capex and Consumption
-15%
-10%
-5%
0%
5%
10%
15%
20%
25%
30%
Jun-11 Jun-12 Jun-13 Jun-14 Jun-15 Jun-16 Jun-17
Govt Pvt Total
Public vs Private Sector Projects
Under Implementation (YoY%)
Source: CMIE, Morgan Stanley Research
Total Expenditure Growth, 3MMA %
-10%
0%
10%
20%
30%
40%
Apr-11 Apr-12 Apr-13 Apr-14 Apr-15 Apr-16 Apr-17
Total Expenditure Growth 3MMA (%)
Source: CGA, Credit Suisse
Farm loan waiver likely to be
staggered over two to three
years.
$40bn
Seventh Pay Commission
Estimate for F2017
$15bn
Source: Farm Loan waiver - UBS Estimates, Seventh Pay Commission, Goldman Sachs Global Investment Research. June 2016

8
2017-2020: Good Micro but weak Macro ?
2014-2017
2017-2020
Source: Internal Research, BNPP AMC
Macro
Positive
Macro
Negative (State + Centre)
Micro
Negative
Micro
Positive
Benign commodity prices
led to softer inflation, helped
EBITDA margins but earnings
recovery remained elusive.
Policy push in terms of Farm
loan waiver, housing interest
rate subsidy and Seventh Pay
Commission will put pressure
on government finances but
would boost consumption, infra
spends and drive earnings
growth.

STRUCTURAL OPPORTUNITIES 2
9

India’s Real GDP Vs other economies
Domestic vs Exports
10
Global Trade and Barriers
Source: WTO
0
2
4
6
8
India World Emerging &DevelopingEconomies
Developing Asia
CY 2016 Real GDP
Source: Haver, UBS
%
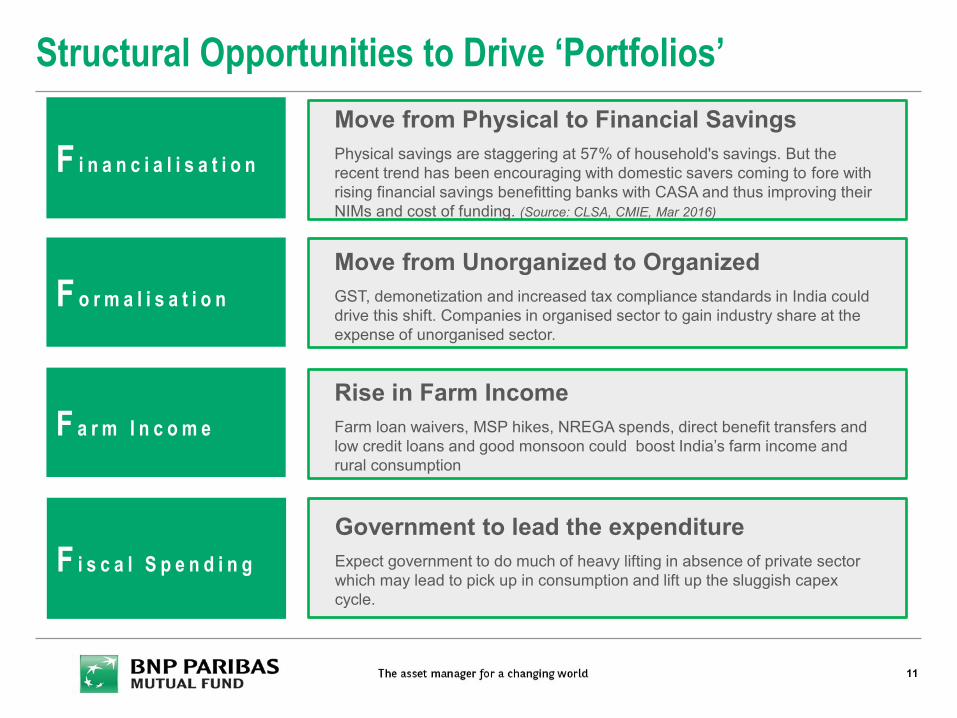
F a r m I n c o m e
Structural Opportunities to Drive ‘Portfolios’
11
Move from Physical to Financial Savings
Physical savings are staggering at 57% of household's savings. But the
recent trend has been encouraging with domestic savers coming to fore with
rising financial savings benefitting banks with CASA and thus improving their
NIMs and cost of funding. (Source: CLSA, CMIE, Mar 2016)
F i n a n c i a l i s a t i o n
F o r m a l i s a t i o n
Move from Unorganized to Organized
GST, demonetization and increased tax compliance standards in India could
drive this shift. Companies in organised sector to gain industry share at the
expense of unorganised sector.
Rise in Farm Income
Farm loan waivers, MSP hikes, NREGA spends, direct benefit transfers and
low credit loans and good monsoon could boost India’s farm income and
rural consumption
Government to lead the expenditure
Expect government to do much of heavy lifting in absence of private sector
which may lead to pick up in consumption and lift up the sluggish capex
cycle.
F i s c a l S p e n d i n g

Financialisation of Savings
12
-15
-10
-5
0
5
10
Jul-0
2
Jul-0
3
Jul-0
4
Jul-0
5
Jul-0
6
Jul-0
7
Jul-0
8
Jul-0
9
Jul-1
0
Jul-1
1
Jul-1
2
Jul-1
3
Jul-1
4
Jul-1
5
Jul-1
6
Jul-1
7
Real Policy Rate on Headline CPI
Positive Real Rates % (Deposit – CPI)
Source: SBI, RBI, Morgan Stanley Research
Source: Morgan Stanley Research Estimates on old base
Domestic Equity MF Flows (INR bn)
Rise in Financial Savings (as % of GDP)
Source: AMFI, Morgan Stanley Research
• Positive real interest rates augur well for
financial savings
• We have already started to see a move away
from physical assets into financial assets
• Positive for Private Retail Banks, Stock
Exchanges and Insurance Companies 0%
5%
10%
15%
20%
25%
F20
08
F20
09
F20
10
F20
11
F20
12
F20
13
F20
14E
F20
15E
F20
16E
F20
17E
F2
018E
Household-Physical Household-Financial
-40
0
40
80
120
160
200
Ma
y-1
4
Jul-1
4
Sep-1
4
No
v-1
4
Jan-1
5
Ma
r-1
5
Ma
y-1
5
Jul-1
5
Sep-1
5
No
v-1
5
Jan-1
6
Ma
r-1
6
Ma
y-1
6
Jul-1
6
Sep-1
6
No
v-1
6
Jan-1
7
Ma
r-1
7
Ma
y-1
7
Jul-1
7
In Rs. bn
The sector(s) mentioned in this document do not constitute any recommendation of the
same and BNP Paribas Mutual Fund may or may not have any future position in these
sector(s).

Formalisation of Economy
13
GST Implementation
One Nation one Tax,
Subsumes all indirect tax levies
Removes Cascading
Improves tax
compliance
Higher tax revenue
collection expected
Increases competitiveness of
domestic manufacturing
Increases medium term output growth (estimated to add 0.5-1%pt
to growth)
• GST – a structural positive for making the
economy more formal
• Crackdown on black money
• Mandatory declaration of PAN for
gold transactions above Rs. 200,000
• Mandatory to update Aadhar with
bank account from Jan 2018
• Income declaration schemes
• Implementing RERA and Benami
Transactions Act
GST, Game changer for Organised sector
• Formalisation will help select industries to
gain market share. We believe organised
players in Paints, Tiles, Pipes, Adhesives,
Plywood and Light electrical goods would
benefit.
• Adverse for real estate, gold and non tax
compliant sectors
The sector(s) mentioned in this document do not constitute any recommendation of the
same and BNP Paribas Mutual Fund may or may not have any future position in these
sector(s).

Farm Income
14
JAN DHAN
YOJANA
MOBILE
AADHAR
Low Credit loans
Aggressive MSP hike
AGRI GDP USD
337bn
Subsidized Crop
Insurance
DBT
Eliminates middle
man
Clamor for Farm Loan
Waiver
NREGA Spend
JAM Trinity to reduce leakages
Total Direct Benefit Transferred (Cumulative)
INR 2.18 crore (Aug 2017)1
Source: 1https://dbtbharat.gov.in/
.
• Government efforts to double farm income
• Policies to reduce volatility through direct benefit
schemes, crop insurance.
• We believe these concerted efforts will boost rural
consumption and benefit sectors like Autos, staples
and discretionary
Source:
NREGA, RBI,
Morgan Stanley Research
Drivers of Farm Income
60% beneficiaries are from
rural/semi-urban centre
bank branches
The sector(s) mentioned in this document do not constitute any recommendation of the
same and BNP Paribas Mutual Fund may or may not have any future position in these
sector(s).

Farm Loan Waiver (Rs bn)
Fiscal Spending to Rise
15
Revenue Expenditure Capital Expenditure
Seventh Pay
Commission, Interest
rate Subsidy and Farm
loan waivers
Road, Rail and Ports
Aggressive MSP hikes Defence spends
Public health spend Capex through PSUs
Govt. capex recovery led by Roads and Railways
• Government’s push to build Road, Railways and
Ports will drive infrastructure cycle in absence of
private capex
• We expect pay seventh commission, interest rate
subsidy on housing loan, farm loan waivers will
help boost consumption
• We expect select infra companies, consumer
facing companies and affordable housing segment
to benefit from this drive
0
400
800
1200
1600
FY
15
FY
16
FY
17
FY
18B
E
FY
15
FY
16
FY
17
FY
18B
E
FY
15
FY
16
FY
17
FY
18B
E
Railways Road Power
Budget support
Internal & Extra budgetaryresources
(INR bn)
Source: Nomura, Investment in Public Enterprises, Budget documents, April 2017
0
100
200
300
400
MH (2017) Punjab(2017)
UP (2017) TN (2016) Tel'gana(2014)
AP (2014)
Source: RBI, Media Reports, UBS
The sector(s) mentioned in this document do not constitute any recommendation of the same
and BNP Paribas Mutual Fund may or may not have any future position in these sector(s).

WHERE IS THE EARNINGS GROWTH ?
3
16

Not all will Ride the Tide!
17
Retail vs Corporate Loan Growth (%) Same Stores Sales Growth (%)
-5
0
5
10
15
20
25
30
35
Jun
-09
Jun
-10
Jun
-11
Jun
-12
Jun
-13
Jun
-14
Jun
-15
Jun
-16
Jun
-17
Corporate Retail
-40
-20
0
20
40
60
Dec-1
4
Feb
-15
Apr-1
5
Jun-1
5
Aug-1
5
Oct-1
5
Dec-1
5
Feb
-16
Apr-1
6
Jun-1
6
Aug-1
6
Oct-1
6
Dec-1
6
Feb
-17
Apr-1
7
Jun-1
7
Dominos Pizza
Titan Jewellery
Source: RBI, Jefferies Source: Jefferies
% %

18
Banks and NBFCs…..Retail Focused
Private vs PSU Bank Loan Market Share (%) %
Source: RBI, Company Data, CLSA
Private vs PSU Banks – CASA Growth (yoy%)
• The asset quality issues with public sector banks
will be an over hang on the banking sector but we
think private banks with strong retail franchise will
stand out.
• We believe the retail participation in Indian capital
markets to rise in coming years benefitting the
stock exchanges and other allied financial
institutions like asset and wealth management
• Similarly low penetration of Life Insurance product
remains an opportunity for insurance companies. (Source: Morgan Stanley Research)
Household Debt (CY2016, % of GDP)
Source: Source: BIS, Various central banks, Haver, Morgan Stanley Research
Source: Company Data, Nomura
0
20
40
60
80
100
Kore
a
Mala
ysia
Thaila
nd
US
Taiw
an
Euro
Are
a
Chin
a
Bra
zil
Turk
ey
Indonesia
India
Mexic
o
Russia
5%
10%
15%
20%
25%
30%
35%
40%
45%
50%
55%
60%
65%
Mar-0
3
Mar-0
4
Mar-0
5
Mar-0
6
Mar-0
7
Mar-0
8
Mar-0
9
Mar-1
0
Mar-1
1
Mar-1
2
Mar-1
3
Mar-1
4
Mar-1
5
Mar-1
6
Mar-1
7
PSU Banks ex SBI group (LHS)
Private Banks (RHS)
10
12
14
16
18
20
22
24
26
28
45
47
49
51
53
55
57
59
Mar-0
5
Mar-0
6
Mar-0
7
Mar-0
8
Mar-0
9
Mar-1
0
Mar-1
1
Mar-1
2
Mar-1
3
Mar-1
4
Mar-1
5
Mar-1
6
Mar-1
7
PSU ex-SBI Private RHS LHS

Affordable Housing
19
Low Mortgage Rates Central Government Budget Allocation
• Low mortgage rates, increased affordability
in small ticket size segment, interest rate
subsidy and rise in budgetary allocation by
the government has given boost to the
sector
Source: Budget documents, CLSA, March 2017. RE- Revised estimates ; BE-
Budget estimates
79
130 111 101
160
230 11 15
49
60
0
50
100
150
200
250
300
350
FY13 FY14 FY15 FY16 FY17RE FY18BE
Housing for All - Rural
Housing for All - Urban
(INR bn)
58% CAGR
7
8
9
10
11
12
13
Jul-0
4
Jul-0
5
Jul-0
6
Jul-0
7
Jul-0
8
Jul-0
9
Jul-1
0
Jul-1
1
Jul-1
2
Jul-1
3
Jul-1
4
Jul-1
5
Jul-1
6
Jul-1
7
Mortgage rate% (%)
Source: RBI, CLSA

20
Select Consumption
Beverage
Media
Travel, Leisure & Entertainment
Discretionary
Retail
Images are used only for representational purpose.

Infrastructure Play
21
0
3,000
6,000
9,000
12,000
15,000
18,000
FY13 FY14 FY15 FY16 FY17
Roads Awarded for Construction (kms) Drivers of Cement Demand (Kms)
35%
10% 20%
20%
15% Rural Housing
Urban Housing Tier 1 cities
Urban Housing Tier 2 &other cities
Infrastucture
Commercial
Source: NHAI and MORTH, Jefferies Data as of Mar 2017 Source: CLSA, Estimates, 2017
0
500
1000
1500
2000
2500
3000
FY90 FY94 FY98 FY02 FY06 FY10 FY14 FY18BE
India central government defenceexpenditure Rs bn (LHS)
Central Government's Defence Expenditure
Source: India Budget, CEIC, UBS.
• Government to play a key role in supporting
infrastructure growth through building roads,
railway network, defense expenditure and
affordable housing
• All these bodes well for the cement demand
and defense sector oriented engineering
companies
The sector(s) mentioned in this document do not constitute any recommendation of the same
and BNP Paribas Mutual Fund may or may not have any future position in these sector(s).

22
GST, Game changer for Organised sector
Source: CLSA Estimates
40 35 50
65 50
70 65
40 35 50
60 65 50
35 50
30 35
60 65 50
Bis
cu
its
Pain
ts
Tea
& C
offe
e
Foo
twea
r
Watc
he
s
Air c
oole
rs
Ply
woo
d
Ele
ctr
ic L
ighting
Ele
ctr
ic c
ab
les
Ha
ir o
il
% Share unorganized % Share Organized
Share of Organised/Unorganised Industries
0
200
400
600
800
1000
1200
1400
1600
Mar-0
1
Mar-0
2
Mar-0
3
Mar-0
4
Mar-0
5
Mar-0
6
Mar-0
7
Mar-0
8
Mar-0
9
Mar-1
0
Mar-1
1
Mar-1
2
Mar-1
3
Mar-1
4
Mar-1
5
Mar-1
6
Mar-1
7
Paints Industry (top 4) Cash ProfitGrowth
Paints Industry (Leader) Cash ProfitGrowth
Nifty EPS Growth
Paints Industry Profit Growth (indexed to100)
Source: ACE Equity
The sector(s) mentioned in this document do not constitute any recommendation of the same
and BNP Paribas Mutual Fund may or may not have any future position in these sector(s).

“Pollution” Awareness
23
Source: The Telegraph, Dec 17, 2016
• In order to check rising environmental
pollution, Chinese government is cracking
down on excess production in energy
intensive sectors
• Move has hampered exports in industries like
chemicals, steel, aluminum and coal
• Move will benefit Indian companies as they re-
gain competitive advantage in the global
markets
•
• The central government is keen to encourage
the use of cleaner fuels in transportation and
households
• Regulations include fast tracking the
production of BS-VI compliant fuels and
imposition of clean energy cess on coal
• All this augurs well for natural gas and
cleaner fuel technology companies

24
Equity Outlook
• Time to focus on MICRO now……..while MACRO
might deteriorate
• The earnings outlook likely to have tailwinds………
• Fiscal stimulus
• Moderately rising inflation
• Financialisation of economy
• GST
• Infrastructure push
• Nifty trading at 16.18x FY19E EPS1
• Earnings outlook to improve FY18 onwards, but
improvement will be more significant for select few !!
Nifty EPS growth is expected to pick up in
FY2018-19
Source: Consensus Estimate, Bloomberg
Source: 1Bloomberg
6.7
10.1
3.0
-4.0
7.0
16.0
20.4
-10
-5
0
5
10
15
20
25
F2013 F2014 F2015 F2016 F2017 F2018E F2019E
Nifty Earnings
%

WHY FOCUS FUND ?
25
SECTION 2

“WIDE DIVERSIFICATION IS ONLY REQUIRED WHEN INVESTORS DO NOT UNDERSTAND WHAT THEY ARE DOING.” – WARREN BUFFETT
26

Concentration vs Other Strategies
27
Lower the
tracking error, closer
are the returns of the
fund to that of the
target benchmark.
High Active Share
represents the
fraction of portfolio
holdings that differ
from the benchmark,
emphasizing
superior stock
selection.
Source: K. J. Martijn Cremers, Antti Petajistoy (March 31, 2009). How Active Is Your Fund Manager? A New Measure That Predicts Performance. Yale School of Management

Risk Return Profile
28
Po
rtfo
lio
Retu
rns
S
tan
da
rd D
evia
tio
n
Source: An Introduction To Risk And Return Concepts And Evidence by Franco Modigliani and Gerald A. Pogue 646-73 March 1973

Conviction Generates Alpha
29
• The study was done over 4,700
diversified US equity mutual funds with
different styles, asset levels, and client
bases.
• They created concentrated portfolios
by measuring the active weights
• The concentrated portfolios ranged
from top 10 to 30 stocks based on their
active weights and the position sizes
were then equal and conviction
weighted.
Concentrated Portfolios Outperform the
Diversified Portfolios (Quarterly data from
1999-2009)
Source: Danny Yeung. (2009) Diversification versus Concentration . . . and the Winner is?
Portfolios
Total Returns
(annualised)
Standard
Deviation
(annualised)
Sharpe
Ratio
Top 10 9.4% 23.4% 0.26
Top 20 8.1% 20.7% 0.23
Top 25 7.8% 19.8% 0.22
Top 30 7.4% 19.5% 0.08
Own Index 5.1% 20.0% 0.28
Past performance including any past scenarios may not reflect future performance.

• Market earnings growth have been lackluster for last three years and
valuations have been richer
• We believe only those sectors and companies will outperform which
will be driven by fundamentals
• Select sector leaders and stocks that are at the cusp of turnaround will
outperform and help alpha creation
• Alpha generation opportunity likely to rise in concentrated portfolio
Why Focused strategy?
30
Alpha = Conviction X Size of Bet

PRESENTING BNP PARIBAS FOCUSED 25 EQUITY FUND
31
SECTION 3
AN OPEN ENDED EQUITY SCHEME

• High conviction portfolio of maximum 25 companies having “superior and sustainable” earnings growth
• Sector agnostic, with endeavour to add the highest earning growth companies that the given economic environment presents
• Pure bottom-up stock picking approach with focus on companies with proven market leadership, strong financials and quality management
• Multicap portfolio, of which minimum 65% will be large capitalization companies and up to 35% in high conviction, fast growing small and mid sized companies
• A blend of value and growth companies played around high conviction themes
Salient Fund Features
32
Please refer to Scheme Information Document for further details on Asset allocation and
Investment Pattern of the Scheme available on our website (www.bnpparibasmf.in)

• Experienced and stable investment team, with deep sectoral
expertise - in excess of 125 years of cumulative experience
• Time tested investment philosophy and process- Business,
Management and Valuation model
• Expertise of identifying multi baggers – Across market caps
Why Us?
33

Core Belief: Companies create wealth, not markets
Identify superior businesses, with strong management, at reasonable valuations
* A sustainable competitive advantage
B.M.V.: Business, Management, Valuation. Source: BNPP AM, August 2017
In search of companies with superior and sustainable earnings growth
34
BUSINESS
- Growth
- “Moat” *
- Positive change
MANAGEMENT Leadership in: - Competence - Governance
B.M.V. FRAMEWORK
VALUATION
- Cash - Margin of Safety
1
2 3

35
An Experienced and Stable Team – BNPP AMC
Sr.Fund Manager
Equities
K Lakshmanan (11)
Deputy CEO & Head of
Investments
Anand Shah (17)
Dealer
Neeraj Saxena (13)
Research Analyst
PMS
Miten Vora (7)
Sr.Fund Manager
Equities
Abhijeet Dey (15)
Equities - Mutual Funds Offshore Advisory & DPM Research
Research Analyst
Equities
Saumil Mehta (11) Dealer
PMS
Nitin Hanspal (9)
Head Research Equities
Chockalingam N (12)
Head Equities – PMS &
Offshore Advisory
Brijesh Ved, (17)
All team members have research
responsibilities
Peer review structure fosters internal
debate on views
( ) Years of total experience as on Aug 2017
CIO
Ritesh Jain (18)
Dealer
Fixed Income
Mithraem
Bharucha (8)
Fund Manager
Fixed Income
Mayank Prakash(10)
Head
Fixed Income
Puneet Pal (17)
Fixed Income - Mutual Funds
Credit Analyst
Ronak
Negandhi (6)
36
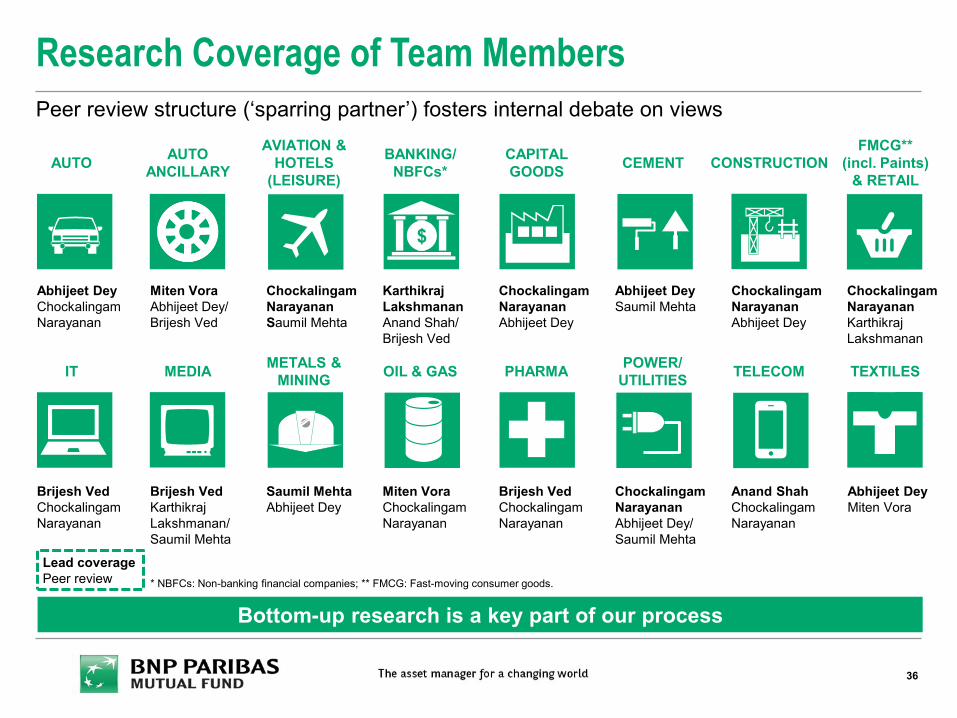
Research Coverage of Team Members
Bottom-up research is a key part of our process
* NBFCs: Non-banking financial companies; ** FMCG: Fast-moving consumer goods.
Peer review structure (‘sparring partner’) fosters internal debate on views
A
$ F AUTO
AUTO
ANCILLARY
AVIATION &
HOTELS
(LEISURE)
BANKING/
NBFCs*
CAPITAL
GOODS CEMENT CONSTRUCTION
FMCG**
(incl. Paints)
& RETAIL
IT MEDIA METALS &
MINING OIL & GAS PHARMA
POWER/
UTILITIES TELECOM TEXTILES
Abhijeet Dey
Chockalingam
Narayanan
Miten Vora
Abhijeet Dey/
Brijesh Ved
Chockalingam
Narayanan
Saumil Mehta
Karthikraj
Lakshmanan
Anand Shah/
Brijesh Ved
Chockalingam
Narayanan
Abhijeet Dey
Abhijeet Dey
Saumil Mehta
Chockalingam
Narayanan
Karthikraj
Lakshmanan
Chockalingam
Narayanan
Abhijeet Dey
Brijesh Ved
Chockalingam
Narayanan
Brijesh Ved
Karthikraj
Lakshmanan/
Saumil Mehta
Saumil Mehta
Abhijeet Dey
Miten Vora
Chockalingam
Narayanan
Brijesh Ved
Chockalingam
Narayanan
Chockalingam
Narayanan
Abhijeet Dey/
Saumil Mehta
Anand Shah
Chockalingam
Narayanan
Abhijeet Dey
Miten Vora
Lead coverage
Peer review

Fund Details
37
Investment Objective
The Scheme seeks to generate long-term capital growth by investing in a concentrated portfolio of equity & equity
related instruments of up to 25 companies and the balance in debt securities & money market instruments.
However, there can be no assurance that the investment objectives of the Scheme will be realized. The Scheme
does not guarantee/indicate any returns.
Asset Allocation
Equity and Equity related securities, (which are not exceeding 25 companies) Of which minimum 65% of equity net
assets will be companies among Nifty 100 by market Capitalization: 65-100%
Debt and Money Market instruments: 0-35%
NFO Dates NFO Opens : September 15, 2017 NFO Closes: September 29, 2017.
Re-Opens : Within 5 business days from date of allotment
Fund Manager Mr. Abhijeet Dey and Mr. Karthikraj Lakshmanan
Minimum Application
Amount (During NFO and
ongoing offer)
Lumpsum investment: Rs. 5000 and in multiples of Re. 1 thereafter.
SIP: Rs. 500 and in multiples of Re. 1 thereafter.
Benchmark Nifty 100
Plans & Options
Regular Plan and Direct Plan along with Growth and Dividend Option respectively
The above dividend option shall have dividend payout and dividend reinvestment facilities. There shall be a single
portfolio under the scheme.
Load
Entry Load: Nil
Exit Load: a) If units of the Scheme are redeemed or switched out up to 10% of the units (the limit) within 12
months from the date of allotment – Nil: b) If units of the scheme are redeemed or switched out in excess of the
limit within 12 months from the date of allotment - 1% of the applicable NAV c) If units of scheme are redeemed or
switched out after 12 months from the date of allotment - Nil.
For Product Label and Riskometer of the Scheme please refer slide 39

Risk Factors
38
Risk Factors: The risks associated with investments in equities include fluctuations in prices, as stock markets can be
volatile and decline in response to political, regulatory, economic, market and stock-specific development etc. The Scheme
may pursue only a limited degree of diversification as it may invest in a limited number of equity and equity related securities
or invest a greater proportion of assets in the securities of very few issuers (within the limits permitted by regulation) or be
concentrated on a few market sectors. The Scheme is also expected to have higher market liquidity risk on account of
concentration. This could have implications on the performance of the Scheme.
Further, to the extent the scheme invests in fixed income securities, the Scheme shall be subject to various risks associated
with investments in Fixed Income Securities such as Credit and Counterparty risk, Liquidity risk, Market risk, Interest Rate risk
& Re-investment risk etc., Further, the Scheme may use various permitted derivative instruments and techniques which may
increase the volatility of scheme’s performance. Also, the risks associated with the use of derivatives are different from or
possibly greater than, the risks associated with investing directly in securities and other traditional investments.
Please refer to Scheme Information Document available on our website (www.bnpparibasmf.in) for detailed Risk Factors,
assets allocation, investment strategy etc.
*Investors should consult their financial advisers if in doubt about whether the product is suitable for them.
Riskometer for the Scheme
Investors understand that their principal
will be at moderately high risk
BNP Paribas Focused 25 Equity Fund, an
open ended equity scheme, is suitable for
investors who are seeking*:
• Wealth creation in long term.
• Investment primarily in equity and equity-
related securities of up to 25 companies and
the rest in debt securities & money market
instruments.

Disclaimers: The material contained herein has been obtained from publicly available information, internally developed data
and other sources believed to be reliable, but BNP Paribas Asset Management India Private Limited (BNPPAMIPL) makes no
representation that it is accurate or complete. BNPPAMIPL has no obligation to tell the recipient when opinions or information
given herein change. It has been prepared without regard to the individual financial circumstances and objectives of persons
who receive it. This information is meant for general reading purpose only and is not meant to serve as a professional guide
for the readers. Except for the historical information contained herein, statements in this publication, which contain words or
phrases such as 'will', 'would', etc., and similar expressions or variations of such expressions may constitute 'forward-looking
statements'. These forward looking statements involve a number of risks, uncertainties and other factors that could cause
actual results to differ materially from those suggested by the forward-looking statements. BNPPAMIPL undertakes no
obligation to update forward-looking statements to reflect events or circumstances after the date thereof. The words like
believe/belief are independent perception of the Fund Manager and do not construe as opinion or advise. This information is
not intended to be an offer to sell or a solicitation for the purchase or sale of any financial product or instrument. The
information should not be construed as an investment advice and investors are requested to consult their investment advisor
and arrive at an informed investment decision before making any investments. The sector(s) mentioned in this document do
not constitute any recommendation of the same and BNP Paribas Mutual Fund may or may not have any future position in
these sector(s). The Trustee, AMC, Mutual Fund, their directors, officers or their employees shall not be liable in any way for
any direct, indirect, special, incidental, consequential, punitive or exemplary damages arising out of the information contained
in this document.
Reg. Office of AMC is at BNP Paribas House, 1 North Avenue, Maker Maxity, Bandra Kurla Complex, Bandra (East), Mumbai
- 400 051. Corporate Identity Number (CIN): U65991MH2003PTC142972.
Toll free Number: 1800 102 2595 Email id: [email protected] Website: www.bnppparibasmf.in
MUTUAL FUND INVESTMENTS ARE SUBJECT TO MARKET RISKS, READ ALL SCHEME RELATED DOCUMENTS
CAREFULLY.
Disclaimers
39

THANK YOU! BNP PARIBAS
INVESTMENT PARTNERS 14 rue Bergère
75009 Paris
Bnpparibas-ip.com