bmc neurology biomed central - home - springer · biomed central page 1 of 13 (page number not for...
TRANSCRIPT

BioMed CentralBMC Neurology
ss
Open AcceResearch articleMeta-analysis of the literature on diagnostic accuracy of SPECT in parkinsonian syndromesAnnemarie MM Vlaar1, Marinus JPG van Kroonenburgh2, Alfons GH Kessels3 and Wim EJ Weber*1Address: 1Department of Neurology, University Hospital Maastricht, The Netherlands, 2Department of Nuclear Medicine, University Hospital Maastricht, The Netherlands and 3Department of Clinical Epidemiology and Technology Assessment, University Hospital Maastricht, The Netherlands
Email: Annemarie MM Vlaar - [email protected]; Marinus JPG van Kroonenburgh - [email protected]; Alfons GH Kessels - [email protected]; Wim EJ Weber* - [email protected]
* Corresponding author
AbstractBackground: Parkinson's disease (PD) is the second most common neurodegenerative disorder.One of the most widely used techniques to diagnose PD is a Single Photon Emission ComputerTomography (SPECT) scan to visualise the integrity of the dopaminergic pathways in the brain.Despite this there remains some discussion on the value of SPECT in the differential diagnosis ofPD. We did a meta-analysis of all the existing literature on the diagnostic accuracy of both pre- andpost-synaptic SPECT imaging in the differential diagnosis of PD.
Methods: Relevant studies were searched in Medline, EMBASE and Cochrane databases withback-searching of their reference lists. We limited our analysis to studies with a clinically relevantmethodology: i.e. when they assessed the ability of the SPECT to provide 1. diagnosis of PD in anearly phase vs. normalcy; 2 diagnostic differentiation between PD and essential tremor (ET); 3.distinguishing between PD and vascular parkinsonism (VP); 4. delineation of PD from atypicalparkinsonian syndromes (APS). Gold standard was, dependent on the study type, clinicalexamination at initial visit or follow-up, and/or response to dopaminergic agents.
Results: The search gave 185 hits, of which we deemed 32 suitable for our analysis. From thesewe recalculated the diagnostic odds ratio of SPECT for the clinical questions above. The pooledodds ratio (with 95%CI) for presynaptic SPECT scan's ability to distinguish between early PD andnormalcy was 60 (13 – 277). For the ability to differentiate between PD and ET this ratio was 210(79–562). The ratio for presynaptic SPECT's ability to delineate PD from VP was 105 (32 – 348).The mean odds ratio for the presynaptic SPECT scans to differentiate between PD and the twoAPS was 2 (1 – 4), and for the postsynaptic SPECT imaging this was 19 (9–36).
Conclusion: SPECT with presynaptic radiotracers is relatively accurate to differentiate patientswith PD in an early phase from normalcy, patients with PD from those with ET, and PD from VP.
The accuracy of SPECT with both presynaptic and postsynaptic tracers to differentiate between PD and APS is relatively low.
Published: 1 September 2007
BMC Neurology 2007, 7:27 doi:10.1186/1471-2377-7-27
Received: 27 September 2006Accepted: 1 September 2007
This article is available from: http://www.biomedcentral.com/1471-2377/7/27
© 2007 Vlaar et al; licensee BioMed Central Ltd. This is an Open Access article distributed under the terms of the Creative Commons Attribution License (http://creativecommons.org/licenses/by/2.0), which permits unrestricted use, distribution, and reproduction in any medium, provided the original work is properly cited.
Page 1 of 13(page number not for citation purposes)
BMC Neurology 2007, 7:27 http://www.biomedcentral.com/1471-2377/7/27
BackgroundParkinson's disease (PD) is the second most commonneurodegenerative disorder with a life-time risk of 2 per-cent in males and 1.3 percent in females [1]. In most casesthe diagnosis of PD is straightforward when cardinal clin-ical signs and symptoms as bradykinesia, rigidity, andresting tremor are present [2]. However, these main fea-tures of PD are shared, at least in part, by essential tremor(ET), multisystem atrophy (MSA), progressive supranu-clear palsy (PSP), vascular parkinsonism (VP), dementiawith Lewy bodies, corticobasal degeneration, Alzheimer'sdisease, and drug-induced parkinsonism. Besides deline-ating PD from the above parkinsonian disorders, distin-guishing PD from normality can also be difficult,especially in early stage of the disease [3].
The gold standard for the diagnosis of PD is post-mortemneuropathological examination [2,4]. Neuropathologicalstudies show that even at end-stage disease the clinicaldiagnostic accuracy for PD varies between 75–90%, withMSA and PSP accounting for most false positives [2,5-7].Diagnostic accuracy is certainly less than 90% in earlierdisease, as Litvan et al. found that the median sensitivityfor the diagnosis of PD increased from 73% at the firstvisit to 80% to the last visit after a mean follow-up of 9years, and the median positive predictive value increasedfrom 46 to 64% [8].
A reliable test to diagnose PD is important for two rea-sons. Prognosis and management of PD and other parkin-sonian disorders differ considerably [9], and an objectivedisease marker would facilitate the development of neuro-protective therapies [10]. Several procedures have beenproposed to diagnose PD: functional imaging with Posi-tron Emission Tomography (PET) or Single Photon Emis-sion Computer Tomography (SPECT), transcranialsonography, olfactory- and neuropsychological tests,biomarkers and DNA tests [11-14].
At the moment neuro-imaging techniques like PET andSPECT are the most widely used diagnostic tools [9]. PETis at least as reliable as SPECT, but its use in routine clini-cal practice is limited by high costs and a relative shorthalf-life of its radioactive tracers [15-18]. Different radi-otracers can be used to visualise the nigrostriatal system.Presynaptic tracers are used to visualize the dopaminetransporter, and postsynaptic radiotracers to assessdopamine receptor density. Examples of presynaptic radi-otracers are Iodine-123-beta-CIT, Iodine-123-Ioflupane(FP-CIT), Iodine-123-IPT and 99mCT-TRODAT-1. Exam-ples of postsynaptic tracers are Iodine-123-iodobenza-mide and Iodine-123-Iodobenzofuran [19].
Despite its widespread use, there is no consensus aboutthe value of SPECT in the differential diagnosis of PD.
First, comparisons between this functional dopaminergicimaging and the ultimate gold standard, autopsy-provenPD, are almost non-existent [20,21]. Second, using a sur-rogate gold standard in the form of a long-term clinicalfollow-up, the ability of SPECT to discriminate PD fromnormality and/or other parkinsonian disorders and to dis-tinguish one of the atypical parkinsonian syndromes fromthe other varies greatly among different studies. Compar-ing these studies is difficult, as they use different radiotrac-ers and SPECT techniques, and, more importantly,involve different patient populations. A major issue hereis that many studies use clearly-defined later-stagepatients that are obviously not representative for the diag-nostic problem that one wants to solve with a SPECT.
With this perspective of clinical relevance we did a meta-analysis of all the existing literature on the diagnosticaccuracy of both pre- and post-synaptic SPECT in the dif-ferential diagnosis of PD. We defined studies as clinicallyrelevant when they dealt with the ability of the SPECT toidentify PD in patients with diagnostic uncertainty, todelineate PD from the other parkinsonian disorders andET, and to provide an early diagnosis of PD in patientswith little signs and symptoms.
MethodsData sourcesMeta-analysis was done according to current methodolog-ical recommendations [22-24]. We searched MEDLINEusing the following terms: PD, parkinsonian, MSA, PSP,VP and ET. We searched for MeSH terms and free textwords. All in combination with SPECT and clinical trial.No beginning data limit was used. The search was updateduntil 9 January 2006. Only English-, Dutch- and Germanlanguage studies were considered, because the investiga-tors were familiar with these languages. The bibliogra-phies of selected articles were screened for potentiallysuitable references which were then retrieved. We alsosearched the EMBASE and Cochrane database (WileyInterScience) using the same search strategy.
Study selectionTwo investigators (AV, WW) screened the full text ofpotential relevant articles using the inclusion criteria. Forthis we use a standard form combined with a modifiedQUADAS score, see table 1 (form available upon request)[25]. In all cases the investigators reached consensus.Studies were selected if the subject of the study was in oneof the following three areas:
1. Patients who underwent SPECT because of diagnosticuncertainty.
Page 2 of 13(page number not for citation purposes)

BMC Neurology 2007, 7:27 http://www.biomedcentral.com/1471-2377/7/27
2. Cross-sectional study of already diagnosed patient cate-gories, in which SPECT was tested as a means to differen-tiate between various parkinsonian syndromes.
3. Cross-sectional studies with patients with known PD inan early stage (Hoehn & Yahr stage 2 or less) vs. normalhealthy controls, in which SPECT was tested as a means toprovide an early diagnosis.
Exclusion criteriaThe following exclusion criteria were used: 1) whole arti-cle not available, 2) language different from English, Ger-man or Dutch, 3) studies including only advanced PDpatients vs. healthy controls, and studies with other maincategories, e.g. dementia, 4) study population with lessthan 10 patients, 5) if the numbers of true positives, falsenegatives, true negatives and false positives with a cut-offpoint of 2 standard deviations (SD) from the mean of thecontrol group were not available or could not be derivedthe study was excluded.
When the study included more than 85 patients we con-tacted the corresponding author to ask for the raw data(see below).
We chose this approach, because we expected a substan-tial cut-off point effect in the included studies. We did notwant to be dependent upon the assumption that the diag-nostic odds ratio's in our study would not be affected bydifferences in the individual cut-off points. To reduce het-erogeneity we decided to choose one common cut-offpoint for all studies. We took a cut-off point of two stand-ard deviations (SD) after consulting with nuclear imagingexperts in our hospital and the University Hospital ofAmsterdam. Both departments use a cut-off point of 2SD's below healthy controls. So we recalculated all resultsfrom all studies using the individual data from tables andfigures in the published paper, using this new cut-offpoint. If recalculation was not possible (when data forindividual patients were not traceable from the manu-script), we excluded the study. This exclusion leads to bias,of course. We feel, however, that, as these studies did notadhere to recommended guidelines by not providing theraw scan results to allow the construction of the diagnostic2 × 2 table, we did not exclude the methodologically beststudies [24].
Data extraction and analysesSensitivity, specificity and the odds ratio was calculatedfor each study separately, and the pooled odds ratio's(OR) for all studies together. Although we tried to reduceheterogeneity by recalculating study results using onecommon cut-off point, we still expected a threshold effect,because of differences in patients, SPECT machinery, radi-otracers etc. Therefore, according to recommendations byDeekes and Egger we used diagnostic OR's [26].
For studies with zeroes in one or more cells 0.5 was addedto all four cells of the 2 × 2 table. Trials with a sensitivityof 100% and a specificity of 0% were not excluded, how-ever the pooled OR's were also calculated without suchstudies (See # in Figure 4, 5 and 6).
All results were put in software SPSS 11.0 for Windowsand later converted to Stata/SE9.
The metan and metareg commands were built in Stata/SE9. Because of the heterogeneity of the selected studieswe used a random model to calculate the diagnostic oddsratios. Heterogeneity was calculated with the I 2 [27].
ResultsLiterature searchThe search on Medline (SPECT & clinical trial) gave 1503hits. When we added all parkinsonian disorders we lim-ited the Medline search to 56 relevant hits.
In the Cochrane database we found 26 hits and in Embase45 hits, but no additional clinical studies above the onesfound in Medline. With cross-reference searching wefound an additional 128 relevant trials (See additional file1). Together with our own retrospective study of 248patients with unclear parkinsonism who underwentSPECT in the period 2001 to 2006, this resulted in 185possibly relevant studies [28].
Of these 185 we excluded 153 studies (See additional file2). Seven were excluded because of the language criteriaand 85 articles were excluded as they did not deal withone of our three designated areas of clinical relevancy:most of them were about techniques, dementia or drugefficacy. We excluded an additional 61, because the abso-lute numbers with a cut-off point of 2 standard deviationsbelow the control group were not available or could notbe derived. We mailed the authors of the four studies withmore than 85 patients, to ask for missing data [29-32],and received a response from 1 [30]. We wanted toacquire raw data from relatively large studies that wouldhave a substantial impact on our meta-analysis; there were4 large studies with more than 85 patients, the restinvolved smaller numbers in the 20–35 range. We thussought to contact the authors of these 4 studies, as we feltthat studies with less than 85 subjects would have a verylimited impact on the overall scores.
Of the 32 trials left (See additional file 3) 7 dealt withdiagnostic uncertainty including a clinical follow-up assurrogate gold standard, 20 studies were cross-sectionalincluding subjects with known parkinsonian disorders,and 6 studies involved patients with early PD. One clinicalstudy fitted as well in the early PD groups as in the studygroup of known parkinsonian disorders [33]. Of the 7 fol-low-up studies, 5 were prospective. Of these prospectiveanalyses, 2 included untreated new patients with parkin-
Page 3 of 13(page number not for citation purposes)

BMC Neurology 2007, 7:27 http://www.biomedcentral.com/1471-2377/7/27
Page 4 of 13(page number not for citation purposes)
Table 1: Methodological aspects of all included trials.
Author Number of
patients (exclusiv
e controls)
(1)
Study methodology (2)
Patiënt selection conseque
tive
Golden standard
(3)
Clinical daignostic criteria clearly
described?
Minimal duration follow-up after scan (month)
Radiotracer: pre-
or postsynaptic or both
Name of radiotrac
er (4)
SPECT judged visually, template or drawn
(5)
Part of striatum judged
(6)
Cut-off point of 2 sd's taken
by the authors?
Drug stopped
appropriate before SPECT?
(7)
SPECT judged blindly
for clinical
diagnoses?
Asenbaum '98
61 II, III - cc yes - pre beta m striatum 2sd yes yes
Benamer '00
185 II - cc yes - pre fpcit t striatum - yes yes
Booij '01 20 I - cf yes 24 pre fpcit t striatum 2sd - yesBuck '95 23 II - cc yes - post ibf t striatum 2sd - -Eerola
'05135 I yes cf yes 24 pre beta m striatum - yes -
Gerschlager '02
33 II - cc yes - pre beta m striatum - yes -
Haapaniemi '01
29 III - cf yes 24 pre beta t striatum - yes yes
Huang '01
34 III - cc yes - pre beta m putamen - yes -
Kim '02 31 II - cc yes - both beta/ibf t c-putamen
- yes yes
Laere V '04
62 III yes . - . pre fp/tr t c-putamen
- yes -
Lee '99 26 II - cc yes - pre ipt m striatum - yes -Lokkegaa
rd '0272 I yes cf yes 14 pre beta t striatum - - yes
Lu '04 85 II - cc yes - pre trodat t c-putamen
- - yes
Messa '98 18 II - cc yes - pre beta m c-pc - - -Muller
'9824 III - dd yes - pre beta m striatum - yes yes
Oertel '93
67 II - fd - 3 post ibzm t striatum 2sd yes -
Oyanagi '02
13 II - cc yes - post ibf t striatum - yes -
Pirker '97 19 II - cc yes - post epide m striatum - yes -Pirker '00 78 II - cc yes - pre beta m striatum - yes -Pirker '02 51 II - cc yes - pre beta m striatum - yes yes
Plotkin '05
57 II yes cc yes - both fp/ibzm t putamen - yes yes
Rooyen v '93
21 II - cc - - posr ibzm m striatum - yes -
Schelvsky '93
44 II yes dd - - post ibzm t striatum - - -
Schwarz '98
65 I - fd yes 24 post ibzm t striatum 2sd yes yes
Schwarz '94
20 II - cc - - post ibzm t striatum - - -
Schwarz '00
28 III - dd yes - pre ipt t striatum - - -
Schwarz '97
55 I - fd - 24 post ibzm t striatum 2sd - yes
Schwarz '93
62 I yes fd - 4 post ibzm m striatum 2sd yes yes
Seppi '04 32 II yes cc yes - post ibzm m striatum 2sd yes -Stoffers
'0570 I - cf yes 36 pre beta t c-pc 2sd yes -
Tatsch '91
42 II - cc - - post ibzm t striatum 2sd yes -
Vlaar '06 147 I yes cf yes 3 both fp/ibzm t putamen 2sd yes yes
- means "no" or information not clearly mentioned by the authors1) Number of patients of particular studied included in meta-analysis. Healthy controls and patients with diseases not relevant or inconclusive diagnosis for this study are not counted.2) Study methodologyI = patients with diagnostic uncertainty. Diagnostic accuracy of SPECT was determined with a surrogate gold standardII = cross sectional study of already diagnosed patient categoriesIII = early PD vs. normalcy3) cf = clinical criteria after follow-upcc = clinical criteria without follow-updd = effect dopaminergic drugs or apomorphine testfd = clinical criteria after follow-up & effect dopaminergic drugs or apomorphine test4) beta = Iodine-123-beta-CIT (beta-CIT), fpcit = Iodine-123-Ioflupane (FP-CIT), tr = Iodine-123-IPT and 99mCT-TRODAT-1.ibzm = 123I-iodobenzamide (IBZM), ibf = Iodine-123-Iodobenzofuran (IBF), epide = Iodine-123-epidepride.5) t = region of interest determined with templatem = region of interest manually encircled6) bg = basale ganglia or striatum, put = putamen, cp = contralateral putamen, cpc = contralateral putamen/caudate ratio7) Yes if: drugs with interference with radiotracer were stopped appropriately or if the subjects did not use dopaminergic drugs at the moment of the spect.(-) if this information was not given or if dopaminergic drugs seemed not to be stopped appropriately.
BMC Neurology 2007, 7:27 http://www.biomedcentral.com/1471-2377/7/27
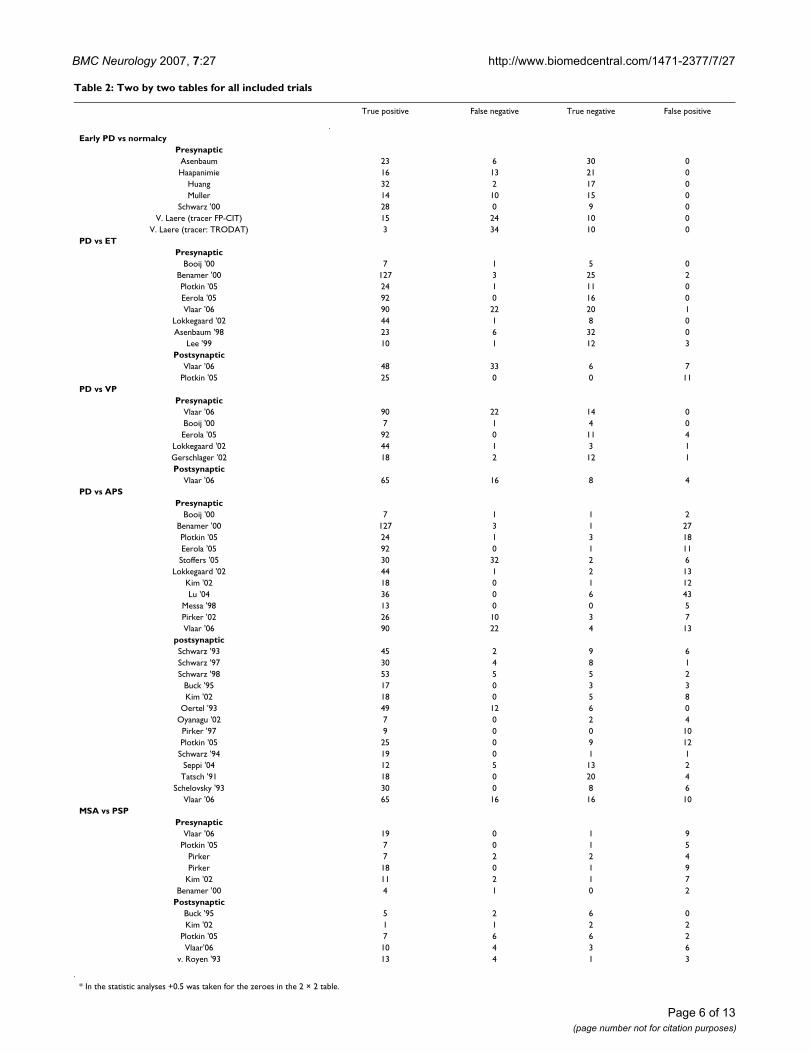
sonism [34,35], and 3 included patients with inconclusiveparkinsonism or with a questionable effect of anti-parkin-sonian medication [28,36,37]. Two of the 7 follow-upstudies were retrospective: Lokkegaard and colleagues ret-rospectively investigated 90 consecutive patients referredfor Beta-CIT SPECT for various reasons, and a non-treat-ing neurologist obtained the final diagnosis from the clin-ical records of the patients [38]. Stoffers et alretrospectively analysed the SPECT scans of 72 patientswith an initial diagnosis of PD, who were then re-diag-nosed after various intervals [39]. The demographic andmethodological characteristics of all included studies arevisible in Table 1. The absolute numbers of the 2 × 2 tablesof all included trials are shown in Table 2.
Results of the pooled study data analysisWe recalculated the diagnostic power of SPECT for the fol-lowing clinical problems: 1. diagnosis of PD in an earlyphase vs. normalcy; 2 diagnostic differentiation betweenPD and ET; 3. diagnostic differentiation between PD andvascular parkinsonism; 4. diagnostic differentiationbetween PD and Atypical Parkinsonian Syndromes (APS)consisting of MSA and PSP.
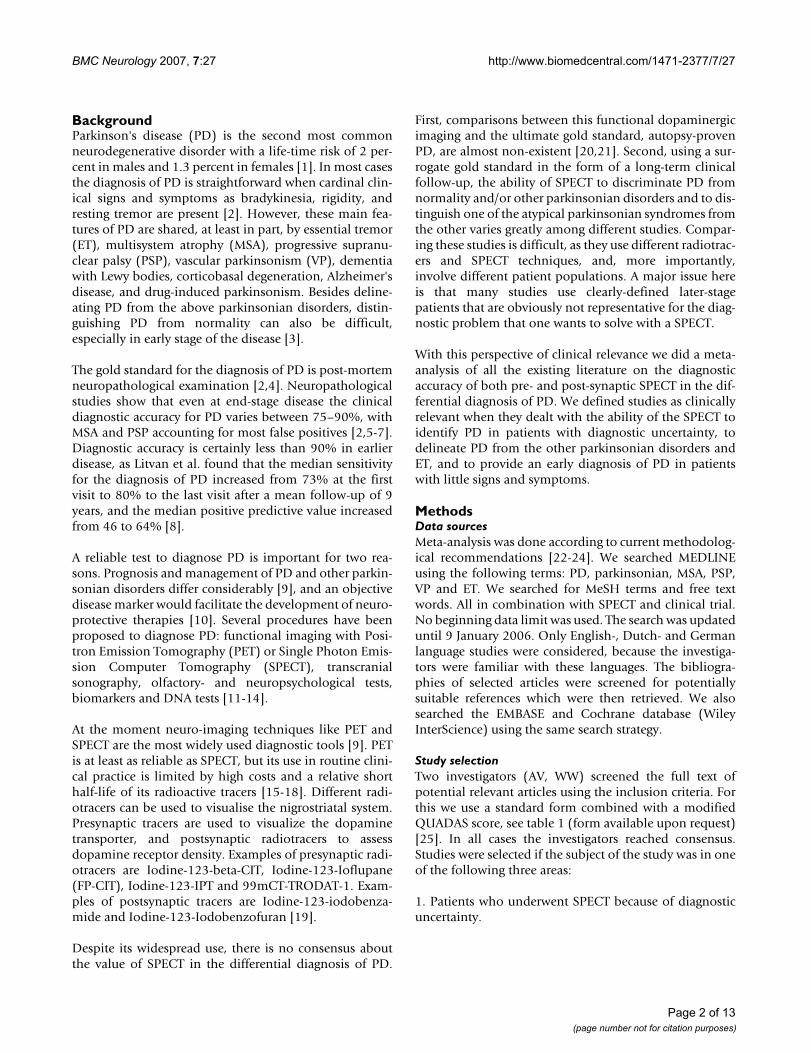
1. Diagnosis of PD in an early phase vs. normalcyPooled data from selected studies [33,40-44] were used tocalculate the diagnostic accuracy of SPECT to differentiatebetween PD and normalcy. All six cross-sectionals (utilis-ing presynaptic tracers) with patients with known PD inan early stage (Hoehn & Yahr score of 2 or lesser) had aspecificity of 100%. However sensitivity varied from 8%to 100%. The pooled odds ratio with a 95%CI was 60 (13– 277). See also Figure 1.
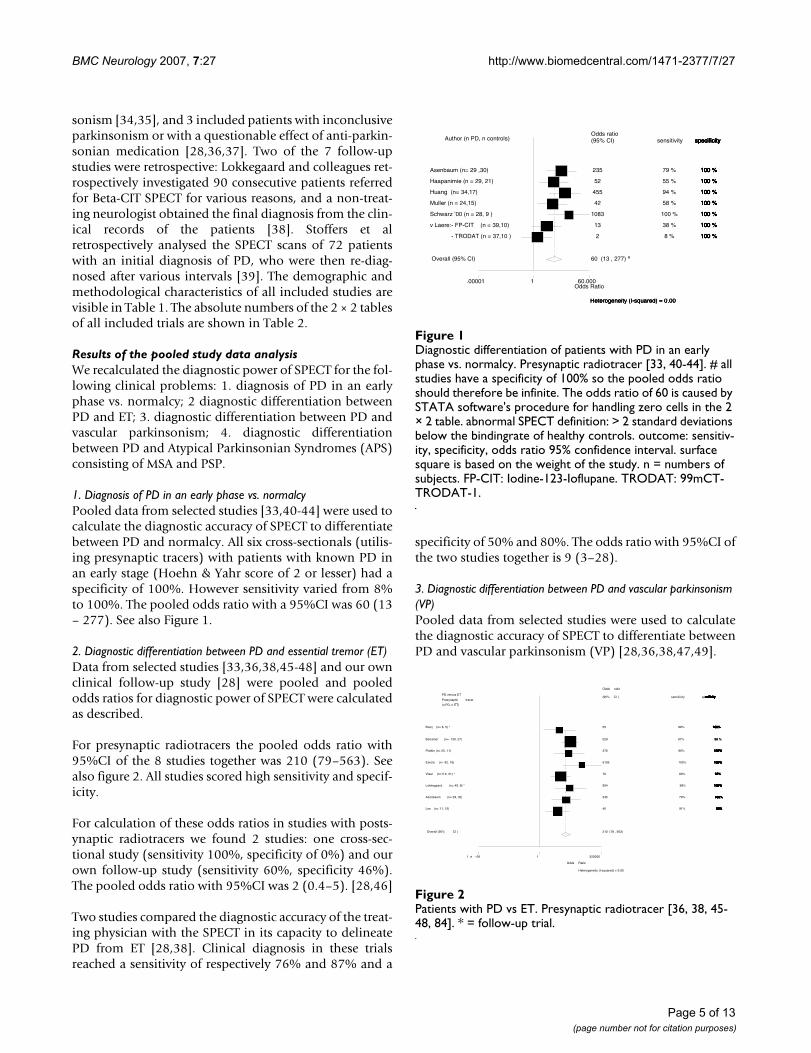
2. Diagnostic differentiation between PD and essential tremor (ET)Data from selected studies [33,36,38,45-48] and our ownclinical follow-up study [28] were pooled and pooledodds ratios for diagnostic power of SPECT were calculatedas described.
For presynaptic radiotracers the pooled odds ratio with95%CI of the 8 studies together was 210 (79–563). Seealso figure 2. All studies scored high sensitivity and specif-icity.
For calculation of these odds ratios in studies with posts-ynaptic radiotracers we found 2 studies: one cross-sec-tional study (sensitivity 100%, specificity of 0%) and ourown follow-up study (sensitivity 60%, specificity 46%).The pooled odds ratio with 95%CI was 2 (0.4–5). [28,46]
Two studies compared the diagnostic accuracy of the treat-ing physician with the SPECT in its capacity to delineatePD from ET [28,38]. Clinical diagnosis in these trialsreached a sensitivity of respectively 76% and 87% and a
specificity of 50% and 80%. The odds ratio with 95%CI ofthe two studies together is 9 (3–28).
3. Diagnostic differentiation between PD and vascular parkinsonism (VP)Pooled data from selected studies were used to calculatethe diagnostic accuracy of SPECT to differentiate betweenPD and vascular parkinsonism (VP) [28,36,38,47,49].
Patients with PD vs ETFigure 2Patients with PD vs ET. Presynaptic radiotracer [36, 38, 45-48, 84]. * = follow-up trial.
Odds ratio
3.1e - 06 1 318580
PD versus ET
Presynaptic tracer
(n PD, n ET)
sensitivity specificity
Odds ratio
(95% CI )
55.0Booij (n= 8, 5) * 88% 100%
529.2Benamer (n= 130, 27) 97% 98 %
375.7Plotkin (n= 25, 11) 96% 100%
6105.0Eerola (n= 92, 16) 100% 100%
76.0Vlaar (n=112, 21) * 80% 95%
504.3Lokkegaard (n= 45, 8) * 98% 100%
235.0Asenbaum (n= 29, 32) 79% 100%
40.0Lee (n= 11, 15) 91% 80%
210.47 (78.63,563.36)Overall (95% CI )
Odds ratio
1. e - 06 1 320000
PD versus ET
Presynaptic tracer
(n PD, n ET)
sensitivity specificity
Odds ratio
(95% CI )
55Booij (n= 8, 5) * 88% 100%
529Benamer (n= 130, 27) 97%
376Plotkin (n= 25, 11) 96% 100%
6105Eerola (n= 92, 16) 100% 100%
76Vlaar (n=112, 21) * 80% 95%
504Lokkegaard (n= 45, 8) * 98% 100%
235Asenbaum (n= 29, 32) 79% 100%
40Lee (n= 11, 15) 91% 80%
210 (78 , 563)Overall (95% CI )
Odds ratio
3.1e - 06 1 318580
PD versus ET
Presynaptic tracer
(n PD, n ET)
sensitivity specificity
Odds ratio
(95% CI )
55.0Booij (n= 8, 5) * 88% 100%
529.2Benamer (n= 130, 27) 97%
375.7Plotkin (n= 25, 11) 96% 100%
6105.0Eerola (n= 92, 16) 100% 100%
76.0Vlaar (n=112, 21) * 80% 95%
504.3Lokkegaard (n= 45, 8) * 98% 100%
235.0Asenbaum (n= 29, 32) 79% 100%
40.0Lee (n= 11, 15) 91% 80%
210.47 (78.63,563.36)Overall (95% CI )
Odds ratio
1. e - 06 1 320000
PD versus ET
Presynaptic tracer
(n PD, n ET)
sensitivity specificity
Odds ratio
(95% CI )
55Booij (n= 8, 5) * 88% 100%
529Benamer (n= 130, 27) 97%
376Plotkin (n= 25, 11) 96% 100%
Odds ratio
3.1e - 06 1 318580
PD versus ET
Presynaptic tracer
(n PD, n ET)
sensitivity specificity
Odds ratio
(95% CI )
55.0Booij (n= 8, 5) * 88% 100%
529.2Benamer (n= 130, 27) 97%
375.7Plotkin (n= 25, 11) 96% 100%
6105.0Eerola (n= 92, 16) 100% 100%
76.0Vlaar (n=112, 21) * 80% 95%
504.3Lokkegaard (n= 45, 8) * 98% 100%
235.0Asenbaum (n= 29, 32) 79% 100%
40.0Lee (n= 11, 15) 91% 80%
210.47 (78.63,563.36)Overall (95% CI )
Odds Ratio
Heterogeneity (I-squared) = 0.00
1. e - 06 1 320000
PD versus ET
Presynaptic tracer
(n PD, n ET)
sensitivity specificity
Odds ratio
(95% CI )
55Booij (n= 8, 5) * 88%
529Benamer (n= 130, 27) 97%
376Plotkin (n= 25, 11) 96% 100%
6105Eerola (n= 92, 16) 100% 100%
76Vlaar (n=112, 21) * 80% 95%
504Lokkegaard (n= 45, 8) * 98% 100%
235Asenbaum (n= 29, 32) 79% 100%
40Lee (n= 11, 15) 91% 80%
210 (78 , 563)Overall (95% CI )
Odds ratio
3.1e - 06 1 318580
PD versus ET
Presynaptic tracer
(n PD, n ET)
sensitivity specificity
Odds ratio
(95% CI )
55.0Booij (n= 8, 5) * 88% 100%
529.2Benamer (n= 130, 27) 97% 98 %
375.7Plotkin (n= 25, 11) 96% 100%
6105.0Eerola (n= 92, 16) 100% 100%
76.0Vlaar (n=112, 21) * 80% 95%
504.3Lokkegaard (n= 45, 8) * 98% 100%
235.0Asenbaum (n= 29, 32) 79% 100%
40.0Lee (n= 11, 15) 91% 80%
210.47 (78.63,563.36)Overall (95% CI )
Odds ratio
1. e - 06 1 320000
PD versus ET
Presynaptic tracer
(n PD, n ET)
sensitivity specificity
Odds ratio
(95% CI )
55Booij (n= 8, 5) * 88% 100%
529Benamer (n= 130, 27) 97%
Odds ratio
3.1e - 06 1 318580
PD versus ET
Presynaptic tracer
(n PD, n ET)
sensitivity specificity
Odds ratio
(95% CI )
55.0Booij (n= 8, 5) * 88% 100%
529.2Benamer (n= 130, 27) 97% 98 %
375.7Plotkin (n= 25, 11) 96% 100%
6105.0Eerola (n= 92, 16) 100% 100%
76.0Vlaar (n=112, 21) * 80% 95%
504.3Lokkegaard (n= 45, 8) * 98% 100%
235.0Asenbaum (n= 29, 32) 79% 100%
40.0Lee (n= 11, 15) 91% 80%
210.47 (78.63,563.36)Overall (95% CI )
Odds ratio
1. e - 06 1 320000
PD versus ET
Presynaptic tracer
(n PD, n ET)
sensitivity specificity
Odds ratio
(95% CI )
55Booij (n= 8, 5) * 88% 100%
529Benamer (n= 130, 27) 97%
376Plotkin (n= 25, 11) 96% 100%
6105Eerola (n= 92, 16) 100% 100%
76Vlaar (n=112, 21) * 80% 95%
504Lokkegaard (n= 45, 8) * 98% 100%
235Asenbaum (n= 29, 32) 79% 100%
40Lee (n= 11, 15) 91% 80%
210 (78 , 563)Overall (95% CI )
Odds ratio
3.1e - 06 1 318580
PD versus ET
Presynaptic tracer
(n PD, n ET)
sensitivity specificity
Odds ratio
(95% CI )
55.0Booij (n= 8, 5) * 88% 100%
529.2Benamer (n= 130, 27) 97%
375.7Plotkin (n= 25, 11) 96% 100%
6105.0Eerola (n= 92, 16) 100% 100%
76.0Vlaar (n=112, 21) * 80% 95%
504.3Lokkegaard (n= 45, 8) * 98% 100%
235.0Asenbaum (n= 29, 32) 79% 100%
40.0Lee (n= 11, 15) 91% 80%
210.47 (78.63,563.36)Overall (95% CI )
Odds ratio
1. e - 06 1 320000
PD versus ET
Presynaptic tracer
(n PD, n ET)
sensitivity specificity
Odds ratio
(95% CI )
55Booij (n= 8, 5) * 88% 100%
529Benamer (n= 130, 27) 97%
376Plotkin (n= 25, 11) 96% 100%
Odds ratio
3.1e - 06 1 318580
PD versus ET
Presynaptic tracer
(n PD, n ET)
sensitivity specificity
Odds ratio
(95% CI )
55.0Booij (n= 8, 5) * 88% 100%
529.2Benamer (n= 130, 27) 97%
375.7Plotkin (n= 25, 11) 96% 100%
6105.0Eerola (n= 92, 16) 100% 100%
76.0Vlaar (n=112, 21) * 80% 95%
504.3Lokkegaard (n= 45, 8) * 98% 100%
235.0Asenbaum (n= 29, 32) 79% 100%
40.0Lee (n= 11, 15) 91% 80%
210.47 (78.63,563.36)Overall (95% CI )
Odds Ratio
Heterogeneity (I-squared) = 0.00
1. e - 06 1 320000
PD versus ET
Presynaptic tracer
(n PD, n ET)
sensitivity specificity
Odds ratio
(95% CI )
55Booij (n= 8, 5) * 88%
529Benamer (n= 130, 27) 97%
376Plotkin (n= 25, 11) 96% 100%
6105Eerola (n= 92, 16) 100% 100%
76Vlaar (n=112, 21) * 80% 95%
504Lokkegaard (n= 45, 8) * 98% 100%
235Asenbaum (n= 29, 32) 79% 100%
40Lee (n= 11, 15) 91% 80%
210 (78 , 563)Overall (95% CI )
Diagnostic differentiation of patients with PD in an early phase vs. normalcyFigure 1Diagnostic differentiation of patients with PD in an early phase vs. normalcy. Presynaptic radiotracer [33, 40-44]. # all studies have a specificity of 100% so the pooled odds ratio should therefore be infinite. The odds ratio of 60 is caused by STATA software's procedure for handling zero cells in the 2 × 2 table. abnormal SPECT definition: > 2 standard deviations below the bindingrate of healthy controls. outcome: sensitiv-ity, specificity, odds ratio 95% confidence interval. surface square is based on the weight of the study. n = numbers of subjects. FP-CIT: Iodine-123-Ioflupane. TRODAT: 99mCT-TRODAT-1.
Odds ratio.00001 1 60.000
Author (n PD, n controls) sensitivity specificityOdds ratio(95% CI)
235 Asenbaum (n= 29 ,30) 79 % 100 %
52 Haapanimie (n = 29, 21) 55 % 100 %
455Huang (n= 34,17) 94 % 100 %
42Muller (n = 24,15) 58 % 100 %
1083Schwarz ’00 (n = 28, 9 ) 100 % 100 %
13v Laere:- FP-CIT (n = 62,10) 38 % 100 %
2- TRODAT (n = 64,10 ) 8 % 100 %
60 (13 , 277)Overall (95% CI)
Odds Ratio
Heterogeneity (I-squared) = 0.00
.00001 1 60.000
Author (n PD, n controls) sensitivity specificityOdds ratio(95% CI)
235 Asenbaum (n= 29 ,30) 79 % 100 %
52 Haapanimie (n = 29, 21) 55 % 100 %
455Huang (n= 34,17) 94 % 100 %
42Muller (n = 24,15) 58 % 100 %
1083Schwarz ’00 (n = 28, 9 ) 100 % 100 %
13v Laere:- FP-CIT (n = 39,10) 38 % 100 %
2- TRODAT (n = 37,10 ) 8 % 100 %
60 (13 , 277) #Overall (95% CI)
Odds ratio.00001 1 60.000
Author (n PD, n controls) sensitivity specificityOdds ratio(95% CI)
235 Asenbaum (n= 29 ,30) 79 % 100 %
52 Haapanimie (n = 29, 21) 55 % 100 %
455Huang (n= 34,17) 94 % 100 %
42Muller (n = 24,15) 58 % 100 %
1083Schwarz ’00 (n = 28, 9 ) 100 % 100 %
13v Laere:- FP-CIT (n = 62,10) 38 % 100 %
2- TRODAT (n = 64,10 ) 8 % 100 %
60 (13 , 277)Overall (95% CI)
Odds Ratio
Heterogeneity (I-squared) = 0.00
.00001 1 60.000
Author (n PD, n controls) sensitivity specificityOdds ratio(95% CI)
235 Asenbaum (n= 29 ,30) 79 % 100 %
52 Haapanimie (n = 29, 21) 55 % 100 %
455Huang (n= 34,17) 94 % 100 %
42Muller (n = 24,15) 58 % 100 %
1083Schwarz ’00 (n = 28, 9 ) 100 % 100 %
13v Laere:- FP-CIT (n = 39,10) 38 % 100 %
2- TRODAT (n = 37,10 ) 8 % 100 %
60 (13 , 277) #Overall (95% CI)
Page 5 of 13(page number not for citation purposes)
BMC Neurology 2007, 7:27 http://www.biomedcentral.com/1471-2377/7/27
Page 6 of 13(page number not for citation purposes)
Table 2: Two by two tables for all included trials
True positive False negative True negative False positive
Early PD vs normalcyPresynaptic
Asenbaum 23 6 30 0Haapanimie 16 13 21 0
Huang 32 2 17 0Muller 14 10 15 0
Schwarz '00 28 0 9 0V. Laere (tracer FP-CIT) 15 24 10 0
V. Laere (tracer: TRODAT) 3 34 10 0PD vs ET
PresynapticBooij '00 7 1 5 0
Benamer '00 127 3 25 2Plotkin '05 24 1 11 0Eerola '05 92 0 16 0Vlaar '06 90 22 20 1
Lokkegaard '02 44 1 8 0Asenbaum '98 23 6 32 0
Lee '99 10 1 12 3Postsynaptic
Vlaar '06 48 33 6 7Plotkin '05 25 0 0 11
PD vs VPPresynaptic
Vlaar '06 90 22 14 0Booij '00 7 1 4 0Eerola '05 92 0 11 4
Lokkegaard '02 44 1 3 1Gerschlager '02 18 2 12 1Postsynaptic
Vlaar '06 65 16 8 4PD vs APS
PresynapticBooij '00 7 1 1 2
Benamer '00 127 3 1 27Plotkin '05 24 1 3 18Eerola '05 92 0 1 11Stoffers '05 30 32 2 6
Lokkegaard '02 44 1 2 13Kim '02 18 0 1 12Lu '04 36 0 6 43
Messa '98 13 0 0 5Pirker '02 26 10 3 7Vlaar '06 90 22 4 13
postsynapticSchwarz '93 45 2 9 6Schwarz '97 30 4 8 1Schwarz '98 53 5 5 2
Buck '95 17 0 3 3Kim '02 18 0 5 8
Oertel '93 49 12 6 0Oyanagu '02 7 0 2 4Pirker '97 9 0 0 10Plotkin '05 25 0 9 12Schwarz '94 19 0 1 1
Seppi '04 12 5 13 2Tatsch '91 18 0 20 4
Schelovsky '93 30 0 8 6Vlaar '06 65 16 16 10
MSA vs PSPPresynaptic
Vlaar '06 19 0 1 9Plotkin '05 7 0 1 5
Pirker 7 2 2 4Pirker 18 0 1 9
Kim '02 11 2 1 7Benamer '00 4 1 0 2
PostsynapticBuck '95 5 2 6 0Kim '02 1 1 2 2
Plotkin '05 7 6 6 2Vlaar'06 10 4 3 6
v. Royen '93 13 4 1 3
* In the statistic analyses +0.5 was taken for the zeroes in the 2 × 2 table.

BMC Neurology 2007, 7:27 http://www.biomedcentral.com/1471-2377/7/27
Using presynaptic radiotracers the 5 studies all scoredhigh sensitivity and specificity for SPECT to differentiatebetween PD and VP. The pooled odds ratio with 95%CI ofall five studies together is 105 (32 – 348). See also figure 3.
We were not able to find any trials except our own trialwith postsynaptic tracers aimed at this diagnostic prob-lem. We found a sensitivity of 80%, specificity of 67% andan odds ratio of 95%CI of 8 (2 – 30).
Lokkegaard et al. and we mentioned the diagnostic accu-racy of the clinician to differentiate PD from VP and founda sensitivity of respectively 87% and 76% and a specificityof respectively 0% and 63% with a odds ratio 95%CI of 3(0.5–18) [28,38].
4. Diagnostic differentiation between PD and APS (MSA & PSP)Pooled data from selected studies were used to calculatethe diagnostic accuracy of SPECT to differentiate betweenPD and APS [18,28,30,34-39,46-48,50-59].
When using presynaptic tracers all trials scored moderateto high sensitivity, but with a low specificity. Combiningall 11 trials the mean odds ratio with 95% CI for the pre-synaptic tracer to differentiate between PD and the twoAPS was 2 (1 – 4). See Figure 4.
When using postsynaptic tracers the 14 trial scoredtogether a pooled odds ratio 95% CI of 19 (9–36). See Fig-ure 5.
Four follow-up studies compared the diagnostic accuracyof the treating physician with the SPECT in its capacity todelineate PD from the two APS. Clinical diagnosis in thesetrials reached a high sensitivity, but a low specificity. Thepooled odds ratio 95% CI was 9 (2 – 34). See Figure 6.
The diagnostic accuracy of SPECT to differentiate MSAfrom PSP was low for both the presynaptic and postsynap-tic radiotracers. With presynaptic racers sensitivity of the 6trials was extremely high (78 – 100%), however specificitywas low (0–33%). The 5 studies with postsynaptic tracersscored moderate sensitivity (50 – 71%) and specificity (25– 100%).
The pooled odds ratio with 95% CI was 2 (0.6 – 7) for thepresynaptic tracers and 2 (0.8 – 6) for the postsynaptictracers [28,46,48,50,52,56,60,61].
DiscussionTo our knowledge this is the first meta-analysis of the lit-erature on the diagnostic value of SPECT in patients withparkinsonian syndromes. Before discussing the actualresults we would like to point out some methodologicalproblems.
We were very strict in including studies. To compare theresults from selected studies we defined positive tests asvalues equal with or exceeding two standard deviationsbelow healthy controls. When authors defined their posi-tive results otherwise, we recalculated these, where possi-ble. However, as many studies did not include raw data,we had to reject these, as we were then not able to (re)cal-culate the absolute numbers of true positive, false nega-tive, true negative, and false positives with a cut-off pointof two standard deviations.
We dichotomised the radiotracers utilised into twogroups: presynaptic and postsynaptic tracers. By doingthis we assumed that all tracers in one group have a simi-lar reliability. This seems to be reasonable for beta-CITand FP-CIT, especially when the SPECT of the parkinso-nian patient is expressed as a percentage of the bindingratios found in healthy controls [62,63].
Besides the use of different equipment, comparisonbetween studies is also hampered by the different meth-ods that investigators use to calculate the tracer binding.In some studies the striatum was encircled manually andothers used predefined templates. The striatum wasjudged visually (compatible or not compatible with PD)or fully automated quantitatively by others. Finally, andpossibly the greatest confounding variable: in some stud-ies the SPECT results are judged by investigators unawareof the clinical records, but in more than half of the studiesblinding of the investigator is not mentioned.
Another methodological shortcoming in our meta-analy-sis is the great variability in clinical criteria used to classifypatients; many authors do not even mention these. Amajor issue here is that most studies use clearly-definedlater-stage patients that are obviously not representative
Diagnostic differentiation of patients with PD versus VPFigure 3Diagnostic differentiation of patients with PD versus VP. Pre-synaptic tracer. [28, 36, 38, 47, 49]. * = follow-up trial.
Odds ratio.000107 1 9357.63
PD versus VPPresynaptic tracer(n PD, n VP)
sensitivity specificityOdds ratio(95% CI)
45.0Booij (n= 8, 4) * 88% 100%
132.0Lokkegaard (n= 45, 4) * 98% 75%
61.4Vlaar (n= 112, 14) * 80% 100%
108.0Gerschlager (n= 20, 13) 90% 92%
472.8Eerola (n= 92, 15) 1005 73%
105.17 (31.81, 347.68)Overall (95% CI)
Odds ratio.0001 1 9000
PD versus VPPresynaptic tracer(n PD, n VP)
sensitivity specificityOdds ratio(95% CI)
45Booij (n= 8, 4) * 88% 100%
132Lokkegaard (n= 45, 4) * 98% 75%
61Vlaar (n= 112, 14) * 80% 100%
108Gerschlager (n= 20, 13) 90% 92%
473Eerola (n= 92, 15) 1005 73%
105 (32, 348)Overall (95% CI)
Odds ratio.000107 1 9357.63
PD versus VPPresynaptic tracer(n PD, n VP)
sensitivity specificityOdds ratio(95% CI)
45.0Booij (n= 8, 4) * 88% 100%
132.0Lokkegaard (n= 45, 4) * 98% 75%
61.4Vlaar (n= 112, 14) * 80% 100%
108.0Gerschlager (n= 20, 13) 90% 92%
472.8Eerola (n= 92, 15) 1005 73%
105.17 (31.81, 347.68)Overall (95% CI)
Odds Ratio
Heterogeneity (I-squared) = 0.00
.0001 1 9000
PD versus VPPresynaptic tracer(n PD, n VP)
sensitivity specificityOdds ratio(95% CI)
45Booij (n= 8, 4) * 88% 100%
132Lokkegaard (n= 45, 4) * 98% 75%
61Vlaar (n= 112, 14) * 80% 100%
108Gerschlager (n= 20, 13) 90% 92%
473Eerola (n= 92, 15) 100% 73%
105 (32, 348)Overall (95% CI)
Odds ratio.000107 1 9357.63
PD versus VPPresynaptic tracer(n PD, n VP)
sensitivity specificityOdds ratio(95% CI)
45.0Booij (n= 8, 4) * 88% 100%
132.0Lokkegaard (n= 45, 4) * 98% 75%
61.4Vlaar (n= 112, 14) * 80% 100%
108.0Gerschlager (n= 20, 13) 90% 92%
472.8Eerola (n= 92, 15) 1005 73%
105.17 (31.81, 347.68)Overall (95% CI)
Odds ratio.0001 1 9000
PD versus VPPresynaptic tracer(n PD, n VP)
sensitivity specificityOdds ratio(95% CI)
45Booij (n= 8, 4) * 88% 100%
132Lokkegaard (n= 45, 4) * 98% 75%
61Vlaar (n= 112, 14) * 80% 100%
108Gerschlager (n= 20, 13) 90% 92%
473Eerola (n= 92, 15) 1005
Odds ratio.000107 1 9357.63
PD versus VPPresynaptic tracer(n PD, n VP)
sensitivity specificityOdds ratio(95% CI)
45.0Booij (n= 8, 4) * 88% 100%
132.0Lokkegaard (n= 45, 4) * 98% 75%
61.4Vlaar (n= 112, 14) * 80% 100%
108.0Gerschlager (n= 20, 13) 90% 92%
472.8Eerola (n= 92, 15) 1005 73%
105.17 (31.81, 347.68)Overall (95% CI)
Odds ratio.0001 1 9000
PD versus VPPresynaptic tracer(n PD, n VP)
sensitivity specificityOdds ratio(95% CI)
45Booij (n= 8, 4) * 88% 100%
132Lokkegaard (n= 45, 4) * 98% 75%
61Vlaar (n= 112, 14) * 80% 100%
108Gerschlager (n= 20, 13) 90% 92%
473Eerola (n= 92, 15) 1005 73%
105 (32, 348)Overall (95% CI)
Odds ratio.000107 1 9357.63
PD versus VPPresynaptic tracer(n PD, n VP)
sensitivity specificityOdds ratio(95% CI)
45.0Booij (n= 8, 4) * 88% 100%
132.0Lokkegaard (n= 45, 4) * 98% 75%
61.4Vlaar (n= 112, 14) * 80% 100%
108.0Gerschlager (n= 20, 13) 90% 92%
472.8Eerola (n= 92, 15) 1005 73%
105.17 (31.81, 347.68)Overall (95% CI)
Odds ratio.0001 1 9000
PD versus VPPresynaptic tracer(n PD, n VP)
73%
105 (32, 348)Overall (95% CI)
Odds ratio.000107 1 9357.63
PD versus VPPresynaptic tracer(n PD, n VP)
sensitivity specificityOdds ratio(95% CI)
45.0Booij (n= 8, 4) * 88% 100%
132.0Lokkegaard (n= 45, 4) * 98% 75%
61.4Vlaar (n= 112, 14) * 80% 100%
108.0Gerschlager (n= 20, 13) 90% 92%
472.8Eerola (n= 92, 15) 1005 73%
105.17 (31.81, 347.68)Overall (95% CI)
Odds ratio.0001 1 9000
PD versus VPPresynaptic tracer(n PD, n VP)
sensitivity specificityOdds ratio(95% CI)
45Booij (n= 8, 4) * 88% 100%
132Lokkegaard (n= 45, 4) * 98% 75%
61Vlaar (n= 112, 14) * 80% 100%
108Gerschlager (n= 20, 13) 90% 92%
473Eerola (n= 92, 15) 1005 73%
105 (32, 348)Overall (95% CI)
Odds ratio.000107 1 9357.63
PD versus VPPresynaptic tracer(n PD, n VP)
sensitivity specificityOdds ratio(95% CI)
45.0Booij (n= 8, 4) * 88% 100%
132.0Lokkegaard (n= 45, 4) * 98% 75%
61.4Vlaar (n= 112, 14) * 80% 100%
108.0Gerschlager (n= 20, 13) 90% 92%
472.8Eerola (n= 92, 15) 1005 73%
105.17 (31.81, 347.68)Overall (95% CI)
Odds Ratio
Heterogeneity (I-squared) = 0.00
.0001 1 9000
sensitivity specificityOdds ratio(95% CI)
45Booij (n= 8, 4) * 88% 100%
132Lokkegaard (n= 45, 4) * 98% 75%
61Vlaar (n= 112, 14) * 80% 100%
108Gerschlager (n= 20, 13) 90% 92%
473Eerola (n= 92, 15) 1005 73%
105 (32, 348)Overall (95% CI)
Odds ratio.000107 1 9357.63
PD versus VPPresynaptic tracer(n PD, n VP)
sensitivity specificityOdds ratio(95% CI)
45.0Booij (n= 8, 4) * 88% 100%
132.0Lokkegaard (n= 45, 4) * 98% 75%
61.4Vlaar (n= 112, 14) * 80% 100%
108.0Gerschlager (n= 20, 13) 90% 92%
472.8Eerola (n= 92, 15) 1005 73%
105.17 (31.81, 347.68)Overall (95% CI)
Odds Ratio
Heterogeneity (I-squared) = 0.00
.0001 1 9000
PD versus VPPresynaptic tracer(n PD, n VP)
sensitivity specificityOdds ratio(95% CI)
45Booij (n= 8, 4) * 88% 100%
132Lokkegaard (n= 45, 4) * 98% 75%
61Vlaar (n= 112, 14) * 80% 100%
108Gerschlager (n= 20, 13) 90% 92%
473Eerola (n= 92, 15) 100% 73%
105 (32, 348)Overall (95% CI)
Page 7 of 13(page number not for citation purposes)

BMC Neurology 2007, 7:27 http://www.biomedcentral.com/1471-2377/7/27
for the diagnostic problem that one wants to solve with aSPECT. We thus limited our analysis to those studies thataddressed the diagnostic accuracy in clinically relevant sit-uations: early PD, follow-up studies and studies withknown parkinsonian diseases. All the measures men-tioned above were taken to minimise heterogeneity,which was actually shown to be minimal as calculated bythe I2 statistic [27]. Despite this, interpreting of the resultsshould be done with caution, as postsynaptic tracer bind-ing in APS can be normal in an early stage of disease witha decrease later on [64]. Finally, strict age-matching is notdone in all studies, but is mandatory as tracer binding ingeneral decreases with age [65-67].
These methodological problems do, however, allow oneimportant conclusion to start with: as we derived only 32papers suitable from a starting number of 185, there is apaucity of methodologically sound and clinically relevantpapers on this subject. Below we would like to discuss ourresults according to the predefined clinically relevant situ-ations.
Diagnosis of PD in an early phase vs. normalcyOur meta-analysis confirms the general opinion thatSPECT is relatively accurate to differentiate between
patients with PD in an early stage and healthy controls.The difference in sensitivity between trials can not beexplained solely by different radiotracer usage. Especiallythe difference with the two studies using TRODAT is obvi-ous [41,43]. An explanation may be that the use of a tem-plate vs. hand-circling of the striatum leads to lowerdiagnostic specificities [40,42,43]. Other possible expla-nations for the lower sensitivity scores in the study of vanLaere et al are their consecutive inclusion of patients andtheir clinic being a tertiary referral centre [43].
Schwarz and Asenbaum were the only two authors whoused two standard deviations below the normal controlsas cut-off [33,42]. In the other four studies we recalculatedthe absolute numbers of true positive, false negative etc.by ourselves, [40,41,43,44] which led in all 4 studies tolower numbers for diagnostic accuracy. Apart from thisdifferent cut-off point, higher sensitivity figures in severallarge trials (normal SPECT scans in 5–10% of clinicallydefinitive PD patients) are probably explained by the dis-ease stage of the patients [68-70].
Asenbaum's, Haapaniemi's and Muller's were the onlystudies which mentioned blinding of the investigators[33,40,44]. It is perhaps not surprising that these authors
Diagnostic differentiation between PD and APS (MSA & PSP)Figure 4Diagnostic differentiation between PD and APS (MSA & PSP). Presynaptic radiotracer. [28, 30, 36, 38, 39, 46-48, 50-52]. * fol-low-up trial. # The pooled odds ratio after excluding the study of Messa '98 (sensitivity 100%, specificity 0%) remains unchanged.
Odds ratio
.001593 1 627.802
PD versus APS
presynaptic radiotracer
(n PD, n APS )
sensitivity specificity
Odds ratio
(95% CI )
3.5Booij (n= 8, 3) * 88% 33%
1.6Benamer (n= 130, 28) 98% 4%
4.0Plotkin (n= 25,21) 96% 14%
24.1Eerola (n= 92,12) 100% 8%
0.3Stoffers (n= 62, 8)* 48% 25%
6.8Lokkegaard (n= 45, 15) * 98% 13%
4.4Kim (n=18,13) 100% 8%
10.9Lu (n= 36,49) 100% 12%
6.2Messa (n= 13, 5) 100% 0%
1.1Pirker (n= 36, 10) 72% 30%
1.3Vlaar (n=110, 17)* 80% 24%
1.92 (0.95,3.88)Overall (95% CI )
Odds ratio
.002 1 600
PD versus APS
presynaptic radiotracer
(n PD, n APS )
sensitivity specificity
Odds ratio
(95% CI )
4Booij (n= 8, 3) * 88% 33%
2Benamer (n= 130, 28) 98% 4%
4Plotkin (n= 25,21) 96% 14%
24Eerola (n= 92,12) 100% 8%
0.3Stoffers (n= 62, 8)* 48% 25%
7Lokkegaard (n= 45, 15) * 98% 13%
4Kim (n=18,13) 100% 8%
11Lu (n= 36,49) 100% 12%
6Messa (n= 13, 5) 100% 0%
1Pirker (n= 36, 10) 72% 30%
1Vlaar (n=110, 17)* 80% 24%
2 ( 1 - 4)Overall (95% CI )
Odds ratio
.001593 1 627.802
PD versus APS
presynaptic radiotracer
(n PD, n APS )
sensitivity specificity
Odds ratio
(95% CI )
3.5Booij (n= 8, 3) * 88% 33%
1.6Benamer (n= 130, 28) 98% 4%
4.0Plotkin (n= 25,21) 96% 14%
24.1Eerola (n= 92,12) 100% 8%
0.3Stoffers (n= 62, 8)* 48% 25%
6.8Lokkegaard (n= 45, 15) * 98% 13%
4.4Kim (n=18,13) 100% 8%
10.9Lu (n= 36,49) 100% 12%
6.2Messa (n= 13, 5) 100% 0%
1.1Pirker (n= 36, 10) 72% 30%
1.3Vlaar (n=110, 17)* 80% 24%
1.92 (0.95,3.88)Overall (95% CI )
Odds ratio
.002 1 600
PD versus APS
presynaptic radiotracer
(n PD, n APS )
sensitivity specificity
Odds ratio
(95% CI )
4
Odds ratio
.001593 1 627.802
PD versus APS
presynaptic radiotracer
(n PD, n APS )
sensitivity specificity
Odds ratio
(95% CI )
3.5Booij (n= 8, 3) * 88% 33%
1.6Benamer (n= 130, 28) 98% 4%
4.0Plotkin (n= 25,21) 96% 14%
24.1Eerola (n= 92,12) 100% 8%
0.3Stoffers (n= 62, 8)* 48% 25%
6.8Lokkegaard (n= 45, 15) * 98% 13%
4.4Kim (n=18,13) 100% 8%
10.9Lu (n= 36,49) 100% 12%
6.2Messa (n= 13, 5) 100% 0%
1.1Pirker (n= 36, 10) 72% 30%
1.3Vlaar (n=110, 17)* 80% 24%
1.92 (0.95,3.88)Overall (95% CI )
Odds Ratio
Heterogeneity (I-squeared) = 0.00
.002 1 600
PD versus APS
presynaptic radiotracer
(n PD, n APS )
sensitivity specificity
Odds ratio
(95% CI )
4Booij (n= 8, 3) * 88% 33%
2Benamer (n= 130, 28) 98% 4%
4Plotkin (n= 25,21) 96% 14%
24Eerola (n= 92,12) 100% 8%
0.3Stoffers (n= 62, 8)* 48% 25%
7Lokkegaard (n= 45, 15) * 98% 13%
4Kim (n=18,13) 100% 8%
11Lu (n= 36,49) 100% 12%
6Messa (n= 13, 5) 100% 0%
1Pirker (n= 36, 10) 72% 30%
1Vlaar (n=112, 17)* 80% 24%
2 ( 1 - 4) #Overall (95% CI )
Odds ratio
.001593 1 627.802
PD versus APS
presynaptic radiotracer
(n PD, n APS )
sensitivity specificity
Odds ratio
(95% CI )
3.5Booij (n= 8, 3) * 88% 33%
1.6Benamer (n= 130, 28) 98% 4%
4.0Plotkin (n= 25,21) 96% 14%
24.1Eerola (n= 92,12) 100% 8%
0.3Stoffers (n= 62, 8)* 48% 25%
6.8Lokkegaard (n= 45, 15) * 98% 13%
4.4Kim (n=18,13) 100% 8%
10.9Lu (n= 36,49) 100% 12%
6.2Messa (n= 13, 5) 100% 0%
1.1Pirker (n= 36, 10) 72% 30%
1.3Vlaar (n=110, 17)* 80% 24%
1.92 (0.95,3.88)Overall (95% CI )
Odds ratio
.002 1 600
PD versus APS
presynaptic radiotracer
(n PD, n APS )
sensitivity specificity
Odds ratio
(95% CI )
4Booij (n= 8, 3) * 88% 33%
2Benamer (n= 130, 28) 98% 4%
4Plotkin (n= 25,21) 96% 14%
24Eerola (n= 92,12) 100% 8%
0.3Stoffers (n= 62, 8)* 48% 25%
7Lokkegaard (n= 45, 15) * 98% 13%
4Kim (n=18,13) 100% 8%
11Lu (n= 36,49) 100% 12%
6Messa (n= 13, 5) 100% 0%
1Pirker (n= 36, 10) 72% 30%
1Vlaar (n=110, 17)* 80% 24%
2 ( 1 - 4)Overall (95% CI )
Odds ratio
.001593 1 627.802
PD versus APS
presynaptic radiotracer
(n PD, n APS )
sensitivity specificity
Odds ratio
(95% CI )
3.5Booij (n= 8, 3) * 88% 33%
Odds ratio
(95% CI )
4Booij (n= 8, 3) * 88% 33%
2Benamer (n= 130, 28) 98% 4%
4Plotkin (n= 25,21) 96% 14%
24Eerola (n= 92,12) 100% 8%
0.3Stoffers (n= 62, 8)* 48% 25%
7Lokkegaard (n= 45, 15) * 98% 13%
4Kim (n=18,13) 100% 8%
11Lu (n= 36,49) 100% 12%
6Messa (n= 13, 5) 100% 0%
1Pirker (n= 36, 10) 72% 30%
1Vlaar (n=110, 17)* 80% 24%
2 ( 1 - 4)Overall (95% CI )
Odds ratio
.001593 1 627.802
PD versus APS
presynaptic radiotracer
(n PD, n APS )
sensitivity specificity
Odds ratio
(95% CI )
3.5Booij (n= 8, 3) * 88% 33%
1.6Benamer (n= 130, 28) 98% 4%
4.0Plotkin (n= 25,21) 96% 14%
24.1Eerola (n= 92,12) 100% 8%
0.3Stoffers (n= 62, 8)* 48% 25%
6.8Lokkegaard (n= 45, 15) * 98% 13%
4.4Kim (n=18,13) 100% 8%
10.9Lu (n= 36,49) 100% 12%
6.2Messa (n= 13, 5) 100% 0%
1.1Pirker (n= 36, 10) 72% 30%
1.3Vlaar (n=110, 17)* 80% 24%
1.92 (0.95,3.88)Overall (95% CI )
Odds ratio
.002 1 600
PD versus APS
presynaptic radiotracer
(n PD, n APS )
sensitivity specificity
Odds ratio
(95% CI )
4
Odds ratio
.001593 1 627.802
PD versus APS
presynaptic radiotracer
(n PD, n APS )
sensitivity specificity
Odds ratio
(95% CI )
3.5Booij (n= 8, 3) * 88% 33%
1.6Benamer (n= 130, 28) 98% 4%
4.0Plotkin (n= 25,21) 96% 14%
24.1Eerola (n= 92,12) 100% 8%
0.3Stoffers (n= 62, 8)* 48% 25%
6.8Lokkegaard (n= 45, 15) * 98% 13%
4.4Kim (n=18,13) 100% 8%
10.9Lu (n= 36,49) 100% 12%
6.2Messa (n= 13, 5) 100% 0%
1.1Pirker (n= 36, 10) 72% 30%
1.3Vlaar (n=110, 17)* 80% 24%
1.92 (0.95,3.88)Overall (95% CI )
Odds Ratio
Heterogeneity (I-squeared) = 0.00
.002 1 600
PD versus APS
presynaptic radiotracer
(n PD, n APS )
sensitivity specificity
Odds ratio
(95% CI )
4Booij (n= 8, 3) * 88% 33%
2Benamer (n= 130, 28) 98% 4%
4Plotkin (n= 25,21) 96% 14%
24Eerola (n= 92,12) 100% 8%
0.3Stoffers (n= 62, 8)* 48% 25%
7Lokkegaard (n= 45, 15) * 98% 13%
4Kim (n=18,13) 100% 8%
11Lu (n= 36,49) 100% 12%
6Messa (n= 13, 5) 100% 0%
1Pirker (n= 36, 10) 72% 30%
1Vlaar (n=112, 17)* 80% 24%
2 ( 1 - 4) #Overall (95% CI )
Page 8 of 13(page number not for citation purposes)

BMC Neurology 2007, 7:27 http://www.biomedcentral.com/1471-2377/7/27
found lower numbers for diagnostic accuracy than Huangand Schwarz (See fig. 1) [41,42].
Diagnosis of PD versus ETThe results of our meta-analysis confirm the general opin-ion that SPECT with presynaptic tracers is highly accurateto differentiate between patients with PD and ET. Lee et al.scored lowest specificity. A possible explanation is thatthey included not only patients with ET but as wellpatients with isolated postural tremor and postural incombination with resting tremor [45].
Diagnostic differentiation between patients with PD versus VPAccording to the results of the meta-analysis we concludethat presynaptic SPECT scans can accurately differentiatebetween patients with PD and VP. The specificity, how-ever, is only moderate in the studies of Lokkegaard andEerola [38,47]. VP is a somewhat controversial clinicalconcept and the differences found in the studies we ana-lysed probably reflect the variability in clinical definition.
Whereas Lokkegaard et al., Gerschlager et al., and Eerolaet al. [38,49] used strict inclusion criteria, Booij et al. didnot [36,47]. This point is illustrated in the paper by Lober-boym et al, who investigated 20 patients with VP with FP-CIT SPECT. Nine had a normal presynaptic SPECT scanbut 11 had decreased striatal tracer binding. All ninepatients with normal presynaptic SPECT scan had no reac-tion on levodopa treatment, however 5 of the 11 withdecreased striatal FP-CIT binding did have [71]. AlthoughSPECT with presynaptic tracers scored high accuracy indifferentiation between PD and VP, conventional tech-niques like CT and MRI may still be necessary as addi-tional diagnostic tools.
Diagnostic differentiation between patients with PD versus APSThis meta-analysis confirmed the generally accepted viewthat presynaptic tracers cannot distinguish between PDand APS. However, we also found that postsynapticSPECT is not very good at this. A negative postsynapticSPECT scan does not exclude APS. The positive predictivevalue of abnormal postsynaptic SPECT for the diagnosisof APS is high, making a reduced postsynaptic radiotracerbinding likely to exclude a diagnosis of PD. However,patients with PD in our meta-analysis do show loss ofdopamine-receptor binding. Studies which used IBZMscored higher accuracy than studies with IBF or Epide-pride [50,53,56,59]. If the trials are excluded which usedother tracers than IBZM the mean 95%CI odds ratio onlyincreased to 21 (11–44).
Diagnostic differentiation of patients with PD vs. APS (MSA & PSP)Figure 6Diagnostic differentiation of patients with PD vs. APS (MSA & PSP). Doctors Prediction [28, 34, 38, 39]. * follow-up trial. # The pooled odds ratio (95%CI) after excluding the studies with a sensitivity of 100% and a specificity of 0% (Stoffers '05 and Schwarz '98) did not change significantly: 6 (1–40). Both trials diagnosed at the beginning of the follow-up all patients as having PD.
Odds ratio.001364 1 733.212
PD versus APS Doctors prediction(n= PD, n= APS)
sensitivity specificityOdds ratio(95% CI)
2.7Vlaar (n= 115, 32) * 76% 47%
17.9Lokkegaard (n= 45, 15)* 87% 73%
19.7Stoffers (n= 62, 8) * 100% 0%
27.0Schwarz ’98 (n= 58, 7) * 100% 0%
8.64 (2.21, 33.76)Overall (95% CI)
Odds ratio.001 1 700
PD versus APS Doctors prediction(n= PD, n= APS)
sensitivity specificityOdds ratio(95% CI)
3Vlaar (n= 115, 32) * 76% 47%
18Lokkegaard (n= 45, 15)* 87% 73%
20Stoffers (n= 62, 8) * 100% 0%
27Schwarz ’98 (n= 58, 7) * 100% 0%
9 (2 , 34) #Overall (95% CI)
Diagnostic differentiation of patient with PD vs. APS (MSA & PSP)Figure 5Diagnostic differentiation of patient with PD vs. APS (MSA & PSP). Postsynaptic radiotracers [18, 28, 34, 35, 37, 46, 50, 53-59]. * follow-up trial. # The pooled odds ratio (95%CI) after excluding the study of Pirker '97 (sensitivity 100%, specificity 0%) did not change significantly: 19 (10–33). Schwarz 1993. this trial can be seen as follow-up trial (long-term l-dopa is golden standard) but also as a cross-sectional trial. In the last case the results will be different (sensitivity = 79%, specificity = 100%). Schwarz 1997: We took signs (in) compatible with PD as golden standard. If taken long-term l-dopa as golden standard sensitivity is 100% and specificity is 67%. Schwarz 1998: We took signs (in) compatible with PD taken as golden standard, if taken long-term-l-dopa as golden standard sensi-tivity is 100% and specificity is 50%.
Odds ratio
.000299 1 3347.09
PD versus APSPostsynaptictracer(n PD, n APS)
Sensitivity specificity
Oddsratio
(95% CI)
33.8Schwarz’93 (n= 47,15) * 96% 60%
60.0Schwarz’97 (n= 31, 24) * 79%
26.5Schwarz’98 (n= 58, 7)* 91% 71%
35.0Buck (n= 17, 6) 100% 50%
23.9Kim (n= 18, 13) 100% 38%
51.5Oertel (n= 61, 6) 100% 100%
8.3Oyanagu(n= 7, 6 ) 100% 33%
2.5Pirker (n= 9, 10) 100% 0 %
38.8Plotkin (n= 25, 21) 100% 43%
39.0Schwarz‘94 (n= 19, 2) 100% 50 %
15.6)Seppi (n= 17, 15) 80% 71%
168.6Tatsch(n= 18, 24) 100% 83%
79.8Schelovsky (n= 30, 14) 100% 57%
6.5Vlaar (n= 81, 26) * 80% 62%
18.92 (9.83,36.42)Overall (95% CI)
Odds ratio
.0003 1 3000
PD versus APSPostsynaptictracer(n PD, n APS)
Sensitivity specificity
Oddsratio
(95% CI)
34Schwarz’93 (n= 47,15) * 96%
60Schwarz’97 (n= 31, 24) * 79%
27Schwarz’98 (n= 58, 7)* 91% 71%
35Buck (n= 17, 6) 100% 50%
24Kim (n= 18, 13) 100% 38%
52Oertel (n= 61, 6) 100%
8Oyanagu(n= 7, 6 ) 100% 33%
3Pirker (n= 9, 10) 100% 0 %
39Plotkin (n= 25, 21) 100% 43%
39Schwarz‘94 (n= 19, 2) 100% 50 %
16Seppi (n= 17, 15) 80% 71%
169Tatsch(n= 18, 24) 100% 83%
80Schelovsky (n= 30, 14) 100% 57%
7Vlaar (n= 81, 26) * 80% 62%
19 (10 , 36)Overall (95% CI)
Odds ratio
.000299 1 3347.09
PD versus APSPostsynaptictracer(n PD, n APS)
Sensitivity specificity
Oddsratio
(95% CI)
33.8Schwarz’93 (n= 47,15) * 96%
60.0Schwarz’97 (n= 31, 24) * 79%
26.5Schwarz’98 (n= 58, 7)* 91% 71%
35.0Buck (n= 17, 6) 100% 50%
23.9Kim (n= 18, 13) 100% 38%
51.5Oertel (n= 61, 6) 100%
8.3Oyanagu(n= 7, 6 ) 100% 33%
2.5Pirker (n= 9, 10) 100% 0 %
38.8Plotkin (n= 25, 21) 100% 43%
39.0Schwarz‘94 (n= 19, 2) 100% 50 %
15.6)Seppi (n= 17, 15) 80% 71%
168.6Tatsch(n= 18, 24) 100% 83%
79.8Schelovsky (n= 30, 14) 100% 57%
6.5Vlaar (n= 81, 26) * 80% 62%
18.92 (9.83,36.42)Overall (95% CI)
Odds ratio
.0003 1 3000
PD versus APSPostsynaptictracer(n PD, n APS)
Sensitivity specificity
Oddsratio
(95% CI)
34Schwarz’93 (n= 47,15) * 96%
60Schwarz’97 (n= 31, 24) * 79%
27Schwarz’98 (n= 58, 7)* 91% 71%
35Buck (n= 17, 6) 100% 50%
24Kim (n= 18, 13) 100% 38%
52Oertel (n= 61, 6) 100%
8Oyanagu(n= 7, 6 ) 100% 33%
3Pirker (n= 9, 10) 100% 0 %
39Plotkin (n= 25, 21) 100% 43%
39Schwarz‘94 (n= 19, 2) 100% 50 %
16Seppi (n= 17, 15) 80% 71%
169Tatsch(n= 18, 24) 100% 83%
80Schelovsky (n= 30, 14) 100% 57%
7Vlaar (n= 81, 26) * 80% 62%
19 (10 , 36)Overall (95% CI)
OddsRatio
.0003 1 3000
PD versus APSPostsynaptictracer(n PD, n APS)
Sensitivity specificity
Oddsratio
(95% CI)
34Schwarz’93 (n= 47,15) * 96%
60Schwarz’97 (n= 34, 9) * 79% 89%
27Schwarz’98 (n= 58, 7)* 91% 71%
35Buck (n= 17, 6) 100% 50%
24Kim (n= 18, 13) 100% 38%
52Oertel (n= 61, 6) 80%
8Oyanagu (n= 7, 6 ) 100% 33%
3Pirker (n= 9, 10) 100% 0 %
39Plotkin (n= 25, 21) 100% 43%
39Schwarz‘94 (n= 19, 2) 100% 50 %
16Seppi (n= 17, 15) 80% 71%
169Tatsch(n= 18, 24) 100% 83%
80Schelovsky (n= 30, 14) 100% 57%
7Vlaar (n= 81, 26) * 80% 62%
19 (10 , 36) #Overall (95% CI)
Odds ratio
.000299 1 3347.09
PD versus APSPostsynaptictracer(n PD, n APS)
Sensitivity specificity
Oddsratio
(95% CI)
33.8Schwarz’93 (n= 47,15) * 96% 60%
60.0Schwarz’97 (n= 31, 24) * 79%
26.5Schwarz’98 (n= 58, 7)* 91% 71%
35.0Buck (n= 17, 6) 100% 50%
23.9Kim (n= 18, 13) 100% 38%
51.5Oertel (n= 61, 6) 100% 100%
8.3Oyanagu(n= 7, 6 ) 100% 33%
2.5Pirker (n= 9, 10) 100% 0 %
38.8Plotkin (n= 25, 21) 100% 43%
39.0Schwarz‘94 (n= 19, 2) 100% 50 %
15.6)Seppi (n= 17, 15) 80% 71%
168.6Tatsch(n= 18, 24) 100% 83%
79.8Schelovsky (n= 30, 14) 100% 57%
6.5Vlaar (n= 81, 26) * 80% 62%
18.92 (9.83,36.42)Overall (95% CI)
Odds ratio
.0003 1 3000
PD versus APSPostsynaptictracer(n PD, n APS)
Sensitivity specificity
Oddsratio
(95% CI)
34Schwarz’93 (n= 47,15) * 96%
60Schwarz’97 (n= 31, 24) * 79%
27Schwarz’98 (n= 58, 7)* 91% 71%
35Buck (n= 17, 6) 100% 50%
24Kim (n= 18, 13) 100% 38%
52Oertel (n= 61, 6) 100%
8Oyanagu(n= 7, 6 ) 100% 33%
3Pirker (n= 9, 10) 100% 0 %
39Plotkin (n= 25, 21) 100% 43%
39Schwarz‘94 (n= 19, 2) 100% 50 %
16Seppi (n= 17, 15) 80% 71%
169Tatsch(n= 18, 24) 100% 83%
80Schelovsky (n= 30, 14) 100% 57%
7Vlaar (n= 81, 26) * 80% 62%
19 (10 , 36)Overall (95% CI)
Odds ratio
.000299 1 3347.09
PD versus APSPostsynaptictracer(n PD, n APS)
Sensitivity specificity
Oddsratio
(95% CI)
33.8Schwarz’93 (n= 47,15) * 96%
60.0Schwarz’97 (n= 31, 24) * 79%
26.5Schwarz’98 (n= 58, 7)* 91% 71%
35.0Buck (n= 17, 6) 100% 50%
23.9Kim (n= 18, 13) 100% 38%
51.5Oertel (n= 61, 6) 100%
8.3Oyanagu(n= 7, 6 ) 100% 33%
2.5Pirker (n= 9, 10) 100% 0 %
38.8Plotkin (n= 25, 21) 100% 43%
39.0Schwarz‘94 (n= 19, 2) 100% 50 %
15.6)Seppi (n= 17, 15) 80% 71%
168.6Tatsch(n= 18, 24) 100% 83%
79.8Schelovsky (n= 30, 14) 100% 57%
6.5Vlaar (n= 81, 26) * 80% 62%
18.92 (9.83,36.42)Overall (95% CI)
Odds ratio
.0003 1 3000
PD versus APSPostsynaptictracer(n PD, n APS)
Sensitivity specificity
Oddsratio
(95% CI)
34Schwarz’93 (n= 47,15) * 96%
60Schwarz’97 (n= 31, 24) * 79%
27Schwarz’98 (n= 58, 7)* 91% 71%
35Buck (n= 17, 6) 100% 50%
24Kim (n= 18, 13) 100% 38%
52Oertel (n= 61, 6) 100%
8Oyanagu(n= 7, 6 ) 100% 33%
3Pirker (n= 9, 10) 100% 0 %
39Plotkin (n= 25, 21) 100% 43%
39Schwarz‘94 (n= 19, 2) 100% 50 %
16Seppi (n= 17, 15) 80% 71%
169Tatsch(n= 18, 24) 100% 83%
80Schelovsky (n= 30, 14) 100% 57%
7Vlaar (n= 81, 26) * 80%
Odds ratio
.0003 1 3000
PD versus APSPostsynaptictracer(n PD, n APS)
Sensitivity specificity
Oddsratio
(95% CI)
34Schwarz’93 (n= 47,15) * 96%
60Schwarz’97 (n= 31, 24) * 79%
27Schwarz’98 (n= 58, 7)* 91% 71%
35Buck (n= 17, 6) 100% 50%
24Kim (n= 18, 13) 100% 38%
52Oertel (n= 61, 6) 100%
8Oyanagu(n= 7, 6 ) 100% 33%
3Pirker (n= 9, 10) 100% 0 %
39Plotkin (n= 25, 21) 100% 43%
39Schwarz‘94 (n= 19, 2) 100% 50 %
16Seppi (n= 17, 15) 80% 71%
169Tatsch(n= 18, 24) 100% 83%
80Schelovsky (n= 30, 14) 100% 57%
7Vlaar (n= 81, 26) * 80% 62%
19 (10 , 36)Overall (95% CI)
OddsRatio
.0003 1 3000
PD versus APSPostsynaptictracer(n PD, n APS)
Sensitivity specificity
Oddsratio
(95% CI)
34Schwarz’93 (n= 47,15) * 96%
60Schwarz’97 (n= 34, 9) * 79% 89%
27Schwarz’98 (n= 58, 7)* 91% 71%
35Buck (n= 17, 6) 100% 50%
24Kim (n= 18, 13) 100% 38%
52Oertel (n= 61, 6) 80%
8Oyanagu (n= 7, 6 ) 100% 33%
3Pirker (n= 9, 10) 100% 0 %
39Plotkin (n= 25, 21) 100% 43%
39Schwarz‘94 (n= 19, 2) 100% 50 %
16Seppi (n= 17, 15) 80% 71%
169Tatsch(n= 18, 24) 100% 83%
80Schelovsky (n= 30, 14) 100% 57%
62%
19 (10 , 36)Overall (95% CI)
OddsRatio
.0003 1 3000
PD versus APSPostsynaptictracer(n PD, n APS)
Sensitivity specificity
Oddsratio
(95% CI)
34Schwarz’93 (n= 47,15) * 96%
60Schwarz’97 (n= 34, 9) * 79% 89%
27Schwarz’98 (n= 58, 7)* 91% 71%
35Buck (n= 17, 6) 100% 50%
24Kim (n= 18, 13) 100% 38%
52Oertel (n= 61, 6) 80%
8Oyanagu (n= 7, 6 ) 100% 33%
3Pirker (n= 9, 10) 100% 0 %
39Plotkin (n= 25, 21) 100% 43%
39Schwarz‘94 (n= 19, 2) 100% 50 %
16Seppi (n= 17, 15) 80% 71%
169Tatsch(n= 18, 24) 100% 83%
80Schelovsky (n= 30, 14) 100% 57%
7Vlaar (n= 81, 26) * 80% 62%
19 (10 , 36) #Overall (95% CI)
Page 9 of 13(page number not for citation purposes)

BMC Neurology 2007, 7:27 http://www.biomedcentral.com/1471-2377/7/27
Some studies, excluded for this meta-analysis, foundexcellent accuracy for the postsynaptic tracer to differenti-ate between PD and APS [19,64,72-77]. Schulz et al, whoinvestigated 32 MSA patients, found similar results as inour meta-analysis: only a significant loss in 63% of thepatients using IBZM-SPECT with two standard deviationsunder controls (PD patients) as cut-off point [78]. Resultsof the studies by Berding et al [79], and Bettin et al [80],are in line with these.
Possible explanations for the difference in results may bedifference in cut-off points (many authors use only oneSD below healthy controls), and the use of special tech-niques claimed by some to enhance diagnostic accuracy,e.g. asymmetric indices, caudate/putamen atio, presynap-tic/postsynaptic ratio of tracer binding, speed of decline infollow-up [30,36,76,81,82]. One other explanation of thelow discriminating value of postsynaptic SPECT imagingis the reversible down regulation of dopamine receptorsby dopaminergic drugs [83]. If the drugs are not stoppedappropriately, the scan result can be false positive. In ourmeta-analysis we found 9 studies where potentially inter-fering medication was not discontinued appropriately orthese did even not mention whether this medication wasdiscontinued (and if, for how long) before the scan.
ConclusionThere is a paucity of methodologically sound and clini-cally relevant papers on the diagnostic accuracy of SPECTin parkinsonian syndromes. Our meta-analysis confirmsthe general opinion that SPECT is relatively accurate todifferentiate between patients with PD in an early stageand healthy controls. We were also able to confirm thegeneral opinion that SPECT with presynaptic tracers ishighly accurate to differentiate between patients with PDand ET. Although SPECT with presynaptic tracers scoredhigh accuracy in differentiation between PD and VP, con-ventional techniques like CT and MRI may still be neces-sary as additional diagnostic tools. This meta-analysisconfirmed the generally accepted view that presynaptictracers cannot distinguish between PD and APS. However,we also found that SPECT with postsynaptic tracers is notvery good at this.
AbbreviationsBeta-CIT 123I-Iodine-beta-CIT (presynaptic radiotracer)
CI confidence interval
CT computer tomography
DIP drug induced parkinsonism
ET essential tremor
FP-CIT 123I-ioflupane (presynaptic radiotracer)
IBF 123I-idiobenzofuran (postsynaptic radiotracer)
IBZM 123I-iodobenzamide (postsynaptic radiotracer)
PD idiopathic Parkinson disease
MRI magnetic resonance imaging
MSA multiple system atrophy
NPV negative predictive value
OR odds ratio
PET positron emission tomography
PPV positive predictive value
PSP progressive supranuclear palsy
SD standard deviation
SPECT single photon emission computer tomography
TRODAT 99mCT-TRODAT-1 (presynaptic radiotracer)
VP vascular parkinsonism
Competing interestsThe author(s) declare that they have no competing inter-ests.
Authors' contributionsWW and MvK initiated the study. WW, AV and AK wrotethe protocol, AV did the literature search and paperretrieval, AV and WW judged each paper, AV and AK didthe statistical calculations. AV wrote a first draft of thepaper, which was finished in its final form by WW.
All authors have read and approved the manuscript.
Page 10 of 13(page number not for citation purposes)

BMC Neurology 2007, 7:27 http://www.biomedcentral.com/1471-2377/7/27
Additional material
References1. Elbaz A, Bower JH, Maraganore DM, McDonnell SK, Peterson BJ, Ahl-
skog JE, Schaid DJ, Rocca WA: Risk tables for parkinsonism andParkinson's disease. J Clin Epidemiol 2002, 55:25-31.
2. Hughes AJ, Daniel SE, Kilford L, Lees AJ: Accuracy of clinical diag-nosis of idiopathic Parkinson's disease: a clinico-pathologicalstudy of 100 cases. J Neurol Neurosurg Psychiatry 1992, 55:181-184.
3. Koller WC, Montgomery EB: Issues in the early diagnosis of Par-kinson's disease. Neurology 1997, 49:S10-25.
4. Hughes AJ, Daniel SE, Blankson S, Lees AJ: A clinicopathologicstudy of 100 cases of Parkinson's disease. Arch Neurol 1993,50:140-148.
5. Hughes AJ, Daniel SE, Lees AJ: Improved accuracy of clinicaldiagnosis of Lewy body Parkinson's disease. Neurology 2001,57:1497-1499.
6. Rajput AH, Rozdilsky B, Rajput A: Accuracy of clinical diagnosisin parkinsonism--a prospective study. Can J Neurol Sci 1991,18:275-278.
7. Watanabe H, Saito Y, Terao S, Ando T, Kachi T, Mukai E, Aiba I, AbeY, Tamakoshi A, Doyu M, Hirayama M, Sobue G: Progression andprognosis in multiple system atrophy: an analysis of 230 Jap-anese patients. Brain 2002, 125:1070-1083.
8. Litvan I, MacIntyre A, Goetz CG, Wenning GK, Jellinger K, Verny M,Bartko JJ, Jankovic J, McKee A, Brandel JP, Chaudhuri KR, Lai EC,D'Olhaberriague L, Pearce RK, Agid Y: Accuracy of the clinicaldiagnoses of Lewy body disease, Parkinson disease, anddementia with Lewy bodies: a clinicopathologic study. ArchNeurol 1998, 55:969-978.
9. Piccini P, Whone A: Functional brain imaging in the differentialdiagnosis of Parkinson's disease. Lancet Neurol 2004, 3:284-290.
10. Clarke CE: Neuroprotection and pharmacotherapy for motorsymptoms in Parkinson's disease. Lancet Neurol 2004,3:466-474.
11. Dujardin K, Defebvre L, Duhamel A, Lecouffe P, Rogelet P, SteinlingM, Destee A: Cognitive and SPECT characteristics predictprogression of Parkinson's disease in newly diagnosedpatients. J Neurol 2004, 251:1383-1392.
12. Ponsen MM, Stoffers D, Booij J, van Eck-Smit BLF, Wolters EC, Ber-endse HW: Idiopathic hyposmia as a preclinical sign of Parkin-son's disease. Ann Neurol 2004, 56:173-181.
13. Storch A, Hofer A, Kruger R, Schulz JB, Winkler J, Gerlach M: Newdevelopments in diagnosis and treatment of Parkinson's dis-ease--from basic science to clinical applications. J Neurol 2004,251 Suppl 6:VI/33-8.
14. Walter U, Klein C, Hilker R, Benecke R, Pramstaller PP, Dressler D:Brain parenchyma sonography detects preclinical parkinson-ism. Mov Disord 2004, 19:1445-1449.
15. Fernandez HH, Friedman JH, Fischman AJ, Noto RB, Lannon MC: Isaltropane SPECT more sensitive to fluoroDOPA PET fordetecting early Parkinson's disease? Med Sci Monit 2001,7:1339-1343.
16. Huang WS, Chiang YH, Lin JC, Chou YH, Cheng CY, Liu RS: Cross-over study of (99m)Tc-TRODAT-1 SPECT and (18)F-FDOPA PET in Parkinson's disease patients. J Nucl Med 2003,44:999-1005.
17. Ishikawa T, Dhawan V, Kazumata K, Chaly T, Mandel F, Neumeyer J,Margouleff C, Babchyck B, Zanzi I, Eidelberg D: Comparativenigrostriatal dopaminergic imaging with iodine-123-betaCIT-FP/SPECT and fluorine-18-FDOPA/PET. J Nucl Med 1996,37:1760-1765.
18. Schwarz J, Antonini A, Tatsch K, Kirsch CM, Oertel WH, LeendersKL: Comparison of 123I-IBZM SPECT and 11C-raclopridePET findings in patients with parkinsonism. Nucl Med Commun1994, 15:806-813.
19. Booij J, Tissingh G, Winogrodzka A, van Royen EA: Imaging of thedopaminergic neurotransmission system using single-pho-ton emission tomography and positron emission tomogra-phy in patients with parkinsonism. Eur J Nucl Med 1999,26:171-182.
20. Jankovic J, Rajput AH, McDermott MP, Perl DP: The evolution ofdiagnosis in early Parkinson disease. Parkinson Study Group.Arch Neurol 2000, 57:369-372.
21. Walker Z, Costa DC, Walker RW, Shaw K, Gacinovic S, Stevens T,Livingston G, Ince P, McKeith IG, Katona CL: Differentiation ofdementia with Lewy bodies from Alzheimer's disease usinga dopaminergic presynaptic ligand. J Neurol Neurosurg Psychiatry2002, 73:134-140.
22. Deville WL, Bossuyt PM, de Vet HC, Bezemer PD, Bouter LM, Assen-delft WJ: Systematic reviews in practice. X. Searching, select-ing and the methodological assessment of diagnosticevaluation research. Ned Tijdschr Geneeskd 2002, 146:2281-2284.
23. Assendelft WJ, van Tulder MW, Scholten RJ, Bouter LM: [The prac-tice of systematic reviews. II. Searching and selection ofstudies]. Ned Tijdschr Geneeskd 1999, 143:656-661.
24. Deville WL, Buntinx F, Bouter LM, Montori VM, de Vet HC, van derWindt DA, Bezemer PD: Conducting systematic reviews ofdiagnostic studies: didactic guidelines. BMC Med Res Methodol2002, 2:9.
25. Whiting PF, Weswood ME, Rutjes AW, Reitsma JB, Bossuyt PN, Kle-ijnen J: Evaluation of QUADAS, a tool for the quality assess-ment of diagnostic accuracy studies. BMC Med Res Methodol2006, 6:9.
26. Egger M, Smith GD, Altman DG: Systematic reviews in healthcare. BMJ Publishing Group, London 2005:271.
27. Higgins JP, Thompson SG, Deeks JJ, Altman DG: Measuring incon-sistency in meta-analyses. BMJ 2003, 327:557-560.
28. Vlaar AMM, Kessels AGH, Nijs de T, Winogrodzka A, Mess WH,Kroonenburgh MJPG, Weber WEJ: Additional value of SPECTimaging in comparance with clinical diagnosis in 248patients with parkinsonism. Movement Disorders 2007, 22(Suppl16):233.
29. Brucke T, Asenbaum S, Pirker W, Djamshidian S, Wenger S, WoberC, Muller C, Podreka I: Measurement of the dopaminergicdegeneration in Parkinson's disease with [123I] beta-CITand SPECT. Correlation with clinical findings and compari-son with multiple system atrophy and progressive supranu-clear palsy. J Neural Transm Suppl 1997, 50:9-24.
30. Lu CS, Weng YH, Chen MC, Chen RS, Tzen KY, Wey SP, Ting G,Chang HC, Yen TC: 99mTc-TRODAT-1 imaging of multiplesystem atrophy. J Nucl Med 2004, 45:49-55.
31. Popperl G, Radau P, Linke R, Hahn K, Tatsch K: Diagnostic per-formance of a 3-D automated quantification method ofdopamine D2 receptor SPECT studies in the differentialdiagnosis of parkinsonism. Nucl Med Commun 2005, 26:39-43.
32. Swanson RL, Newberg AB, Acton PD, Siderowf A, Wintering N, AlaviA, Mozley PD, Plossl K, Udeshi M, Hurtig H: Differences in[99mTc]TRODAT-1 SPECT binding to dopamine transport-ers in patients with multiple system atrophy and Parkinson'sdisease. Eur J Nucl Med Mol Imaging 2005, 32:302-307.
33. Asenbaum S, Pirker W, Angelberger P, Bencsits G, Pruckmayer M,Brucke T: [123I]beta-CIT and SPECT in essential tremor andParkinson's disease. J Neural Transm 1998, 105:1213-1228.
Additional file 1flowchart. flowchart of the study selection for the meta-analysis.Click here for file[http://www.biomedcentral.com/content/supplementary/1471-2377-7-27-S1.doc]
Additional file 2reference list 1. reference list of the studies excluded for the meta-analysisClick here for file[http://www.biomedcentral.com/content/supplementary/1471-2377-7-27-S2.doc]
Additional file 3reference list 2. reference list of the studies included in the meta-analysisClick here for file[http://www.biomedcentral.com/content/supplementary/1471-2377-7-27-S3.doc]
Page 11 of 13(page number not for citation purposes)

BMC Neurology 2007, 7:27 http://www.biomedcentral.com/1471-2377/7/27
34. Schwarz J, Tatsch K, Gasser T, Arnold G, Pogarell O, Kunig G, OertelWH: 123I-IBZM binding compared with long-term clinicalfollow up in patients with de novo parkinsonism. Mov Disord1998, 13:16-19.
35. Schwarz J, Tatsch K, Arnold G, Ott M, Trenkwalder C, Kirsch CM,Oertel WH: 123I-iodobenzamide-SPECT in 83 patients withde novo parkinsonism. Neurology 1993, 43:S17-20.
36. Booij J, Speelman JD, Horstink MW, Wolters EC: The clinical ben-efit of imaging striatal dopamine transporters with [123I]FP-CIT SPET in differentiating patients with presynaptic parkin-sonism from those with other forms of parkinsonism. Eur JNucl Med 2001, 28:266-272.
37. Schwarz J, Tatsch K, Gasser T, Arnold G, Oertel WH: [123]IBZMbinding predicts dopaminergic responsiveness in patientswith parkinsonism and previous dopaminomimetic therapy.Mov Disord 1997, 12:898-902.
38. Lokkegaard A, Werdelin LM, Friberg L: Clinical impact of diagnos-tic SPET investigations with a dopamine re-uptake ligand.Eur J Nucl Med Mol Imaging 2002, 29:1623-1629.
39. Stoffers D, Booij J, Bosscher L, Winogrodzka A, Wolters EC, Ber-endse HW: Early-stage [(123)I]beta-CIT SPECT and long-term clinical follow-up in patients with an initial diagnosis ofParkinson's disease. Eur J Nucl Med Mol Imaging 2005.
40. Haapaniemi TH, Ahonen A, Torniainen P, Sotaniemi KA, Myllyla VV:[123I]beta-CIT SPECT demonstrates decreased braindopamine and serotonin transporter levels in untreated par-kinsonian patients. Mov Disord 2001, 16:124-130.
41. Huang WS, Lin SZ, Lin JC, Wey SP, Ting G, Liu RS: Evaluation ofearly-stage Parkinson's disease with 99mTc-TRODAT-1imaging. J Nucl Med 2001, 42:1303-1308.
42. Schwarz J, Linke R, Kerner M, Mozley PD, Trenkwalder C, Gasser T,Tatsch K: Striatal dopamine transporter binding assessed by[I-123]IPT and single photon emission computed tomogra-phy in patients with early Parkinson's disease: implicationsfor a preclinical diagnosis. Arch Neurol 2000, 57:205-208.
43. Van Laere K, De Ceuninck L, Dom R, Van den Eynden J, VanbilloenH, Cleynhens J, Dupont P, Bormans G, Verbruggen A, Mortelmans L:Dopamine transporter SPECT using fast kinetic ligands:123I-FP-beta-CIT versus 99mTc-TRODAT-1. Eur J Nucl MedMol Imaging 2004, 31:1119-1127.
44. Muller T, Farahati J, Kuhn W, Eising EG, Przuntek H, Reiners C,Coenen HH: [123I]beta-CIT SPECT visualizes dopaminetransporter loss in de novo parkinsonian patients. Eur Neurol1998, 39:44-48.
45. Lee MS, Kim YD, Im JH, Kim HJ, Rinne JO, Bhatia KP: 123I-IPT brainSPECT study in essential tremor and Parkinson's disease.Neurology 1999, 52:1422-1426.
46. Plotkin M, Amthauer H, Klaffke S, Kuhn A, Ludemann L, Arnold G,Wernecke KD, Kupsch A, Felix R, Venz S: Combined (123)I-FP-CIT and (123)I-IBZM SPECT for the diagnosis of parkinso-nian syndromes: study on 72 patients. J Neural Transm 2005,112:677-692.
47. Eerola J, Tienari PJ, Kaakkola S, Nikkinen P, Launes J: How useful is[123I]beta-CIT SPECT in clinical practice? J Neurol NeurosurgPsychiatry 2005, 76:1211-1216.
48. Benamer TS, Patterson J, Grosset DG, Booij J, de Bruin K, van RoyenE, Speelman JD, Horstink MH, Sips HJ, Dierckx RA, Versijpt J, DecooD, Van Der Linden C, Hadley DM, Doder M, Lees AJ, Costa DC,Gacinovic S, Oertel WH, Pogarell O, Hoeffken H, Joseph K, TatschK, Schwarz J, Ries V: Accurate differentiation of parkinsonismand essential tremor using visual assessment of [123I]-FP-CIT SPECT imaging: the [123I]-FP-CIT study group. Mov Dis-ord 2000, 15:503-510.
49. Gerschlager W, Bencsits G, Pirker W, Bloem BR, Asenbaum S, PrayerD, Zijlmans JC, Hoffmann M, Brucke T: [123I]beta-CIT SPECTdistinguishes vascular parkinsonism from Parkinson's dis-ease. Mov Disord 2002, 17:518-523.
50. Kim YJ, Ichise M, Ballinger JR, Vines D, Erami SS, Tatschida T, Lang AE:Combination of dopamine transporter and D2 receptorSPECT in the diagnostic evaluation of PD, MSA, and PSP.Mov Disord 2002, 17:303-312.
51. Messa C, Volonte MA, Fazio F, Zito F, Carpinelli A, d'Amico A, RizzoG, Moresco RM, Paulesu E, Franceschi M, Lucignani G: Differentialdistribution of striatal [123I]beta-CIT in Parkinson's diseaseand progressive supranuclear palsy, evaluated with single-
photon emission tomography. Eur J Nucl Med 1998,25:1270-1276.
52. Pirker W, Djamshidian S, Asenbaum S, Gerschlager W, Tribl G, Hoff-mann M, Brucke T: Progression of dopaminergic degenerationin Parkinson's disease and atypical parkinsonism: a longitudi-nal beta-CIT SPECT study. Mov Disord 2002, 17:45-53.
53. Oyanagi C, Katsumi Y, Hanakawa T, Hayashi T, Thuy DD, HashikawaK, Nagahama Y, Fukuyama H, Shibasaki H: Comparison of striataldopamine D2 receptors in Parkinson's disease and progres-sive supranuclear palsy patients using [123I] iodobenzofuransingle-photon emission computed tomography. J Neuroimag-ing 2002, 12:316-324.
54. Oertel WH, Schwarz J, Tatsch K, Arnold G, Gasser T, Kirsch CM:IBZM-SPECT as predictor for dopamimetic responsivenessof patients with de novo parkinsonian syndrome. Adv Neurol1993, 60:519-524.
55. Tatsch K, Schwarz J, Oertel WH, Kirsch CM: SPECT imaging ofdopamine D2 receptors with 123I-IBZM: initial experience incontrols and patients with Parkinson's syndrome and Wil-son's disease. Nucl Med Commun 1991, 12:699-707.
56. Buck A, Westera G, Sutter M, Albani C, Kung HF, vonSchulthess GK:Iodine-123-IBF SPECT evaluation of extrapyramidal dis-eases. J Nucl Med 1995, 36:1196-1200.
57. Seppi K, Schocke MF, Donnemiller E, Esterhammer R, Kremser C,Scherfler C, Diem A, Jaschke W, Wenning GK, Poewe W: Compar-ison of diffusion-weighted imaging and [123I]IBZM-SPECTfor the differentiation of patients with the Parkinson variantof multiple system atrophy from those with Parkinson's dis-ease. Mov Disord 2004, 19:1438-1445.
58. Schelosky L, Hierholzer J, Wissel J, Cordes M, Poewe W: Correla-tion of clinical response in apomorphine test with D2-recep-tor status as demonstrated by 123I IBZM-SPECT. Mov Disord1993, 8:453-458.
59. Pirker W, Asenbaum S, Wenger S, Kornhuber J, Angelberger P,Deecke L, Podreka I, Brucke T: Iodine-123-epidepride-SPECT:studies in Parkinson's disease, multiple system atrophy andHuntington's disease. J Nucl Med 1997, 38:1711-1717.
60. van Royen E, Verhoeff NF, Speelman JD, Wolters EC, Kuiper MA,Janssen AG: Multiple system atrophy and progressive supra-nuclear palsy. Diminished striatal D2 dopamine receptoractivity demonstrated by 123I-IBZM single photon emissioncomputed tomography. Arch Neurol 1993, 50:513-516.
61. Pirker W, Asenbaum S, Bencsits G, Prayer D, Gerschlager W, DeeckeL, Brucke T: [123I]beta-CIT SPECT in multiple system atro-phy, progressive supranuclear palsy, and corticobasal degen-eration. Mov Disord 2000, 15:1158-1167.
62. Seibyl JP, Marek K, Sheff K, Zoghbi S, Baldwin RM, Charney DS, vanDyck CH, Innis RB: Iodine-123-beta-CIT and iodine-123-FPCITSPECT measurement of dopamine transporters in healthysubjects and Parkinson's patients. J Nucl Med 1998,39:1500-1508.
63. Booij J, Tissingh G, Winogrodzka A, Boer GJ, Stoof JC, Wolters EC,van Royen EA: Practical benefit of [123I]FP-CIT SPET in thedemonstration of the dopaminergic deficit in Parkinson'sdisease. Eur J Nucl Med 1997, 24:68-71.
64. Hierholzer J, Cordes M, Venz S, Schelosky L, Harisch C, Richter W,Keske U, Hosten N, Maurer J, Poewe W, Felix R: Loss ofdopamine-D2 receptor binding sites in Parkinsonian plussyndromes. J Nucl Med 1998, 39:954-960.
65. Pirker W, Holler I, Gerschlager W, Asenbaum S, Zettinig G, BruckeT: Measuring the rate of progression of Parkinson's diseaseover a 5-year period with beta-CIT SPECT. Mov Disord 2003,18:1266-1272.
66. Booij J, Bergmans P, Winogrodzka A, Speelman JD, Wolters EC:Imaging of dopamine transporters with [123I]FP-CITSPECT does not suggest a significant effect of age on thesymptomatic threshold of disease in Parkinson's disease. Syn-apse 2001, 39:101-108.
67. van Dyck CH, Seibyl JP, Malison RT, Laruelle M, Zoghbi SS, BaldwinRM, Innis RB: Age-related decline in dopamine transporters:analysis of striatal subregions, nonlinear effects, and hemi-spheric asymmetries. Am J Geriatr Psychiatry 2002, 10:36-43.
68. Whone AL, Watts RL, Stoessl AJ, Davis M, Reske S, Nahmias C, LangAE, Rascol O, Ribeiro MJ, Remy P, Poewe WH, Hauser RA, BrooksDJ: Slower progression of Parkinson's disease with ropinirole
Page 12 of 13(page number not for citation purposes)

BMC Neurology 2007, 7:27 http://www.biomedcentral.com/1471-2377/7/27
Publish with BioMed Central and every scientist can read your work free of charge
"BioMed Central will be the most significant development for disseminating the results of biomedical research in our lifetime."
Sir Paul Nurse, Cancer Research UK
Your research papers will be:
available free of charge to the entire biomedical community
peer reviewed and published immediately upon acceptance
cited in PubMed and archived on PubMed Central
yours — you keep the copyright
Submit your manuscript here:http://www.biomedcentral.com/info/publishing_adv.asp
BioMedcentral
versus levodopa: The REAL-PET study. Ann Neurol 2003,54:93-101.
69. Fahn S: Parkinson disease, the effect of levodopa, and theELLDOPA trial. Earlier vs Later L-DOPA. Arch Neurol 1999,56:529-535.
70. Benamer HT, Oertel WH, Patterson J, Hadley DM, Pogarell O,Hoffken H, Gerstner A, Grosset DG: Prospective study of presy-naptic dopaminergic imaging in patients with mild parkin-sonism and tremor disorders: part 1. Baseline and 3-monthobservations. Mov Disord 2003, 18:977-984.
71. Lorberboym M, Djaldetti R, Melamed E, Sadeh M, Lampl Y: 123I-FP-CIT SPECT imaging of dopamine transporters in patientswith cerebrovascular disease and clinical diagnosis of vascu-lar parkinsonism. J Nucl Med 2004, 45:1688-1693.
72. Schwarz J, Kraft E, Vogl T, Arnold G, Tatsch K, Oertel WH: Relativequantification of signal on T2-weighted images in the basalganglia: limited value in differential diagnosis of patients withparkinsonism. Neuroradiology 1999, 41:124-128.
73. Pizzolato G, Cagnin A, Rossato A, Chierichetti F, Fabbri M, Dam M,Ferlin G, Battistin L: Striatal dopamine D2 receptor alterationsand response to L-DOPA in Parkinson's disease. A[123I]IBZM SPET study. Adv Neurol 1996, 69:467-473.
74. Schwarz J, Tatsch K, Arnold G, Gasser T, Trenkwalder C, Kirsch CM,Oertel WH: 123I-iodobenzamide-SPECT predicts dopamin-ergic responsiveness in patients with de novo parkinsonism.Neurology 1992, 42:556-561.
75. Hierholzer J, Cordes M, Schelosky L, Sander B, Bock JC, David I,Horowski R, Poewe W: [The differential diagnosis of Parkinsondiseases--123I-IBZM-SPECT vs. the apomorphine test]. Rofo1993, 159:86-90.
76. Knudsen GM, Karlsborg M, Thomsen G, Krabbe K, Regeur L, Nyg-aard T, Videbaek C, Werdelin L: Imaging of dopamine transport-ers and D2 receptors in patients with Parkinson's disease andmultiple system atrophy. Eur J Nucl Med Mol Imaging 2004,31:1631-1638.
77. Prunier C, Tranquart F, Cottier JP, Giraudeau B, Chalon S, GuilloteauD, De Toffol B, Chossat F, Autret A, Besnard JC, Baulieu JL: Quanti-tative analysis of striatal dopamine D2 receptors with 123 I-iodolisuride SPECT in degenerative extrapyramidal dis-eases. Nucl Med Commun 2001, 22:1207-1214.
78. Schulz JB, Klockgether T, Petersen D, Jauch M, Muller-SchauenburgW, Spieker S, Voigt K, Dichgans J: Multiple system atrophy: nat-ural history, MRI morphology, and dopamine receptor imag-ing with 123IBZM-SPECT. J Neurol Neurosurg Psychiatry 1994,57:1047-1056.
79. Berding G, Gratz KF, Kolbe H, Meyer GJ, Dengler R, Knoop BO, Hun-deshagen H: 123I-IBZM SPECT: reconstruction methodologyand results in parkinsonism and dystonia. Nuklearmedizin 1994,33:194-199.
80. Bettin S, Kampfer I, Seese A, Schafer A, Reuter M, Lossner J, DietrichJ, Wagner A, Knapp WH: [Striatal uptake of I-123-beta-CIT andI-123-IBZM in patients with extrapyramidal symptoms].Nuklearmedizin 1997, 36:167-172.
81. Scherfler C, Seppi K, Donnemiller E, Goebel G, Brenneis C, VirgoliniI, Wenning GK, Poewe W: Voxel-wise analysis of [123I] beta-CIT SPECT differentiates the Parkinson variant of multiplesystem atrophy from idiopathic Parkinson's disease. Brain2005.
82. Staffen W, Mair A, Unterrainer J, Trinka E, Ladurner G: Measuringthe progression of idiopathic Parkinson's disease with [123I]beta-CIT SPECT. J Neural Transm 2000, 107:543-552.
83. Thobois S, Jahanshahi M, Pinto S, Frackowiak R, Limousin-Dowsey P:PET and SPECT functional imaging studies in Parkinsoniansyndromes: from the lesion to its consequences. Neuroimage2004, 23:1-16.
84. Parkinson Study Group: A multicenter assessment of dopaminetransporter imaging with DOPASCAN/SPECT in parkinson-ism. Neurology 2000, 55:1540-1547.
Pre-publication historyThe pre-publication history for this paper can be accessedhere:
http://www.biomedcentral.com/1471-2377/7/27/prepub
Page 13 of 13(page number not for citation purposes)