bmc evolutionary biology - cas
TRANSCRIPT
This Provisional PDF corresponds to the article as it appeared upon acceptance. Fully formattedPDF and full text (HTML) versions will be made available soon.
Expansion and diversification of the SET domain gene family followingwhole-genome duplications in Populus trichocarpa
BMC Evolutionary Biology 2012, 12:51 doi:10.1186/1471-2148-12-51
Li Lei ([email protected])Shi-Liang Zhou ([email protected])
Hong Ma ([email protected])Liang-Sheng Zhang ([email protected])
ISSN 1471-2148
Article type Research article
Submission date 12 September 2011
Acceptance date 12 April 2012
Publication date 12 April 2012
Article URL http://www.biomedcentral.com/1471-2148/12/51
Like all articles in BMC journals, this peer-reviewed article was published immediately uponacceptance. It can be downloaded, printed and distributed freely for any purposes (see copyright
notice below).
Articles in BMC journals are listed in PubMed and archived at PubMed Central.
For information about publishing your research in BMC journals or any BioMed Central journal, go to
http://www.biomedcentral.com/info/authors/
BMC Evolutionary Biology
© 2012 Lei et al. ; licensee BioMed Central Ltd.This is an open access article distributed under the terms of the Creative Commons Attribution License (http://creativecommons.org/licenses/by/2.0),
which permits unrestricted use, distribution, and reproduction in any medium, provided the original work is properly cited.
Expansion and diversification of the SET domain
gene family following whole-genome duplications in
Populus trichocarpa
Li Lei1,3
Email: [email protected]
Shi-Liang Zhou1
Email: [email protected]
Hong Ma2*
* Corresponding author
Email: [email protected]
Liang-Sheng Zhang2*
* Corresponding author
Email: [email protected]
1 State Key Laboratory of Systematic and Evolutionary Botany, Institute of
Botany, the Chinese Academy of Sciences, Beijing 100093, China
2 State Key Laboratory of Genetic Engineering, Institute of Plants Biology,
Center for Evolutionary Biology, School of Life Sciences, Fudan University,
Shanghai 200433, China
3 Graduate University of the Chinese Academy of Sciences, Beijing 100039,
China
Abstract
Background
Histone lysine methylation modifies chromatin structure and thereby regulates eukaryotic
gene transcription and a variety of developmental and physiological processes. SET domain
proteins are lysine methyltransferases containing the evolutionarily-conserved SET domain,
which is known to be the catalytic domain.
Results
We identified 59 SET genes in the Populus genome. Phylogenetic analyses of 106 SET genes
from Populus and Arabidopsis supported the clustering of SET genes into six distinct
subfamilies and identified 19 duplicated gene pairs in Populus. The chromosome locations of
these gene pairs and the distribution of synonymous substitution rates showed that the
expansion of the SET gene family might be caused by large-scale duplications in Populus.
Comparison of gene structures and domain architectures of each duplicate pair indicated that
divergence took place at the 3′- and 5′-terminal transcribed regions and at the N- and C-
termini of the predicted proteins, respectively. Expression profile analysis of Populus SET
genes suggested that most Populus SET genes were expressed widely, many with the highest
expression in young leaves. In particular, the expression profiles of 12 of the 19 duplicated
gene pairs fell into two types of expression patterns.
Conclusions
The 19 duplicated SET genes could have originated from whole genome duplication events.
The differences in SET gene structure, domain architecture, and expression profiles in various
tissues of Populus suggest that members of the SET gene family have a variety of
developmental and physiological functions. Our study provides clues about the evolution of
epigenetic regulating chromatin structure and gene expression.
Background
Gene expression is regulated by many factors acting in concert with the status of the
chromatin environment, particularly histone methylation [1]. The SET-domain-containing
protein family is a major player in histone methylation. These proteins are responsible for the
methylation of lysine (K) residues in various histones, specifically K4, K9, K27, and K36 in
histone H3 and K20 in histone H4 [2]; H3K79 is an exception [3]. All members of this family
share a highly conserved SET domain [2], named for three Drosophila melanogaster
proteins: Suppressor of variegation 3–9 (Su(var)3-9) (Suv), Enhancer of Zeste (E(z)) and
Trithorax (Trx). This domain has approximately 130 amino acids and has been found in all
eukaryotic organisms studied so far [2]. Proteins containing the SET domain can also be
found in viruses as well as both domains of prokaryotes [4,5].
Recent studies have revealed that the SET domain (here after referred as SET) genes are
important for regulating growth and reproduction processes, such as control of flowering time
and embryogenesis in plants [6]. Genome sequencing has uncovered many genes encoding
SET-domain proteins; in particular, Arabidopsis SET genes are the best annotated and
characterized. For example, the Arabidopsis CURLY LEAF (CLF) gene is required for stable
repression of the floral homeotic gene AGAMOUS in leaves and stems [7]. ARABIDOPSIS
TRITHORAX 1 (ATX1) functions as an activator of homeotic genes, like Trithorax in animal
systems [8]. ARABIDOPSIS TRITHORAX-RELATED PROTEIN 7 (ATXR7) is an H3K4
methylase required for proper expression of the Flowering Locus C (FLC) gene [9]. The
Arabidopsis ASH1 HOMOLOG 2 (ASHH2) protein has been suggested to methylate H3K4
and/or H3K36, similar to Drosophila ASH1 and yeast SET2, a H3K36 histone
methyltransferase (HMT) [10]. Other SET genes are associated with embryogenesis,
including MEDEA (MEA); a maternally inherited loss-of-function mea allele results in
embryo abortion and prolonged endosperm production [11]. Recently, ATXR3 is crucial for
both sporophyte and gametophyte development and encodes the major enzyme responsible
for trimethylation of H3K4 [12,13].
In plants, at least 47, 33, 31, and 43 SET genes have been identified in Arabidopsis, grape,
maize and rice, respectively [14-16]. In both Arabidopsis and rice it has been determined that
many SET genes are located in large blocks of related regions derived from whole genome
duplication events, indicating that whole genome duplication could be an important
contributor to the duplication of SET genes [15]. In addition, different classifications of SET
genes were used in different plants. Initially, 37 putative Arabidopsis SET genes were
classified into four distinct classes: (I) enhancer of zeste [E(z)] homologs; (II) trithorax (Trx)
homologs and related proteins; (III) Ash1 homologs and related proteins; and (IV) suppressor
of variegation [Su(var)] homologs and related proteins [17]. In another study, 32 Arabidopsis
and 22 maize SET genes were classified into five classes according to phylogenetic
relationships and domain organization [18]. More recently, two additional classes (VI and
VII) were recognized for SET genes in Arabidopsis, grape, maize, and rice [14-16].
Interestingly, in Arabidopsis several genes in class III, like ATXR3, were shown to be crucial
for both sporophyte and gametophyte development [12,13]. Moreover, Arabidopsis has ten
Su(var) homologue (SUVH) genes belonging to Class V, including several that control
heterochromatic domains. Loss of function of these genes suppresses gene silencing, whereas
overexpression enhances silencing, causing ectopic heterochromatization and significant
growth defects in Arabidopsis [19]. Therefore, SET genes in different subfamilies could have
diverse functions.
Previous studies of SET genes have focused on annotation and Arabidopsis functional
characterizations [7-13,19]; in addition evolutionary analyses have been limited to
herbaceous plants [14-18]. Trees are distinct from herbaceous species in many ways: they
have a self-supporting structure, the secondary growth or wood, and a much longer lifespan
[20,21]. The regulatory networks and molecular mechanisms that underlie these unique
properties cannot be investigated through the examination of nontree species. Therefore, it is
worthwhile to study SET genes in trees, thereby improving our understanding in their
functions and the evolution of SET genes. The recently completed genome sequence of the
model tree, Populus trichocarpa (hereafter called Populus) [22], provides a great opportunity
to investigate these issues.
Molecular evidence suggests that Arabidopsis and Populus shared their last common ancestor
as much as 100 to 120 million years ago [22]. Since then, Arabidopsis and Populus have
evolved different life histories, including herbaceous versus arboreal development, annual
versus perennial habit, and self-pollination versus cross-pollination strategies [20,21]. In
addition, since they diverged from each other, Populus has experienced whole genome
duplication once, whereas Arabidopsis has twice [22,23]. In plants, evolutionary diversity has
been hypothesized to be modulated directly or indirectly by epigenetic regulations [24].
Therefore, the SET gene family, among the most important epigenetic regulators, could be
postulated to contribute substantially to the evolutionary innovations in plant diversity.
We conducted a comparative analysis of SET genes from Arabidopsis and Populus to address
the key question: how have SET genes evolved in Populus after the divergence of
Arabidopsis and Populus. In particular, how did the SET gene family expand and diversify in
Populus? In this study, we performed comprehensive analyses of SET genes from Populus,
including phylogeny, gene structure, domain architecture, gene duplication and
diversification, and expression profiling analyses. Our results provide insight into the
function of Populus SET genes and provide a basis for understanding how gene functions,
particularly functions involved in the development of trees, have evolved.
Results
Identification of SET genes in Populus
We obtained the Populus whole-genome shotgun trace data from JGI and identified all
predicted proteins containing SET domains. We named Populus SET genes based on the
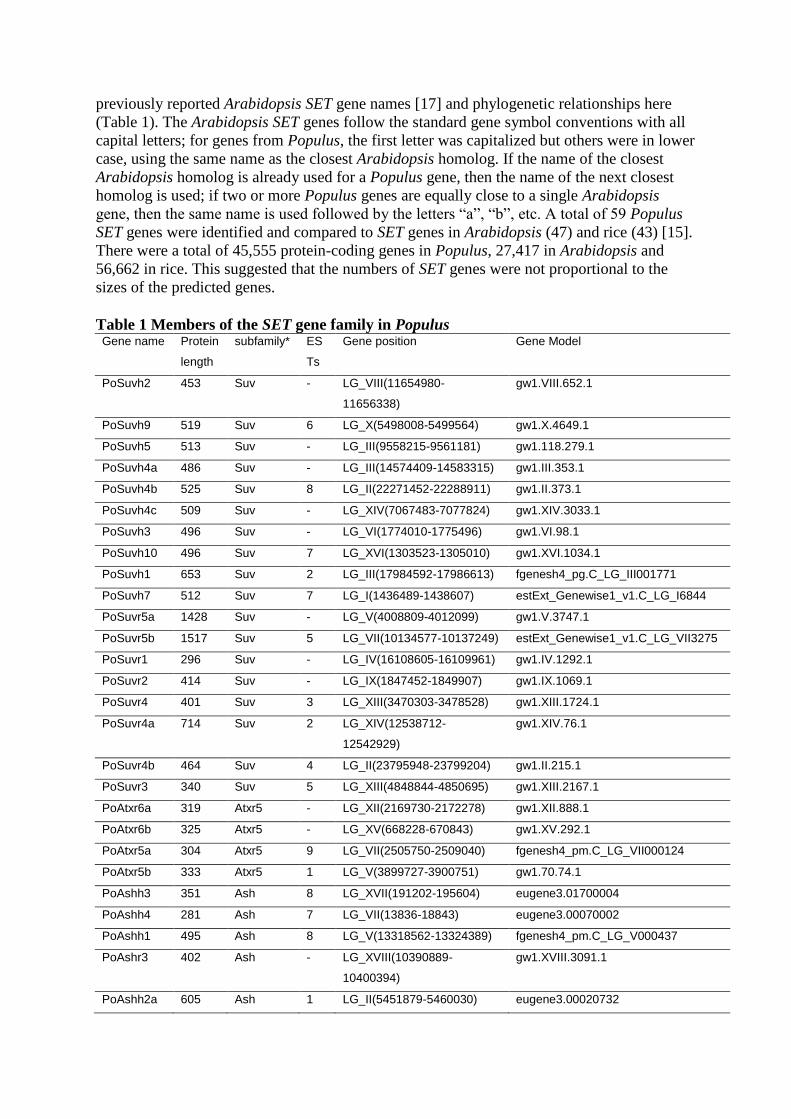
previously reported Arabidopsis SET gene names [17] and phylogenetic relationships here
(Table 1). The Arabidopsis SET genes follow the standard gene symbol conventions with all
capital letters; for genes from Populus, the first letter was capitalized but others were in lower
case, using the same name as the closest Arabidopsis homolog. If the name of the closest
Arabidopsis homolog is already used for a Populus gene, then the name of the next closest
homolog is used; if two or more Populus genes are equally close to a single Arabidopsis
gene, then the same name is used followed by the letters “a”, “b”, etc. A total of 59 Populus
SET genes were identified and compared to SET genes in Arabidopsis (47) and rice (43) [15].
There were a total of 45,555 protein-coding genes in Populus, 27,417 in Arabidopsis and
56,662 in rice. This suggested that the numbers of SET genes were not proportional to the
sizes of the predicted genes.
Table 1 Members of the SET gene family in Populus Gene name Protein
length
subfamily* ES
Ts
Gene position Gene Model
PoSuvh2 453 Suv - LG_VIII(11654980-
11656338)
gw1.VIII.652.1
PoSuvh9 519 Suv 6 LG_X(5498008-5499564) gw1.X.4649.1
PoSuvh5 513 Suv - LG_III(9558215-9561181) gw1.118.279.1
PoSuvh4a 486 Suv - LG_III(14574409-14583315) gw1.III.353.1
PoSuvh4b 525 Suv 8 LG_II(22271452-22288911) gw1.II.373.1
PoSuvh4c 509 Suv - LG_XIV(7067483-7077824) gw1.XIV.3033.1
PoSuvh3 496 Suv - LG_VI(1774010-1775496) gw1.VI.98.1
PoSuvh10 496 Suv 7 LG_XVI(1303523-1305010) gw1.XVI.1034.1
PoSuvh1 653 Suv 2 LG_III(17984592-17986613) fgenesh4_pg.C_LG_III001771
PoSuvh7 512 Suv 7 LG_I(1436489-1438607) estExt_Genewise1_v1.C_LG_I6844
PoSuvr5a 1428 Suv - LG_V(4008809-4012099) gw1.V.3747.1
PoSuvr5b 1517 Suv 5 LG_VII(10134577-10137249) estExt_Genewise1_v1.C_LG_VII3275
PoSuvr1 296 Suv - LG_IV(16108605-16109961) gw1.IV.1292.1
PoSuvr2 414 Suv - LG_IX(1847452-1849907) gw1.IX.1069.1
PoSuvr4 401 Suv 3 LG_XIII(3470303-3478528) gw1.XIII.1724.1
PoSuvr4a 714 Suv 2 LG_XIV(12538712-
12542929)
gw1.XIV.76.1
PoSuvr4b 464 Suv 4 LG_II(23795948-23799204) gw1.II.215.1
PoSuvr3 340 Suv 5 LG_XIII(4848844-4850695) gw1.XIII.2167.1
PoAtxr6a 319 Atxr5 - LG_XII(2169730-2172278) gw1.XII.888.1
PoAtxr6b 325 Atxr5 - LG_XV(668228-670843) gw1.XV.292.1
PoAtxr5a 304 Atxr5 9 LG_VII(2505750-2509040) fgenesh4_pm.C_LG_VII000124
PoAtxr5b 333 Atxr5 1 LG_V(3899727-3900751) gw1.70.74.1
PoAshh3 351 Ash 8 LG_XVII(191202-195604) eugene3.01700004
PoAshh4 281 Ash 7 LG_VII(13836-18843) eugene3.00070002
PoAshh1 495 Ash 8 LG_V(13318562-13324389) fgenesh4_pm.C_LG_V000437
PoAshr3 402 Ash - LG_XVIII(10390889-
10400394)
gw1.XVIII.3091.1
PoAshh2a 605 Ash 1 LG_II(5451879-5460030) eugene3.00020732
PoAshh2b 594 Ash - LG_V(1177943-12003046) gw1.V.27.1
PoAtxr3a 2350 Atxr3 7 LG_VII(1678369-1689434) fgenesh4_pg.C_LG_VII000266
PoAtxr3b 2476 Atxr3 28 LG_XVII(5241549-5229352) eugene3.00640010
PoSwna 852 E(z) 10 LG_II(16109075-16116062) gw1.II.890.1
PoSwnb 812 E(z) 1 LG_XIV(5213392-5220923) estExt_Genewise1_v1.C_LG_XIV2284
PoClfa 917 E(z) 5 LG_V(5117508-5125370) estExt_fgenesh4_pg.C_LG_V0535
PoClfb 892 E(z) 1 LG_VII(8674891-8681980) estExt_Genewise1_v1.C_LG_VII2923
PoAtxr7a 1390 Trx 2 LG_II(69963-76718) fgenesh4_pg.C_LG_II000009
PoAtxr7b 1149 Trx 3 LG_V(25489363-25495946) POPTR_0005s28130
PoAtx6 712 Trx - LG_XVIII(1929427-1923848) POPTR_0018s02170
PoAtx1 1014 Trx 6 LG_II(20140580-20153598) fgenesh4_pg.C_LG_II002136
PoAtx2 1050 Trx 5 LG_XIV(7247301-7259403) gw1.XIV.3109.1
PoAtx3a 667 Trx 2 LG_II(13105976-13113638) fgenesh4_pg.C_LG_II001571
PoAtx3b 908 Trx 6 LG_XIV(3468877-3477546) gw1.XIV.1697.1
PoAtx5 1070 Trx 3 LG_XV(992498-1001204) gw1.XV.426.1
PoAtx4 1078 Trx 4 LG_XII(1824820-1833670) gw1.XII.196.1
PoAshr2 326 SMYD 3 LG_I(5175894-5176871) gw1.I.8071.1
PoAtxr4 283 SMYD 7 LG_VI(5075142-10640133) gw1.VI.14.1
PoAtxr1 542 SMYD - LG_VIII(5563751-5563753) fgenesh4_pg.C_LG_VIII000780
PoAtxr2 398 SMYD 9 LG_XVII(5018556-5014447) estExt_fgenesh4_pm.C_640013
PoAshr1 458 SMYD 4 LG_V(11020007-11025452) eugene3.00050808
PoSetd8 167 SETD 4 LG_III(13995189-13996722) gw1.III.385.1
PoSetd3 362 SETD 1 LG_VIII(8841653-8843777) fgenesh4_pg.C_LG_VIII001195
PoSetd4 513 SETD 2 LG_VI(16825966-16820213) POPTR_0006s18410
PoSetd7 468 SETD 2 LG_IV(11613451-11616746) gw1.IV.4590.1
PoSetd10 444 SETD 12 LG_IV(7403229-7405799) gw1.IV.3768.1
PoSetd6 439 SETD 1 LG_VIII(2548612-2554748) gw1.VIII.1187.1
PoSetd9 502 SETD 9 LG_VII(9438694-9433649) eugene3.01730002
PoSetd5 503 SETD 12 LG_XIV(9526856-9530848) eugene3.00141165
PoSetd1 551 SETD 4 LG_XIV(2038778-2044599) gw1.XIV.1045.1
PoSetd2a 490 SETD 7 LG_VIII(5640809-5644314) gw1.VIII.2559.1
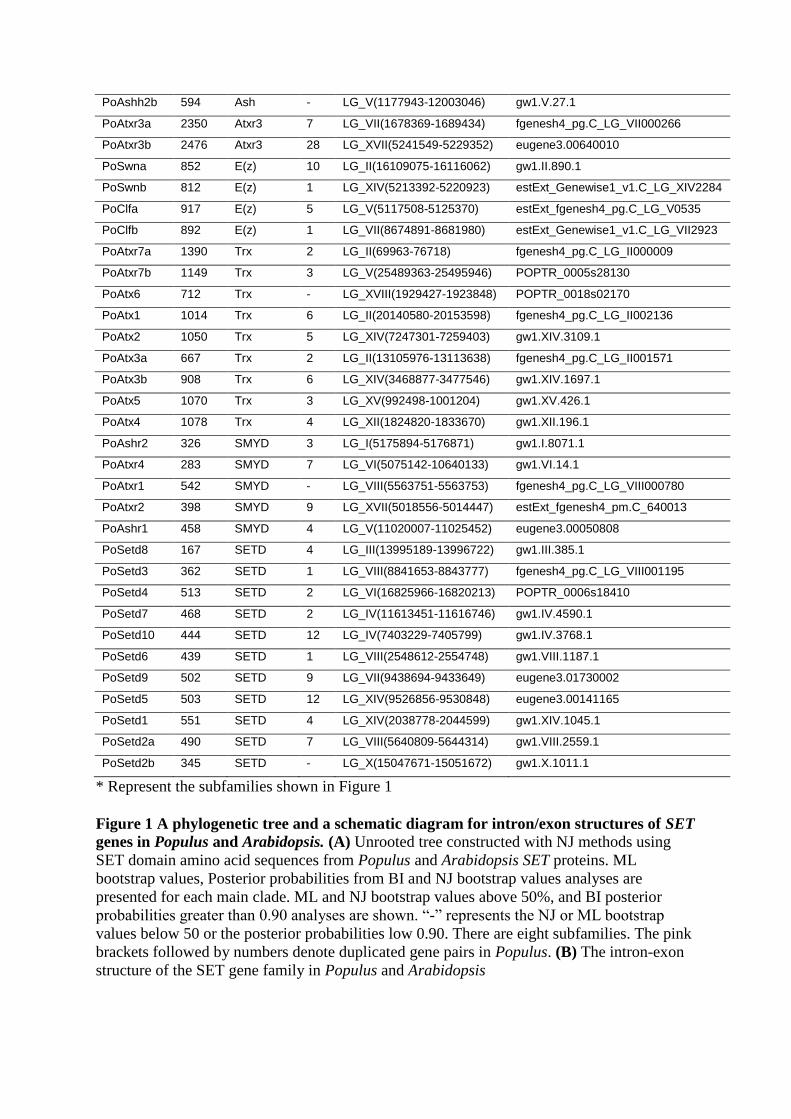
PoSetd2b 345 SETD - LG_X(15047671-15051672) gw1.X.1011.1
* Represent the subfamilies shown in Figure 1
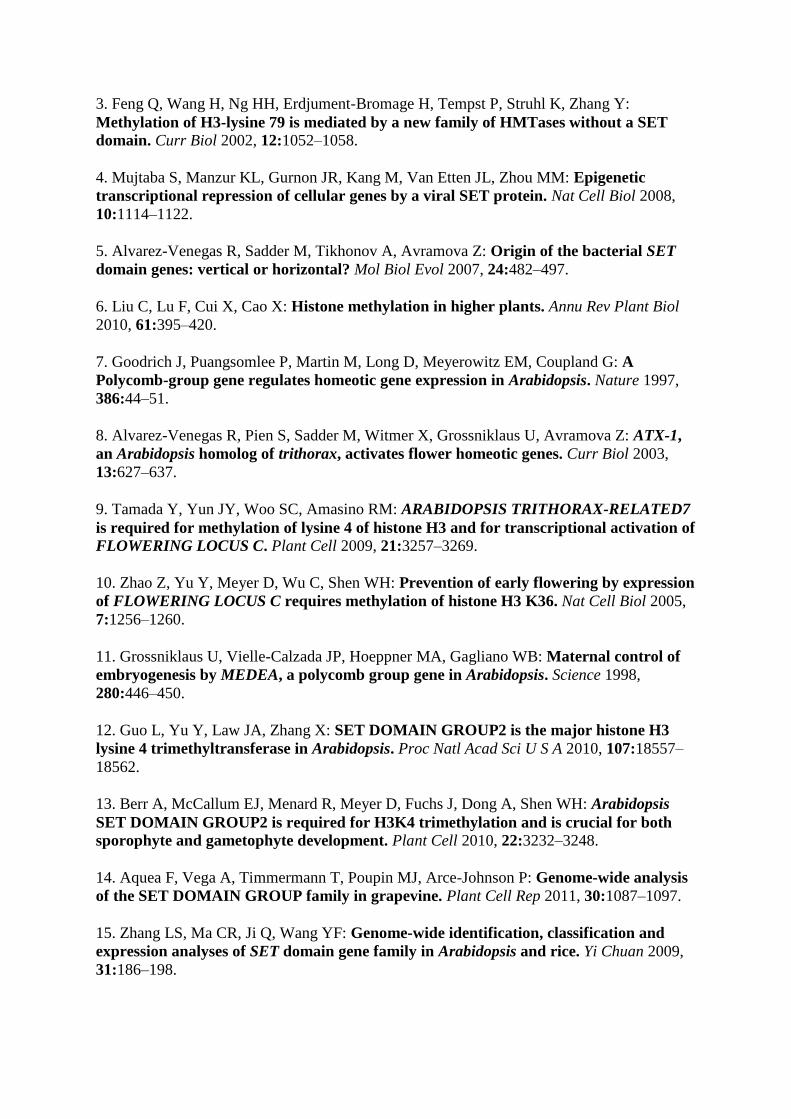
Figure 1 A phylogenetic tree and a schematic diagram for intron/exon structures of SET genes in Populus and Arabidopsis. (A) Unrooted tree constructed with NJ methods using
SET domain amino acid sequences from Populus and Arabidopsis SET proteins. ML
bootstrap values, Posterior probabilities from BI and NJ bootstrap values analyses are
presented for each main clade. ML and NJ bootstrap values above 50%, and BI posterior
probabilities greater than 0.90 analyses are shown. “-” represents the NJ or ML bootstrap
values below 50 or the posterior probabilities low 0.90. There are eight subfamilies. The pink
brackets followed by numbers denote duplicated gene pairs in Populus. (B) The intron-exon
structure of the SET gene family in Populus and Arabidopsis

Phylogeny and gene structures of Populus SET genes
To understand the evolution of Populus SET genes, we performed unrooted phylogenetic
analyses on the 106 SET genes from Populus (59 genes) and Arabidopsis (47) using
Maximum Likelihood (ML), Bayesian inference (BI) and Neighbour-Joining (NJ) methods
(Figures 1A and Additional file 1). The tree topologies produced by the three methods are
largely consistent, with only minor differences at interior nodes (Additional file 1). The NJ
tree is shown in Figure 1A and discussed below. Most Populus SET genes clustered with their
homologs in Arabidopsis. Sometimes, however, two Populus genes clustered together with
either a single Arabidopsis gene, or without any corresponding gene in Arabidopsis
(Figure 1A, pink single brackets followed by numbers). In total, there are 19 such pairs of
Populus SET genes.
The phylogenetic tree topology and the predicted protein domain compositions also allow the
grouping of the 106 SET genes in Arabidopsis and Populus into eight subfamilies (named
Suv, Atxr5, Ash, Atxr3, E(z), Trx, SMYD and SETD; Figure 1A), generally in accordance
with those in other plants [14,16-18]. Nevertheless, there were some differences from prior
classifications [16-18]. One notable difference is that recent classifications placed MEA, CLF
and SWN in class I and ATX1, ATX2, ATX3, ATX4, ATX5, ATXR3 and ATXR7 in Class III
[14-16], but our results had all of these genes clustered together, forming a monophyletic
clade with bootstrap support of 77% (Figure 1A). In addition, each subfamily formed a group
with high bootstrap support in the unrooted ML/BI/NJ analysis and may have the same
ancestral origin.
In general, members from the same subfamily shared similar exon/intron structures, e.g.
intron number and exon length; however, some members of the Suv, SMYD and SETD
subfamilies (Figure 1B) had structural differences from other members. In the Suv subfamily,
retrotransposition events have been reported [17,18], which could have contributed to the
diversity of the subfamily members. For subfamilies SMYD and SETD, we observed
considerable diversity in gene structure and highly divergent sequences among subfamily
members, but this diversity and its possible functions have rarely been reported.
Expansion and evolution of the SET gene family in Populus
The phylogenetic analysis of Populus SET genes indicates that they have experienced
multiple gene duplication events. Gene duplication mechanisms include tandem duplication
and large segmental/whole-genome duplication (WGD). To examine the relative contribution
of each of these mechanisms in the expansion of the SET gene family, each member was
electronically mapped to loci across all 16 Populus chromosomes and 4 additional scaffolds
according to the location information provided by the JGI database [22] (Figure 2A).
Chromosomes LG XI and LG XIX did not contain any SET genes; some SET genes had only
been located in the scaffold and had not yet been assigned to a particular chromosome
(Figure 2A). The highest number of SET genes (8, or 13.1% of the total) was found on
chromosome II (Figure 2A). Intriguingly, we did not identify gene clusters on any Populus
chromosomes (Figure 2A), indicating that tandem duplication was not the cause of the
detected duplicates in the Populus SET gene family. This is similar to the lack of tandem
duplication events in the Arabidopsis and rice SET gene families [15].
Figure 2 Positions of SET genes on Populus chromosomes. (A) Map of the SET gene
positions on Populus chromosomes. Numbers refer to locus ID as listed in Table 1. The SET
genes found on duplicated chromosomal segments are connected by lines. (B) Frequency
distribution of Ks between all syntenically duplicated gene pairs in Populus. The light blue
box indicates a recent polyploidy event (since the split from the Arabidopsis lineage),
denoted p; the pink box marks a duplication event apparently shared among the eurosids (γ);
the dark blue box denotes a possible overlap of ancient polyploidy events shared with all the
seeds plants (ε) or angiosperms (ζ). (C) One example of the detailed locations of
representative pairs of genes duplicated in recent polyploidy events in the syntenic region.
(D) Detailed location of representative duplicated pairs from ancient polyploidy events in the
syntenic region
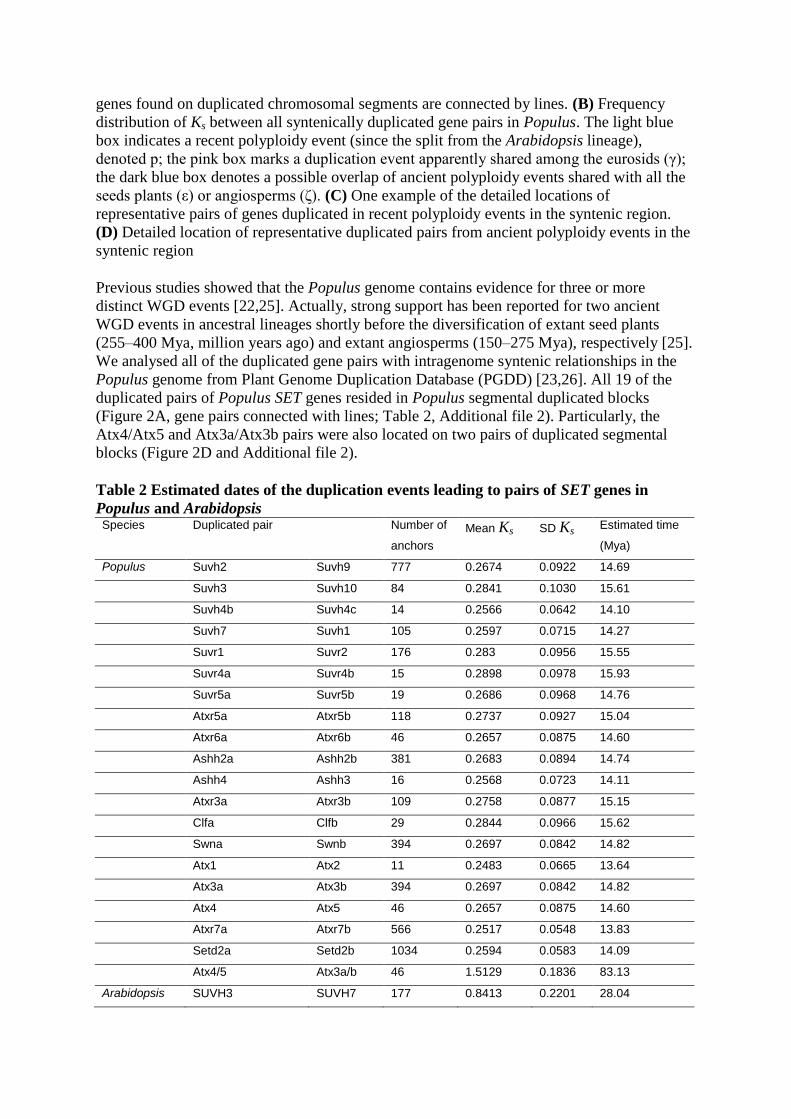
Previous studies showed that the Populus genome contains evidence for three or more
distinct WGD events [22,25]. Actually, strong support has been reported for two ancient
WGD events in ancestral lineages shortly before the diversification of extant seed plants
(255–400 Mya, million years ago) and extant angiosperms (150–275 Mya), respectively [25].
We analysed all of the duplicated gene pairs with intragenome syntenic relationships in the
Populus genome from Plant Genome Duplication Database (PGDD) [23,26]. All 19 of the
duplicated pairs of Populus SET genes resided in Populus segmental duplicated blocks
(Figure 2A, gene pairs connected with lines; Table 2, Additional file 2). Particularly, the
Atx4/Atx5 and Atx3a/Atx3b pairs were also located on two pairs of duplicated segmental
blocks (Figure 2D and Additional file 2).
Table 2 Estimated dates of the duplication events leading to pairs of SET genes in
Populus and Arabidopsis Species Duplicated pair Number of
anchors
Mean Ks SD Ks Estimated time
(Mya)
Populus Suvh2 Suvh9 777 0.2674 0.0922 14.69
Suvh3 Suvh10 84 0.2841 0.1030 15.61
Suvh4b Suvh4c 14 0.2566 0.0642 14.10
Suvh7 Suvh1 105 0.2597 0.0715 14.27
Suvr1 Suvr2 176 0.283 0.0956 15.55
Suvr4a Suvr4b 15 0.2898 0.0978 15.93
Suvr5a Suvr5b 19 0.2686 0.0968 14.76
Atxr5a Atxr5b 118 0.2737 0.0927 15.04
Atxr6a Atxr6b 46 0.2657 0.0875 14.60
Ashh2a Ashh2b 381 0.2683 0.0894 14.74
Ashh4 Ashh3 16 0.2568 0.0723 14.11
Atxr3a Atxr3b 109 0.2758 0.0877 15.15
Clfa Clfb 29 0.2844 0.0966 15.62
Swna Swnb 394 0.2697 0.0842 14.82
Atx1 Atx2 11 0.2483 0.0665 13.64
Atx3a Atx3b 394 0.2697 0.0842 14.82
Atx4 Atx5 46 0.2657 0.0875 14.60
Atxr7a Atxr7b 566 0.2517 0.0548 13.83
Setd2a Setd2b 1034 0.2594 0.0583 14.09
Atx4/5 Atx3a/b 46 1.5129 0.1836 83.13
Arabidopsis SUVH3 SUVH7 177 0.8413 0.2201 28.04
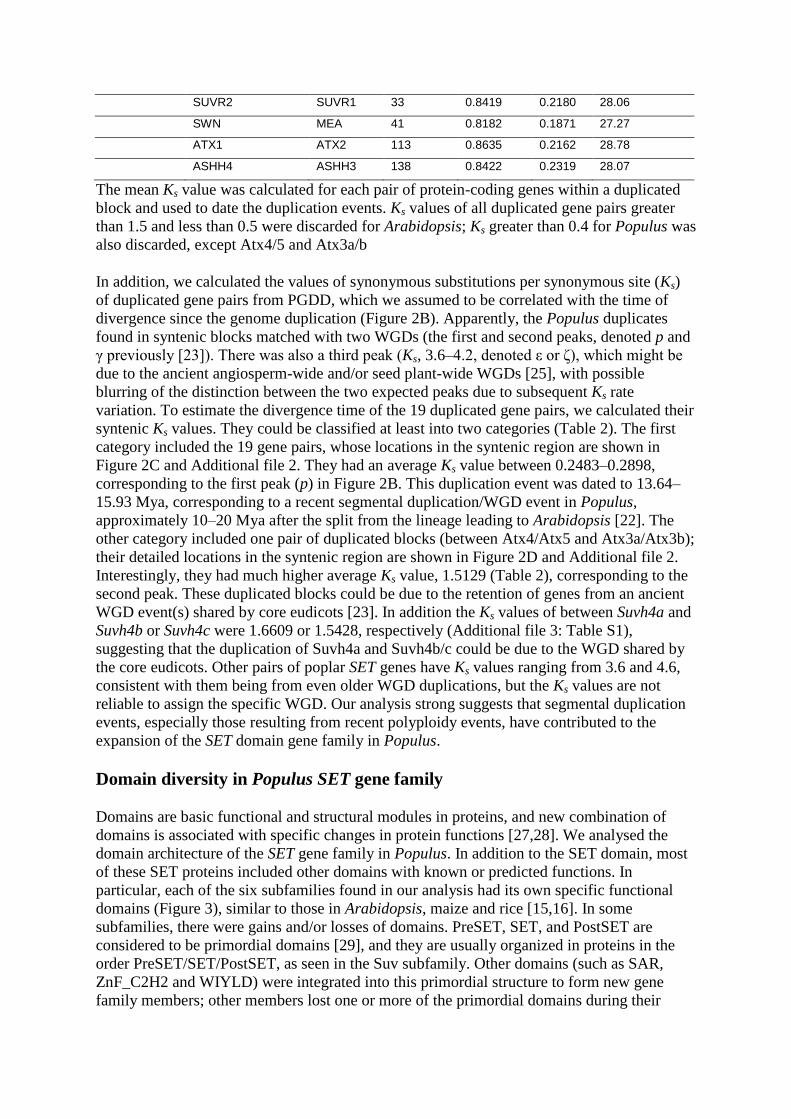
SUVR2 SUVR1 33 0.8419 0.2180 28.06
SWN MEA 41 0.8182 0.1871 27.27
ATX1 ATX2 113 0.8635 0.2162 28.78
ASHH4 ASHH3 138 0.8422 0.2319 28.07
The mean Ks value was calculated for each pair of protein-coding genes within a duplicated
block and used to date the duplication events. Ks values of all duplicated gene pairs greater
than 1.5 and less than 0.5 were discarded for Arabidopsis; Ks greater than 0.4 for Populus was
also discarded, except Atx4/5 and Atx3a/b
In addition, we calculated the values of synonymous substitutions per synonymous site (Ks)
of duplicated gene pairs from PGDD, which we assumed to be correlated with the time of
divergence since the genome duplication (Figure 2B). Apparently, the Populus duplicates
found in syntenic blocks matched with two WGDs (the first and second peaks, denoted p and
γ previously [23]). There was also a third peak (Ks, 3.6–4.2, denoted ε or ζ), which might be
due to the ancient angiosperm-wide and/or seed plant-wide WGDs [25], with possible
blurring of the distinction between the two expected peaks due to subsequent Ks rate
variation. To estimate the divergence time of the 19 duplicated gene pairs, we calculated their
syntenic Ks values. They could be classified at least into two categories (Table 2). The first
category included the 19 gene pairs, whose locations in the syntenic region are shown in
Figure 2C and Additional file 2. They had an average Ks value between 0.2483–0.2898,
corresponding to the first peak (p) in Figure 2B. This duplication event was dated to 13.64–
15.93 Mya, corresponding to a recent segmental duplication/WGD event in Populus,
approximately 10–20 Mya after the split from the lineage leading to Arabidopsis [22]. The
other category included one pair of duplicated blocks (between Atx4/Atx5 and Atx3a/Atx3b);
their detailed locations in the syntenic region are shown in Figure 2D and Additional file 2.
Interestingly, they had much higher average Ks value, 1.5129 (Table 2), corresponding to the
second peak. These duplicated blocks could be due to the retention of genes from an ancient
WGD event(s) shared by core eudicots [23]. In addition the Ks values of between Suvh4a and
Suvh4b or Suvh4c were 1.6609 or 1.5428, respectively (Additional file 3: Table S1),
suggesting that the duplication of Suvh4a and Suvh4b/c could be due to the WGD shared by
the core eudicots. Other pairs of poplar SET genes have Ks values ranging from 3.6 and 4.6,
consistent with them being from even older WGD duplications, but the Ks values are not
reliable to assign the specific WGD. Our analysis strong suggests that segmental duplication
events, especially those resulting from recent polyploidy events, have contributed to the
expansion of the SET domain gene family in Populus.
Domain diversity in Populus SET gene family
Domains are basic functional and structural modules in proteins, and new combination of
domains is associated with specific changes in protein functions [27,28]. We analysed the
domain architecture of the SET gene family in Populus. In addition to the SET domain, most
of these SET proteins included other domains with known or predicted functions. In
particular, each of the six subfamilies found in our analysis had its own specific functional
domains (Figure 3), similar to those in Arabidopsis, maize and rice [15,16]. In some
subfamilies, there were gains and/or losses of domains. PreSET, SET, and PostSET are
considered to be primordial domains [29], and they are usually organized in proteins in the
order PreSET/SET/PostSET, as seen in the Suv subfamily. Other domains (such as SAR,
ZnF_C2H2 and WIYLD) were integrated into this primordial structure to form new gene
family members; other members lost one or more of the primordial domains during their
evolution (Figure 3). The general patterns of domain gains and losses were similar in the Ash,
Trx and E(z) subfamilies.
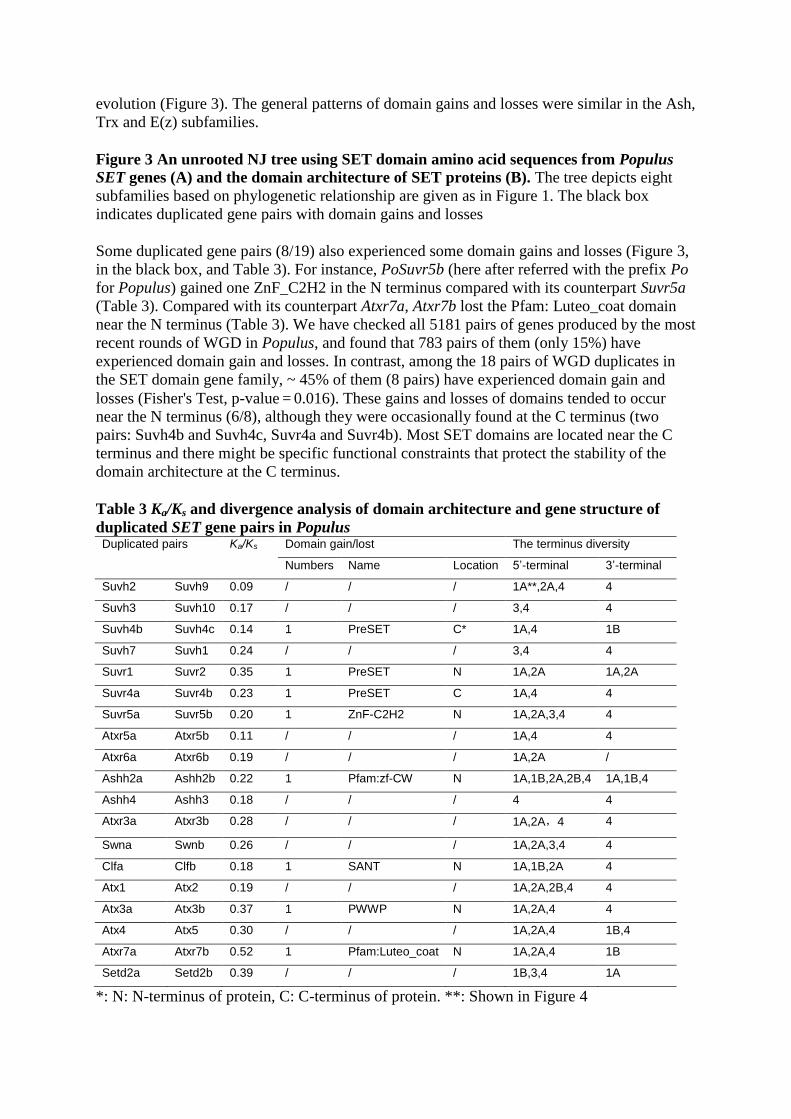
Figure 3 An unrooted NJ tree using SET domain amino acid sequences from Populus
SET genes (A) and the domain architecture of SET proteins (B). The tree depicts eight
subfamilies based on phylogenetic relationship are given as in Figure 1. The black box
indicates duplicated gene pairs with domain gains and losses
Some duplicated gene pairs (8/19) also experienced some domain gains and losses (Figure 3,
in the black box, and Table 3). For instance, PoSuvr5b (here after referred with the prefix Po
for Populus) gained one ZnF_C2H2 in the N terminus compared with its counterpart Suvr5a
(Table 3). Compared with its counterpart Atxr7a, Atxr7b lost the Pfam: Luteo_coat domain
near the N terminus (Table 3). We have checked all 5181 pairs of genes produced by the most
recent rounds of WGD in Populus, and found that 783 pairs of them (only 15%) have
experienced domain gain and losses. In contrast, among the 18 pairs of WGD duplicates in
the SET domain gene family, ~ 45% of them (8 pairs) have experienced domain gain and
losses (Fisher's Test, p-value = 0.016). These gains and losses of domains tended to occur
near the N terminus (6/8), although they were occasionally found at the C terminus (two
pairs: Suvh4b and Suvh4c, Suvr4a and Suvr4b). Most SET domains are located near the C
terminus and there might be specific functional constraints that protect the stability of the
domain architecture at the C terminus.
Table 3 Ka/Ks and divergence analysis of domain architecture and gene structure of
duplicated SET gene pairs in Populus Duplicated pairs Ka/Ks Domain gain/lost The terminus diversity
Numbers Name Location 5’-terminal 3’-terminal
Suvh2 Suvh9 0.09 / / / 1A**,2A,4 4
Suvh3 Suvh10 0.17 / / / 3,4 4
Suvh4b Suvh4c 0.14 1 PreSET C* 1A,4 1B
Suvh7 Suvh1 0.24 / / / 3,4 4
Suvr1 Suvr2 0.35 1 PreSET N 1A,2A 1A,2A
Suvr4a Suvr4b 0.23 1 PreSET C 1A,4 4
Suvr5a Suvr5b 0.20 1 ZnF-C2H2 N 1A,2A,3,4 4
Atxr5a Atxr5b 0.11 / / / 1A,4 4
Atxr6a Atxr6b 0.19 / / / 1A,2A /
Ashh2a Ashh2b 0.22 1 Pfam:zf-CW N 1A,1B,2A,2B,4 1A,1B,4
Ashh4 Ashh3 0.18 / / / 4 4
Atxr3a Atxr3b 0.28 / / / 1A,2A,4 4
Swna Swnb 0.26 / / / 1A,2A,3,4 4
Clfa Clfb 0.18 1 SANT N 1A,1B,2A 4
Atx1 Atx2 0.19 / / / 1A,2A,2B,4 4
Atx3a Atx3b 0.37 1 PWWP N 1A,2A,4 4
Atx4 Atx5 0.30 / / / 1A,2A,4 1B,4
Atxr7a Atxr7b 0.52 1 Pfam:Luteo_coat N 1A,2A,4 1B
Setd2a Setd2b 0.39 / / / 1B,3,4 1A
*: N: N-terminus of protein, C: C-terminus of protein. **: Shown in Figure 4
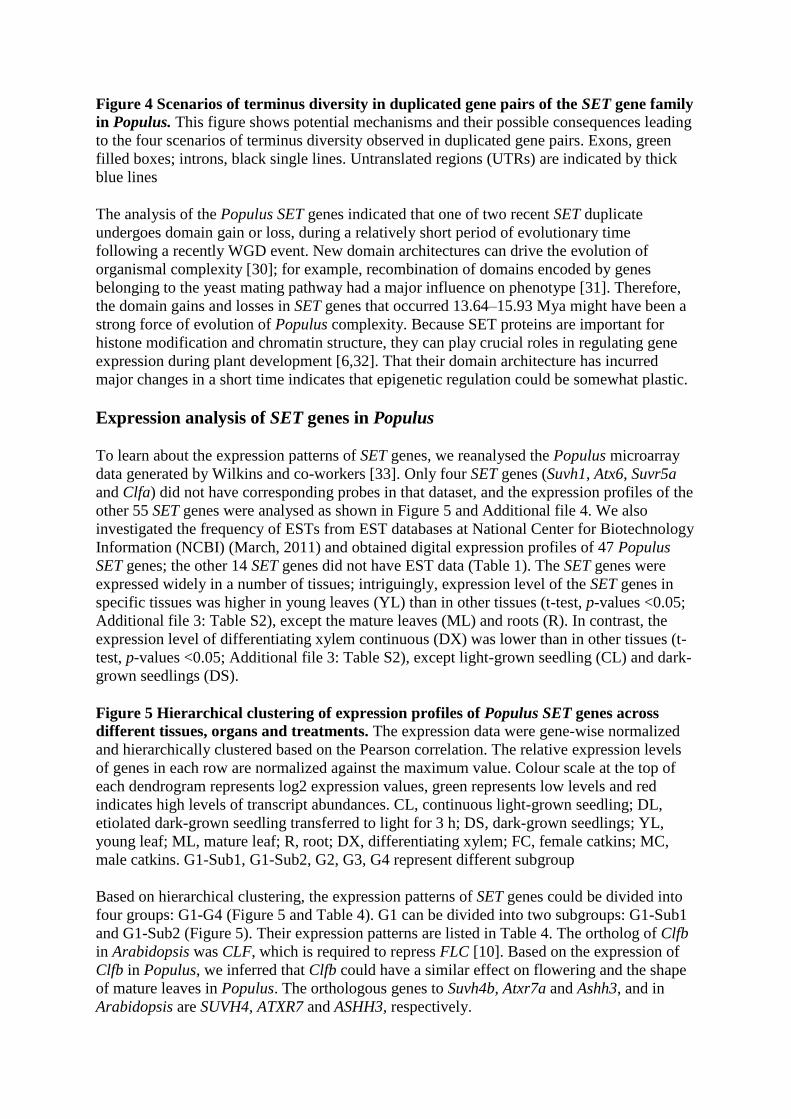
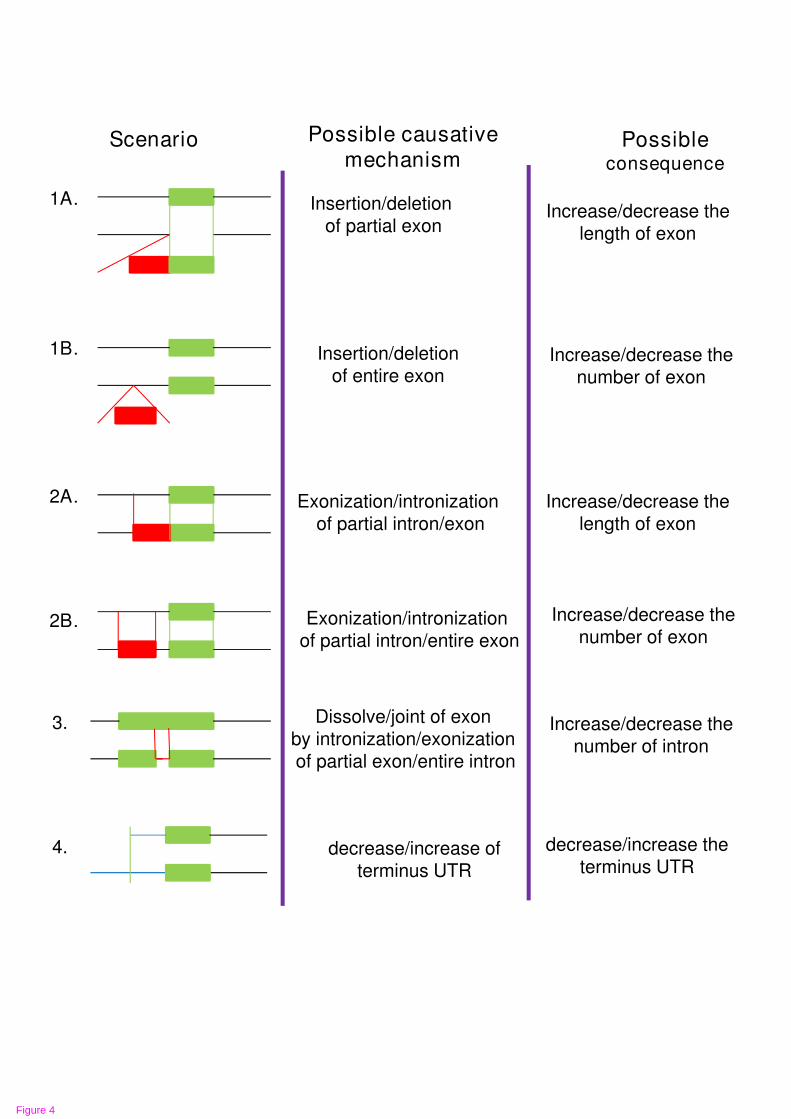
Figure 4 Scenarios of terminus diversity in duplicated gene pairs of the SET gene family
in Populus. This figure shows potential mechanisms and their possible consequences leading
to the four scenarios of terminus diversity observed in duplicated gene pairs. Exons, green
filled boxes; introns, black single lines. Untranslated regions (UTRs) are indicated by thick
blue lines
The analysis of the Populus SET genes indicated that one of two recent SET duplicate
undergoes domain gain or loss, during a relatively short period of evolutionary time
following a recently WGD event. New domain architectures can drive the evolution of
organismal complexity [30]; for example, recombination of domains encoded by genes
belonging to the yeast mating pathway had a major influence on phenotype [31]. Therefore,
the domain gains and losses in SET genes that occurred 13.64–15.93 Mya might have been a
strong force of evolution of Populus complexity. Because SET proteins are important for
histone modification and chromatin structure, they can play crucial roles in regulating gene
expression during plant development [6,32]. That their domain architecture has incurred
major changes in a short time indicates that epigenetic regulation could be somewhat plastic.
Expression analysis of SET genes in Populus
To learn about the expression patterns of SET genes, we reanalysed the Populus microarray
data generated by Wilkins and co-workers [33]. Only four SET genes (Suvh1, Atx6, Suvr5a
and Clfa) did not have corresponding probes in that dataset, and the expression profiles of the
other 55 SET genes were analysed as shown in Figure 5 and Additional file 4. We also
investigated the frequency of ESTs from EST databases at National Center for Biotechnology
Information (NCBI) (March, 2011) and obtained digital expression profiles of 47 Populus
SET genes; the other 14 SET genes did not have EST data (Table 1). The SET genes were
expressed widely in a number of tissues; intriguingly, expression level of the SET genes in
specific tissues was higher in young leaves (YL) than in other tissues (t-test, p-values <0.05;
Additional file 3: Table S2), except the mature leaves (ML) and roots (R). In contrast, the
expression level of differentiating xylem continuous (DX) was lower than in other tissues (t-
test, p-values <0.05; Additional file 3: Table S2), except light-grown seedling (CL) and dark-
grown seedlings (DS).
Figure 5 Hierarchical clustering of expression profiles of Populus SET genes across
different tissues, organs and treatments. The expression data were gene-wise normalized
and hierarchically clustered based on the Pearson correlation. The relative expression levels
of genes in each row are normalized against the maximum value. Colour scale at the top of
each dendrogram represents log2 expression values, green represents low levels and red
indicates high levels of transcript abundances. CL, continuous light-grown seedling; DL,
etiolated dark-grown seedling transferred to light for 3 h; DS, dark-grown seedlings; YL,
young leaf; ML, mature leaf; R, root; DX, differentiating xylem; FC, female catkins; MC,
male catkins. G1-Sub1, G1-Sub2, G2, G3, G4 represent different subgroup
Based on hierarchical clustering, the expression patterns of SET genes could be divided into
four groups: G1-G4 (Figure 5 and Table 4). G1 can be divided into two subgroups: G1-Sub1
and G1-Sub2 (Figure 5). Their expression patterns are listed in Table 4. The ortholog of Clfb
in Arabidopsis was CLF, which is required to repress FLC [10]. Based on the expression of
Clfb in Populus, we inferred that Clfb could have a similar effect on flowering and the shape
of mature leaves in Populus. The orthologous genes to Suvh4b, Atxr7a and Ashh3, and in
Arabidopsis are SUVH4, ATXR7 and ASHH3, respectively.
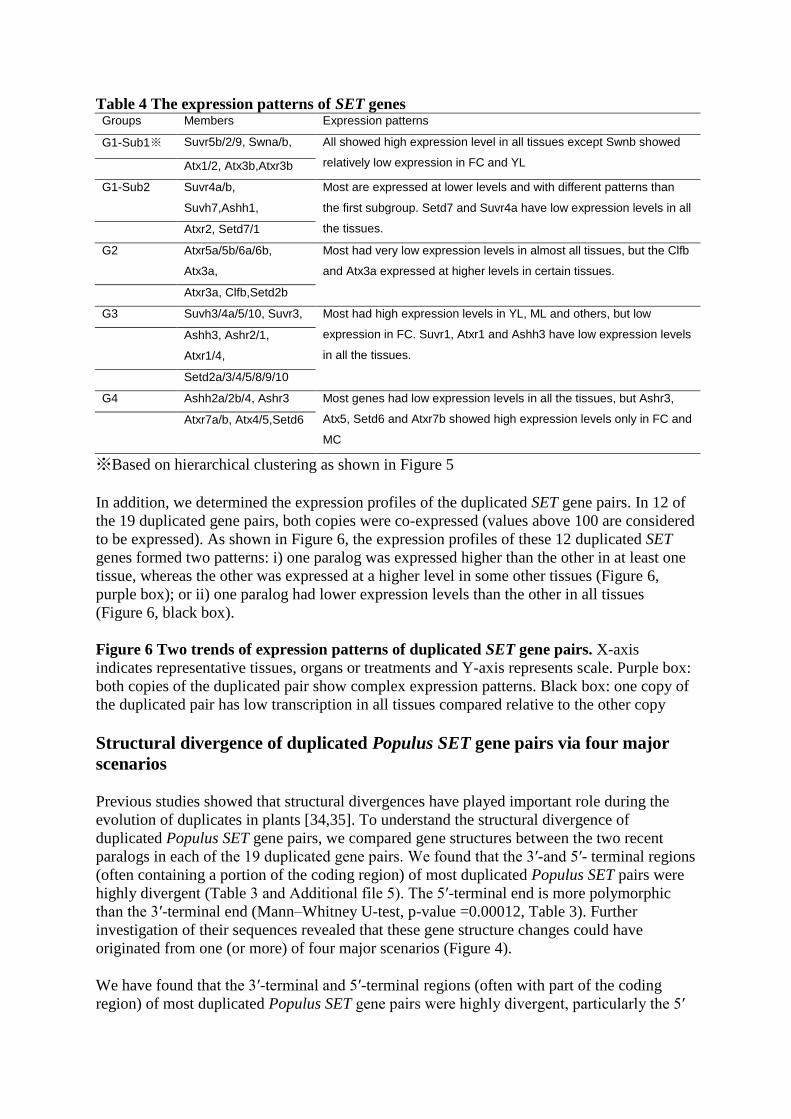
Table 4 The expression patterns of SET genes Groups Members Expression patterns
G1-Sub1※ Suvr5b/2/9, Swna/b, All showed high expression level in all tissues except Swnb showed
relatively low expression in FC and YL Atx1/2, Atx3b,Atxr3b
G1-Sub2 Suvr4a/b,
Suvh7,Ashh1,
Most are expressed at lower levels and with different patterns than
the first subgroup. Setd7 and Suvr4a have low expression levels in all
the tissues. Atxr2, Setd7/1
G2 Atxr5a/5b/6a/6b,
Atx3a,
Most had very low expression levels in almost all tissues, but the Clfb
and Atx3a expressed at higher levels in certain tissues.
Atxr3a, Clfb,Setd2b
G3 Suvh3/4a/5/10, Suvr3, Most had high expression levels in YL, ML and others, but low
expression in FC. Suvr1, Atxr1 and Ashh3 have low expression levels
in all the tissues.
Ashh3, Ashr2/1,
Atxr1/4,
Setd2a/3/4/5/8/9/10
G4 Ashh2a/2b/4, Ashr3 Most genes had low expression levels in all the tissues, but Ashr3,
Atx5, Setd6 and Atxr7b showed high expression levels only in FC and
MC
Atxr7a/b, Atx4/5,Setd6
※Based on hierarchical clustering as shown in Figure 5
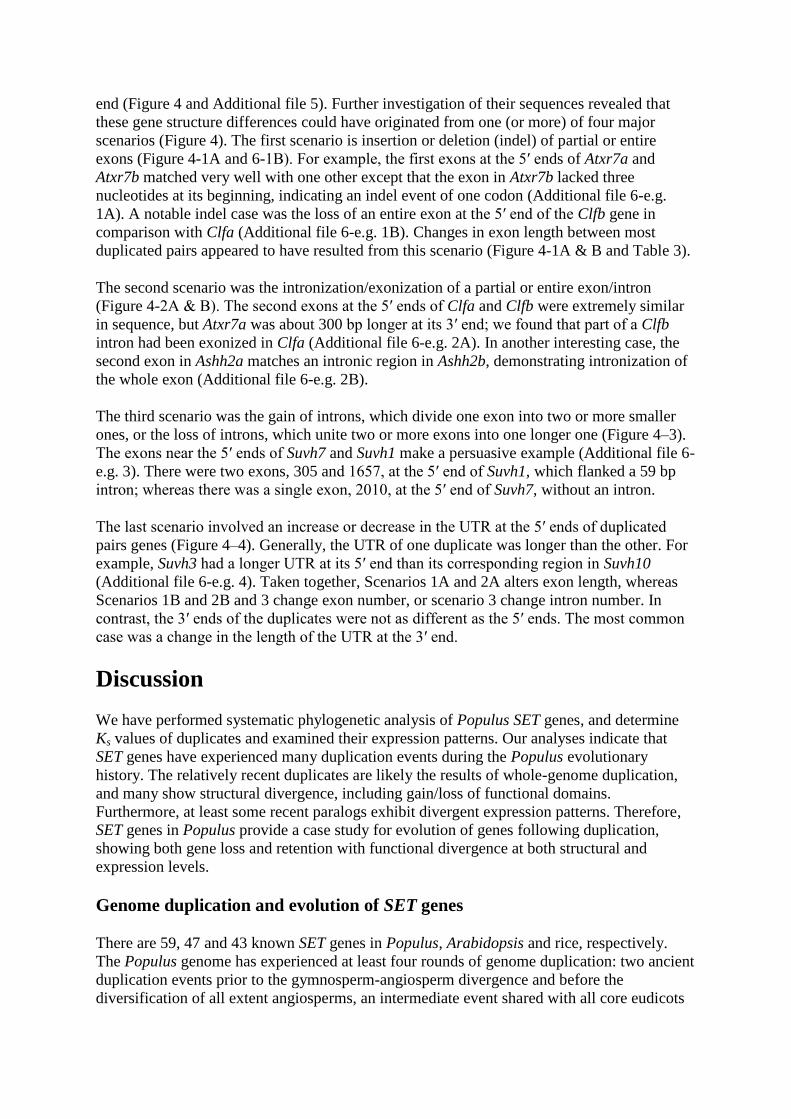
In addition, we determined the expression profiles of the duplicated SET gene pairs. In 12 of
the 19 duplicated gene pairs, both copies were co-expressed (values above 100 are considered
to be expressed). As shown in Figure 6, the expression profiles of these 12 duplicated SET
genes formed two patterns: i) one paralog was expressed higher than the other in at least one
tissue, whereas the other was expressed at a higher level in some other tissues (Figure 6,
purple box); or ii) one paralog had lower expression levels than the other in all tissues
(Figure 6, black box).
Figure 6 Two trends of expression patterns of duplicated SET gene pairs. X-axis
indicates representative tissues, organs or treatments and Y-axis represents scale. Purple box:
both copies of the duplicated pair show complex expression patterns. Black box: one copy of
the duplicated pair has low transcription in all tissues compared relative to the other copy
Structural divergence of duplicated Populus SET gene pairs via four major
scenarios
Previous studies showed that structural divergences have played important role during the
evolution of duplicates in plants [34,35]. To understand the structural divergence of
duplicated Populus SET gene pairs, we compared gene structures between the two recent
paralogs in each of the 19 duplicated gene pairs. We found that the 3′-and 5′- terminal regions
(often containing a portion of the coding region) of most duplicated Populus SET pairs were
highly divergent (Table 3 and Additional file 5). The 5′-terminal end is more polymorphic
than the 3′-terminal end (Mann–Whitney U-test, p-value =0.00012, Table 3). Further
investigation of their sequences revealed that these gene structure changes could have
originated from one (or more) of four major scenarios (Figure 4).
We have found that the 3′-terminal and 5′-terminal regions (often with part of the coding
region) of most duplicated Populus SET gene pairs were highly divergent, particularly the 5′
end (Figure 4 and Additional file 5). Further investigation of their sequences revealed that
these gene structure differences could have originated from one (or more) of four major
scenarios (Figure 4). The first scenario is insertion or deletion (indel) of partial or entire
exons (Figure 4-1A and 6-1B). For example, the first exons at the 5′ ends of Atxr7a and
Atxr7b matched very well with one other except that the exon in Atxr7b lacked three
nucleotides at its beginning, indicating an indel event of one codon (Additional file 6-e.g.
1A). A notable indel case was the loss of an entire exon at the 5′ end of the Clfb gene in
comparison with Clfa (Additional file 6-e.g. 1B). Changes in exon length between most
duplicated pairs appeared to have resulted from this scenario (Figure 4-1A & B and Table 3).
The second scenario was the intronization/exonization of a partial or entire exon/intron
(Figure 4-2A & B). The second exons at the 5′ ends of Clfa and Clfb were extremely similar
in sequence, but Atxr7a was about 300 bp longer at its 3′ end; we found that part of a Clfb
intron had been exonized in Clfa (Additional file 6-e.g. 2A). In another interesting case, the
second exon in Ashh2a matches an intronic region in Ashh2b, demonstrating intronization of
the whole exon (Additional file 6-e.g. 2B).
The third scenario was the gain of introns, which divide one exon into two or more smaller
ones, or the loss of introns, which unite two or more exons into one longer one (Figure 4–3).
The exons near the 5′ ends of Suvh7 and Suvh1 make a persuasive example (Additional file 6-
e.g. 3). There were two exons, 305 and 1657, at the 5′ end of Suvh1, which flanked a 59 bp
intron; whereas there was a single exon, 2010, at the 5′ end of Suvh7, without an intron.
The last scenario involved an increase or decrease in the UTR at the 5′ ends of duplicated
pairs genes (Figure 4–4). Generally, the UTR of one duplicate was longer than the other. For
example, Suvh3 had a longer UTR at its 5′ end than its corresponding region in Suvh10
(Additional file 6-e.g. 4). Taken together, Scenarios 1A and 2A alters exon length, whereas
Scenarios 1B and 2B and 3 change exon number, or scenario 3 change intron number. In
contrast, the 3′ ends of the duplicates were not as different as the 5′ ends. The most common
case was a change in the length of the UTR at the 3′ end.
Discussion
We have performed systematic phylogenetic analysis of Populus SET genes, and determine
Ks values of duplicates and examined their expression patterns. Our analyses indicate that
SET genes have experienced many duplication events during the Populus evolutionary
history. The relatively recent duplicates are likely the results of whole-genome duplication,
and many show structural divergence, including gain/loss of functional domains.
Furthermore, at least some recent paralogs exhibit divergent expression patterns. Therefore,
SET genes in Populus provide a case study for evolution of genes following duplication,
showing both gene loss and retention with functional divergence at both structural and
expression levels.
Genome duplication and evolution of SET genes
There are 59, 47 and 43 known SET genes in Populus, Arabidopsis and rice, respectively.
The Populus genome has experienced at least four rounds of genome duplication: two ancient
duplication events prior to the gymnosperm-angiosperm divergence and before the
diversification of all extent angiosperms, an intermediate event shared with all core eudicots
plants, and a recent event occurring after the divergence of the lineages leading to Populus
and Arabidopsis [22,23,25]. Our analysis suggested that, of the 19 duplicated pairs of
adjacent Populus SET genes on the phylogenetic tree, all resulted from the recent WGD
event. Among older duplicates prior to the split of Populus and Arabidopsis, one or two Suv
pairs and one Atx pair likely resulted from the core eudicot WGD, and possibly others from
older WGDs. Given that at least four rounds of WGD are known in the Populus lineage,
many genes loss within the SET gene family appears to have occurred in Populus. The
Arabidopsis lineage has experienced two WGD events since its split from the Populus
lineage and has lost many of the duplicates [36]. Our investigation of Arabidopsis SET genes
revealed five duplicated gene pairs since its divergence from Populus. These five pairs had
average Ks values between 0.1817–0.2319, with estimated dates between 27.27–28.78 Mya
for the duplication, corresponding to a recent WGD in Arabidopsis [22,23]. Furthermore,
soybean has experienced one more WGD event than Populus since its split with the Populus
lineage, and it has 25 more SET genes than Populus. Most of the increased soybean SET gene
number resulted from the recent WGD (data not shown). Therefore, the expansions in the
SET gene family in Arabidopsis, Populus, and soybean could be explained by gene loss and
gain after WGD events.
An increase in the number of regulatory genes (i.e. transcriptional and developmental
regulators) is one of important factors that facilitated the evolution of more complex
developmental systems [36]. Maere et al. estimated that more than 90% of the increases in
Arabidopsis regulatory genes were likely caused by genome duplications during the last 150
million years [37]. Our results suggest that WGD could be the main mechanism for the
expansion of the SET gene family in Populus, consistent with this idea. To date, many studies
have shown that many members of transcriptional factor (TF) gene families survive after
WGD events [33,36,38], but few papers report on epigenetic regulatory gene families. SET
genes are important epigenetic regulatory gene and have been largely retained after WGDs.
Epigenetic regulators modulate expression of a large number of functionally related genes.
Therefore, our study suggests that more basic regulatory gene families could have
evolutionary mechanisms similar to TF genes, which might contribute to the evolution of
gene networks and provide insight into chromatin regulatory evolution.
Expression profiles of SET genes and functional diversity of duplicated pairs
in Populus
We investigated Populus microarray and EST data and found that most SET genes are
expressed relatively widely, suggesting that the Populus SET genes that have survived after
WGD events are likely functional. Similarly, almost all Arabidopsis and soybean SET genes
were expressed (Additional file 3: Tables S3, S4), again suggesting that these SET genes have
functions.
According to the expression patterns of Populus genes and the functions of their Arabidopsis
orthologues, we could hypothesize possible functions of these genes in Populus. For
example, the orthologue of Swnb in Arabidopsis is SWN, which is involved in H3K27
trimethylation at important floral and shoot developmental genes, including AGAMOUS and
SHOOT MERISTEMLESS (STM) [39]. Therefore, Swnb might have a function similar to
SWN in regulating Populus flower and shoot development. However, some SET genes were
specific to Populus, for example, Suvr4a, Suvr4b, Atx3a, and Atx3b. All of these genes have
abundant transcripts in Populus and are expressed at different levels in different tissues.
These results suggest that their counterparts in Arabidopsis have been lost and the functions
are either not needed in Arabidopsis or performed by other genes.
Interestingly, one of the greatest differences between the Populus SET genes and Arabidopsis
SET genes is that there are 19 duplicated Populus SET gene pairs but only five Arabidopsis
SET gene pairs. In 12 of the 19 duplicated gene pairs, both copies of were expressed, with
two types of expression patterns.
The first type is that one copy was expressed at higher levels than the other in one or more
tissues, but the other copy was higher in some other tissue(s) (Figure 6, purple boxes). For
example, Ashh2a and Ashh2b corresponded to ASHH2 in Arabidopsis, which negatively
regulates shoot branching [40]. The Ashh2a and Ashh2b duplicates in Populus are both
expressed at the same stages and could repress shoot branching in Populus. Swna and Swnb
corresponded to the Arabidopsis SWN, which exhibits partial functional redundancy with
CLF and MEA [6]. Populus is a perennial woody plant with a juvenile-to-mature phase
change, so its flowering processes is different from that of Arabidopsis and may require two
duplicates with somewhat different functions to regulate these processes.
The second type is that one duplicate was expressed at higher levels than the other in all
tissues (Figure 6, black boxes), suggesting that ther former has a stronger function than the
latter. The Arabidopsis ATXR3 gene corresponds to the poplar Atxr3a and Atxr3b. ATXR3
mutants are smaller with curly leaves, short roots, early flowering, and female sterility
[12,13]. The closest Populus homologues of ATXR3 may also play important roles in
regulating broad developmental processes, consistent with one duplicate having wide-ranging
high level expression. Similarly, the fact that Arabidopsis SUVH4 is responsible for the
majority of H3K9 dimethylation in heterochromatin and affects the number of floral organs
and the expression of PHOSPHOANTHRINILATE ISOMERASE (PAI) [6] suggests that the
Populus homologues Suvh4a and Suvh4b could also regulate multiple developmental
processes.
The two different expression patterns in different tissues of the 12 duplicated gene pairs
suggest functional diversification and possible function redundancy (or gene silencing),
respectively. Many models for the evolution of gene duplications have been proposed in the
past nearly four decades [41]. Recently, divergence in expression between duplicates has also
been examined for Arabidopsis regulatory genes [42]. The first pattern may support the
duplication-degeneration-complementation (DDC) model, in which divergent expression in
different tissues allows functional differentiation of the duplicates and finally lead to
subfunctionalization or neofunctionalization [43,44]. On the other hand, the latter pattern
might suggest functional reduction for one copy (hypofunctionalization), before the weak
copy is completely lost (nonefunctionalization) [41,45,46].
Conclusions
We have shown that Populus has gained additional SET genes compared with its common
ancestor with Arabidopsis, due to a WGD since the divergence from the lineage leading to
Arabidopsis. Those duplicates that have been retained show divergence in both coding
regions and expression levels, suggesting that the SET genes might have experienced
functional diversification, including possible subfunctionalization. The increased number of
SET genes with potentially distinct functions could have supported the evolution of
epigenetic gene regulation of a woody perennial that is more complex than that of an
herbaceous annual.
Methods
Database search for SET genes
The complete genome and predicted proteomes sequence of Populus was obtained from the
JGI (http://genome.jgi-psf.org/Poptr1_1/Poptr1_1.home.html) database [22].. To identify all
genes for proteins containing SET domains in Populus, the SET domain PF00856 model
from the Pfam database [47,48] was used to perform a local search of the Populus predicted
proteomes using the HMMER program (2.3.2) [49]. To find genes for similar proteins from
unannotated genomic regions, the identified proteins sequences (domains) were used as
queries for a gene search against the Populus genome sequence using a newly developed
software, Phoenix (Protein Homologue Extraction, Sun et al., unpublished). An e-value cutoff
value of 1e-5 was used for further analysis. SET protein genes from Arabidopsis were
obtained as described by Zhang et al. [15].
Multiple sequence alignment, gene structure and protein architecture analyses
Multiple sequence alignment using MUSCLE with default parameters [50] was performed on
SET proteins, and the alignment was subsequently adjusted manually. Gene structure
information, including the intron/exon distribution pattern, was obtained by GSDS (Gene
Structure Display Server), developed by CBI [51]. Structural motif annotation was performed
using the SMART (http://smart.embl-heidelberg.de) and Pfam (http://pfam.sanger.ac.uk)
databases.
Genome localization and syntenic analysis of SET genes
Information on chromosomal location was gathered from the Populus genome browser.
MapInspect (www.dpw.wau.nl/pv/PUB/MapComp) was used to map the SET genes onto
chromosomes. Syntenic information was collected from the Plant Genome Duplication
Database (PGDD: http://chibba.agtec.uga.edu/duplication) [23,26].
Calculating Ks and dating the duplication event
Protein amino acid sequences of all the duplicated gene pairs from Populus were aligned
using MUSCLE with default parameters [50], and the results were used to guide the
alignments of DNA coding sequences (CDS) by Pal2Nal [52]. Ks and Ka, the number of
synonymous and nonsynonymous substitutions per site, were determined using the aligned
CDS by yn00 in PAML 4.3 [53].
In dating segmental duplication events, the approximate date of the duplication event was
calculated using the mean Ks values from T = Ks/2λ, where the clock-like rate (λ) for Populus
was 9.1 × 10⁻⁹
[54]. Similarly, the average Ks of all the duplicated SET gene pairs from
Populus and Arabidopsis was calculated by the same method, where the clock-like rate (λ)
for Arabidopsis was 1.5 × 10⁻⁸
.
Tree building
Phylogenetic trees for the aligned SET protein sequences were constructed using NJ, ML,
and BI methods. The NJ tree was constructed using MEGA [55] with the “pairwise deletion”
option and “Poisson correction” model. Bootstrap support was estimated from 1000 replicates
to evaluate the reliability of internal branches. ML trees were generated using PhyML version
3.0.1, with 100 nonparametric bootstrap replicates and WAG model [56]. MrBayes software
[57] was used to construct BI trees, using the WAG model of evolution, after running for
1,000,000 generations, with four Markov chains sampled every 1000 generations.
Gene expression analysis
To search for SET genes from Populus ESTs, we used the Populus SET CDS as query
sequences to search for highly similar ESTs sequences (at least 160 bp and 95% identity) in
Populus using the NCBI database. We also analyzed the public microarray dataset of Populus
[33]; we normalized and hierarchically clustered them based on Pearson coefficients with
average linkage in the MeV (version 4.8) program [58]. Furthermore, we also got the RNA-
seq dataset of soybean [59].
Abbreviations
K, Lysine; ML, Maximum likelihood; BI, Bayesian inference; NJ, Neighbour-Joining; Mya,
Million years ago; WGD, Whole-genome duplication; PGDD, Plant genome duplication
database; TF, Transcriptional factor; EST, Expressed sequence tag; NCBI, National center for
biotechnology Information; UTR, Untranslated region; Ks, Synonymous substitutions rate, Ka,
Non-synonymous substitution rate.
Authors’ contributions
LSZ and LL conceived the study and performed the analyses. LL and LSZ wrote the
manuscript. HM provided support for the study, contributed to the discussion and revised the
manuscript. SLZ revised the manuscript and contributed to discussion. All authors read and
approved the final manuscript.
Acknowledgements
We would like to thank Drs. Fei He, Jinyong Hu, Zhenguo Lin and Zhenguo Zhang for
comments on the manuscript and helpful discussions. This work was supported by the
National Natural Science Foundation of China (91131007).
References
1. Bannister AJ, Kouzarides T: Regulation of chromatin by histone modifications. Cell Res
2011, 21:381–395.
2. Dillon SC, Zhang X, Trievel RC, Cheng X: The SET-domain protein superfamily:
protein lysine methyltransferases. Genome Biol 2005, 6:227.
3. Feng Q, Wang H, Ng HH, Erdjument-Bromage H, Tempst P, Struhl K, Zhang Y:
Methylation of H3-lysine 79 is mediated by a new family of HMTases without a SET
domain. Curr Biol 2002, 12:1052–1058.
4. Mujtaba S, Manzur KL, Gurnon JR, Kang M, Van Etten JL, Zhou MM: Epigenetic
transcriptional repression of cellular genes by a viral SET protein. Nat Cell Biol 2008,
10:1114–1122.
5. Alvarez-Venegas R, Sadder M, Tikhonov A, Avramova Z: Origin of the bacterial SET
domain genes: vertical or horizontal? Mol Biol Evol 2007, 24:482–497.
6. Liu C, Lu F, Cui X, Cao X: Histone methylation in higher plants. Annu Rev Plant Biol
2010, 61:395–420.
7. Goodrich J, Puangsomlee P, Martin M, Long D, Meyerowitz EM, Coupland G: A
Polycomb-group gene regulates homeotic gene expression in Arabidopsis. Nature 1997,
386:44–51.
8. Alvarez-Venegas R, Pien S, Sadder M, Witmer X, Grossniklaus U, Avramova Z: ATX-1,
an Arabidopsis homolog of trithorax, activates flower homeotic genes. Curr Biol 2003,
13:627–637.
9. Tamada Y, Yun JY, Woo SC, Amasino RM: ARABIDOPSIS TRITHORAX-RELATED7
is required for methylation of lysine 4 of histone H3 and for transcriptional activation of FLOWERING LOCUS C. Plant Cell 2009, 21:3257–3269.
10. Zhao Z, Yu Y, Meyer D, Wu C, Shen WH: Prevention of early flowering by expression
of FLOWERING LOCUS C requires methylation of histone H3 K36. Nat Cell Biol 2005,
7:1256–1260.
11. Grossniklaus U, Vielle-Calzada JP, Hoeppner MA, Gagliano WB: Maternal control of
embryogenesis by MEDEA, a polycomb group gene in Arabidopsis. Science 1998,
280:446–450.
12. Guo L, Yu Y, Law JA, Zhang X: SET DOMAIN GROUP2 is the major histone H3
lysine 4 trimethyltransferase in Arabidopsis. Proc Natl Acad Sci U S A 2010, 107:18557–
18562.
13. Berr A, McCallum EJ, Menard R, Meyer D, Fuchs J, Dong A, Shen WH: Arabidopsis
SET DOMAIN GROUP2 is required for H3K4 trimethylation and is crucial for both
sporophyte and gametophyte development. Plant Cell 2010, 22:3232–3248.
14. Aquea F, Vega A, Timmermann T, Poupin MJ, Arce-Johnson P: Genome-wide analysis
of the SET DOMAIN GROUP family in grapevine. Plant Cell Rep 2011, 30:1087–1097.
15. Zhang LS, Ma CR, Ji Q, Wang YF: Genome-wide identification, classification and
expression analyses of SET domain gene family in Arabidopsis and rice. Yi Chuan 2009,
31:186–198.

16. Ng DW, Wang T, Chandrasekharan MB, Aramayo R, Kertbundit S, Hall TC: Plant SET
domain-containing proteins: structure, function and regulation. Biochim Biophys Acta
2007, 1769:316–329.
17. Baumbusch LO, Thorstensen T, Krauss V, Fischer A, Naumann K, Assalkhou R, Schulz
I, Reuter G, Aalen RB: The Arabidopsis thaliana genome contains at least 29 active genes
encoding SET domain proteins that can be assigned to four evolutionarily conserved
classes. Nucleic Acids Res 2001, 29:4319–4333.
18. Springer NM, Napoli CA, Selinger DA, Pandey R, Cone KC, Chandler VL, Kaeppler HF,
Kaeppler SM: Comparative analysis of SET domain proteins in maize and Arabidopsis
reveals multiple duplications preceding the divergence of monocots and dicots. Plant
Physiol 2003, 132:907–925.
19. Naumann K, Fischer A, Hofmann I, Krauss V, Phalke S, Irmler K, Hause G, Aurich AC,
Dorn R, Jenuwein T, Reuter G: Pivotal role of AtSUVH2 in heterochromatic histone
methylation and gene silencing in Arabidopsis. EMBO J 2005, 24:1418–1429.
20. Jansson S, Douglas CJ: Populus: a model system for plant biology. Annu Rev Plant Biol
2007, 58:435–458.
21. Brunner AM, Busov VB, Strauss SH: Poplar genome sequence: functional genomics in
an ecologically dominant plant species. Trends Plant Sci 2004, 9:49–56.
22. Tuskan GA, Difazio S, Jansson S, Bohlmann J, Grigoriev I, Hellsten U, Putnam N, Ralph
S, Rombauts S, Salamov A, et al: The genome of black cottonwood, Populus trichocarpa
(Torr. & Gray). Science 2006, 313:1596–1604.
23. Tang H, Wang X, Bowers JE, Ming R, Alam M, Paterson AH: Unraveling ancient
hexaploidy through multiply-aligned angiosperm gene maps. Genome Res 2008,
18:1944–1954.
24. Feng S, Jacobsen SE: Epigenetic modifications in plants: an evolutionary perspective.
Curr Opin Plant Biol 2011, 14:179–186.
25. Jiao Y, Wickett NJ, Ayyampalayam S, Chanderbali AS, Landherr L, Ralph PE, Tomsho
LP, Hu Y, Liang H, Soltis PS, et al: Ancestral polyploidy in seed plants and angiosperms.
Nature 2011, 473:97–100.
26. Tang H, Bowers JE, Wang X, Ming R, Alam M, Paterson AH: Synteny and collinearity
in plant genomes. Science 2008, 320:486–488.
27. Chothia C, Gough J, Vogel C, Teichmann SA: Evolution of the protein repertoire.
Science 2003, 300:1701–1703.
28. Bashton M, Chothia C: The generation of new protein functions by the combination
of domains. Structure 2007, 15:85–99.
29. Zhu X, Ma H, Chen Z: Phylogenetics and evolution of Su(var)3-9 SET genes in land
plants: rapid diversification in structure and function. BMC Evol Biol 2011, 11:63.
30. Babushok DV, Ostertag EM, Kazazian HH Jr: Current topics in genome evolution:
molecular mechanisms of new gene formation. Cell Mol Life Sci 2007, 64:542–554.
31. Peisajovich SG, Garbarino JE, Wei P, Lim WA: Rapid diversification of cell signaling
phenotypes by modular domain recombination. Science 2010, 328:368–372.
32. Pontvianne F, Blevins T, Pikaard CS: Arabidopsis histone lysine methyltransferases.
Adv Bot Res 2010, 53:1–22.
33. Wilkins O, Nahal H, Foong J, Provart NJ, Campbell MM: Expansion and
diversification of the Populus R2R3-MYB family of transcription factors. Plant Physiol
2009, 149:981–993.
34. Xu G, Ma H, Nei M, Kong H: Evolution of F-box genes in plants: different modes of
sequence divergence and their relationships with functional diversification. Proc Natl
Acad Sci U S A 2009, 106:835–840.
35. Xu G, Guo C, Shan H, Kong H: Divergence of duplicate genes in exon-intron
structure. Proc Natl Acad Sci U S A 2012, 109:1187–1192.
36. Proost S, Pattyn P, Gerats T, Van de Peer Y: Journey through the past: 150 million
years of plant genome evolution. Plant J 2011, 66:58–65.
37. Maere S, De Bodt S, Raes J, Casneuf T, Van Montagu M, Kuiper M, Van de Peer Y:
Modeling gene and genome duplications in eukaryotes. Proc Natl Acad Sci U S A 2005,
102:5454–5459.
38. Van de Peer Y, Maere S, Meyer A: The evolutionary significance of ancient genome
duplications. Nat Rev Genet 2009, 10:725–732.
39. Schubert D, Primavesi L, Bishopp A, Roberts G, Doonan J, Jenuwein T, Goodrich J:
Silencing by plant Polycomb-group genes requires dispersed trimethylation of histone
H3 at lysine 27. EMBO J 2006, 25:4638–4649.
40. Dong G, Ma DP, Li J: The histone methyltransferase SDG8 regulates shoot
branching in Arabidopsis. Biochem Biophys Res Commun 2008, 373:659–664.
41. Innan H, Kondrashov F: The evolution of gene duplications: classifying and
distinguishing between models. Nat Rev Genet 2010, 11:97–108.
42. Duarte JM, Cui L, Wall PK, Zhang Q, Zhang X, Leebens-Mack J, Ma H, Altman N,
dePamphilis CW: Expression pattern shifts following duplication indicative of
subfunctionalization and neofunctionalization in regulatory genes of Arabidopsis. Mol
Biol Evol 2006, 23:469–478.
43. Force A, Lynch M, Pickett FB, Amores A, Yan YL, Postlethwait J: Preservation of
duplicate genes by complementary, degenerative mutations. Genetics 1999, 151:1531–
1545.
44. Liu SL, Baute GJ, Adams KL: Organ and cell type-specific complementary expression
patterns and regulatory neofunctionalization between duplicated genes in Arabidopsis
thaliana. Genome Biol Evol 2011, 3:1419–1436.
45. Papp B, Pal C, Hurst LD: Dosage sensitivity and the evolution of gene families in
yeast. Nature 2003, 424:194–197.
46. Qian W, Liao BY, Chang AY, Zhang J: Maintenance of duplicate genes and their
functional redundancy by reduced expression. Trends Genet 2010, 26:425–430.
47. Finn RD, Tate J, Mistry J, Coggill PC, Sammut SJ, Hotz HR, Ceric G, Forslund K, Eddy
SR, Sonnhammer EL, Bateman A: The Pfam protein families database. Nucleic Acids Res
2008, 36:D281–D288.
48. Finn RD, Mistry J, Schuster-Bockler B, Griffiths-Jones S, Hollich V, Lassmann T,
Moxon S, Marshall M, Khanna A, Durbin R, et al: Pfam: clans, web tools and services.
Nucleic Acids Res 2006, 34:D247–D251.
49. Eddy SR: Profile hidden Markov models. Bioinformatics 1998, 14:755–763.
50. Edgar RC: MUSCLE: a multiple sequence alignment method with reduced time and
space complexity. BMC Bioinformatics 2004, 5:113.
51. Guo AY, Zhu QH, Chen X, Luo JC: GSDS: a gene structure display server. Yi Chuan
2007, 29:1023–1026.
52. Suyama M, Torrents D, Bork P: PAL2NAL: robust conversion of protein sequence
alignments into the corresponding codon alignments. Nucleic Acids Res 2006, 34:W609–
W612.
53. Yang Z: PAML 4: phylogenetic analysis by maximum likelihood. Mol Biol Evol 2007,
24:1586–1591.
54. Lynch M, Conery JS: The evolutionary fate and consequences of duplicate genes.
Science 2000, 290:1151–1155.
55. Tamura K, Dudley J, Nei M, Kumar S: MEGA4: Molecular Evolutionary Genetics
Analysis (MEGA) software version 4.0. Mol Biol Evol 2007, 24:1596–1599.
56. Guindon S, Gascuel O: A simple, fast, and accurate algorithm to estimate large
phylogenies by maximum likelihood. Syst Biol 2003, 52:696–704.
57. Ronquist F, Huelsenbeck JP: MrBayes 3: Bayesian phylogenetic inference under
mixed models. Bioinformatics 2003, 19:1572–1574.
58. Saeed AI, Bhagabati NK, Braisted JC, Liang W, Sharov V, Howe EA, Li J, Thiagarajan
M, White JA, Quackenbush J: TM4 microarray software suite. Methods Enzymol 2006,
411:134–193.

59. Severin AJ, Woody JL, Bolon YT, Joseph B, Diers BW, Farmer AD, Muehlbauer GJ,
Nelson RT, Grant D, Specht JE, et al: RNA-Seq Atlas of Glycine max: a guide to the
soybean transcriptome. BMC Plant Biol 2010, 10:160.
Additional files
Additional_file_1 as PDF
Additional file 1. Unrooted phylogenetic trees constructed using (A) ML and (B) BI methods
based on SET amino acid sequences from Populus and Arabidopsis SET proteins
Additional_file_2 as TIFF
Additional file 2. Detailed locations of all duplicated pairs of SET genes in Populus from
recent and ancient polyploidy events in the syntenic region
Additional_file_3 as TIFF
Additional file 3. Table-S1 Ks of SET gene pairs in Suv, Ash, Atxr5, E(z) and Trx
subfamilies. Table-S2 Raw data from microarray expression analyses for Populus SET genes.
Sample abbreviations are defined in Figure 6 and Additional file 4. Table-S3 Raw data from
ESTs for Arabidopsis SET genes. Table-S4 Raw data from transcriptome data for soybean
SET genes
Additional_file_4 as TIFF
Additional file 4. Transcript abundance in different subgroups across different tissues,
organs, and treatments in Populus based on the genome-wide microarray data. Sample
abbreviations are defined in Figure 6
Additional_file_5 as TIFF
Additional file 5. Structure of duplicated gene pairs within the Populus SET gene family.
Exons, green filled boxes; introns, black single lines. UTRs are indicated by thick blue lines
at both ends. Intron phases 0, 1 and 2 are indicated by numbers 0, 1 and 2 in the figure
Additional_file_6 as XLS
Additional file 6. Examples of five scenarios for terminus diversity in duplicated gene pairs
of the SET family in Populus. This number corresponds to the one in Figure 6, and the red
box represents the location of the mutations causing the patterns
Figure 1
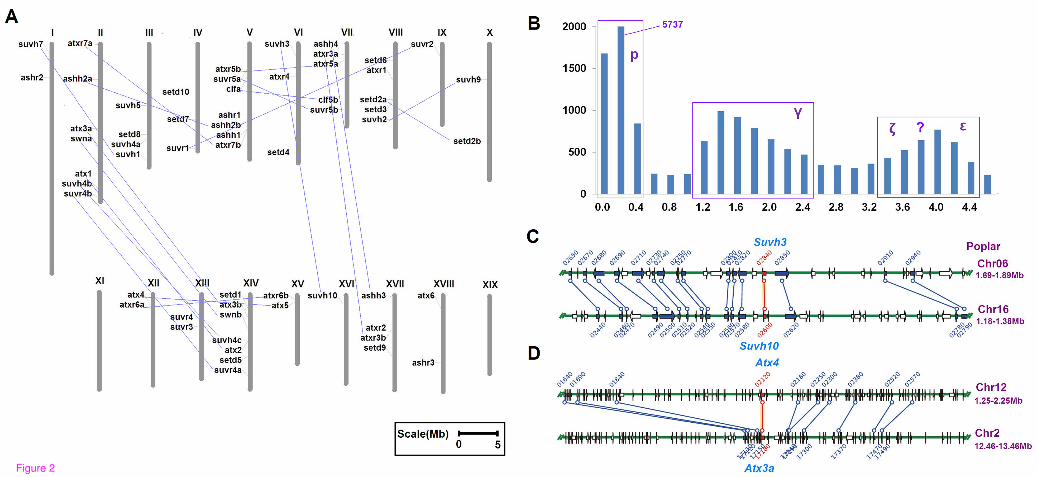
Figure 2
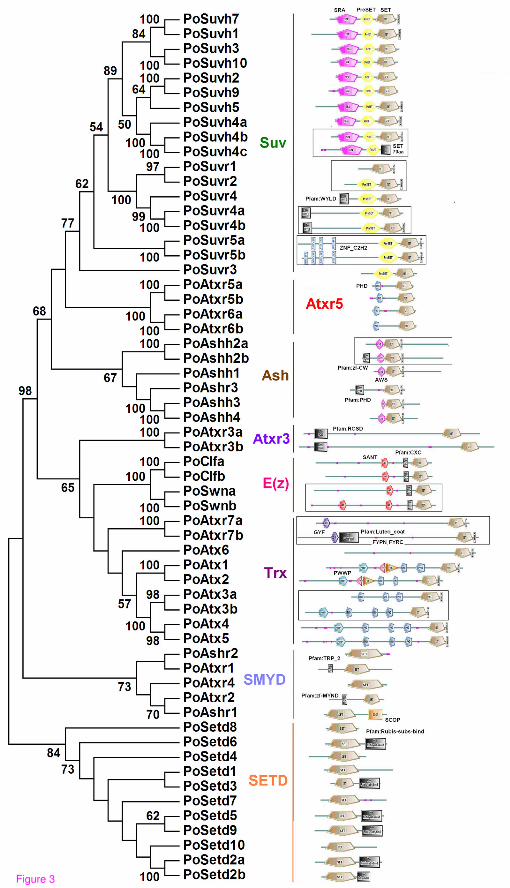
Figure 3
Scenario
1A.
1B.
2A.
2B.
3.
4.
Possibleconsequence
Increase/decrease the
length of exon
Increase/decrease the
number of exon
Increase/decrease the
length of exon
Increase/decrease the
number of exon
Increase/decrease the
number of intron
decrease/increase the
terminus UTR
Insertion/deletion
of partial exon
Insertion/deletion
of entire exon
Exonization/intronization
of partial intron/exon
Exonization/intronization
of partial intron/entire exon
Dissolve/joint of exon
by intronization/exonization
of partial exon/entire intron
decrease/increase of
terminus UTR
Possible causative mechanism
Figure 4
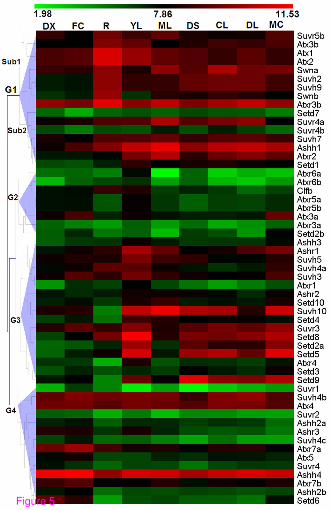
Figure 5
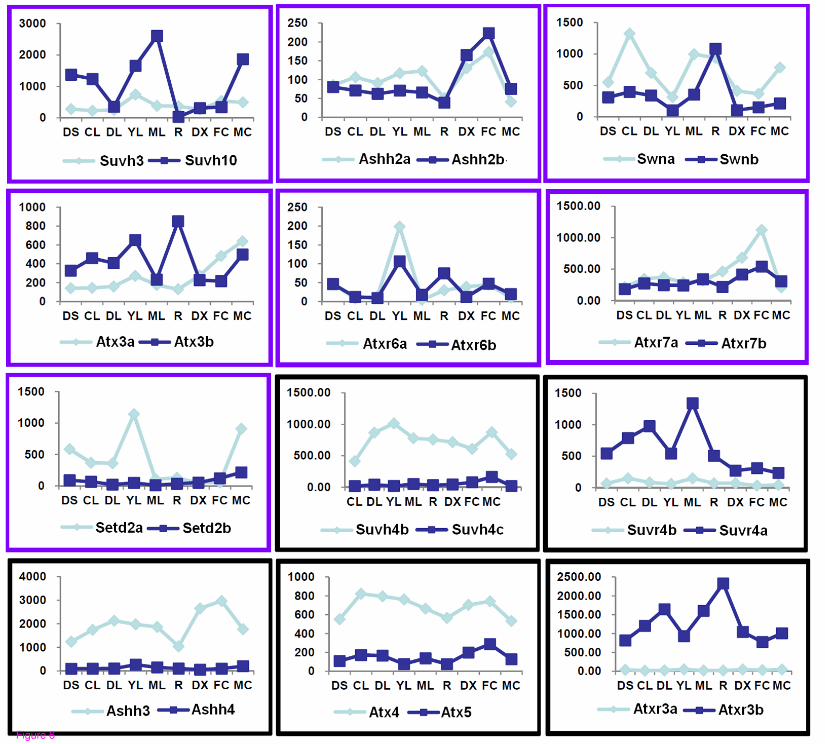
Figure 6

Additional files provided with this submission:
Additional file 1: 2042390764597008_add1.pdf, 39Khttp://www.biomedcentral.com/imedia/7196781071245071/supp1.pdfAdditional file 2: 2042390764597008_add2.tiff, 2776Khttp://www.biomedcentral.com/imedia/1792749951712450/supp2.tiffAdditional file 3: 2042390764597008_add3.xls, 62Khttp://www.biomedcentral.com/imedia/1786064771712450/supp3.xlsAdditional file 4: 2042390764597008_add4.tiff, 372Khttp://www.biomedcentral.com/imedia/9610141971245107/supp4.tiffAdditional file 5: 2042390764597008_add5.tiff, 56Khttp://www.biomedcentral.com/imedia/1885375887712451/supp5.tiffAdditional file 6: 2042390764597008_add6.tiff, 372Khttp://www.biomedcentral.com/imedia/4569714587124512/supp6.tiff