blue water learning academy - michigan.gov · unreserved fund balance $1,279,082 % operating...
TRANSCRIPT

Mission Statement:
Num
ber o
f Stu
dent
s
Student Demographics Racial/ethnic composition 84% White, 6% American
Indian, 6% Hispanic Students receiving free or reduced price lunch 61%
Special education students 0%
Attendance 88%
Student/Teacher Ratio 16:1
Where Do Students Come From? Student Count Trend
School Opened: 09/01/2000 Current Contract Term: 07/01/09 to 06/30/12
Educational Service Provider: Self Managed Authorizer: St. Clair ISD
Teacher/Administrator Demographics
BA/BS MA/MS Other
Teachers in School 100% 0% 0% Teachers in Michigan 38% 61% 1% Administrators in school 100% 0% 0%
Administrators in state 19% 64% 17%
Teacher & Administrator Degrees Foundation Grant $7,316
Unreserved Fund Balance $119,271
% Operating Expenditures Spent on Instruction
56%
Financial Information (08-09)
School State
<1 year 0% 12%
1 to 2 years 0% 9%
3 to 5 years 0% 13%
6 to 15 years 100% 43%
>15 years 0% 23%
Teachers’ longevity in school
School State
<1 year 0% 14%
1 to 2 years 0% 12%
3 to 5 years 0% 13%
6 to 15 years 100% 36%
>15 years 0% 25%
Administrators’ longevity in school
Address Grades Students Made AYP AYP Phase Ed YES! Grade State Ranking for Math/Reading 9541 Phelps, Algonac 7-12 31 No 0 No Grade Not Ranked
BLUE WATER LEARNING ACADEMY

BLUE WATER LEARNING ACADEMY ACHIEVEMENT DATA

Bradford Academy prepares children academically, emotionally, physically, perceptually and socially to become caring, actively involved and productive citizens in a culturally diverse, rapidly changing and highly technological society.
Mission Statement:
Num
ber o
f Stu
dent
s
Student Demographics Racial/ethnic composition 99% Black
Students receiving free or reduced price lunch 72%
Special education students 11%
Attendance 91%
Student/Teacher Ratio 14:1
Where Do Students Come From? Student Count Trend
School Opened: 08/28/2003 Current Contract Term: 07/01/11 to 06/30/12
Educational Service Provider: Choice Schools Associates Authorizer: Bay Mills Community College
Teacher/Administrator Demographics
BA/BS MA/MS Other
Teachers in School 76% 24% 0% Teachers in Michigan 38% 61% 1% Administrators in school 27% 73% 0%
Administrators in state 19% 64% 17%
Teacher & Administrator Degrees Foundation Grant $7,580
Unreserved Fund Balance $1,279,082
% Operating Expenditures Spent on Instruction
44%
Financial Information (08-09)
School State
<1 year 52% 12%
1 to 2 years 28% 9%
3 to 5 years 17% 13%
6 to 15 years 3% 43%
>15 years 0% 23%
Teachers’ longevity in school
School State
<1 year 20% 14%
1 to 2 years 47% 12%
3 to 5 years 27% 13%
6 to 15 years 7% 36%
>15 years 0% 25%
Administrators’ longevity in school
Address Grades Students Made AYP AYP Phase Ed YES! Grade State Ranking for Math/Reading 24216 Garner St, Southfield K-12 1522 No 0 C Bottom Quarter
BRADFORD ACADEMY

4-Year Cohort 4-Year Graduation Rates 4-Year Dropout Rates
2008 2009 2010 2008 2009 2010 2008 2009 2010
School N/R N/R N/A N/R N/R N/R N/A
State 145,097 142,322 138,003 76% 75% 76% 14% 11% 11%
4 YEAR GRADUATION AND DROPOUT REPORT
BRADFORD ACADEMY ACHIEVEMENT DATA Percentage of Students Proficient on MEAP
MEAP 2008
MEAP 2009
MEAP 2010
State MEAP 2010
Math 3 69 83 84 95 Math 4 65 67 71 91 Math 5 69 63 49 80 Math 6 67 71 73 84 Math 7 72 64 70 85 Math 8 49 43 51 78
Math MME 6 5 52
Reading 3 59 74 79 87 Reading 4 54 54 70 84 Reading 5 76 64 70 85 Reading 6 65 79 73 84 Reading 7 59 69 69 79 Reading 8 60 69 74 82
Reading MME 29 23 63
MME 2009
MME 2010
MME 2011
State MME 2011
Student Progress from 2009 to 2010 on MEAP tests for 7th to 8th Grade
COLLEGE READY REPORT Percent College Ready in…
2008 Percent Meeting or Exceeding Benchmarks
2009 Percent Meeting or Exceeding Benchmarks
2010 Percent Meeting or Exceeding Benchmarks
2011 Percent Meeting or Exceeding Benchmarks
All Subjects NULL NULL 0 1 English NULL NULL 14 12 Mathematics NULL NULL 0 2 Reading NULL NULL 4 5 Science NULL NULL 0 1 *ACT Definition of College and Career Readiness is defined as the percentage of students that meet the following four minimum scores on the ACT: 18 on English, 22 on math, 21 on reading and 24 on science. Research by the ACT suggests that meeting the college readiness benchmarks allows for a 50% chance of obtaining a B or higher or about a 75% chance of obtaining a C or higher in college courses of the same subject area.)

Bridge Academy's mission is to create academic excellence, positive character, and understanding of cultures, and compassion for others. Mission Statement:
Num
ber o
f Stu
dent
s
Student Demographics Racial/ethnic composition 68% White,25% Asian,
6% Black Students receiving free or reduced price lunch 99%
Special education students 6%
Attendance 97%
Student/Teacher Ratio 17:1
Where Do Students Come From? Student Count Trend
School Opened: 08/23/2004 Current Contract Term: 07/01/09 to 06/30/14
Educational Service Provider: Global Educational Excellence Authorizer: Ferris State University
Teacher/Administrator Demographics
BA/BS MA/MS Other
Teachers in School 97% 3% 0% Teachers in Michigan 38% 61% 1% Administrators in school 33% 67% 0%
Administrators in state 19% 64% 17%
Teacher & Administrator Degrees Foundation Grant $7,316
Unreserved Fund Balance $1,804,989
% Operating Expenditures Spent on Instruction
24%
Financial Information (08-09)
School State
<1 year 60% 12%
1 to 2 years 23% 9%
3 to 5 years 17% 13%
6 to 15 years 0% 43%
>15 years 0% 23%
Teachers’ longevity in school
School State
<1 year 33% 14%
1 to 2 years 0% 12%
3 to 5 years 67% 13%
6 to 15 years 0% 36%
>15 years 0% 25%
Administrators’ longevity in school
Address Grades Students Made AYP AYP Phase Ed YES! Grade State Ranking for Math/Reading 9600 Buffalo St, Hamtramck K-5 586 Yes 0 B Bottom Quarter
BRIDGE ACADEMY

Percentage of 5th Graders Proficient on MEAP Percentage of 8th Graders Proficient on MEAP
BRIDGE ACADEMY ACHIEVEMENT DATA Student Progress from 2009 to 2010 on MEAP tests for 7th to 8th Grade Percentage of Students Proficient on MEAP
MEAP 2008
MEAP 2009
MEAP 2010
State MEAP 2010
Math 3 78 88 89 95 Math 4 65 69 80 91 Math 5 62 64 66 80 Math 6 79 75 70 84 Math 7 53 72 75 85 Math 8 48 35 71 78
Reading 3 59 71 67 87 Reading 4 45 34 59 84 Reading 5 49 40 54 85 Reading 6 73 66 56 84 Reading 7 62 79 51 79 Reading 8 51 50 90 82
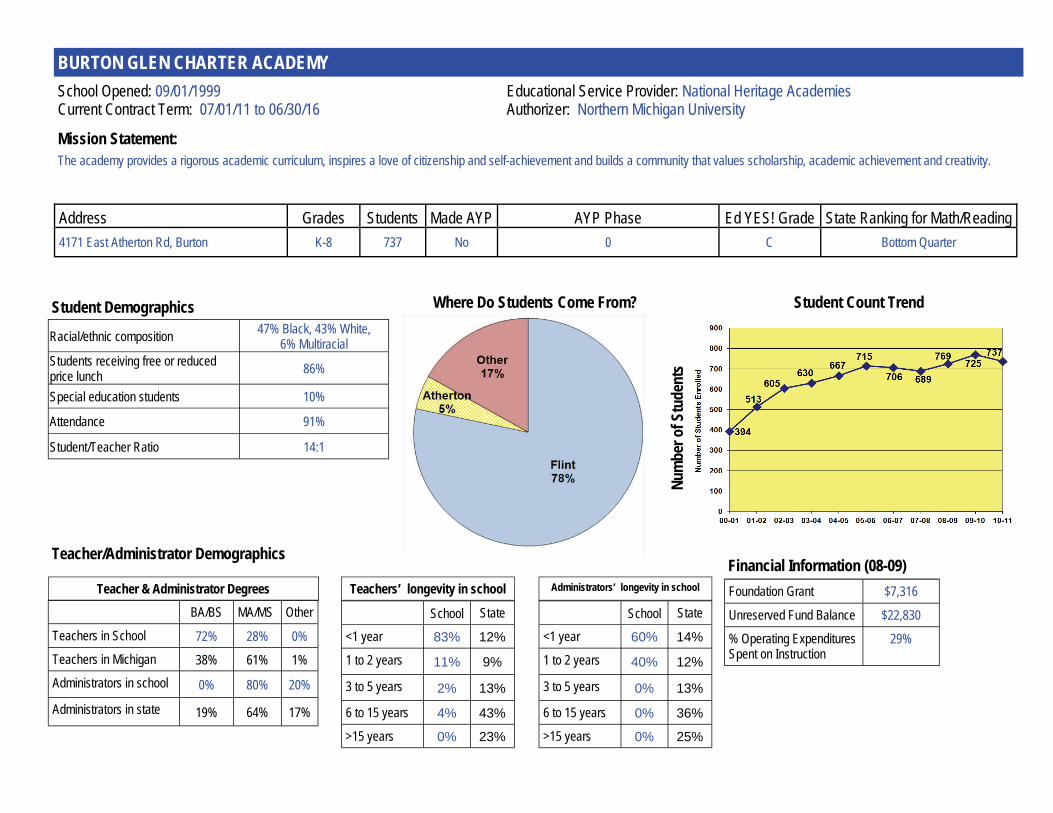
The academy provides a rigorous academic curriculum, inspires a love of citizenship and self-achievement and builds a community that values scholarship, academic achievement and creativity. Mission Statement:
Num
ber o
f Stu
dent
s
Student Demographics Racial/ethnic composition 47% Black, 43% White,
6% Multiracial Students receiving free or reduced price lunch 86%
Special education students 10%
Attendance 91%
Student/Teacher Ratio 14:1
Where Do Students Come From? Student Count Trend
School Opened: 09/01/1999 Current Contract Term: 07/01/11 to 06/30/16
Educational Service Provider: National Heritage Academies Authorizer: Northern Michigan University
Teacher/Administrator Demographics
BA/BS MA/MS Other
Teachers in School 72% 28% 0% Teachers in Michigan 38% 61% 1% Administrators in school 0% 80% 20%
Administrators in state 19% 64% 17%
Teacher & Administrator Degrees Foundation Grant $7,316
Unreserved Fund Balance $22,830
% Operating Expenditures Spent on Instruction
29%
Financial Information (08-09)
School State
<1 year 83% 12%
1 to 2 years 11% 9%
3 to 5 years 2% 13%
6 to 15 years 4% 43%
>15 years 0% 23%
Teachers’ longevity in school
School State
<1 year 60% 14%
1 to 2 years 40% 12%
3 to 5 years 0% 13%
6 to 15 years 0% 36%
>15 years 0% 25%
Administrators’ longevity in school
Address Grades Students Made AYP AYP Phase Ed YES! Grade State Ranking for Math/Reading 4171 East Atherton Rd, Burton K-8 737 No 0 C Bottom Quarter
BURTON GLEN CHARTER ACADEMY
Percentage of 5th Graders Proficient on MEAP Percentage of 8th Graders Proficient on MEAP
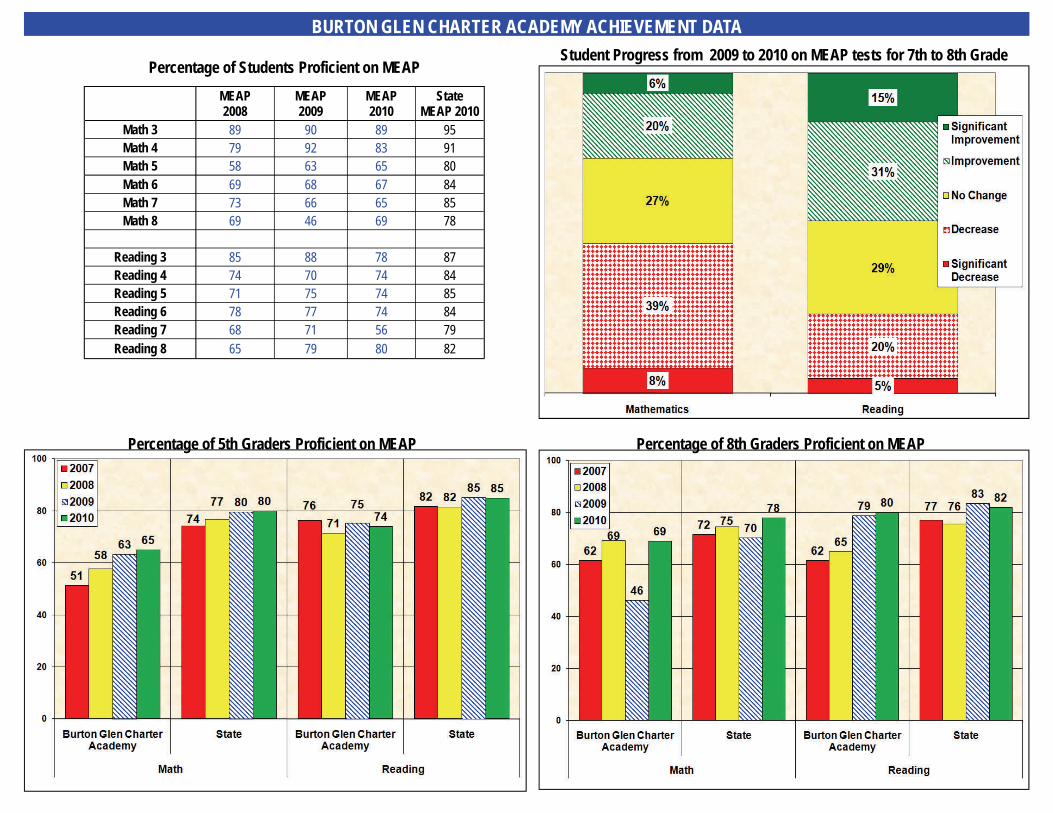
BURTON GLEN CHARTER ACADEMY ACHIEVEMENT DATA Student Progress from 2009 to 2010 on MEAP tests for 7th to 8th Grade
Percentage of Students Proficient on MEAP
MEAP 2008
MEAP 2009
MEAP 2010
State MEAP 2010
Math 3 89 90 89 95 Math 4 79 92 83 91 Math 5 58 63 65 80 Math 6 69 68 67 84 Math 7 73 66 65 85 Math 8 69 46 69 78
Reading 3 85 88 78 87 Reading 4 74 70 74 84 Reading 5 71 75 74 85 Reading 6 78 77 74 84 Reading 7 68 71 56 79 Reading 8 65 79 80 82
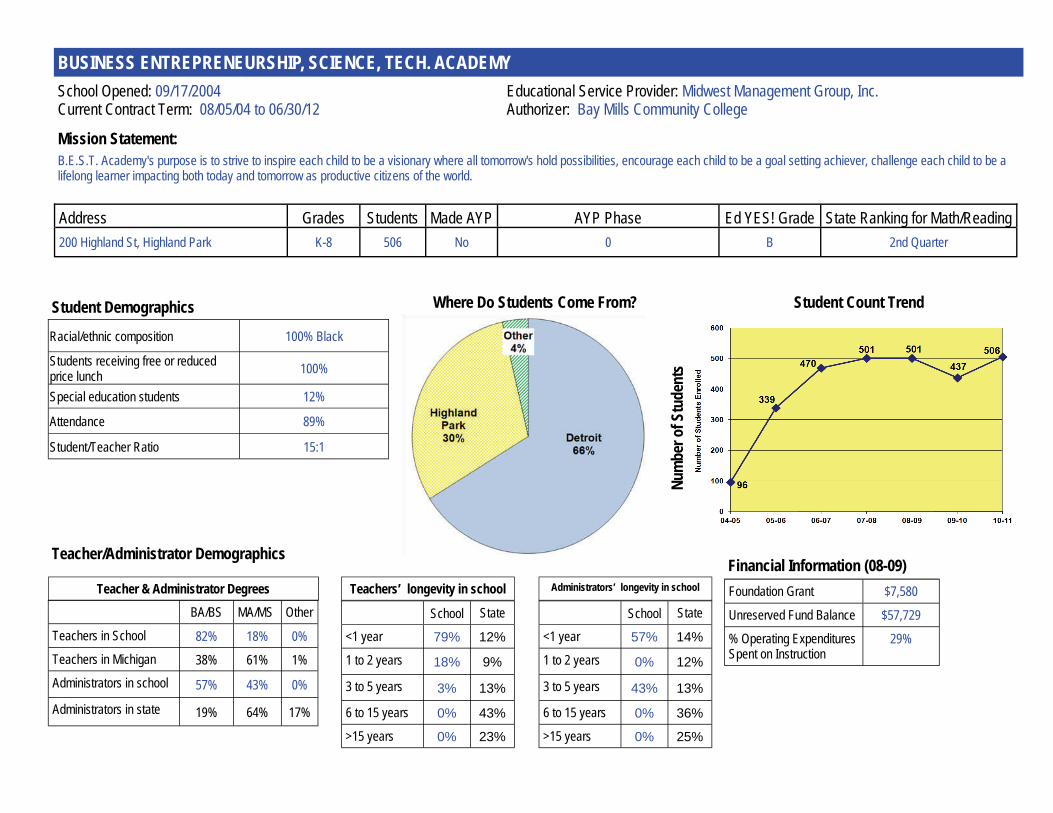
B.E.S.T. Academy's purpose is to strive to inspire each child to be a visionary where all tomorrow's hold possibilities, encourage each child to be a goal setting achiever, challenge each child to be a lifelong learner impacting both today and tomorrow as productive citizens of the world.
Mission Statement:
Num
ber o
f Stu
dent
s
Student Demographics Racial/ethnic composition 100% Black
Students receiving free or reduced price lunch 100%
Special education students 12%
Attendance 89%
Student/Teacher Ratio 15:1
Where Do Students Come From? Student Count Trend
School Opened: 09/17/2004 Current Contract Term: 08/05/04 to 06/30/12
Educational Service Provider: Midwest Management Group, Inc. Authorizer: Bay Mills Community College
Teacher/Administrator Demographics
BA/BS MA/MS Other
Teachers in School 82% 18% 0% Teachers in Michigan 38% 61% 1% Administrators in school 57% 43% 0%
Administrators in state 19% 64% 17%
Teacher & Administrator Degrees Foundation Grant $7,580
Unreserved Fund Balance $57,729
% Operating Expenditures Spent on Instruction
29%
Financial Information (08-09)
School State
<1 year 79% 12%
1 to 2 years 18% 9%
3 to 5 years 3% 13%
6 to 15 years 0% 43%
>15 years 0% 23%
Teachers’ longevity in school
School State
<1 year 57% 14%
1 to 2 years 0% 12%
3 to 5 years 43% 13%
6 to 15 years 0% 36%
>15 years 0% 25%
Administrators’ longevity in school
Address Grades Students Made AYP AYP Phase Ed YES! Grade State Ranking for Math/Reading 200 Highland St, Highland Park K-8 506 No 0 B 2nd Quarter
BUSINESS ENTREPRENEURSHIP, SCIENCE, TECH. ACADEMY

Percentage of 5th Graders Proficient on MEAP Percentage of 8th Graders Proficient on MEAP
BUSINESS ENTREPRENEURSHIP, SCIENCE AND TECHNOLOGY ACADEMY ACHIEVEMENT DATA
Student Progress from 2009 to 2010 on MEAP tests for 7th to 8th Grade Percentage of Students Proficient on MEAP
MEAP 2008
MEAP 2009
MEAP 2010
State MEAP 2010
Math 3 61 78 97 95 Math 4 60 98 98 91 Math 5 29 41 81 80 Math 6 64 77 94 84 Math 7 31 55 88 85 Math 8 12 32 90 78
Reading 3 71 86 85 87 Reading 4 41 52 93 84 Reading 5 44 40 62 85 Reading 6 54 76 96 84 Reading 7 56 64 60 79 Reading 8 21 79 84 82

Empowering students to reach their greatest potential by emphasizing personal connections, academic excellence, and positive character values. Mission Statement:
Num
ber o
f Stu
dent
s
Student Demographics Racial/ethnic composition 94% White
Students receiving free or reduced price lunch 28%
Special education students 13%
Attendance 96%
Student/Teacher Ratio 13:1
Where Do Students Come From? Student Count Trend
School Opened: 08/26/1996 Current Contract Term: 07/01/08 to 06/30/13
Educational Service Provider: Woodbridge Group Authorizer: Grand Valley State University
Teacher/Administrator Demographics
BA/BS MA/MS Other
Teachers in School 79% 21% 0% Teachers in Michigan 38% 61% 1% Administrators in school 0% 100% 0%
Administrators in state 19% 64% 17%
Teacher & Administrator Degrees Foundation Grant $7,580
Unreserved Fund Balance $453,999
% Operating Expenditures Spent on Instruction
62%
Financial Information (08-09)
School State
<1 year 11% 12%
1 to 2 years 16% 9%
3 to 5 years 26% 13%
6 to 15 years 47% 43%
>15 years 0% 23%
Teachers’ longevity in school
School State
<1 year 0% 14%
1 to 2 years 0% 12%
3 to 5 years 0% 13%
6 to 15 years 100% 36%
>15 years 0% 25%
Administrators’ longevity in school
Address Grades Students Made AYP AYP Phase Ed YES! Grade State Ranking for Math/Reading 9930 Burlingame Ave Sw, Byron Center K-12 239 Yes 0 A 2nd Quarter
BYRON CENTER CHARTER SCHOOL

4-Year Cohort 4-Year Graduation Rates 4-Year Dropout Rates
2008 2009 2010 2008 2009 2010 2008 2009 2010
School 12 16 18 67% 75% 83% 8% 19% 11%
State 145,097 142,322 138,003 76% 75% 76% 14% 11% 11%
4 YEAR GRADUATION AND DROPOUT REPORT
BYRON CENTER CHARTER SCHOOL ACHIEVEMENT DATA Percentage of Students Proficient on MEAP
MEAP 2008
MEAP 2009
MEAP 2010
State MEAP 2010
Math 3 100 * 88 95 Math 4 94 95 92 91 Math 5 83 75 90 80 Math 6 90 100 85 84 Math 7 95 95 90 85 Math 8 94 78 96 78
Math MME 67 68 56 52
Reading 3 88 * 94 87 Reading 4 89 90 85 84 Reading 5 92 95 85 85 Reading 6 100 100 85 84 Reading 7 74 91 85 79 Reading 8 94 87 96 82
Reading MME 78 85 81 63
MME 2009
MME 2010
MME 2011
State MME 2011
Student Progress from 2009 to 2010 on MEAP tests for 7th to 8th Grade
COLLEGE READY REPORT Percent College Ready in…
2008 Percent Meeting or Exceeding Benchmarks
2009 Percent Meeting or Exceeding Benchmarks
2010 Percent Meeting or Exceeding Benchmarks
2011 Percent Meeting or Exceeding Benchmarks
All Subjects 6 18 10 6 English 25 76 55 69 Mathematics 25 47 20 31 Reading 19 65 45 31 Science 13 24 25 6 *ACT Definition of College and Career Readiness is defined as the percentage of students that meet the following four minimum scores on the ACT: 18 on English, 22 on math, 21 on reading and 24 on science. Research by the ACT suggests that meeting the college readiness benchmarks allows for a 50% chance of obtaining a B or higher or about a 75% chance of obtaining a C or higher in college courses of the same subject area.)

Canton Charter Academy will ensure that all students master basic academic skills, develop into moral, ethical adults, demonstrate the ability to think critically, be proficient in written and oral communication and develop a sense of responsibility toward themselves and their community.
Mission Statement:
Num
ber o
f Stu
dent
s
Student Demographics Racial/ethnic composition 47% White, 41% Asian,
8% Black Students receiving free or reduced price lunch 12%
Special education students 5%
Attendance 95%
Student/Teacher Ratio 18:1
Where Do Students Come From? Student Count Trend
School Opened: 09/01/2000 Current Contract Term: 07/01/05 to 06/30/12
Educational Service Provider: National Heritage Academies Authorizer: Central Michigan University
Teacher/Administrator Demographics
BA/BS MA/MS Other
Teachers in School 75% 25% 0% Teachers in Michigan 38% 61% 1% Administrators in school 60% 20% 0%
Administrators in state 19% 64% 17%
Teacher & Administrator Degrees Foundation Grant $7,580
Unreserved Fund Balance $58,354
% Operating Expenditures Spent on Instruction
36%
Financial Information (08-09)
School State
<1 year 45% 12%
1 to 2 years 23% 9%
3 to 5 years 13% 13%
6 to 15 years 20% 43%
>15 years 0% 23%
Teachers’ longevity in school
School State
<1 year 60% 14%
1 to 2 years 20% 12%
3 to 5 years 0% 13%
6 to 15 years 20% 36%
>15 years 0% 25%
Administrators’ longevity in school
Address Grades Students Made AYP AYP Phase Ed YES! Grade State Ranking for Math/Reading 49100 Ford Rd, Canton K-8 728 Yes 0 A Top Quarter
CANTON CHARTER ACADEMY

Percentage of 5th Graders Proficient on MEAP Percentage of 8th Graders Proficient on MEAP
CANTON CHARTER ACADEMY ACHIEVEMENT DATA
Student Progress from 2009 to 2010 on MEAP tests for 7th to 8th Grade Percentage of Students Proficient on MEAP
MEAP 2008
MEAP 2009
MEAP 2010
State MEAP 2010
Math 3 100 100 100 95 Math 4 100 99 99 91 Math 5 93 93 95 80 Math 6 94 97 92 84 Math 7 99 99 100 85 Math 8 99 88 98 78
Reading 3 99 97 98 87 Reading 4 99 96 93 84 Reading 5 97 97 98 85 Reading 6 94 97 96 84 Reading 7 92 94 97 79 Reading 8 96 91 99 82

Capital Area Academy will inspire each child to be a visionary where all tomorrows hold possibilities; to encourage each child to be an achiever setting goals; to challenge each child to be a life- long learner impacting both today and tomorrow as productive citizens of the world.
Mission Statement:
Num
ber o
f Stu
dent
s
Student Demographics Racial/ethnic composition 39% Black, 34% White,
19% Hispanic, 6% Multiracial Students receiving free or reduced price lunch 90%
Special education students 19%
Attendance 93%
Student/Teacher Ratio 7:1
Where Do Students Come From? Student Count Trend
School Opened: 09/01/1999 Current Contract Term: 07/01/10 to 06/30/11
Educational Service Provider: Mosaica Education Authorizer: Central Michigan University
Teacher/Administrator Demographics
BA/BS MA/MS Other
Teachers in School 81% 19% 0% Teachers in Michigan 38% 61% 1% Administrators in school 33% 67% 0%
Administrators in state 19% 64% 17%
Teacher & Administrator Degrees Foundation Grant $7,580
Unreserved Fund Balance $351,552
% Operating Expenditures Spent on Instruction
36%
Financial Information (08-09)
School State
<1 year 55% 12%
1 to 2 years 29% 9%
3 to 5 years 13% 13%
6 to 15 years 3% 43%
>15 years 0% 23%
Teachers’ longevity in school
School State
<1 year 0% 14%
1 to 2 years 33% 12%
3 to 5 years 33% 13%
6 to 15 years 33% 36%
>15 years 0% 25%
Administrators’ longevity in school
Address Grades Students Made AYP AYP Phase Ed YES! Grade State Ranking for Math/Reading Closed K-8 208 Yes 0 C Bottom Quarter
CAPITAL AREA ACADEMY

Percentage of 5th Graders Proficient on MEAP Percentage of 8th Graders Proficient on MEAP
CAPITAL AREA ACADEMY ACHIEVEMENT DATA
Student Progress from 2009 to 2010 on MEAP tests for 7th to 8th Grade Percentage of Students Proficient on MEAP
MEAP 2008
MEAP 2009
MEAP 2010
State MEAP 2010
Math 3 57 92 92 95 Math 4 71 75 83 91 Math 5 27 50 78 80 Math 6 50 36 39 84 Math 7 67 76 37 85 Math 8 29 40 37 78
Reading 3 50 75 75 87 Reading 4 47 70 69 84 Reading 5 31 43 61 85 Reading 6 56 54 52 84 Reading 7 46 62 30 79 Reading 8 48 65 63 82
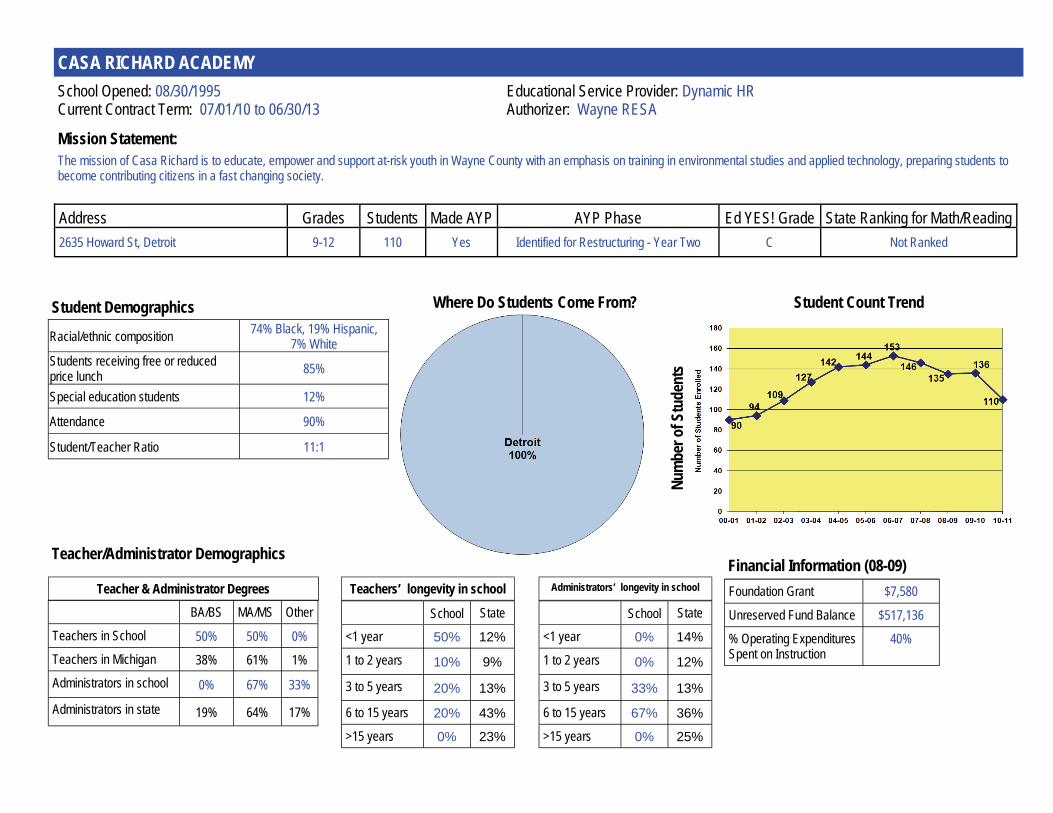
The mission of Casa Richard is to educate, empower and support at-risk youth in Wayne County with an emphasis on training in environmental studies and applied technology, preparing students to become contributing citizens in a fast changing society.
Mission Statement:
Num
ber o
f Stu
dent
s
Student Demographics Racial/ethnic composition 74% Black, 19% Hispanic,
7% White Students receiving free or reduced price lunch 85%
Special education students 12%
Attendance 90%
Student/Teacher Ratio 11:1
Where Do Students Come From? Student Count Trend
School Opened: 08/30/1995 Current Contract Term: 07/01/10 to 06/30/13
Educational Service Provider: Dynamic HR Authorizer: Wayne RESA
Teacher/Administrator Demographics
BA/BS MA/MS Other
Teachers in School 50% 50% 0% Teachers in Michigan 38% 61% 1% Administrators in school 0% 67% 33%
Administrators in state 19% 64% 17%
Teacher & Administrator Degrees Foundation Grant $7,580
Unreserved Fund Balance $517,136
% Operating Expenditures Spent on Instruction
40%
Financial Information (08-09)
School State
<1 year 50% 12%
1 to 2 years 10% 9%
3 to 5 years 20% 13%
6 to 15 years 20% 43%
>15 years 0% 23%
Teachers’ longevity in school
School State
<1 year 0% 14%
1 to 2 years 0% 12%
3 to 5 years 33% 13%
6 to 15 years 67% 36%
>15 years 0% 25%
Administrators’ longevity in school
Address Grades Students Made AYP AYP Phase Ed YES! Grade State Ranking for Math/Reading 2635 Howard St, Detroit 9-12 110 Yes Identified for Restructuring - Year Two C Not Ranked
CASA RICHARD ACADEMY

CASA RICHARD ACADEMY ACHIEVEMENT DATA
4-Year Cohort 4-Year Graduation Rates 4-Year Dropout Rates 2008 2009 2010 2008 2009 2010 2008 2009 2010
School 41 38 59 24% 39% 53% 49% 47% 29% State 145,097 142,322 138,003 76% 75% 76% 14% 11% 11%
4 YEAR GRADUATION AND DROPOUT REPORT
Subject
2008 Percent Meeting or Exceed‐ing Benchmarks
2009 Percent Meeting or Exceed‐ing Benchmarks
2010 Percent Meeting or Exceed‐ing Benchmarks
2011 Percent Meeting or Exceed‐ing Benchmarks
All Subjects 0 0 0 0 English 12 44 19 8 Mathematics 0 7 0 4 Reading 4 33 7 16 Science 0 7 0 4 *ACT Definition of College and Career Readiness is defined as the percentage of students that meet the following four minimum scores on the ACT: 18 on English, 22 on math, 21 on reading and 24 on science. Research by the ACT suggests that meeting the college readiness benchmarks allows for a 50% chance of obtaining a B or higher or about a 75% chance of obtaining a C or higher in college courses of the same subject area.)

The Mission of CASMAN Alternative Academy is to provide innovative and responsible education for our students based upon their needs and circumstances. Mission Statement:
Num
ber o
f Stu
dent
s
Student Demographics Racial/ethnic composition 90% White,
7% American Indian Students receiving free or reduced price lunch 73%
Special education students 17%
Attendance 88%
Student/Teacher Ratio 9:1
Where Do Students Come From? Student Count Trend
School Opened: 09/02/1997 Current Contract Term: 07/01/11 to 06/30/16
Educational Service Provider: Self Managed Authorizer: Manistee ISD
Teacher/Administrator Demographics
BA/BS MA/MS Other
Teachers in School 82% 18% 0% Teachers in Michigan 38% 61% 1% Administrators in school 67% 33% 0%
Administrators in state 19% 64% 17%
Teacher & Administrator Degrees Foundation Grant $7,316
Unreserved Fund Balance $373,099
% Operating Expenditures Spent on Instruction
34%
Financial Information (08-09)
School State
<1 year 55% 12%
1 to 2 years 9% 9%
3 to 5 years 36% 13%
6 to 15 years 0% 43%
>15 years 0% 23%
Teachers’ longevity in school
School State
<1 year 33% 14%
1 to 2 years 0% 12%
3 to 5 years 0% 13%
6 to 15 years 67% 36%
>15 years 0% 25%
Administrators’ longevity in school
Address Grades Students Made AYP AYP Phase Ed YES! Grade State Ranking for Math/Reading 225 9th St, Manistee 7-12 101 No Identified for Restructuring - Year Two No Grade Not Ranked
CASMAN ALTERNATIVE ACADEMY
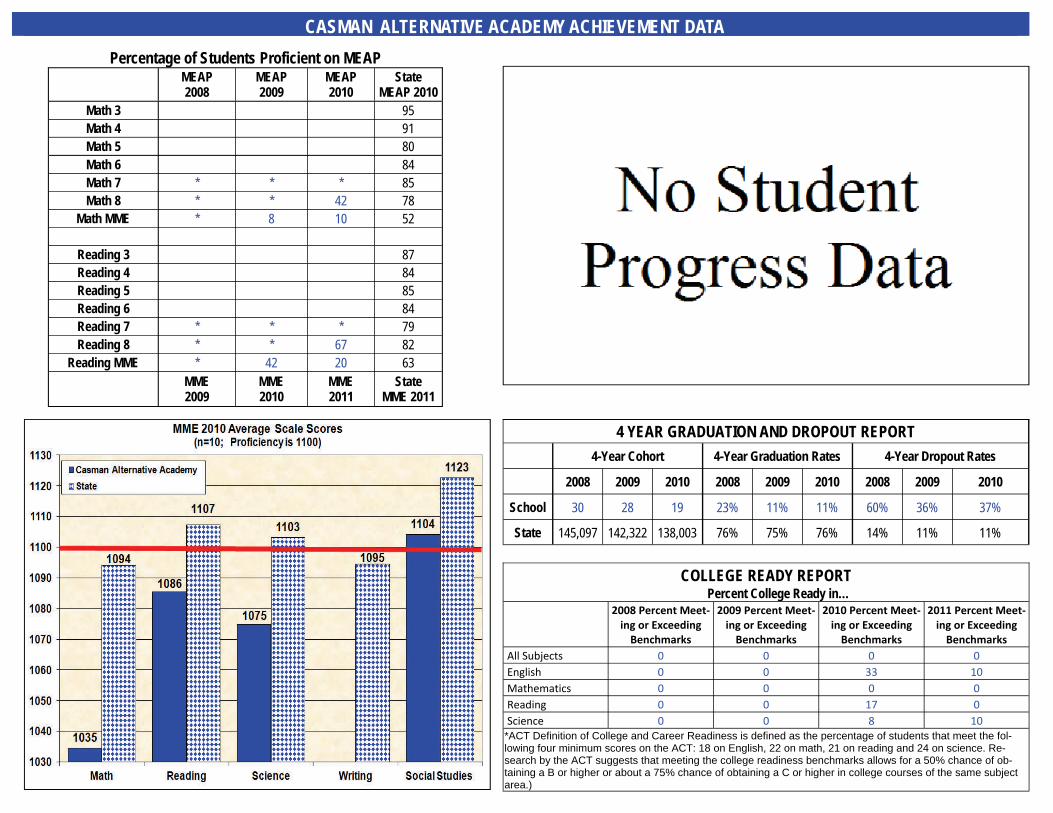
CASMAN ALTERNATIVE ACADEMY ACHIEVEMENT DATA
4-Year Cohort 4-Year Graduation Rates 4-Year Dropout Rates
2008 2009 2010 2008 2009 2010 2008 2009 2010
School 30 28 19 23% 11% 11% 60% 36% 37%
State 145,097 142,322 138,003 76% 75% 76% 14% 11% 11%
4 YEAR GRADUATION AND DROPOUT REPORT
CASMAN ALTERNATIVE ACADEMY ACHIEVEMENT DATA Percentage of Students Proficient on MEAP
MEAP 2008
MEAP 2009
MEAP 2010
State MEAP 2010
Math 3 95 Math 4 91 Math 5 80 Math 6 84 Math 7 * * * 85 Math 8 * * 42 78
Math MME * 8 10 52
Reading 3 87 Reading 4 84 Reading 5 85 Reading 6 84 Reading 7 * * * 79 Reading 8 * * 67 82
Reading MME * 42 20 63
MME 2009
MME 2010
MME 2011
State MME 2011
COLLEGE READY REPORT Percent College Ready in…
2008 Percent Meet‐ing or Exceeding Benchmarks
2009 Percent Meet‐ing or Exceeding Benchmarks
2010 Percent Meet‐ing or Exceeding Benchmarks
2011 Percent Meet‐ing or Exceeding Benchmarks
All Subjects 0 0 0 0 English 0 0 33 10 Mathematics 0 0 0 0 Reading 0 0 17 0 Science 0 0 8 10 *ACT Definition of College and Career Readiness is defined as the percentage of students that meet the fol-lowing four minimum scores on the ACT: 18 on English, 22 on math, 21 on reading and 24 on science. Re-search by the ACT suggests that meeting the college readiness benchmarks allows for a 50% chance of ob-taining a B or higher or about a 75% chance of obtaining a C or higher in college courses of the same subject area.)