bls_employnews_196908.pdf
TRANSCRIPT

U. S. DEPARTMENT OF LABORO F F I C E OF I N F O R M A T I O N , W A S H I N G T O N , D. C . 2 0 2 1 0
USDL - 10-666Bureau of Labor Statist ics(202) 961-2531
F O R RE LE A S E : 11:00 A. M.Monday, S eptem ber 8, 1969
THE E M P L O Y M E N T SITUATION: AUGUST 1969
Em p loym en t r o s e m o d e s t ly in August, while the unem ploym ent situation rem ained about the sam e, the U. S. D epartm ent of L a b o r 1 s Bureau of Labor Statis t ics re p o r te d today. N onfarm payro l l em p loym ent r o s e by 165, 000 (seasonal ly adjusted) o v e r the month, but tw o - th ird s of the gain was due to the return of w o r k e r s after an e a r ly m o d e l - c h a n g e o v e r in the autom obi le industry . The total unem ploym ent rate, at 3. 5 percent^was essent ia l ly unchanged f r o m July. J o b le s s rates rem ained the same for m o s t m a jo r groups in the labor f o r c e .Industry Em p loym en t
Fol lowing a season a l ly adjusted dec l ine of 30, 000 in July (as r e v i s e d ) , nonfarm payro l l em p loym ent in August continued to show signs of level ing off. Although up by 165, 000 o v e r the month to 70. 4 m i l l i o n (seasonal ly ad jus ted ) , about 100, 000 of the in c r e a s e was attr ibutable to the return of auto w o r k e r s fo l lowing an e a r l i e r - t h a n -u s u a l m o d e l ch angeover .
Since M arch , growth in nonfarm payro l l em p lo ym e n t has s lowed down substantially. Monthly p ayro l l e m p lo ym e n t i n c r e a s e s have av era ged 145, 000 in the M a r c h -A u g u s t p er iod , in con trast with a 250, 000 av era ge pickup in the S e p t e m b e r - M a r c h per iod . M o st m a jo r industr ies have e x p e r i e n c e d e m p l o y ment s lowdowns during the past 5 months.
O ver the month, season a l ly adjusted gains w ere re p o r te d in m a n u fa c turing, s e r v i c e s , trade, f inance, and State and loca l governm ent , 'With the except ion of the transportat ion equipment industry , m o s t manufacturing industr ies showed little or no change in August. The only s izable gains w e re in p r im a r y m eta ls (15 ,000 ) and e l e c t r i c a l equipment (1 0 ,0 0 0 ) . E m p lo y m e n t fe l l by 10 ,000 in apparel .
Digitized for FRASER http://fraser.stlouisfed.org/ Federal Reserve Bank of St. Louis

- 2 -
E m p lo y m e n t in con trac t co n s tru c t io n was down by about 45, 000 ( s e a s o n ally ad jus ted ) , its s e con d c o n se cu t iv e monthly dec l ine . About 25 ,000 o f the August drop , h ow ever , was due to i n c r e a s e d str ike act iv ity . Since June, the construct ion j o b l e s s rate has r i se n f r o m 5. 0 to 7. 4 percent . Both o f these deve lopm ents p r im a r i ly r e f l e c t s ignif icant d e c l in e s in housing starts . Since last August, c o ns truct ion e m p lo y m e n t has in c r e a s e d by 105, 000.
In s e r v i c e s , the 55, 000 August gain (seasonal ly adjusted) f o l lo w e d a 4 -m onth per iod when the av e ra ge monthly i n c r e a s e was only 5, 000, c o m p a r e d with a 65, 000 monthly i n c r e a s e fo r the S ep tem ber 1968 -M arch 1969 per iod . The in c r e a s e in trade, though s izable ( 3 0 ,0 0 0 ) , still r em ained below the a v era ge monthly ga ins r e c o r d e d during m o s t of 1969. State and l o c a l g o v e r n ment e m p lo ym e n t r o s e 20 ,000 in August. In contrast , F e d e r a l go v e rn m e n t e m p lo ym e n t was down by 25, 000, the fifth month out of the past 6 that F e d e r a l e m p lo ym e n t has dropped .Hours and Earn ings
A fter 5 con secu t iv e months at 3 7 .8 hours (seasona l ly a d ju s te d ) , a v e ra g e weekly hours for r a n k -a n d - f i l e w o r k e r s on private nonagr icu ltura l p a y r o l l s edged up to 37. 9 hours . In c r e a s e s in the August w ork w eek in construct ion , trade, and f inance o f fs e t d e c l in e s in manufacturing and mining.
The average w ork w eek in manufacturing was down 0. 1 hour ove r the month to 40. 6 hours (seasona l ly adjusted) in August. The f a c to r y w o rk w e e k has edged s lowly downward s ince M arch , when it stood at 40. 9 hours . The gradual reduct ion in the manufactur ing w ork w eek has been w id e s p r e a d among both durable and nondurable g ood s industr ies , with many down substant ially f r o m their 1969 highs. O v e r t im e hours in manufactur ing, at 3. 6 hours s e a sonally adjusted, r em ain ed unchanged f o r the third c on secu t iv e month.
A v e r a g e hourly earn ings fo r r a n k -a n d - f i l e w o r k e r s w e re unchanged in August at $ 3 .0 4 . Due to a longer w orkw eek , av e ra ge w eek ly earn ings in c r e a s e d by 61 cents to $ 1 1 6 .4 3 . Since last August , average hourly e a r n ings have r i se n by 19 cents and weekly earn ings by $7. 27 (both in cre a s in g by 6. 7 p e rce n t ) #U nem ploym e nt
The num ber of unem ployed p e rso n s totaled 2 .9 m i l l ion in August,325, 000 f e w e r than in July . The dec l ine was in l ine with the usual J u ly - t o -
August pattern, as te e n a g e rs began their annual exodus f r o m the s u m m e r t im eDigitized for FRASER http://fraser.stlouisfed.org/ Federal Reserve Bank of St. Louis
- 3 -
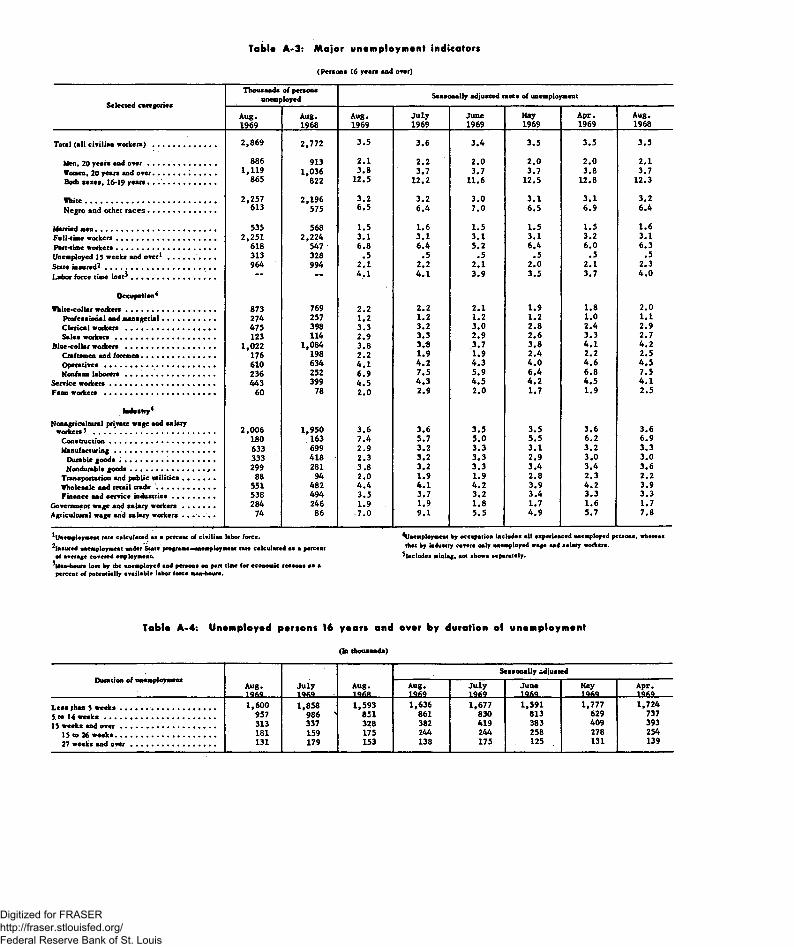
labor f o r c e . A f te r season a l adjustment , unem ploym ent rem ain ed the same o v e r the month fo r m o s t m a jo r w o r k e r g ro u p s . H ow ev er , unem ploym ent was up by about 275, 000 s ince the 1 2 -ye a r low r e a c h e d ear ly last winter .
The o v e r a l l unem ploym ent rate in August was 3. 5 percent , about the same as the 3. 6 p ercen t in July. Although the August rate re m ain e d within the 3. 4 -3 . 6 percen t range of the past 6 months, it was up sl ightly f r o m the p o s t -K o r e a n low of 3 .3 p ercen t r e c o r d e d in the D e c e m b e r - F e b r u a r y p er iod .
J o b le s s rates for aciuilt m en (2. 1 p e r c e n t ) , m a r r i e d m e n (1. 5 p e r c e n t ) , w om en (3 .8 p e r c e n t ) , and teenagers (12. 5 p e rce n t ) w e re v ir tual ly unchanged in August . The rate fo r adult men, how ever , has r i s e n som ew hat f r o m its a l l t im e r e c o r d e d low of 1 .8 percen t in D e c e m b e r . Rates fo r m o s t other g roup s rem ained near the low s reached e a r l i e r this yea r .
The j o b l e s s rate f o r all fu l l - t im e w o r k e r s re m ain e d at 3. 1 p e rce n t for the fourth straight month but was up f r o m the 2. 8 p ercen t re ach e d in D e c e m b e r - - t h e low point fo r this s e r i e s , which began in 1963. The rate f o r part - t ime w o r k e r s , at 6. 8 percent , was essent ia l ly unchanged f r o m July and f r o m a y e a r ago. (This p r e s s r e l e a s e in troduces a new table, A - 2, present ing season a l ly adjusted data on ful l - and p ar t - t im e w o r k e r s by sex and age . )
The unem ploym ent rate for w o r k e r s c o v e r e d under State unem ploym ent insurance p r o g r a m s edged down to 2.1 p ercen t in August. This rate has rem ained in the narrow range of 2 . 0 - 2 . 2 p ercen t f o r the past 12 months .
J o b le s s rates f o r both white and N egro w o r k e r s w e re unchanged in August; h o w ever , both have r i se n somewhat s ince reach ing p o s t - K o r e a n r e c o r d lows in F e b ru a r y . The white unem ploym ent rate in August was 3. 2 percent , up f r o m 2 .9 p ercen t in F e b ru a r y , while the rate for N e g r o e s was 6. 5 p e rce n t in August, c o m p a r e d with 5. 7 p ercen t in F e b r u a r y .
The i n c r e a s e in unem ploym ent s ince the end of last yea r was m ain ly of s h o r t - t e r m durat ion. U nem ploym ent of l e s s than 5 w eeks , at 1. 6 m i l l i o n in August ( seasonal ly ad ju s te d ) , was up by 275, 000 f r o m the le v e l at the end of last ye a r . L o n g - t e r m unem ploym ent (15 w eeks or m o r e ) has r i s e n only sl ightly during the year .
Digitized for FRASER http://fraser.stlouisfed.org/ Federal Reserve Bank of St. Louis

- 4 -
Labor F o r c e ana E m p lo y m e n tThe c iv i l ian labor f o r c e dec l ined l e s s in August than it usual ly does at
this time of year . A l te r seasonal ad justment, the labor f o r c e stood at 81. 1 mi l l ion , 300 ,000 above July. A l l of the r i se o c c u r r e d among adult w o r k e r s .
Total e m p loym en t was 78. 2 m i l l io n ( seasonal ly adjusted) in August; this r e p re se n te d a gain of 325, 000 f r o m July, all among adult w o r k e r s .After showing little or no change f r o m F e b ru a r y to June, em p lo ym e n t has advanced somewhat in the past 2 months. Despite this i n c r e a s e , the August leve l was up only 450, 000 f r o m F e b ru a ry .
The number of p e r s o n s who want fu l l - t im e nonagricu ltura l j o b s but are em ployed part time fo r e c o n o m i c reasons r o se by 200 ,000 in August to 2 .0 m i l l ion (seasonal ly ad ju s ted ) , the highest level s ince ear ly 1967. E c o n o m i c p a r t - t im e em p loym ent has i n c r e a s e d 400, 000 since the beginning of the year ; p e rso n s who usually w ork full time accounted for tw o - th ird s of the r i s e .
This r e le a s e presents and ana lyzes s tat is t ics f r o m two m a jo r s u rve ys . Data on labor f o r c e , total em p loym ent , and unerriployment are d e r ive d f r o m the sam ple surveys of households conducted and tabulated by the Bureau of the Census for the Bureau of Labor Stat ist ics . Statist ics on industry em p loym ent , hours , and earnings are c o l l e c te d by State ag e n c ie s f r o m p a y ro l l r e c o r d s of e m p l o y e r s and are tabulated by the Bureau of La bor Stat ist ics . A d e s c r ip t io n of the two surveys appears in the BLS publication Em p loym en t and Earn ings .
Digitized for FRASER http://fraser.stlouisfed.org/ Federal Reserve Bank of St. Louis

TabU A-1: Employment status of the noninstitutional population by sox and ago
(In thousands)
Employment status, age, and sex Aug.1969
July1969
Aug.1968
Seasonally adjustedAug.1969
J u ly1969
June1969
May1969
Apr.1969
Total
Total labor fo r c e .......................................... .. . . 86 ,046 86,318 83,792 84,584 84 ,277 83 ,957 83 ,593 83 ,966Civilian labor f o r c e ........................ .................... 82 ,516 82,797 80 ,203 81 ,054 80 ,756 80 ,433 80 ,071 80 ,450
Employed............................................................ 79 ,646 79,616 77,432 78,187 77 ,874 77 ,671 77,265 77,605Agriculture....................................................... 3 ,977 4 ,155 4 ,107 3,634 3 ,551 3 ,705 3 ,805 3 ,664Nonagricultural industries............................. 75 ,669 75,460 73 ,325 74,553 74,323 73,966 73 ,460 73,941
On part time for economic reasons............. 2 ,323 2,156 2,098 2,001 1,795 1,874 1,688 1,670Usually work foil time............................... 1 ,088 862 995 1,065 881 1 ,030 862 858Usually work part t im e ............................. 1 ,235 1,294 1,103 936 914 844 826 812
Unemployed........................................................ 2 ,869 3,182 2,772 2,867 2 ,882 2,762 2 ,806 2 ,845
Men, 20 years .and aver
Civilian labor force............................................... 46 ,9 8 1 46 ,791 4 6 ,3 7 4 46 ,507 4 6 ,322 46 ,206 4 6 ,171 46 ,195Employed............................................................ 4 6 ,096 45 ,846 45 ,461 45 ,551 45 ,293 4 5 ,260 45 ,227 45 ,285
Agriculture....................................... ........... 2 ,766 2,815 2,859 2,693 2 ,646 2,676 2 ,731 2 ,681Nonagricultural industries............................. 43 ,329 43,031 42 ,601 42 ,858 42 ,647 4 2 ,584 4 2 ,496 42 ,6 0 4
Unemployed.......................................................... 886 945 913 956 1,029 946 944 910
Women, 20 years and over
Civilian labor f o r c e ..................... . .................... 26 ,909 26,784 25 ,494 27,677 27 ,511 27,262 27 ,049 27 ,205Employed ............................................................. 25 ,790 25,798 24,458 26,622 26,505 26,251 26,046 26 ,169
Agriculture....................................................... 658 715 661 578 540 617 627 609Nonagricultural industries............................. 25,132 25,082 23,797 26 ,044 25 ,965 25 ,634 25,419 25 ,560
Unemployed. ........................................................ 1 ,119 987 1 ,036 1,055 1 ,006 1,011 1,003 1 ,036
Both sexes, 16-19 years
Civilian labor force................................................ 8 ,625 9 ,222 8 ,336 6 ,870 6 ,923 6 ,965 6 ,8 5 1 7 ,0 5 0Employed....................................................... 7 ,761 7 ,972 7 ,513 6 ,014 6 ,076 6 ,160 5 ,992 6 ,151
Agriculture..................................................... i 552 625 587 363 365 412 447 374Nooagricultural industriea............................. 7 ,208 7,346 6 ,9 2 6 5 ,651 5 ,711 5 ,748 5 ,545 5 ,777
Unemployed.......................................................... 865 1 ,250 822 856 847 805 859 899
Tablo A-2: Full- and part-timo status of tho civilian labor forco by sox and ago
(Numbers in thousands)
Digitized for FRASER http://fraser.stlouisfed.org/ Federal Reserve Bank of St. Louis
(Persons 16 years and over)
TabU A-3: Major unamploymant indicators
Selected categories
Thousands of persons unemployed Seasonally adjusted rates of unemployment
Aug.1969
Aug.1968
Aug.1969
Ju ly1969
June1969
May1969
Apr.1969
Aug.1968
Total (all civilian w orkers)................................ 2 ,869 2,772 3 .5 3 .6 3 .4 3 .5 3 .5 3 .5
Men, 20 years and o v e r .................................. 886 913 2 .1 2 .2 2 .0 2 .0 2 .0 2 .1Women, 20 years and over................ ............... 1 ,119 1,036 3 .8 3 .7 3 .7 3 .7 3 .8 3 .7Both sexes, 16*19 years • .. ' ............... .. 865 822 12 .5 12.2 11 .6 12 .5 12 .8 12.3
White.................................................................. 2 ,257 2,196 3 .2 3 .2 3 .0 3 .1 3 .1 3 .2Negro and ocher ra ces .................................. 613 575 6 .5 6 .4 7 .0 6 .5 6 .9 6 .4
Married men............................................................ 535 568 1 .5 1 .6 1 .5 1 .5 1 .5 1 .6Full-time workers.................................................. 2 ,251 2 ,224 3 .1 3 .1 3 .1 3 .1 3 .2 3 .1Part-time workers..................... ........................... 618 547 6 .8 6 .4 5 .2 6 .4 6 .0 6 .3Unemployed 1$ weeks and over1 ............. .. . . . 313 328 .5 .5 .5 .5 .5 .5State insured2 ...................................................... 964 994 2 .1 2 .2 2 .1 2 .0 2 .1 2 .3Labor force time lost^ .......................................... — — 4 .1 4 .1 3 .9 3 .5 3 .7 4 .0
Occupation4White-collar workers............................................. 873 769 2 .2 2 .2 2 .1 1 .9 1 .8 2 .0
Professional and managerial........................... 274 257 1 .2 1 .2 1 .2 1 .2 1 .0 1 .1Clerical workers ............................................. 475 398 3 .3 3 .2 3 .0 2 .8 2 .4 2 .9Sales w orkers............................................... . 123 114 2 .9 3 .3 2 .9 2 .6 3 .3 2 .7
Blue-collar workers ............................................. 1 ,022 1 ,084 3 .8 3 .0 3 .7 3 .8 4 .1 4 .2Craftsmen and foremen..................................... 176 198 2 .2 1 .9 1 .9 2 .4 2 .2 2 .5Operatives....................................................... 610 634 4 .1 4 .2 4 .3 4 .0 4 .6 4 .5Non farm laborers............................. .............. 236 252 6 .9 7 .5 5 .9 6 .4 6 .8 7 .5
Service workers................................................. 443 399 4 .5 4 .3 4 .5 4 .2 4 .5 4 .1Farm workers .................................................. .. 60 78 2 .0 2 .9 2 .0 1 .7 1 .9 2 .5
Industry4Nonagricultural private wage and salary
workers 5 ............................................................. 2 ,006 1 ,950 3 .6 3 .6 3 .5 3 .5 3 .6 3 .6Construction..................................................... 180 163 7 .4 5 .7 5 .0 5 .5 6 .2 6 .9Manufacturing.................................................. 633 699 2 .9 3 .2 3 .3 3 .1 3 .2 3 .3
Durable goods ............................................... 333 418 - 2 .3 3 .2 3 .3 2 .9 3 .0 3 .0Nondurable goods..................................... ... • 299 281 3 .8 3 .2 3 .3 3 .4 3 .4 3 .6
Transportation and public utilities................ 88 94 2 .0 1 .9 1 .9 2 .8 2 .3 2 .2Wholesale and retail trade ' . ........................... 551 482 4 .4 4 .1 4 .2 3 .9 4 .2 3 .9Finance and service industries..................... 538 494 3 .5 3 .7 3 .2 3 .4 3 .3 3 .3
Government wage and salary workers . . . . . . . 284 246 1 .9 1 .9 1 .8 1 .7 1 .6 1 .7Agricultural wage and salary workers . . . . . . . 74 86 7 .0 9 .1 5 .5 4 .9 5 .7 7 .8
1 Unemployment rate calculated as a percent of civilian labor force. ^Unemployment by occupation includes all esperienced unemployed persons, whereas
W e d unemployment under St.ce protrams-unemploymeat rate calculated a . a percent *h« ** c o W ‘ “n* "P ,0jr*d w‘ « « “ d w o tk tt9 'of average covered employment. ^Includes mining, not shown separately.
^Man-hours lost by the unemployed and persons on part time for economic rensons as a percent o f potentially available labor force man-hours.
TabU A-4: Unamployad parsons 16 yaars and ovar by duration of unomploymant
Duration of unemployment Aug.1 Q M
July 1969
Aug.1968
Seasonally adjusted
Aug.1969
July1969
June1969
MayI960
Apr.I960
Less than J weeks ..................................... 1 ,600 1,858 1,593 1,636 1,677 1 ,591 1,777 1 ,7245. to 14 w eek s ........................................................ 957 986 ' 851 861 830 813 629 73715 weeks and o v e r ................................................ 313 337 328 382 419 383 409 393
15 to 26 weeks.................................................. 181 159 175 244 244 258 278 25427 weeks and o v e r ................................ .. 131 179 153 138 175 125 131 139
Digitized for FRASER http://fraser.stlouisfed.org/ Federal Reserve Bank of St. Louis

Table A -5: U nem ployed persons by reason for unem ploym ent, sex, a g e, and color,
not seaso n ally ad justed
Reason for unemployment
Totalunemployed
Male, 20 years and over
Female, 20 years mid over
Both sexes, 16 to 19 years
White Negro and other races
Aug.1969
Aug.1968
Aug.1969
Aug.1968
Aug.1969
Aug.1968
Aug.1969
Aug.1968
Aug.1969
Aug.1968
Aug.1969
Aug.1968
UNEMPLOYMENT LEVEL
Total unemployed, in thousands................. . 2 ,869 2,772 888 913 1,119 1,036 865 822 *2 ,257 2 ,196 613 575Lost last j o b ................. .................................. 894 965 469 534 310 282 115 150 684 767 210 199Left last jo b .................................................... 507 493 192 163 196 215 119 115 418 400 89 93Reenteted labor fo rc e ................................... 997 870 200 205 549 468 248 197 803 694 194 176Never worked before...................................... 471 443 24 11 64 71 383 361 352 335 119 108
Total unemployed, percent distribution . . 100 .0 100 .0 100 .0 1 00 .0 100 .0 100.0 100 .0 100 .0 100 .0 100 .0 100 .0 100 .0Lost last f o b ................................................. 3 1 .2 3 4 .8 5 3 .0 5 8 .4 27 .6 2 7 .2 13 .4 18 .2 30 .2 34 .9 34.3 3 4 .5Left last jo b .................................................... 17 .7 17 .8 21 .7 17 .9 17.5 20 .8 13 .8 13 .9 18 .5 18 .2 14 .5 16 .2Reentered labor force ................................... 3 4 .7 3 1 .4 2 2 .6 2 2 .5 4 9 .1 4 5 .1 28 .7 23 .9 35 .6 3 1 .6 3 1 .6 30 .5Never worked before....................... 1 6 .4 1 6 .0 2 .7 1 .2 5 .7 6 .9 4 4 .3 4 3 .9 15 .6 15 .3 19.5 18 .8
UNEMPLOYMENT RATE
Total unemployment r a t e ................................ 3.5 3.5 1 .9 2 .0 4 .2 4 .1 10 .0 9 .9 3 .1 3 .1 6 .6 6 .4fob-loser rate1 ................................ .. 1.0 1 .2 1.0 1 .2 1 .1 1; 1 1 .3 1 .8 .9 1.0 2 .3 2 .2job-leaver rate1 ........................................... .6 .6 .4 .4 .7 .8 1 .4 U 4 -.6 .6 1.0 1.0Reentrant rate1 .............................................. 1 .2 1 .1 .4 .4 2 .0 1*8 2 .9 2 .4 1 .1 1.0 2 .1 2 .0New entrant rate1............................................ .6 .6 .1 .2 .3 4 .4 4 .3 .5 .5 1 .3 1 .2
1 Unemployment rates mre cslculsted ns n percent o f die civilian labor force.
Table A -6 : U nem ployed persons by age and sex
Age and sex
Thousands o f persons Percent looking for Seasonally adjusted unemployment rates
Aug.1969
J u ly1969
full-timework Ju ly
1969June1969
May1969
A pr.1969
Aug.1968Auk. 1969
Aug.1969
Total, 16 years and o v e r ................................ 2 ,8 6 9 3 ,1 8 2 7 8 .5 3 .5 3 .6 3 .4 3 .5 3 .5 3 .5
16 to 19 years.................................................. 865 1 ,250 6 4 .2 1 2 .5 12 .2 1 1 .6 1 2 .5 12 .8 12 .316 and 17 y e a r s ......................................... 455 704 4 7 .7 1 6 .1 14 .7 13 .4 1 3 .8 14 .5 1 3 .818 and 19 y e a r s ......................................... 410 546 8 2 .4 9 .9 10 .4 1 0 .0 11 .8 11 .5 11 .2
20 to 24 years................................................. 566 594 8 7 .5 5 .4 5 .9 5 .3 5 .4 5 .7 6 .025 years and o v e r ......................................... 1 ,439 1 ,338 8 3 .5 2 .3 2 .3 2 .2 2 .2 2 .2 2 .2
25 to 54 y e a r s ............................................ 1 ,1 6 0 1 ,067 8 5 .2 2 .4 2 .3 2 .3 2 .3 2 .3 2 .355 years and o v e r ...................................... 279 270 7 6 .3 2 .0 2 .1 2 .0 1 .7 2 .0 2 .0
Males, 16 years and o v e r ................................ 1 ,2 9 3 1 ,680 7 9 .7 2 .7 3 .0 2 .7 - 2 .7 2 .7 2 .8
16 to 19 years................................................. 407 663 60 .2 1 1 .1 1 2 .0 1 0 .4 1 1 .0 1 1 .4 10 .916 and 17 y e a r s ......................................... 251 394 4 6 .2 15.7 14 .7 12 .7 13 .9 1 2 .6 1 2 .818 and 19 y e a r s ......................................... 156 268 8 2 .7 7 .6 10 .0 8 .3 8 .8 10 .4 9 .5
20 to 24 years............................................. . 237 285 8 9 .9 4 .5 5 .5 4 .8 4 .8 4 .7 5 .325 years and o v e r ......................................... 648 660 8 8 .4 1 .7 1 .8 1 .6 1 .7 1 .6 1 .8
25 to 54 y e a r s ............................................ 478 500 9 3 .7 1 .7 1 .7 1 .6 1 .8 1 .6 1 .755 years and o v e r ...................................... 170 159 7 2 .9 2 .0 2 .0 1 .8 1 .6 1 .7 1 .9
Females, 16 years and over . . . . . . . . . . 1 ,577 1 ,574 7 7 .4 4 .9 4 .6 4 .7 4 .8 4 .9 4 .8
16 to 19 years................................................. 458 587 6 7 .7 14 .1 12 .5 12.9 14 .5 14.5 1 4 .016 and 17 y e a r s ............ ............................ 204 310 4 9 .5 16.7 14 .8 14.3 1 3 .5 16 .9 1 5 .418 and 19 y e a r s ......................................... 254 277 82 .7 12 .3 10 .8 11 .9 15 .2 12 .7 1 3 .1
20 to 24 years................................................. 328 309 8 6 .0 6 .4 6 .3 5 .9 6 .1 6 .8 6 .825 years and o v e r ......................................... 791 678 7 9 .4 3 .3 3 .2 3 .3 3 .1 3 .2 3 .1
25 to 54 years ............................................. 682 566 7 9 .2 3 .6 3 .5 3 .6 3 .4 3 .6 3 .455 years and o v e r ...................................... 109
“
8 0 .7 2 .1 2 .3 2 .3 1 .8 2 .4 2 .1
Digitized for FRASER http://fraser.stlouisfed.org/ Federal Reserve Bank of St. Louis
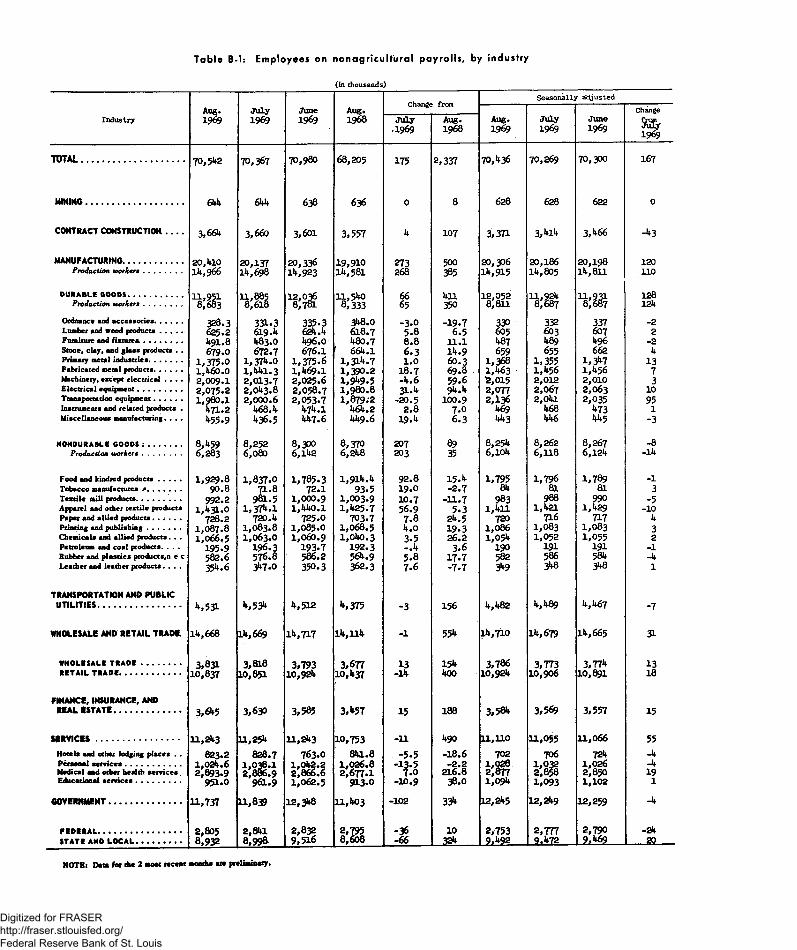
Table B-1: Employees on nonagricultural payrolls , by industry
(In thousands)Seasonally adjusted
Aug. July June Aug. irum ChangeIndustry 1969 1969 1969 1968 July Aug. Aug. July June
1969.1969 1968 1969 1969 1969
TOTAL.......................................... m cko 70,367 70,980 68,205 17c 2,337 70,436 70,269 70,300 167
MINING................................................... 61*
3,66k
644
3,660
638
3,601
636
3,557
0 8 628 628 622 0
CONTRACT CONSTRUCTION______ 4 107 3,371 3*14 3,466 -43
MANUFACTURING............................... 20*10 20,137 20,336 19,910 273 20,306 20,186 20,198 120Production worker*..............
50014,966 14,698 14,923 14,581 268 385 14,915 14,805 14,811 n o
DURABLE GOODS................ 11,540 8,'333
6665
411350
12,0528,811
11 00kW r
128124Production worker*.............. 8,683
JLL.OOP8,618
328.3 331.3 335.3 348.0 -3.0 -19.7 330 332 337 _2Lumber and wood products........... 629.2 619.4 624.4 618.7 5.8 6.5 605 603 607 2
491.8 483.0 496.O 480.7 8.8 11.1 487 489 496 _2Stone, clay, and glass products . . 679.0
1,375-0672.7
1,374.0676.1
1,375.6' 664.1 1,314.7
6.3i n 14.960.3
6591,368
6551,355
6621,347
413X«v
Fabricated metal products..............Machinery, except electrical . . . .
1.460.02.009.1 2,075-2
1,441.32.013.72.043.8
1,469.12,025.62,058.7
1,390.21,949.51,980.8
18.7-4.631.4
69.859.694.4
1,46312,0152,077
1,4562,0122,067
1,4562,0102,063
73
101,980.1 2,000.6 2,053.7 1,879.2 .a n c 2,136 2,04l 2,035 QA"A/ • P JLVAJy 7?
Instruments and related products . 471.2 468.4 474.1 464.2 2.8 7.0 469 468 473 1Miscellaneous manufacturing. . . . 455.9 436.5 447.6 449.6 19.4 6.3 443 446 445 -3
NONDURABLE GOODS : ................. 8,459 8,252 8,300 8,370 207 89 8,254 8,262 8,267 -8Production worker* .............. 6,283 6,080 6,142 6,248 203 35 6,104 6,118 6,124 -14
Food and kindred products........... 1,929.8 1,837.0 1,785.3 1,914.4 92.8 15.4 1,795 1,796 1,789 -1Tobacco manufactures w*................. 90.8 71.8 72.1 93.5 19.0 -2.7 84 81 81 3Textile mill products...................... 992.2 981.5 1,000.9 1,003.9 10.7 -11.7 983 988 990 -5Apparel and other textile products 1,431.0 1,374.1 1,440.1 1,425.7 56.9 5.3 1,411 1,421 1,429 -10Paper and allied products. . . . . . 728.2 720.4 725.0 703.7 7.8 24.5 720 716 717 4Printing and publishing................. 1,087.8 1,083.8 1,085.0 1,068.5 4.0 19.3 1,086 1,083 1,083 3Chemicals and allied products. . . 1,066.5 1,063.0 1,060.9 1,040.3 3.5 26.2 1,054 1,052 1,055 2Petroleum and coal products. . . . 195.9 196.3 193.7 192.3 -.4 3.6 190 191 191 -1Rubber and plastics products,n e c 582.6 576.8 586.2 564.9 5.8 17.7 582 586 584 -4Leather and leather products. . . . 354.6 347.0 350.3 362.3 7.6 -7.7 349 348 348 1
TRANSPORTATION AND PU BLICU T IL IT IE S ............... ....................... 4,531 4,534 4,512 *,375 -3 156 4,482 4,489 4,467 -7
W HOLESALE AND R ET A IL TRADE. 14,668 14,669 14,717 14,114 -1 554 14,710 14,679 14,665 31
WHOLESALE TRADE .................... 3,831 3,818 3,793 1 7 154 3,786 3,773 3,774 i n3, O f f-14 18RETAIL TRADE............................. i n A77 10,851 10,924 10,437 400 10,924 10,906 10,891
FINANCE, INSURANCE, ANDR EA L ES T A T E ................................... 3,630 3,585 3,457 i s 188 3,584 3,569 3,557 15
S E R V IC E S ........................................... 11,243 11,254 11,243 10,753 -11 490 11,110 11,055 11,066 55Hotels and other lodging places . . 823.2 828.7 763.0 841.8 -5.5 -18.6 702 706 724 -4Personal sen d ees ............ 1,024.6 1,038.1
2,886.91,042.2 1,026.8 -13.5 -2.2 1,028 1,032 1,026 -4
Medical and other health sendees. 2,893.9 2,666.6 2,677.1 7.0 216.8 2,877 2,858 2,850 19Educational sen dees....................... 951.0 961.9 1,062.5 913.0 -10.9 38.0 1,094 1,093 1,102 1
GOVERNM ENT...................................... 11,737
2,8058,932
11,839
2,8418,998
12,348
2,8329,516
11,403
2,7958,608
-102 334
10
12,245
2,753 9,492___
12,249
2,7779.472
12,259
2,790 9.*>69___
-4
PCDERAL. ....................................... -36 -24STATE AND LOCAL........... -66 ____ ___ 22___
NOTE: Data lor die 2 moor recent months are preliminary.
Digitized for FRASER http://fraser.stlouisfed.org/ Federal Reserve Bank of St. Louis

Table B-2: Average weekly hours of production or nonsupervisory workers1on private non ag ricultural p ayro lls, by industry
IndustryAug.1969
July1969
[ i
ta
Aug.1968
Change bemSeasonally adjusted
Aug.1969
July1969
if
Change
J £ _July1969
Aug.1968
TOTAL PRIVATE...................... 38.3 38.1 38.0 38 .3 0.2 0 .0 37.9 37 .8 37*8 0 .1MINING................................................... 43 .0 43 .4 42 .5 ^3-3 - .4 - . 3 42 .5 42 .9 42 .0 - .4CONTRACT CONSTRUCTION------ 39.2 38 .7 38.5 38.8 .5 .4 37.9 37.^ 37 .6 .5MANUFACTURING.............. ................ 4o .6 40 .5 40.9 40.7 .1 - . 1 40 .6 40 .7 40 .7 - . 1
3 .6 3 .5 3.7 3.6 .1 0 3 .6 3 .6 3 .6 0DURABLE ROODS........................... 4 i . l 40 .9 41 .5 4 l . l .2 0 41 .3 4 1 .2 4 1 .3 .1
3.7 3.6 3.9 3.6 .1 .1 3 .7 3 .8 3.9 - .1Ordnance sad accessories.............. 1+0.3 39.9 40 .8 41 .5 .4 - 1.2 40 .5 4 0 .3 40 .9 .2Luabtr and wood products . . . . . 40 .2 39.8 40 .7 41 .2 .4 - 1.0 39.8 39.8 40 .2 0Furniture aad fixtures................... 40.7 39.7 40 .8 41 .2 1 .0 - .5 40 .2 40 .1 40 .7 .1Scone, clay, and glass products . . 42 .3 42 .0 42 .4 42 .4 • 3 -.1 41 .8 41 .8 41 .9 0Primary accal iaduatriea................. 41.5 41 .6 42 .0 40 .1 - .1 1 .4 41 .7 41 .5 41 .7 .2Fabricated s e a l products............ 41.5 41 .1 42 .0 41 .8 .4 - .3 41 .4 41.5 41 .8 - .1Machinery, except electrical. . . . 41 .8 41 .8 42 .6 41 .5 0 • 3 42 .4 42 .2 42 .5 .2Electrical equipacot................ 40 .2 39*8 40 .7 40 .4 .4 - . 2 40 .3 4 0 .3 40 .6 0
41.4 41 .7 41 .6 41 .4 - 3 0 42 .2 42 .4 41 .6 - .2laacraaaacs aad related products . 40.6 4 o .4 41.0 40 .4 .2 .2 40 .8 40 .8 40 .9 0Miscellaneous manufacturing. . . . 39.2 38.5 39.2 39.4 .7 - .2 39.1 39.2 39.2 - .1
HONOURABLE GOOOS................... 39.9 39.8 39.9 k0.2 .1 - .3 39.6 39.7 39.8 - .1 -
3.4 3.4 3.4 3-5 0 - .1 3 .3 • 3.4 3.4 - .1Food and kindred products........... 41.1 41 .2 40 .9 41 .5 - .1 -.4 40 .7 40 .6 40 .7 .1Tobncco manufactures................... 36.5 37.6 39.9 39.0 - 1.1 -2 .5 36.2 38.1 39.5 -1 .9Textile a ill products...................... 41.0 40 .8 41 .4 41 .3 .2 - .3 40 .9 41 .3 41 .2 - .4Apparel and other textile products 36.4 36.0 36.3 36.5 .4 - .1 36.0 36.1 36.2 - .1Paper and allied products.............. 43.1 43 .0 43 .0 43 .2 .1 - .1 42 .9 43 .0 42 .9 - .1Printing and publishing................. 38.6 38.4 38.it 38.7 .2 - .1 38.4 38.5 38.4 - .1Cheaicals and allied products. . . 41 .6 4 1 .6 41 .8 41 .6 0 0 41 .8 41 .8 41 .8 0Petroleua and coal products . . . 43.1 43 .5 42 .5 42 .3 - .4 .8 43.O 42 .8 42 .2 .2Rubber and plastics products, n e c 41 .2 40 .7 41 .3 41 .6 .5 - .4 41 .1 41 .1 41 .3 0Leather and leather products. . . . 37.2 37.5 37.8 38.3 - .3 - 1.1 36.9 37.1 37.4 - .2
W HOLESALE AND R ET A IL TRADE. 36.6 36.5 35.9 37.0 .1 - .4 35.8 35.7 35.7 .1WHOLESALE TRADE ................... 40 .3 40 .3 40 .1 40 .4 0 - .1 40 .1 40 .0 40 .0 .1RETAIL TRAOE.............................. 35.3 35*2 34.5 35.8 .1 - .5 34.2 34.2 34.2 0
FINANCE, INSURANCE, AND *R EA L ES T A T E .................................. 37.0 37.0 37-1 37.1 0 - .1 37.0 36.9 37.2 .1
iData relate to production workers in mining and manufacturing* to construction workers in contiict constructions and to nonsupervisory workers in wholesale and retail trade; finance, insurance, and real estate; transportation and public utilities; and services. These groups account for approximately four-fifths of the total employment on private nonagricultural payrolls. Transportation and public utilities, and services are included in Total Private but are not shown separately in this table.
NOTE: Data for the 2 most recent months are preliminary.
T a b le B -3: A verag e hourly and w eekly earn in gs of production or nonsupervisory w orkers1*on private n o n ag ricu ltu ral payrolls, by industry
Average hourly earnings Average weekly earnings
Industry Aug. July June Aug. Change from Aug. July June Aug. Change from1969 1969 1969 1968 July
1969Aug.1968
1969 1969 1969 1968 July1969
Aug.1968
TO TAL P R IV A T E .......................... $3.04 $3.04 $3 .03 $2.85 $0.00 $0.19 $116.43 $115.82 $115.14 $109.16 $0.61 $7.27MINING................................................... 3.57 3.58 3.55 3.34 - .0 1 .23 153.51 155.37 150.88 144.62 -1 .86 8.89CONTRACT CON STRUCTION ------ 4 .78 4.74 4.71 4.40 .04 • 38 187.38 183.44 181.34 170.72 3.94 16.66M ANUFACTURING............................. 3.18 3.19 3.17 2.99 -.0 1 .19 i 2 9 . l l 129.20 129.65 121.69 -.0 9 7.42
DURABLE 6 0 0 0 S ........................... 3.37 3.37 3.36 3.17 0 .20 138.51 137.83 139.44 130.29 .68 8.22Ordnance aad accessories.............. 3.45 3.44 3.45 3.23 .01 .22 139.04 137.26 140.76 134.05 1.78 4.99Lumber nod wood products........... 2.74 2 .73 2.71 2 .6 l .01 .13 110.15 108.65 110.30 107.53 I .5 0 2.62Furniture aad fixtures................... 2.65 2.62 2 .62 2.48 .03 .17 107.86 104.01 106.90 102.18 3.85 5.68Suae, clay, aad glass products . . 3.18 3.18 3.17 3.02 0 .16 134.51 133.56 134.41 128.05 .95 6.46Primary metal industries................. 3.78 3.79 3.76 3.55 - .0 1 .23 156.87 157.66 157.92 142.36 -.7 9 14.51Fabricated metal products.............. 3.34 3.33 3-33 3.16 .01 .18 138.61 136.86 139.86 132.09 1.75 6.52Machinery, except electrical. . . . 3.56 3.56 3.56 3.35 0 .21 148.81 148.81 151.66 139.03 0 9 .78Electrical equipment...................... 3.09 3.09 3.08 2.92 0 .17 124.22 122.98 125.36 117.97 1.24 6.25Transportsrioa equipment.............. 3.88 3.89 3.86 3.64 - .0 1 .24 160.63 162.21 160.58 150.70 -1 .5 8 9.93Instruments aad related products . 3.15 3.14 3.15 2.99 .01 .16 127.89 126.86 129.15 120.80 1 .0 3 7.09Miscellaneous manufacturing. . . . 2.64 2.64 2.65 2.49 0 .15 103.49 101.64 103.88 98.11 1.85 5.38
NONDURABLE GOODS................... 2.91 2.92 2.89 2.75 - .0 1 .16 116.11 116.22 115.31 110.55 -.1 1 5.56Food aad kindred products........... 2.93 2.96 2.94 2.77 - .0 3 .16 120.42 121.95 120.25 114.96 -1 .5 3 5.46Tobacco manufactures................... 2.51 2.77 2 .79 2.45 - .2 6 .06 91.62 104.15 H l .3 2 95.55 - 2 2 . 53 -3 .9 3Textile mill products...................... 2.38 2.35 2.31 2.24 .03 .14 97.58 95.88 95 .63 92.51 1.70 5.07Apparel and other textile products 2.32 2 .28 2.30 2.23 .04 .09 84.45 82.08 83.49 a i .4 o 2.37 3.05Paper nod allied products.............. 3.28 3.26 3-22 3.07 .02 .21 141.37 140.18 138.46 132.62 1 .19 8.75Printing and publishing................. 3.71 3.69 3.68 3.50 .02 .21 143.21 141.70 141.31 135.45 1.51 7.76Chemicals aad allied products. . . 3.49 3.49 3.46 3.29 0 .20 145.18 145.18 144.63 136.86 0 8.32Petroleum and coal products . . . 3.98 4 .0 3 • 4.00 3.73 - .0 5 .25 171.54 175.31 170.00 157.78 -3 .7 7 13.76Rubber aad plastics product* n e c 3.10 3.08 3.05 2.94 .02 .16 127.72 125.36 125.97 122.30 2.36 5.42Leather and leather products. . . . 2.34 2.34 2.35 2.23 0 .11 87.05 87.75 88 .83 85.41 - .7 0 1 .6 4
W HOLESALE AND R ET A IL TRAD E 2.56 2.55 2.55 2.40 .01 .16 93.70 93.08 91.55 88.80 .62 4.90WHOLESALE TRAD E................... 3.23 3.23 3.24 3.04 0 .19 130.17 130.17 129.92 122.82 0 7.35RETAIL TRADE..............................
FINANCE. INSURANCE, AND2.30 2.30 2 .30 2 .16 0 .14 81.19 80.96 79.35 77 .33 .23 3.86
R EA L E S T A T E .................................. 2.91 2.90 2 .93 2 .76 .01 .15 107.67 107.30 IO8.70 102.40 .37 5.27
1 See footnote 1, table B-2.NOTE: Data for the 2 most recent months are preliminary.Digitized for FRASER
http://fraser.stlouisfed.org/ Federal Reserve Bank of St. Louis