bls_1812_1974.pdf
TRANSCRIPT

/ t a American Telephone and Telegraph Company—Long Lines Department, and Communications Workers of America (AFL-CIO), October 1940-July 1974Bulletin 1812U.S. DEPARTMENT OF LABOR Bureau of Labor Statistics 1974
Digitized for FRASER http://fraser.stlouisfed.org/ Federal Reserve Bank of St. Louis

American Telephone and Telegraph Company—Long Lines Department, and Communications Workers of America (AFL-CIO), October 1940-July 1974Bulletin 1812
U.S. DEPARTMENT OF LABOR Peter J. Brennan, Secretary
BUREAU OF LABOR STATISTICS Julius Shiskin, Commissioner 1974
For sale by the Superintendent of Documents, U.S. Government Printing Office, Washington, D.C. 20402, GPO Bookstores, orBLS Regional Offices listed on inside back cover. Price $1.15
Make checks payable to Superintendent of Documents.
Digitized for FRASER http://fraser.stlouisfed.org/ Federal Reserve Bank of St. Louis

Digitized for FRASER http://fraser.stlouisfed.org/ Federal Reserve Bank of St. Louis

Preface
This bulletin is prepared by the Bureau of Labor Statistics as part of a series that traces changes in wage scales and related benefits negotiated by individual employers or combinations of employers with a union or group of unions. Benefits unilaterally introduced by an employer generally are included. The information is obtained largely from collective bargaining agreements and related documents voluntarily filed with the Bureau. Descriptions of the course of collective bargaining are derived from the news media and confirmed and supplemented by the parties to the agreement. Wage chronologies, dealing only with selected features of collective bargaining or wage determination, are intended primarily as a tool for research, analysis, and wage administration. References to job security, grievance procedures, methods of piece-rate adjustments, and similar matters are omitted. For a detailed explanation of the purpose and scope of the chronology program, see “Wage Chronologies and Salary Trend Reports,” BLS Handbook o f Methods, Bulletin 1711 (Bureau of Labor Statistics, 1971), pp. 209-212.
This wage chronology summarizes changes in wage rates and related compensation practices negotiated by the American Telephone and Telegraph Company’s Long Lines Department with the Communications Workers of America (AFL-CIO) since 1940. This bulletin replaces Wage Chronology: A.T. & T. - Long Lines Department, 1940-64, published as BLS Bulletin 1443, and incorporates the supplement covering the 1965-70 period. Materials previously published have been supplemented by contract changes negotiated in 1970 and 1971. Except for a revised introduction and other minor changes, earlier texts are included as they were originally published.
The section for 1965-74 was prepared in the Division of Trends in Employee Compensation by William M. Davis and John J. Lacombe II.
ill
Digitized for FRASER http://fraser.stlouisfed.org/ Federal Reserve Bank of St. Louis

Contents
Page
In troduction .......................................................................................................................................... 1Summary of contract negotiations...................................................................................................... 3
July 1952-December 1964 .................................................................................................. 3January 1965-December 1966 ............................................................................................ 4January 1967-July 1968 ...................................................................................................... 4July 1968July 1 9 7 1 ............................................................................................................ 5July 1971 July 1974 ............................................................................................................ 5
Tables:1. General wage changes, 1940-52 72. General wage changes, 1953-73 103. Weekly salary rates for plant central office craftsmen, selected cities, January 1941
and July 1946 ................................................................................................................ 134. Weekly salary rates for plant central office craftsmen, selected cities, 1952-70 . . . . 135. Weekly salary rates for plant central office craftsmen, selected cities,
1971-73 ......................................................................................................................... 176. Weekly salary rates for traffic central office
employees, selected cities and occupations,January 1941 and July 1946 .............................................................. . . . 19
7. Weekly salary rates for traffic central office employees, selectedcities and occupations, 1952-70 .................................................... . . 19
8. Weekly salary rates for traffic central office employees, selectedcities and occupations, 1971-73 ........................................................... . . 25
9. Weekly salary rates for clerical employees, selected groups and cities,August 1944 and July 1946 ......................................................................................... 26
10. Weekly salary rates for clerical employees, selected groups and cities,1952-70 ......................................................................................................................... 27
11. Weekly salary rates for clerical employees, selectedgroups and cities, 1971-73 ............................................................................................ 34
12. Special and special city allowances, 1971-73 ..................................................................... 3713. Salary progression schedule for operators, selected cities, 1940-50 ................................. 3814. Supplementary compensation practices ............................................................................... 39
Overtime p a y ............................. 39Night premium p a y .............................................................................................................40Premium pay for Sunday w o r k .............................................................. 42Holiday pay .......................................................................................................................42Vacation p a y .......................................................................................................................45Termination pay (dism issals).............................................................................................46In-charge p a y ....................................................................................................................... 47Travel-time p a y .................................................................................................................... 47Jury duty or summons p a y ................................................................................................ 48Voting p a y .......................... 48
Digitized for FRASER http://fraser.stlouisfed.org/ Federal Reserve Bank of St. Louis

Contents—Continued
Page
Meal Allowance .....................................................................................................................49Bereavement p a y .....................................................................................................................49Absence pay ........................................................................................................................... 49Call-out pay ............................................................................................................................50Shifted-tour pay .....................................................................................................................50Board and lodging ..................................................................................................................51Carfare allowance ..................................................................................................................51Severance p a y ............................................................................................................................52Sick leave p a y ............................................................................................................................52Health and welfare b en efits ................................................................................................. 53Pension p lan ...............................................................................................................................62
Wage chronologies available ........................................................................................................70
Digitized for FRASER http://fraser.stlouisfed.org/ Federal Reserve Bank of St. Louis

Digitized for FRASER http://fraser.stlouisfed.org/ Federal Reserve Bank of St. Louis

Introduction
The Long Lines Department of the American Telephone & Telegraph Co. is a separate operating unit of the Bell System. Together with 24 associated Bell Companies and a number of independent telephone companies, Long Lines furnishes telephone service throughout the United States, to foreign countries, and to ships at sea. It operates toll lines and related equipment for communication between and through the territories of the associated and independent companies. In addition to long distance telephone service, it furnishes private line telephone and telegraph; data, radio, and television transmission; and other special services.
To operate this network, Long Lines employs approximately 35,000 workers in about 700 localities in the United States. Approximately 330 gangs are maintained to construct and repair long distance telephone lines. Despite this wide dispersal, one-fifth of the Department’s employees are concentrated in the New York metropolitan area, the site of its headquarters.
Since 1919, the year in which the Association of Employees of the Long Lines Department was formed, Long Lines employees have been represented by a number of labor organizations. The Association, which worked through an employee representation plan, became an independent labor organization in 1935. In 1939, the employees organized the Federation of Long Lines Telephone Workers, which was renamed American Union of Telephone Workers in 1946. During the various phases of its existence, the union was unaffiliated, affiliated with the National Federation of Telephone Workers,1 and affiliated with the Telephone Workers Organizing Committee (TWOC-CIO). The National Federation of Telephone Workers was renamed Communications Workers of America (CWA) in 1947. It voted to affiliate with the CIO in 1949, at which time the Long Lines section of TWOC (CIO) was made Division No. 10 of the national union. In April 1951, the organizational structure of CWA was changed to the two-level form of locals and international, and in May of
1 An independent confederation of autonomous local unionsorganized in 1938.
that year, CWA-CIO was substituted for Division No. 10 as the bargaining agent for Long Lines employees.
Contract negotiations between the CWA and Bell System companies have been characterized by agreements negotiated and signed individually with the various companies. Although the contracts have often been similar, pattern bargaining, as such, was not instituted until 1971. In that year, the union selected two companies as targets and the resulting settlements were then used as a pattern for the other companies in the System. Separate contracts are still signed for each company and the Long Lines Department.
The current collective bargaining agreement between the Long Lines Department and the CWA affects nonsupervisory, administrative office, operations (plant and traffic), central office, headquarters service, gang, and dining service employees. This chronology, however, is limited to wages and benefits affecting operations (plant and traffic), central office, and gang employees, and wage provisions only of non-supervisory clerical employees in all locations. Traffic employees, who operate the equipment necessary to establish connections between various localities, and plant employees, who construct, install, and maintain the operating facilities, are the most important numerically. Clerical employees also constitute a major group.
Employees in the bargaining unit are classified not only by occupation, which determines rate range of pay, but also by group, which determines how working practices and related benefits are applied. All employees are classified as Group A or Group B.2 In essence, Group A encompasses the employees engaged in construction, maintenance, and switchboard operation, and Group B includes those performing administrative office and headquarters service work. Operations (plant and traffic) central office and gang employees are classified mainly in Group A; dining service employees are in Group A only; and all administrative office employees— primarily clerks and desk workers— and headquarters service
yClassification of employees into groups had its origin
before the enactment of the Fair Labor Standards Act. Group A employees, during that period, received overtime pay; Group B employees did not.
Digitized for FRASER http://fraser.stlouisfed.org/ Federal Reserve Bank of St. Louis

employees, are classified in Group B. Furthermore, such working practices and related benefits vary among and within departments by occupational groups and length of service. In some cases, working practices, such as holidays observed, also vary by locality.
Salary rates and progression from the minimum or starting rate are governed by well-defined schedules. These schedules explicitly set forth the amount of time required to move from one step in the progression to another as well as the weekly salary increase accompanying each step upward. Movement up the scale is practically automatic. Salary rates vary by locality.
The first collective bargaining contract between the Long Lines Department and the Federation of Long Lines Telephone Workers became effective in Octobei 1940. By its terms, the existing wage schedules and working practices were made a part of the agreement. Provisions reported under that date do not, therefore, necessarily indicate changes in previous conditions of employment. This chronology traces changes affecting full-time employees since 1940 as provided by collective bargaining agreements and by directive orders of the National War Labor Board.
Digitized for FRASER http://fraser.stlouisfed.org/ Federal Reserve Bank of St. Louis

Summary of contract negotiations
July 1952-December 1964
From 1952 to 1964, negotiations between American Telephone & Telegraph Co.’s Long Lines Department and the Communications Workers of America resulted in gradually lengthening contract periods, substantial wage increases, annd improvements in and additions to the fringe benefits provided employees.3 Contracts negotiated between 1952 and 1957 each ran for a 1-year term, and the 1958 and 1959 agreements remained in effect for 16 months. In 1960, the company and the union signed a contract which ran for 3 years, with two wage reopenings, and in 1963 they negotiated a minimum 38-month agreement, also with two wage reopenings.
During each negotiation, the union proposed a general wage increase and reclassification of some towns into higher rated zones. Frequently, it also proposed reductions in the time required to progress from the minimum to the maximum job rate and the elimination of area differentials. It also asked for various changes in supplementary benefits. Reductions in the workweek, in some cases to 35 hours, were proposed a number of times. Beginning in 1953, a company-paid health and welfare plan was demanded in each negotiation until a plan was established by the 1963 contract.
Of the 11 settlements, 2 were wage reopeners, and therefore covered only wage items; 9 changed both wages and supplementary benefits. In addition to wage increases, most of the settlements reclassified some towns into higher rated zones, and two reduced the length of time required for employees in specified classifications to progress from the minimum to the maximum rate for their job.
From 1952 through the 1963 settlement, the basic maximum rates of pay for long distance operators increased an average of 45 percent or about $26 a week.
The 1952 agreement between the company the CWA-CIO went into effect on July 5, 1952, and contained no wage reopening provision.
3 Each of the contracts was for a specified minimum period, and could be terminated at the end of the period by either party on 60 days’ prior written notice.
In 1953, negotiations were opened in May, about 2 months before the scheduled termination date of the existing agreement. The 1-year settlement reached on September 2, 1953 increased wages by amounts ranging up to $8 a week, including increases resulting from shortening all 6%-year progression schedules to 6 years. The waiting period for payment for absence because of illness was reduced.
Bargaining began in mid-August 1954, and on October 9, the parties announced agreement on a contract to remain in effect until October 24, 1955. It provided wage advances effective October 9 (including those resulting from reclassification of several towns) of up to $5.50 a week for employees with at least 1 year of service. Wage rates of employees with shorter service were not changed.
The 1955 negotiations started on September 22 and continued after termination of the contract on October 24, with agreement being consummated on November14 and effective on November 28. Weekly wage rates, including increases resulting from the shortening of some progression schedules and the reclassification of some towns, were increased $1 to $10, effective November 14. The agreement added Veterans’ Day as a paid holiday in nine states where it had not previously been recognized.
In 1956, the union opened negotiations on October15 and, when the existing contract expired on November 28, the parties agreed to continue negotiations. The contract agreed to on December 5 raised pay $1 to $11.50 a week, effective immediately. The plant night-shift differential was increased for some employees, health benefits were liberalized, and sickness and disability benefits were extended to workers with 1 but less than 3 years of service. The contract was to run from December 19, 1956 through January 3, 1958.
Contract renewal talks were again opened on November 15,1957, and were concluded on January 11, 1958 with a 16-month agreement effective February 10. Wage increases of $1 to $9.50 were effective January 11, including increases resulting from reclassification of seven towns. Maximum carfare allowances for operators on double tours of duty were increased, and negotiations were continued on group life insurance and amendments to the pension plan. On May 12, the company agreed to
Digitized for FRASER http://fraser.stlouisfed.org/ Federal Reserve Bank of St. Louis

a contributory life insurance plan for regular employees with 6 months or more of service. Benefits were to approximate annual basic wages with a minimum of $2,000. Accord on an amended pension plan was reached in January 1959.
Negotiations for revisions in the 1958 contract began on May 1, 1959, and were concluded on June 10 with agreement on weekly wage advances ranging up to $12, including increases resulting from reclassification of 20 towns. A fourth week of vacation was added for employees with at least 30 years’ service, the differential paid to employees assigned “in-charge” responsibilities was increased, and carfare allowances were raised.
Negotiations that began early in September 1960 resulted in agreement on a 3-year contract, after extended negotiations and a vote authorizing the leadership to call a strike. The economic changes agreed to in the contract of November 9 provided wage advances of $1 to $10 including increases resulting from the upgrading of 15 towns, in addition to liberalized provisions for vacations, life insurance, and pensions, and establishment of a company-financed major medical (Extraordinary Medical Expense) plan. The agreement provided for two annual wage reopenings.
Under the first reopening, weekly wages were increased $1 to $9, including the effects of upgrading 15 towns. In addition, the progression schedule for operators was reduced from 6 to 5Vi years, effective November 9, 1961. A year later, under the second wage reopening, company and union negotiators agreed to wage increases of $1.50 to $10.50 a week, including increases resulting from the upgrading of 56 towns. The agreement covered 23,000 workers in 42 States and the District of Columbia.
The 1963 negotiations began on September 20 and were concluded with a 38-month agreement on November 11, 1963. Weekly wage rates, including increases resulting from the reclassification of 42 towns, were raised from $1 to $12. Pension and other welfare benefits were also improved. A separate agreement was reached on a basic contributory hospital-surgical-medical plan. The agreement, which covered 22,600 employees in 42 states and the District of Columbia, also provided for wage reopeners in 1965 and 1966.
January 1965-December 1966
On January 11, 1965, under the first reopening of their 1963 agreement, officials of American Telephone & Telegraph Co.’s Long Lines Department and the Communications Workers (CWA) agreed to wage changes, which ranged up to a $13-a-week increase. The increases included amounts resulting from the reclassifi
cation of 88 towns. Workers in some areas also received additional special allowances because of remoteness, condition of the roads, and other special circumstances. Some 1,100 “merit” employees who had been earning $675 a month or less received a total wage increase of $22.50 a week. The settlement covered approximately 24,000 workers and was ratified by the union membership on February 8, 1965.
Under a second wage reopener, the parties reached an agreement on January 11, 1966, on wage increases for approximately 20,000 workers, ranging from $1 to $16 a week. The increases were made effective January 11, 1966, and reflected the consolidation of six former wage zones into four, which resulted in the reclassification of 154 towns. Additional special allowances again were provided in some areas. Workers ratified the contract in early February. Also in 1966, a special medical expense plan was established for those age 65 or over so that Medicare would be supplemented rather than duplicated.
January 1967-July 1968
On January 16, 1967, 3-year basic and supplemental agreements were reached between the company and union. The settlement provided for an increase in wage rates ranging from $3.50 to $21 a week, including amounts which resulted from the reclassification of 91 towns, effective January 16, 1967. Additional special allowances were provided for workers in some areas.
Agreed-upon benefits, similar to those negotiated during the last quarter of 1966 at other Bell System companies, included a higher night differential, an additional paid holiday in some areas, a liberalized vacation schedule, an increased differential for employees assigned “in-charge” responsibilities, and a reduction in the social security offset to pension payments to 25 percent from 33-1/3 percent. Some of the other changes included a sickness-death benefit of $500 or 12 months’ wages, whichever was greater; an increased company contribution to the hospital-surgical- medical plan for dependent coverage; and the establishment of a supplementary group life insurance plan for regular employees under age 60. Elealth benefits deferred until 1968 included increased coverage for confinement in a nonmember hospital, extension of the eligibility for outpatient care to 72 hours, and a reduction in the deductible portion of the major medical expense plan. Also in 1968, the employee’s contribution for basic life insurance was to be reduced, and the company’s contribution to the hospital-surgical-medical plan for both employee and dependent coverage was to be increased.
Digitized for FRASER http://fraser.stlouisfed.org/ Federal Reserve Bank of St. Louis

The settlement, covering approximately 24,000 workers, was ratified by the union membership in late January 1967 and provided for a wage reopener after 18 months. The basic and supplemental agreements were scheduled to remain in effect until July 16, 1970.
July 1968-July 1971
The first nationwide telephone strike since 1947 ended in May 1968 when agreements were reached by the Communications Workers with various operating companies of the Bell System. The strike began when the union rejected company-proposed wage increases under wage reopening clauses of the 1966 agreements. After a stalemate in bargaining, the parties reopened all provisions of the basic and supplemental contracts and eventually agreed upon new 3-year pacts.
Negotiators for American Telephone & Telegraph Co.’s Long Lines Department, and the Communications Workers also agreed to replace the old contract, which had been reopened for wages, with new 3-year basic and supplemental agreements. The union accepted the company’s wage offer but rejected other offers, which involved primarily issues such as wage differentials by towns, working conditions, and the grievance procedure. Strike votes were scheduled in 38 cities; but a strike was averted when a settlement, similar to those reached earlier at other telephone companies, was reached on July 17, 1968, and ratified by the workers on August15.
Terms of the basic agreement provided for a first-year increase in weekly wage rates of from $1 to $27.50, which resulted from reclassification of 60 towns and increases for each occupational group, and for deferred weekly wage increases ranging from $3.50 to $8 in 1969 and from $3.50 to $8 in 1970. The deferred wage increases in lieu of wage reopeners were new to the Bell System but not to the telephone industry as a whole. Additional amounts also were provided as special allowances for workers in some areas in 1968. The progression schedules for operators and clerical employees were reduced to 5 years. Other changes in the basic contract included double time for work in excess of 49 hours a week, higher shift premium pay, a minimum of 8 paid holidays, double time and one-half for work on a holiday, and a fifth week of vacation for employees with 25 years or more of service.
Supplemental agreements on health and pension benefits included an increase in sickness benefits to a minimum of one-half pay for 52 weeks for employees with 6 months to 10 years of service and, in 1970, company assumption of the full cost of the basic
hospital-surgical-medical and group life insurance plans. In 1969, the minimum monthly pension was increased to $125 and the social security offset to pension payments was eliminated. A vested pension was established for employees age 40 with 15 years of service, payable at age 65. Benefits originally provided in the 1967 settlement and which were to become effective after the scheduled 1968 wage reopening were incorporated into the 1968 settlement.
The agreements, which covered approximately 24,000 workers, were to remain in effect until July 16, 1971. The basic agreement provided for one wage reopening at the discretion of the company at any time during the term of the contract for starting rates and progression schedules only (with stipulation to retain or reduce but not increase overall schedule length).
In 1970, the company exercised its option under the January 16, 1967 contract, as amended July 16, 1968, to reopen the agreement for the purpose of adjusting wage rates (other than maximums), wage schedules, and wage schedule assignments. The parties reached agreement in May, resulting in adjustments and the shortening of all wage progression schedules (at the bottom end) by 12 months, effective May 20, 1970. Maximum rates were unchanged, but the starting rate for each wage schedule was advanced to the 12-month rate, resulting in increases in minimum rates ranging from $2 to $23.50 a week.
The parties also agreed to some changes in the rates scheduled for July 16, 1970 under the 1968 agreement, and the increases in maximum rates for workers in the territory of the New York Telephone Co. were advanced to April 1, 1970, from the scheduled July 16 date. Minimum rates increased by $3.50 to $5.50 a week on July 16, and maximum rates rose as much as $8 a week.
July 1971-July 1974
The Communications Workers of America’s 61-member Bell System Bargaining Council met in Washington, D.C. on March 15-16, 1971, to consider the executive board’s recommended goals for the upcoming American Telephone and Telegraph Company negotiations and to adopt a bargaining strategy. Since most CWA contracts with individual Bell System units expired at various times throughout the year (the Long Lines expiration date was July 16), the union chose two units (the Chesapeake and Potomac Telephone Co. and the installation division of the Western Electric Co.) as bargaining targets. This meant that negotiations with the other units would continue, without a work stoppage,
Digitized for FRASER http://fraser.stlouisfed.org/ Federal Reserve Bank of St. Louis

even if their individual contracts had expired before a settlement was reached. A strike would only be called in the event of an impasse with either Chesapeake and Potomac or Western Electric (their contracts expired in April and May), and then against all Bell System Companies.
The initial demands of the union included a 25-percent first-year increase in wages plus a cost-of- living escalator clause; improvements in health, welfare, and pension plans, and a union security provision. Western Electric countered with fringe improvements, a 9-percent wage increase in the first year, and 21/£-percent increases in the second and third years, and a cost-of-living clause it estimated to be worth 4 percent a year.
Negotiations, which in some cases had begun as early as April, continued into June at which time the union executive board asked for strike authorization from the membership. By July, the two target companies had increased their wage offers to an estimated 30 percent over 3 years, but the union again rejected this as inadequate.
In a nationwide telecast on July 13, CWA President Joseph A. Beirne said the union would strike the following day if some movement toward equalizing differentials between male and female pay scales and geographic areas were not made, and if the comapny’s last offers were not improved and made retroactive for all units to the date of original contract expirations. The union also continued to demand a security clause which would require nonunion members of the bargaining unit to pay amounts equal to union dues.
On July 14, the union began what was to be a 5-day nationwide walkout. Although a new 3-year pact (tentatively reached by 30 of 32 CWA units on July 18) was ratified by a majority of the membership following a July 19 back-to-work order by the International, some area locals, most notably those in New York State, remained out.4
The Long Lines pact which was ratified on August 14, 1971, retroactive to July 18, provided, in addition to special area allowances (which included a new daily allowance for designated inner-city locations), an increase in minimum weekly rates ranging from $2 to $20.50 in the first year. In the second year, the increases
4 The New York State strike, which lasted 31 weeks, ended Feb. 17, 1972. The agreement was similar to the July 1971 nationwide contract except it provided for an initial minimum wage increase of $30 a week, instead of the $29 the New York employees would have received under the July agreement. It also provided for the adoption of 20-percent premium pay for Saturday work which was part uf the employees regular 40-hour week. A union shop also was adopted, compared with the modified union shop adopted in other areas.
in minimums were from $5.50 to $9, and in the third year, from $9 to $12.50. A cost-of-living escalator clause was established, with annual adjustments in July of 1972 and 1973 based on the previous year’s (May to May) change in the Bureau of Labor Statistics’ Consumer Price Index. Progression schedules for operators and clerical employees were reduced to 4 years and for plant craftsmen to 5 years.
A security clause was adopted with the provision that it apply only to employees hired after July 18, 1971, and to those hired earlier who failed to notify the company within 10 days after the 18th of their desire not to pay dues.
Improvements in the health and welfare plan, effective in 1972, included elimination of the major medical lifetime maximum of $20,000, changing the surgical benefit to 80 percent of the reasonable and customary charge and reduction of the program’s deductible to 2 percent of the annual base pay of the employee. Employees were given the option to substitute designated medical plans for the company plan.
Retirement age provisions were changed to allow men to retire under the same age and service requirements as women, and widowers living with their wives at the time of the wife’s death would receive benefits on the same basis as widows. The basic pension formula was increased to 1.5 percent per year for each year of service after age 55 (years of service previous to age 55 remained at 1 percent) and the range of minimum pensions was increased to from $100 to $145 a month, depending on service and age. Eligibility for retirement at the employee’s request was reduced to age 55 after 20 years’ service; age 50 after 25 years’ service; and at any age after 30 years’ service — however pension benefits would be discounted at the rate of 0.5 percent for each month the employee retired before age 55. Effective July 1, 1972, retirees would be reimbursed for all fees and premiums made for Medicare Part B coverage.
Other contract improvements included 4 weeks’ vacation after 17 years of service (it had been 20); a 10-percent night differential for administrative Group B employees (clerical employees); increased carfare allowances for traffic operators; establishment of a special central city allowance; inclusion of evening and night differentials in the computing of overtime pay for traffic Group A; a liberalized vacation policy; and a provision that all Long Lines employees would have at least 9 paid holidays by July 1973 (previously holiday policy had varied by area, ranging from 6 to 11).
The agreement, which covered approximately 25,000 workers, was to remain in effect until July 17, 1974. The following tables are up to date through the contract expiration date.
Digitized for FRASER http://fraser.stlouisfed.org/ Federal Reserve Bank of St. Louis

Oct. 23, 1940
Jan. 1,1941, to Oct. 8, 1942.
No general wage change
Increases ranging from $0 to $7 a week, depending upon location and position on applicable schedule. Starting rates increased up to $3.
First rate progression schedules adopted for plant craftsmen, to become effective Jan. 1, 1941. Eligible craftsmen to be placed on schedule by that date and granted increases as required to reach the proper rates for the employee’s period of service.
Minimum and maximum weekly rates increased and the progressions for some job classifications were accelerated. The rate ranges were increased as follows, depending upon location:
______Weekly ra tes_____Minimum Maximum
Plant central officecraftsmen.................... $0 to $2 $2 to $7
Traffic operators.............. $ 0 to $ 3 $2 to $3
Oct. 9, 1942 Increases ranging from $2 to $7 a week, depending upon location and position on applicable schedule.
Adoption of wage-rate schedules for outside plant construction forces during this period resulted in increases for these employees up to $2 a week. Acceleration of rate of progression permitted increases for operators up to $4 a week.
Retroactive directive orders of the National War Labor Board, dated July 2 and Oct. 6, 1943. Minimum and maximum weekly wage rates were raised and some progression wage schedules were shortened. The rate ranges were increased as follows, depending upon location:
Plant central officecraftsmen....................
Traffic operators..............Plant construction forces .
Weekly ratesMinimum Maximum
$2 to $3 $2 to $6
$0
$1 to $5 $2 to $4
$2
Oct. 10, 1942, to Sept. 6, 1945. Increases ranging from $2 to $11 a week, depending upon location and position on applicable schedule.
All plant construction force employees on the payroll received an increase of $2 a week.
Acceleration of rate of progression permitted increases up to $7.
Minimum and maximum weekly wage rates were raised and some progression schedules for job classifications were shortened. The rate ranges of these employees were increased as follows, depending upon location:
Plant central officecraftsmen2 ..................
Traffic operators3 4 .........Plant construction forces . Outside maintenance
fo rces...........................Clerical forces4 5 ..............
Weekly ratesMinimum Maximum
$2 to $6 $2 to $8$3 to $7 $3 to $8
$0 $0 to $3
$2 to $6 $2 to $11$2 to $7 $2 to $7
Rate progression schedule adopted Aug. 4, 1944, for outside maintenance forces and clerical employees with increases retroactive to 1943 for employees at many locations. The effect of these increases was reflected in
Digitized for FRASER http://fraser.stlouisfed.org/ Federal Reserve Bank of St. Louis

Oct. 10, 1942, to Sept. 6, 1945- Continued
Sept. 7, 1945
Feb. 1,1946 Increases ranging from $5 to $9 a week, depending upon location and position on applicable schedule.
May 9, 1947 Increases ranging from $2 to $5 a week, depending upon location and position applicable schedule.
on
June 2,1948
Oct. 15, 1948 Increases ranging from $0 to $7 a week, depending upon location and position on applicable schedule.
increases in minimum and maximum rates shown above. Plant construction forces received a minimum increase of $2 a week, except that resulting rate did not exceed applicable maximums.
Increases ranging from $3 to $5 a week to New York traffic department employees. Increases were as follows:
Weekly ratesMinimum Maximum
Traffic operators Clerical forces . .
$5$3
$5$3
Minimum and maximum weekly rates were raised and some progression schedules for job classifications were shortened. The rate ranges of these employees were increased as follows:
Weekly ratesMinimum Maximum
Plant central officecraftsm en.................... $5 to $9 $8
Traffic operators.............. $5 to $6 $7Plant construction forces . $5 $6 to $8Outside maintenance
fo rces ........................... $5 to $7 $7 to $8Clerical forces .................. $5 to $7 $5 to $7
New York traffic operators and clerical employees received increases which, when added to increases previously given on Sept. 7, 1945, conformed to the above pattern.
Acceleration of rate of progression permitted increases up to $15 a week.
The rate ranges of employees covered by wage schedules were increased as follows:
Weekly ratesMinimum Maximum
Plant central officecraftsmen.................... $2 to $4 $3 to $5
Traffic operators.............. $2 to $4 $4 to $5Plant construction forces . $4 $4Outside maintenance
forces ........................... $2 to $4 $3 to $4Clerical fo r c e s .................. $2 to $4 $2 to $4
Increases ranging up to $4 were made at certain points. The increases affected about 5 percent of the employees. Traffic operators were not involved.The rate ranges of employees covered by wage schedules
were increased as follows:
Weekly ratesMinimum Maximum
Plant central officecraftsmen.................... $1 to $3 $2 to $7
Traffic operators.............. $1 to $4 $3 to $4Plant construction forces . $2 $2 to $4Outside maintenance
forces ........................... $1 to $4 $1 to $7Clerical forces .................. $0 to $4 $1 to $6
Digitized for FRASER http://fraser.stlouisfed.org/ Federal Reserve Bank of St. Louis

July 5, 1950
July 5, 1951 Increases ranging from $3 to $13 a week, depending upon location and position on applicable schedule.
Reclassification of approximately 100 towns in addition to the adjustment of specific wage schedules in some areas.
Schedules were reduced to 6V2 years. Prior to this, most employees had been assigned to 8-year wage schedules and a few employees had been assigned to 7-year wage schedules.
Increases affected about 50 percent of the employees and ranged up to $11 a week.
The rate ranges of employees covered by wage schedules were increased as follows:
______Weekly ratesMinimum Maximum
Plant central officecraftsmen.................... $3 to $5 $6 to$ll>/2
Traffic operators.............. $3 to $5 $4 Vi to $ 5>/iPlant construction forces . Outside maintenance
$3 to $3V4 $5 to $ 7Vi
forces ........................... $3 to $6 $5'/i to $13Clerical forces .................. $3 to $5% $3 to$ 9
July 5, 1952 Increases ranging from $2.50 to The rate ranges of employees covered by wage schedules$10 a week, depending upon location and position on applicable schedule.
were increased as follows: Weekly rates
Plant central office
Minimum Maximum
craftsmen.................... $3 to $5 $4 to $10Traffic operators.............. $2>/i to $4 $3 to $ 4Plant construction forces . Outside maintenance
$3 Vi to $4 $4Vito$ 5
fo rces........................... $3 to $7 $3Vi to $ 9Clerical forces .................. $2Vi to $5 $2Vi to $ 6
1 General wage changes are construed as upward or downward changes that affect an entire establishment, bargaining unit, or substantial group of employees at one time. Not included within the term and therefore omitted from this tabulation are adjustments in individual rates (promotions, merit increases, etc.) and minor adjustments in wage structure (such as changes in specific classification rates) that do not have an immediate and noticeable effect on the general wage level.
The general changes listed above were the major changes affecting salary rates during the period covered by this chronology. Because of the omission of nongeneral changes, the payment of premium and special rates and other factors, the total of the general wage changes listed will not necessarily coincide with the movement of straight-time average hourly earnings.
2 Included was an increase of $4 in the minimum and $2 in the maximum rate of the schedule for plant central office craftsmen in New York City, by NWLB directive order, effective
Dec. 26, 1944.
3 Included was an increase of $3 in the minimum and maximum rates of traffic operators’ schedules in New York City, $5 in Louisville, Ky., and $5 in Memphis, Tenn., effective Jan. 10, 1944, by NWLB directive order.
4 Included was an increase of $3 in the minimum and maximum rates of traffic operators’ schedules and $3 in clerical schedules in Detroit, effective Mar. 28, 1943, by NWLB directive order.
5 Included was an increase of $3 in the minimum rate and $2 in the maximum rate of the schedules for certain traffic clerical employees in New York City, Louisville, Ky., and Memphis, Tenn., effective Jan. 10, 1944, by NWLB directive order. Included also in this period was an increase of $3 in minimum and $2 in maximum rates of the schedule for certain plant clerical employees of New York City, effective Dec. 26, 1944, by NWLB directive order.
Digitized for FRASER http://fraser.stlouisfed.org/ Federal Reserve Bank of St. Louis

Occupational group2Changes in weekly rates effective
Sept 2, 1953 Oct. 9,1954 Nov. 14, 1955 Dec. 5, 1956 Jan. 11, 1958
Number of towns reclassified................ 29 11 10 17 7Number of years’ service
required to reach maximumrates:
Central office craftsmen.................. 36 6 6 6 6Traffic operators................................ 36 6 6 6 6
Plant central office craftsmen:Minimum rate ...................................... $0 - $4.00 $0 - $2.00 $2.00- $5.50 $2.00- $5.50 $1.00- $5.00
Maximum r a te ...................................... 0 - 5.50 1.00- 5.50 3.50- 9.50 3.50- 9.50 2.50- 6.00
Traffic operators:Minimum rate ...................................... 1.00- 3.00 0 - 2.00 2.00- 2.50 2.00- 4.00 2.00- 4.00Maximum r a te ...................................... 1.50- 2.50 1.50- 2.50 2.00- 3.00 2.50- 3.00 2.50- 3.50
Plant construction forces:Minimum rate ...................................... 1.00- 2.00 0 2.50 2.50 2.00Maximum r a te ...................................... 1.50- 3.00 1.00- 2.00 3.00- 4.00 3.00- 4.00 2.50- 3.50
Outside maintenance forces:Minimum rate ...................................... 0 - 5.00 0 - 2.00 2.00- 5.50 2.00- 11.50 1.00- 4.00Maximum r a te ...................................... 1.00- 8.00 1.00- 5.50 3.00- 10.00 3.00- 11.50 2.50- 9.50
Clerical forces:Minimum rate ...................................... 0.50- 3.50 0 - 2.00 1.00- 3.00 1.00- 5.00 1.50- 4.00Maximum ra te ...................................... 1.00- 4.50 0 - 4.00 1.00- 6.00 1.50- 5.00 1.50- 5.50
June 10, 1959 Oct. 10, 1960 Nov. 9, 1961 Nov. 9, 1962 Nov. 10, 1963
Number of towns reclassified................ 20 15 15 56 42Number of years’ service
required to reach maximumrates:
Central office craftsmen.................. 6 6 6 6 6Traffic operators................................ 6 6 5 y2 5X/2 5y2
Plant central office craftsmen:Minimum r a te ...................................... $1.00- $5.50 $1.00- $8.50 $1.50- $5.50 $1.50- $8.00 , $1.50- $8.50
Maximum r a te ...................................... 2.00- 11.00 3.50- 10.00 3.00- 9.00 4.00- 10.50 3.50- 11.00
Traffic operators:Minimum rate ...................................... 1.00- 3.00 1.50- 7.00 1.50- 3.00 2.00- 3.50 2.00- 3.50Maximum r a te ...................................... 3.00- 4.00 2.50- 3.00 42.00 2.50- 4.50 5 2.50- 4.00
Plant construction forces:Minimum rate ...................................... 1.50 2.50 3.00 2.00 2.00Maximum r a te ...................................... 3.00- 4.00 4.50- 6.00 2.00- 3.00 2.00- 4.50 2.00- 5.00
Outside maintenance forces:Minimum rate ...................................... 0 - 5.50 1.00- 5.50 1.50- 5.50 1.50- 7.00 1.50- 9.00Maximum r a te ...................................... 3.00- 12.00 3.00- 10.00 2.50- 8.00 3.50- 10.50 3.50- 12.00
Clerical forces:Minimum rate ...................................... 0 - 4.50 1.00- 7.00 1.00- 5.50 1.00- 5.00 1.00- 5.50Maximum r a te ...................................... 0 - 8.00 1.50- 7.50 1.00- 6.00 1.50- 6.50 51.50- 6.00
Digitized for FRASER http://fraser.stlouisfed.org/ Federal Reserve Bank of St. Louis

Occupational group1 2 * *Changes in weekly rates effective
Jan. 11, 19656 Jan. 11, 19666 Jan. 16, 19676 Jan. 16, 19686 July 16, 19697
Number of towns reclassified................ 88 154 91 60Number of years’ service
required to reach maximumrate:
Operations (plant) centraloffice craftsmen................................ 6 6 6 6 6Traffic operators................................ 5% 5% 5V2 5 5
Operations (plant) centraloffice craftsmen:
Minimum rate ...................................... -$2.50- $8.00 11 $2.00- $6.00 $5.50-$11.00 12$7.00-$16.00 $5.50- $7.50Maximum r a te ...................................... -1.00- 13.00 4.00- 16.00 8.00- 21.00 12.00- 19.00 6.00- 8.00
Traffic operators:Minimum rate ...................................... 1S1.50- 4.00 2.00- 5.00 3.50- 7.50 4.00- 6.50 3.50Maximum r a te ...................................... 4.00- 7.50 3.00- 6.00 5.50- 10.50 8.00- 10.00 4.00
Plant construction forces:Minimum rate ...................................... 3.00 2.00 165.50 1.00- 3.00 5.50Maximum r a te ...................................... 173.00- 5.00 18 3.00- 5.00 194.50- 8.00 4.00- 8.00 6.00
Outside maintenance forces:Minimum rate ...................................... 20 2.00- 8.00 2.00- 13.50 5.50- 10.00 5.00- 16.00 (21)Maximum r a te ...................................... 22 4.00- 13.00 4.00- 10.50 237.50- 14.50 8.00- 20.00 (21)
Clerical forces:Minimum rate ...................................... -1.00- 7.50 1.00- 7.50 3.50- 10.50 4.00- 27.50 3.50- 5.50Maximum r a te ...................................... - .50- 10.00 2.50- 11.00 243.50- 13.50 4.00- 14.00 3.50- 6.00
May 20, 1970 July 16, 1970 July 17, 1971s July 16, 19729 July 15, 19739
Number of towns reclassified................ 1088 -Number of years’ service
required to reach maximumrate:
Operations (plant) centraloffice craftsmen................................ 5 5 5 5 5Traffic operators................................ 4 4 4 4 4
Operations (plant) centraloffice craftsmen:
Minimum rate ...................................... $8.00-$19.00 13 $5.50 $4.00-$20.50 $6.00- $9.00 $9.50-$12.50Maximum r a te ...................................... 0 140 - 8.00 23.00- 36.00 12.00- 14.50 16.00- 18.00
Traffic operators:Minimum rate ...................................... 2.00- 14.50 3.50 6.00- 10.50 5.50- 7.50 9.00- 11.00Maximum r a te ...................................... 0 140 - 4.00 16.50- 22.50 9.50 13.50
Plant construction forces:Minimum rate ...................................... 18.50- 23.50 5.50 8.00- 10.50 7.00 9.50- 10.50Maximum r a te ...................................... 0 6.00 21.50- 37.50 12.00 16.00
Outside maintenance forces:Minimum rate ...................................... -
Maximum r a te ...................................... - —
Clerical forces:Minimum rate ...................................... 4.00- 23.00 3.50- 5.50 2.00- 17.00 5.50- 9.00 9.00- 12.50Maximum r a te ...................................... 0 140 - 6.00 16.00- 28.50 9.50- 12.00 13.00- 16.00
1 General wage changes are construed as upward ordownward changes that affect an entire establishment,bargaining unit, or substantial group of employees at one time.Not included within the term and therefore omitted from this
tabulation are adjustments in individual rates (promotions, merit increases, etc.) and minor adjustments in the wage structure (such as changes in specific classification rates) that do not have an immediate and noticeable effect on the general wage level.
Digitized for FRASER http://fraser.stlouisfed.org/ Federal Reserve Bank of St. Louis

FOOTNOTES - Continued
The general changes listed above were the major changes affecting salary rates during the period covered by this chronology bulletin. Because of the omission of nongeneral changes, the payment of premium and special rates and other factors, the total of the general wage changes listed will not necessarily coincide with the movement of straight-time average hourly earnings.
2 A range is shown since individual increases were governed by location, position on the salary schedule, and job.
3 Reduced from 6V2 years. See table 13 for earlier progression schedule.
4 Effective May 6, 1962, rates were increased $1.5 Effective Feb. 9, 1964, maximum rates for traffic
operators were increased $1 and those for clerical forces, 50 cents.
6 Additional increases were provided as “Special Allowances” at various locations. The 1965 agreement provided that such “Special Allowances” be shown in the contract apart from and in addition to the basic rate. The decreases which are shown effective Jan. 11, 1965, were the result of the elimination of special amounts that were built into the basic rate prior to the 1965 wage change.
7 Deferred increase.8 Ranges do not include special or special city
allowances—see table 12.9 Changes include $4.50 a week increases in 1972 and $8 a
week in 1973 resulting from establishment of a cost-of-living escalator clause in the 1971 contract. It provided for annual adjustments in weekly rates, on July 16, 1972 and July 15, 1973, based on the May Bureau of Labor Statistics’ National Consumer Price Index (1967=100) in the respective years. The index table with appropriate rate adjustments was as follows:
Cumulative Cumulativeadjustment adjustmentin weekly in weekly
Index rates Index rates120.9-121.4 . . . . . $0.50 127.5-127.8 . . . . . $ 8.00121.5-121.8 . . 1.00 127.9-128.3 . . 8.50121.9-122.3 . . 1.50 128.4-128.7 . . 9.00122.4-122.7 . . 2.00 128.8-129.1 . . . 9.50122.8-123.1 . . 2.50 129.2-129.6 . . . . . 10.00123.2-123.5 . . 3.00 129.7-130.0 . . .. . . 10.50123.6-124.0 . . 3.50 130.1-130.4 . . . . . . 11.00124.1-124.4 . . . . . 4.00 130.5-130.9 . . . . . 11.50124.5-124.8 . . . . . 4.50 131.0-131.3 . . . . . . 12.00124.9-125.3 . . 5.00 131.4-131.7 . . .. . . 12.50125.4-125.7 . . 5.50 131.8-132.1 . . . . . 13.00125.8-126.1 . . 6.00 132.2-132.6 . . .. . . 13.50126.2-126.6 . . 6.50 132.7-133.0 . ... . . 14.00126.7-127.0 . . 7.00 133.1-133.4 . . . . . 14.50127.1-127.4 . . 7.50 133.5-133.9 . .,. . . 15.00
Cumulative adjustment in weekly
Index rates
134.0-134.3 ......... $15.50134.4-134.7 ......... 16.00134.8-135.2 ......... 16.50
Cumulative adjustment in weekly
Index rates
135.3-135.6 ......... $17.00135.7-136.0 ......... 17.50136.1-136.4 ......... 18.00
etc.
10 Eleven additional towns were reclassified on August 1, 1971, and four towns were reclassified on February 13, 1972.
11 Effective Mar. 30, 1966, highest figure in range (applied to workers at Jackie Jones, Montauk, and Southfields, N.Y.) was increased $3.
12 Effective Mar. 2, 1969, highest figure in range (applied to workers at various locations in Michigan) was increased $10.
13 Effective July 19, 1970, employees at various locations in Zone 1 in the Southwestern Bell Territory received an additional $0.50.
14 Employees in the territory of the New York Telephone Co. received the scheduled July 16, 1970 increases in their maximums ($6 for operations central office craftsmen, $4 for traffic operators, and $3.50 to $6 for clerical) retroactive to April 1, 1970.
15 Effective May 16, 1965, highest figure in range (applied to workers in Chicago, 111.) was increased $2.50.
16 Effective Feb. 5, 1967, workers in all areas except Northeast and East received an additional $0.50.
17 Effective Feb. 27, 1965, highest figure in range (applied to workers in Group 4 in Northeast and Eastern territories) was increased $2.
18 Effective Mar. 30, 1966, highest figure in range (applied to workers in Group 3 in Northeast and East) was increased $1.
19 Effective Feb. 5, 1967, highest figure in range (applied to workers in all areas except Northeast and East) was increased $0.50.
20 Effective May 30, 1965, highest figure in range (applied to workers in Mt. Rainier, Md.) was increased $5.
21 Outside maintenance forces merged with operations (plant) central office craftsmen and gang employees on Jan. 20, 1969.
22 Effective Feb. 27, 1965, highest figure in range (applied to workers in Group 4 in New York territories) was increased $5.
23 Effective Feb. 5, 1967, highest figure in range (applied to workers in Group 4 at Ennis, Tex.) was increased $0.50.
24 Effective Feb. 5, 1967, highest figure in range (applied to workers in Group 4 at various locations in Texas) was increased $0.50.
Digitized for FRASER http://fraser.stlouisfed.org/ Federal Reserve Bank of St. Louis

CityJan. 1941 July 1946
CityJan. 1941 July 1946
Minimum Maximum Minimum Maximum Minimum Maximum Minimum Maximum
B oston .................... $18.00 $58.00 $28.00 $76.00 Louisville................ $17.00 $50.00 $28.00 $67.00Buffalo.................... 18.00 54.00 29.00 72.00 Memphis.................. 17.00 50.00 28.00 67.00Chicago .................. 18.00 58.00 30.00 75.00 Minneapolis ........... 16.00 49.00 30.00 70.00Cincinnati................ 17.00 50.00 31.00 69.00 New York................ 18.00 63.00 29.00 80.00Cleveland................ 17.00 52.00 31.00 73.00 Philadelphia........... 18.00 58.00 28.00 75.00D etroit.................... 17.00 54.00 31.00 76.00 Pittsburgh................ 18.00 58.00 28.00 75.00Kansas City ........... 17.00 50.00 31.00 68.00 St. Louis.................. 17.00 53.00 31.00 71.00
1 Table covers 14 of a total of 236 cities. The cities shown are the Long Lines operating centers.
Table 4. Weekly salary rates for plant central office craftsmen, selected cities, 1952-70
CityJuly 1952 September 1953 October 1954 November 1955 December 1956 January 1958
Minimum
Maximum1
Minimum
Maximum1
Minimum
Maximum1
Minimum
Maximum1
Minimum
Maximum1
Minimum
Maximum1
Atlanta....................... $40.00 $ 89.50 $42.00 $ 92.50 $42.00 $ 95.00 $44.00 $ 99.00 $46.00 $103.50 $48.00 $107.50Baltimore.................. 42.00 97.50 45.00 100.00 45.00 102.50 47.50 107.00 53.00 112.00 55.50 117.00Birmingham.............. 40.00 89.50 42.00 92.50 42.00 95.00 44.00 99.00 46.00 103.50 48.00 107.50B o sto n ....................... 42.00 99.50 43.00 102.00 45.00 106.00 47.00 110.00 50.00 115.00 51.00 118.00Buffalo....................... 44.00 96.00 45.00 98.50 45.00 100.50 47.00 105.00 51.00 110.00 53.00 113.50Charleston, W. Va. 43.00 93.00 44.50 96.00 45.00 98.50 47.50 103.50 53.00 109.00 55.50 114.00Charlotte .................. 40.00 89.50 42.00 92.50 42.00 95.00 44.00 99.00 46.00 103.50 48.00 107.50Chattanooga.............. 40.00 89.50 42.00 92.50 42.00 95.00 44.00 99.00 46.00 103.50 48.00 107.50Chicago .................... 43.50 100.00 45.00 103.00 46.00 105.50 48.00 110.50 51.00 115.50 54.00 119.50Cincinnati.................. 44.00 93.00 46.00 97.50 46.00 100.50 48.50 105.50 52.50 110.50 55.00 115.50Cleveland.................. 45.00 96.00 47.00 98.50 47.00 100.50 49.50 105.50 53.50 110.50 56.50 115.50D allas......................... 44.00 95.00 46.00 98.00 46.00 100.50 50.00 105.50 55.00 110.50 58.00 115.50D enver....................... 41.50 87.50 44.00 91.00 44.00 93.50 46.50 98.00 50.00 103.00 53.00 108.50Des Moines................ 43.00 91.00 45.50 94.50 45.50 97.00 48.00 101.50 51.50 106.50 54.50 111.50D etro it....................... 44.00 99.00 46.00 101.50 46.00 103.50 48.50 108.50 51.50 113.50 55.50 118.50Duluth2 .................... - - —El P aso ....................... 41.50 86.50 43.50 89.00 43.50 91.50 46.00 95.50 50.00 100.00 53.00 105.00Harrisburg ................ 39.50 94.50 42.00 97.00 42.00 99.50 45.00 106.50 48.00 111.00 51.00 114.50Hartford.................... 40.00 99.50 41.00 102.00 41.00 104.50 43.00 109.00 46.00 112.50 47.00 117.50Indianapolis.............. 45.00 92.00 47.50 95.00 47.50 97.50 50.50 102.50 53.50 107.50 56.00 112.00Kansas City ............. 44.00 95.00 46.00 98.00 46.00 100.50 50.00 105.50 55.00 110.50 58.00 115.50Knoxville.................. 40.00 89.50 42.00 92.50 42.00 95.00 44.00 99.00 46.00 103.50 48.00 107.50Little R ock................ 43.00 86.50 45.00 89.50 45.00 92.00 49.00 96.50 53.00 101.50 56.00 106.50Louisville.................. 40.00 89.50 42.00 92.50 42.00 95.00 44.00 99.00 46.00 103.50 48.00 107.50Memphis.................... 40.00 89.50 42.00 92.50 42.00 95.00 44.00 99.00 46.00 103.50 48.00 107.50Miami......................... 40.00 89.50 42.00 92.50 42.00 95.00 44.00 99.00 46.00 103.50 48.00 107.50Milwaukee ................ 43.50 92.50 45.50 96.50 45.50 99.50 48.00 104.50 51.00 109.50 54.00 114.50Minneapolis .............. 43.00 93.50 45.50 96.50 45.50 99.00 48.00 103.50 51.50 108.50 54.50 113.50Montgomery.............. 38.50 87.50 40.50 90.50 40.50 93.00 42.50 97.00 44.50 101.50 46.50 105.00Nashville.................... 40.00 89.50 42.00 92.50 42.00 95.00 44.00 99.00 46.00 103.50 48.00 107.50New Orleans.............. 40.00 89.50 42.00 92.50 42.00 95.00 44.00 99.00 46.00 103.50 48.00 107.50New York.................. 44.00 104.00 45.00 106.50 45.00 109.00 47.00 114.00 52.00 119.00 54.00 123.00Newark....................... 44.00 102.00 46.00 104.00 46.00 105.50 48.00 110.00 52.00 114.50 54.00 118.50Om aha....................... 43.00 91.00 45.50 94.50 45.50 97.00 48.00 101.50 51.50 106.50 54.50 111.50Philadelphia............. 41.00 98.50 43.00 101.00 43.00 103.50 46.00 109.50 50.00 114.50 52.00 118.50Pittsburgh.................. 41.00 98.50 43.00 101.00 43.00 103.50 46.00 109.50 50.00 114.50 52.00 118.50Reading .................... 39.50 94.50 42.00 97.00 42.00 99.50 45.00 106.50 48.00 111.00 51.00 114.50Richmond ................ 40.00 92.00 42.00 94.50 42.00 97.00 44.50 101.50 49.50 106.50 53.00 111.50Salt Lake City ......... 41.50 87.50 43.50 90.00 43.50 92.50 46.00 97.00 50.00 102.00 53.00 107.00Scranton.................... 39.50 94.50 42.00 97.00 42.00 99.50 45.00 106.50 48.00 111.00 51.00 114.50St. Louis.................... 44.00 95.00 46.00 98.00 46.00 100.50 50.00 105.50 55.00 110.50 58.00 115.50Washington, D.C. . . . 45.50 100.00 47.00 102.50 47.00 105.00 49.50 109.50 55.00 114.50 57.50 119.50Wayne, Pa.3 .............. — — — — 50.00 114.50 52.00 118.50White Plains, N.Y.4 . - - 45.00 106.50 45.00 109.00 47.00 114.00 52.00 119.00 54.00 123.00
Digitized for FRASER http://fraser.stlouisfed.org/ Federal Reserve Bank of St. Louis

City
June 1959 October 1960 November 1961 November 1962 November 1963
Minimum
Maximum1
Minimum
Maximum1
Minimum
Maximum1
Minimum
Maximum1
Minimum
Maximum1
Atlanta........................................................ $51.00 $112.50 $53.00 $117.00 $57.00 $120.00 $59.00 $124.50 $61.00 $129.00Baltimore.................................................... 57.50 122.00 59.50 126.50 62.00 129.50 64.00 134.00 66.50 138.50Birmingham............................................... 51.00 112.50 53.00 117.00 57.00 120.00 59.00 124.50 61.00 129.00B oston ........................................................ 52.50 124.00 54.50 128.50 56.50 131.50 58.50 136.50 60.50 141.50Buffalo........................................................ 54.50 118.50 59.00 123.00 63.00 127.00 66.00 132.00 68.00 139.00Charleston, W. Va....................................... 57.50 119.00 60.00 123.50 63.00 126.50 65.00 131.50 72.00 136.50Charlotte .................................................... 51.00 112.50 53.00 117.00 57.00 120.00 59.00 124.50 61.00 129.00Chattanooga............................................... 51.00 112.50 53.00 117.00 57.00 120.00 59.00 124.50 61.00 129.00Chicago ...................................................... 58.00 125.50 62.50 131.00 65.50 135.00 68.00 140.00 70.50 145.00Cincinnati.................................................... 56.50 120.50 58.00 125.00 61.00 128.00 64.00 133.00 66.00 138.00Cleveland.................................................... 57.50 120.50 59.50 125.00 61.50 128.00 63.50 133.00 66.00 138.00D allas.......................................................... 60.00 120.50 61.50 125.00 63.50 128.00 66.50 133.00 68.50 138.00D enver........................................................ 55.00 113.50 57.50 118.00 61.00 121.00 64.00 126.00 67.00 131.00Des Moines................................................. 56.00 116.00 59.50 120.00 62.00 123.00 64.50 127.50 68.00 132.00D etro it........................................................ 58.50 123.50 60.50 128.00 63.00 131.00 65.00 136.00 67.50 141.00Duluth2 ...................................................... 56.00 116.00 59.50 120.00 62.00 123.00 64.50 127.50 68.00 132.00El P aso ........................................................ 54.50 109.00 57.00 113.00 60.00 116.00 62.50 120.50 65.50 125.00Harrisburg .................................................. 53.00 119.50 56.00 124.00 59.00 127.00 63.00 131.50 67.00 136.50Hartford...................................................... 48.50 122.50 50.00 127.50 55.50 130.50 57.00 135.50 58.50 140.50Indianapolis............................................... 57.50 117.00 60.00 122.00 62.00 125.00 64.00 130.00 66.00 134.50Kansas City ............................................... 60.00 120.50 61.50 125.00 63.50 128.00 66.50 133.00 68.50 138.00K noxville.................................................... 51.00 112.50 53.00 117.00 57.00 120.00 59.00 124.50 61.00 129.00Little R ock................................................. 58.00 110.50 61.50 120.50 63.50 123.50 65.50 128.00 67.50 132.50Louisville.................................................... 51.00 112.50 53.00 117.00 57.00 120.00 59.00 124.50 61.00 129.00Memphis...................................................... 51.00 112.50 53.00 117.00 57.00 120.00 59.00 124.50 61.00 129.00Miami........................................................... 51.00 112.50 53.00 117.00 57.00 120.00 59.00 124.50 61.00 129.00Milwaukee .................................................. 56.00 119.50 61.00 124.00 63.00 127.00 65.00 132.00 67.00 137.00Minneapolis............................................... 56.00 118.50 59.50 123.00 63.00 126.00 66.50 131.00 70.00 136.00Montgomery............................................... 49.50 110.00 51.50 114.00 55.50 117.00 57.50 121.50 59.50 125.50Nashville...................................................... 51.00 112.50 53.00 117.00 57.00 120.00 59.00 124.50 61.00 129.00New Orleans............................................... 51.00 112.50 53.00 117.00 57.00 120.00 59.00 124.50 61.00 129.00New Y ork .................................................... 55.50 128.00 60.50 132.50 64.00 135.50 66.00 140.50 68.00 147.50Newark........................................................ 55.50 123.50 58.00 129.00 60.00 132.00 65.00 137.00 67.50 142.00O m aha........................................................ 56.00 116.00 59.50 120.00 62.00 123.00 64.50 127.50 68.00 132.00Philadelphia............................................... 54.00 123.00 57.00 127.50 60.00 130.50 65.00 135.50 70.00 140.50Pittsburgh.................................................... 54.00 123.00 57.00 127.50 60.00 130.50 65.00 135.50 70.00 140.50R eading...................................................... 53.00 119.50 56.00 124.00 59.00 127.00 63.00 131.50 67.00 136.50Richmond .................................................. 55.00 116.50 57.00 121.00 60.00 124.00 62.00 128.50 65.00 133.00Salt Lake City ........................................... 54.50 111.50 57.00 115.50 60.50 118.50 63.00 123.00 66.00 127.50Scranton...................................................... 53.00 119.50 56.00 124.00 59.00 127.00 63.00 131.50 67.00 136.50St. Louis...................................................... 60.00 120.50 61.50 125.00 63.50 128.00 66.50 133.00 s 68.50 6 138.00Washington, D.C.......................................... 59.50 124.50 61.50 129.00 64.50 132.00 66.50 137.00 72.00 142.00Wayne, Pa.3 ............................................... 54.00 123.00 57.00 127.50 60.00 130.50 65.00 135.50 70.00 140.50White Plains, N.Y.4 .................................. 55.50 128.00 60.50 132.50 64.00 135.50 66.00 140.50 68.00 147.50
See footnotes at end of table.
Digitized for FRASER http://fraser.stlouisfed.org/ Federal Reserve Bank of St. Louis

CityJanuary 1965 January 1966 January 1967 July 1968
Minimum
Maximum2
Minimum
Maximum2
Minimum
Maximum2
Minimum
Maximum2
Atlanta....................... $64.00 $134.00 $66.00 $138.50 $74.00 $146.50 $81.00 $160.50Baltimore.................. 71.00 143.50 75.00 148.50 82.00 156.50 89.50 168.50Birmingham.............. 64.00 134.00 66.00 138.50 74.00 146.50 81.00 160.50B oston ....................... 66.50 146.50 72.00 151.50 77.50 159.50 84.50 8171.50Buffalo....................... 71.00 9 144.00 77.00 lo 153.50 82.50 162.50 89.50 174.50Charleston, W. Va. . . 75.00 141.50 79.00 146.50 85.00 155.50 92.00 167.50Charlotte .................. 64.00 134.00 66.00 138.50 74.00 146.50 81.00 158.50Chattanooga.............. 64.00 134.00 66.00 138.50 74.00 146.50 81.00 158.50Chicago .................... 75.00 150.00 80.00 155.00 85.50 163.00 92.50 175.00Cincinnati.................. 70.00 143.00 73.00 147.50 81.00 155.50 88.00 167.50Cleveland.................. 70.00 143.00 72.00 147.50 80.00 157.50 87.00 170.50D allas......................... 71.50 143.00 1375.00 14147.50 1S82.50 158.00 90.50 170.00D enver...................... 70.50 136.00 72.50 140.50 78.00 148.50 85.00 160.50Des Moines................ 70.50 137.00 73.00 141.50 78.50 149.50 85.50 161.50D etroit....................... 70.50 146.00 75.00 150.50 82.00 158.50 1890.00 170.50D u lu th ...................... 70.50 137.00 73.00 141.50 78.50 149.50 85.50 161.50El P a so ....................... 68.50 130.00 70.50 134.50 76.00 142.50 84.00 157.00Harrisburg ................ 72.00 141.50 77.00 146.50 82.50 154.50 92.50 170.50Hartford.................... 60.50 145.50 66.50 150.50 72.00 158.50 86.00 171.50Indianapolis.............. 69.00 139.50 73.50 144.00 80.00 152.00 88.00 164.00Kansas City .............. 71.50 143.00 1375.00 14147.50 l s 82.50 158.00 90.50 170.00K noxville.................. 64.00 134.00 66.00 138.50 74.00 146.50 81.00 158.50Little R ock................ 70.00 137.50 73.00 142.00 78.50 150.00Louisville.................. 64.00 134.00 66.00 138.50 74.00 146.50 81.00 158.50Memphis.................... 64.00 134.00 66.00 138.50 74.00 146.50 81.00 158.50Miami......................... 64.00 134.00 66.00 138.50 74.00 146.50 81.00 160.50Milwaukee ................ 69.50 142.00 75.00 147.00 83.00 155.00 92.00 167.50Minneapolis.............. 73.00 141.00 76.00 146.00 81.50 154.00 88.50 167.50Montgomery.............. 62.00 130.50 64.00 135.00 72.00 143.00 79.00 155.00Nashville.................... 64.00 134.00 66.00 138.50 74.00 146.50 81.00 158.50New Orleans.............. 64.00 134.00 66.00 138.50 74.00 146.50 81.00 160.50New Y ork.................. 72.00 19152.50 77.00 159.50 82.50 167.50 89.50 2O179.50Newark....................... 71.50 147.00 75.50 152.00 83.00 160.00 90.00 172.50Om aha....................... 70.50 137.00 73.00 141.50 78.50 149.50 85.50 161.50Philadelphia.............. 75.00 145.50 80.00 150.50 85.50 158.50 92.50 170.50Pittsburgh.................. 75.00 145.50 80.00 150.50 85.50 158.50 92.50 170.50R eading.................... 72.00 141.50 77.00 146.50 82.50 154.50 89.50 166.50Richmond ................ 68.00 138.00 70.00 142.00 76.00 151.00 83.00 163.00Salt Lake City ......... 69.50 132.50 71.50 137.00 77.00 145.00 84.00 157.00Scranton.................... 72.00 141.50 77.00 146.50 82.50 154.50 89.50 166.50St. Louis.................... 73.00 146.00 76.50 150.50 15 82.00 158.50 90.00 170.50Washington, D.C. . . . 2275.00 147.00 84.00 152.00 90.00 160.00 97.00 172.50Wayne, Pa................... 75.00 145.50 80.00 150.50 85.50 158.50 92.50 170.50White Plains, N.Y. . . 72.00 19152.50 77.00 159.50 82.50 167.50 89.50 2O179.50
See footnotes at end of table.
Digitized for FRASER http://fraser.stlouisfed.org/ Federal Reserve Bank of St. Louis

CityJuly 1969 May 1970 July 1970
Minimum
Maximum2
Minimum
Maximum2
Minimum
Maximum2
Atlanta ...................................................................... $ 86.50 $166.50 $ 96.50 $166.50 $102.00 $172.50Baltimore.................................................................... 95.00 174.50 7 105.00 174.50 113.00 180.50Birmingham............................................................... 86.50 166.50 96.50 166.50 102.00 172.50B oston ........................................................................ 90.00 179.50 109.00 179.50 114.50 186.50Buffalo ...................................................................... 95.00 180.50 113.00 11186.50 118.50 186.50Charleston, W. Va...................................................... 97.50 173.50 l 2 107.50 173.50 114.00 179.50Charlotte.................................................................... 86.50 164.50 96.50 164.50 102.00 170.50Chattanooga ............................................................. 86.50 164.50 96.50 164.50 102.00 170.50C hicago...................................................................... 98.00 181.00 114.00 181.00 119.50 188.00Cincinnati ................................................................. 93.50 173.50 103.50 173.50 109.00 179.50Cleveland.................................................................... 92.50 176.50 110.00 176.50 115.50 182.50Dallas.......................................................................... 96.00 176.00 106.00 176.00 16111.50 182.00Denver........................................................................ 90.50 166.50 17100.00 166.50 106.00 172.50Des Moines ............................................................... 91.00 167.50 101.00 167.50 106.50 173.50Detroit........................................................................ 105.50 176.50 115.00 176.50 120.50 182.50D uluth........................................................................ 91.00 167.50 101.00 167.50 106.50 173.50El Paso........................................................................ 89.50 163.00 1 8i99.00 163.00 105.00 169.00Harrisburg................................................................. 98.00 176.50 112.50 176.50 118.00 184.50Hartford .................................................................... 91.50 177.50 102.00 177.50 107.50 183.50Indianapolis............................................................... 93.50 170.00 103.00 170.00 108.50 176.00Kansas C ity ............................................................... 96.00 176.00 106.00 176.00 16111.50 182.00Knoxville.................................................................... 86.50 164.50 96.50 164.50 102.00 170.50Little Rock ............................................................... - - - - - -Louisville................................................................... 86.50 164.50 96.50 164.50 102.00 170.50Memphis .................................................................... 86.50 164.50 96.50 164.50 102.00 170.50Miami ........................................................................ 86.50 166.50 96.50 166.50 102.00 172.50Milwaukee................................................................. 97.50 173.50 110.50 173.50 116.00 179.50Minneapolis............................................................... 94.00 173.00 104.00 173.00 109.50 179.00Montgomery ............................................................. 84.50 161.00 94.50 161.00 100.00 167.00Nashville .................................................................... 86.50 164.50 96.50 164.50 102.00 170.50New Orleans ............................................................. 86.50 166.50 96.50 166.50 102.00 172.50New Y ork ................................................................. 95.00 187.00 113.00 11193.00 118.50 193.00Newark ...................................................................... 95.50 179.00 106.00 179.00 111.50 186.00Omaha........................................................................ 91.00 167.50 101.00 167.50 106.50 173.50Philadelphia............................................................... 98.00 176.50 112.50 176.50 118.00 184.50Pittsburgh ................................................................. 98.00 176.50 112.50 176.50 118.00 184.50Reading...................................................................... 95.00 172.50 109.50 172.50 115.00 180.50Richm ond................................................................. 88.50 169.00 2198.50 169.00 109.00 175.00Salt Lake C ity ........................................................... 89.50 163.00 1799.00 163.00 105.00 169.00Scranton .................................................................... 95.00 172.50 109.50 172.50 115.00 180.50St. Louis .................................................................... 95.50 176.50 106.00 176.50 16111.50 182.50Washington, D.C......................................................... 102.50 178.50 112.50 178.50 118.00 184.50Wayne, Pa.................................................................... 98.00 176.50 112.50 176.50 118.00 184.50White Plains, N.Y....................................................... 95.00 187.00 113.00 11193.00 118.50 193.00
1 Time required to reach maximum rate reduced from 6V2 years to 6 effective Sept. 2, 1953.
Plant central office craftsmen were first employed in Duluth in 1958.
Plant central office craftsmen were first employed in Wayne, Pa. in 1956. 4
4 Plant central office craftsmen were first employed in White Plains, N.Y. in 1953.
Rate increased an additional $1 effective Feb. 9, 1964. Rate increased an additional $3 effective Feb. 9, 1964. Rate increased an additional $2.50 effective May 31,
1970. Rate increased an additional $2 effective Sept. 2, 1968. Rate increased an additional $4.50 effective Feb. 27,
1965.Rate increased an additional $1 effective Mar. 30, 1966.
11 Effective April 1, 1970.12 Rate increased an additional $1 effective June 7, 1970.1 31 Rate increased an additional $2 effective Feb. 6, 1966.1 Rate increased an additional $2.50 effective Feb. 6,
1966.1 Rate increased an additional $1 effective Feb. 5, 1967.16 Rate increased an additional $0.50 effective July 19,
1970.12 Rate increased an additional $0.50 effective May 24,
1970.1 Rate increased an additional $10 effective Mar. 2, 1969.19 Rate increased an additional $2 effective Feb. 27, 1965.20 Rate increased an additional $1.50 effective July 29,
1968.21 Rate increased an additional $5 effective July 5, 1970.99 Rate increased an additional $5 effective May 30, 1965.
Digitized for FRASER http://fraser.stlouisfed.org/ Federal Reserve Bank of St. Louis

1 9Table 5. Weekly salary rates for plant central office craftsmen, selected cities, 1971-73
State and cityJuly 1971 July 1972 July 1973
Minimum Maximum Minimum Maximum Minimum Maximum
Alabama— Birmingham .................................. $109.50 $197.50 $111.50 $205.00 $113.00 $213.00Crossville......................................... 104.50 184.00 106.00 191.50 107.50 199.50
Alaska- Ketchikan...................................... 215.00 280.00 218.00 290.00 221.00 300.00Arizona— Phoenix........................................... 115.00 197.50 116.50 205.00 118.00 213.00
Casa Grande .................................. 108.50 186.00 110.00 193.50 111.50 201.50Arkansas— Alexander...................................... 112.50 200.50 114.00 208.00 115.50 216.00
N ew castle...................................... 104.50 187.00 106.00 194.50 107.50 202.50California- Oakland ......................................... 134.00 208.00 137.50 215.50 141.00 223.50
San Luis Obispo Jet....................... 127.50 200.00 131.00 207.50 134.50 215.50Colorado- Denver ........................................... 115.00 197.50 116.50 205.00 118.00 213.00
Lamar............................................. 108.50 186.00 110.00 193.50 111.50 201.50Connecticut- Hartford......................................... 118.50 211.50 120.50 219.00 122.50 227.00District of Columbia 130.50 211.50 132.50 219.00 134.50 227.00Florida- M iam i............................................. 109.50 197.50 111.50 205.00 113.00 213.00
Madison ......................................... 104.50 185.00 106.00 192.50 107.50 200.50Georgia- A tlanta ........................................... 109.50 197.50 111.50 205.00 113.00 213.00
Monticello...................................... 104.50 185.00 106.00 192.50 107.50 200.50Idaho— Pocatello......................................... 110.50 189.50 112.00 197.00 113.50 205.00Illinois- Chicago........................................... 128.00 216.00 130.00 223.50 132.00 231.50
Vandalia......................................... 122.00 203.50 124.00 211.00 126.00 219.00Indiana Lawrenceburg................................ 118.50 205.50 121.00 213.00 123.50 221.00
Indianapolis .................................. 116.00 202.00 117.50 209.50 119.00 217.50Elkhart........................................... 111.00 194.00 112.50 201.50 114.00 209.50
Iowa- Des M oines.................................... 116.00 198.50 118.00 206.00 120.00 214.00Red O a k ......................................... 108.00 185.50 110.00 193.00 112.00 201.00
Kansas- W ichita........................................... 112.50 200.50 114.00 208.00 115.50 216.00Dodge C ity .................................... 104.50 187.00 106.00 194.50 107.50 202.50
Kentucky- Williamstown ................................ 118.50 205.50 121.00 213.00 123.50 221.00Louisville ...................................... 109.50 197.50 111.50 205.00 113.00 213.00Monticello...................................... 104.50 184.00 106.00 191.50 107.50 199.50
Louisiana- New Orleans.................................. 109.50 197.50 111.50 205.00 113.00 213.00Bunkie ........................................... 104.50 184.00 106.00 191.50 107.50 199.50
Maine- Dover-Foxcroft............................. 3117.50 4 197.00 124.00 210.50 126.50 218.50Maryland- Baltimore ...................................... 124.50 205.50 126.50 213.00 128.50 221.00
Silver Spring.................................. 130.50 211.50 132.50 219.00 134.50 227.00Fairlee............................................. 112.50 192.50 114.50 200.00 116.50 208.00
Massachusetts- Boston ........................................... 122.00 5211.50 124.50 222.00 127.00 230.00High R ock...................................... 6121.50 7 203.00 124.50 216.00 127.00 224.00
Michigan- Detroit ........................................... 130.00 207.50 132.00 215.00 134.00 223.00Iron Mountain................................ 110.50 194.00 112.50 201.50 114.50 209.50
Minnesota- Minneapolis.................................... 119.00 204.00 121.00 211.50 123.00 219.50Red Wing ...................................... 108.00 185.50 110.00 193.00 112.00 201.00
Mississippi— Jackson ........................................... 109.50 195.50 111.00 203.00 112.50 211.00Pickens ........................................... 104.50 184.00 106.00 191.50 107.50 199.50
Missouri— St. L ou is........................................ 119.50 207.50 121.00 215.00 122.50 223.00Dover ............................................. 104.50 187.00 106.00 194.50 107.50 202.50
Nebraska- Omaha ........................................... 116.00 198.50 118.00 206.00 120.00 214.00Lyons ............................................. 108.00 185.50 110.00 193.00 112.00 201.00
New Hampshire- Concord ......................................... 3117.50 4 197.00 124.00 210.50 126.50 218.50New Jersey- N ewark........................................... 121.00 214.00 124.50 221.50 128.00 229.50New York— New Y ork ...................................... 131.00 8222.00 135.50 230.50 140.00 238.50
B u ffa lo ........................................... 126.50 9213.00 129.00 222.00 131.50 230.00Elizabethtown............................... 126.00 8205.00 128.50 213.50 131.00 221.50
New Mexico- Albuquerque.................................. 114.00 194.00 115.50 201.50 117.00 209.50Carlsbad ......................................... 108.50 186.00 110.00 193.50 111.50 201.50
North Carolina- Charlotte......................................... 109.50 195.50 111.00 203.00 112.50 211.00Henderson...................................... 104.50 185.00 106.00 192.50 107.50 200.50
North Dakota- Bismarck, Jet................................... 111.50 191.00 113.50 198.50 115.50 206.50Dickerson...................................... 108.00 185.50 110.00 193.00 112.00 201.00
Digitized for FRASER http://fraser.stlouisfed.org/ Federal Reserve Bank of St. Louis

State and cityJuly 1971 July 1972 July 1973
Minimum Maximum Minimum Maximum Minimum Maximum
Ohio- Cleveland ...................................... $126.00 $207.50 $128.50 $215.00 $131.50 $223.00Cambridge...................................... 110.50 193.50 113.00 201.00 116.00 209.00
Oklahoma- Oklahoma C ity ............................. 119.50 207.00 121.00 214.50 122.50 222.50M cAlester...................................... 104.50 187.00 106.00 194.50 107.50 202.50
Pennsylvania— Philadelphia .................................. 125.50 212.50 128.50 220.00 131.50 228.00Scranton......................................... 122.50 205.50 125.50 213.00 128.50 221.00
Rhode Island- Providence .................................... 122.00 lo 207.50 124.50 216.00 127.00 224.00Green H ill...................................... 6 121.50 7203.00 124.50 216.00 127.00 224.00
South Carolina— Greenville...................................... 109.50 195.50 111.00 203.00 112.50 211.00Chester........................................... 104.50 185.00 106.00 192.50 107.50 200.50
South Dakota- Sioux Falls .................................... 111.50 191.00 113.50 198.50 115.50 206.50Watertown, Jet................................ 108.00 185.50 110.00 193.00 112.00 201.00
Tennessee- Memphis......................................... 109.50 197.50 111.50 205.00 113.00 213.00Farmington.................................... 104.50 184.00 106.00 191.50 107.50 199.50
Texas- Houston ......................................... 119.50 207.00 121.00 214.50 122.50 222.50Laredo ........................................... 104.50 187.00 106.00 194.50 107.50 202.50
Utah- Salt Lake C ity ................................ 115.00 197.50 116.50 205.00 118.00 213.00Brigham C ity.................................. 108.50 186.00 110.00 193.50 111.50 201.50
Vermont- White River, Jet.............................. 3 117.50 4 197.00 124.00 210.50 126.50 218.50Virginia- Arlington ...................................... 130.50 211.50 132.50 219.00 134.50 227.00
Richmond...................................... 118.50 201.50 120.50 209.00 122.50 217.00McKenney...................................... 112.50 192.50 114.50 200.00 116.50 208.00
West Virginia- Charleston...................................... 124.50 205.50 126.50 213.00 128.50 221.00E tam ............................................... 112.50 192.50 114.50 200.00 116.50 208.00
Washington- Port A ngeles.................................. 124.00 202.00 126.00 209.50 128.00 217.50Wisconsin- Milwaukee...................................... 124.50 206.50 126.00 214.00 127.50 222.00
Stevens Pt........................................ 119.50 192.50 121.00 200.00 122.50 208.00Wyoming- Laramie........................................... 110.50 189.50 112.00 197.00 113.50 205.00
Rawlins........................................... 108.50 186.00 110.00 193.50 111.50 201.50
1 Rates do not include “special” or “special city” allowances (see table 12) or cost-of-living allowance in effect in 1972 and 1973.* Cities and towns in this table were selected from those in the lowest and highest pay categories in each state. In addition, some
cities in intermediate categories were included because they are among the principal cities in the state. Listings showing one city are for states having a single wage rate.
Rate increased an additional $4 effective Aug. 1, 1971. Rate increased an additional $6 effective Aug. 1, 1971. Rate increased an additional $3 effective Aug. 1, 1971. Rate increased an additional $0.50 effective Aug. 1, 1971. Rate increased an additional $5.50 effective Aug. 1, 1971.
® Rate increased an additional $1 effective Feb. 13, 1972. Rate increased an additional $1.50 effective Feb. 13, 1972.
Rate increased an additional $1 effective Aug. 1, 1971.
Digitized for FRASER http://fraser.stlouisfed.org/ Federal Reserve Bank of St. Louis

Table 6. Weekly salary rates for traffic central office employees, selected cities and occupations, January 1941 and July 1946
Operators Junior Service Service ServiceAssistants Assistants Observers
City Jan.1941
July1946
Jan.1941
July1946
Jan.1941
July1946
Jan.1941
July1946
Minimum
Maximum
Minimum
Maximum Maximum
Boston...................................... $13.00 $25.00 $27.00 $41.00 $26.00 $43.00 $30.00 $50.00 $30.00 $47.00Buffalo .................................... 15.00 25.00 28.00 41.00 26.00 42.00 30.00 49.00 30.00 46.00Chicago.................................... 15.00 26.00 30.00 44.00 27.00 45.00 31.00 53.00 31.00 51.00Cincinnati ................................ 13.00 24.00 27.50 41.50 25.00 42.50 29.00 49.50 29.00 46.50Cleveland.................................. 14.00 25.00 29.00 42.50 26.00 44.50 31.00 51.50 31.00 48.50Detroit...................................... 15.00 25.00 31.00 45.00 26.00 46.00 30.00 54.00 30.00 51.00Kansas C ity ............................. 13.00 22.00 27.00 39.00 - 27.00 47.00 27.00 45.00Louisville.................................. 12.00 20.00 27.00 39.00 21.00 4 1.00 25.00 47.00 25.00 45.00Memphis .................................. 12.00 20.00 27.00 39.00 21.00 41.00 25.00 47.00 25.00 45.00Minneapolis............................. 14.00 23.00 27.00 40.00 24.00 41.00 28.00 48.00 28.00 46.00New York ................................ 16.00 29.00 28.00 44.00 31.00 46.00 35.00 53.00 35.00 50.00Philadelphia............................. 14.00 25.00 28.00 41.00 27.00 43.00 31.00 50.00 31.00 47.00Pittsburgh ................................ 14.00 25.00 28.00 41.00 27.00 43.00 31.00 50.00 31.00 47.00St. Louis .................................. 13.00 23.00 27.00 40.00 - - 28.00 48.00 28.00 46.00
Table 7. Weekly salary rates for traffic central office employes, selected cities and occupations, 1952-70
Operators
CityJuly 1952 Sept. 1953 Oct. 1954 Nov. 1955 Dec. 1956 Jan. 1958
Minimum
Maximum1
Minimum
Maximum1
Minimum
Maximum1
Minimum
Maximum1
Minimum
Maximum1
Minimum
Maximum1
Boston .................................... $37.50 $57.50 $39.00 $59.00 $39.00 $61.50 $41.00 $64.00 $44.00 $66.50 $46.00 $69.00B u ffa lo .................................... 41.00 58.50 42.00 60.00 42.00 61.50 44.00 63.50 (2) (2) -
Chicago.................................... 42.00 60.00 44.00 62.00 46.00 64.00 48.00 66.50 51.50 69.50 54.00 72.50Cincinnati................................ 39.00 58.00 42.00 60.50 42.00 62.50 44.50 65.00 48.50 68.00 51.00 71.00Cleveland ............................... 43.00 58.50 45.00 60.50 45.00 62.00 47.00 64.50 51.50 67.50 54.50 70.50Detroit .................................... 44.00 61.50 46.00 63.00 46.00 64.50 48.50 67.50 51.50 70.50 55.50 73.50Hillsboro, Mo........................... - - - - - —Kansas C ity ............................. 40.00 56.50 42.00 58.50 42.00 60.00 44.50 63.00 47.50 66.00 50.50 69.00Louisville ............................... 36.50 55.00 38.00 57.00 38.00 58.50 40.00 61.00 43.00 63.50 45.00 66.00Memphis.................................. 36.50 55.00 38.00 57.00 38.00 58.50 40.00 61.00 43.00 63.50 45.00 66.00Minneapolis............................. 39.00 56.50 41.00 58.50 41.00 60.00 43.00 62.50 46.00 65.50 49.00 68.50Monrovia, Md........................... - - - - -New Y o rk ............................... 42.00 60.50 43.00 62.50 43.00 64.00 45.00 66.50 48.00 69.50 51.00 72.00Philadelphia ........................... 40.00 57.00 42.00 59.00 42.00 60.50 44.00 63.00 46.00 66.00 50.00 68.50Pittsburgh................................ 40.00 57.00 42.00 59.00 42.00 60.50 44.00 63.00 46.00 66.00 50.00 68.50Rockdale, Ga............................ - - - - - - -St. L ou is.................................. 40.00 56.50 42.00 59.00 42.00 60.50 44.50 63.50 47.50 66.50 50.50 69.50Wayne, Pa. ........................... - - - - - - - - 46.00 66.00 50.00 68.50White Plains, N.Y..................... — — 43.00 62.50 43.00 64.00 45.00 66.50 48.00 69.50 51.00 72.00
Digitized for FRASER http://fraser.stlouisfed.org/ Federal Reserve Bank of St. Louis

Operators—Continued
City June 1959 Oct. 1960 Nov. 1961 Nov. 1962 Nov. 1963
Minimum
Maximum1
Minimum
Maximum1
Minimum
Maximum1
Minimum
Maximum1
Minimum
Maximum1
B o sto n .................................................................... $49.00 $72.50 $51.00 $75.00 $54.00 $77.00 $56.00 $80.00 $58.00 $83.00Buffalo.................................................................... - - - - - - - - -
Chicago ................................................................. 55.50 76.50 57.00 79.00 59.50 81.00 61.50 84.00 64.00 87.00Cincinnati............................................................... 52.50 74.00 54.00 76.50 57.00 78.50 59.00 81.50 61.00 84.50Cleveland............................................................... 55.50 73.50 57.50 76.00 60.50 78.00 62.50 81.00 65.00 84.50D etro it.................................................................... 58.50 76.50 60.50 79.00 63.00 81.00 65.00 84.00 67.50 87.00Hillsboro, Mo.......................................................... - - - 56.00 75.00 59.50 79.00Kansas City ........................................................... 52.50 72.00 54.00 74.50 55.50 76.50 57.50 79.50 59.50 82.50Louisville............................................................... 46.50 70.00 48.50 72.50 51.00 74.50 53.00 77.00 55.00 79.50Memphis................................................................. 46.50 70.00 48.50 72.50 51.00 74.50 53.00 77.00 55.00 79.50Minneapolis ........................................................... 50.00 71.50 52.00 74.00 54.50 76.00 56.50 79.00 (4) (4)Monrovia, Md.......................................................... - - - - - 53.50 70.00 55.50 72.50New Y ork............................................................... 52.00 75.00 57.00 78.00 60.00 580.00 63.00 84.00 65.00 88.00Philadelphia........................................................... 52.00 71.50 59.00 74.50 61.00 s76.50 63.00 80.50 65.00 83.50Pittsburgh............................................................... 52.00 71.50 59.00 74.50 61.00 s76.50 63.00 80.50 65.00 83.50Rockdale, Ga.......................................................... - - - - - - 51.00 73.50 53.00 76.00St. Louis................................................................. 52.50 72.50 54.00 75.00 55.50 77.00 57.50 80.00 659.50 783.00Wayne, Pa.3 ........................................................... 52.00 71.50 59.00 74.50 61.00 s76.50 - - -White Plains, N.Y................................................... 52.00 75.00 57.00 78.00 60.00 s 80.00 63.00 84.00 65.00 88.00
Operators- Continued
Jan. 1965 Jan. 1966 Jan.1967 July 1968
Minimum Maximum Minimum Maximum Minimum Maximum Minimum Maximum
B oston.................................... $60.00 $87.00 $63.00 $ 90.00 $66.50 $ 95.50 _ _Buffalo .................................. - - - - -Chicago.................................. 865.50 91.00 70.00 94.00 9 74.00 99.50 -Cincinnati ............................. 65.00 88.50 70.00 91.50 74.00 97.00 -
Cleveland................................ 67.50 88.50 69.50 91.50 - - - -Detroit.................................... 70.50 91.00 75.00 94.00 80.00 99.50 - -Hillsboro, Mo.......................... 62.00 83.00 65.00 86.00 68.50 lo 91.50 $72.50 $101.50Kansas C ity ........................... 62.50 86.50 65.50 1189.50 - - - -Louisville................................ 57.00 83.50 60.00 86.50 63.50 92.00 68.00 100.00Memphis ................................ 57.00 83.50 60.00 86.50 63.50 92.00 68.00 100.00Minneapolis........................... - - - - - - - -Monrovia, Md......................... 1258.50 1276.50 1260.50 1282.50 1265.50 1288.00 1271.50 1297.50New York ............................. 67.50 1392.00 70.00 96.00 73.50 101.50 77.50 109.50Philadelphia........................... 68.00 1487.50 70.00 91.00 - - - -Pittsburgh ............................. 68.00 1487.50 70.00 91.00 73.50 96.50 77.50 104.50Rockdale, Ga.......................... 57.00 83.50 60.00 86.50 63.50 92.00 68.00 101.50St. Louis ............................... 63.00 89.00 66.00 92.00 - - -Wayne, Pa.3 ........................... - - - - - - -White Plains, N.Y................... 67.50 1592.00 70.00 96.00 73.50 101.50 77.50 109.50
See footnotes at end of table.
Digitized for FRASER http://fraser.stlouisfed.org/ Federal Reserve Bank of St. Louis
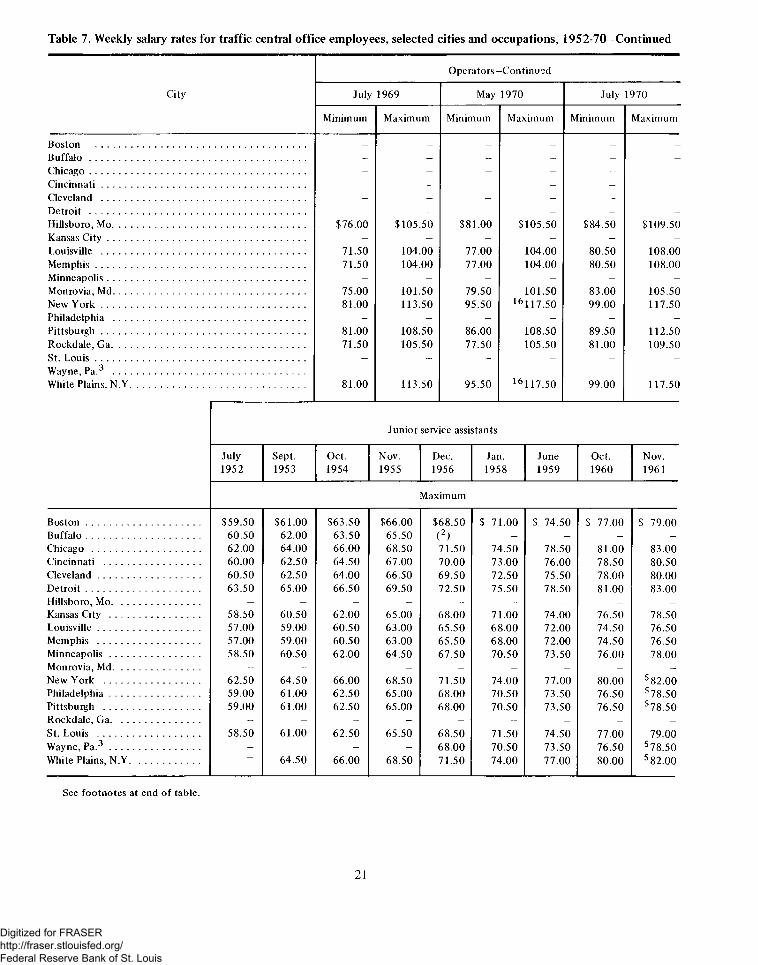
City
Operators--Continued
July 1969 May 1970 July 1970
Minimum Maximum Minimum Maximum Minimum Maximum
Boston ................................................................................. _ — — _ — _B uffa lo ................................................................................. - - - - - -Chicago................................................................................. - - - - -Cincinnati............................................................................ - - - - -
Cleveland ............................................................................ - - - - -Detroit ................................................................................. -Hillsboro, Mo........................................................................ $76.00 $105.50 $81.00 $105.50 $84.50 $109.50Kansas C ity .......................................................................... - - - - -Louisville ............................................................................ 71.50 104.00 77.00 104.00 80.50 108.00Memphis............................................................................... 71.50 104.00 77.00 104.00 80.50 108.00Minneapolis.......................................................................... - - - - - -Monrovia, Md........................................................................ 75.00 101.50 79.50 101.50 83.00 105.50New Y ork ............................................................................ 81.00 113.50 95.50 16117.50 99.00 117.50Philadelphia ........................................................................ - - - - - -Pittsburgh............................................................................ 81.00 108.50 86.00 108.50 89.50 112.50Rockdale, Ga......................................................................... 71.50 105.50 77.50 105.50 81.00 109.50St. L ou is............................................................................... - - - - -
Wayne, Pa.3 ........................................................................ - - - - -
White Plains, N.Y.................................................................. 81.00 113.50 95.50 16117.50 99.00 117.50
Junior service assistants
July Sept. Oct. Nov. Dec. Jan. June Oct. Nov.1952 1953 1954 1955 1956 1958 1959 1960 1961
Maximum
B oston ........................................... $59.50 $61.00 $63.50 $66.00 $68.50 $ 71.00 $ 74.50 $ 77.00 $ 79.00Buffalo........................................... 60.50 62.00 63.50 65.50 (2) —Chicago ......................................... 62.00 64.00 66.00 68.50 71.50 74.50 78.50 81.00 83.00Cincinnati .................................... 60.00 62.50 64.50 67.00 70.00 73.00 76.00 78.50 80.50Cleveland...................................... 60.50 62.50 64.00 66.50 69.50 72.50 75.50 78.00 80.00D etroit........................................... 63.50 65.00 66.50 69.50 72.50 75.50 78.50 81.00 83.00Hillsboro, Mo................................. - - - — - -Kansas City .................................. 58.50 60.50 62.00 65.00 68.00 71.00 74.00 76.50 78.50Louisville...................................... 57.00 59.00 60.50 63.00 65.50 68.00 72.00 74.50 76.50Memphis ...................................... 57.00 59.00 60.50 63.00 65.50 68.00 72.00 74.50 76.50Minneapolis.................................. 58.50 60.50 62.00 64.50 67.50 70.50 73.50 76.00 78.00Monrovia, Md................................. - - - - - —New York .................................... 62.50 64.50 66.00 68.50 71.50 74.00 77.00 80.00 5 82.00Philadelphia.................................. 59.00 61.00 62.50 65.00 68.00 70.50 73.50 76.50 s 78.50Pittsburgh .................................... 59.00 61.00 62.50 65.00 68.00 70.50 73.50 76.50 s78.50Rockdale, Ga................................. - - - - -St. Louis ...................................... 58.50 61.00 62.50 65.50 68.50 71.50 74.50 77.00 79.00Wayne, Pa.3 .................................. - - - - 68.00 70.50 73.50 76.50 s 78.50White Plains, N.Y.......................... 64.50 66.00 68.50 71.50 74.00 77.00 80.00 5 82.00
Digitized for FRASER http://fraser.stlouisfed.org/ Federal Reserve Bank of St. Louis

City
Junior service assistants—Continued
Nov.1962
Nov.1963
Jan.1965
Jan.1966
Jan.1967
July1968
July1969
July1970
Maximum
B oston............................................. $82.00 $85.00 $89.00 $92.00 $97.50 _ _ _Buffalo ........................................... - - - - - -Chicago........................................... 86.00 89.00 93.00 96.00 101.50 - -Cincinnati ...................................... 83.50 86.50 90.50 93.50 99.00 - -Cleveland......................................... 83.00 86.50 90.50 93.50 - - -Detroit............................................. 86.00 89.00 93.00 96.00 101.50 - - -Hillsboro, Mo................................... - - - - - - -Kansas C ity .................................... 81.50 84.50 88.50 n 91.50 - -Louisville......................................... 79.00 81.50 85.50 88.50 94.00 S102.00 $106.00 SI 10.00Memphis ......................................... 79.00 81.50 85.50 88.50 94.00 102.00 106.00 110.00Minneapolis.................................... 81.00 (4> - - - - - -Monrovia, Md................................... - - - - -New York ...................................... 86.00 90.00 13 94.00 98.00 103.50 112.50 1 16.50 16120.50Philadelphia.................................... 82.50 85.50 1489.50 93.00 - - -Pittsburgh ...................................... 82.50 85.50 1489.50 93.00 98.50 106.50 110.50 114.50Rockdale, Ga................................... - - - - - - - -St. Louis ......................................... 82.00 7 85.00 91.00 94.00 - -Wayne, Pa.3 .................................... - - - - - -White Plains, N.Y............................ 86.00 90.00 1594.00 98.00 103.50 112.50 116.50 16120.50
Service assistants
July Sept. Oct. Nov. Dec. Jan. June Oct. Nov.1952 1953 1954 1955 1956 1958 1959 1960 1961
Maximum
B oston ........................................... $66.50 $68.00 $70.50 $73.00 $75.50 $78.00 $81.50 $84.50 $86.50Buffalo........................................... 67.50 69.00 71.50 73.50 (2) - - - -Chicago ......................................... 69.00 71.00 73.00 75.50 78.50 81.50 85.50 89.00 91.00Cincinnati .................................... 67.00 69.50 71.50 74.00 77.00 80.00 83.00 86.50 88.50Cleveland...................................... 67.50 69.50 71.00 73.50 76.50 79.50 82.50 85.00 88.00D etroit........................................... 70.50 72.00 73.50 76.50 79.50 82.50 85.50 89.00 91.00Hillsboro, Mo................................. - - - - - - - - -Kansas City .................................. 65.50 67.50 69.00 72.00 75.00 78.00 81.00 83.50 86.50Louisville...................................... 64.00 66.00 67.50 70.00 72.50 75.00 79.00 81.50 83.50Memphis ...................................... 64.00 66.00 67.50 70.00 72.50 75.00 79.00 81.50 83.50Minneapolis.................................. 65.50 67.50 69.00 71.50 74.50 77.50 80.50 83.00 85.50Monrovia, Md................................. - - - - - - - -New York .................................... 69.50 71.50 74.00 76.50 79.50 82.00 85.00 88.00 590.00Philadelphia.................................. 66.00 68.00 70.50 73.00 76.00 78.50 81.50 84.50 s86.50Pittsburgh .................................... 66.00 68.00 70.50 73.00 76.00 78.50 81.50 84.50 586.50Rockdale, Ga................................. - - - - - - - - -St. Louis ...................................... 65.50 68.00 69.50 72.50 75.50 78.50 81.50 84.00 87.00Wayne, Pa.3 .................................. - - - - 76.00 78.50 81.50 84.50 586.50White Plains, N.Y.......................... — 71.50 74.00 76.50 79.50 82.00 85.00 88.00 590.00
Digitized for FRASER http://fraser.stlouisfed.org/ Federal Reserve Bank of St. Louis

City
Service assistants—Continued
Nov.1962
Nov.1963
Jan.1965
Jan.1966
Jan.1967
July1968
July1969
July1970
Maximum
B oston............................................. $90.00 $93.00 $ 97.00 $100.00 $105.50 _ _Buffalo ........................................... - - - - - - -Chicago........................................... 94.00 97.00 101.00 104.00 109.50 - -Cincinnati ...................................... 91.50 94.50 98.50 101.50 107.00 - -Cleveland......................................... 91.00 94.50 98.50 101.50 - -Detroit............................................. 94.00 97.00 101.00 104.00 109.50 - — -Hillsboro, Mo................................... - - - - - - -Kansas C ity .................................... 89.50 92.50 96.50 1 *99.50 - -Louisville......................................... 86.50 89.00 93.00 96.00 102.00 $110.00 $114.00 $118.00Memphis ......................................... 86.50 89.00 93.00 96.00 102.00 110.00 114.00 118.00Minneapolis.................................... 89.00 (4) - - -Monrovia, Md................................... - - 1298.00 107.50 111.50 115.50New York ...................................... 94.00 98.00 13102.00 106.00 111.50 120.50 124.50 16128.50Philadelphia.................................... 90.50 93.50 1497.50 101.00 -Pittsburgh ...................................... 90.50 93.50 97.50 101.00 106.50 114.50 118.50 122.50Rockdale, Ga................................... - - - - 111.50 115.50 119.50St. Louis ........................................ 90.00 793.00 99.00 102.00 - — —Wayne; Pa.3 .................................... - - - - -White Plains, N.Y............................ 94.00 98.00 15102.00 106.00 111.50 120.50 124.50 16128.50
Service observers
July Sept. Oct. Nov. Dec. Jan. June Oct. Nov.1952 1953 1954 1955 1956 1958 1959 1960 1961
Maximum
B oston ........................................... $65.50 $68.00 $70.50 $ 73.00 $ 75.50 $ 78.00 $ 81.50 $ 84.50 $ 86.50Buffalo........................................... 67.50 69.00 71.50 73.50 (2) -Chicago ......................................... 69.00 71.00 73.00 75.50 78.50 81.50 85.50 88.00 91.00Cincinnati .................................... 66.00 69.50 71.50 74.00 77.00 80.00 83.00 85.50 87.50Cleveland...................................... 66.50 69.50 71.00 73.50 76.50 79.50 82.50 85.00 88.00D etroit........................................... 69.50 72.00 73.50 76.50 79.50 82.50 85.50 88.00 91.00Hillsboro, Mo................................. - - -
Kansas City .................................. 64.50 67.50 69.00 72.00 75.00 78.00 81.00 83.50 86.50Louisville...................................... 64.00 66.00 67.50 70.00 72.50 75.00 79.00 81.50 83.50Memphis ...................................... 64.00 66.00 67.50 70.00 72.50 75.00 79.00 81.50 83.50Minneapolis.................................. 64.50 67.50 69.00 71.50 74.50 77.50 80.50 83.00 85.00Monrovia, Md................................. - - - —New York .................................... 69.50 71.50 74.00 76.50 79.50 82.00 85.00 88.00 s 90.00Philadelphia.................................. 65.00 68.00 69.50 72.00 75.00 77.50 80.50 83.50 5 85.00Pittsburgh .................................... 65.00 68.00 69.50 72.00 75.00 77.50 80.50 83.50 5 85.50Rockdale, Ga................................. - - - - — —St. Louis ...................................... 64.50 68.00 69.50 72.50 75.50 78.50 81.50 84.00 87.00Wayne, Pa.3 .................................. - - - - - - - -
White Plains, N.Y.......................... — 71.50 74.00 76.50 79.50 82.00 85.00 88.00 s 90.00
Digitized for FRASER http://fraser.stlouisfed.org/ Federal Reserve Bank of St. Louis

City
Service observers-Continued
Nov.1962
Nov.1963
Jan.1965
Jan.1966
Jan.1967
July1968
July1969
July1970
Maximum
B oston............................................................... $90.00 $93.00 $ 97.00 $100.00 $105.50 _ _Buffalo ............................................................. - - - - - - —Chicago............................................................. 94.00 97.00 101.00 104.00 109.50 - -
Cincinnati ........................................................ 91.50 94.50 98.50 101.50 107.00 - - -
Cleveland.......................................................... 91.00 94.50 98.50 101.50 -Detroit............................................................... 94.00 97.00 101.00 104.00 109.50Hillsboro, Mo..................................................... - 10101.50 $111.50 $115.50 SI 19.50Kansas C ity ...................................................... 89.50 92.50 96.50 n 99.50 - - - -Louisville........................................................... 86.50 89.00 93.50 96.50 102.00 110.00 114.00 118.00Memphis ........................................................... 86.50 89.00 93.50 96.50 102.00 110.00 114.00 118.00Minneapolis...................................................... 89.00 (4) - - - - -
Monrovia, Md..................................................... - - -New York ........................................................ 94.00 98.00 13102.00 106.00 1 11.50 120.50 124.50 16128.50Philadelphia...................................................... 89.50 92.50 1496.50 100.00 - - -Pittsburgh ........................................................ 89.50 92.50 1496.50 100.00 105.50 113.50 117.50 121.50Rockdale, Ga..................................................... - - - - - — -St. Louis .......................................................... 90.00 793.00 99.00 102.00 — -Wayne, Pa.3 ...................................................... - - - - -White Plains, N.Y.............................................. 94.00 98.00 15102.00 106.00 111.50 120.50 124.50 16128.50
1 Time required to reach maximum rates for operators reduced from 6V2 years to 6 years effective Sept. 2, 1953, and to 5Vi years effective Nov. 9, 1961.
2 Traffic employees were not employed in Buffalo by the Long Lines Department after May 6, 1956.
3 Traffic employees, except service observers, were employed in Wayne only for the period 1956-62. Service observers were not employed in Wayne.
4 Traffic employees were not employed in Minneapolis by the Long Lines Department after Mar. 2, 1963.
5 Maximum rate increased an additional $1 effective May 6, 1962.
6 Rate increased an additional $0.50 effective Feb. 9,1964.
7 Rate increased an additional $2 effective Feb. 9, 1964.8 Rate increased an additional $2.50 effective May 16,
1965.
9 Rate increased an additional $4 effective June 4, 1967.
10 Rate increased an additional $0.50 effective Feb. 5, 1967.
11 Rate increased an additional $2.50 effective Feb. 6,1966.
12 Employees received an additional $1.50 special allowance.
13 Rate increased an additional $1 effective Mar. 6, 1965.
14 Rate increased an additional $0.50 effective Mar. 14, 1965.
15 Rate increased an additional $1 effective Mar. 6, 1965.
16 Effective April 1, 1970.
NOTE: Dashes indicate no employees in group.
Digitized for FRASER http://fraser.stlouisfed.org/ Federal Reserve Bank of St. Louis

1 ' JTable 8. Weekly salary rates for traffic central office employees, selected cities and occupations, 1971-73
City
Operators
July 1971 July 1972 July 1973
Minimum Maximum Minimum Maximum Minimum Maximum
Chatham, N.C.................................. $ 87.00 $126.50 $ 88.00 $131.50 $ 89.00 $137.00Hagerstown, Md.............................. 87.50 120.50 89.50 125.50 91.50 131.00Jacksonville, Fla.............................. 87.00 126.50 88.00 131.50 89.00 137.00Leesburg, Va.................................... 96.00 130.00 98.00 135.00 101.00 140.50Monrovia, Md.................................. 91.00 124.00 93.00 129.00 95.00 134.50New York, N.Y............................... 3107.00 4 136.00 112.00 144.00 115.00 149.50Pittsburgh, Pa.................................. 99.50 132.50 101.50 137.50 103.50 143.00White Plains, N.Y............................ • 5105.00 4 136.00 109.00 144.00 112.00 149.50
Junior service assistants Service assistants
July 1971 July 1972 July 1973 July 1971 July 1972 'July 1973
Maximum
Chatham, N.C.................................. _ _Hagerstown, Md.............................. - -
Jacksonville, Fla.............................. SI 28.50 $133.50 $139.00 SI 36.50 S141.50 $147.00Leesburg, Va.................................... - - - - -Monrovia, Md................................... - - 139.00 144.00 149.50New York, N.Y............................... 6139.00 150.00 155.50 7 147.00 159.00 164.50Pittsburgh, Pa.................................. 134.50 139.50 145.00 142.50 147.50 153.00White Plains, N.Y............................ 6139.00 150.00 155.50 7 147.00 159.00 164.50
Service observers
July 1971 July 1972 July 1973
Maximum
Chatham, N.C........................................ _
Hagerstown, Md.................................... -
Jacksonville, Fla.................................... $140.00 $145.00 $150.50Leesburg, Va.......................................... - - -
Monrovia, Md........................................ -
New York, N.Y..................................... 7147.00 159.00 164.50Pittsburgh, Pa........................................ 141.50 146.50 152.00White Plains, N.Y.................................. 7 147.00 159.00 164.50
1 Rates do not include “special” or “special city” allowances (see table 12) or cost-of-living allowances in effect in 1972 and 1973.
2 Relocations of traffic employees as of 1971 necessitated the selection of a new sample of cities. Traffic employees had not necessarily been newly introduced into the cities appearing for the first time in the sample.
3 Rate increased an additional $2 effective Aug. 15, 1971.
4 Rate increased an additional $3 effective Aug. 15, 1971.
5 Rate increased an additional $1 effective Aug. 15, 1971.
6 Rate increased an additional $6 effective Aug. 15, 1971.
7 Rate increased an additional $7 effective Aug. 15, 1971.
Digitized for FRASER http://fraser.stlouisfed.org/ Federal Reserve Bank of St. Louis

City
Group 3 1 Group 4 1
Aug. 19442 July 1946 Aug. 19442 July 1946
Minimum Maximum Minimum Maximum Minimum Maximum Minimum Maximum
C hicago.................................. $20.00 $33.00 $30.00 $44.00 $20.00 $38.00 $30.00 $49.00Cincinnati ............................. 20.00 29.00 28.50 39.50 20.00 33.00 28.50 43.50Cleveland............................... 21.00 32.00 29.00 41.00 21.00 36.00 29.00 45.00Kansas C ity ........................... 18.00 27.00 27.00 38.00 18.00 33.00 27.00 44.00New Y ork ............................. 20.00 34.00 28.00 43.00 20.00 40.00 28.00 49.00Philadelphia........................... 19.00 33.00 28.00 42.00 19.00 39.00 28.00 48.00St. Louis ............................... 18.00 28.00 27.00 39.00 18.00 34.00 27.00 45.00
Each clerical group is composed of a number of occupations requiring approximately the same skill or degree of responsibility. Group 3 had 6 occupations among which were file clerk, and typist. Group 4 had 18 occupations among which were calculating machine operator, junior draftsman, payroll clerk, and stenographer.
Initial schedules; employees at many locations received retroactive increases as a result of the establishment of these schedules.
Digitized for FRASER http://fraser.stlouisfed.org/ Federal Reserve Bank of St. Louis

City
July 1952 September 1953 October 1954 November 1955
Mini-mum
Maximum Mini-mum
Maximum Mini-mum
Maximum Mini-mum
Maximum
Group 3 1
Group4 1
Group
31Group
4 1Group
3 1Group
4 1Group
3 1Group
4 1
A tlanta.................................... $39.00 $57.00 $60.00 $40.50 $59.00 $62.00 $40.50 $60.50 $63.50 $42.50 $62.50 $66.00Baltimore ............................... 39.00 - 64.00 40.50 - 66.00 40.50 67.00 43.00 69.50Birmingham ........................... 39.00 57.00 60.00 40.50 59.00 62.00 40.50 60.50 63.50 42.50 62.50 66.00Boston .................................... 37.50 54.00 60.50 39.00 55.50 62.00 39.00 57.00 63.50 41.00 59.00 65.50B uffalo .................................... 41.00 55.00 60.50 42.00 56.50 62.00 42.00 58.00 63.50 44.00 60.00 65.50Charleston................................ 38.50 - 60.50 39.00 62.50 39.00 - 64.00 41.00 - 66.50Charlotte.................................. 39.00 57.00 60.00 40.50 59.00 62.00 40.50 60.50 63.50 42.50 62.50 66.00Chattanooga........................... 39.00 - 60.00 40.50 - 62.00 40.50 - 63.50 42.50 - 66.00Chicago.................................... 43.00 61.50 67.00 45.00 63.50 69.00 46.00 65.50 71.00 48.00 67.50 73.50Cincinnati................................ 39.00 53.50 60.00 42.00 55.50 62.50 42.00 58.00 65.50 44.50 60.50 68.00Cleveland ................................ 43.00 57.00 61.50 45.00 59.00 63.50 45.00 60.50 65.00 47.50 63.00 67.50Dallas ...................................... 40.00 53.00 60.50 42.00 55.00 62.50 42.00 56.50 64.00 44.50 59.50 67.00Denver .................................... 40.00 56.50 59.50 42.00 59.00 62.00 42.00 60.50 63.50 44.00 63.00 66.00Des M oines............................. 39.00 - 60.00 42.00 - 62.00 42.00 63.50 44.00 - 66.00Detroit .................................... 44.00 60.00 67.00 46.00 61.50 68.50 46.00 62.50 69.50 48.50 65.00 72.50Duluth .................................... - - - - - - - -
El Paso .................................... 40.00 - 59.50 41.50 - 61.50 41.50 63.00 43.50 65.00Harrisburg................................ 38.00 54.50 61.50 40.00 56.50 63.50 40.00 57.50 64.50 42.00 59.50 67.00Hartford.................................. 38.00 - 60.50 39.00 62.00 39.00 63.50 41.00 65.50Houston .................................. - - - - - 42.00 64.00 44.50 67.00Indianapolis ........................... 40.50 56.50 60.50 42.00 57.50 61.50 42.00 58.50 63.00 44.50 60.50 65.00Kansas C ity ............................. 40.00 53.00 60.50 42.00 55.00 62.50 42.00 56.50 64.00 44.50 59.50 67.00Knoxville ............................... 39.00 - 60.00 40.50 - 62.00 40.50 - 63.50 42.50 - 66.00Little R o ck ............................. 39.00 - 57.00 41.00 - 59.00 41.00 60.50 43.50 63.50Los Angeles............................. - - - 47.00 - 70.00 47.00 71.50 50.00 74.00Louisville ............................... 39.00 57.00 60.00 40.50 59.00 62.00 40.50 60.50 63.50 42.50 62.50 66.00Memphis.................................. 39.00 57.00 60.00 40.50 59.00 62.00 40.50 60.50 63.50 42.50 62.50 66.00M iam i...................................... 39.00 - 60.00 40.50 - 62.00 40.50 - 63.50 42.50 66.00Milwaukee................................ 39.00 57.00 40.50 - 59.00 40.50 - 60.50 43.00 63.00Minneapolis............................. 39.00 56.50 61.00 42.00 58.50 63.00 42.00 60.00 66.00 44.00 62.50 68.50Montgomery........................... 38.00 - 57.00 39.50 - 59.00 39.50 - 60.50 41.50 - 62.50Nashville.................................. 39.00 57.00 60.00 40.50 59.00 62.00 40.50 60.50 63.50 42.50 62.50 66.00New Orleans........................... 39.00 - 60.00 40.50 - 62.00 40.50 - 63.50 42.50 66.00New Y ork ................................ 42.00 58.00 65.50 43.00 60.00 67.50 43.00 61.50 69.00 45.00 64.00 71.50Newark.................................... 44.00 59.50 65.00 45.00 61.00 66.50 45.00 61.50 67.00 47.00 64.00 69.50Omaha .................................... 39.00 54.50 60.00 42.00 56.50 62.00 42.00 58.00 63.50 44.00 60.50 66.00Philadelphia ........................... 40.00 56.00 62.50 42.00 58.00 64.50 42.00 59.50 66.00 44.00 62.00 68.50Pittsburgh............................... 40.00 56.00 62.50 42.00 58.00 64.50 42.00 59.50 66.00 44.00 62.00 68.50Reading.................................... 38.00 - 61.50 40.00 - 63.50 40.00 - 64.50 42.00 - 67.00Richmond................................ 38.50 55.00 62.00 40.00 56.50 63.50 40.00 58.00 65.00 42.00 60.00 67.00Salt Lake C ity ......................... 40.00 - 59.50 41.50 - 61.50 41.50 - 63.00 43.50 - 65.50San Francisco......................... 43.50 62.50 68.00 47.00 64.50 70.00 47.00 66.00 71.50 50.00 68.50 74.00Scranton.................................. 38.00 - 61.50 40.00 - 63.50 40.00 - 64.50 42.00 - 67.00Seattle...................................... - - - - - - 47.00 - 71.00 49.00 73.50St. L ou is.................................. 40.00 53.00 60.50 42.00 55.00 62.50 42.00 56.50 64.00 44.50 59.50 67.00Washington, D.C...................... 43.50 60.00 66.00 45.00 61.50 67.50 45.00 63.00 69.00 47.50 65.50 71.50Wayne, Pa................................. - - - - - - - - - - - -White Plains, N.Y..................... - - - 43.00 60.00 67.50 43.00 61.50 69.00 45.00 64.00 71.50
Digitized for FRASER http://fraser.stlouisfed.org/ Federal Reserve Bank of St. Louis

City
December 1956 January 1958 June 1959 October 1960
Mini-mum
MaximumMini-mum
MaximumMini-mum
MaximumMini-mum
Maximum
Group3 1
Group4 1
Group3 1
Group4 1
Group 3 1
Group4 1
Group 3 1
Group4 1
A tlanta.................................... $45.50 $65.00 $68.50 $47.50 $67.50 $71.00 $48.50 $71.00 $74.50 $50.00 $73.50 $77.00Baltimore ............................... 47.00 - 72.00 49.50 - 74.50 50.50 - 77.00 53.00 - 79.00Birmingham ........................... 45.50 65.00 68.50 47.50 67.50 71.00 48.50 71.00 74.50 50.00 73.50 77.00Boston .................................... 44.00 61.50 68.00 46.00 66.00 72.50 49.00 69.00 75.50 51.00 71.50 78.00B uffa lo .................................... 46.00 62.00 67.50 48.00 64.00 70.00 49.50 - 72.00 53.50 - 75.00Charleston............................... 45.00 - 70.00 47.50 73.00 50.00 - 76.00 51.50 - 78.00Charlotte.................................. 45.50 65.00 68.50 47.50 67.50 71.00 48.50 71.00 74.50 50.00 - 77.00Chattanooga........................... 45.50 - 68.50 47.50 - 71.00 48.50 74.50 50.00 - 77.00Chicago.................................... 51.00 70.50 76.50 53.50 73.50 79.50 54.50 76.50 83.00 56.00 78.50 86.00Cincinnati............................... 48.50 63.50 71.00 51.00 66.50 74.00 52.50 69.50 77.00 54.00 73.50 80.00Cleveland ............................... 51.50 66.00 70.50 54.50 69.00 73.50 55.50 71.00 75.50 57.50 73.00 77.50Dallas ...................................... 47.50 62.50 70.00 50.50 65.50 73.00 52.50 76.00 54.00 - 79.00Denver .................................... 46.50 66.00 69.00 49.00 69.00 72.00 50.50 72.00 75.00 52.00 74.50 77.50Des M oines............................. 47.00 - 69.00 50.00 72.00 50.00 - 76.00 52.00 - 78.50Detroit .................................... 51.50 68.00 75.50 55.50 7 1.00 78.50 58.50 74.00 81.50 60.50 - 84.00Duluth .................................... - - - - - - 50.00 - 76.00 52.00 - 78.50El Paso .................................... 45.50 - 68.00 48.00 - 71.00 49.50 - 74.00 51.00 - 76.50Harrisburg................................ 44.00 62.00 69.50 46.00 63.50 71.50 49.00 66.50 74.50 51.00 69.00 77.50Hartford.................................. 44.00 - 68.50 47.00 - 71.50 48.50 74.50 50.00 - 77.50Houston .................................. 47.50 - 70.00 50.50 - 73.00 52.50 76.00 54.00 - 79.00Indianapolis ........................... 48.50 62.50 67.50 51.50 64.50 70.00 53.00 67.00 73.00 54.50 - 75.50Kansas C ity ............................. 47.50 62.50 70.00 50.50 65.50 73.00 52.50 68.50 76.00 54.00 71.50 79.00Knoxville ............................... 45.50 - 68.50 47.50 - 71.00 48.50 - 74.50 50.00 - 77.00Little R o ck ............................. 46.00 - 66.50 48.50 - 69.50 50.50 - 72.00 54.00 - 77.50Los Angeles............................. 55.00 - 77.00 57.50 - 80.00 59.50 - 82.50 64.00 - 85.50Louisville ............................... 45.50 65.00 68.50 47.50 67.50 71.00 48.50 71.00 74.50 50.00 - 77.00Memphis.................................. 45.50 65.00 68.50 47.50 67.50 71.00 48.50 71.00 74.50 50.00 - 77.00M iam i...................................... 45.50 - 68.50 47.50 - 71.00 48.50 - 74.50 50.00 - 77.00Milwaukee................................ 47.00 - 66.50 50.00 - 69.50 51.50 - 73.00 54.50 - 75.50Minneapolis............................. 47.00 65.50 71.50 50.00 68.50 74.50 50.00 - 77.50 52.00 - 80.00Montgomery........................... 44.00 - 64.50 46.00 - 67.00 47.00 - 70.00 49.00 - 72.50Nashville.................................. 45.50 65.00 68.50 47.50 67.50 71.00 48.50 71.00 74.50 50.00 - 77.00New Orleans........................... 45.50 - 68.50 47.50 - 71.00 48.50 - 74.50 50.00 - 77.00New Y o r k ............................... 48.00 67.00 74.50 51.00 69.00 77.00 52.00 70.50 79.00 55.00 74.00 82.00Newark.................................... 49.50 67.00 72.50 51.50 69.50 75.00 52.00 71.50 77.00 53.50 - 79.50Omaha .................................... 47.00 63.50 69.00 50.00 66.50 72.00 50.00 - 76.00 52.00 - 78.50Philadelphia ........................... 46.00 65.00 71.50 48.00 67.50 74.00 50.00 70.00 77.00 53.00 72.00 81.00Pittsburgh............................... 46.00 65.00 71.50 48.00 67.50 74.00 50.00 70.00 77.00 53.00 72.00 81.00Reading.................................... 44.00 - 69.50 46.00 - 71.50 49.00 - 74.50 51.00 - 77.50Richmond............................... 46.00 63.00 70.00 48.50 66.00 73.00 50.50 67.50 76.00 52.00 69.00 78.50Salt Lake C ity ......................... 45.50 - 68.50 48.50 - 71.50 50.50 - 74.50 52.00 - 77.00San Francisco......................... 55.00 70.00 77.00 57.50 72.50 80.00 59.50 - 82.50 64.00 - 85.50Scranton.................................. 44.00 - 69.50 46.00 - 71.50 49.00 - 74.50 51.00 - 77.50Seattle...................................... 53.00 - 76.50 55.50 - 79.50 57.00 - 82.00 59.00 - 84.50St. L ou is.................................. 47.50 62.50 70.00 50.50 65.50 73.00 52.50 68.50 76.00 54.00 71.50 79.00Washington, D.C...................... 51.50 68.50 74.50 54.00 71.00 77.00 55.50 73.50 79.50 57.00 76.00 81.50Wayne, Pa................................. 46.00 65.00 71.50 48.00 67.50 74.00 50.00 70.00 77.00 53.00 72.00 81.00White Plains, N.Y..................... 48.00 67.00 74.50 51.00 69.00 77.00 52.00 70.50 79.00 55.00 74.00 82.00
Digitized for FRASER http://fraser.stlouisfed.org/ Federal Reserve Bank of St. Louis

City
November 1961 November 1962 November 1963 January 1965
Mini-mum
MaximumMini-mum
MaximumMini-mum
MaximumMini-mum
Maximum
Group 3 1
Group4 1
Group31
Group4 1
Group 3 1
Group 4 1
Group 3 1
Group 4 1
A tlanta.................................... $51.50 $75.00 $78.50 $53.50 $77.00 $80.50 $55.50 $79.00 $83.00 $62.50 $82.00 $86.00Baltimore ............................... 54.00 - 80.50 55.50 - 83.00 57.50 - 85.00 60.50 - 88.00Birmingham ........................... 51.50 75.00 78.50 53.50 77.00 80.50 55.50 79.00 83.00 57.50 82.00 86.00Boston .................................... 53.00 73.00 79.50 55.00 76.00 82.50 57.00 79.00 85.50 59.00 - 88.50B uffalo .................................... 55.00 - 78.00 57.00 - 81.00 59.00 - 85.00 62.00 - 88.00Charleston............................... 53.00 - 79.50 55.00 - 82.50 57.00 - 85.00 59.50 - 88.00Charlotte.................................. 51.50 - 78.50 53.50 80.50 55.50 - 83.00 57.50 - 86.00Chattanooga........................... 51.50 - 78.50 53.50 80.50 55.50 - 83.00 57.50 - 86.00Chicago.................................... 57.50 80.00 88.00 59.50 83.00 91.00 62.00 86.00 94.00 64.50 89.00 97.00Cincinnati............................... 56.00 75.00 81.50 59.00 77.50 84.50 61.00 82.00 87.50 65.00 86.00 90.50Cleveland ............................... 59.00 74.50 79.00 61.00 77.50 83.00 63.50 82.50 87.00 66.50 86.00 90.00Dallas ...................................... 55.50 - 81.00 57.50 - 84.00 59.50 - 87.00 62.50 - 91.50Denver .................................... 55.00 76.00 79.50 57.00 79.00 82.50 59.50 82.00 85.50 62.00 - 88.50Des M oines............................. 53.50 - 81.50 55.50 - 84.50 57.50 - 87.00 60.00 - 90.00Detroit .................................... 63.00 - 85.50 65.00 - 88.50 67.50 - 91.50 70.50 - 94.50Duluth .................................... 53.50 - 81.50 55.50 84.50 57.50 - 87.00 60.00 - 90.00El Paso .................................... 54.00 - 78.50 56.00 81.00 58.50 - 83.50 61.00 - 86.50Harrisburg............................... 53.00 72.00 79.50 55.00 75.50 82.00 57.00 78.50 85.00 60.00 81.50 88.00H a r tfo r d .................................. 55.50 - 79.50 57.00 - 82.00 58.50 - 85.50 60.50 - 88.50Houston .................................. 55.50 - 81.00 57.50 - 84.00 59.50 - 87.00 62.50 - 91.50Indianapolis ........................... 56.00 - 77.00 58.00 - 80.00 59.50 - 83.00 62.50 - 86.00Kansas C ity ............................. 55.50 73.00 81.00 57.50 76.00 84.00 59.50 79.00 87.00 62.50 83.50 91.50Knoxville ............................... 51.50 - 78.50 53.50 - 80.50 55.50 - 83.00 57.50 - 86.00Little R o ck ............................. 55.50 - 79.50 57.50 - 82.50 59.50 - 85.00 62.00 - 88.50Los Angeles............................. 68.00 - 87.50 71.50 - 90.50 74.50 - 95.50 77.50 - 98.50Louisville ................................ 51.50 - 78.50 53.50 - 80.50 55.50 - 83.00 57.50 - 86.00Memphis.................................. 51.50 - 78.50 53.50 - 80.50 55.50 - 83.00 57.50 - 86.00M iam i...................................... 51.50 - 78.50 53.50 - 80.50 55.50 - 83.00 57.50 - 86.00Milwaukee............................... 57.00 - 77.00 59.00 - 80.00 61.00 - 83.00 63.50 - 86.00Minneapolis............................. 54.50 - 82.50 56.50 - 86.00 59.00 - 89.00 62.00 - 92.00Montgomery........................... 50.50 - 74.00 52.50 - 76.00 54.50 - 78.00 56.50 - 81.00Nashville.................................. 51.50 - 78.50 53.50 - 80.50 55.50 - 83.00 57.50 - 86.00New Orleans........................... 51.50 - 78.50 53.50 - 80.50 55.50 - 83.00 57.50 - 86.00New Y ork ............................... 56.50 76.00 84.00 58.50 79.00 87.00 60.50 82.00 90.00 64.50 2 85.00 293.00Newark.................................... 55.00 - 81.00 57.00 - 84.00 59.00 - 87.00 61.50 - 90.50Omaha .................................... 53.50 - 81.50 55.50 - 84.50 57.50 - 87.00 60.00 - 90.00Philadelphia ........................... 55.00 74.50 83.00 57.00 78.50 86.00 59.00 81.50 89.00 62.00 84.50 92.00Pittsburgh............................... 55.00 74.50 83.00 57.00 78.50 86.00 59.00 81.50 89.00 62.00 92.00Reading.................................... 53.00 - 79.50 55.00 - 82.00 57.00 - 85.00 60.00 88.00Richmond............................... 53.50 70.50 80.00 55.00 72.50 82.00 57.00 74.00 84.00 59.50 77.50 87.00Salt Lake C ity ......................... 55.00 - 79.00 57.00 - 81.50 59.50 - 84.00 62.00 - 87.00San Lrancisco......................... 68.00 - 87.50 71.50 - 90.50 74.50 - 95.50 77.00 - 98.50Scranton...................... ........... 53.00 - 79.50 55.00 - 82.00 57.00 - 85.00 60.00 88.00Seattle...................................... 62.50 - 86.00 64.50 - 89.00 66.50 - 91.50 69.00 94.00St. L ou is.................................. 55.50 73.00 81.00 57.50 76.00 84.00 359.50 479.00 4 87.00 63.00 85.50 93.50Washington, D.C...................... 58.50 78.00 83.00 60.50 81.50 85.50 66.00 83.50 87.50 569.00 86.50 90.50Wayne...................................... 55.00 74.50 83.00 57.00 78.50 86.00 59.00 81.50 89.00 62.00 84.50 92.00White Plains ........................... 56.50 76.00 84.00 58.50 79.00 87.00 60.50 82.00 90.00 64.50 2 85.00 293.00
Digitized for FRASER http://fraser.stlouisfed.org/ Federal Reserve Bank of St. Louis

City
January 1966 January 1967
Minimum Maximum Minimum Maximum
Group 3 1 Group 4 1 Group 3 1 Group 4 1
Atlanta ........................................... $65.00 $85.00 $ 89.00 $73.50 $ 90.50 $ 94.50Baltimore......................................... 62.50 - 91.00 66.00 - 96.50Birmingham.................................... 60.00 85.00 89.00 63.50 90.50 94.50B oston............................................. 62.00 - 91.50 65.50 - 97.00Buffalo ........................................... 65.00 - 691.00 68.50 98.50Charleston, W. Va........................... 61.50 - 91.00 65.00 96.50Charlotte........................................ 60.00 - 89.00 63.50 94.50Chattanooga .................................. 60.00 - 89.00 63.50 - 94.50Chicago........................................... 69.00 92.00 100.00 72.50 97.50 105.50Cincinnati ...................................... 69.00 89.50 93.50 72.50 95.00 99.00Cleveland........................................ 68.50 89.50 93.00 72.00 94.50 98.50Dallas............................................... 65.50 - 794.50 69.00 - 102.00Denver............................................. 64.00 - 91.50 67.50 97.00Des Moines .................................... 62.00 - 93.00 65.50 98.50Detroit............................................. 75.00 - 97.50 78.50 103.00D uluth............................................. 62.00 - 93.00 65.50 98.50El Paso............................................. 63.00 - 89.50 66.50 95.00Harrisburg...................................... 62.00 84.50 91.50 65.50 96.50Hartford ........................................ 62.50 - 91.50 66.00 - 97.00Houston........................................... 65.50 - 794.50 69.00 - 102.00Indianapolis.................................... 66.50 - 89.00 70.00 - 94.50Kansas C ity .................................... 65.50 786.50 794.50 69.00 94.00 102.00Knoxville........................................ 60.00 - 89.00 63.50 - 94.50Little Rock .................................... - - - - -Los A ngeles.................................... 80.50 101.50 84.00 - 107.00Louisville........................................ 60.00 . 89.00 63.50 - 94.50Memphis ........................................ 60.00 - 89.00 63.50 - 94.50Miami ............................................. 60.00 - 89.00 63.50 - 94.50Milwaukee...................................... 65.50 - 89.00 69.00 - 94.50Minneapolis.................................... 64.00 - 95.00 67.50 - 100.50Montgomery .................................. 59.00 - 84.00 62.50 - 89.50Nashville ........................................ 60.00 - 89.00 63.50 - 94.50New Orleans .................................. 60.00 - 89.00 68.50 - 94.50New York ...................................... 67.50 89.00 97.00 71.00 94.50 102.50Newark ........................................... 65.00 93.50 68.50 - 99.00Omaha............................................. 62.00 93.00 65.50 - 98.50Philadelphia.................................... 65.00 87.50 95.00 68.50 - 100.50Pittsburgh ...................................... 65.00 - 95.00 68.50 - 100.50Reading........................................... 62.00 - 91.00 65.50 - 96.50Richm ond...................................... 61.50 80.50 90.00 65.50 - 95.50Salt Lake C ity ................................ 64.00 - 90.00 67.50 - 95.50San Lrancisco ................................ 80.00 - 101.50 83.50 104.00 107.00Scranton ........................................ 62.00 - 91.00 65.50 - 96.50Seattle............................................. 71.50 - 97.00 75.00 - 102.50St. Louis ........................................ 66.00 88.50 96.50 69.50 94.00 102.00Washington, D.C.............................. 72.00 91.00 93.50 75.50 96.50 99.00Wayne, Pa......................................... 65.00 87.50 95.00 68.50 93.00 100.50White Plains, N.Y............................ 67.50 89.00 97.00 71.00 94.50 102.50
Digitized for FRASER http://fraser.stlouisfed.org/ Federal Reserve Bank of St. Louis

City
July 1968 July 1969
Minimum Maximum Minimum Maximum
Group 31 Group 4 1 Group 3 1 Group 4 1
Atlanta ........................................... $77.50 $100.00 $104.00 $81.00 $104.00 $108.00Baltimore......................................... 70.00 - 104.50 73.50 - 108.50Birmingham.................................... 68.00 - 104.00 71.50 - 108.00Boston............................................. 69.50 - 105.00 73.00 - 109.00Buffalo ........................................... 72.50 - 106.50 76.00 - 110.50Charleston, W. Va............................ 69.00 - 104.50 72.50 — 108.50Charlotte......................................... 68.00 - .102.50 71.50 — 106.50Chattanooga .................................. 68.00 - 102.50 71.50 - 106.50Chicago........................................... 82.00 105.50 114.00 85.50 109.50 118.00Cincinnati ...................................... 76.50 103.00 107.00 80.00 107.00 111.00Cleveland......................................... 76.00 102.50 106.50 79.50 106.50 110.50Dallas............................................... 73.00 - 110.00 76.50 - 114.00Denver............................................. 71.50 - 106.00 75.00 - 110.00Des Moines .................................... 69.50 - 106.50 73.00 — 110.50Detroit............................................. 82.50 - 111.00 86.00 - 115.00D uluth............................................. 69.50 - 106.50 73.00 — 110.50El Paso............................................. 71.50 - 105.00 75.00 — 109.00Harrisburg...................................... 72.50 - 108.50 76.00 - 112.50Hartford ......................................... 70.00 - 105.00 73.50 — 109.00Houston........................................... 73.00 - 110.00 76.50 — 114.00Indianapolis.................................... 74.00 - 102.50 77.50 - 106.50Kansas C ity .................................... 73.00 102.00 110.00 76.50 106.00 114.00Knoxville......................................... 68.00 - 102.50 71.50 — 106.50Little R o c k .................................... - - — — — —Los Angeles.................................... 88.00 - 115.00 91.50 - 119.00Louisville......................................... 68.00 - 102.50 71.50 - 106.50Memphis ......................................... 68.00 98.50 102.50 71.50 102.50 106.50Miami ............................................. 68.00 - 104.00 71.50 - 108.00Milwaukee...................................... 73.50 - 103.00 77.00 - 107.00Minneapolis.................................... 71.50 - 108.50 75.00 - 112.50Montgomery .................................. 68.00 - 97.50 71.50 - 101.50Nashville ......................................... 68.00 - 102.50 71.50 - 106.50New Orleans .................................. 72.50 - 104.00 76.00 — 108.00New Y ork ...................................... 8 75.00 102.50 110.50 79.50 106.50 114.50N ew ark ........................................... 72.50 - 107.00 76.00 - 111.00Omaha............................................. 69.50 - 106.50 73.00 — 110.50Philadelphia.................................... 72.50 - 108.50 76.00 - 112.50Pittsburgh ...................................... 72.50 - 108.50 76.00 - 112.50Reading........................................... 69.50 - 104.50 73.00 - 108.50R ichm ond...................................... 69.00 - 103.50 72.50 - 107.50Salt Lake C ity ................................ 71.50 - 105.00 75.00 - 109.00San Francisco ................................ 87.50 112.00 115.00 91.00 116.00 119.00Scranton ......................................... 69.50 - 104.50 73.00 — 108.50Seattle............................................. 79.00 - 110.50 82.50 - 114.50St. Louis ......................................... 73.50 102.00 110.00 77.00 106.00 114.00Washington, D.C.............................. 79.50 105.00 107.50 83.00 109.00 111.50Wayne, Pa......................................... 72.50 101.00 108.50 76.00 105.00 112.50White Plains, N.Y............................ 875.00 102.50 110.50 79.50 106.50 114.50
Digitized for FRASER http://fraser.stlouisfed.org/ Federal Reserve Bank of St. Louis

City
May 20, 1970 July 16, 1970
Minimum Maximum Minimum Maximum
Group 31 Group 4 1 Group 31 Group 4 1 Group 31 Group 4 1 Group 31 Group 4 1
Atlanta ........................................... $85.00 $ 86.00 $104.00 $108.00 $ 88.50 $ 89.50 $108.00 $112.00Baltimore......................................... - 980.50 - 108.50 - 84.50 - 112.50Birmingham.................................... - 78.00 - 108.00 - 81.50 - 112.00B oston............................................. - 81.00 - 109.00 - 84.50 - 113.00Buffalo ........................................... - 95.50 - 10114.50 - 99.00 - 114.50Charleston, W. Va........................... - 79.50 - 108.50 - 83.00 - 112.50Charlotte......................................... - 78.00 - 106.50 - 81.50 - 110.50Chattanooga .................................. - 78.00 - 106.50 - 81.50 - 110.50Chicago........................................... 93.50 98.00 109.50 118.00 97.00 101.50 113.50 122.00Cincinnati ...................................... 985.00 1186.50 107.00 111.00 89.00 91.00 111.00 115.00Cleveland......................................... - 86.50 - 110.50 - 90.00 - 114.50Dallas............................................... - 84.50 - 114.00 - 88.00 - 118.00Denver............................................. - 1281.50 - 110.00 - 85.50 - 114.00Des Moines .................................... - 85.50 - 110.50 - 89.00 - 114.50Detroit............................................. - 92.00 - 115.00 - 95.50 - 119.00D uluth............................................. - 85.50 - 110.50 - 89.00 - 114.50El Paso............................................. - 12 81.00 - 109.00 - 85.00 - 113.00Harrisburg...................................... - 91.00 - 112.50 - 94.50 - 116.50Hartford ......................................... - 80.50 - 109.00 - 84.00 - 113.00Houston........................................... - 84.50 - 106.50 - 88.00 - 118.00Indianapolis.................................... - 83.00 - 106.50 - 86.50 - 110.50Kansas C ity .................................... 82.50 84.50 111.50 114.00 86.00 88.00 115.50 118.00Knoxville......................................... - 78.00 - 106.50 - 81.50 - 110.50Little R o c k .................................... - - - - - - - -Los Angeles.................................... - 99.00 - 120.50 - 102.50 - 124.50Louisville......................................... - 78.00 - 106.50 - 81.50 - 110.50Memphis ......................................... 77.50 78.00 102.50 106.50 81.00 81.50 106.50 110.50Miami ............................................. - 78.00 - 108.00 - 81.50 - 112.00Milwaukee...................................... - 83.00 - 107.00 - 86.50 - 111.00Minneapolis.................................... - 87.50 - 112.50 - 91.00 - 116.50Montgomery .................................. - 76.50 - 101.50 - 80.00 - 105.50Nashville ...................................... .. - 78.00 - 106.50 - 81.50 - 110.50New Orleans .................................. - 82.00 - 108.00 - 85.50 - 112.00New York ....................................... 94.50 103.50 lo 118.50 10118.50 98.00 107.00 118.50 118.50N ew ark........................................... - 82.50 - 111.00 - 86.00 - 115.00Omaha............................................. - 85.50 - 110.50 - 89.00 - 114.50Philadelphia.................................... - 91.00 - 112.50 - 94.50 - 116.50Pittsburgh ...................................... - 91.00 - 112.50 - 94.50 - 116.50Reading........................................... - 88.00 - 108.50 - 91.50 - 112.50R ichm ond...................................... - 80.00 - 107.50 - 83.50 - 111.50Salt Lake C ity ................................ - 1281.00 - 109.00 - 85.00 - 113.00San Francisco ................................ 95.50 99.00 116.00 120.50 110.00 102.50 120.00 124.50Scranton ......................................... - 88.00 - 108.50 - 91.50 - 112.50Seattle............................................. - 91.00 - 114.50 - 94.50 - 118.50St. Louis ......................................... - 84.50 - 114.00 - 88.00 - 118.00Washington, D.C.............................. 87.50 88.00 109.00 111.50 91.00 91.50 113.00 115.50Wayne, Pa......................................... 85.00 91.00 105.00 112.50 88.50 94.50 109.00 116.50White Plains, N.Y............................ 94.50 103.50 10118.50 lo 118.50 98.00 107.00 118.50 118.50
1 Each clerical group is com posed o l a number o f occupations requiring approxim ately the same skill or degree o f responsibility. Group 3 had 4 occupations up to Jan. 16, 1967, and 3 thereafter, am ong which were file clerks and typists. Group 4 had 16 occupations up to Nov. 10, 1963, 15 up to Jan.
16, 1967 , and 13 thereafter, among which were junior draftsmen, records clerks, stenographers, and traffic clerks.
2 Rate increased an additional $1 effective Feb. 27, 1965.
3 Rate increased an additional $0 .50 effective Feb. 9 ,1 9 6 4 .
Digitized for FRASER http://fraser.stlouisfed.org/ Federal Reserve Bank of St. Louis

4 Rate increased an additional $2 effective Feb. 9, 1964.
5 Rate increased an additional $1 effective Feb. 28, 1965.
6 Rate increased an additional $2 effective Mar. 30, 1966.
7 Rate increased an additional $2 effective Feb. 6, 1966.
8 Rate increased an additional $1 for Group 3 employees and $5 for Group 4 employees effective July 29- 1968.
9 Rate increased an additional $0.50 effective May 31, 1970.
10 Effective April 1, 1970.11 Rate increased an additional $1 effective May 31, 1970.12 Rate increased an additional $0.50 effective May 24,
1970.
NOTE: Dashes indicate no employees in group.
Digitized for FRASER http://fraser.stlouisfed.org/ Federal Reserve Bank of St. Louis

State and n t y 3July 17, 1971 July 16, 1972
Group 4 Group 5 Group 4 Group 5Minimum Maximum Minimum Maximum Minimum Maximum Minimum Maximum
Alabama— Birmingham ........... $ 88.00 $130.50 $ 92.00 $139.50 $ 89.50 $135.50 $ 93.50 $144.50Jasper...................... 85.50 122.00 489.50 4130.50 86.50 127.00 90.50 135.50
Arizona— Phoenix .................. 94.50 133.50 98.50 141.00 96.00 138.50 100.00 146.00Holbrook ................ 90.00 129.50 494.00 4 136.00 91.50 134.50 95.50 141.00
Arkansas— Newcastle................ 85.00 125.00 489.00 4 130.50 86.50 130.00 90.50 135.50California— Oakland .................. 112.50 143.00 116.50 149.50 115.00 148.00 119.00 154.50
San Luis Obispo Jet. 102.50 136.50 4 106.50 4 144.00 105.00 141.50 109.00 149.00Colorado— Denver .................... 94.50 133.50 98.50 141.00 96.00 138.50 100.00 146.00
Lamar....................... 88.00 126.00 492.00 4 134.00 89.50 131.00 93.50 139.00Connecticut— Hartford.................. 95.00 134.00 99.00 144.50 97.00 139.00 101.00 149.50
New H aven.............. 94.00 134.00 98.00 144.50 96.00 139.00 100.00 149.50Delaware— Wilmington.............. — — 105.00 145.50 — — 107.00 150.50District of Columbia.................................. 100.00 134.00 104.00 144.50 102.00 139.00 106.00 149.50Florida— M iam i....................... 88.50 130.50 92.50 139.50 90.00 135.50 94.00 144.50
Vero Beach.............. 85.50 122.00 489.50 4 130.50 86.50 127.00 90.50 135.50Georgia— A tlanta.................... 93.50 130.50 97.50 139.50 95.00 135.50 99.00 144.50
Monticello .............. 85.00 119.50 489.00 4 128.00 86.00 124.50 90.00 133.00Idaho— Pocatello.................. 90.00 129.50 494.00 4 136.00 91.50 134.50 95.50 141.00Illinois— Chicago.................... 108.00 141.50 112.00 151.50 109.50 146.50 113.50 156.50
Vandalia.................. 99.00 133.00 4 103.00 4 143.50 100.50 138.00 104.50 148.50Indiana— Indianapolis........... 93.00 130.00 97.50 141.00 94.50 135.00 99.00 146.00
Terre Haute ........... 91.00 128.00 495.50 4 139.00 92.50 133.00 97.00 144.00Iowa— Des M oines.............. 97.50 136.50 101.50 144.00 99.50 141.50 103.50 149.00
Red O ak .................. 86.00 125.00 490.00 4 132.00 88.00 130.00 92.00 137.00Kansas— Topeka .................... 91.50 135.00 95.50 141.00 93.00 140.00 97.00 146.00
Dodge C ity .............. 85.00 125.00 489.00 4 130.50 86.50 130.00 90.50 135.50Kentucky— Louisville ................ 88.00 130.50 92.00 139.50 89.50 135.50 93.50 144.50
Williamstown......... 99.50 133.50 4 103.50 4 140.00 102.00 138.50 106.00 145.00Louisiana— New Orleans........... 88.00 130.50 92.00 139.50 89.50 135.50 93.50 144.50
Bogalusa.................. ^85.50 122.00 489.50 4130.50 86.50 127.00 90.50 135.50Maine— Dover-Foxcroft . . . . 588.50 6 121.00 493.00 4 133.00 91.50 129.00 95.50 138.00Maryland— Silver Spring........... 100.00 134.00 4 104.00 4 144.50 102.00 139.00 106.00 149.50
Baltimore................ 93.00 131.00 97.50 141.00 95.00 136.00 99.50 146.00Fairlee .................... 85.00 121.00 — — 87.00 126.00 _ _
Massachusetts— Boston .................... 595.50 7131.50 100.00 141.50 98.50 139.00 102.50 148.50High Rock .............. 888.50 9 121.00 496.50 4 139.50 95.50 135.00 99.00 144.50
Michigan— D etro it.................... 102.50 137.50 106.50 145.50 104.50 142.50 108.50 150.50Kalamazoo.............. 98.50 134.00 4 101.50 4142.50 100.50 139.00 103.50 147.50
Minnesota— Minneapolis ........... 99.50 139.50 103.50 146.50 101.50 144.50 105.50 151.50Duluth .................... 97.50 136.50 4 101.50 4 144.00 99.50 141.50 103.50 149.00
Mississippi— Jackson .................... 87.50 129.00 91.50 138.00 88.50 134.00 92.50 143.00Pickens.................... 85.50 118.50 489.50 4 126.00 86.50 123.50 90.50 131.00
Missouri— St. Louis.................. 94.00 138.00 99.00 146.50 95.50 143.00 100.50 151.50D over....................... 85.00 125.00 489.00 4 130.50 86.50 130.00 90.50 135.50
Nebraska- Omaha .................... 97.50 136.50 101.50 144.00 99.50 141.50 103.50 149.00Lyons ....................... 86.00 125.00 490.00 4 132.00 88.00 130.00 92.00 137.00
New Jersey— Newark.................... 99.50 135.00 103.50 145.00 101.50 140.00 105.50 150.00New York— New Y ork ................ 115.00 137.00 119.00 148.00 118.00 142.00 122.00 153.00
B uffalo.................... 105.00 133.00 109.00 145.00 108.00 138.00 112.00 150.00Elizabethtown . . . . 104.00 128.00 4 108.00 4 139.50 107.00 133.00 1 1 1 . 0 0 144.50
New Mexico- Albuquerque........... 93.00 132.50 97.00 140.00 94.50 137.50 98.50 145.00Socorro.................... 88.00 126.00 492.00 4 134.00 89.5C 131.00 93.50 139.00
North Carolina- Charlotte ................ 87.50 129.00 91.50 138.00 88.50 134.00 92.50 143.00Stanfield.................. 85.50 122.00 489.50 4 130.50 86.50 127.00 90.50 135.50
North Dakota— Bismark Jet............... 92.00 133.00 496.00 4 1<0.50 94.00 138.00 98.00 145.50Ohio - Cleveland ................ 98.00 135.00 102.00 145.50 100.50 140.00 104.50 150.50
Cambridge .............. 90.00 121.50 494.00 4 131.50 92.50 126.50 96.50 136.50Oklahoma— Oklahoma City . . . . 94.00 138.00 99.00 146.50 95.50 143.00 100.50 151.50
Mounds.................... 88.00 128.50 492.00 4 134.00 89.50 133.50 93.50 139.00Pennsylvania— Philadelphia........... 101.00 136.50 105.00 145.50 103.00 141.50 107.00 150.50
Scranton.................. 98.00 131.50 4 102.00 4 140.00 100.00 136.50 104.00 145.00Rhode Island— Providence.............. 1092.00 11126.50 1296.00 13136.50 95.50 135.00 99.00 144.50
Green H ill................ 888.50 9 121.00 496.50 4 139.50 95.50 135.00 99.00 144.50South Carolina- Greenville................ 87.50 129.00 491.50 4 138.00 88.50 134.00 92.50 143.00South Dakota— Sioux F a lls .............. 92.00 133.00 496.00 4 140.50 94.00 138.00 98.00 145.50Tennessee— Memphis.................. 88.00 130.50 92.00 139.50 89.50 135.50 93.50 144.50
Nashville.................. 87.50 129.00 91.50 138.00 88.50 134.00 92.50 143.00Texas— H ouston .................. 94.00 138.00 99.00 146.50 95.50 143.00 100.50 151.50
Sweetwater.............. 88.00 128.50 492.00 4 134.00 89.50 133.50 93.50 139.00Utah- Salt Lake C ity......... 94.50 133.50 98.50 141.00 96.00 138.50 100.00 146.00
Delta......................... 90.00 129.50 494.00 4 136.00 91.50 134.50 95.50 141.00Virginia— Dranesville .............. 100.00 134.00 104.00 144.50 102.00 139.00 106.00 149.50
Richmond................ 89.50 130.00 93.50 138.50 91.50 135.00 95.50 143.50McKenney .............. 84.00 122.00 — — 86.00 127.00 _ _
West Virginia— Charleston .............. 90.50 131.00 95.00 141.00 92.50 136.00 97.00 146.00Etam......................... 83.50 120.50 488.00 4 129.50 85.50 125.50 90.00 134.50
Washington— Seattle .................... 101.50 139.00 105.50 146.50 103.50 144.00 107.50 151.50R enton.................... 100.50 137.00 104.50 145.00 102.50 142.00 106.50 150.00
Wisconsin— Milwaukee .............. 93.00 129.50 97.00 139.50 94.50 134.50 98.50 144.50Stevens Pt................. 85.50 119.50 489.50 4 128.50 87.00 124.50 91.00 133.50
Wyoming— Laramie .................. 90.00 129.50 494.00 4 136.00 91.50 134.50 95.50 141.00
Digitized for FRASER http://fraser.stlouisfed.org/ Federal Reserve Bank of St. Louis

1 9Table 11. Weekly salary rates for clerical employees, selected groups and cities, 1971-73—Continued
July 15, 1973State and city3 Group 4 Group 5
Minimum Maximum Minimum MaximumAlabama— Birmingham.............................................................................................. $ 90.50 $141.00 $ 95.00 $150.00
Jasper.......................................................................................................... 87.50 132.50 91.50 141.00Arizona— P hoenix ................................................................................................... . 97.50 144.00 101.50 151.50
Holbrook................................................................................................... 93.00 140.00 97.00 146.50Arkansas— Newcastle................................................................................................... 88.00 135.50 92.00 141.00California— Oakland..................................................................................................... 117.50 153.50 121.50 159.50
San Luis Obispo Jet................................................................................... 107.50 147.00 111.50 154.50Colorado — Denver........................................................................................................ 97.50 144.00 101.50 151.50
Lamar ....................................................................................................... 91.00 136.50 95.00 145.00Connecticut — Hartford..................................................................................................... 99.00 144.50 103.00 155.00
New Haven................................................................................................. 98.00 144.50 102.00 155.00Delaware— Wilmington .............................................................................................. — 109.00 i c a noDistrict of Columbia ................................................................................................................... 104.00 144.50 108.00 155.00Florida— Miami.......................................................................................................... 91.00 141.00 95.00 150.00
Vero Beach .............................................................................................. 87.50 132.50 91.50 14L00Georgia — Atlanta....................................................................................................... 96.50 141.00 100.50 150.00
M onticello................................................................................................. 87.00 130.00 91.00 138.50Idaho — Pocatello ................................................................................................... 93.00 140.00 97.00 146.50Illinois — Chicago ..................................................................................................... 111.00 152.00 115.00 162.00
Vandalia..................................................................................................... 102.00 143.50 106.00 154.00Indiana— Indianapolis.............................................................................................. 96.00 140.50 100.50 151.50
Terre H aute.............................................................................................. 94.00 138.50 98.50 149.50Iowa— Des Moines................................................................................................. 101.50 147.00 105.50 155.00
Red Oak ..................................................................................................... 90.00 135.50 94.00 143.00Kansas— Topeka ....................................................................................................... 94.50 145.50 98.50 151.50
Dodge C ity ................................................................................................. 88.00 135.50 92.00 141.00Kentucky — Louisville................................................................................................... 90.50 141.00 95.00 150.00
William st o w n ............................................................................................ 104.50 144.00 108.50 150.50Louisiana— New Orleans.............................................................................................. 90.50 141.00 95.00 150.00
Bogalusa..................................................................................................... 87.50 132.50 91.50 141.00Maine— Dover-Foxcroft ........................................................................................ 94.00 134.50 98.00 143.50Maryland— Silver Spring.............................................................................................. 104.00 144.50 108.00 155.00
Baltimore................................................................................................... 97.00 141.50 101.50 151.50Fairlee....................................................................................................... 89.00 131.50 —
Massachusetts— B oston........................................................................................................ 101.00 144.50 1 05.00 154.00High R o c k ................................................................................................. 98.00 140.50 101.50 150.00
Michigan— D etroit....................................................................................................... 106.50 148.00 110.50 156.00Kalamazoo................................................................................................. 102.50 144.50 105.50 153.00
Minnesota— Minneapolis.............................................................................................. 103.50 150.00 107.50 157.50D uluth....................................................................................................... 101.50 147.00 105.50 155.00
Mississippi— Jackson ..................................................................................................... 89.50 139.50 93.50 148.50Pickens....................................................................................................... 87.50 129.00 91.50 136.50
Missouri— St. Louis ................................................................................................... 97.00 148.50 102.00 157.00Dover.......................................................................................................... 88.00 135.50 92.00 141.00
Nebraska- Omaha....................................................................................................... 101.50 147.00 105.50 155.00Lyons.......................................................................................................... 90.00 135.50 94.00 143.00
New Jersey- Newark ..................................................................................................... 103.50 145.50 107.50 155.50New York — New York ................................................................................................. 121.00 147.50 125.00 158.50
Buffalo....................................................................................................... 111.00 143.50 115.00 155.50Elizabethtown.......................................................................................... 110.00 138.50 114.00 150.00
New Mexico- Albuquerque ............................................................................................ 96.00 143.00 100.00 150.50Socorro ..................................................................................................... 91.00 136.50 95.00 145.00
North Carolina- Charlotte................................................................................................... 89.50 139.50 93.50 148.50Stanfield ................................................................................................... 87.50 132.50 91.50 141.00
North Dakota— Bismark Jet................................................................................................. 96.00 143.50 100.00 151.50Ohio — Cleveland................................................................................................... 103.50 145.50 107.50 156.00
Cambridge................................................................................................. 95.50 132.00 99.50 142.00Oklahoma— Oklahoma C ity.......................................................................................... 97.00 148.50 102.00 157.00
Mounds ..................................................................................................... 91.00 139.00 95.00 144.50Pennsylvania— Philadelphia.............................................................................................. 105.00 147.00 109.00 156.00
Scranton ................................................................................................... 102.00 142.00 106.00 150.50Rhode Inland- Providence................................................................................................. 98.00 140.50 101.50 150.00
Green Hill ................................................................................................. 98.00 140.50 101.50 150.00South Carolina- Greenville................................................................................................... 89.50 139.50 93.50 148.50South Dakota — Sioux Falls................................................................................................. 96.00 143.50 100.00 151.50Tennessee — Memphis ................................................................................................... 90.50 141.00 95.00 150.00
Nashville ................................................................................................... 89.50 139.50 93.50 148.50Texas— Houston..................................................................................................... 97.00 148.50 102.00 157.00
Sweetwater .............................................................................................. 91.00 139.00 95.00 144.50Utah- Salt Lake City .......................................................................................... 97.50 144.00 101.50 151.50
Delta .......................................................................................................... 93.00 140.00 97.00 146.50Virginia— Dranesville................................................................................................. 104.00 144.50 108.00 155.00
Richmond ................................................................................................. 93.50 140.50 97.50 149.00McKenney ................................................................................................. 88.00 132.50 — —
West Virginia— Charleston................................................................................................. 94.50 141.50 99.00 151.50Etam .......................................................................................................... 87.50 131.00 92.00 140.00
Washington— S eattle ....................................................................................................... 105.50 149.50 109.50 157.00Renton....................................................................................................... 104.50 147.50 108.50 155.50
Wisconsin— Milwaukee..................................................................................... .. 96.00 140.00 100.00 150.00Stevens Pt.................................................................................................... 88.50 130.00 92.50 139.00
Wyoming— Laramie..................................................................................................... 93.00 140.00 97.00 146.50
Digitized for FRASER http://fraser.stlouisfed.org/ Federal Reserve Bank of St. Louis

1 Rates do not include “special” or “special city” allowances (see table 12) or cost-of-living allowances in effect in 1972 and 1973.2 Because of the declining number of cities represented in Group 3, Group 5 has been substituted in this table beginning with July
17, 1971. Each clerical group is composed of a number of occupations requiring approximately the same skill or degree of responsibility. Group 4 had 13 occupations among which were junior draftsmen, stenographers, traffic clerks, and records clerks; group 5 had 16 occupations among which were clerical draftsmen, clerical stenographers, engineering data clerks, and senior file clerks.
3 Cities and towns in this table were selected from those in the lowest and highest pay categories in each State. In addition, some cities in intermediate categories were included because they are among the principal cities in the State. Listings showing one city are for States having a single wage rate.
4 Effective May 4 ,1972, which was the initial authorization date for title group 5 in these cities.5 Rate increased an additional $0.50 effective Aug. 1,1971.6 Rate increased an additional $3 effective Aug. 1,1971.7 Rate increased an additional $2.50 effective Aug. 1,1971.8 Rate increased an additional $4.50 effective Aug. 1,1971.9 Rate increased an additional $9 effective Aug. 1,1971.
10 Rate increased an additional $1 effective Aug. 1,1971.11 Rate increased an additional $3.50 effective Aug. 1, 1971.12 Rate increased an additional $0.50 effective May 4,1972.13 Rate increased an additional $3 effective May 4,1972.
NOTE: Dashes indicate no employees in group.
Digitized for FRASER http://fraser.stlouisfed.org/ Federal Reserve Bank of St. Louis

Special allowances2 Special city allowances3
City Weekly amount CityDaily
allowance
Buckingham, Va....................................................... $ 6.00 Atlanta, Ga............................................................... $1.00Crossville, Ala........................................................... 2.00 Baltimore, Md........................................................... 1.40Dover, Mo................................................................. 1.50 Birmingham, Ala...................................................... 1.00Etam, W. Va..................................... ........................ 5.00 Boston, Mass............................................................. 1.40Fontenelle, Wyo....................................................... 10.00 Chicago, 111................................................................ 1.40Hagerstown, Md....................................................... 5.00 Cleveland, O h io ...................................................... 1.40Jamesburg, Calif....................................................... 12.00 Denver, Colo............................................................. 1.00Lamar, Colo. #2 .................................................... 1.00 Detroit, Mich............................................................ 1.40Leesburg, Va. # 5 .................................................... 3.00 Houston, Tex............................................................ 1.00Lyons, Neb................................................................ 3.50 Indianapolis, Ind...................................................... 1.00Monrovia, Md........................................................... 1.50 Miami, Fla................................................................. 1.00Mounds, Okla........................................................... 4.00 Milwaukee, Wis......................................................... 1.00Muddy Gap, Wyo..................................................... 15.00 Minneapolis, Minn.................................................... 1.00Newcastle, Ark......................................................... 4.00 Newark, N.J.............................................................. 1.40Orrville, Ala.............................................................. 2.50 New Orleans, La....................................................... 1.00Pickens, Miss............................................................. 3.00 New York, N.Y........................................................ 1.80Point Reyes, C alif................................................... 8.00 Oakland, Calif........................................................... 1.40Prospect Valley, Colo.............................................. 14.00 Philadelphia, Pa........................................................ 1.40Red Oak, Iow a........................................................ 3.50 Phoenix, Ariz............................................................ 1.00Stanfield, N.C........................................................... 2.50 Pittsburgh, Pa............................................................ 1.40
St. Louis, Mo............................................................ 1.00Seattle, Wash............................................................ 1.40Washington, D.C....................................................... 1.40
1 These allowances, although not necessarily established for the first tim e in July 1971, were in effec t for the duration o f the July 1971-July 1974 agreement. A llowances in som e cities have been in effec t since January 11, 1965.
^ “Special” a llow ances-w eek ly add-on paym ents ranging from $1 to $15 , effective July 17, 1971, made to em ployees at designated localities.
“Special c ity ” a llow ances-daily add-on paym ents ranging from $1 to $1 .80 , effective August 15, 1971, to em ployees whose assigned reporting location on a particular day was within the central area o f one o f the designated cities.
Digitized for FRASER http://fraser.stlouisfed.org/ Federal Reserve Bank of St. Louis

Effective date and number of years’ service required to reach maximum rates
December1940
October1942 19432 19442 January
1945February
1946July1950
Boston ...................................................................................... 13 12 _ _ 9 8 6 V 2
B uffalo...................................................................................... 13 12 - 8 - - 6 V 2
Chicago...................................................................................... 13 12 9 - - 8 6 V 2
Cincinnati................................................................................. 13 12 - 10 - 8 6 V 2
Cleveland ................................................................................. 10 - - 8 - - 6 V 2
D etro it...................................................................................... 13 12 9 8 - - 6 V 2
Kansas C ity............................................................................... 12 - - 10 - 8 6 V 2
Louisville ................................................................................. 11 - - 9 - 8 6 V 2
Memphis................................................................................... 11 - - 9 - 8 6 V 2
Minneapolis ............................................................................. 313 12 - - 48 - 6 V 2
New Y ork ................................................................................. 13 12 - 8 - - 6 V 2
Philadelphia............................................................................. 13 12 10 - 9 8 6 V 2
Pittsburgh................................................................................. 13 12 10 - 9 8 6 V 2
St. Louis................................................................................... 13 12 — 10 - 8 6 V 2
1 Other groups followed the same general pattern as operators.2 Various months during the year indicated.3 Effective March 1941.4 Effective Mar. 2, 1945, the wage schedule was reduced to 10 years and effective Mar. 16, it was reduced to 8 years.
Digitized for FRASER http://fraser.stlouisfed.org/ Federal Reserve Bank of St. Louis

Effective date Provision Applications, exceptions, and other related matters
Overtime pay
Oct. 20, 1940 Traffic, Group A: Time and one-half for work-
(1) In excess of a normal tour or a basic workweek.(2) In excess of scheduled half tour.(3) On nonscheduled days.(4) On second assigned tour if interval between tours was less than 10 hours.
Applicable evening and night differentials included in computing overtime rate after 40 hours.
Plant central office, Group A: Time and one-half for work-
(1) On a scheduled day outside of scheduled or shifted normal tour or half tour.(2) On a nonscheduled day.(3) On a second scheduled tour if interval since previous scheduled or shifted tour was less than 8 hours.(4) On a scheduled tour if required to work 16 continuous hours immediately preceding start of tour.
Overtime rate included night differentials.
Outside maintenance and gang— Group A: Time and one-half for work-
(1) In excess of 8 hours on a scheduled day.(2) On a nonscheduled day.
Group B: If work time was 40 hours or less in a calendar week, compensatory time off or straight-time pay for work—
(1) In excess of assigned tour.(2) In excess of a basic workweek.(3) On a nonscheduled day.
Time and one-half for hours in excess of 40 in a calendar week.
May 9,1947 Changed: Plant central office, Group A — Time and one-half paid for time worked on a second scheduled tour if interval since previous scheduled or shifted tour was less than 10 hours.
Digitized for FRASER http://fraser.stlouisfed.org/ Federal Reserve Bank of St. Louis
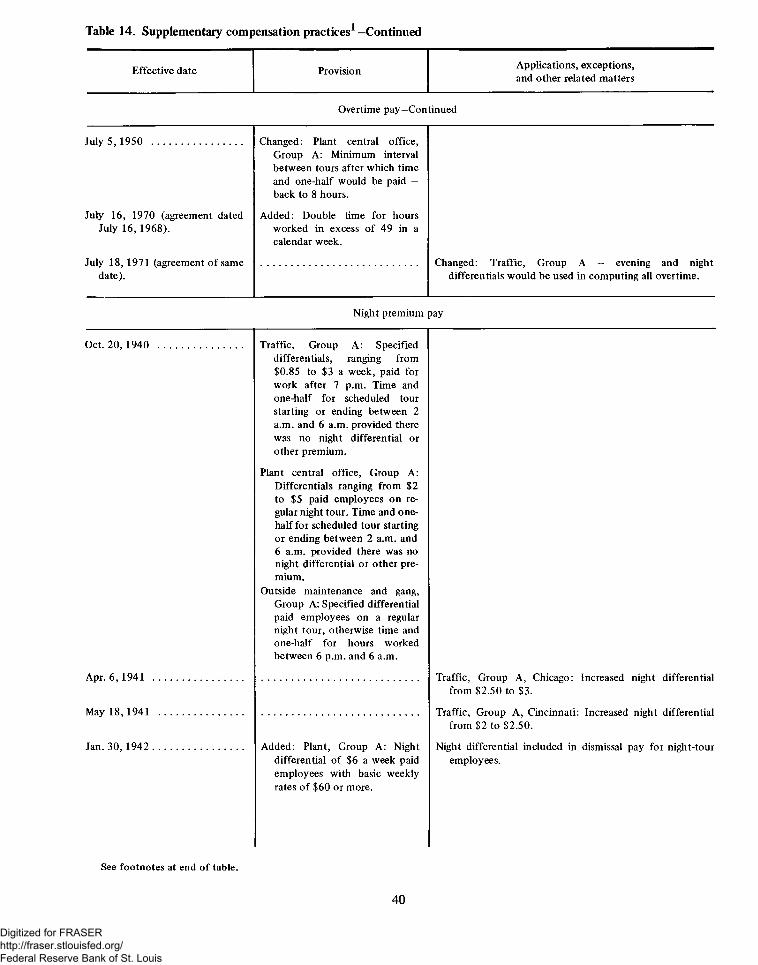
Effective date Provision Applications, exceptions, and other related matters
Overtime pay-Continued
July 5,1950 .................................. Changed: Plant central office, Group A: Minimum interval between tours after which time and one-half would be paid - back to 8 hours.
July 16, 1970 (agreement dated July 16,1968).
July 18,1971 (agreement of same date).
Added: Double time for hours worked in excess of 49 in a calendar week.
Changed: Traffic, Group A - evening and night differentials would be used in computing all overtime.
Night premium pay
Oct. 20,1940 Traffic, Group A: Specifieddifferentials, ranging from $0.85 to $3 a week, paid for work after 7 p.m. Time and one-half for scheduled tour starting or ending between 2 a.m. and 6 a.m. provided there was no night differential or other premium.
Plant central office, Group A: Differentials ranging from $2 to $5 paid employees on regular night tour. Time and one- half for scheduled tour starting or ending between 2 a.m. and 6 a.m. provided there was no night differential or other premium.
Outside maintenance and gang, Group A: Specified differential paid employees on a regular night tour, otherwise time and one-half for hours worked between 6 p.m. and 6 a.m.
Apr. 6,1941 Traffic, Group A, Chicago: Increased night differential from $2.50 to $3.
May 18,1941
Jan. 30, 1942
Traffic, Group A, Cincinnati: Increased night differential from $2 to $2.50.
Added: Plant, Group A: Night differential of $6 a week paid employees with basic weekly rates of $60 or more.
Night differential included in dismissal pay for night-tour employees.
Digitized for FRASER http://fraser.stlouisfed.org/ Federal Reserve Bank of St. Louis

Effective date Provision Applications, exceptions, and other related matters
Night premium pay—Continued
Dec. 5, 1943 .................................... Added: Traffic, Group A: Night differential of $3 a week for7- hour tours, $4 a week for8- hour tours.
$3 for 8-hour tour at Philadelphia which included additional 60-minute paid relief.
Jan. 1,1946 .................................... Added: Plant, Group A: Night differential of $7 a week paid employees with basic weekly rates of $70 or more.
Apr. 7, 1946 .................................. Changed: Traffic: Uniform evening and night differentials established, ranging from $2 to $4 a week, depending on tour worked.
June 2,1948 .................................. Added: Plant, Group A: Night differential of $8 a week paid employees with basic weekly rates of $80 or more.
July 5, 1950 .................................... Added: Traffic, Group B: Evening and night differential for Traffic Control Bureau clerical employees.
Added: Plant, Group B: Night differential for cleaners at New York City and cleaners and janitors at Philadelphia.
June 27,1951 ................................ Added: Plant: Night differential of $9 a week paid eligible employees with basic weekly rates of $90 or more.
July 5 ,1952 .................................. Increased: Traffic, Group A: At Detroit, night differential to $5 a week.
Sept. 2, 1953 (agreement of same date).
Added: Plant central office craftsmen: Differential of $10 a week paid eligible employees with basic weekly rates of $100 or more.
Changed: Traffic, Group A, Cleveland and Detroit—night tour reduced from 8 to 7 hours without change in differential.
Dec. 5, 1956 (agreement dated Dec. 19,1956).
Added: Plant central office craftsmen: Differential of $11 a week paid employees with basic weekly rates of $115 or more.
Oct. 10, 1960 (agreement dated Nov. 9,1960).
Added: Plant central office craftsmen: Differential of $12 a week paid employees with basic weekly rate of $130 or more.
Added: Traffic, Group A: Boston—$3.50 for 7-hour night tour; New York and White Plains-$4 for 7-hour night tour; Chicago-$4.50 for 8-hour night tour; Cincinnati, Pittsburgh, and Wayne-$5 for 8-hour night tour.
Jan. 16, 1967 (agreement of same date).
Added: Plant central office craftsmen: Differential of $13 paid employees with basic weekly rate of $145 or more.
Changed: Traffic, Group A: Cleveland and Philadelphia- differential to be computed as in most areas.
Digitized for FRASER http://fraser.stlouisfed.org/ Federal Reserve Bank of St. Louis

Effective date Provision Applications, exceptions, and other related matters
Night premium pay-Continued
July 16,1968 (agreement of same date).
Increased: Traffic, Group A: Pittsburgh-differential of $5 for an 8-hour tour.
Changed: Traffic, Group A: Boston, Chicago, Cincinnati, Detroit, and Wayne-differential to be computed as in most areas.
July 16, 1969 (agreement of above date).
Increased: Plant central office craftsmen: Differential to 10 percent of employee’s basic weekly wage rate.
July 18,1971 (agreement of same date).
Changed: Plant Group B cleaners and building attendants would receive an evening or night differential provided their schedules entitled them to it.
Changed: Traffic, Group A: Pittsburgh-night tour reduced from 8 to V/i hours without change in differential.
Premium pay for Sunday work
Oct. 20,1940 ................................ Group A: One-half time extra for scheduled Sunday work. Time and one-half for nonscheduled Sunday work. No premium pay for Saturday as such.
Traffic, Group A: In New York and Chicago, straight-time extra paid for scheduled Sundays worked at the request of management if a previous Suday has been worked in same calendar month.
July 16,1968 (agreement of same date).
Group B: No premium pay for Saturday or Sunday as such.
Eliminated: Traffic, Group A: Chicago-straight-time extra for work on a second or subsequent Sunday.
Holiday pay
Oct. 20,1940 ................................ 6 or more authorized holidays in most states on which employees could be scheduled and excused with regular pay.
Group A: If worked, double time for time within normal tour. Time and one-half for work in excess of normal tour on holidays.
6 states had only the 5 holidays listed below.
Holidays were: New Year’s Day, Independence Day, Labor Day, Thanksgiving Day, Christmas Day, and at least 1 other.2
Group B: If worked, compensatory time off or time extra pay for time worked.
Traffic, Group A: Special payment of $2 for working evening or night tours on Dec. 24 and Dec. 31 under specified combinations of Christmas and New Year’s assignments.
Digitized for FRASER http://fraser.stlouisfed.org/ Federal Reserve Bank of St. Louis

Effective date Provision Applications, exceptions, and other related matters
Holiday pay-Comdnued
Oct. 20, 1940-Continued Plant, Group A: Minimum of 3 hours paid when called to work on excused holiday.
Mar. 30,1941
Jan. 30,1942
Traffic, Group A, Minneapolis: Special $2 payment replaced by double time for work on Dec. 24 and Dec. 31 after 7 p.m. to end of latest ending evening tour.
At least 1 holiday added in 14 states, including the 6 formerly having only 5 holidays. At subsequent dates 8 states added 1 more holiday.2
Jan. 1,1945 Group B: Saturday holiday included in scheduled workweek when employee had worked on 3 of preceding 8 Saturdays.
May 18,1945
May 9,1947
Traffic, Group A, except Minneapolis: Special payment for work on Dec. 24 and Dec. 31 changed to $2 for nightwork starting at 10 p.m. or later and evening work ending after 7 p.m. but not later than 10 p.m.; $3 for nightwork starting before 10 p.m. and evening work ending after 10 p.m.
Traffic, Group A, and Plant central office, Group A: Double time for work in excess of a normal tour on a holiday.
Traffic, Group A: Double-time payment plan at Minneapolis for evening and night work on Dec. 24 and Dec. 31 extended to all offices.
June 2,1948
Plant, Group A: Minimum of half-day's worktime paid when called to work on excused holiday.
Plant, outside maintenance and gang, Group A: Double time for work in excess of normal tour on a holiday.
Nov. 28, 1955 (agreement of same date).
Added: Veterans’ Day, Nov. 11, as holiday in 9 states.
Nov. 10, 1963 (agreement of same date).
Added: Inauguration Day, Jan. 20, inauguration year in Arlington, Va., and Silver Spring and Greenbelt, Md. Memorial Day, May 30, and Alaska Day, March 30, in Alaska.
Digitized for FRASER http://fraser.stlouisfed.org/ Federal Reserve Bank of St. Louis

Effective date Provision Applications, exceptions, and other related matters
Holiday pay-Comtinued
Jan. 16, 1967 (agreement of same date).
Added: Group B-employee to be paid at his holiday overtime rate for time worked in excess of a normal tour on a holiday.
Added: Lincoln’s Birthday as holiday in Illinois (excluding St. Clair and Madison Counties but including cities of Edwardsville and Highland); Columbus Day in Connecticut; Veterans’ Day in South Dakota; and Good Friday in Micnigan and Wisconsin.
In effect and continued: Special local observance of a holiday by businesses in a community could be recognized as a paid holiday if observed by the local telephone company. The observance of such a holiday was not to be construed as the establishment of a regulai holiday in the contract.
July 16,1968 (agreement of same date).
Increased: Paid for a normal tour at gross rate and time and one-half for time worked up to a normal tour.
Increased: Holiday overtime rate at two and one-half times gross rate.
Added: Washington’s Birthday as holiday in Michigan and Wisconsin; Inauguration Day in Dranesville, Va., and Cheltenham and Mt. Rainier, Md.; and Good Friday in 26 states.3
Eliminated: Washington’s Birthday as a holiday in Kansas and Missouri; Veterans Day in West Virginia; Lincoln’s Birthday as holiday in New Jersey; and Bunker Hill Day i}h day) for traffic employees in Boston.3
Jan. 1, 1969 (agreement of above date).
Added: Veterans’ Day as holiday in Delaware and NewJersey.3
July 18,1971 (agreement of same date).
Jan. 1, 1972 (agreement of July 18,1971).
Added: Inauguration Day as holiday in Garden City, Virginia, and Fast Day as holiday in Connecticut.4
Eliminated: Good Friday as holiday in Connecticut; Jefferson Davis’ Birthday in Louisiana; Admission Day in California; and Washington’s Birthday in Indiana (except Lawrenceburg) and Wisconsin.4
Added: Day after Thanksgiving in Indiana (exceptLawrenceburg) and Wisconsin; and Columbus Day in California.4
Jan. 1, 1973 (agreement of July 18,1971).
Added: Lincoln’s Birthday as a holiday in St. Clair and Madison Counties, Illinois (except Belleville and Mascoutah); Washington’s Birthday in 16 states (except Pendleton, Grant, Galletin, Campbell, Kenton, and Boone counties in Kentucky and El Paso County, Texas, where this holiday was already in effect) plus Belleville and Mascoutah, Illinois; Mardi Gras Day in Bogalusa, Louisiana; Memorial Day in Louisiana (except New Orleans, Lafayette, and Bogalusa); Friday after Thanksgiving in 6 states plus Lawrenceburg, Indiana; Columbus Day in 3 states; Veterans’ Day in 6 states plus Belleville and Mascoutah, Illinois; Good Friday in 11 states (except Belleville and Mascoutah, Illinois, where this holiday was already in effect) and the District of Columbia; Christmas Eve in Indiana (except Lawrenceburg) and Wisconsin; and Nevada Day in Nevada.4
Eliminated: Good Friday as a holiday in Alaska, Oregon and Washington.4
Digitized for FRASER http://fraser.stlouisfed.org/ Federal Reserve Bank of St. Louis

Effective date Provision Applications, exceptions, and other related matters
Vacation pay
Oct. 20,1940 ................................ 1 week for 1 year, 2 weeks for 2 Evening and night differentials included in vacation pay.years, and 3 weeks for 15 years Traffic: Special vacation provisions for first year’s serviceof credited service. were applicable in certain traffic cities as follows:
Memphis and Louisville-1 week’s pay after 8 months’ service; Boston-2 weeks’ pay after 6 months’ service.
Oct. 29,1944 ................................ Added: Employee to receive 1 extra day’s pay if 12 or more full tours were worked in excess of the established workweeks during first 17 or 18 weeks immediately preceding vacation, one-half day’s pay if 6 but less than 12 full tours were worked.
May 9,1947 .................................. Added: Additional day off with Boston, Louisville, and Memphis Traffic group changed topay allowed for scheduled holiday occurring during vacation.
same practice as other Traffic offices.
Jan. 1, 1954 (agreement dated Changed to: 1 week after 6 Continued: Pay for unused vacation to laid-off employees,Sept. 2, 1953). months’ service, if hired before temporary employees whose work was completed, and
April 1 of current year; 2 weeks after 1 year, if hired before October of preceding calendar year.
employees resigning or dismissed.
1959 (agreement dated July 10, Added: 4 weeks’ paid vacation Changed: Paid days in vacation week to be number in1959). after 30 years’ service. established work week during the first 17 of 20 (was 18)
weeks preceding vacation in office to which employee was assigned.
Traffic-Groups A and B-Vacation pay to include average of night differentials for tours scheduled during first 4 of 7 (was 5) weeks preceding vacation.
Continued: Plant Groups A—Inclusion in vacation pay of night differential received in weeks preceding vacation.
Traffic and Plant Groups-Provision of additional vacation days if employee worked in excess of scheduled workweek, as follows: (1) If employee worked 6 but less than 12 additional normal tours during contract period—J/2 day per week of vacation; if 12 or more normal tours— 1 day per week of vacation.
Jan. 1, 1961 (agreement dated Changed: 4 weeks’ paid vacationNov. 9,1960). after 25 years.
Jan. 1, 1964 (agreement dated Changed: 3 weeks’ paid vacation Changed: Paid days in vacation week; for full-timeNov. 10,1963). after 10 years. employee, to 5 days; for part-time employee, to average
weekdays in scheduled workweek during first 10 of 13 weeks preceding vacation.
Jan. 1, 1967 (agreement dated Changed: 4 weeks* paid vacationJan. 16,1967). after 20 years.
Digitized for FRASER http://fraser.stlouisfed.org/ Federal Reserve Bank of St. Louis

Effective date Provision Applications, exceptions, and other related matters
Vacation pay-Continued
Jan. 1, 1969 (agreement dated July 16,1968).
Added: 5 weeks’ paid vacation after 25 years.
One of the 5 weeks was to be taken during January, February, March, April, November, or December.
July 18,1971 (agreement of same date).
Changed: One week of employee’s eligible vacation could begin on the first day of the last calendar week of the year provided it was not taken in succession with a vacation week the following year unless specifically authorized by the company.
Increased: Total period of all leaves with service credit granted to any employee during his or her entire service with the company subsequent to June 2, 1942, to maximum 4 years.
Jan. 1, 1973 (agreement dated July 18, 1971).
Changed: 4 weeks’ paid vacation after 17 years.
Changed: Employees eligible after Dec. 1 of current calendar year for a one or two week vacation could electto take a week in the following year provided it was completed prior to April 1.
Changed: Employees hiredanytime after Jan. 1, 1973 eligible for 1 week of vacation after 6 months of service.
Changed: Employees hiredanytime after Jan. 1, 1973 eligible for 2-week vacation after 1 year of service, provided employee’s term of employment of both 6 months and 12 months was completed within the same calendar year; the employee’s second week of vacation would be taken after completion o f 12 months of service.
Changed: Employees eligible for 2 weeks’ vacation during the calendar year in which a term of employment of 2 years was completed.
Termination pay (dismissals)
Oct. 20,1940 1 week’s termination pay in lieu of notice to employees with less than 1 year’s service, 2 weeks’ pay for 1 or more years’ service.
Employees not entitled to payment if dismissed (1) at expiration of leave of absence or period of disability payments, (2) because of becoming ineligible for employment under company rules, or (3) for misconduct. A dismissed employee was defined as one terminated for any reason other than transfer, resignation, layoff, retirement, or death.
Dismissed employees received vacation payments due.
Digitized for FRASER http://fraser.stlouisfed.org/ Federal Reserve Bank of St. Louis

Effective date Provision Applications, exceptions, and other related matters
In-charge pay
Oct. 20,1940 Traffic: No provision for incharge pay.
Plant central office, Group A: $3 a week paid employees assigned limited responsibility for directing the work of 1 or more employees, or office responsibility for 4 hours in each o f 3 or more of 5 daily tours, or when assigned duties of supervisor for 1 week or more.
May 9,1947
July 10,1959 (agreement of same date).
Jan. 16, 1967 (agreement of same date).
Established: Traffic, Group A $1.40 a day paid employees assigned to duties of absent supervisor for 4 or more hours during a tour.
Plant central office, Group A: Changed to $1.40 a day for any day assigned in-charge responsibilities for 4 hours or more.
Increased: Traffic, Group A and plant central office, Group A -to $1.50 for any day assigned duties of absent supervisor or in-charge responsibility for 4 hours or more.
Increased: Traffic, Group A and plant central office, Group A -to $1.75.
Travel-time pay
Oct. 20,1940 Applicable rate (straight time or time and one-half) paid for travel time on company business. Except for plant gang employees, time spent outside of normal working day not paid for if sleeping car or other first class accommodations were provided.
Gang employees: Straight-timerate up to 8 hours for travel time between 6 a.m. and 6 p.m. on scheduled days. Straight-time rate paid for all travel time between 6 a.m. and 6 p.m. on nonscheduled days, Sundays, and holidays. Time
Gang employees: Time traveling in excess of Vi hour to and Vi hour from the job, and time traveling in the course of the day’s work considered travel time on company business.
Plant, outside maintenance employees: Time traveling from the storeroom to the job, from one part of the job to another and from the job to the storeroom considered travel time on company business.
Digitized for FRASER http://fraser.stlouisfed.org/ Federal Reserve Bank of St. Louis

Effective date Provision Applications, exceptions, and other related matters
Travel-time pay-Continued
Oct. 20 ,1940-Continued
May 9,1947 ..................................
spent outside of 6 a.m. to 6 p.m. not paid for if sleeping car accomodations were provided.
Changed: Gang employees: Time traveling from the reporting place to the job, from one part of the job to another and from the job back to the reporting place considered travel time on company business.
Jan. 16, 1967 (agreement of same date).
July 16,1968 (agreement of same date).
Changed: Applicable rate paid for travel time on company business. Except for plant gang employees, only first hour spent in traveling on company business outside of normal working day paid for.
Changed: Applicable rate paid for travel time on public transportation designated by the com pany for company business. Local travel time not considered work time, except for time normally spent traveling from transportation depot to the point of destination in the city of destination (other than the city of origination).
Jury duty or summons pay
Oct. 20,1940 ................................
Jan. 16, 1967 (agreement of same date).
Leave with full pay granted employees serving on juries or appearing in court as witnesses in compliance with subpoena.
In effect and continued: Traffic, Group A-employee assigned to night duty and excused for jury duty could be shifted to a day tour without eligibility for a night differential.
Voting pay
Oct. 20,1940 ................................ Traffic: Employee whose tour did not give opportunity to vote excused with pay for reasonable period.
Plant: No provision for voting pay.
Digitized for FRASER http://fraser.stlouisfed.org/ Federal Reserve Bank of St. Louis

Effective date Provision Applications, exceptions, and other related matters
Voting pay—Continued
June 2,1948 .................................. Traffic and plant: Employee eligible to vote and requesting leave excused with pay for reasonable period. Company to specify period of leave.
Jan. 16, 1967 (agreement of same date).
In effect and continued: An employee requesting leave to serve on an election board for a Federal, State, county, or municipal election excused with pay.
Deductions for election board service could be made if circumstances of a particular case deemed it advisable.
Meal allowance
Oct. 20,1940 ................................ Reasonable meal expense paid if time work in excess of a normal tour extended over a meal period. No pay for meal period.
Not applicable to traffic, Group A, outside maintenance and gang employees.
Two hours in excess of a normal tour defined as work beyond normal meal period.
June 25,1944 ................................ Group B: Reasonable meal expense paid on nonscheduled workdays if employee was compensated for such work by equivalent time off.
Bereavement pay
Oct. 20,1940 ................................ Traffic: Up to 5 paid days of absence allowed because of death in immediate family. Up to 3 paid days of absence allowed to attend funeral of distant relative or close friend.
Plant: No provision for bereavement pay.
Immediate family defined as parents, husband, wife, children, brothers, sisters, or any relative living in same house with employee.
Absence pay
Oct. 20,1940 Traffic, Group A: Employeeabsent from work after reporting for duty paid for Vi tour if part of a session was worked. If such absence was due to personal illness or injury on the job, employee paid for the full tour.
Traffic, Group B: Employeeordinarily paid for full tour if part of full tour was worked.
Provision not applicable for absence occasioned by union activity unless meeting with management.
Digitized for FRASER http://fraser.stlouisfed.org/ Federal Reserve Bank of St. Louis

Effective date Provision Applications, exceptions, and other related matters
Absence pay-Continued
Oct. 20, 1940-Continued Plant: No provision for absence pay.
Jan. 16, 1967 (agreement of same date).
In effect and continued: Traffic, Group A-employee absent from work after reporting for duty paid for (a) half-tour if absence occurred during first session of normal tour, (b) full tour if absence occurred during second tour, and (c) half-tour if absence occurred during an assigned half-tour.
Group B-employee orinarily paid for half-tour if part of half-tour was worked.
Call-out pay
Oct. 20,1940 ................................ Plant, Group A: 3 hours* minimum pay guaranteed for each period of work during non- scheduled periods not continuous with any other period of work time or during an excused holiday.
Traffic: No provision for call-out pay.
When more than one period of call-out time was involved and where the interval between periods of call-out time was less than 3 hours, total compensation for all such periods not to exceed that which the employee would have received had the employee worked continuously from start of first to end of last such period as single call-out.
May 9,1947 .................................. Plant central office, Group A: Changed to one-half tour minimum pay for the first call to work on nonscheduled days or excused holidays. Three- hour minimum at all other times.
June 2,1948 .................................. Plant, outside maintenance and gang, Group A: V2 tour minimum pay for the first call to work on nonscheduled days or excused holidays. Three-hour minimum at all other times.
Shifted tour pay
Oct. 20,1940 ................................ Plant central office, Group A: Time and one-half paid for hours worked up to a normal tour, when employee’s tour was shifted without adequate notice to start 4 hours before or after starting time of his
Digitized for FRASER http://fraser.stlouisfed.org/ Federal Reserve Bank of St. Louis

Effective date Provision Applications, exceptions, and other related matters
Shifted tour pay—Continued
Oct. 20 ,1940-Continued scheduled tour, or when the employee worked a scheduled tour which started 4 or more hours before or after the starting time of his basic tour.
Traffic: No provision.
Board and lodging
Oct. 20,1940 ................................ Nonlocated gang employees: Board and lodging normally furnished by company. Amounts ranging from $7 to $13 a week, depending upon the employees’ weekly basic rate, considered as the equivalent of board and lodging and paid to employee when board and lodging was not furnished.
Nonlocated employees were workers normally working at different locations as required by company.
Jan. 30,1942 .................................. Changed: Nonlocated gang employees: Employee’s basic rates adjusted to include a wage equivalent for board and lodging and a $7-a-week deduction for board and lodging was made from the employee’s basic rate when board and lodging was furnished by the company.
Carfare allowance
May 9,1947 .................................. Established: Employee working in both sessions of a divided tour would be eligible for a carfare allowance in the amount incurred for one roundtrip fare not to exceed 30 cents.
June 27,1951 ................................ Increased: Maximum to 50 cents.
Feb. 10,1958 ................................ Increased: Maximum to 70 cents.
July 16,1968 (agreement of same date).
Increased: Maximum to 90 cents.
July 18,1971 (agreement of date).
Increased: Maximum to $1.20. If cost of one round trip fare for public transportation in New York City exceeded 60 cents, the maximum would be increased to $2.
Digitized for FRASER http://fraser.stlouisfed.org/ Federal Reserve Bank of St. Louis

Effective date Provision Applications, exceptions, and other related matters
Severance pay
Oct. 20,1940 ................................ 1 week’s severance pay for each completed year of net credited service up to and including 7 years, plus 2 weeks’ pay for each completed year of net credited service for 8 but less than 15 years, plus 3 weeks’ pay for each completed year of net credited service for 15 or more years.
Pay computed at regular weekly rate in effect at date of lay-off. Reengaged employee to repay excess received over that which would have been earned at straight-time rates if retained. Payment to employee reengaged and laid off reduced by any previous severance pay. Laid-off employees also receive vacation payments due.
May 9,1947 .................................. Changed to: 1 week’s severance pay for each completed year of net credited service up to and including 4 years, plus 2 weeks’ pay for each completed year of net credited service for 5 but less than 9 years, plus 4 weeks’ pay for each completed year of net credited service for 9 or more years.
Sick leave
Oct. 20.1940 Traffic: Pay for scheduled days during the first 7 calendar days of the absence because of illness or quarantine. (Pay treatment for illness beyond 7 th day provided under plan for accident, sickness, and death benefits.)
Group A: Employees with (1) 2 but less than 10 years’ service-payment to start on 3d scheduled day of absence, (2) 10 or more years’ service-payment to start on 1st day of absence. Regulations provided certain exceptions in Cleveland.
Group B: Employees ordinarily paid for scheduled days during first 7 calendar days of an absence period.
Jan. 30,1942 Traffic, Group A: Pay formula not applicable to scheduled days in excess of 5 in a calendar week.
Jan. 1, 1945 Traffic, Group A: Pay formula applicable to 6 scheduled days in a calendar week if 3 or more days in that week were worked.
Oct. 5, 1953 (agreement dated Sept. 2,1953).
Changed: Traffic: To pay for scheduled sessions5 during first 7 calendar days of absence because of illness or quarantine.
Group A: Employees with (1) 2 but less than 5 years’ service-pay for all except 1st 4 scheduled sessions, (2) 5 but less than 10 years’ service-pay for all except 1st 2 scheduled sessions.
Eliminated: Exceptions in Cleveland.
Jan. 16, 1967 (agreement of same date).
In effect and continued: Traffic, Group A-pay formula applicable to 6 scheduled days in a calendar week if less than 3 days in that week were worked.6
Digitized for FRASER http://fraser.stlouisfed.org/ Federal Reserve Bank of St. Louis

Effective date Provision Applications, exceptions, and other related matters
Health and welfare benefits
1940 In effect:Accident benefits: Employees
physically disabled by reason of accidental occupational injury to receive for (1) total disability-full pay for 13 weeks, half pay for the remainder of the disability, but not more than $20 a week after 6 years; (2) partial disability-100 percent of loss in earning capacity for 13 weeks, 50 percent for remainder of disability up to 6 years. Employees with 15 years’ service or more to receive full pay for periods specified under sickness benefits for this length of service.
Sickness benefits: Employees disabled because of sickness, including injuries not arising in the course of employment, to receive:
Full Halfpay pay
Years o f service for for
2 & under 5 4 wks. 9 wks.5 & under 10 13 wks. 13 wks.10 & under 15 13 wks 39 wks.15 & under 20 26 wks. 26 wks.20 & under 25 39 wks. 13 wks.25 or more 52 wks -
Noncontributory accident, sickness and death benefits plan was established in 1913. Not covered by union agreement. Benefits to begin on first day on which a full day’s wage was not paid.
Amount of payment could be changed if disability changed from total to partial or from partial to total. No payments for partial disability to be made after 6 years of disability payments.
In case of accidental injury resulting in permanent loss of a body member or its use, special benefits not exceeding amount payable for accidental death could be awarded in lieu of all other benefits.
Committee administering plan could also approved necessary expenses for first aid treatment or surgery.
Benefits to begin on 8th calendar day of absence or, if employee had been receiving benefits and was again absent within 2 weeks, on 1st day.
All benefit payments to be reduced by the amount of related benefits required by State or Federal Law.
Payments to employees with less than 2 years’ service to be governed by company practice.
Death benefits: In event of death from (1) work-connected accident-benefits to equal 3 years’ wages, but not more than $5,000; (2) nonoccupa- tional sickness-4 months’ pay for employees with 2 but less than 3 years’ service and an additional month’s pay for each added year c f service up to 10 (maximum 12 months); minimum benefit $250.
Benefits in case of death of pensioner: Not to exceed payments under sickness-death benefits.
Payments made at discretion of company.
Digitized for FRASER http://fraser.stlouisfed.org/ Federal Reserve Bank of St. Louis

Effective date Provision Applications, exceptions, and other related matters
Health and welfare benefilts-Continued
1940—Continued Funeral benefits: Up to $250 for necessary expenses.
In addition to death benefit.
Jan. 1,1946 Increased:Accident Benefits: For total
occupational disability, half pay to continue for duration of disability.
Death Benefits: Maximum to$10,000 for death resulting from occupational injury.
Changed to :Benefits in case of death of
pensioner: Mandatory payments to qualified beneficiaries (1) if death occurred within 1 year after retirem en t-m axim u m sickness- death benefit payable as if pensioner had died on last day of active service; (2) if death occurred more than 1 year after retirement-not less than maximum sickness-death benefits reduced by 10 percent for each full year since retirement, or amount of annual pension, whichever was greater. Could be supplemented at company discretion with amount not to exceed payments under (1) if no qualified beneficiaries; payments at company discretion to extent necessary for $250 burial expense plus cost of last illness.
May 9,1947 Agreement that company would not reduce or diminish benefits or privileges without consent of the union.
Dec. 19,1956 (agreement of same date).
Increased:Death benefits-In the event of
death from (1) accident- m axim u m to $ 3 0 ,0 0 0 , (2) sickness-m inim um to $500. Funeral benefits-$500.
Added:Agreement that company would not change benefits
without 60 days’ notice to union.
April 1,1957 Increased:Sickness benefits-Employees
with 1 but less than 2 years’ service, to half pay for 9 weeks.
Digitized for FRASER http://fraser.stlouisfed.org/ Federal Reserve Bank of St. Louis

Effective date ProvisionApplications, exceptions, and other related matters
Health and welfare benefits—Continued
Mar. 1,1958 .................................. Changed to:Death b e n e f its -S ic k n e s s -4
months’ pay for employees with 6 months but under 2 years’ service, and an additional 2 months’ pay for each added year of service up to 5 (maximum 12 months). No change in minimum benefits.
May 18, 1958 (by agreement dated May 12,1958).
Established:Contributory life insurance plan
for regular employees with 6 months or more of service, providing benefits equal to employee’s annual basic pay adjusted to the next higher $1,000, with $2,000 minimum, plus equal amount for accidental death or dismemberment.7
Employees to contribute $0.50 monthly for each $1,000 above first $1,000 of life insurance until retirement. Company to pay any additional amount required.
Retired employee, continuously insured while eligible after age 45, to be covered without cost by life insurance in amount in effect at retirement reduced by 10 percent after 1 year and by the same dollar amount on each of 4 succeeding retirement anniversary dates, with a minimum of $1,500. Accidental death and dismemberment insurance discontinued on retirement.
For employee totally disabled and not eligible for pension or disability benefits, insurance to be continued with cost to employee during term of disability. After expiration of disability benefits, insurance continued without cost to employee as follows: 1 year for employees with less than 5 years’ credited service; 2 years for 5 but less than 10 years’ service; and 3 years for 10 but less than 15 years’ service. Employees with 15 or more years’ service to receive same benefit as retired employee. Accidental death and dismemberment insurance discontinued on expiration of disability benefits.
Employees could continue insurance during layoff up to 6 months on payment of contribution.
Dec. 1, 1960 (agreement dated Oct. 10,1960).
Increased: Life insurance- minimum face amount to $3,000.8
Changed: Employee to contribute $0.50 monthly for each $1,000 above first $2,000 life insurance.
Dec. 15, 1960 (agreement dated Nov. 9,1960).
Established:Noncontributory major medical
benefits plan for regular employees with 6 or more months’ service, retirees, and their dependents.
Benefits: 80 percent o f the amount by which medical expenses exceeded sum of (1 ) am ount payable by specified local plans9 providing basic benefits, whether or not employee was covered by such plan, plus (2) 4 percent of annual basic pay of
Benefits limited to 50 percent for mental care outside hospital or mental institution, except for regular employees absent from work because of disability.
Maximum benefit could be restored on submission of evidence of insurability, at any time after receipt of $1,000 in benefits.
Four-percent deductible could be applied 3 times in any 12 months, but only once for an accident injuring 2 or more beneficiaries.
Benefits available in or outside hospital.
Digitized for FRASER http://fraser.stlouisfed.org/ Federal Reserve Bank of St. Louis

Effective date ProvisionApplications, exceptions, and other related matters
Health and welfare benefits-Continued
Dec. 15, 1960 (agreement dated Nov. 9, 1960).-Continued
regu lar em ployee w ith minimum o f $100 and maximum of $500. Lifetime maximum for regular employees and their dependents under 65 years of age- $15,000; for retired employees and their dependents, and regular employee’s dependents over 65-$2,500.
Covered expenses: Hospital room plus related hospital services, and services of doctors and registered nurses; professional ambulance services to first hospital; physiotherapy presc r ib e d by a tte n d in g physician, when performed by qualified physiotherapist; drugs and medicines; diagnostic X-ray and laboratory examinations; X-ray, radium and radioactive isotope therapy; anesthesia and oxygen and the administration thereof; blood and blood plasma to the extent not donated or otherwise replaced; rental of iron lung and other durable medical or surgical equipment; artificial limbs and eyes, except replacements.
Not applicable to services of registered nurse ordinarily residing with or a member of beneficiary’s immediate family; care in nursing or convalescent homes or places for the aged; expenses covered under laws or regulations of any government; occupational disability; treatment, services, or supplies not certified by doctor; charges in excess of either the regular and customer charges for or the fair and reasonable value of the service; expenses paid under any other plan to which employer contributed or made payroll deductions, to the extent such expense exceeds the “deductible” ; dental work or treatment and cosmetic surgery or treatment, except in case of accident; medical observation or diagnostic study when no disease or injury was revealed, except under certain conditions; personal services; pregnancy or childbirth, except severe complications; eyeglasses and hearing aids, or examinations for the prescription or fitting thereof.
Nov. 1, 1963 (agreement dated Oct. 25,1963).
Changed to :Benefits in case of death of pen
sioner: Mandatory payments to qualified beneficiaries if retirement occurred on or a fte r Oct. 31 , 1 9 6 3 - maximum sickness death benefits payable as if pensioner had died on last day of active service. Could be supplemented at company discretion with amount not to exceed maximum sickness death benefits if no qualified beneficiaries.
By resolution of the Benefit Committee, the company also provided mandatory payments to qualified beneficiaries if retirement occurred prior to Oct. 31, 1963—not less than maximum sickness death benefits reduced by 10 percent for each full year since retirement and up to Oct. 31, 1963, or amount of annual pension, whichever amount was greater. Could be supplemented at company discretion with amount not to exceed maximum sickness death benefits if no qualified beneficiaries.
Digitized for FRASER http://fraser.stlouisfed.org/ Federal Reserve Bank of St. Louis

Effective date ProvisionApplications, exceptions, and other related matters
Health and welfare benefits—Continued
Dec. 1, 1963 (agreement dated Nov. 10,1963).
Changed to Major Medical Benefits: Lifetime maximum for regular employees and their dependents under 65 years of age-$20,000; for retired employees and their dependents, and regular em p loyees’ dependents over 65—$5,000.
Changed: Employee to contribute $0.40 monthly for each $1,000 above first $2,000 life insurance.10
Jan. 1, 1964 (agreement dated Nov. 10,1963).
E sta b lish e d : C ontributoryhospital-surgical-medical plan for regular employees, retirees, and their dependents.
Company to contribute 14 of initial cost of plan. Dollar contribution to be doubled in 1966. Dependents defined as wife or husband and unmarried children (including stepchildren and adopted children residing with employee) under age 19.
New York-(Blue Cross and Blue Shield).11
In New York, company contributed $1.70 a month for single employees, $4.79 for a 2-person family, and $4.95 for larger families.
Hospital benefits (room and board)-In member hospital, full coverage for semiprivate room or ward up to 120 days per admission.
In nonmember hospital, 80 percent of charges for semiprivate room or ward up to 120 days per admission.
Employee using private room to pay difference between that charge and cost of semiprivate accommodations
Benefits reinstated 90 days after last day of hospitalization.
Benefits not available for institutions for convalescence, nursing, or rest care; for service of physicians, surgeons, and technicians not employed by hospital; for dental care, except in case of accident or removal of impacted teeth; hospitalization primarily for diagnostic study, physical therapy, X-ray and laboratory examinations, basal metabolism tests, electrocardiograms, and electroencephalograms; for care under the laws of the United States, or any State or Government (except covered services for which employee paid); for care for occupational disabilities provided in accordance with law; for care provided by any other employer-financed or contributory plan.
Benefits limited to 30 days for each confinement for tuberculosis, nervous and mental conditions, alcoholism, or drug addiction.
Benefits reinstated 180 days after last day of hospitalization.
Special hospital expenses (other than for room and board): Full coverage up to 120 days for meals and special diets; general nursing care; use of operating and other surgical treatment rooms; anesthesia and the adm inistration thereof; all laboratory tests;
Excludes ambulance service and services or supplies not certified by doctor
Digitized for FRASER http://fraser.stlouisfed.org/ Federal Reserve Bank of St. Louis

Effective date Provision Applications, exceptions, and other related matters
Health and welfare benefilts-Continued
Jan. 1, 1964 (agreement dated Nov. 10, 1963).-Continued
physical therapy treatments; oxygen and oxygen therapy; all recognized drugs and medicines for use in hospital; dressings, ordinary splints, and plaster casts, X-ray examinations, X-ray therapy, radiation therapy and treatm ent; electrocardiograms, electroencephalograms, and basal metabolism tests; and administration of blood and blood plasma.
Outpatient benefits: Full coverage provided for care rendered in hospital within 48 hours after accidental injury, for serious illness, or when minor surgery was required.
Maternity benefits: All services provided for regular hospitalization up to 120 days, plus use of delivery room, infant feeding, and other routine care of the newborn child.
Premature Infants benefits: Same as Hospital Benefits.
Surgical-medical benefits:1. Plan to pay full amount of
scheduled fee for single employees earning $4,000 or less and married em ployees earning $ 6 ,0 0 0 or less annually for:Surgical services—all accepted
operative and cutting procedures for diagnosis and treatment of diseases, injuries, fractures, and dislocations, and postoperat i v e care pa id in a c c o r d a n c e w i th a schedule.
Medical care-up to 120 days’ care in hospital when surgery was not required; doctors’ fees limited to $571 for routine care, $637 for intensive care.12 Up to 30 days’ care for tuberculosis, nervous and mental conditions, drug addiction, or alcoholism;
Available after 270 consecutive days in plan.
Applicable only to infants weighing less than 5Yt pounds.
Participating doctors agreed to accept plan schedule as payment in full.
Full benefits reinstated 3 months after release from hospital; after 6 months for tuberculosis, nervous and mental conditions, drug addiction, or alcoholism.
Digitized for FRASER http://fraser.stlouisfed.org/ Federal Reserve Bank of St. Louis

Effective date Provision Applications, exceptions, and other related matters
Health and welfare benefi ts-Continued
Jan. 1, 1964 (agreement dated Nov. 10, 1963).-Continued
doctors’ fees limited to $171.13
Premature infants benefits: Up to $100 provided for in-hospital medicare care.A nesthesia-20 percent of
surgical and maternity care allowance; minimum $20.
Radiation Therapy-Up to $250 for each contract year for proven malignancy and $200 for benign conditions.
2. Plan to pay scheduled fee for: Obstetrical benefits—Up to
$75 for normal delivery, $75 to $175 for other procedures.
D i a g n o s t i c X-ray and laboratory examinations- Up to $75 per person per contract year for any one accident or illness in doctor’s office or hospital outpatient department.
Consultation services—Up to $20 for one in-hospital specialist consultation per continuous period of hospitalization.
Electro-shock therapy-Up to $15 for each treatment, in or out of hospital, to maximum of $150 per contract year.
Applicable only to infants weighing 5 pounds or less.
Includes X-ray, radium, and other forms of radiation therapy used n the treatment of proved cases of malignancy only.
Benefits not available for maternity services.
Jan. 11, 1966 (agreement dated Nov. 10, 1963).
Company contribution to hospital-surgical-medical plan increased to 50 percent for regular employees, retirees, and their dependents.
July 1, 1966 (agreement dated Jan. 31,1966).
Established: Noncontributoryspecial medical expense plan which provided benefits at age 65 or over for retirees and eligible dependents of both regular and retired employees. The plan was coordinated with Medicare so that there would not be a duplication of benefits. In no case would the total of benefits under both Medicare and the special plan be less than those under the basic and major medical plans. The lifetime maximum was
Basic and major medical plan benefits were not available to those who qualified for Medicare.
Digitized for FRASER http://fraser.stlouisfed.org/ Federal Reserve Bank of St. Louis

Effective date Provision Applications, exceptions, and other related matters
Health and welfare benefits-Continued
July 1, 1966 (agreement dated Jan. 31, 1966).-Continued
Jan. 16, 1967 (agreement of same date).
$5,000 per person, to be reduced by any benefit received under the major medical plan. A deductible of 4 percent (maximum $500) was to be applied separately to the expenses of each eligible person based on the (1) annual pension before social security adjustment for claims of eligible retirees and their dependents or (2) annual basic pay of a regular employee on the claims of his eligible dependents.
C h a n g ed : Major m edicalbenefits-the $100 minimum deductible was eliminated. In addition to the $5,000 lifetime maximum, payments up to $1,000 could be made in any medical expense period ending on or after Jan. 16, 1967, and only the amount of payments, if any, exceeding $1,000 if such period could be charged against $5,000 lifetime maximum.
Feb. 1, 1967 (agreement of above date).
Changed: Company contribution to the hospital-surgical- medical plan for 2-person or family coverage to 50 percent of the premium for individual coverage, plus 75 percent of the difference between the premium for individual coverage and the premium for 2-person or family coverage.
No contribution was made toward the premium for a sponsored child.
Mar. 1, 1967 (agreement of above date).
Established: Contributory supplementary life insurance plan for regular employees under age 60 who were enrolled under the basic life insurance plan, providing benefits equal to 1 year’s basic pay rounded to the next higher $1,000, with $3,000 minimum.
Employee to contribute $0.20 monthly for each $1,000 if under age 45 and $0.70 monthly if age 45 or more.
Retired employee under age 60 and continuously insured after age 45 could continue coverage until age 60 through contributions.
For employees totally disabled and not eligible for pension or disability benefits, insurance to be continued under same formula as that of basic life insurance. In no case was coverage to continue after age 60. Employee contribution discontinued after expiration of company disability benefits.
Apr. 1, 1967 C hanged: Death b enefits-sickness-$500 or 12 months’ wages, whichever is greater.
Digitized for FRASER http://fraser.stlouisfed.org/ Federal Reserve Bank of St. Louis

Effective date Provision Applications, exceptions, and other related matters
Health and welfare benefits—Continued
July 16,1968 (agreement of same date).
Increased: Hospital-surgical- medical. Hospital benefits—in nonmem ber hospital 90 percent o f charges for semiprivate room or ward, up to 120 days per admission. Outp a t ie n t b e n e f i t s - f u l l coverage provided for care in hospital within 72 hours of accidental injury, serious illness, or minor surgery.
Reduced: Major medical benefits -deductible to 3 percent of a n n u a l basic pay o f employee.
Increased: Company contribution to the hospital-surgical- medical plan to 75 percent of the premium for either individual, 2-person, or family coverage.
Added: Definition of dependent for basic medical coverage to include any unmarried child of any age who was incapable of self-support and mentally retarded or physically handicapped before age 19.
Aug. 1, 1968 (agreement of above date).
Reduced: Employee to contribute $0.35 monthly for each $1,000 above first $2,000 basic group life insurance.14
June 1, 1969 (agreement dated July 16,1968).
Increased: Sickness benefits to a minimum of half pay for 52 weeks for employees with 6 months but less than 10 years of service.15
Aug. 1, 1970 (agreement dated July 16,1968).
C h a n g e d : C o n tr ib u t o r y hospital-surgical-medical plan for regular em ployees, retirees, and their dependents was made non contributory.
Company agreed to pay full cost of premium for basic group life insurance.
Jan. 1, 1972 (agreement of July 18, 1971).
Changed: For covered surgical procedures, payment would be made at rate of 80 percent o f “ r e a s o n a b le and customary” charges in a particular community.
Added: Option under which individual employees enrolled in the Basic Medical Expense Plan could substitute designated prepaid group medical practice plans with which the company had made contractual arrangements. Company would pay same amount toward alternate coverage as it would for whatever form of coverage the employee had under the BME plan. Any additional cost of the alternate plan would be paid by the employee through payroll deductions.
July 1, 1972 (agreement of July 18,1971).
Reduced: Major medical deductible—to 2 percent of annual base pay of employee, but not to exceed $250 (was $500).
Eliminated: $20,000 lifetime maximum for major medical benefits.
Changed: Retired employees would be reimbursed for fees a n d p r e m i u m s o f Medicare—Part B.
Changed: Definition of Class II relatives to include those for whom employee provided a household in vicinity (not necessary to live with employee).
Increased: Maximum income allowance from outside sources for Class II relatives to $2,400 each (was $1,200).
Digitized for FRASER http://fraser.stlouisfed.org/ Federal Reserve Bank of St. Louis

Effective date Provision Applications, exceptions, and other related matters
Pension plan
1940 (plan established Jan. 1, 1913).
Noncontributory plan9 providing the following benefits:
Not covered by union agreements. Retirement automatic at age 65; however, company could delay retirement if continuation of employment was in its best interest.
Normal benefits:Eligibility: (1) Men at age 60 or
older and women at 55 or older, with at least 20 years’ service, (2) men at age 55 or older and women at age 50 or older, with 25 or more years o f service, or (3) any employee with 30 or more years of service.
Monthly annuities: 1/12 of 1 percent of annual average pay during 10 years preceding retirement, or—at company’s discretion—the 10 consecutive years during which employee received highest wages, times years of service.
Benefits to be reduced by one-half of social security benefits.
Minimum monthly pension: $30, e x c e p t fo r d is a b le d employees with less than 20 years’ service or part-time employees.
Disability benefits: Pension of employees with 15 or more years’ service, totally disabled as a result o f a non- occu pational sickness or injury, to be computed like normal benefits.
Retirement (except for men at age 60 and over and women at age 55 and over, with 20 years’ service) to be at the discretion of the committee administering the plan.
Continuity of service not to be broken for leaves of absence of less than 6 months or periods of disability or temporary layoff.
Deduction to be increased as social security benefits were raised by legislation.
Jan. 1, 1946 Increased: Minimum pensions, to $50.
May 9,1947 Company not to reduce benefits or privileges without union’s consent.
Nov. 16, 1949
Sept. 1, 1952
Increased: Minimum pensions,including total primary social security benefits, to $100 a month at age 65 or over and $75 a month below that age.
Changed: Minimum pensions, to include one-half primary social security benefits.
Digitized for FRASER http://fraser.stlouisfed.org/ Federal Reserve Bank of St. Louis

Effective date Provision Applications, exceptions, and other related matters
Pension plan—Continued
Dec. 31,1952 Changed: Service pension to be reduced by one-half Federal social security benefits (1 ) for employees retired before Sept. 1, 1952-by benefits provided by act as amended 1950; (2) foremployees retired after Aug. 31, 1952—by benefits ineffect on date of retirement.
Feb. 28,1959 ................................ Increased: Minimum pensions, to$115 a month at age 65 and over and $85 a month below that age.
Changed: Pensions to be based on greater of 1 percent of the average annual pay during the last or highest 5 years.
Jan. 1 ,1 9 6 1 .................................... Changed: Minimum pensions, foremployees age 65 and over, to (1) $115 a month for 20 but less than 30 years of service, (2) $120 for 30 but less than 40 years, and (3) $125 for 40 years or more.
Nov. 1, 1963 (agreement dated Oct. 25, 1963).
Added: Eligibility: Any employee age 65 with 15 or more years’ service.
Added: Minimum pensions: For employees age 65 with less than 20 years’ service-to be reduced proportionately.
Changed: Service and disability pensions: Benefits to bereduced by one-third of social security benefits.
Disability pension to be reduced by one-third disability insurance benefits (1) for employees retired before Nov. 2, 1973—by benefits provided by act in effect on Nov. 1, 1963; (2) for employees retired after Nov. 1, 1963-by benefits in effect on date of retirement.
Added: Survivors’ Option:Employee eligible for Class A p en s io n 16 could e lec t actuarially reduced pension and benefit to spouse or parent, at age 55, o f one- third o f reduced pension after employee’s death.
Widow of employee eligible for Class A pension who died before retirement to receive annuitant’s pension at age55.
Digitized for FRASER http://fraser.stlouisfed.org/ Federal Reserve Bank of St. Louis

Effective date Provision Applications, exceptions, and other related matters
Pension plan-Continued
Apr. 1, 1967 .................................... Changed: Service and disability p en sio n s-b en efits to be reduced by one-quarter of social security benefits.
June 1, 1969 (agreement dated July 16,1968).
Established: Vested pension- employee age 40 or more with 15 years of service or more entitled to a deferred pension at age 65.
June 1, 1969 (agreement dated July 16,1968).
Increased: Minimum pension-to $125 for 20 years or more of service.
Eliminated: Reduction of pension benefits because of social security benefits.
Oct. 1, 1971 (agreement of July 18,1971).
Increased: Pension formula to 1.5 percent per year for each year of service after age 55.
Changed: Early retirement eligibility to permit retirement at own request at age 55 after 20 years’ service, age 50 after 25 years and at any age after 30
Changed: Male and female employees to be treated equally with respect to retirement age.
Pensions for early retirement before age 55 for other than disability would be discounted at a rate of 0.5 percent for each month before age 55.
Changed: Elected and automatic survivor annuities to be paid on the same basis regardless of sex.
years. Changed: Widowers living with wives at time of death to receive death benefits on same basis as widows.
Increased: Minimum pensions to a range of $100 to $145 a month, depending on length of service and age.17
Digitized for FRASER http://fraser.stlouisfed.org/ Federal Reserve Bank of St. Louis

1 This table is limited to the provisions affecting operations (plant and traffic) central office and gang employees. The last entry under each item represents the most recent change.
2 The following holidays, in effect July 5,1952, were in addition to the 5 basic holidays authorized for all areas:
Area Washington’sBirthday
MemorialDay
ColumbusDay
ArmisticeDay Other
Alabama...................................................................... — X — —Arizona........................................................................ X X — XArkansas...................................................................... - X - XCalifornia .................................................................... X X - - Admission DayColorado...................................................................... X X - XConnecticut.................................................................. X X - - Good FridayDelaware...................................................................... X X - -District of Columbia.................................................. X X - X Inauguration DayFlorida ........................................................................ - X - -Georgia........................................................................ - X - -Idaho ............................................................................. X X - XIllinois.......................................................................... X X — -Indiana........................................................................ X X - -Io w a ............................................................................. X X - -Kansas.......................................................................... X X - XKentucky .................................................................... - X - -
6 counties.................................................................Louisiana:
Except New Orleans and Lafayette ....................
X
Jefferson Davis’ BirthdayNew Orleans and Lafayette .................................. - - - - Mardi Gras
Maine .......................................................................... X X - X Patriots’ DayMaryland...................................................................... X X - XMassachusetts ............................................................. X X X X Patriots’ DayMichigan...................................................................... - X - -Minnesota............................................... *................. X X - -Mississippi.................................................................... - X - -Missouri........................................................................ X X - XM ontana...................................................................... - X - -Nebraska...................................................................... X X - -Nevada ........................................................................ X X - -New Hampshire........................................................... X X X X Fast and Election DaysNew Jersey .................................................................. X X X - Lincoln’s Birthday and
New Mexicc ............................................................... X X XElection Day
New Y o rk .................................................................... X X X X Lincoln’s Birthday and
North Carolina ........................................................... XElection Day
North Dakota ............................................................. X X - -Ohio ............................................................................. X X - -Oklahoma.................................................................... - X - XOregon ........................................................................ X X - -Pennsylvania.................................................................... X X - XRhode Island .................................................................... X X X X Victory DaySouth Carolina ............................................................... - X - -
South Dakota .................................................................. - X - -
Tennessee ......................................................................... - X - -Texas ................................................................................... - X - X
El Paso County o n ly ................................................... X - - -Utah ................................................................................... - X - X Pioneer DayV erm o n t......................................... .................................. X X X X Battle o f Bennington DayV irginia.............................................................................. X X - XW ashington....................................................................... X X - -West V irginia.................................................................... X X - XWisconsin ........................................................ ................. - X - -W yoming..................................................... ................. X X - X
Digitized for FRASER http://fraser.stlouisfed.org/ Federal Reserve Bank of St. Louis

3 The following holidays, in effect July 16,1968, were in addition to the 5 basic holidays authorized for all areas:
Area Washington’sBirthday
MemorialDay
ColumbusDay
Veterans’Day
GoodFriday Other
Alabama...................................................... _ X _ X XAlaska........................................................... - X — — X Alaska DayArizona........................................................ X X — X —Arkansas ...................................................... - X — X XCalifornia.................................................... X X — — — Admission DayColorado...................................................... X X — X —Connecticut ............................................... X X X — — Fast DayDelaware...................................................... X X — * X _District of Columbia.................................. X X - X — Inauguration DayFlorida........................................................ — X — X XGeorgia........................................................ - X - X XIdaho ........................................................... X X — X —
Illinois:St. Clair and Madison Countys (except cities of Belleville, Mascoutah,Edwardsville and Highland).................. X X — —Belleville and Mascoutah....................... — X — XEdwardsville and Highland and counties other than St. Clairand Madison ........................................... X X — — — Lincoln’s Birthday
Indiana........................................................ X X — — XIow a ............................................................. X X - — XKansas ........................................................ — X — X XKentucky:
Pendleton, Grant, Galletin, Campbell,Kenton, and Boone Counties................ X X - X XOther Counties ...................................... — X - X X
Louisiana:New Orleans and L afayette.................. - - X X Mardi GrasOther than New Orleans andLafayette.................................................. - - - X X Jefferson Davis’ Birthday
M aine........................................................... X X - X — Patriots* DayMaryland:
Greenbelt, Silver Spring, Mt.Rainier, and Cheltenham....................... X X X - Inauguration DayOther than Greenbelt, Silver Spring,Mt. Rainier, and Cheltenham................ X X — X —
Massachusetts............................................. X X X X — Patriots’ DayMichigan...................................................... X X — — XMinnesota.................................................... X X — — XMississippi.................................................... — X — X XMissouri ...................................................... — X — X XMontana...................................................... — X — _ _Nebraska...................................................... X X _ _ XNevada ........................................................ X X — — _New Hampshire ......................................... X X X X — Fast and Election DaysNew Jersey................................................. X X X * X — Election DayNew M exico ............................................... X X — X _New Y ork .................................................... X X X X - Lincoln’s Birthday and
North Carolina........................................... X X XElection Day
North D akota............................................. X X — _ XO h io ............................................................. X X _ _ XOklahoma.................................................... - X — X XOregon ........................................................ X X — — XPennsylvania............................................... X X — X _Rhode Island ............................................. X X X X — Victory DaySouth Carolina........................................... — X — X XSouth D akota............................................. — X — X XTennessee.................................................... — X — X XTexas:
El Paso County ...................................... X X — XOther counties......................................... — X — X X
U ta h ............................................................. - X - X — Pioneer DayVermont......................................................Virginia:
Arlington, Dranesville, and Garden
X X X X - Battle of Bennington Day
C ity ........................................................... X X X Inauguration DayOther than Arlington, Dranesville,and Garden City .................................... X X _ X _
Washington.................................................. X X — _ XWest Virginia ............................................. X X — _ XWisconsin.................................................... X X _ XWyoming .................................................... X X - X -
* Effective 1969.Digitized for FRASER http://fraser.stlouisfed.org/ Federal Reserve Bank of St. Louis

4 The following holidays, in effect July 18, 1971, were in addition to the 5 basic holidays authorized for all areas:
Area Washington’sBirthday
MemorialDay
ColumbusDay
Veterans’Day
GoodFriday
Fridayafter
ThanksgivingOther
Alabama .................................... (a) X _ X £ _Alaska........................................ X (a) — <°) (a) Alaska DayArizona...................................... X X X (a) —Arkansas.................................... (a) X — X X —California .................................. X X (c) — — (a)Colorado.................................... X X X (a) —Connecticut................................ X X X — — Fast DayDelaware.................................... X X — X (a) —District of Columbia................ X X — X (a) — Inauguration DayFlorida ...................................... (a) X — X X —Georgia...................................... (a) X — X X --Idaho........................................... X X — X (a)Illinois:
Belleville and Mascoutah . . . (a) X X XOther than Belleville andMascoutah ............................. X X
■(a) Lincoln’s
Birthday
Indiana:Lawrenceburg......................... X X — — X (!) Christmas EveOther than Lawrenceburg . . . — X — — X (c)
Iowa ........................................... X X — (a) X —Kansas......................................... (a) X — X X —Kentucky:
Pendleton, Grant, Galletin, Campbell, Kenton, andBoone counties.......................Other coutn ies.......................
X(a)
XX
XX
XX
Louisiana:New Orleans, Lafayette,and Bogalusa ......................... (a) — X X Mardi Gras DayOther than New Orleans,Lafayette, and Bogalusa . . . .
Maine ........................................(a)X
XX
XX
XPatriots’ Day
Maryland:Greenbelt, Silver Spring, Mt. Rainier and
(a)Cheltenham ........................... X X X Inauguration DayOther than Greenbelt, Silver Spring, Mt. Rainier,and Cheltenham.................... X X — X (a) —
Massachusetts ........................... X X X X — Patriots’ DayMichigan.................................... X X ■ — — X (a)Minnesota.................................. X X — (a) X —
Mississippi.................................. (a) X — X X —Missouri...................................... (a) X — X X —Montana .................................... (a) X — (a) X —Nebraska.................................... X X — (a) X —Nevada ...................................... X X — — Nevada DayaNew Hampshire......................... X X X X — Fast Day and
Election DayNew Jersey ................................ X X X X — — Election DayNew Mexico ............................. X X — X (a) —New Y o r k .................................. X X X X Lincoln’s Birth
day and Election Day
North Carolina ......................... (a) X — X X —North Dakota ........................... X X — (a) X —Ohio ...........................................Oklahoma..................................
X(a)
XX I X
XX
(a)Oregon ...................................... X X (a) — (?) (a)Pennsylvania............................. X X — X (a) —Rhode Island............................. X X X X — — Victory DaySouth Carolina ......................... (a) X — X X —
South Dakota ........................... (a) X — X X —
Tennessee .................................. (a) X — X X —
Texas:El Paso County....................... X X — X (a) —
Other counties....................... (a) X — X X —
Utah ........................................... X — X (a) — Pioneer DayV erm ont.................................... X X X X
"
Battle of Bennington Day
Virginia:Arlington, Dranesville,
(a)and Garden C ity .................... X X X Inauguration DayOther than Arlington, Dranesville, and GardenCity ........................................ X X — X (a) —
Washington................................ X X (a) — (b) (a)West Virginia............................. X X (a) X —
Wisconsin .................................. — X — X (c) Christmas EveaWyoming.................................... X X — X (a)
aEffective in 1973.^Eliminated in 1973.cEffective in 1972. 67
Digitized for FRASER http://fraser.stlouisfed.org/ Federal Reserve Bank of St. Louis

FOOTNOTES— Continued5 Two sessions constitute a tour (or day) of duty.6 Sick leave pay for employees scheduled to work 6 days in week was as follows:
Sessions* paid for according to number o f scheduled days worked in week
No days 1 day 2 days 3 days 4 days 5 days 6 daysYears of service worked worked worked worked worked worked worked
2 but less than 5 years........... 6 4 2 2 0 0 05 but less than 10 years......... 8 6 4 4 2 0 010 years or m ore.................... 10 8 6 6 4 2 0
*2 sessions constitute a tour (or day) of duty.
7 Benefits provided as follows:
Annual basic pay Amount o f insuranceBut Accidentalless death or Employee
A t least than Life disability Total contribution
- $2,000 $2,000 $2,000 $4,000 $0.50$2,000 3,000 3,000 3,000 6,000 1.00
3,000 4,000 4,000 4,000 8,000 1.50and so forth, and so forth, and so and so
by $1,000 steps by $1,000 steps forth, by forth, by$2,000 steps $0.50 steps
8 Benefits provided as follows- .Annual basic pay Amount of insurance
But Accidentalless death or Employee
A t least than Life disability Total contribution
$3,000 $3,000 $3,000 $ 6,000 $0.5083.000 4,000 4,000 4,000 8,000 1.00
4,000 5,000 5,000 5,000 10,000 1.50and so forth, and !50 forth, and so and so
by $1,000 steps by $1.,000 steps forth, by forth, by$2,000 steps $0.50 steps
9 Under the terms of this plan, dependents were separated into 2 classes: Class 1 included the spouse of a regular or retired employee and children under 19 or, if attending school full time, under 23; Class 2 included unmarried children over 19 (or over 23 if at school) and grandchildren, brothers, sisters, parents, grandparents, and parents and grandparents of spouse who were dependent upon participant for support, had resided in participant’s household for at least 6 consecutive months, and had incomes of less than $1,200 from any source other than participant.
10 Benefits provided as follows:
Annual basic pay Amount o f insuranceBut Accidentalless death or Employee
A t least than Life disability Total contribution
$3,000 $3,000 $3,000 $ 6,000 $0.4083,000 4,000 4,000 4,000 8,000 0.804,000 5,000 5,000 5,000 10,000 1.20
and so forth, and !50 forth, and so and soby $1,000 steps by $1.,000 steps forth, by forth, by
$2,000 steps $0.40 steps
11 Blue Shield benefits vary according to States, but for the most part are similar to benefits provided in the New York Plan.12 Fee per day of routine care: 1st through 7th day-$7; 8th through 14th day-$6; 15ththrough70thday-$5;71st through 120th
day-$4.Fee per day of intensive care (provided in lieu of routine care allowance if serious illiness occurred): 1st and 2d day-$20; 3d
through 21st day-$8; 22d through 70th day-$5; 71st through 120th day-$4.13 Fee per day for treatment of tuberculosis, nervous and mental conditions, etc.: 1st through 7th day-$7; 8th through 14th
day-$6; 15th through 30th day-$5.
Digitized for FRASER http://fraser.stlouisfed.org/ Federal Reserve Bank of St. Louis

Annual basic pay Amount o f insurance
ButAccidental
death orless dismember- Employee
A t least than Life ment Total contribution
- $3,000 $3,000 $3,000 $ 6,000 $0.35$3,000 4,000 4,000 4,000 8,000 0.704,000 5,000 5,000 5,000 10,000 1.05and so forth, and so forth, and so and so
by $1,000 steps by $1,000 steps forth, by $2,000 steps
forth, by $0.35 steps
15 Benefits for sickness were as follows:
TotalWeeks at Weeks at
Service credit full pay half pay
Under 6 months.................................. 0 06 months but less than 2 years......... 0 522 years but less than 5 years ........... 4 485 years but less than 15 years ......... 13 3915 years but less than 20 years . . . . 26 2620 years but less than 25 years . . . . 39 1325 years or m o r e ............................... 52 0
16 Class A pension applied to all employees age 65 with 15 years or more service or male employees age 60 or more (females 55 or more) with 20 years’ service.
17 Minimum pension benefits were:
Under age 65:20 or more years’ service ....................................$100 a month
At age 65:20 but less than 30 years’ service .......................135 a month30 but less than 40 years’ service ...................... 140 a month40 or more years’ service ....................................145a month
Digitized for FRASER http://fraser.stlouisfed.org/ Federal Reserve Bank of St. Louis

Wage chronologies
The following wage chronologies are currently being maintained. Bulletins or reports for which a price is indicated are available from the Superintendent of Documents, U.S. Government Printing Office, Washington, D.C. 20402, or from the regional offices of the Bureau of Labor Statistics listed on the inside back cover. (Order by check or money order; do not send cash or stamps.) Publications for which no price is indicated and those designated as out of print are not available from the Superintendent of Documents but may be obtained, as long as supplies are available, from the Bureau of Labor Statistics, Washington, D.C. 20212, or from the Bureau’s regional offices. Out-of-print items also may be available for reference in leading public, college, or university libraries.
Before July 1965, basic wage chronologies and their supplements were published in the Monthly Labor Review and released as Bureau reports. Wage chronologies published later are available only as bulletin (and their supplements). Summaries of general wage changes and new or changed working practices are added to bulletins as new contracts are negotiated.
Aluminum Company of America—Nov. 1939-May 1974, BLS Bulletin 1815. (Price not available.)
American Viscose (a division of FMC Corp.)—1945-67, BLS Bulletin 1560.1June 1968-June 1974, Supplement to BLS Bulletin 1560 (free).
The Anaconda Co.—1941-58, BLS Report 197.1
Armour and Company-1941-72, BLS Bulletin 1682 (50 cents).
Atlantic Richfield Co. (former Sinclair Oil Companies’ facilities)—1941-72, BLS Bulletin 1771 (75 cents).January 1973-January 1975, Supplement to BLS Bulletin 1771 (free).
Berkshire Hathaway Inc.—1943-69, BLS Bulletin 1541.11969-71, Supplement to BLS Bulletin 1541 (free).
Bethlehem Atlantic Shipyards—1941-68, BLS Bulletin 1607 (35 cents).1969-72, Supplement to BLS Bulletin 1607 (free).
Bituminous Coal Mine Operators and United Mine Workers of America—October 1933-November 1974, BLS Bulletin 1799 (70 cents).
The Boeing Co. (Washington Plants)—1936- 67, BLS BuEetin 1565.1
Commonweath Edison Co. of Chicago and International Brotherhood of Electrical Workers— April 1945-March 1974, BLS Bulletin 1808 (85 cents).
Dan River Inc.—May 1943-January 1972, BLS Bulletin 1767 (35 cents).
Federal Classification Act Employees—1924-68, BLS Bulletin 1604 (70 cents).August 1968-October 1973, Supplement to BLS Bulletin 1604 (free).
Firestone Tire and Rubber Co. and B. F. Goodrich Co. (Akron Plants)—1937- 73, BLS Bulletin 1762 (50 cents).
Digitized for FRASER http://fraser.stlouisfed.org/ Federal Reserve Bank of St. Louis

Ford Motor Company—June 1941-September 1973, BLS Bulletin 1787 ($1).
International Harvester Company—1946-70, BLS Bulletin 1678 (65 cents).1970-73, Supplement to BLS Bulletin 1678 (free).
International Paper Co., Southern Kraft Division—1937-73, BLS Bulletin 1788 (55 cents).
International Shoe Co. (a division of Interco, Inc.)—1945-74, BLS Bulletin 1718 (30 cents).
Lockheed-California Company (a division of Lockheed Aircraft Corp.) —1937-67, BLS Bulletin 1522.1
Martin-Marietta Corp.—1944- 64, BLS Bulletin 1449.11965-68, Supplement to BLS Bulletin 1449 (free).
Massachusetts Shoe Manufacturers and United Shoe Workers of America (AFL-CIO)—January 1945-January 1975, BLS Bulletin 1800 (60 cents).
New York City Laundries—1945- 64, BLS Bulletin 1453.11965-72, Supplement to BLS Bulletin 1453 (free).
North American Rockwell Corp.—1941-67, BLS Bulletin 1564.11967- 70, Supplement to BLS Bulletin 1564 (free).
North Atlantic Longshoremen—1934-71, BLS Bulletin 1736 (50 cents).
Pacific Coast Shipbuilding—1941- 67, BLS Bulletin 1605.1
Pacific Gas and Electric Co.—1943-73, BLS Bulletin 1761 (50 cents).
Pacific Longshore Industry—1934-70, BLS Bulletin 1568.1
Swift & Co.—1942- 73, BLS Bulletin 1773 (85 cents).
United States Steel Corporation-March 1937-April 1974, BLS Bulletin 1814. (Price not available.)
Western Greyhound Lines—1945-67, BLS Bulletin 1595.11968- 72, Supplement to BLS Bulletin 1595 (free).
Western Union Telegraph Co.—1943- 67, BLS Bulletin 1545.11968-71, Supplement to BLS Bulletin 1545 (free).
1 Out of print. See Directory o f Wage Chronologies, 1948-72, for Monthly Labor Review in which reports and supplements issued before July 1965 appeared.
Digitized for FRASER http://fraser.stlouisfed.org/ Federal Reserve Bank of St. Louis

BUREAU OF LABOR STATISTICS REGIONAL OFFICES
Region I1603 JFK Federal Building Government Center Boston, Mass. 02203 Phone: 223-6762 (Area Code 617)
Region IISuite 34001515 BroadwayNew York, N.Y. 10036Phone: 971-5405 (Area Code 212)
Region IIIP.O. Box 13309Philadelphia, Pa. 19101Phone: 597-1154 (Area Code 215)
Region IVSuite 5401371 Peachtree St., NE.Atlanta, Ga. 30309Phone: 526-5418 (Area Code 404)
Region V8th Floor, 300 South Wacker DriveChicago, III. 60606Phone: 353-1880 (Area Code 312)
Region VI1100 Commerce St., Rm. 6B7Dallas, Tex. 75202Phone: 749-3516 (Area Code 214)
Regions VII and VIII *Federal Office Building 911 Walnut St., 15th Floor Kansas City, Mo. 64106 Phone: 374-2481 (Area Code 816)
Regions IX and X **450 Golden Gate Ave.Box 36017San Francisco, Calif. 94102 Phone: 556-4678 (Area Code 415)
Regions VII and VIII are serviced by Kansas City Regions IX and X are serviced by San Francisco
Digitized for FRASER http://fraser.stlouisfed.org/ Federal Reserve Bank of St. Louis