bls_0497_1929.pdf
TRANSCRIPT

UNITED STATES DEPARTMENT OF LABORJAMES J. DAVIS, Secretary
BUREAU OF LABOR STATISTICSETHELBERT STEWART, Commissioner
BULLETIN OF THE UNITED STATES \ BU REAU OF L A B O R S T A T IS T IC S / * * • • No. 497
W A G E S A N D H O U R S O F L A B O R S E R I E S
WAGES AND HOURS OF LABORIN THE LUMBER INDUSTRY INTHE UNITED STATES : 1928
S./ v \
OCTOBER, 1929
UNITED STATES
GOVERNMENT PRINTING OFFICE
WASHINGTON ; 1929
For sale by the Superintendent of Documents, Washington, D. C. - - - Price 15 cents
Digitized for FRASER http://fraser.stlouisfed.org/ Federal Reserve Bank of St. Louis

Digitized for FRASER http://fraser.stlouisfed.org/ Federal Reserve Bank of St. Louis
CONTENTS
P a wIntroduction and summary_______________________________________________ 1Average and classified earnings per hour, 1910 to 1928___________________ 6Regular or customary hours of operation_________________________________ 9Changes in wage rates since June 1, 1925_________________________________ 14Changes in full-time hours per week______________________________________ 15Bonus system_____________________________________________________________ 16Pay for overtime and work on Sunday and holidays, 1928________________ 17Index numbers of employment and of pay rolls, 1923 to 1928____________ 18Days of operation and of idleness________________________________________ 19Days of operation of head saws______________________________________ _____ 19Lumber produced in the United States in 1926___________________________ 23Importance of the lumber industry_______________________________________ 25Occupations_______________________________________________________________ 26General tables:
Table A.— Average number of days on which employees worked, average full-time and actual hours, and earnings per week, average earnings per hour, and per cent of full time worked, 1928, by occupation and State___________________________________________________ 28
Table B.— Average and classified earnings per hour in eight specified occupations, 1928, by State___________________________________ 37
T able C.— Average and classified full-time hours per week in eightspecified occupations, 1928, by State________________ _____________ 42
T able D.— Average and classified hours actually worked in one weekin eight specified occupations, 1928, by State______________________ 45
T able E.— Average and classified actual earnings in one week ineight specified occupations, 1928, by State________________________ 50
Wages and hours in logging camps in 1928:T able F.— Number of employees, full-time hours per week, and rates
of wages in logging camps, 1928, by State and occupation_________ 55m
Digitized for FRASER http://fraser.stlouisfed.org/ Federal Reserve Bank of St. Louis

Digitized for FRASER http://fraser.stlouisfed.org/ Federal Reserve Bank of St. Louis
BULLETIN OF THE
U. S. BUREAU OF LABOR STATISTICSn o . 497 WASHINGTON o c t o b e r , 1929
WAGES AND HOURS OF LABOR IN THE LUMBER INDUSTRY IN THE UNITED STATES, 1928
INTRODUCTION AND SUMMARY
During the summer of 1928 the Bureau of Labor Statistics made a study of wages and hours of labor of wage earners in the lumber industry in the United States.1 The data compiled cover 58,007 employees of 319 representative sawmills in 22 States and 6,968 employees of 51 logging camps in 10 States. Only 18 of the employees in the sawmills and 29 of those in the logging camps were females. The States are those in which sawmills and logging camps were, according to the 1926 Census of Manufactures, sufficient in number of wage earners to warrant inclusion in this report, and in which the production of sawmills was 94 per cent of the total in all States. Wage figures for employees of sawmills are presented on page 2 and for employees of logging camps on page 55.
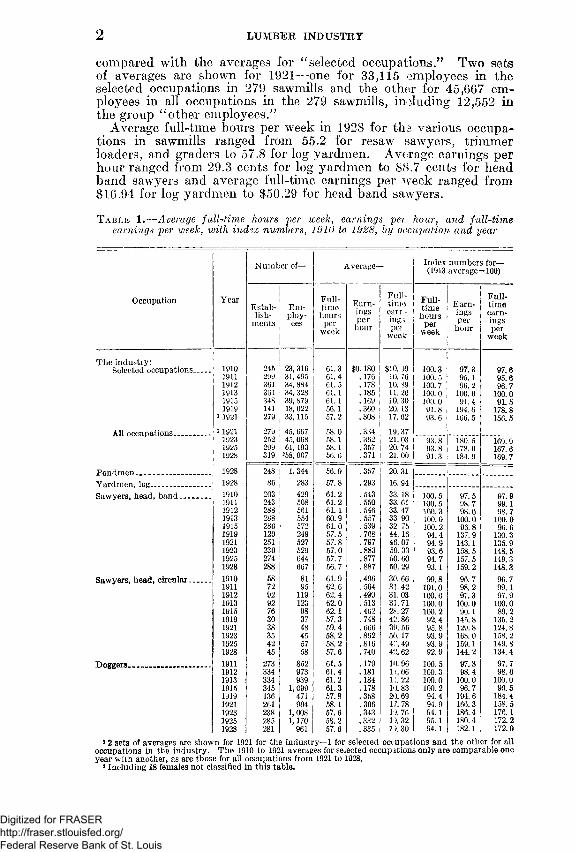
Summaries of average full-time hours per week, of average earnings per hour and of average full-time earnings per week are presented at the beginning of Table 1 for all of the employees that have been included in the study of sawmills, or the industry, in each of the specified years from 1910 to 1928. The averages for the industry are followed by like figures for each of the most important occupations in sawmills, and also for a group designated as “ other employ ees.”
Average full-time hours per week for the wage earners of sawmills, or the industry, were 56.6 in 1928 and 58.1 in 1925, a decrease of 1.5 hours per week, or 2.6 per cent. Average earnings per hour were37.1 cents in 1928 and 35.7 cents in 1925, an increase of 1.4 cents per hour, or 3.9 per cent. Average full-time earnings per week were $21 in 1928 and $20.74 in 1925, an increase of 26 cents per week over the 1925 average or 1.3 per cent. The percentage increase of average full-time earnings per week was less than the increase of average earnings per hour because of the decrease in average fulltime hours per week from 58.1 in 1925 to 56.6 in 1928.
The industry averages for the specified years from 1910 to 1921 are for the employees in “ selected occupations” only and are comparable, one year with another. Those for the years 1921 to 1928 are for “ all occupations,” including the group designated in the table as “ other employees,” and are also comparable but should not be
* Earlier reports of the bureau relating to wages and hours in the lumber industry may be found in the Nineteenth Annual Report and in Bulletins Nos. 59, 65, 71, 77, 129, 153, 225, 265, 317, 363, and 413.
1
Digitized for FRASER http://fraser.stlouisfed.org/ Federal Reserve Bank of St. Louis
2 LUMBER INDUSTRY
compared with the averages for “ selected occupations.” Two sets of averages are shown for 1921— one for 33,115 employees in the selected occupations in 279 sawmills and the other for 45,667 employees in all occupations in the 279 sawmills, including 12,552 in the group “ other employees.”
Average full-time hours per week in 1928 for the various occupations in sawmills ranged from 55.2 for resaw sawyers, trimmer loaders, and graders to 57.8 for log yardmen. Average earnings per hour ranged from 29.3 cents for log yardmen to 88.7 cents for head band sawyers and average full-time earnings per week ranged from $16.94 for log yardmen to $50.29 for head band sawyers.
T a b l e 1.— Average full-time hours per week, earnings per hour, and full-time earnings per week, with index numbers, 1910 to 1928, by occupation and year
Occupation Year
Number of— Average- Index numbers for— (1913 average=100)
Establish
ments
Employees
Fulltime
hoursper
week
Earningsper
hour
Fulltimeearring;;pei
week:
Fulltimehours
perweek
Earningsper
hour
Fulltimeearningsper
week
The industry:Selected occupations........ 1910 245 23,316 61.3 $0.180 $10.99 100.3 97.3 97.6
1911 299 31, 495 61.4 .176 10. 76 100.5 95.1 95.61912 361 34, 884 61.5 .178 10. S9 100.7 96.2 96.71913 361 34, 328 61.1 .185 11. 26 100.0 100.0 100.01915 348 39, 879 61.1 .169 10. 30 100.0 91.4 91.51919 141 18, 022 56.1 .360 20.13 91.8 194.6 178.8
i 1921 279 33,115 57.2 .308 17. 82 93.6 166.5 156.5All occupations_________ i 1921 279 45, 667 58.0 .334 19.37
1923 252 45, 068 58.1 .362 21.03 93.8 180.5 169.91925 299 61,193 58.1 .357 20. 74 93.8 178.0 167.61928 319 258, 007 56.6 .371 21.00 91.3 184.9 169.7
P ondm en..________________ 1928 248 1, 344 56.9 .357 20.31Yardmen, log_______________ 1928 86 283 57.8 .293 16. 94Sawyers, head, band.............. 1910 203 429 61.2 .543 33. 18 100.5 97.5 97.9
1911 243 508 61.2 .550 33. 61 100.5 98.7 99.11912 288 561 61.1 .546 33. 47 100.3 98.0 98.71913 288 554 60.9 .557 33 90 100.0 100.0 100.01915 286 572 61.0 .539 32 75 100.2 96.8 96.61919 120 249 57.5 .768 44.16 94.4 137. 9 130.31921 251 527 57.8 .797 46. 07 94.9 143.1 135.91923 230 529 57.0 .883 50. 33 93.6 158.5 148.51925 274 644 57.7 .877 50. 60 94.7 157.5 149.31928 288 667 56.7 .887 50.29 93.1 159.2 148.3
Sawyers, head, circular.......... 1910 58 81 61.9 .496 30. 66 99.8 96.7 96.71911 72 95 62.6 .504 31.42 101.0 98.2 99.11912 92 119 62.4 .499 31.03 100.6 97.3 97.91913 92 123 62.0 .513 31.71 100.0 100.0 100.01915 76 98 62.1 .462 28. 27 100.2 90.1 89.21919 30 37 57.3 .748 42.86 92.4 145. 8 135.21921 38 48 59.4 .666 39. 56 95.8 129.8 124.81923 35 45 58.2 .862 50.17 93.9 168.0 158.21925 42 57 58.2 .816 47.49 93.9 159.1 149.81928 45 58 57.6 .740 42. 62 92.9 144.2 134.4
Doggers____________________ 1911 273 852 61.5 .179 10. 96 100.5 97.3 97.71912 334 973 61.4 .181 11. 06 100.3 98.4 98.61913 334 939 61.2 .184 11. 22 100.0 100.0 100.01915 345 1,099 61.3 .178 10. 83 100.2 96.7 96.51919 136 471 57.8 .358 20. 69 94.4 194.6 184.41921 261 904 58.1 .306 17. 78 94.9 166.3 158.51923 238 1,008 57.6 .343 1). 76 94.1 186.4 176.11925 285 1,170 58.2 .332 U 32 95.1 180.4 172.21928 281 961 57.6 .335 19. 30 94.1 182.1 172.0
12 sets of averages are shown for 1921 for the Industry—1 for selected occupations and the other for all occupations in the industry. The 1910 to 1921 averages for selected occup itions only are comparable one year with another, as are those for all occupations from 1921 to 1928.
a Including 18 females not classified in this table.
Digitized for FRASER http://fraser.stlouisfed.org/ Federal Reserve Bank of St. Louis
INTRODUCTION AND SUMMARY 3T a b l e 1.— Average full-time hours per week, earnings per hour, and full-time
earnings per week, with index numbers, 1910 to 1928, by occupation and year— Continued
Occupation Year
Number of— Average- Index numbers for— (1913 average ==100)
Establish
ments
Employees
Fulltimehours
perweek
Earningsper
hour
Fulltimeearningsper
week
Fulltimehours
perweek
Earningsper
hour
Fulltimeearningsper
week
Setters....... ................................ 1911 301 714 61.3 .251 15.30 100.5 97.3 97.41912 361 780 61.3 .250 15.29 100.5 96.9 97.31913 361 782 61.0 .258 15.71 100.0 100.0 100.01915 348 687 61.2 .239 14.56 100.3 92.6 92.71919 141 311 57.0 .446 25. 42 93.4 172.9 161.81921 279 673 57.6 .412 23. 73 94.4 159. 7 151.11923 251 706 57.0 .474 27.02 93.4 183.7 172.01925 299 832 57.5 .458 26. 34 94.3 177.5 167.71928 313 742 56.5 .468 26.44 92.6 181.4 168.3
Saw tailers on head saws____ 1921 276 586 57.7 .326 18. 811923 252 677 57.0 .364 20. 751925 299 786 57.3 .349 20. 001928 305 738 56.4 .355 20. 02
Sawyers, gang.......................... 1910 52 64 61.4 .309 18.88 100.0 99.4 99.31911 66 74 61.6 .306 18.77 100.3 98.4 98.71912 71 79 61.7 .307 18. 86 100.5 98.7 99.21913 71 80 61.4 .311 19. 02 100.0 100.0 100.01915 81 93 61.8 .289 17. 74 100.7 92.9 93.31919 34 46 56.2 .520 29. 22 91.5 167. 2 153. 61921 61 82 56.8 .482 27. 38 92.5 155. 0 144.01923 55 80 56.1 .584 32. 76 91.4 187. 8 172.21925 75 110 57.9 .581 33. 64 94.3 186.8 176.91928 76 121 56.1 .533 29.90 91.4 171.4 157.2
Sawyers, resaw........................ 1911 98 149 60.7 .252 15. 24 100.0 96.6 96.61912 138 197 60.7 .254 15.41 100.0 97.3 97.71913 138 192 60.7 .261 15. 77 100.0 100. 0 100.01915 152 215 60.9 .240 14. 57 100. 3 92.0 92.41919 67 111 55.2 .471 26. 00 90.9 180. 5 164.91921 145 239 55.8 .403 25.84 91.9 177.4 163. 91923 131 259 55.7 .493 27. 46 91.8 188.9 174.11925 152 296 55.9 .489 27. 34 92.1 187.4 173.41928 173 346 55.2 .475 26. 22 90.9 182.0 166.3
Edgemen............................... . 1910 245 585 61.2 .255 15. 58 100.3 95.1 95.71911 299 684 61.3 .260 15. 86 100. 5 97.0 97.41912 361 751 61.2 .262 15.97 100.3 97.8 98.11913 361 754 61.0 .268 16. 28 100.0 100.0 100.01915 348 756 61.0 .252 15. 32 100.0 94.0 '94.11919 140 314 57.5 .450 25.88 94.3 167.9 159.01921 278 727 57.5 .437 25.13 94.3 163.1 154.41923 252 738 57.1 .492 28. 09 93.6 183.6 172.51925 298 911 57.8 .468 27.05 94.8 174.6 166.21928 318 923 56.7 .470 26. 65 93.0 175.4 163.7
Edger tailers_______________ 1928 272 708 56. 7 .319 18. 09
Transfer men_________ -____ 1928 172 708 55. 5 .341 18. 93
Trimmer loaders___________ 1928 216 630 55.2 .379 20. 92
Trimmer operators................. 1910 228 503 61.0 .209 12.71 100.0 96.3 96.31911 228 485 61.0 .211 12.85 100.0 97.2 97.31912 346 511 61.2 .209 12. 73 100.3 96.3 96.41913 346 538 61.0 .217 13. 20 100.0 100.0 100.01915 345 564 61.1 .203 12. 34 100.2 93.5 93.51919 139 273 57.3 .405 23. 21 93.9 186. 6 175.81921 277 530 57.0 .380 21.66 93.4 175.1 164.11923 252 504 56.9 .430 24.47 93.3 198.2 185.41925 299 600 57.7 .409 23. 60 94.6 188.5 178.81928 318 585 55.8 .429 23. 94 91.5 197.7 181.4
Off-bearers (except on headsaws)_____________________ 1928 208 860 55.9 .317 17. 72
Graders ______________ 1928 292 1, 562 55.2 .503 27. 77
Sorters_____________________ 1928 274 4,138 55.5 .357 19. 81
Truckers................. ................. 1928 293 3,137 57.3 .323 18.51
Digitized for FRASER http://fraser.stlouisfed.org/ Federal Reserve Bank of St. Louis
4 LUMBER INDUSTRY
T a b l e 1.— Average full-time hours per week, earnings per hour, and full-time earnings per week, with index numbers, 1910 to 1928, by occupation and year— Continued
Occupation Year
Number of— A verage- Index numbers for— (1913 average=100)
Establish
ments
Employees
Full-timehours
perweek
Earningsperhour
Fulltimeearningsper
week
Fulltimehours
perweek
Earningsper
hour
Fulltimeearningsper
week
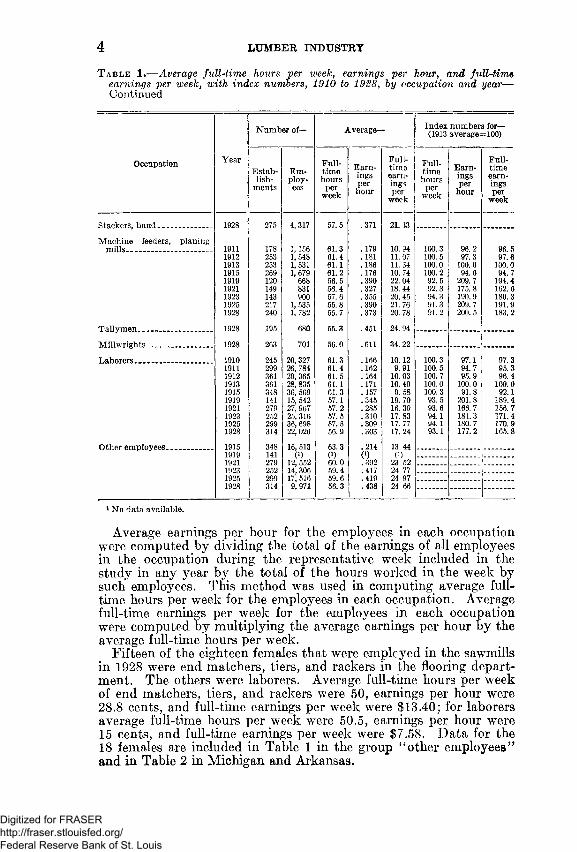
Stackers, hand ____________ 1928 275 4,317 57.5 .371 21. 33
Machine feeders, planingmills.........- ............................ 1911 178 1,156 61.3 .179 10.94 100.3 96.2 96.5
1912 253 1, 548 61.4 .181 11.07 100. 5 97.3 97.61913 253 1,531 61.1 .186 11. 34 100.0 100.0 100.01915 269 1, 679 61.2 .176 10. 74 100.2 94.6 94.71919 120 668 56.5 .390 22. 04 92.5 209.7 194.41921 149 831 56.4 .327 18. 44 92.3 175. 8 162.61923 143 900 57.6 .355 20. 45 94.3 190.9 180. 31925 217 1, 535 55.8 .390 21. 76 91.3 209.7 191. 91928 240 1, 782 55.7 .373 20. 78 91.2 200.5 183.2
Tallymen__________________ 1928 195 680 55.3 .451 24. 94
Millwrights________________ 1928 263 701 56.0 .611 34. 22
Laborers-................................ 1910 245 20,327 61.3 .166 10.12 100.3 97.1 97.31911 299 26, 784 61.4 . 162 9. 91 100.5 94.7 95.31912 361 29, 365 61.5 .164 10. 03 100.7 95.9 96.41913 361 28, 835 61.1 .171 10.40 100.0 100.0 100.01915 348 36, 569 61.3 .157 9. 58 100.3 91.8 92.11919 141 15, 542 57.1 .345 19. 70 93.5 201.8 189.41921 279 27,967 57.2 .285 16. 30 93.6 166.7 156. 71923 252 25, 316 57.5 .310 17. 83 94.1 181.3 171.41925 299 36, 698 67.5 .309 17. 77 94.1 180.7 170.91928 314 22,026 56.9 .303 17. 24 93.1 177.2 165.8
Other employees___________ 1915 348 16, 513 63.3 .214 13 441919 141 0 ) 0 ) 0 ) 0 )1921 279 12, 552 60.0 .392 23 521923 252 14,306 59.4 .417 24 771925 299 17, 516 59.6 .419 24 971928 314 9,971 56.3 .438 24 66
1 No data available.
Average earnings per hour for the employees in each occupation were computed by dividing the total of the earnings of all employees in the occupation during the representative week included in the study in any year by the total of the hours worked in the week by such employees. This method was used in computing average fulltime hours per week for the employees in each occupation. Average full-time earnings per week for the employees in each occupation were computed by multiplying the average earnings per hour by the average full-time hours per week.
Fifteen of the eighteen females that were employed in the sawmills in 1928 were end matchers, tiers, and rackers in the flooring department. The others were laborers. Average full-time hours per week of end matchers, tiers, and rackers were 50, earnings per hour were28.8 cents, and full-time earnings per week were $13.40; for laborers average full-time hours per week were 50.5, earnings per hour were15 cents, and full-time earnings per week were $7.58. Data for the 18 females are included in Table 1 in the group “ other employees” and in Table 2 in Michigan and Arkansas.
Digitized for FRASER http://fraser.stlouisfed.org/ Federal Reserve Bank of St. Louis
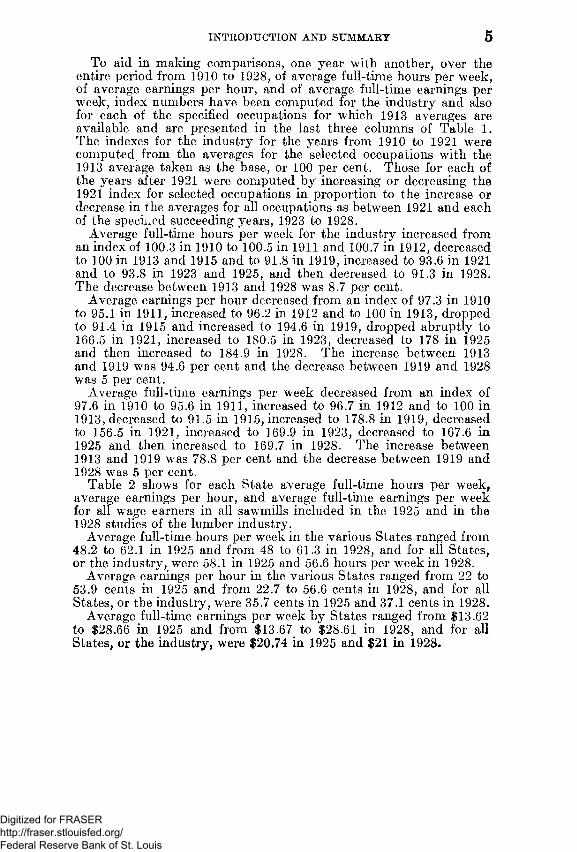
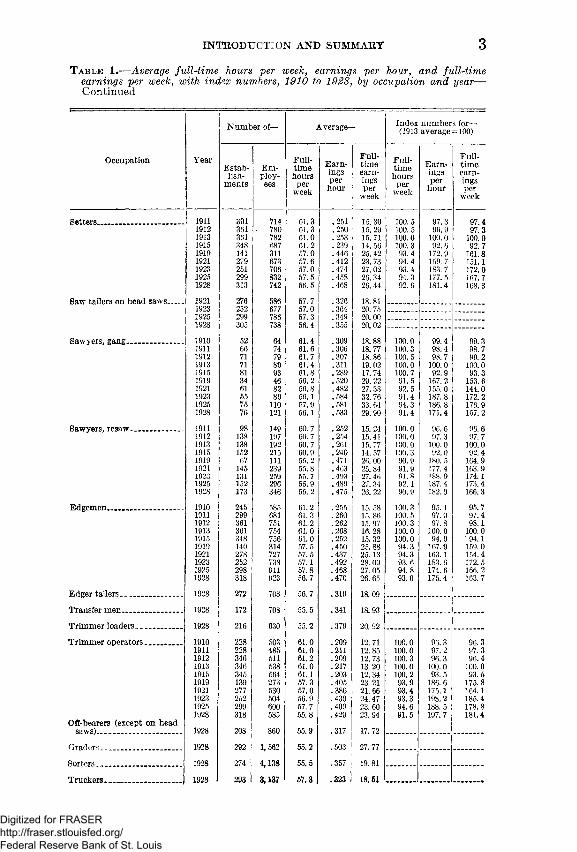
INTRODUCTION AND SUMMARY 5To aid in making comparisons, one year with another, over the
entire period from 1910 to 1928, of average full-time hours per week, of average earnings per hour, and of average full-time earnings per week, index numbers have been computed for the industry and also for each of the specified occupations for which 1913 averages are available and are presented in the last three columns of Table 1. The indexes for the industry for the years from 1910 to 1921 were computed from the averages for the selected occupations with the 1913 average taken as the base, or 100 per cent. Those for each of the years after 1921 were computed by increasing or decreasing the 1921 index for selected occupations in proportion to the increase or decrease in the averages for all occupations as between 1921 and each of the specked succeeding years, 1923 to 1928.
Average full-time hours per week for the industry increased from an index of 100.3 in 1910 to 100.5 in 1911 and 100.7 in 1912, decreased to 100 in 1913 and 1915 and to 91.8 in 1919, increased to 93.6 in 1921 and to 93.8 in 1923 and 1925, and then decreased to 91.3 in 1928. The decrease between 1913 and 1928 was 8.7 per cent.
Average earnings per hour decreased from an index of 97.3 in 1910 to 95.1 in 1911, increased to 96.2 in 1912 and to 100 in 1913, dropped to 91.4 in 1915 and increased to 194.6 in 1919, dropped abruptly to 166.5 in 1921, increased to 180.5 in 1923, decreased to 178 in 1925 and then increased to 184.9 in 1928. The increase between 1913 and 1919 was 94.6 per cent and the decrease between 1919 and 1928 was 5 per cent.
Average full-time earnings per week decreased from an index of 97.6 in 1910 to 95.6 in 1911, increased to 96.7 in 1912 and to 100 in 1913, decreased to 91.5 in 1915, increased to 178.8 in 1919, decreased to 156.5 in 1921, increased to 169.9 in 1923, decreased to 167.6 in1925 and then increased to 169.7 in 1928. The increase between 1913 and 1919 was 78.8 per cent and the decrease between 1919 and 1928 was 5 per cent.
Table 2 shows for each State average full-time hours per week, average earnings per hour, and average full-time earnings per week for all wage earners in all sawmills included in the 1925 and in the 1928 studies of the lumber industry.
Average full-time hours per week in the various States ranged from 48.2 to 62.1 in 1925 and from 48 to 61.3 in 1928, and for all States, or the industry, were 58.1 in 1925 and 56.6 hours per week in 1928.
Average earnings per hour in the various States ranged from 22 to53.9 cents in 1925 and from 22.7 to 56.6 cents in 1928, and for all States, or the industry, were 35.7 cents in 1925 and 37.1 cents in 1928.
Average full-time earnings per week by States ranged from $13.62 to $28.66 in 1925 and from $13.67 to $28.61 in 1928, and for all States, or the industry, were $20.74 in 1925 and $21 in 1928.
Digitized for FRASER http://fraser.stlouisfed.org/ Federal Reserve Bank of St. Louis

6 LTTMBER INDUSTRY
T a b l e 2.— Average hours and earnings, 1925 and 1928, by State
State
Number of establish
mentsNumber of em
ployees
Averagefull-timehours per
week
Avf rage earnings per hour
Average fulltime earnings
per week
1925 1928 1925 1928 1925 1928 1925 1928 1925 1928
Alabama............................... 18 21 3,606 3, 747 61.6 60.5 $0. 236 $0. 243 $14. 54 $14. 70Arkansas............................. 19 15 4, 912 4, 250 60.9 59.2 . 2S5 .303 17. 36 17. 94California ........... ............... 9 14 2, 706 3, 496 57.2 66.1 .501 .510 28. 66 28.61Florida........ ......................... 14 12 2, 938 2, 321 61.1 61.3 .294 . 261 17. 96 16.00Georgia................................ 14 19 1,746 1,813 61.2 59.3 .233 .244 14. 26 14. 47Idaho. .................... ........... 4 5 1, 240 1, 769 48.4 48.0 .510 .547 24. 68 26. 26Kentucky............................. 14 9 891 435 59.4 57.2 .327 .349 19. 42 19. 96Louisiana............. ......... . 20 18 6,141 5, 214 62.1 59.4 .288 .286 17. 88 16. 99Maine.......................... ........ 12 12 1,167 732 58.1 58.9 .349 .354 20. 28 20. 85Michigan.............................. 14 23 1, 897 2, 381 60.3 59.0 .384 .387 23.16 22. 83Minnesota............. ......... . 4 4 1,983 1,860 60.8 60.4 .391 .409 23. 77 24.70Mississippi................ ......... 16 16 4, 760 4, 835 60.9 59.6 .285 .290 17. 36 17. 28Montana________________ 4 5 979 1,142 51.0 50. 7 .490 .488 24. 99 24. 74North Carolina................. 19 23 2,376 2,030 61.3 60.2 .247 .260 15.14 15. 65Oregon............. ..................... 10 14 4, 068 4, 362 48.2 48.4 . £39 .. 566 25. 98 27. 39South Carolina..... .............. 11 10 2,146 1,962 61.9 60.2 .220 .227 13. 62 13. 67T ennessee..______ ______ 20 20 1, 731 1,646 58.6 58.2 .304 .320 17.81 18. 62Texas.................................... 9 11 2, 602 2, 502 61.6 58.3 .300 .299 18. 48 17. 43Virginia......... ....................... 12 18 1, 629 850 60.5 59. 7 . £77 . 295 16. 76 17. 61Washington.. ...................... 22 21 6, 913 7, 283 48.4 48.1 ..'30 .552 25. 65 26. 55West Virginia...................... 14 10 1, 220 828 60.3 60.1 .396 .409 23. 88 24. 58Wisconsin.—........... ............ 14 19 2, 769 2, 549 60.1 59.6 . £73 .363 22. 42 21. 63
Total.......................... 299 319 61,193 58,007 58.1 56.6 .£57 .371 20. 74 21.00
AVERAGE AND CLASSIFIED EARNINGS PER HOUR, 1910 TO 1928
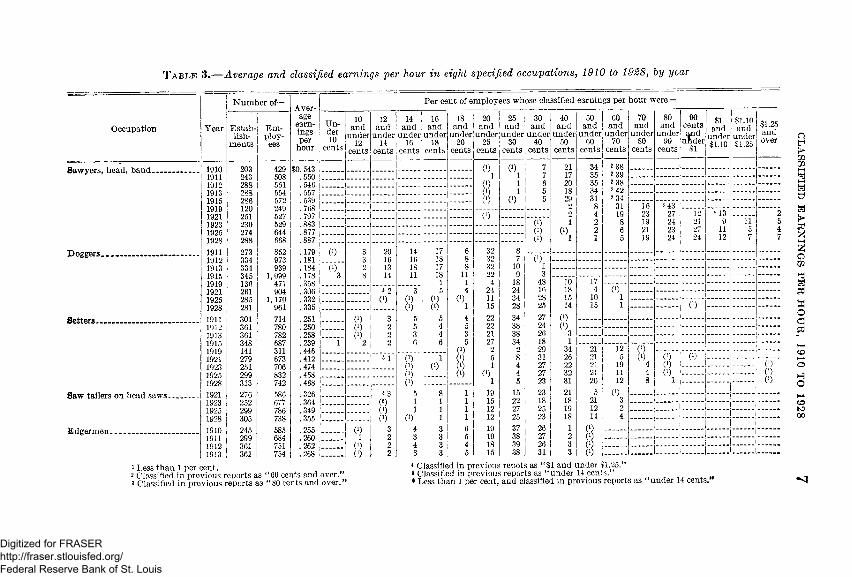
Average and classified earnings per hour are presented in Table 3 for the wage earners in each of eight of the most important occupations in sawmills for each of the specified years from 1910 to 1928 for which data are available. The figures for the employees in these occupations also represent the trend and spread of average and classified earnings per hour of employees in all other occupations in the sawmills that have been included in the various studies of the sawmills or lumber industry during these years. The same figures are shown for each State for the employees in the eight occupations in Table B (pp. 37 to 41) for 1928.
Average earnings per hour of head band sawyers, the first occupation in the table, increased from 54.3 cents in 1910 to 88.3 cents in 1923, decreased to 87.7 cents in 1925 and then increased to 88.7 cents per hour in 1928. Average earnings per hour of doggers, the second occupation in the table, increased from 17.9 cents in 1911 to 35.8 cents in 1919, decreased to 30.6 cents in 1921 and increased to 33.2 in 1925 and to 33.5 cents per hour in 1928.
The classification or percentage distribution of the employees in the table by average earnings per hour is to a considerable extent graphic in effect in that it shows a large per cent of them in the low classified earning groups in the years from 1910 to 1915, as compared with a very small per cent in the same groups in the years from 1919 to 1928. Example— in the years from 1910 to 1915 the per cent of head band sawyers that earned less than 50 cents per hour ranged from 24 in 1913 to 34 per cent in 1915, while in the years from 1919 to 1928, the per cent was 2 or less.
Digitized for FRASER http://fraser.stlouisfed.org/ Federal Reserve Bank of St. Louis
T a b l e 3 .— Average and classified earnings per hour in eight specified occupations, 1910 to 1928, by year
Occupation
Sawyers, head, band.
Doggers.
Setters..
r tailers on head saws.
Edgermen.
Year
1910191119121913 1915 1919 1921 1923 1925 1928191119121913 1915 1919 1921 1925 1928191119121913 1915 1919 1921 1923 1925 1928 1921 1923 1925 19281910191119121913
Number of—
Establish
ments
203243288288286120251230274288273334334345136261285281301361361348141279251 299 313 276252 299 305 245 299 361 361
Employ-
429508561554572249527529644668852973939
1,099471904
1,170961714780782687311673706832742586677786738585684751754
Average
earningsper
hour
$0. 543 .550 .546 .557 . 539 .768 .797 .883 .877 .887.179 .181 . 184 . 178 .358 .306 .332 .335.251.250.258.239.446.412.474.458.468.326.364.349.355.255.260.262.268
Per cent of employees whose classified earnings per hour were—
Under10
cents
10and
under12
cents
12and
under14
cents
14and
under16
cents
1 Less than 1 per cent.2 Classified in previous reports as ‘3 Classified in previous reports as '
60 cents and over.”‘ 80 cents and over. ”
« 20 )
53(6)0 )0 )
3222
0)0 )
553
0)0)0 )0 )
511
0)434
16and
under18
cents
18and
under20
cents
17181718 1 5
0 )0
544
0
811140145 3 5
0 )000)
20and
under25
cents
323232224
24 11 152222212725 1
01
1915121219191815
25and
under30
cents
(01110
30and
under40
cents
0
40and
under50
cents
2117 2018 29221
01
10181514
0)031
34262232312118191812
50and
under60
cents
21212121205
211214
000)0 )
60and
under70
cents
2 39 2 38 2 42 2 34
31 19
011
125
191112
03 24
70and
under80
cents
andunder
90cents
00
44
3 43 27 242324
90centsiMid
under$1
$1and
under$1.10
0
$1.10and
under$1.25
$1.25andover
C1)0 )0)
4 Classified in previous repots as “ $1 and under $1.25.”4 Classified in previous reports as “ under 14 cents.”• Less than 1 per cent, and classified in previous reports as “ under 14 cents.”
CLASSIFIED
EARN
ING
S PER
HO
UR
, 1910
TO 1928
Digitized for FRASER http://fraser.stlouisfed.org/ Federal Reserve Bank of St. Louis

T a b l e 3 .— Average and classified earnings per hour in eight specified occupations, 1910 to 1928, by year— Continued 00
Occupation
Edgermen (continued).
Trimmer operators..
Machine feeders, planing m ill.
Laborers.
Year
Number of—Aver
ageearningsper
hour
Per cent of employees whose cIs
Establish
ments
Employees
Under10
cents
1 10 and undei
12 cents
12and
■ under 14
cents
14and
■ under 16
cents
16and
under18
cents
1 18 and under
20 cents
20and
■ under 25
cents
25 and
■ under 30
cents
30and
under40
cents
1915 348 756 .252 1 3 2 4 5 6 21 31 241919 140 314 .440 1 0) 2 3 301921 278 727 .437 * 1 1 1 1 3 8 341923 252 738 .492 0) 0 2 4 271925 298 911 .468 0 0) 0) 1 5 241928 318 923 .470 0 3 5 261910 228 503 .209 (0 2 9 7 11 8 38 17 71911 228 485 .211 2 9 7 11 6 38 19 71912 346 511 .209 3 7 11 11 6 37 17 61913 346 538 .217 3 5 10 10 5 38 19 91915 345 564 .203 2 4 8 9 13 10 33 13 81919 139 273 .405 0 0 1 3 7 411921 277 530 .381 4 2 2 3 2 11 12 291925 299 600 .409 0) 1 0) 0 7 11 301928 318 585 .429* 0 0 0 0 8 10 271911 178 1,156 . 179 4 13 18 25 7 21 11 21912 253 1,548 .181 0 4 16 13 23 10 22 10 21913 253 1, 531 .186 0 3 12 17 22 9 22 11 41915 269 1, 679 .176 2 9 16 15 17 9 20 10 31919 120 668 .390 (6) 0 1 1 6 12 381921 149 831 .327 « 1 2 5 4 22 17 151923 143 900 .355 (6) (!) 1 2 17 19 261925 217 1, 535 .390 0) 0 1 0 2 10 18 231928 240 1,782 .373 0 0 1 1 2 11 19 211910 245 20,327 .166 3 14 13 12 18 11 26 3 0) .iyii 2yy ■A), 7S4 . 162 2 14 16 17 20 8 20 o 0 •1912 361 29, 365 .164 1 13 17 17 20 7 20 4 11913 361 28, 835 .171 1 9 17 17 17 9 24 5 11915 348 36, 569 .157 7 17 13 16 17 9 17 4 11919 141 15, 542 .345 (6) 1 1 1 12 19 361921 279 27, 968 .285 *9 13 9 2 18 9 251923 252 25, 316 .310 0 0 1 4 6 4 26 16 151925 299 36, 698 .309 0 0 1 2 4 3 26 19 191928 314 22,026 .303 0 0 1 3 4 3 27 17 17
40and
under50
cents
2526 37 3111111
29232919
0)0)0)1624142117
0)00
14131718 19
50and
under60
cents
0142
1066
60and
under70
cents
70 80 and and
under under 80 90
cents cents
0 100 11
0)0)0 11
90centsand
under$1
0)111
(7)
0
0)
$1and
under$1.10
$1.10and
under$1.25
0
$1.25andover
0)
0)00
0
i Less than 1 per cent.* Classified in previous reports as “ 80 cents and over/* 5 Classified in previous reports as “ under 14 cents.”
• Less than 1 per cent, and classified in previous reports as under 14 cents.”• Less than 1 per cent, and classified in previous reports as “ 80 cents and over /'• Less than 1 per cent, and classified in previous reports as “ 60 cents and over.”
LUMBER
IND
USTR
Y
Digitized for FRASER http://fraser.stlouisfed.org/ Federal Reserve Bank of St. Louis
CLASSIFIED HOURS OF LABOR 9REGULAR OR CUSTOMARY HOURS OF OPERATION
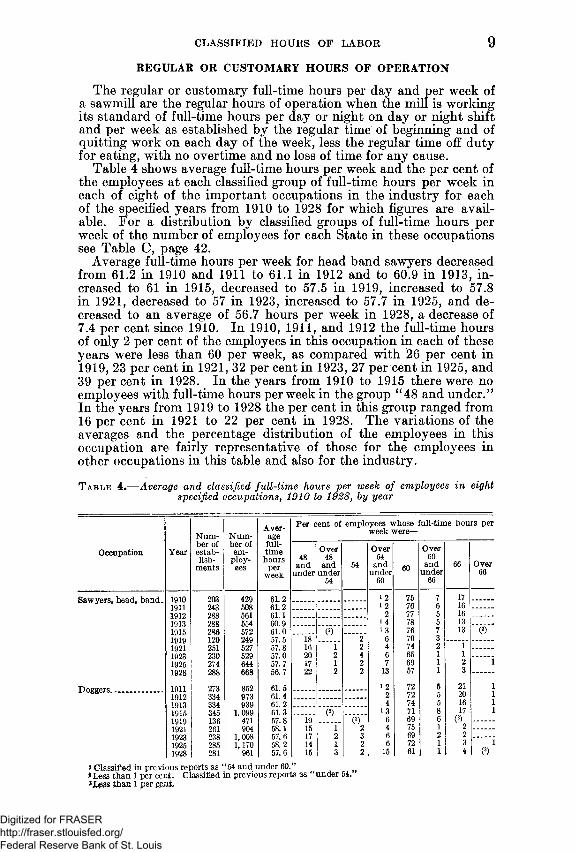
The regular or customary full-time hours per day and per week of a sawmill are the regular hours of operation when the mill is working its standard of full-time hours per day or night on day or night shift and per week as established by the regular time of beginning and of quitting work on each day of the week, less the regular time off duty for eating, with no overtime and no loss of time for any cause.
Table 4 shows average full-time hours per week and the per cent of the employees at each classified group of full-time hours per week in each of eight of the important occupations in the industry for each of the specified years from 1910 to 1928 for which figures are available. For a distribution by classified groups of full-time hours per week of the number of employees for each State in these occupations see Table C, page 42.
Average full-time hours per week for head band sawyers decreased from 61.2 in 1910 and 1911 to 61.1 in 1912 and to 60.9 in 1913, increased to 61 in 1915, decreased to 57.5 in 1919, increased to 57.8 in 1921, decreased to 57 in 1923, increased to 57.7 in 1925, and decreased to an average of 56.7 hours per week in 1928, a decrease of 7.4 per cent since 1910. In 1910, 1911, and 1912 the full-time hours of only 2 per cent of the employees in this occupation in each of these years were less than 60 per week, as compared with 26 per cent in 1919, 23 per cent in 1921, 32 per cent in 1923, 27 per cent in 1925, and 39 per cent in 1928. In the years from 1910 to 1915 there were no employees with full-time hours per week in the group “ 48 and under.” In the years from 1919 to 1928 the per cent in this group ranged from16 per cent in 1921 to 22 per cent in 1928. The variations of the averages and the percentage distribution of the employees in this occupation are fairly representative of those for the employees in other occupations in this table and also for the industry.
T a b l e 4.— Average and classified full-time hours per week of employees in eight specified occupations, 1910 to 1928, by year
Occupation Year
Number of establish
ments
Number of em
ployees
Sawyers, head, band. 1910 203 4291911 243 5081912 288 5611913 288 5541915 286 5721919 120 2491921 251 5271923 230 5291925 274 6441928 288 668
Doggers........................ 1911 273 8521912 334 9731913 334 9391915 345 1,0991919 136 4711921 261 9041923 238 1,0081925 285 1,1701928 281 961
Average
Per cent of employees whose full-time hours per week were—
fulltime Over Over Overhours 48 48 54 60
and and 54 and AH and 66 Overweek under under under DU under 66
54 60 66
61.2 1 2 75 7 1761.2 1 2 76 6 166l! 1 2 77 5 1660.9 1 4 78 5 136l! 0 0 1 3 76 7 13 (3)57. 5 18 2 6 70 357! 8 16 1 2 4 74 2 157.0 20 2 4 6 65 1 157.7 17 1 2 7 69 1 2 156.7 22 2 2 13 57 1 3
61. 5 12 72 5 21 161.4 2 72 5 20 161. 2 4 74 5 16 161. 3 (2) 13 71 8 17 157. 8 19 (3) 6 69 6 (3)58!l 15 1 2 4 75 1 257.6 17 2 3 6 69 2 258.2 14 1 2 6 72 1 3 157.6 15 3 2 15 61 1 4 (3)
i Classified in previous reports as “ 54 and under 60.”*Less than 1 per cent. Classified in previous reports as “ under 54.4 Less than 1 per cent
Digitized for FRASER http://fraser.stlouisfed.org/ Federal Reserve Bank of St. Louis

10 LUMBER INDUSTRY
T a b l e 4,— Average and classified full-time hours per week of employees i n eight specified occupations, 1910 to 1928, by year— Continued
Occupation
Setters.,
Saw tailers on head
Edgermen..
Trimmer operators...
M a ch in e feeders, planing mills.
Laborers.
Year
191119121913 1915 1919 1921 1923 1925 1928
1921192319251928
1910191119121913 1915 1919 1921 1923 1925 1928
1910191119121913 1915 1919 1921 1923 1925 1928
191119121913 1915 1919 1921 1923 1925 1928
1910191119121913 1915 1919 1921 1923 1925 1928
Number of establish
ments
301361361348141279251 299313
276252 299 305
245299361361348140278 252298 318
228228346346345139277252299 318
178253 253 269 120 149 143 217 240
245299361361348141279 252 299314
Number of em
ploy-
714780782687311673706832742
677786738
585684751754756314727738911923
503 485 511 538 564 273 530504 600 585
1,156 1,548 1,531 1,679
668 831 900
1,535 1,782
20,32726, 784 29,365 28,835 36, 569 15,54227, 968 25,316 36,698 22,026
Averagefulltimehours
perweek
61.361.3 61.0 61.2 5^.057.657.057.556.5
57.757.057.356.4
61.261.3 61.261.0 61.057.5 5". 557.157.856.7
61.061.061.2 61.0 61.157.357.056.957.755.8
61.361.461.1 61.256.5 56.457.655.855.7
61.361.461.5 61.1 61.357.157.257.557.556.9
Per cent of employees whose ful!-.time hours per week were—
48and
under
Over48
andunder
54
54
Over54
andunder
60
60
Over60
andunder
66
66 Over66
1 1 75 6 17 12 75 6 16 1
i 3 78 5 12 1(’) i 3 73 7 15 2
23 5 6 62 5 (8)18 1 2 4 71 1 221 2 5 5 64 1 219 1 3 5 68 1 2 122 3 2 14 56 1 2
17 1 2 4 72 2 221 2 3 6 65 1 220 1 2 6 66 1 2 124 2 2 13 54 1 3
i 2 76 5 17 1i 1 76 5 17 1
2 76 6 16 1i 4 77 6 12 1
(2) i 3 *75 6 13 120 2 5 69 419 1 2 4 71 2 220 1 4 6 66 1 217 1 2 5 70 1 2 122 3 2 13 56 1 3 0
1 2 79 3 15 11 2 79 4 15 1
2 76 4 17 11 4 78 4 14 1
(2) 1 4 74 7 14 122 2 6 66 4 123 1 2 6 64 2 222 2 4 6 63 1 219 1 2 6 66 2 4 127 3 4 13 48 1 3 (3)
2 75 6 171 74 5 20 1
1 3 76 5 15 1i 1 76 6 16 1
29 2 3 60 5 130 1 1 67 1 (3)21 2 3 70 1 434 1 5 56 1 2 133 2 2 8 52 1 3 (*)
*3 74 5 18 1i l 73 7 18 1
2 72 5 21 11 3 76 6 14 1
(2) 1 2 75 6 16 224 2 3 66 4 1 (3)23 (3) 1 3 69 2 2 (3)19 1 3 4 69 2 2 (3)20 (*) 1 6 68 1 3 123 2 1 9 60 1 3 (*)
1 Classified in previous reports as “ 54 and under 60."* Less than 1 per cent. Classified in previous reports as “ under 64.”* Less than 1 per cent.
Digitized for FRASER http://fraser.stlouisfed.org/ Federal Reserve Bank of St. Louis

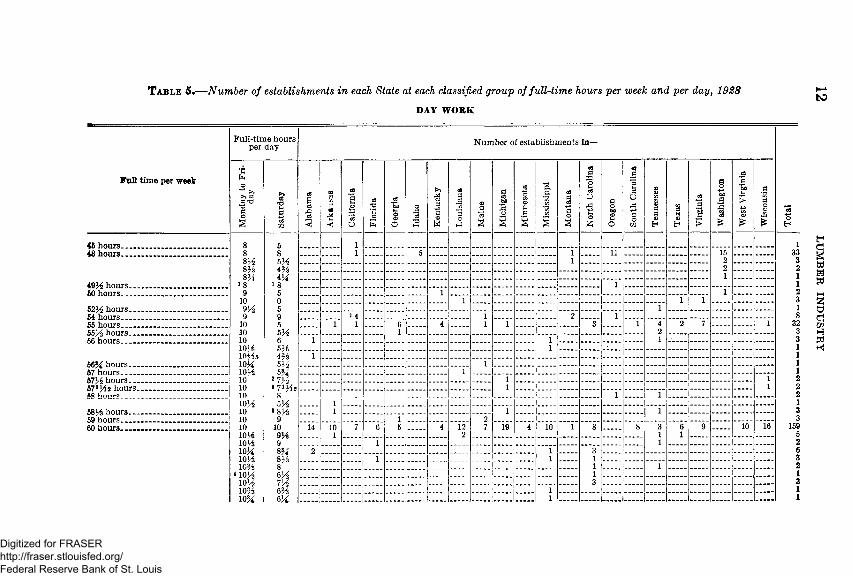
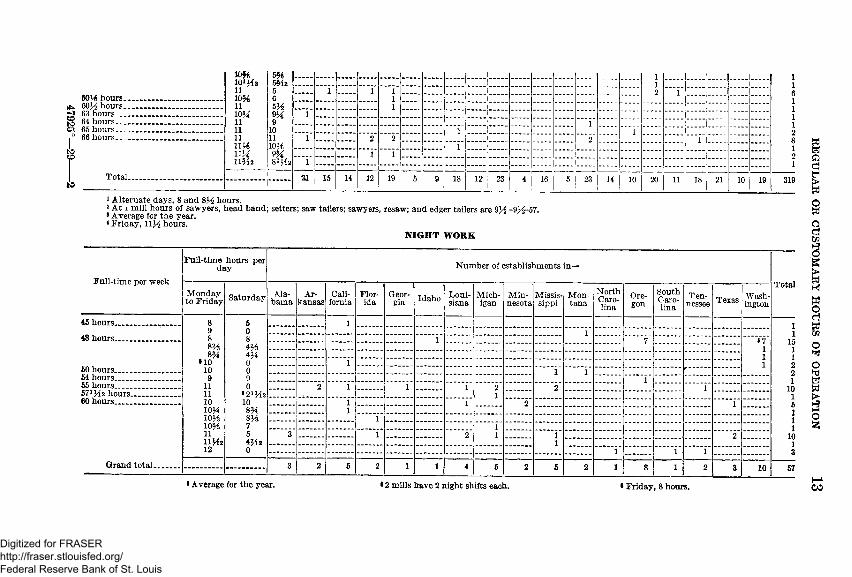
REGULAR OR CUSTOMARY HOURS OF OPERATION 11Table 5 shows for each sawmill in each State regular or customary
full-time hours per week and per day or nighty Monday to Friday, and Saturday, for 1928. All of the 319 mills included in the study had day shifts and 57 of them also had night shifts.
Hours per week for day work for the 319 mills ranged from 45 for the mill with the shortest to 66 for the 12 mills with the longest hours and for night work for the 57 mills ranged from 45 to 60 hours per week.
Hours per day, Monday to Friday, for day work ranged from 8 to l l % 2 and for night work ranged from 8 to 12 and on Saturdays for day work ranged from 4% to 11 and for night work ranged from 2 % to 10 hours. Three mills that had day shifts and 18 that had night shifts were 5-day-week mills, there being no work on Saturday.
Full-time hours per week were frequently the same for a considerable number of sawmills with much variation in hours per day. Example— the hours of 39 mills were 48 per week with 33 of them at 8 per day for 6 days, 3 at 8% for 5 days and 5% Saturday, 2 at 8% for 5 days and 4% Saturday, and 1 at 8% for 5 days and 4}i on Saturday.
Digitized for FRASER http://fraser.stlouisfed.org/ Federal Reserve Bank of St. Louis
T a b l e 5 .— Number of establishments in each State at each classified group of full-time hours per week and per day, 1928
DAY W ORK
Full time per week
45 hours. 48 hours.
49H hours. 60 hours..
523 hours. 64 hours...55 hours... 55H hours.56 hours...
56^ hours...57 hours------57H hours... 57H42 hours.58 hours____
58H hours.59 hours...60 hours...
Full-time hours per day Number of establishments in -
Ala
bam
a
1Ut< Ca
lifor
nia
Flor
ida
Geo
rgia
Idah
o
Ken
tuck
y
Loui
siana
J
Mai
ne
Mic
higa
n
Min
neso
ta
Mis
siss
ippi
Mon
tana
North
Ca
rolin
a
Ore
gon
Sout
h Ca
rolin
a
Tenn
esse
e
Texa
s
Vir
gini
a
Was
hing
ton
Wes
t V
irgi
nia
Wis
cons
in
[ Tot
al
1 11 5 1 11 15 33
1 2 32 21 1
1 11 1 2
1 1 1 31 1
2 4 1 2 1 81 1 6 4 1 1 3 1 4 2 7 1 32
1 2 31 1 1 3
1 11 1
1 11 1
1 1 21 1 2
1 1 21 11 1 1 3
1 2 314 10 7 6 6 4 12 7 19 4 10 1 8 8 3 6 9 10 16 159
1 2 1 1 51 1 2
2 1 3 61 1 1 3
1 1 21 13 3
1 11 1
•e©
efl 05 T3
aO2
8 Hm8%
10
5 Hm4 H
1 85 0 5 9
10 510 5 X10 610H 5HioMs 4%ioh VAm i 5%10 3 7 M10 »7»H*in R10H 5H10 •8^10 910 1010tt 9H10H 910H 8M10 H 8^10 H 8
U 0H 6K103 7H10% 6%103* 6 X
LUMBER
IND
USTR
Y
Digitized for FRASER http://fraser.stlouisfed.org/ Federal Reserve Bank of St. Louis
47925
60^ hours. 60K hours.63 hou rs...64 h ou rs...65 hours__66 hours__
Total..
10*610i1110*61110 H11 11 11i m 11M 11M 2
m :64 2565V29H9
101110H 9H 81H2
21 15 14 12 19 9 18 16 18 21 319
1 Alternate days, 8 and 8K hours.2 At 1 mill hours of sawyers, head band; setters; saw tailers; sawyers, resaw; and edger tailers are £ * Average for the year.4 Friday, 11^ hours.
N IG H T W O R K
-9M-57.
Full-time hours per day Number of establishments in—
itt! a nAr Totalx' uii“Hiiic yci w ccaM onday to Friday Saturday Ala
bamaAr
kansasCali
forniaFlorida
Georgia Idaho Loui
sianaM ichigan
M innesota
Mississippi
M ontana
NorthCarolina
Oregon
SouthCarolina
Tennessee Texas Wash
ington
45 hours............... .............. 8 5 1 1148 hours______ __________
9 0 18 8 1 7 *7
11
15m mm 4H 1
250 hours_______ _________• 10 0 1 1
10 0 1 1 254 hours____ ____________ 9 9 1 1101
55 hours___ _____________ 11 0 2 1 1 1 2 2 15 7 % hours____________ 11 »2iM 2 160 hours____ ____________ 10 10 1 1 2 1 5
10H 8 H 1 110*6 8H 1 110% 7 1 1
10111 5 3 1 2 1 1 2IIM2 4^2 112 0 1 1 1 3
Grand total______ 3 2 5 2 1 1 4 5 2 5 2 2 Q 0 O 1 AO 6 O J-U Of
* Average for the year. • 2 mills have 2 night shifts each. • Friday, 8 hours.
REGULAR OR
CUSTO
MARY
HOURS
OF O
PE
RA
TION
Digitized for FRASER http://fraser.stlouisfed.org/ Federal Reserve Bank of St. Louis

14 LUMBER INDUSTRY
CHANGES IN WAGE RATES SINCE JUNE, 1, 1925
Between June 1, 1925, and the period of the 1928 study of the industry 76 of the 319 sawmills made one or more changes in the wage rages of all or part of the wage earners of the mills.
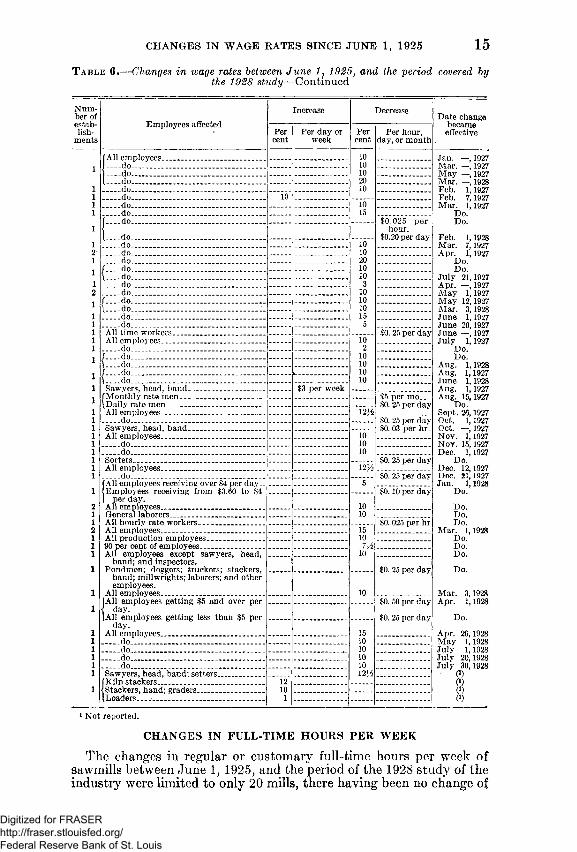
Table 6 shows the number of sawmills, the employees whose wage rates were increased or decreased, the per cent or amount of the increase or decrease, and the date when the change went into effect.
Only 5 of the 76 mills that made changes increased rates. One increased the rates of band sawyers February 9, 1926, 70 cents per day, of hand stackers 40 cents per day, and of all other employees 10 per cent; 1 increased the rates of all employees 6 per cent April 1, 1926, and 6 per cent August 1, 1928; 1 increased the rates of all employees 10 per cent February 7, 1927; 1 increased the rates of head band sawyers $3 per week August 1, 1927; and 1 increased the rates of kiln stackers 12 per cent July 30, 1928, of hand stackers and graders 10 per cent, and of loaders 1 per cent.
One mill made a reduction of 25 cents per day in the wage rates of all employees April 1, 1926, and increased the rates of hand stackers 25 cents per day January 1, 1928.
The wage rates of all or of part of the employees of 70 sawmills were reduced one or more times between June 1, 1925, and the time of the 1928 study. Reading part of the figures in the columns under “ Decrease” it is seen that the wage rates of all the employees of 4 mills were reduced 10 per cent July 1, 1925; that the rates of all employees of 1 mill were reduced 8 per cent January 1, 1926, 8 per cent December 24, 1927, and 8 per cent July 2, 1928; and that the rates ©f all employees of 1 mill were reduced 10, 10, 10, and 20 per cent.
T a b l e 6 .— Changes in wage rates between June 1, 1925, and the period covered bythe 1928 study
Num ber of establish
ments
Employees affected
All employees............................................Setters, saw tailers on head saws, edger-
men, edger tailers, graders, sorters, truckers, talleymen, deckmen, scalers, pipe fitters, and oilers.
All employees............................................. .,do._do_..dodo ._____________
___ do_______________Sawyers, head, band.Stackers, h an d ..........
.Other employees____All employees.............
.d o do................do________
f_-__do_________(.Stackers, hand. /A ll employees._ \___ do..
_do_..do.._do_._do_...do....do....do.._do....do.,.do..
Increase
Per Per day or cent week
10
0.70 per day 0.40 per day
10.25 per day
Decrease
Per Per hour, cent day, or month
$0.25 per day
.do.._do_..do..
:0.25 per day
10 10 10 12^ .5
1010101015
Id'0.50 per day
Date change became effective
July 1,1925 July 1,1925
Aug. 1,1925 Aug. 15,1925 Sept. 1,1925 Jan. 1,1926 Dec. 24,1927 July 2,1928 Feb. 9,1926
Do.Do.
Mar. 1,1926 Sept. 15,1926 Apr. 1,1926
1.19281.19261.19281.19261.1927
Aug.Apr.Jan.July Nov.Aug. 15,1 Dec. 30,1926 Jan. 1,1927
Do.Do.
Feb. 15,1927 July 1,1927 Jan. 1,1927
Do.Jan. 15,1927
Digitized for FRASER http://fraser.stlouisfed.org/ Federal Reserve Bank of St. Louis
CHANGES IN WAGE RATES SINCE JUNE 1, 1925 15T a b l e 6.— Changes in wage rates between June l y 1925, and the period covered by
the 1928 study— Continued
Increase DecreaseEmployees affected
Percent
Per day or week
Percent
Per hour, day, or month
f All employees_________________________ 10J___ do..... ...................................... 10|___ do........................................................ 101___ do........................................................... 20____ do_________________________________ 10____ do............................................................. 10____ do_________ ___________ ____________ 10____ do_____________________ _ _ __ __ 15(___ do_____________________ __________ $0,025 per
hour.$0.20 per dayI . . . . , , .............................................................
____ do__________________________________ 10____ do________ _____ ___ _______________ 10____ do__________________________________ 20r __do................ ........................................... 10{ ___ do ..................................... ................. 10........do._.......................................................... 3____ d o ............................................................. 10/ ___ d o .. . ......................................................... 10{ ___ do.__..................................................... . 10____ do__________________________________ 15____ do_________________________________ 5
$0.25 per dayAll employees__________________________ 10
____ d o „ ______________________________ 2/ ___ do...... ....................................................... 10{ ___ do__......................................... ............... 10r _do..................... ..................................... 10{ . . . . d o ............................................. ............. 10Sawyers, head, band___________________ $3 per week.
/M onthly rate men__ ___ ___ __ __ $5 per m o ... $0. 25 per day(Daily rate men ________ __ _____
All employees_____ ____________________ m i$0. 25 per day $0. 03 per hr.Sawyers, head, band___________________
All em ployees_________________________ 10____ d o _________________________________ 10____ do__________________________________ 10Sorters _ _ _ _ $0.25 per dayAll em ployees______________________ _ 12^
$0. 25 per day[All employees receiving over $4 per day 5< Employees receiving from $3.60 to $4 I per day.All employees__________________________
$0.10 per day10
General laborers______________________ 10All hourly rate workers________________ $0. 025 per hrAll employees____________ _____________ 15All production employees______________ 1090 per cent of employees............................. 7HAll employees except sawyers, head,
band; and inspectors.Pondmen; doggers; truckers; stackers,
hand; millwrights; laborers; and other employees.
All employees...............................................
10
$0. 25 per day
10[All employees getting $5 and over per { day.[All employees getting less than $5 per
day.All employees___ ______________________
$0. 50 per day
$0. 25 per day
15____ d o _________________________________ 10____ do___________ ____ _____ _______ ___ 10........do.................... ......................................... 10____ do............................................................. 10Sawyers, head, band; setters _________ 12*6
[Kiln stackers . . . ______ ______ 12•1 Stackers, hand; graders_________________ 10[Loaders.......................................... ............. 1
Number of establish
ment
Date change became
effective
Jan. —, 1927 Mar. —, 1927 M ay —, 1927 Mar. —, 1928 Feb. 1,1927 Feb. 7,1927 Mar. 1,1927
Do.Do.
Feb. 1,1928 Mar. 7,1927 Apr. 1,1927
Do.Do.
July 21,1927 Apr. —,1927 M ay 1,1927 M ay 12,1927 Mar. 3,1928 June 1,1927 June 20,1927 June —,1927 July 1,1927
Do.Do.
Aug. 1,1928 Aug. 1,1927 June 1,1928 Aug. 1,1927 Aug. 15,1927
Do.Sept. 26,1927 Oct. 1,1927 Oct. —,1927 Nov. 1,1927 Nov. 15,1927 Dec. 1,1927
Do.Dec. 12,1927 Dec. 21,1927 Jan. 1,1928
Do.
Do.Do.Do.
Mar. 1,1928 Do.Do.Do.
Do.
Mar. 3,1928 Apr. 1,1928
Do.
Apr. 26,1928 May 1,1928 July 1,1928 July 20,1928 July 30,1928 ' 0)
0)0)(l)
1 Not reported.
CHANGES IN FULL-TIME HOURS PER WEEK
The changes in regular or customary full-time hours per week of sawmills between June 1, 1925, and the period of the 1928 study of the industry were limited to only 20 mills, there having been no change of
Digitized for FRASER http://fraser.stlouisfed.org/ Federal Reserve Bank of St. Louis

16 LUMBER INDUSTRY
hours in 299 of the 319 mills covered in the latter year. Of the 20 mills, 10 increased and 10 decreased hours. The increases were: 6 mills from 60 to 66 hours per week, 1 from 50 to 60. 1 from 54 to 56%,1 from 48 to 54, and 1 from 48 to 50. The decreases were: 3 mills from 60 to 55 hours per week, 2 from 60 to. 50, 1 from 60 to 58, 1 from 57% to 55, 1 from 66 to 60, 1 from 60 to 52%, and 1 from 55 to 50.
BONUS SYSTEMS
Only 27 of the 319 mills reported bonus systems in effect at the time of the 1928 study. Bonuses varied in amounts and were paid to all or to only a specified part of the employees of a mill.
Twelve of the twenty-seven mills paid bonuses based on production, 4 on efficiency, 6 on attendance or full-time work; 1 furnished life insurance based on length of service, and 1 paid a bonus of 10 per cent of earnings at regular rates based on length of service. One mill paid a production bonus of 5 cents per M to the lath-mill crew for each M over a set standard per week and paid an efficiency bonus of 25 cents to $1 per day to graders, one paid a production bonus to sawyers, an efficiency bonus to graders, and a length-of-service bonus to a few skilled employees, and one paid an efficiency and an attendance bonus to sawmill and yard employees.
T a b l e 7.— Bonus systems of 27 sawmills, 1928
Number of mills
Basis of bonus Wage earners covered Amount of bonus
Production.. ____do...........
Production over a set standard per week.
Production over a set standard per hour.
[Production over a set standard per day.
.Efficiency......... ........ ....................Production over a set standard
per day.. . . . .d o ..............................................
..d o .Production over a set standard
per minute.........do........... .................................(Production over a set standard
per day.
Efficiency.......................................Length of service.................. ........Efficiency.......................................
........do..............................................
Efficiency and full-time attendance.
FulKime attendance............................d o . ....................................................do....... ..............................................d o . ....................................................do......................................................do..............................................Length of service..
____do.....................
Sawyers_____________ _______Feeders and trimmers in floor
ing mill.All productive employees........Shipping and loading crew___Band sawyers_______________
Scalers and yard crew..
Lath-mill crew............ .
Graders............. .Lath-mill crew..
fLath-mill boss____\Lath-mill crew____All employees____Planing-mill crew.
Dimention-mill crew.. Sawyers....................... .
Graders......................................A few skilled employees_____Stackers....... .............................Nearly all employees. .............Head millwright........ ..............Graders.....................................Sawmill and yard employees.
All employees........................... .Hourly workers______________Night force................................ .All employees on hourly rate..Yard employees_____________Setters, edgermen, pullers, ma
chine stackers, slotter feeders, and chute tenders.
All employees............................
.d o .
% cent per M.0 ).
0 .0 ).10 nents per M .
10 cents per M .
5 cunts per M.
25 cents to $1 per day.0 ).5 cents per M.2 cents per M .2 cents per M .0 )
0 ).20 to 25 cents per M.5 cants per hour.0 )4 c<mts per hour.Sliding scale.$25 per month.25 cents per day.Varies according to individual
efficiency.1 day’s pay extra per month.2 hours’ pay extra per week.5 hours’ pay extra per week.4 hours’ pay extra per week.$1.50 per week.5 eonts per hour.
Life insurance: After 1 year, $500; after 2 years, $700; after3 years, $1,000.
10 per cent of pay per day.
i Not reported.
Digitized for FRASER http://fraser.stlouisfed.org/ Federal Reserve Bank of St. Louis
OVERTIME WORK 17PAY FOR OVERTIME AND WORK ON SUNDAY AND HOLIDAYS, 1928
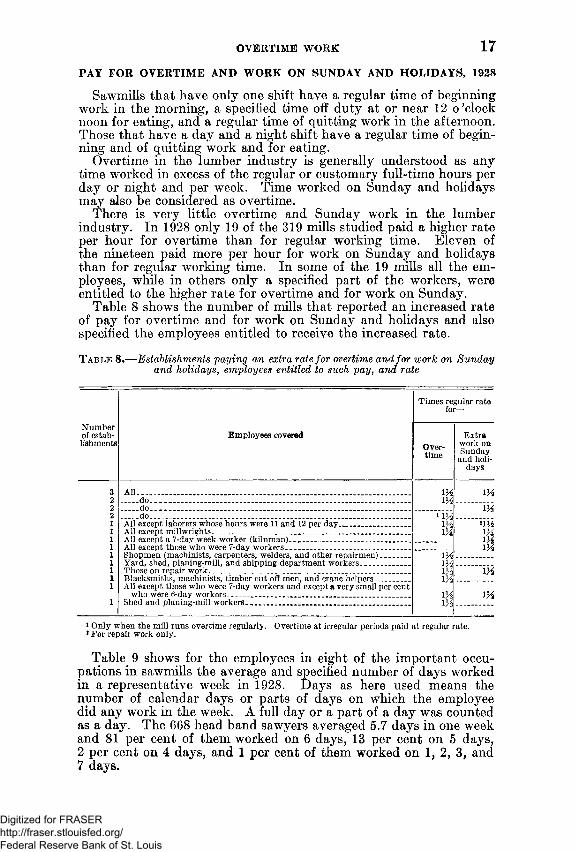
Sawmills that have only one shift have a regular time of beginning work in the morning, a specified time off duty at or near 12 o'clock noon for eating, and a regular time of quitting work in the afternoon. Those that have a day and a night shift have a regular time of beginning and of quitting work and for eating.
Overtime in the lumber industry is generally understood as any time worked in excess of the regular or customary full-time hours per day or night and per week. Time worked on Sunday and holidays may also be considered as overtime.
There is very little overtime and Sunday work in the lumber industry. In 1928 only 19 of the 319 mills studied paid a higher rate per hour for overtime than for regular working time. Eleven of the nineteen paid more per hour for work on Sunday and holidays than for regular working time. In some of the 19 mills all the employees, while in others only a specified part of the workers, were entitled to the higher rate for overtime and for work on Sunday.
Table 8 shows the number of mills that reported an increased rate of pay for overtime and for work on Sunday and holidays and also specified the employees entitled to receive the increased rate.
T a b l e 8,— Establishments paying an extra rate for overtime and for work on Sunday and holidays, employees entitled to such pay, and rate
Times regular rate for—
Number of establishments
Employees coveredOvertime
Extra work on Sunday
and holidays
3 A ll ........................................................................................................................... IX1 X
IX2 ____ do_________________________________________________________________2 ____ do...................... .......................................................................... ................... . IX2 ____ d o . . .______ ____________ ___________ __________ _______ ____________ 1 IX
IX IX
1 All except laborers whose hours were 11 and 12 per day__________________ *1H 1X1 All except millwrights........... .............................................. ..............................
1 All except a 7-day week worker (kilnman)_______ ____ _________________ IX1 All except those who were 7-day workers______ ______ ___ _____________ IX1 Shopmen (machinists, carpenters, welders, and other repairmen)_______ l Xi xl Xi x
i xIX
1 Yard, shed, planing-mill, and shipping department workers____________1 Those on repair work____ ____ __________ ___________ _ _________ IX1 Blacksmiths, machinists, timber cut-off men, and crane helpers_________1 All except those who were 7-day workers and except a very small per cent
who were 6-day workers___________________________________________ IX1 Shed and planing-mill workers________ ________________ ____ __________
1 Only when the mill runs overtime regularly. Overtime at irregular periods paid at regular rate.3 For repair work only.
Table 9 shows for the employees in eight of the important occupations in sawmills the average and specified number of days worked in a representative week in 1928. Days as here used means the number of calendar days or parts of days on which the employee did any work in the week. A full day or a part of a day was counted as a day. The 668 head band sawyers averaged 5.7 days in one week and 81 per cent of them worked on 6 days, 13 per cent on 5 days,2 per cent on 4 days, and 1 per cent of them worked on 1, 2, 3, and 7 days.
Digitized for FRASER http://fraser.stlouisfed.org/ Federal Reserve Bank of St. Louis
18 LUMBER INDUSTRY
T a b l e 9.— Average number of days and per cent of employees who worked on specified number of days per week in eight selected occupations, 1928
Average
Per cent of employees who worked—
Occupation
Number of establish
ments
Number of em
ployees
number of days
on which
employees worked in one week
1day
2days days
4days
5days
6days
7days
Sawyers, head, band_____________________ 288 668 5.7 1 1 1 2 13 81 1Doggers _ _ _______ ___________________ 281 961 5.2 4 3 4 8 20 59 2Setters ___ ______________________ 313 742 5.6 3 1 1 4 17 72 2Saw tailers on head saws_________________ 305 738 5.4 4 3 2 6 16 66 4Edgermen________ __________ __________ 318 923 5.5 3 2 2 4 16 69 3Trimmer operators_______________________ 318 585 5.6 2 1 2 5 16 69 5Machine feeders, planing mill____________ 240 1, 782 5.6 1 2 2 5 15 73 2Laborers___ ______________________ - ___ __ 314 22,026 5.3 3 4 5 7 16 63 2
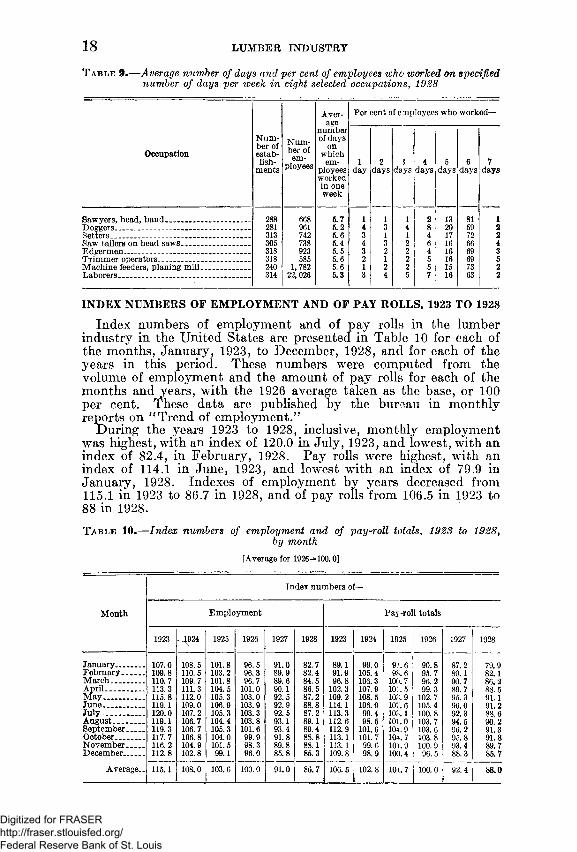
INDEX NUMBERS OF EM PLOYM ENT AND OF PAY ROLLS, 1923 TO 1928
Index numbers of employment and of pay rolls in the lumber industry in the United States are presented in Table 10 for each of the months, January, 1923, to December, 1928, and for each of the years in this period. These numbers were computed from the volume of employment and the amount of pay rolls for each of the months and years, with the 1926 average taken as the base, or 100 per cent. These data are published by the bureau in monthly reports on “ Trend of employment.”
During the years 1923 to 1928, inclusive, monthly employment was highest, with an index of 120.0 in July, 1923, and lowest, with an index of 82.4, in February, 1928. Pay rolls were highest, with an index of 114.1 in June, 1923, and lowest with an index of 79.9 in January, 1928. Indexes of employment by years decreased from115.1 in 1923 to 86.7 in 1928, and of pay rolls from 106.5 in 1923 to 88 in 1928.
T a b l e 10.— Index numbers of employment and of pay-roll totals, 1923 to 1928, by month
[Average for 1926=100.0]
Index numbers of—
Month Employment Pa5 -roll totals
1923 —4^24 1925 1926 1927 1928 1923 1924 1925 1926 1927 1928
January............. 107.0 108.5 101.8 96.5 91.0 82.7 89.1 99.0 9]. 6 90.8 87.2 79.9February.......... 109.8 110.5 103.2 96.3 89.9 82.4 91.9 105.4 98.6 95.7 89.1 82.1March............... 110.7 109.7 101.8 96.7 89.6 84.5 96.8 106.3 100.7 96.2 90.7 86.2April.................. 113.3 111.3 104.5 101.0 90.1 86.5 102.3 107.9 10]. 5 99.3 89.7 88.5M ay................... 115.8 112.0 105.3 103.0 92.5 87.2 109.2 108.5 108.9 102.7 95.3 91.1June...... ............ 119.1 109.0 106.9 103.9 92.9 88.8 114.1 106.9 107. 6 105.4 96.0 91.2July................... 120.0 107.2 105.3 103.3 92.5 87.2 113.3 99.4 103.1 100.8 92.3 88.6August.............. 119.1 106.7 104.4 103.8 93.1 89.1 112.6 98.5 101.0 103.7 94.5 90.2September........ 119.3 106.7 105.3 101.6 93.4 89.4 112.9 101.6 104.9 103.6 96.2 91.3October............. 117.7 106.8 104.0 99.9 91.8 88.8 113.1 101.7 104.7 103.8 95.8 91.8November........ 116.2 104.9 101.5 98.3 89.8 88.1 113.1 99.6 101.9 100.9 93.4 89.7December_____ 112.8 102.8 99.1 96.0 85.8 85.3 109.8 98.9 100.4 96.5 88.3 85.7
Average.. 115.1 108.0 103.6 100.0 91.0 86.7 106.5 102.8 10 L. 7 100.0 92.4 88.0
Digitized for FRASER http://fraser.stlouisfed.org/ Federal Reserve Bank of St. Louis
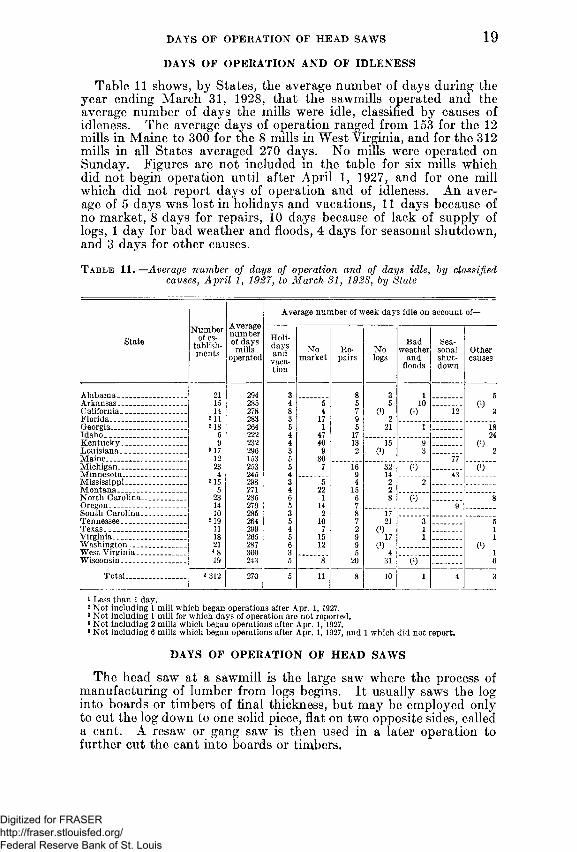
DAYS OF OPERATION OF HEAD SAWS 19DAYS OF OPERATION AND OF IDLENESS
Table 11 shows, by States, the average number of days during the year ending March 31, 1928, that the sawmills operated and the average number of days the mills were idle, classified by causes of idleness. The average days of operation ranged from 153 for the 12 mills in Maine to 300 for the 8 mills in West Virginia, and for the 312 mills in all States averaged 270 days. No mills were operated on Sunday. Figures are not included in the table for six mills which did not begin operation until after April 1, 1927, and for one mill which did not report days of operation and of idleness. An average of 5 days was lost in holidays and vacations, 11 days because of no market, 8 days for repairs, 10 days because of lack of supply of logs, 1 day for bad weather and floods, 4 days for seasonal shutdown, and 3 days for other causes.
T a b l e 11.— Average number of days of operation and of days idle, by classified causes, April 1, 1927, to March 31, 1928, by State
Average number of week days idle on account of—Average number of days mills
operated
StateNumber
of establishments
Holidaysand
vacation
Nomarket
Repairs
Nologs
Badweather
andfloods
Seasonalshutdown
Othercauses
Alabama_________________ 21 294 3 8 3 1 5Arkansas............................. . 15 285 4 5 5 5 10 <>)
3California _______________ 14 278 8 4 0) 2 0) 12Florida___________________ 2 ii 283 3 17 9Georgia.................................. 218 264 5 1 5 21 l 18Idaho __________ _____ __ 5 222 4 47 17 24Kentucky............................. 9 232 4 40 13 15 9 0)
2Louisiana____________ ___ 317 296 3 9 2 0) 3Maine____________________ 12 153 5 80 77Michigan_________________ 23 253 5 7 16 32 0) 0)Minnesota____________ _ 4 245 4 9 14 43Mississippi...................... . 215 298 3 5 4 2 2Montana. _______________ 5 271 4 22 15 2North Carolina.................. 23 285 6 1 6 8 0) 8Oregon___________________ 14 279 5 14 7 9South Carolina.................... 10 285 3 2 8 17Tennessee............. ................ 219 264 5 10 7 21 3 5Texas ................................. 11 299 4 7 2 0)
171 1
Virginia__________________ 18 265 5 15 9 1 1Washington................ ........ 21 287 6 12 9 0) 4 0) 1West Virginia____________ 4 8 300 3 5Wisconsin............................. 19 243 5 8 20 31 0) 6
Total........................... * 312 270 5 11 8 10 1 4 3
1 Less than 1 day.2 Not including 1 mill which began operations after Apr. 1, 1927.3 Not including 1 mill for which days of operation are not reported.4 Not including 2 mills which began operations after Apr. 1, 1927.* Not including 6 mills which began operations after Apr. 1, 1927, and 1 which did not report.
DAYS OF OPERATION OF HEAD SAWS
The head saw at a sawmill is the large saw where the process of manufacturing of lumber from logs begins. It usually saws the log into boards or timbers of final thickness, but may be employed only to cut the log down to one solid piece, flat on two opposite sides, called a cant. A resaw or gang saw is then used in a later operation to further cut the cant into boards or timbers.
Digitized for FRASER http://fraser.stlouisfed.org/ Federal Reserve Bank of St. Louis

20 LUMBER INDUSTRY
Table 12 shows, by States, the number of mills, number of head saws, average number of head saws per mill, average number of days mills operated, average number of shifts each head saw was operated during day, night, and third shifts, and the number of mills operating each specified number of head saws.
Of the 319 mills reporting, 154 operated 1 head saw each, 129 operated 2 head saws each, 25 operated 3 head saws each, 7 operated 4 head saws each, and 4 operated 5 head saws each. A total of 535 head saws were operated by the 319 mills, or an average of 1.7 head saws per mill. The head saws reported averaged 269 day shifts, 62 night shifts, and 1 third shift, a total of 332 shifts during the year.
T a b l e 12.— Number of head saws and of days of operation for the year endingMarch 81, 1928, by State
State
Alabama.............Arkansas..........California______Florida................Georgia________Idaho...................Kentucky...........Louisiana______Maine_................Michigan_______Minnesota_____Mississippi........M ontana............North Carolina..Oregon_________South Carolina..Tennessee...........Texas...................Virginia. .............Washington____West Virginia-.. W isconsin..........
Total..
Mills operating each speci- fied n u m b er o f head saws
154 129 25
Totalnumber
of—
Mills
319
Headsaws
535
Average
numberof
headsawspermill
1.5 2.12.61.5 1.12.6 1.2 2.21.31.53 .5 1.9 1.81.3 2.21.6 1.22 .3 1.21.71.8 1.6
Average
numberof
daysmillsoperated
294285278
1 2831 264
222 232
2 296 153 253 245
i 298 271 285279 285
i 264 299 265 287
3 300 243
A v e r a g e n u m b e r o f shifts each head saw was operated
Day Night
282264
1 2891 259
235 239
2 285 152 254 249
1300276288266284
i 266 299 261 279
3 297 230
Third
224187
1 58 i 10 14212 60
46 247 i 80 127
8156 15
i 28 54
1163 53
49
1. 7 < 270 I * 269 < 62
Total
315 323 351
1347 i 269
377 240
»345 152 300 496
1 380 403 296 422 299
i 295 353 261 410
3 350 280
* 332
* Not including 1 mill which began operations after Apr. 1, 1927.* Not including 1 mill for which days of operation were not reported.* Not including 2 mills which began operation after Apr. 1, 1927.4 Not including 6 mills which began operations after Apr. 1, 1927, and 1 whict did not report.
Table 13 shows the number of head saws, the average number of days of operation during the year ending March 31. 1928, by States. The head saws are classified by the number of days of operation during the year. The table is divided into two sections, one showing day shifts and the other night shifts. In addition to these groups two mills operated one head saw each on a third shift, one operating 261 days and the other 274 days.
On the day shift 526 saws averaged 269 shifts during the year; on the night shift 169 saws averaged 193 shifts; and on the third shift two saws averaged 268 shifts. The table does not include data for 6 head saws of 4 mills that did not begin operating until after April1, 1927, nor for 1 head saw of 1 mill that did not report days of operation.
Digitized for FRASER http://fraser.stlouisfed.org/ Federal Reserve Bank of St. Louis

T a b l e 13.— Average and classified days head saws were in operation during the year ending March 81, 1928, by State
DAY SHIFTS
Head saws Number of head saws in operation each classified number of days
State Numberoperat
ing
Average days in operation
Under150
15Qand
under160
160and
under170
170and
under180
180and
under190
| 190 1 and under
200
200and
under210
210and
under220
220and
under230
230and
under240
240and
under250
250and
under260
260and
under270
270and
under280
280and
under290
290and
under300
300and
under310
310andover
Alabama............................................................... 32 293 12
1 3 6g
5 11g
5gArkansas_____ _____________________________ 31 282 1 1 1
43 2
California_____ ____________________________ 37 264 1 4 3 2 3 2 5 5 gFlorida................................................................. 1 16 289 1 1 1 2 1
45 5
Georgia................................................................. * 19 259 1 2 2 2 1 2 1 3Idaho.......................... ........................................ 13 235 2 2 !i 1 2 2 4Kentucky............................................................ 11 239 1 1 1 1 1 2 1
32 1
§Louisiana............................................................. *39 285 2 2 3 5 9 QM aine__.......... .................................................__ 15 152 9 2 1 1 1 2
»Michigan__________________________________ 35 254 1 1 2 1 2 1 2 2 7 4 4 g 2Minnesota__________________ ______________ 14 249 3 3 5 3Mississippi........................ .................................. 2 29 300 1 4 g 6 12Montana______________ ____________________ 9 276 1 2 4 2North Carolina. _............................................... 29 288 1 2 1 4 16
66
11Oregon............... ...................................... ............ 31 266 1 2 2 4 2 4 8 2South Carolina............................................ ....... 16 284 1 2 2 5Tennessee............................................................. *23 266 1 1 1 2 1 1 1 1 2 1
14
7 2 2Texas................................................................... 25 299 1
711
2104
2Virginia................ .......................................... 22 261 1 1 1 1 1W ashington....... ................................... ............. 35 279 1 2 1 5 7 7 12
gWest Virginia................ ................................. «15 297 1 2 2 4Wisconsin........................................................... 30 230 2 4 3 2 5 1 1 1 4 2 3 2
Total________________________________ *526 269 24 4 3 4 11 3 9 11 15 10
4--------16 20 34 40 72 93 106 51
1 N ot including 2 head saws in 1 mill which began operation after Apr. 3, 1927.1 Not including 1 head saw in 1 mill which began operation Apr. 1, 1927.1 Not including 1 head saw in 1 mill for which days of operation were not reported.4 N ot including 3 head saws in 2 mills that began operations after Apr. 1, 1927.• N ot including 8 head saws in 0 mills which began operations after Apr. 1, 1927, and 1 head saw in 1 mill which did not report.
t o
DAYS OF
OPERATION OF
HEAD SA
WS
Digitized for FRASER http://fraser.stlouisfed.org/ Federal Reserve Bank of St. Louis

T a b l e 13 .— Average and classified days head saws were in operation during the year ending March 31, 1928, by State— Continued
NIGHT SHIFTS
Head saws Number of head saws in operation each classified number of days
State Numberoperat
ing
Average days in operation
Under150
150and
under160
160and
under170
170and
under180
180and
under190
190and
under200
200and
under210
210and
under220
220and
under230
230and
under240
240and
under250
250and
under260
260and
under270
270and
under280
280and
under290
290and
under300
300and
under310
310andover
A la b a m a .______ ______ _ _____ 3 232 1 1 1Arkansas 9 141 6 2 1California 19 170 8 2 1 4 3 1Florida _ ____ _ _ __ i 3 308 1 2Georgia __________ - __ __ ________ 1 191 1Idaho _ _____________ ___ _ _ ___________ 9 204 2 2 3 2Kentucky 1 12 1Louisiana ___________________ ___________ 11 214 1 2 2 1 3 2Michigan _ _ - 12 134 9 1 2Minnesota _ _______ _ _ . _____ 14 247 3 3 5 3Mississippi ________ __ _ 9 259 1 2 2 2 2Montana ______ ______ 5 229 2 1 2North Carolina 1 240 1Oregon - - - - _ 22 220 3 1 2 2 3 2 2 5 2South Carolina 1 240 1Tennessee 7 93 5 1 1Texas - _ 5 268 3 2Washington * _ 18 225 4 1 2 1 2 1 3 2 2West Virginia 4 198 2 2W isconsin 15 98 13 1 1
Total.......................................................... i 169 193 59 4 5 1 5 2 4 3 3 7 12 3 12 9 16 10 10 4
1 *-*■% i-»-» r* O V. J 1 *11 »r-V> ' oV> V o rfp r* -r-> A 1 1 1 HOW- AJjLUiUV^i-U.5 +* X ico-u. o a w o A.LI A VV iiiO i-i d ^ & d u . u p c i u i i u i i a i t c i x i p m x f X o - < .
* 2 mills ran 1 head saw each on third shift, 1 operating 261 days and the other 274 days.
Digitized for FRASER http://fraser.stlouisfed.org/ Federal Reserve Bank of St. Louis
LUMBER PRODUCTION IN 1926 23
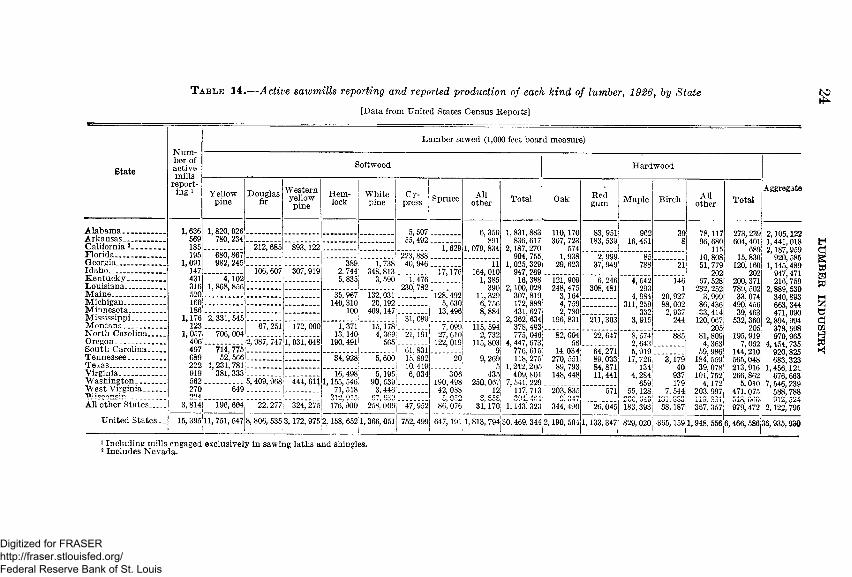
LUMBER PRODUCED IN THE UNITED STATES IN 1926
Table 14 shows for each of 22 States, for the group “ All other States/’ and for the United States, the number of sawmills in operation and the production in thousands of board feet of the various kinds of hardwood and of softwood lumber in 1926. The figures were taken from the reports of the United States Census of Manufactures.
The 15,395 sawmills in active operation in the United States in1926 produced 36,935,930 thousand board feet of lumber; 30,469,344 thousand feet was softwood and 6,466,586 thousand feet hardwood. The production of yellow pine was 11,751,647 thousand feet, or nearly one-third of the total, and of Douglas fir was 8,806,535 thousand feet, or nearly one-fourth of the total. The 562 mills in Washington produced 7,541,229 thousand feet of softwood and only 5,010 thousand feet of hardwood. The total production in Washington was approximately one-fifth of the total in the United States. ‘
Digitized for FRASER http://fraser.stlouisfed.org/ Federal Reserve Bank of St. Louis
State
T a b l e 14.— Active sawmills reporting and reported production of each kind of lumber, 1926, by State
[Data from United States Census Reports]
Alabama________Arkansas........ .......California 1______Florida...................Georgia...................Idaho......................Kentucky..............Louisiana________M a in e ................Michigan...............Minnesota_______Mississippi............M ontana...............North Carolina...Oregon...................South Carolina...Tennessee............Texas____________Virginia.......... .......Washington_____W est Virginia___'XR7 i cr>oT-» ciAll other States...
United States
Number of active mills
reporting 1
Lumber sawed (1,000 feet board measure)
Softwood
Yellowpine
1,636 569185 195
1,091147431316520160186
1,176123
1,057 406 497 689 222 919j 562: 270 00/1!
3, 8141
1,820, 026 780, 234
" 680,” 867 982,245
4,'102 1,868,856
2, 331, 545
706,004
” 714,'77552,566
1,231, 781 381, 333
649
" 196,’ 664
Douglasfir
106, 607
67, 251
2, 987,’ 747
Westernyellowpine
893,122
307,919
172, 000
1,031,048
5,409, 968 444, 611
22, 277 j 324, 275
Hemlock
Whitepine
Cypress
5,507 55,492
389 1,738 2, 744 348, 813! 5,835; 3, 590
223,888 40,946
35, 967' 132,031 140,310 20,192
100 409,147
1,371 13,140
190, 491
34,928
16,498 1,155, 546
71, 5189 1 0 I-----
15,1784,369
565
1,476 230, 782
31,089
21,191
5,600'
5,195! 90, 539:
3,4461
61,831 15. 892 10,419 6,034
176, 900 258,009! 47, 952
15, 395 11, 751, 647 8, 806, 535 3,172, 975 2,158, 652 1,366, 051 752,499 647,191 1, 813, 794 30,469,344 2,190,504
Spruce
1,629
17,176
128, 492 5, 630
13,496
7, 099 27,610
122,019
20
306 190,498 42, 088
86’ 076
Allother
6,350 891
, 079, 834
11164,010
1, 385 390
11,329 6, 756 8,884
115, 594 2, 732
115, 803 9
9,2695
435 250,06'
12 8 °5° 31,’ 170
Total
1,831,883 836, 617
2,187,270 904, 755
1,025, 329 947,269! 16,388
2, 100, 028 307,819 172, 888 431, 627
2,362, 634 378,493775, 046
4, 447, 673776, 615 118, 275'
1, 242,205 409,80 r
7, 541, 229 117, 713:
1,143,’ 323
Oak
110,170 307, 723
574
29,623
121,909 248,475
3,164 4, 759 2, 780
196,831
82,00456
14,034270, 551 89, 793
148,448
203,835
344,’ 490
Hardwood
Redgum
83,951 183, 539
Maple
962 16,451
2,999 37,9491
6,246 308,481
22, 647
64,271 89,033 84,871 11,441
571
26,045
85788
4, 542 293
311,259332
3,915
Birch
21
146120, 927 88,002 2,937
244
8, 574 2, 643 5,919
17,7261 134!
4, 284' 659|
55,128'
885
3,179 40
937 179
7,544
183,3931 58,187
1 ,133,347 829,020j 365,159 1,948 ,556^6,466,586
Allother
78,11796,680
115 10,808 51, 779
202 67,528.
232,252 3,999
86,436 33,414
120,067 205
81,809 4,363
59,986! 184, 559! 39,078!
101, 752j 4,172*
203,997!
Total
273,239 604,401
689 15, 830
120,160 202
200,371 789, 502 33,074
490,456 39,463
532,360 205
195,919 7,062
144,210 565,048 213,916 266,862
5,010 471,075ulo, 0u&979,472
36,935,930
to
Aggregate
2,105,122 1,441,018 2,187,959
920,585 1,145,489
947,471 216,759
2,889,530 340,893 663,344 471,090
2,894,994 378,698 970,965
4,454,735 920,825 683,323
1,456,121 676,663
7,546,239 588,788 912,524
2,122, 795
* Including mills engaged exclusively in sawing laths and shingles.2 Includes Nevada.
Digitized for FRASER http://fraser.stlouisfed.org/ Federal Reserve Bank of St. Louis
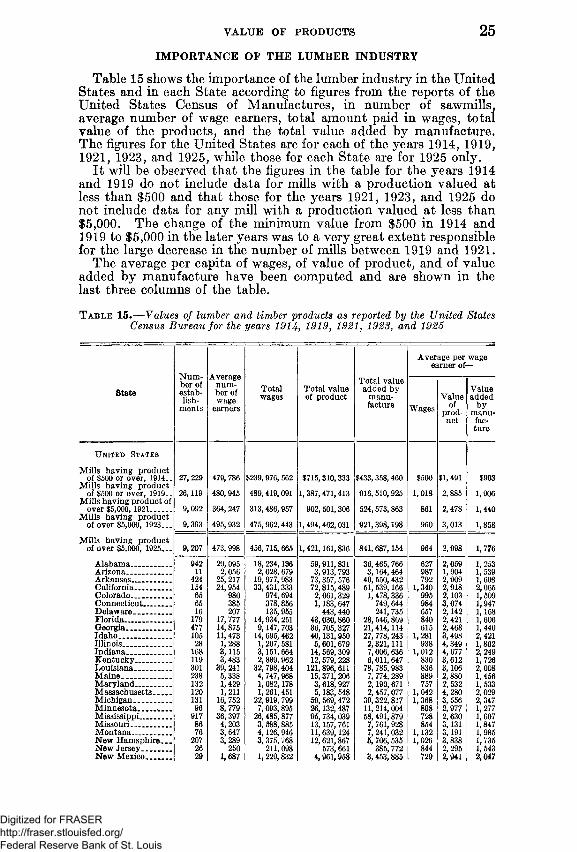
VALUE OF PRODUCTS 25 IMPORTANCE OF THE LUMBER INDUSTRY
Table 15 shows the importance of the lumber industry in the United States and in each State according to figures from the reports of the United States Census of Manufactures, in number of sawmills, average number of wage earners, total amount paid in wages, total value of the products, and the total value added by manufacture. The figures for the United States are for each of the years 1914, 1919, 1921, 1923, and 1925, while those for each State are for 1925 only.
It will be observed that the figures in the table for the years 1914 and 1919 do not include data for mills with a production valued at less than $500 and that those for the years 1921, 1923, and 1925 do not include data for any mill with a production valued at less than $5,000. The change of the minimum value from $500 in 1914 and 1919 to $5,000 in the later years was to a very great extent responsible for the large decrease in the number of mills between 1919 and 1921.
The average per capita of wages, of value of product, and of value added by manufacture have been computed and are shown in the last three columns of the table.
T a b l e 15.— Values of lumber and timber products as reported by the United States Census Bureau for the years 1914, 1919, 1921, 1923, and 1925
Number of establish
ments
Average number of wage
earners
Average per wage earner of—
State Totalw ages
Total value of product
Total value added by
manufacture Wages
Valueof
product
Valueadded
bymanu
facture
U n it e d St a t e s
Mills having productof $500 or over, 1914__ 27,229 479, 786 $239, 976, 562 $715,310,333 $433, 358,460 $500 $1,491 $903
Mills having productof $500 or over, 1919. _ 26,119 480,945 489,419,091 1,387,471,413 916,510,925 1,018 2,885 1,906
Mills having product ofover $5,000,1921......... 9,092 364, 247 313,486,957 902,501,306 524,573,863 861 2,478 1,440
Mills having productof over $5,000, 1923—_ 9,393 495,932 475,962,443 1,494,462,031 921,398,198 960 3,013 1,858
Mills having productof over $5,000, 1925... 9,207 473, 998 456,715,665 1,421,161,836 841, 687,154 964 2,998 1,776
Alabama.................. 942 29,095 18, 234,136 59,911,831 36,465,766 627 2,059 1, 253Arizona___________ 11 2,056 2,028,679 3,913, 793 3,164,464 987 1,904 1, 539Arkansas.................. 424 25, 217 19,977, 983 73,357, 576 40, 550,432 792 2,909 1,608California_________ 154 24,954 33,431,333 72,815,489 51,539,166 1,340 2,918 2,065Colorado.................. 65 980 974, 694 2,061,329 1,478,336 995 2,103 1,509Connecticut............. 65 385 378,856 1,183,647 749,644 984 3,074 1,947Delaware................. 16 207 135,955 443,440 241, 735 657 2,142 1,168Florida..................... 179 17,777 14,934,251 43,030,860 28,546,869 840 2,421 1, 606Georgia..................... 477 14,875 9,147,703 36,705,327 21,414,114 615 2,468 1,440Idaho........................ 105 11,473 14,695,462 40,131,950 27,778,243 1,281 3,498 2,421Illinois...................... 28 1,288 1,207, 581 5,601,679 2,321, 111 938 4,349 1,802Indiana.................... 168 3,115 3,151,664 14,569,309 7,006,636 1,012 4,677 2,249Kentucky................. 119 3,483 2,889,962
32,798,40412,579, 228 6,011, 647 830 3,612
3,1061, 726
Louisiana................. 301 39, 241 121,896,611 78, 785,983 836 2,008Maine....................... 238 5,338 4, 747,968 15,371, 206 7, 774, 289 889 2,880 1,456Maryland................ 132 1,429 1,082,178 3,618,927 2,190,671 757 2,532 1, 533Massachusetts........ 120 1,211 1, 261,451 5,183,548 2,457,077 1,042 4,280 2,029Michigan.......... ....... 131 16,752 22,919, 799 59,569,472 39,322, 817 1,368 3,556 2,347Minnesota____ -___ 96 8,779 7,093,895 26,132,487 11,214,004 808 2,977 1, 277Mississippi............... 917 36,397 26,485,877 95, 734,039 58,491,879 728 2,630 1,607Missouri........... ....... 86 4,203 3, 388, 885 13,157, 761 7, 761, 928 854 3,131 1,847M ontana................. 76 3, 647 4,126, 946 11,639,124 7,241,032 1,132 3,191 1,985New H amsphire... 207 3,289 3,375, 768 12,621,867 5,706,535 1,026 3,838 1,735New Jersey.............. 26 250 211, 098 573,661 385, 772 844 2,295 1,543New Mexico............ 29 1,687 1,229,832 4,961,958 3,453,885 729 2,941 2,047
Digitized for FRASER http://fraser.stlouisfed.org/ Federal Reserve Bank of St. Louis

26 LUMBER INDUSTRY
T a b l e 15.— Values of lumber and timber products as reported by the United States Census Bureau for the years 1914, 1919, 1921, 1923, and 1925— Continued
Number of establish
ments
Average number of wage
earners
Average per wage earner of—
State Totalwages
Total value of product
Total value added by
manufacture Wages
Valueof
product
Valueadded
bymanu
facture
U n it e d S t a t e s — Con.
Mills having product of over $5,000, 1925— Continued
New York............... 216 3,060 $3, 579, 625 $13,296,139 $7,117,920 $1,170 $4,345 •$2,326North Carolina___ 515 17, 787 12,900, 303 38,080,932 22,166, 363 725 2,141
4,3771,2462,308Ohio.......................... 193 2,126 2,214, 876
1,450,0929, 305, 717 4,907,033
3,058, 3871,042
Oklahoma................ 28 1,692 4,812,763 120,570, 255
857 2,844 1,808Oregon...................... 364 31, 217 42,432,499 69, 221, 593 1,359 3,862 2,217Pennsylvania......... 308 4,498 4, 111, 034 12,947,042 8,762, 228 914 2,878 1,948Rhode Island_____ 5 50 60, 219 162,679
29, 598, 58585, 280
18,091,7981,204 3, 254
1,8871,706
South Carolina....... 273 15, 686 10,305,351 657 1,153South Dakota......... 36 644 583, 549 1,187, 649 845,186 906 1,844 1,312Tennessee...... .......... 324 11,185 8, 550, 512 35, 527, 699
47,645, 23019,935, 800 764 3,176
2,6181,782
Texas...................... . 196 18, 200 14,949,971 30, 588,417 821 1,681Utah......... ............... 6 23 16, 216 52, 582 37, 587 705 2, 286 1,634Vermont.................. 151 2,214 1,877,993 6,140, 528
23,895, 5613, 560, 993 848 2, 773 1,608
Virginia.................... 493 11,621 8,447,487 14, 496, 561 131,860, 303
727 2,056 1, 247 2,207Washington............. 653 59, 733 84,012, 612
9,825, 443253,070, 780 1,406 4, 237
West Virginia......... 138 9, 020 26, 787,495 18, 605,637 1,089 2,970 2,063Wisconsin....... ........ 175 19,972 19, 503,832 56,374,735 33, 111, 110 977 2,823 1,658W yoming................. 14 735 968, 602 1, 573, 020 1,359, 417
1,821, 5061, 318 2,140 1,850
All other States___ 7 499 815,089 3,366,326 1,633 6,746 3,650
OCCUPATIONS
The occupations for which data are presented in this bulletin are arranged below as nearly as possible in order of manufacture and are defined in Bulletin No. 225.Pondmen (including boommen and
slip men). Yardmen, log. Sawyers, head, band. Sawyers, head, circular. Coggers.Setters.Saw tailers on head saws.Sawyers, gang. Sawyers, resaw. Edgermen. Edger tailers. Transfer men.
Trimmer loaders. Trimmer operators. Off-bearers (except on head saws). Graders. Sorters. Truckers.Stackers, hand.Machine feeders, planing (including
timber sizers).Tallymen. Millwrights. Laborers (including various unskilled
employees).Wage figures are also presented in the tables of this report for
a group designated as “ other employees.” This group includes employees in occupations other than those listed above.
GENERAL TABLES
In addition to the summary and other tables already shown in this bulletin, five general tables are presented as follows:
T a b l e A.— Average number of days on which employees worked, average full-time and actual hours and earnings per week, average earnings per hour, and per cent of full time worked, 1928, by occupation and State.
Digitized for FRASER http://fraser.stlouisfed.org/ Federal Reserve Bank of St. Louis

T a b l e B.— Average and classified earnings per hour in eight specified occupations, 1928, by State.
T a b l e G.— Average and classified full-time hours per week in eight specified occupations, 1928, by State.
T a b l e D.— Average and classified hours actually worked in one week in eight specified occupations, 1928, by State.
T a b l e E.— Average and classified actual earnings in one week in eight specified occupations, 1928, by State.
Wages and hours of employees in logging camps are given in Table F, page 57.
GENERAL TABLES 27
Digitized for FRASER http://fraser.stlouisfed.org/ Federal Reserve Bank of St. Louis

28 LUMBER INDUSTRY
T a b l e A .— Average number of days on which employees worked, average full-time and actual hours and earnings per week, average earnings per hour, and per cent of full time worked, 1928, by occupation and State
Occupation and State
Number of— Average
number of days
worked in one week
Average hours per week Per
cent of fulltime hours actually
worked
Average earnings—
Es-tab-lish-
ments
Employees
Fulltime
Actually
workedPer
hour
Perweek,
fulltime
Perweek,actual
Pondmen:Alabama. ............................. 20 99 5.5 60.4 55.0 91 $0.228 $13.77 $12.57Arkansas.............................. 11 69 5.1 59.2 48.5 82 .279 16.52 13.54California........ ..................... 14 84 5.8 56.4 56.1 99 .479 27.02 26.85Florida................................... 6 47 5.4 60.6 54.3 90 .256 15. 51 13.89Idaho..................... - .............. 4 34 5.8 48.0 46.5 97 .496 23. 81 23.02Kentucky............................. 4 6 6.0 58.3 58.3 100 .379 22.12 22.12Louisiana.............................. 18 147 5.4 59.2 54.3 92 .267 15.81 14. 52Maine.................................... 11 33 5.8 58.5 57.2 98 .332 19. 42 18. 95Michigan............................... 23 91 5.7 59.0 56.0 95 .373 22.01 20.92Minnesota............................ 4 31 5.7 60.0 57.5 96 .384 23.04 22.10Mississippi........... ................ 12 98 5.6 59.2 56.4 95 .283 16. 75 15. 95Montana...... ......................... 5 26 5.0 52.2 43.5 83 .481 25.11 20.92North Carolina.......... ......... 17 46 5.7 59.2 57.0 96 ! . 256 15.16 14.58Oregon............................. . 14 82 5.6 48.8 47.0 96 .548 26. 74 25. 72South Carolina.................... 7 54 5.5 59.7 56.8 95 1 .208 12.42 11.83Tennessee............................. 8 21 5.3 58.3 53.4 92 .304 17. 72 16.23Texas.............. ..... ................. 10 89 5.3 59.4 51.7 87 .299 17. 76 15. 47Virginia................................. 9 20 5.8 60.6 58.5 97 .276 16. 73 16.14W ashington....................... 21 154 5.7 48.3 47.9 99 .575 27.77 27.54West Virginia....................... 10 22 5.8 60.0 57.1 95 .383 22. 98 21.88Wisconsin............................. 19 86 5.7 59.1 54.7 93 .370 21.87 20. 25Other States........................ 1 5 5.0 60.0 60.0 100 .317 19.00 19.00
T o ta l . . . ............................ 248 1, 344 5.6 56.9 53.2 93 .357 20.31 18. 95Yardmen, log:
Arkansas............................... 4 21 5.0 59.4 47.7 80 .363 21. 56 17.31Florida................................... 7 18 5.8 61.3 59.4 97 .254 15. 57 15.08Georgia................................. 19 63 5.6 58.5 54.0 92 .233 13. 63 12. 61Idaho.................................... 2 10 4.2 48.0 33.9 71 i .442 21. 22 15.00K e n t u c k y ......................... 5 20 4.5 57.3 42.4 74 .302 17. 30 12. 79Louisiana.............................. 2 11 5.2 60.0 51.2 85 .270 16.20 13. 84Mississippi........................... 6 26 5.5 59.5 55.9 94 .288 17.14 16.12Montana. ............................. 4 17 4.9 50.8 41.8 82 .559 28.40 23. 37North Carolina.................... 5 8 5.8 60.9 57.4 94 .222 13. 52 12. 76South Carolina........... ......... 3 9 4.7 61.1 46.6 76 .259 15. 82 12.07Tennessee............................ 14 45 5.3 58.5 53.0 91 .287 16. 79 15.24Texas..................................... 3 13 5.2 54.6 50.9 93 .289 15. 78 14.70Virginia................................. 9 9 5.7 55.0 54.9 100 .317 17.44 17.42Other States.......................... 3 13 4.4 57.2 40.3 70 .275 15. 73 11.08
Total.................... ............. 86 283 5.2 57.8 50.6 8S .293 16. 94 14. 81Eawyers, head, band:
Alabama............................... 17 32 6.0 60.8 60.2 99 .820 49.86 49.37Arkansas............................. 15 35 5.8 58.9 56.9 97' .847 49.89 48.24California.............................. 14 56 5.7 54.6 53.6 98 1. 029 56.18 55.19Florida.................................. 9 23 5.8 60.5 58.4 97 .893 54.03 52.21Georgia.................................. 12 14 5.8 59.2 58.1 98 .828 49.02 48.17Idaho..................................... 5 22 5.7 48.0 45.8 95 .945 45. 36 43. 28Kentucky............................. 8 10 5.4 57.5 52.0 90 .754 43. 36 39.23Louisiana.............................. 16 53 6.7 59.1 57.3 97 .872 51. 54 49.99Maine........... ........................ 10 12 6.0 58.7 58.7 100 .684 40.20 40.20Michigan....................... ....... 21 41 5.8 59.0 56.4 96 .768 45.31 43. 35Minnesota............................. 4 30 5.7 60.0 56.7 95 .844 50.64 47.82Mississippi............................ 16 53 6.4 58.4 53.7 92 .884 51. 63 47.46Montana...................... ........ 5 14 5.9 50.7 50.7 100 .982 49.82 49.82North Carolina................... 23 33 5.7 60.0 56.9 95 .697 41.82 39. 69Oregon.................................. 14 48 5.8 48.7 46.6 96 1.146 55.81 53. 37South Carolina.................... 9 17 5.8 60.3 59.1 98 .781 47.09 46.18Tennessee............................. 20 27 5.6 57.9 55.1 95 .875 50.66 48.25Texas..................................... 11 34 5.8 56.8 53.9 95 .903 51.29 48. 64Virginia................................. 11 18 5.7 60.7 57.9 95 .695 42.19 40.20Washington.......................... 19 51 5.5 48.1 44.9 93 1.176 56.57 52.87West Virginia....................... 10 18 6.1 60.0 60.1 100 .806 48. 36 48. 42Wisconsin............................. 19 27 6.0 59.5 58.4 98 .764 45. 46 44. 60
Total........................... 288 668 5.7 56.7 54.4 96 .887 . 50. 29 48.27
Digitized for FRASER http://fraser.stlouisfed.org/ Federal Reserve Bank of St. Louis

GENERAL TABLES 29T a b l e A .— Average number of days on which employees worked, average full-time
and actual hours and earnings per week, average earnings per hour, and per cent of full time worked, 1928, by occupation and State— Continued
Number of— Average
num
Average hours per week Per
cent of full
Average earnings—
Occupation and State Es-tab-lish-
ments
Employees
ber of days
worked in one week
Fulltime
Actually
worked
timehoursactually
worked
Perhour
Perweek,
fulltime
Perweek,actual
Sawyers, head, circular:Alabama____ ____________ 7 9 5.6 59.6 54.7 92 $0.778
.661$46.37 42.84
$42. 54 42.84 30. 55
F lorida__________________ 3 5 6.0 64.8 64. 8 100Georgia___________________ 7 7 6.0 59.3 59. 5 100 .514 30. 48Louisiana________________ 4 8 5.9 60. 0 55.0 92 .938 56.28 51. 56Maine____________________ 3 3 6.0 56.3 56.3 100 . 541 30.50 30. 50Michigan_________________ 2 2 6.0 60.0 58. 8 98 .763 45.78 44. 82
55. 60 24.87 54.38
3 4 6.0 58. 8 57.5 54. 3
98 .967 56. 86Virginia__________________ 7 7 5.9 54.3 100 .458 24.87Washington.......................... 3 4 6.0 48.0 49. 5 103 1. 098 52.70Wisconsin.... ......................... 2 2 6.0 60.0 56.5 94 .763 45. 78 43.10Other States______________ 4 7 5.7 52.7 48.8 93 .817 43. 06 39. 82
Total___________________ 45 58 5.9 57.6 55.5 96 .740 42. 62 41.10
Doggers:Alabama_________________ 20 82 5.4 60.4 53.3 88 .237 14.31 12.62
12. 63Arkansas___________ _____ 15 92 4.6 59.0 44.2 75 .286 16. 87California______________ 9 24 4.9 56.3 46.4 82 .436 24. 55 20. 24Florida______________ ____ 10 28 5.7 62.4 59.8 96 .237 14. 79 14.20Georgia___________________ 16 35 5.2 59.2 50.8 86 .215 12. 73 10. 94Idaho............. ................... . 2 10 5.9 48.0 47.2 98 .460 22.08 21.73Kentucky. ________ ____ _ 8 19 4.9 57.4 47.9 83 .345 19.80 16. 53Louisiana________________ 17 94 4.8 58.9 47.8 81 .281 16. 55 13. 42M a in e _________________ _ 11 19 5.7 59.1 55. 2 93 .328 19. 38 18.12Michigan. ............................. 23 51 5.6 59.1 55.7 94 .407 24.05 22. 66Minnesota............................. 4 34 5.6 60.0 55.6 93 .525 31.50 29. 20Mississippi., __________ _ 10 56 5.1 58.9 51.9 88 .276 16. 26 14. 31North Carolina.____ _____ 22 46 5.3 59.9 52.9 88 .254 15.21 13. 44Oregon. ______________ _ 9 34 5.6 48.6 45.3 93 .543 26. 39 24. 58South Carolina_______ 10 33 5.6 60.0 56. 3 94 . 223 13. 38 12. 54Tennessee. ......................... 20 48 5.4 57.9 52.8 91 .314 18.18 16. 56Texas___________________ 9 61 4.9 59.6 47. 7 80 . 295 17. 58 14.07Virginia________________ 16 30 5.5 59.6 54.3 91 .264 15.73 14.37Washington................... ....... 20 105 5.0 48.1 40.7 85 .520 25.01 21.13West Virginia ............. ....... 10 18 5.9 60.6 58.8 97 .413 25.03 24. 27Wisconsin________________ 19 38 5.7 59.2 54.0 91 .408 24.15 22.02Other States____________ 1 4 6.0 54.0 54.0 100 .450 24.30 24. 30
Total................................... 281 961 5.2 57.6 50.0 87 .335 19. 30 16.74
Setters:Alabama_______ _____ 21 35 6.0 60.4 59.7 99 .344 20. 78 20. 57Arkansas____________ ____ 15 39 5.1 58.7 49.3 84 .384 22. 54 18.94California_______________ 14 59 5.8 54.9 55.0 100 .624 34. 26 34. 37Florida___________ _____ 12 26 5.4 61. 2 55.1 90 .372 22. 77 20. 50
18.10 28. 71 21.7821. 63
Georgia___________________ 19 20 5. 7 58.9 56.4 96 .321 18. 91Idaho_____________ _ . 5 31 5.5 48.0 44. 2 92 .650 31. 20Kentucky______________ 9 11 5.3 56.8 51.2 90 .426 24.20Louisiana............................. 18 61 5.3 58.8 52.6 89 .411 24.17Maine.... ...... ....................... 12 19 5.7 58.4 55.2 95 .404 23. 59 22. 29Michigan........................... 23 44 5.6 59.1 55.3
58.054.348.853.9
94 .478 28. 25 26.47 31.28 23.3829.48 16. 65 32.16 18. 69 22.07
Minnesota______________ 4 25473140
5.8 60.058.750.260.048.6 §0.057.7
97939790
.539 32. 34Mississippi_____________ 16
55.4 5.65.4
.430
.604
.309
25.24Montana.. ___________ 30. 32North Carolina.................... 23 18. 54Oregon_________ ____ ____ 14 53 5.9 47.3 97 .680 33.05South Carolina........ ............ 10 18 5.5 55.2 92 .339 20.34Tennessee. ............................ 20 27 5.3 52.6 91 .420 24. 23Texas___________________ 11 37
1653
5.3 58.9 50.7 88 .365 21. 50 18. 51Virginia________________ 12 5.6
5. 559.8 48.1
55. 7 93 .346 20. 69 29.24
19. 26 27.35 27. 27 26.12
Washington.......................... 21 45.0 94 .608West Virginia. .................... 10 19 5.8 60.0 58.0 97 .470 28. 20Wisconsin______ _____ 19 31 5.9 59.5 57.8 97 .452 26. 89
Total.................................. 313 742 5.6 56.5 52.7 93 .468 26. 44 24.64
47925°—29------ 3
Digitized for FRASER http://fraser.stlouisfed.org/ Federal Reserve Bank of St. Louis
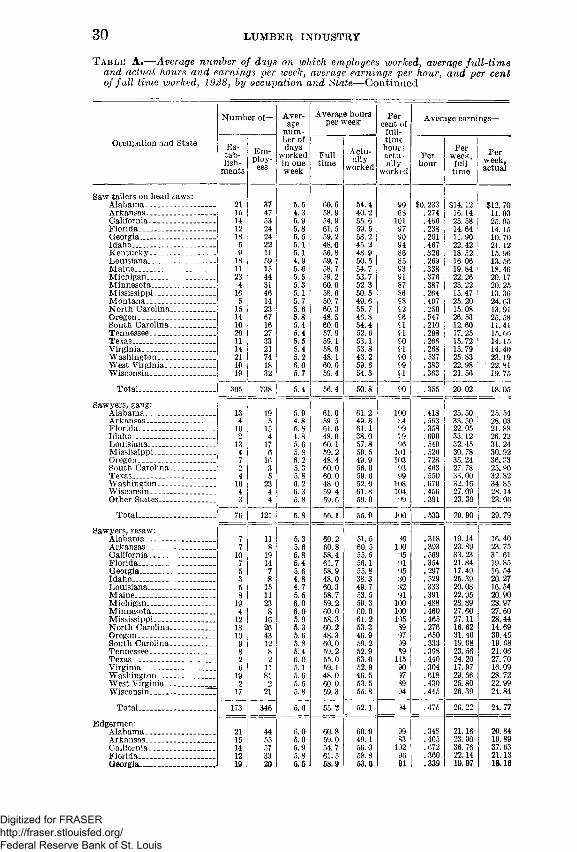
30 LUMBER INDUSTRY
T a b l e A,— Average number of days on which employees worked, average full-time and actual hours and earnings per week, average earnings per hour, and per cent of f ull time worked, 1928, by occupation and State— Continued
Number of— Average
num
Average hours per week Per
cent of full
Average earnings—
Occupation and State Es-tab-lish-
ments
Employees
ber of days
worked in one week
Fulltime
Actually
worked
time hour} actually
worked
Perhour
Perweek,
fulltime
Perweek,actual
Saw tailers on head saws:21 37 5. 5 60. 6 54.4 90
6S101
$0. 233 .274 .466
$14.12 16.14 25. 58 14. 64 11. 90 22.42
$12.70 11.03 25. 9514.15 10. 70 21.12 15. 96 13. 56 18.46 20.17 20. 2513. 3624. 63 13.9125. 58 11.41 15.6614.1514. 40
15 47 4.3 58.954.9
40. 2California________________ 14 53 5.9 55. 6F lorid a __________________ 12 24 5.8 61. 5 59. 5 97 . 238Georgia__________________ 18 24 5.5 59.2 53. 2 90 . 201Idaho_______________ ____ 5 22 5.1 48.0 45. 2 94 .467
9 11 5.1 56. 8 48.9 86 .326 . 269
18. 52 16.06Louisiana.............................. 18 59 4.9 59.7 50. 5 85
M a in e ___________________ 11 15 5. 6 58.7 54.7 93 .338 19u 84Michigan____________ ___ 23 44 5. 5 59. 2 53.7 91 .376 22. 26Minnesota. 4 31 5.3 60.0 52.3 87 . 387 23. 22Mississippi_______________ 16 46 5.1 58. 6 50.5 86 .264 15. 47
5 14 5. 7 50. 7 49. 6 68 .497 25. 20 15. 08North Carolina___________ 15 23 5. 6 60.3 55.7 £2 . 250
Oregon___________________ 14 67 5.8 48. 5 46.8 £6 .547 26. 53South Carolina___________ 10 16 5.4 60.0 54.4 £1 .210 12.60Tennessee___________ ____ 20 27 5.4 57.9 52. 6 £1 .298 17. 25Texas____________________ 11 33 5.5 59.1 53.1 £0 .266 15. 72Virginia........ ......................... 14 21 5.4 58.9 53.8 £1 .268 15. 79Washington______________ 21 74 5.2 48.1 43.2 £0 .537 25. 83 23.19West Virginia...................... 10 18 6.0 60.0 59.6 £9 .383 22. 98 ' 22.81Wisconsin______________ _ 19 32 5.7 59.4 54.3 £1 .363 21.56 19. 75
T otal--........... ................ 305 738 5.4 56.4 50.8 £0 .355 20 02 18. 05
Sawyers, gang:Alabama............................... 13 19 5.9 61.0 61.2 1(0 .418 25. 50 25. 54Arkansas _________ __ 4 5 4. 8 59. 5 49. 8 . 563 33. 50 28. 03
21.88Florida._ ______________ _ 10 15 5. 8 61. 6 61.1 £9 .358 22. 05Id a h o _________________ 2 4 4. 8 48.0 38.0 79 .690 33.12 26. 22Louisiana......... ................... 13 17 5.6 60.1 57.8 96 .540 32. 45 31. 24Mississippi........................... 4 6 5.8 59.2 59. 5 101 .520 30. 78 30. 92Oregon.. _________ ______ 7 16 6. 2 48.4 49.9 103 .728 35.24 36.33South Carolina_________ 2 3 5.3 60.0 56.0 93 .463 27. 78 25.90Texas____________________ 4 5 5.8 60. 0 59. 6 99 . 550 33.00 32. 82Washington________ 10
423 6. 2 48. 0 52. 0 108 . 670 32.16 34. 85
Wisconsin_____ _____ 4 6. 3 59.4 61. 8 104 .456 27. 09 28.14Other States___________ 3 4 5.8 59.6 59.0 !I9 .391 23. 30 23. 06
Total.— .......................... 76 121 5.8 56.1 55.9 100 .533 29. 90 29.79
Sawyers, resaw:Alabama________________ 7 11 5.3 60.2 51.5 86 .318 19.14 16.40Arkansas_________ ____ 7 8 5.6
5.85.4
60.8 60. 5 100 .393 23. 89 23. 75California________ __ 10
71914
58.4 55. 5 ')5 .569 33.23 31.61F lorida__________________ 61.7 56.1 •n .354 21. 84 19.85Georgia..... ........................ ... 5 7 5.6 58.9 55.8 ')5 .297 17.49 16.54Idaho______________ ___ 3 8 4.8 48.0 38.3 80 .529 25. 39 20.27Louisiana______________ 5 15 4.7 60.3 49.7 82 .333 20.08 16. 54Maine ____________ 8 11 5.5
6.058.7 59. 2
53.5 *)1 .391 22. 95 20.90Michigan......... ................. 19 23 59.3 100 .488 28. 89 28.97Minnesota______________ 4 8 6.0 60.0 60.0 100 .460 27.60 27.60Mississippi_____________ 12 16
265.9 58.3 61.2 105 .465 27.11 28.44
North C arolina............ 13 5.3 60.2 53.3 39 .276 16. 62 14.69O r e g o n ...... ... ............ ..... 10 43 5.6 48.3 46.9 ■37 .650 31.40 30. 45South Carolina_________ 9 12 5.8 60.0 59.2 99 .333 19. 98 19. 68Tennessee.. _____ _____ 8 8 5.4 59.2 52.9 S9 .398 23. 56 21.06T exas____________ _ _ 2 2 6.0 55.0 63.0 115 .440
.30424.20 27. 70
Virginia ________ 6 11 5.1 59.1 52.9 90 17.97 16.09Washington______ _____ 19 81 5.6 48.0 46.5 97 .618 29. 66 28. 72West Virginia_________ 2 2 5. 5 60.0 53.5 S9 .430 25. 80 22. 99Wisconsin____________ 17 21 5.8 59.3 55.8 94 .445 26. 39 24.84
Total................................... 173 346 5.6 55.2 52.1 94 .475 26. 22 24. 77
Edgermen:Alabama__________ _____ _ 21 44 6.0 60.8 60.0 99 .348 21.16 20. 84Arkansas_________________ 15 55 5.0 59.0 49.1 S3 .405 23. 90 19. 89California___________ ____ 14 57 5.9 54.7 56.0 102 .672 36. 76 37. 63Florida_________ ______ __ 12 33 5.8 61.5 58.8 96 .360 22.14 21.13Georgia.................................. 19 20 5.6 58.9 53.6 91 .339 19.97 18.16
Digitized for FRASER http://fraser.stlouisfed.org/ Federal Reserve Bank of St. Louis

GENERAL TABLES 31T a b l e A .— Average number of days on which employees worked, average full-time
and actual hours and earnings per week, average earnings per hour, and per cent of full time worked, 1928, by occupation and State— C on tin u ed
Number of— Average
num
Average hours per week Per
cent of full
Average earnings—
Occupation and State Es-tab-lish-
ments
Employees
ber of days
worked in one week
Fulltime
Actually
worked
timehoursactually
worked
Perhour
Perweek,
fulltime
Perweek,actual
Edgerraen—Continued.Idaho____________________ 5 22 5.7 48.0 45.8 95 $0. 620 $29. 76 $28.41Kentucky.............................Louisiana.......—...................
9 11 4.9 56.8 47.8 84 .443 25.16 21.1318 107 5.0 59.0 50.6 86 .374 22. 07 18.91
Maine-.................................. 12 16 5.7 58.7 55.6 95 .417 24.48 23.16Michigan............................. - 23 49 5.8 59.2 57.3 97 .451 26. 70 25. 86Minnesota....... ..................... 4 41 5.5 60.0 54.1 90 .494 29.64 26. 73Mississippi.................... ....... 16 79 5.4 59.8 54.8 93 .387 22.79 21. 20Montana............................... 5 21 5.0 50.0 43.9 88 .603 30.15 26.44North Carolina.................... 23 34 5.6 60.0 55.9 93 .305 18. 30 17.03Oregon................................... 14 67 5.8 48.7 48.0 99 .780 37.99 37.42South Carolina—................. 10 26 5.6 60.0 56.6 94 .326 19.56 18.44Tennessee............................. 20 26 5.5 58.0 55.1 95 .433 25.11 23. 89Texas................ .................... 11 48 4.8 59.1 46.8 79 .387 22. 87 18.11Virginia_____________ ____ 17 21 5.6 58.7 55.2 94 .314 18. 43 17. 31Washington.......................... 21 89 5.3 48.1 43.4 90 .683 32. 85 29. 65West Virginia....................... 10 17 6.0 60.0 59.8 100 .507 30. 42 30.29Wisconsin............................. 19 40 6.1 59.6 58.9 99 .457 27.24 26. 94
Total................................... 318 923 5.5 56.7 52.3 92 .470 26. 65 24. 61
Edger tailers:Alabama................................ 21 49 5.3 60.9 52.6 86 .206 12. 55 10.84Arkansas-------------------------- 15 37 4.9 58.8 47.5 81 .255 14. 99 12. 08California............................. 14 58 5.7 55.8 54.6 98 .409 22. 82 22. 33Florida................................... 12 31 5.9 61.5 59.6 97 .217 13.35 12.94Georgia..........- ..................... 14 16 5.4 59.3 54.4 92 .190 11. 27 10. 33Id a h o ................................... 5 19 5.7 48.0 45.5 95 .500 24.00 22.75Kentucky...... ....................... 4 5 5.4 56.0 51.6 92 .272 15. 23 14. 03Louisiana.............................. 17 47 5.3 60.1 54.1 90 .236 14.18 12.74Maine.................................... 10 16 5.3 58.4 50.2 86 .331 19. 33 16.64Michigan____________ ,____ 17 42 5.4 59.2 52.3 88 .330 19. 54 17. 26Minnesota............................. 4 29 5.6 60.0 55.7 93 .352 21.12 19. 59Mississippi............................ 16 55 6.1 58.4 50.0 86 .252 14. 72 12.60M ontana.............................. 4 22 5.4 48.3 46.8 97 .432 20. 87 20.23North Carolina__________ 16 25 5.8 60.2 59.6 99 .228 13. 73 13. 59Oregon................................. . 14 64 5.7 48.8 46.7 96 .496 24. 20 23.15South Carolina.................... 10 22 5.6 60.0 57.3 96 .171 10. 26 9. 82Tennessee.......... ................... 14 19 5.3 58.4 52.6 90 .247 14.42 12.96Texas............................ ........ 9 28 5.1 59.8 50.3 84 .258 15. 43 12. 97Virginia................................. 11 14 5.3 58.6 50.9 87 .258 15.12 13.13Washington.......................... 19 57 5.6 48.1 45.0 94 .486 23. 38 21.87West Virginia....................... 7 13 5.8 60.0 56.7 95 .363 21. 78 20.60Wisconsin________________ 19 40 6.0 59.5 57.2 96 .325 19. 34 18.58
Total_____ ________ ____ 272 708 5,5 56.7 51.9 92 .319 18.09 16. 56Transfer men:
Alabama_________________ 13 34 5.3 60.7 53.2 88 .215 13. 05 11.45Arkansas_________________ 11 41 4.8 59.1 46.5 79 .260 15. 37 12.08California.............................. 11 43 5.7 54.1 52.4 97 .439 23. 75 23. 03Florida................................... 7 42 5.3 61.6 55.2 90 .200 12. 32 11.01Georgia.................................. 9 21 5.1 59.7 50.5 85 .183 10.93 9.24Idaho.............. ....................... 5 29 5.3 48.0 42.4 88 .545 26.16 23.12Louisiana________________ 18 88 5.5 59.8 56.1 94 .251 15. 01 14. 08Maine.................................... 4 4 6.0 56.5 56.5 100 .359 20. 25 20.25Michigan............................... 2 3 6.3 55.8 55.3 99 .340 18. 97 18.80Minnestota......................... 3 13 5.3 60.0 53.0 88 .340 20. 40 18. 04Mississippi............... ......... 12 42 4.9 58.9 48.4 82 .252 14. 84 12.19Montana.............................. 5 17 5.8 51.0 51.2 100 .474 24.17 24. 27North Carolina.................... 6 15 5.3 59.7 50.3 84 .255 15. 22 12. 83Oregon................................... 8 42 5.9 48.5 47.9 99 .532 25.80 25.47South Carolina........... ........ 7 35 5.4 60.1 53.3 89 .191 11.48 10.17Tennessee............................. 3 5 5.8 56.4 48.5 86 .282 15. 90 13. 68Texas..................................... 11 42 5.5 59.2 54.4 92 .257 15. 21 13. 97Virginia.......................... ....... 5 14 5.5 60.0 55.0 92 .249 14.94 13.68Washington........ ................. 20 153 5.8 48.0 47.5 99 .499 23.95 23.71West Virginia....................... 2 3 6.3 60.0 62.3 104 .348 20.88 21. 67W isconsin............................ 9 21 5.5 59.2 52.4 89 .330 19. 54 17.28Other States......................... 1 1 6.0 60.0 60.0 100 .300 18.00 18.00
Total.................................. 172 708 5.5 55.5 50.9 92 .341 18. 93 17.34
Digitized for FRASER http://fraser.stlouisfed.org/ Federal Reserve Bank of St. Louis

T a b l e A.— Average number of days on which employees worked, average full-time and actual hours and earnings per week, average earnings per hour, and per cent of full time worked, 1928, by occupation and State— C o n t in u e d
32 LUMBER INDUSTRY
Occupation and State
Trimmer loaders:A labam a............Arkansas.......... .California...........Florida................Georgia................Idaho...................Kentucky...........Louisiana...........M a in e ............Michigan............Minnesota_____Mississippi.........Montana.........North Carolina..Oregon................South Carolina..Tennessee...........Texas..................Washington.......West Virginia...Wisconsin..........Other States^....
Total..Trimmer operators:
Alabama.............Arkansas.............California...........Florida................Georgia________Idaho...................Kentucky...........Louisiana............M aine.................Michigan............Minnesota..........Mississippi.____Montana-----------North Carolina..Oregon_________South Carolina..Tennessee______Texas...................Virginia________Washington____West Virginia... Wisconsin...........
Total..................................Off-bearers (except on head
Alabama.............Arkansas .............California______Florida................Georgia. .............Id a h o ............... .Louisiana______Maine..................Michigan........... .Minnesota_____Mississippi.........Montana. ......... .North Carolina..O regon ..............South Carolina..Tennessee______Texas..................V irg in ia ........... .Washington____Wisconsin.........Other States___
Total_
Number of—
Es-tab-lish-
ments
122
1011766
1317171
208
Employ-
33722519122
418
252533368
6519
618
1109
271
630
585
342442 87 93 19 62 2443 19 458
19 112226
20 20
120 40
___1_860
Average
number of days
worked in one week
5.44.75.55.75.55.15.55.6 6.05.85.75.35.15.65.65.55.35.15.65.95.8 6.0
5.45.25.75.65.65.15.35.4 5.95.8 6.05.75.75.3 6.05.85.44.85.55.86.15.8
5.14.85.85.35.45.65.45.45.75.24.65.65.75.65.54.55.45.85.75.6 6.05.4
Average hours per week
Fulltime
60.659.156.5 61.459.148.060.0 60.156.359.060.058.748.160.848.4 60.0 59.759.448.1 60.059.6 60.055.2
60.5 58.955.861.659.148.056.758.0 58.459.060.059.049.960.048.9 60.057.858.858.2 48.1 61.0 59.655.8
Actually
worked
53.445.653.457.454.040.855.058.556.355.756.452.842.955.945.555.856.448.946.658.756.460.051.1
Per cent of
fulltime hours actually
worked
53.0 51.554.457.054.541.451.455.257.456.560.0 58.9 48.753.250.058.152.547.154.248.2 61.0 56.152.6
61.359.756.0 61.259.748.058.757.759.060.058.447.359.448.160.258.958.056.548.0 59.260.055.9
50.946.755.054.155.344.7 56.652.055.051.245.946.954.845.554.143.851.554.946.4 53.855.051.0
77959391 8592 97
10094 94 90 8992 949394 82979895
10093
96100100988£
105
10C10C
Average earnings—
Perhour
). 234 .286 .473 .244 .205 .451 .250 .286 .300 .363 .418 .293 .425 .253 .536 .203 .272 .334 .499 .353 .366 .270
.262
.322
.556
.309
.255
.528
.390
.328
.362
.423
.456
.374
.478
.282
.647
.261
.346
.341
.284
.664
.429
.401
.199
.246
.424
.207
.216
.439
.235
.309
.352
.352
.251
.420
.244
.456
.189
.296
.255.222
.471
.350
.400
.317
Perweek,
fulltime
$14.18 16.90 26. 72 14. 98 12.12 21.6515.0017.19 16.88 21.42 25.0817.20 20.44 15.38 25.94 12.18 16.24 19.8424.00 21.18 21.8116.2020.92
15.85 18.9731.0219.0315.07 25.34 22.11 19.0221.14 24.96 27.3622.0723.85 16. 92 31.64 15.66 20.00 20.05 16. 53 31.9426.14 23.9023.94
12. 20 14. 69 23. 74 12.67 12.9021. 0713. 79 17.83 20. 77 21.1214. 66 19.87 14. 49 21.93 11.38 17.43 14.79 12. 5422. 61 20. 72 24.0017. 72
Perweek,actual
$12.48 13.0325.26 14.00 11.0518.40 13.75 16. 75 16.8820.23 23.56 15.4818.24 14.1224.4011.3315.33 16.3123.26 20. 73 20.64 16.2019. 38
13.86 16.5930.27 17.62 13.91 21.85 20. 06 18.12 20. 78 23.89 27.36 22.0123.28 15.00 32.34 15.15 18.17 16.07 15.41 32.02 26.14 22.4 ft22.57
10.15 11.47 23.31 11.18 11.93 19. 61 13. 30 16.07 • 19.40 18.01 11.5119. 69 13. 3620. 72 10. 20 12. 9613.1512.16 21.89 18.84 22.0016.17
Digitized for FRASER http://fraser.stlouisfed.org/ Federal Reserve Bank of St. Louis

GENERAL TABLES 33T a b l e A .— Average number of days on which employees worked, average full-time
and actual hours and earnings per week, average earnings per hour, and per cent of full time worked, 1928, by occupation and State— C on tin u ed
Number of— Average
numAverage hours
per weekPer
cent of full
Average earnings—
Occupation and State Es-tab-lish-
ments
Employees
ber of days
worked in one week
Fulltime
Actually
worked
timehoursactually
worked
Perhour
Perweek,
fulltime
Perweek,actual
GradeFs:Alabama__ ______________ 21 45 5.7 61.1 56.4 92 $0.316 $19.31 $17.86
18.62Arkansas___________ _____ 15 75 5.3 59.5 50,9 86 .366 21.78California.- _____________ 14 102 5.9 55.8 55.8 100 .649 36.19 36.19Florida___________________ 12 49 5.6 61.0 56.8 93 .447 27.27 25.36Georgia__________________ 18 52 5.8 59.5 57.8 97 .513 30.52 29.69Idaho _____ _ _______ 5 119 5.5 48.0 45.0 94 .606 29.09 27.25K entucky.. _____________ 9 23 5.7 57.0 55.0 96 .566 32. 26 31.17Louisiana________________ 18 96 5.6 58.1 56.6 97 .380 22.08 21.48M a in e___________________ a 13 6.0 58.3 58.3 100 .378 22.04 22.04Michigan________________ 22 44 5.9 58.3 57.0 98 .457 26.64 26.09Minnesota________________ 4 69 5.4 60.0 52.5 88 .443 26.58 23.26Mississippi........................... 16 62 5.5 59.1 54.8 93 .373 22.04 20.43Montana ........... ............ 5 52 5.4 51.9 47.4 91 .551 28.60 26.14North Carolina.................. 15 42 5.2 61.3 52.5 86 .302 18. 51 15.86Oregon___________________ 14 129 5.8 48.2 49.3 102 .658 31. 72 32.45South Carolina___________ 10 41 5.7 60.4 57.4 95 .435 26. 27 24.97Tennessee________________ 19 68 5.6 57.8 54.0 93 .626 36.18 33. 84Texas ___________________ 11 86 5.5 57.9 54.2 94 .386 22. 35 20.88Virginia__________________ 8 11 5.5 60.1 56.0 93 .337 20. 25 18.87Washington______________ 21 250 5.7 48.0 47.1 98 .583 27. 98 27.44West Virginia........ ............ . 10 35 5.9 60.0 58.0 97 .591 35.46 34. 31Wisconsin............................ 19 99 5.8 59.7 56.5 95 .464 27. 70 26. 22
Total___________________ 292 1, 562 5.7 55.2 52.4 95 .503 27. 77 26. 38Sorters:
Alabama_________________ 20 198 5.2 60.3 50.7 84 .201 12.12 10.18Arkansas_______ _________ 15 191 5.3 59.0 50.6 86 .257 15.16 12. 99California........ ..................... 14 342 5.8 55.9 55.5 99 .502 28.06 27.85Florida___________________ 12 207 5.5 60.6 54.8 90 .219 13. 27 12.02Georgia___________________ 15 68 5.6 60.1 55.2 92 .208 12. 50 11.51Idaho. __________________ 5 124 5.5 48.0 44.4 93 .586 28.13 26.02Kentucky........................ ..... 9 26 5.2 57.9 51.4 89 .294 17.02 15.14Louisiana.............................. 18 391 5.3 50.3 52.3 88 .225 13.34 11.78Maine......... .......................... 3 11 4.6 57.7 44.3 77 .320 18. 46 14.18Michigan______ __________ 23 149 5.4 99.1 52.1 88 .348 20. 57 18.11Minnesota________________ 4 117 5.3 60.1 52.6 88 .397 23.86 20.90Mississippi_______ ___ ___ 16 402 5.1 59.2 49.9 84 .245 14. 50 12.21Montana............................... 5 73 5.5 50.6 47.8 94 .456 23. 07 21.82North Carolina......... .......... 9 52 5.1 62.0 49.8 80 .248 15. 38 12.34Oregon___________________ 14 398 5.6 48.3 46.3 96 .526 25.41 24.35South Carolina___________ 10 128 5.6 60.5 56.0 93 .189 11.43 10. 57Tennessee________________ 18 97 5.4 58.4 52.7 90 .280 16.35 14.76Texas____________________ 10 170 5.1 59.2 48.5 82 .258 15.27 12.51Virginia__________________ 4 19 5.6 60.0 55.9 93 .272 16.32 15.20Washington______________ 21 791 5.4 48.0 43.9 91 .502 24.10 22.08West Virginia____________ 10 51 5.6 60.2 54.8 91 .367
.33022.09 20.08
Wisconsin________________ 19 133 5.7 59.6 55.2 93 19. 67 18.21Total___________________ 274 4,138 5.4 55.5 49.9 90 .357 19.81 17.83
Truckers:Alabama_________________ 20 164 5.4 60.6 53.3 88 .202 12. 24 10. 75Arkansas______ __________ 15 367 5.1 59.2 49.2 83 .261 15.45 12.84California________________ 14 101 5.9 55.8 56.4
57.354.7
1019494
.484 27.01 27. 31Florida___________________ 12
1973 5.6
5.661.258.2
.227
.21513.89 12.98
11. 78Georgia__________________ 167 12. 51Idaho____________________ 4 66 5.9 48.0 48.4
50.910191
.486 23.33 23. 56Kentucky________________ 9 29 5.4 56.0 .298 16.69 15.19Louisiana________________ 18 309 5.4 59.4 52.7 89 .242 14.37 12.73Maine. _____ ___________ 10
2391 5.6 58.1 54.0 93 .331
.36119. 23 17.87
M ich igan______ ________ 180 5.7 59.3 56.0 94 21.41 20. 23Minnesota______________ _ 4 134 5.7
5.561.659.7
59.053.7
9690
.368 22. 67 21. 72M ississippi......................... 16 242 .256 16. 28 13. 77Montana_________________ 4 58 5.3 50.4 46.-6 92 .452 22. 78 21.04North Carolina.................. 16 66 5.4 60.9 54.8 90 .220 13. 40 12.05Oregon_________ _________ 14 196 5.9 49.0 50.1 102 .564 27. 64 28.28South Carolina___________ 10 101 5.6 59.7 55.7 93 . 197 11.76 10.96Tennessee__________ ____ _ 17 95 5.6 58.0 54.5 94
83.285 16.53 15.50
Texas_____________ _____ _ 11 220 5.1 58.7 48.6 .253 14. 85 12.31Virginia................................. 11 28 5.7 57.9 54.6 94 .235 13.61 12.80W ashington_______ _______ 21 247 5.8 48.1 49.3 102 .556 26.74 27.42West Virginia____________ 6 23 5.8 60.0 56.3 94 .386 23.16 21.69Wisconsin___ ___________ I 19 180 5.9 59.5 57.2 96 .331 19. 69 18. 91
Total_______ ___________ 293 | 3,137 5.5 57.3 52.8 92 .323 18. 51 17.04
Digitized for FRASER http://fraser.stlouisfed.org/ Federal Reserve Bank of St. Louis

34 LUMBER INDUSTRY
T a b l e A .— Average number of days on which employees worked, average full-time and actual hours and earnings per week, average earnings per hour, and per cent of full time worked, 1928, by occupation and State— C on tin u ed
Number of— Average
numAverage hours
per weekPer
ceat of f all-
Average earnings—
Occupation and State Es-tab-lish-
ments
Employees
ber of days
worked in one week
Fulltime
Actually
worked
time hours actually
wi >rked
Perhour
Perweek,full
time
Perweek,actual
Stackers, hand:Alabama.......... ..................... 19 258 5.2 60.4 50.9 84 $0. 239 $14.44 $12.14Arkansas_____ _____ _____ 15 450 5.0 59.1 48.7 82 .318 18.79 15. 48California........ ..................... 10 315 5.7 55.5 52.3 94 . 523 29.03 27. 38Florida................................... 10 247 5.3 61.8 53.9 87 .228 14.09 12.29Georgia.................. ............... 19 176 5.6 59.2 53.8 91 . 227 13. 44 12. 22Idaho............................... . 5 -87 5.5 48.0 45.4 95 . 797 38. 26 36. 21Kentucky............... ............. 4 27 5.5 59.1 53.9 91 .370 21.87 19.94Louisiana---------- --------------- 17 330 5.2 59.8 49.9 83 . 283 16.92 14.11Maine.................................. 9 48 4.3 59.3 41.9 71 .323 19.15 13.51Michigan............................... 22 222 5.5 59.1 52.8 89 .401 23. 70 21.18Minnesota......... - .......... ....... 4 106 5.8 60.0 57.6 96 .533 31. 92 30. 65Mississippi............... ............ 16 475 5.1 59.6 50.3 84 .278 16. 57 14.01Montana....................... ....... 5 64 5.4 49.8 45.3 91 .558 27. 79 25. 28North Carolina...... .............. 20 137 5.4 59.7 52.5 88 .275 1 16. 42 14. 45Oregon_____ ____ - .............. 11 195 5.8 48.0 47.0 98 .636 30. 53 29. 90South Carolina............. ....... 10 193 5.3 60.7 53.9 89 .198 12.02 10. 66Tennessee— ........................ 8 123 5.1 57.9 46.3 80 .322 18. 64 14. 90Texas............ ................. ....... 9 161 4.8 59.0 46.6 79 .272 16. 05 12. 68Virginia.--...................... . 16 66 5.3 59.6 52.9 89 .301 17. 94 15. 92W ash in gton ..----------------- 18 353 5.7 48.0 46.2 96 .670 32.16 30. 94West Virginia-------- ---------- 10 116 5.6 60.0 54.5 91 .398 23. 88 21.65Wisconsin----------------------- - 18 168 5.8 59.3 55.3 93 .391 23.19 21.65
Total___________________ 275 4,317 5.4 57.5 50.5 88 .371 21.33 18. 76Machine feeders, planing mills:
Alabama--------------------------- 21 162 5.6 60.5 54.8 91 .241 14. 58 13. 21Arkansas............ ............. . 12 130 5.1 59.1 49.8 84 .293 17. 32 14. 56California................... ......... 14 55 5.8 56.9 55.3 97 .482 27. 43 26. 64Florida...................... .......... 12 68 5.7 61.4 57.6 94 .230 14.12 13. 24Georgia_______ _. -------- 17 66 5.8 59.0 60.1 102 .323 19. 06 19.40Idaho................................... 5 113 5.2 48.0 42.4 88 .531 25. 49 22. 50K en tu ck y..-....................... 2 6 5.8 50.8 50.0 98 .608 30.89 30. 42Louisiana------------------------ 18 144 5.7 59.4 55.1 93 .291 17. 29 16.03Maine.............................. 11 15 5.5 58.7 53.2 91 .367 21. 54 19. 53Michigan....... ................... . 11 41 5.8 58.3 53,5 92 .388 22. 62 20. 77Minnesota............................ 4 50 5.4 60.0 52.6 88 .399 23.94 21.01Mississippi____ ____ _____ 14 126 5.5 59.9 55.3 92 .285 17.07 15. 77Montana-------------------------- 5 46 5.7 52.0 50.8 98 .477 24. 80 24. 25North Carolina................ . 10 26 5.7 58.8 54.0 92 .249 14. 64 13. 45Oregon.-. ----------------------- 14 175 5.8 48.1 48.2 100 .554 26. 65 26.71South Carolina----------------- 8 59 5.7 60.1 56.9 95 .223 13. 40 12. 69Tennessee------------------------- 5 26 5.6 57.7 54.3 94 .305 17. 60 16. 58T exas..................... .............. 11 98 5.3 58.9 51.5 87 .299 17. 61 15. 43Virginia............... ............ . 2 4 5.5 60.0 51.0 85 .308 18. 48 15.71Washington................... 21 276 5.6 48.0 45.8 95 .524 25.15 24.00West Virginia------------------- 6 16 5.7 60.0 54.1 f>0 .426 25. 56 23. 06Wisconsin.................... ........ 17 80 5.9 59.9 58.4 .350 20. 97 20. 47
Total................................. 240 1, 782 5.6 j 55.7 51.8 93 .373 20. 78 | 19.31Tallymen:
Alabama.......................... . 20 41 5.9 60.3 59.6 99 .301 18.15 17. 96Arkansas-------------- ---------- 2 4 4.5 59.0 42.8 73 .307 18.11 13.13California ______________ 13 73 5.9 55.4 56.0 101 .568 31.47 31.85F lorida ............................... 10 38 5.7 61.7 57.8 94 .331 20. 42 19.10Georgia___________________ 9 22 5.9 60.4 60.2 100 .271 16. 37 16. 33Idaho. ........... ........... ......... 3 9 5. 6 48.0 49.1 102 .488 23. 42 23. 95Kentucky.. _____________ 2 2 6.0 57.5 57.5 100 .337 19. 38 19.38Louisiana................. ............ 17 64 5.5 60.1 55.2 92 .369 22.18 20. 39M aine....................... ............ 12 18 6.0 58.8 58.8 100 .384 22. 56 22. 56Michigan.. _____ _______ _ 13 29 5.9 59.0 55.2 94 .356 21.00 19. 63Minnesota_______________ 3 13 5. 5 60.0 53.8 90 .336 20.16 18.07Montana_________ _____ _ 3 8 5.9 50.5 51.8 103 .525 26. 51 27.17North Carolina................ 10 21 5.8 60.2 57.8 96 .364 21.91 21.02Oregon.. ____ ____ _____ 13 74 5.8 48.2 49.3 102 .598 28. 82 29. 52South Carolina................... 8 38 5.8 60.4 58.0 96 .332 20.05 19. 25Tennessee_________ ______ 8 15 5.5 58.4 52.7 90 .297 17. 34 15. 67Texas. __________________ 8 16 5.8 58.8 58.0 99 .440 25. 87 25. 51Virginia...... ..................... . 7 13 5.6 60.5 55.7 92 .307 18. 57 17.07W ashington........................ 18 151 5.8 48.1 49.0 102 .615 29. 58 30. 09West V irg in ia .................... 3 7 5.3 60.0 52.4 87 .419 25.14 21. 95W iscon sin ........................ . 12 23 5.8 59.4 55.1 93 .352 20. 91 19.41Other States______________ 1 1 6.0 60.0 70.0 117 .225 13. 50 15. 75
Total................................. . 195 680 5. 8 i 55.3 54.0 98 .451 | 24.94 24. 36
Digitized for FRASER http://fraser.stlouisfed.org/ Federal Reserve Bank of St. Louis

GENERAL TABLES 35T a b l e A .— Average number of days on which employees worked, average full-time
and actual hours and earnings per week, average earnings per hour, and per cent of full time worked, 1928, by occupation and State— Continued
Number of— Average
numAverage hours
per weekPer
cent of full
Average earnings—
Occupation and State Es-tab-lish-
ments
Employ-
ees
ber of days
worked in one week
Fulltime
Actually
worked
timehoursactually
worked
Perhour
Perweek,
fulltime
Perweek,actual
Millwrights:Alabama_________________ 19 36 6.1 60.9 64.7 106 $0. 486 $29.60
32.36 41.18 34.1629. 58
$31.46 31.79 42. 99 36.4730. 6535. 65 37.8936. 6331. 51
Arkansas_________________ 15 33 5.7 59. 7 58. 6 98 .542 . 742California________________ 13 56 6.0 55.5 57.9 104 .
Florida................................... 12 23 5.9 61.0 65.1 107 . 560Georgia............. ..................... 14 15 5.9 59.4 61.6 104 .498Idaho................. .................. 5 19 5.5 48.0 48.1 100 .741 35. 57Kentucky.............................. 4 4 6.3 58.8 62.4 106 .607 35. 69Louisiana____________ ___ 17 53 6.2 58. 6 67.9 116 . 539 31. 59Maine. ................................. 11 13 6.0 59. 2 59.7 101 . 528 31. 26Michigan____ _____ ______ 21 39 6.3 60.4 63.9 106 . 525 31. 71 33. 55M innesota.................. ........ 4 19 6.1 64.4 64.1 100 . 560 36.06 35. 86
35. 80Mississippi.......................... 14 42 5.7 65.5 66.0 101 . 542 35.50M ontana............................. 4 7 6.3 54.0 58.9 109 .619 33.43 36. 44North Carolina___________ 14 15 6.0 60.5 62.6 103 . 531 32.13
37.9033. 28 42* 85Oregon. __ 13 75 6.3 48.4 54.8 113 .783
South Carolina___________ 10 21 5.6 60.0 59.1 99 .473 28.38 28.00Tennessee.............................. 9 13 6.2 59.2 66.1 112 . 570 33. 74 37. 65Texas.......................... .......... 11 22 6.4 58.0 64.0 n o .591 34. 28 37. 78Virginia.. _______ _____ 8 10 5.5 60.6 59.0 97 .434 26. 30 25. 63Washington_______ ______ 21 141 6.1 48.4 53.1 n o .716 34. 65 38.02West Virginia....................... 6 13 6.4 60.0 68.2 114 .589 35. 34 40.18Wisconsin............................. 18 32 6.3 59.6 63.0 106 .498 29. 68 31.38
T otal................................. 263 701 6.1 56.0 59.8 107 .611 34. 22 36. 49Laborers:
Alabama_________________ 21 1,795 1,472
5.0 60.5 49.4 82 . 198 11.98 9. 77Arkansas...................... ....... 15 5.0 59.2 48.0 81 .243 14. 39 11. 64California__________ 14 1,078
8646.6 56.4 53.1 94 .423 23. 86 22. 45
Florida.... ................. . 12 5.3 61.4 53.7 87 .207 12. 71 11.10Georgia................................. 19 704 5.4 59.5 52.5 88 . 185 11.01 9. 71Idaho _____ _____ 5 569 5.1 48.0 41. 5 86 .460 22. 08 19.09Kentucky................... .......... 9 164 5.2 57.0 49.7 87 .267 15. 22 13. 26Louisiana___________ . __ 18 1,950 5.2 59.5 51.6 87 .231 13. 74 11.90M aine......................... .......... 12 192 5.3 59.5 52.0 87 .301 17. 91 15. 66Michigan........... ................... 23 828 5.4 59.0 51.7 88 .345 20. 36 17. 83Minnesota_________ _____ 4 753 5.3 60.1 52.6 88 .363 21.82 19.10Mississippi_______________ 16 1, 967 5.1 59. 7 50. 6 85 .237 14.15 11.97Montana______ __________ 5 422 5.1 50.6 43.9 87 .436 22. 06 19.13North Carolina___________ 23 1, 052 5.0 60.2 49.2 82 .213 12.82 10.48Oregon___________________ 14 1, 528 5.6 48.3 46.7 97 .486 23. 47 22.69South Carolina.......... .......... 10 785 5.2 60.2 51.2 85 . 165 9. 93 8. 48Tennessee........ .................... 19 688 5.4 58.2 51.9 89 .248 14.43 12. 85Texas....... ............................. U 915 4.9 57.6 47.7 83 .242 13. 94 11. 57Virginia__________________ 14 366 5.2 60.1 51.1 85 .247 14. 84 12. 62Washington.......................... 21 2,510
3135.5 48.0 44.7 93 .488 23. 42 21. 79
West Virginia....................... 10 5.5 60.1 53.6 89 .354 21. 28 18. 98W isconsin............................ 19 1,111 5.6 59.6 53.4 90 .322 19.19 17.19
Total................................... 314 22,026 5.3 56.9 49.6 87 .303 17. 24 15. 05Other employees:
Alabama_________________ 21 487 5.7 60.0 57. 7 96 .325 19. 50 18. 78Arkansas________ _____ __ 15 994 5.4 59.3 53.2 90 .367 21. 76 19.50California__________ _____ 14 756 5.9 56.3 56.8 101 .555 31. 25 31.50Florida___________________ 12 315 5.6 61.1 58. 5 96 .352 21. 51 20. 57Georgia________ ______ ___ 19 178 5.8 59.4 56.7 95 .338 20.08 19.17Idaho . __________________ 5 390 5.5 48.1 45.8
52.595 .573
.38627. 56 26. 28
Kentucky________________ 9 48 5.4 57.9 91 22. 35 20. 27Louisiana________________ 18 1,025
1345.7 59.6 56.9 95 .339 20.20 19.30
Maine____________________ 12 5.7 59.5 56.0 94 .396 23. 56 22.15Michigan_________________ 23 341 5.8 59.4 56.0
58.994 .416 24. 71 23.31
Minnesota.................... ........ 4 303 5.9 60.9 97 .414 25.21 24.40Mississippi........ ..... .............. 16 891 5.7 59.9 57.9 97 .358 21.44 20. 71Montana____________ ____ 5 188 5.6 51.7 47.8 92 .520 26. 88 24. 84North Carolina___________ 23 267 5.7 60.3 57.5 95 .331 19.96 19.03Oregon...... ........ .................. 14 850 5.9 48.6 50.0 103 .628 30. 52 31.36South Carolina___________ 10 296 5.5 60.3 55.9 93 .320 19. 30 17. 89Tennessee______ _________ 20 234 5.5 58.4 53.4 91 .374 21. 84 19. 95Texas____________________ 11 356 5.6 58.6 55.5 95 .353 20. 69 19. 59Virginia................. ................ 13 109 5.7 60.9 57.8 95 .384 23. 39 22.17Washington.____ ________ 21 1,413
1045.8 48.1 47.9 100 .604 29.05 28.92
West Virginia.......... ......... . 10 5.7 60.1 56.9 95 .427 25. 66 24. 28Wisconsin........................ ..... 19 292 5.8 59.7 57.1 96 .411 24. 54 23. 49
T o ta l--.--—— ...... .......... 314 9, 971 5.7 56.3 54.1 96 1 .438 j 24. 66 23. 67
Digitized for FRASER http://fraser.stlouisfed.org/ Federal Reserve Bank of St. Louis
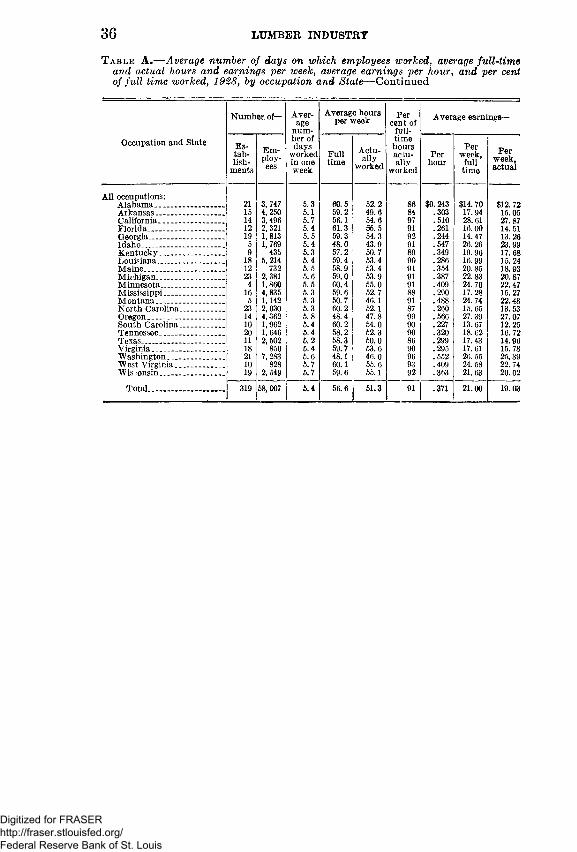
36 LUMBER INDUSTRY
T a b l e A,— Average number of days on which employees worked, average full-time and actual hours and earnings per week, average earnings per hour, and per cent of full time worked, 1928, by occupation and State— Continued
Number, of— Average
num
Average hours per week Per
cent of full
Average earnings—
Occupation and State Es-tab-lish-
ments
Employees
ber of days
worked in one week
Fulltime
Actually
worked
timehoarsactually
worked
Perhour
Perweek,
fulltime
Perweek,actual
All occupations:Alabama ___________ __ 21 3,747
4, 2505.3 60.5 52.2 86 $0.243 $14.70
17.94$12.72 15.05Arkansas_________________ 15 5.1 59.2 49.6 84 .303
California____________ ___ 14 3,496 2, 321 1,813
5.7 56.1 54.6 97 .510 28.61 27. 87Florida................................ 12 5.4 61.3 56.5 91 .261 16.00 14. 51Georgia___________________ 19 5.5 59.3 54.3 92 .244 14.47 13.26Idaho _ __________________ 5 1, 769
4355.4 48.0 43.9 91 .547 26.26 23.99
Kentucky________ _____ 9 5.3 57.2 50.7 89 .349 19.96 17. 68Louisiana_________________ 18 5, 214
7325.4 59.4 53.4 90 .286 16.99 15.24
Maine____________________ 12 5.5 58.9 53.4 91 .354 20. 85 18.93Michigan_________________ 23 2,381 5.6 59.0 53.9 91 .387 22. 83 20.87Minnesota________________ 4 1,860
4, 835 1,142 2, 030 4, 362
5.5 60.4 55.0 91 .409 24. 70 22. 47Mississippi_____ _____ ___ 16 5.3 59.6 52.7 88 .290 17. 28 15. 27Montana ________________ 5 5.3 50.7 46.1 91 .488 24. 74 22.48North Carolina_________ 23 5.3 60.2 52.1 87 .260 15. 65 13. 53Oregon __________________ 14 5.8 48.4 47.8 99 .566 27.39 27.07South Carolina___________ 10 1,962 5.4 60.2 54.0 90 .227 13.67 12. 25Tennessee......................... . 20 1,646 5.4 58.2 52.3 90 .320 18. 62 16.72Texas......... ................. .......... 11 2, 502 5.2 58.3 50.0 86 .299 17.43 14.96Virginia ........... ..... .............. 18 850 5.4 59.7 53.6 90 .295 17.61 15.78Washington _____________ 21 7,283
8285.6 48.1 46.0 96 .552 26. 55 25.39
West Virginia _________ 10 5.7 60.1 55.6 93 .409 24. 58 22.74Wis ons i n _______________ 19 2,549 5.7 59.6 55.1 92 .363 21.63 20. 02
T o ta l______________ . . . » 319 58,007 5.4 56.6 51.3 91 .371 21.00 19.03
Digitized for FRASER http://fraser.stlouisfed.org/ Federal Reserve Bank of St. Louis

T a b l e B .— Average and classified earnings per hour in eight specified occupations, 1928, by State
Number of—Aver
Number of employees whose classified earnings per hour were—
Occupation and State Establish
mentsEm
ployees
ageearningsper
hour
Under10
cents
10and
under12
cents
12and
under14
cents
14and
under16
cents
16and
under18
cents
18and
under20
cents
20and
under25
cents
25and
under30
cents
30and
under40
cents
40and
under50
cents
50and
under60
cents
60and
under70
C’nts
70and
ander80
cents
80 ! and under
90 cents
90centsand
under$1
$1and
under$1.10
$1.10and
under$1.25
$1.25andover
Sawyers, head, band:Alabama.............................. ....... 17 32 $0.820 11 g 13
7Arkansas................... ................. 15 35 .847 134 121214
3California________________ 14 56 1.029 2 2 15 9 12Florida........................................ 9 23 .893 4 152Georgia............................. .......... 12 14 .828 1 5 2Idaho________________________ 5 22 .945 i 221
18Kentucky.......... ........ ............... 8 10 .754 1 1 1 3 2Louisiana____________________ 16 53 .872 4 3 21
117Q
gMaine_____ __________________ 10 12 .684 1 3 7Michigan__________________ 21 41 .768 4 18
112Minnesota__________________ 4 30 .844 13
285
Mississippi..............................* 16 53 .884__
2 21 1 1Montana________________ 5 14 .982 9North Carolina____________ 23 33 .697 2 1 1 10 10 8 113Oregon........................................ 14 48 1.146 2 17 16South Carolina....................... 9 17 .781 1 1 2 11 2Tennessee.................................... 20 27 .875 1 2 2 5 8 9
T exa s .......................................... 11 34 .903 165
11 1 gVirginia____________________ 11 18 .695 1 6 gWashington_______________ 19 51 1.176 1 164
5 113 17 16West Virginia_______________ 10 18 .806 2 6 1Wisconsin______________ _____ 19 27 .764 22 1
Total__________ ___________ 288 668 .887 1 3 4 9 32 128 161 158 78 50 45Doggers:
Alabama_____________________ 20 82 .2371 I
1 52I
27 21 1 1 i
IArkansas____________________ 15 92 .286 2 46 44California____________________ 9 24 .436 6 15 3Florida......... .............................. 10 28 .237 2 14 11 1Georgia_______ _______ ____ 16 35 .215 4 2 1 20 7 1Idaho......................................... 2 10 .460 6 4Kentucky........ .......................... 8 19 .345 4 11 3 1Louisiana............................. 17 94 .281 7 51 36Maine_______________________ 11 19 .328 3 16Michigan_______________ __ 23 51 .407 12 39Minnesota__ .____________ 4 34 .525 34
GENERAL
TAB
LES
Digitized for FRASER http://fraser.stlouisfed.org/ Federal Reserve Bank of St. Louis
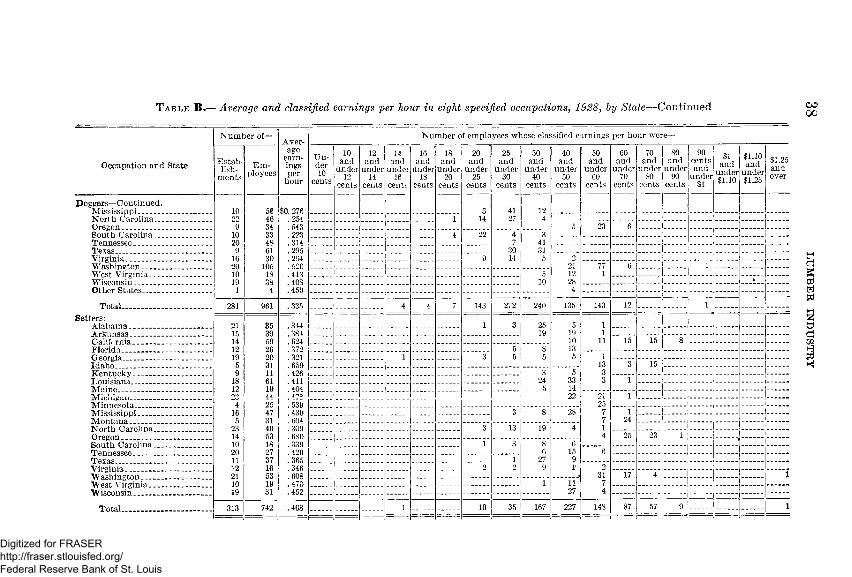
T a b l e B.— Average and classified earnings per hour in eight specified occupations, 1928, by State— Continued 0300
Occupation and State
Number of— Average
earningsper
hour
Number of employees whose classified earnings per hour were—
Establish
mentsEm
ployees
Under10
cents
10and
under12
cents
12and
under14
cents
14and
under16
cents
16and
under18
cents
18and
under20
cents
20and
under25
cents
25and
under30
cents
30and
under40
cents
40and
under50
cents
50and
under60
cents
60and
under70
cents
70and
under80
cents
80and
under90
cents
90centsand
under$1
$1and
under$1.10
$1.10and
under$1.25
$1.25andover
Doggers—Continued.10
910209
162010191
56463433486130
10518384
$0. 276 .254 .543 .223 .314 .295 .264 .520 .413 .408 .450
144127
1241
5 23 64 22 4
73014
3413159 2
2112284
W ashington 771
6 1West Virginia 5
10WisconsinOther States
Total 281 961 .335 4 4 7 143
1
272 i 240 135 143 12 1Setters:
Alabama i 2115 14 1219 5 9
1812
2416 5
23141020 11 12 21 10 19
353959262031116119
.344
.384
.624
.372
.321
.650
.426
.411
.404
3 2519
51910135
11
11ArkansasCalifornia 15 15 8Florida 5
585Georgia 1 3 1
1333
Idaho 3 15Kentucky 3
245
5331422
Louisiana 1Maine
21257714
1Minnesota 25 .539
.430
.604
.309
.680
.339
.420
.365
.346
.608
.470
.452
Mississippi 4731405318273716531931
3 8 28 124Montana
North Carolina 3 13 19 4 iOregon 25 23 1South Carolina 1 3 8
6279
61591'
Tennessee 6Texas 1
2Virginia 2 23174
W ash ington 17 4 1West Virginia 1 i r
27W isconsin
Total........................................ 313 742 .468 1 10 35 167 227 148 87 57 9 1
LUMBER
IND
UST
RY
Digitized for FRASER http://fraser.stlouisfed.org/ Federal Reserve Bank of St. Louis
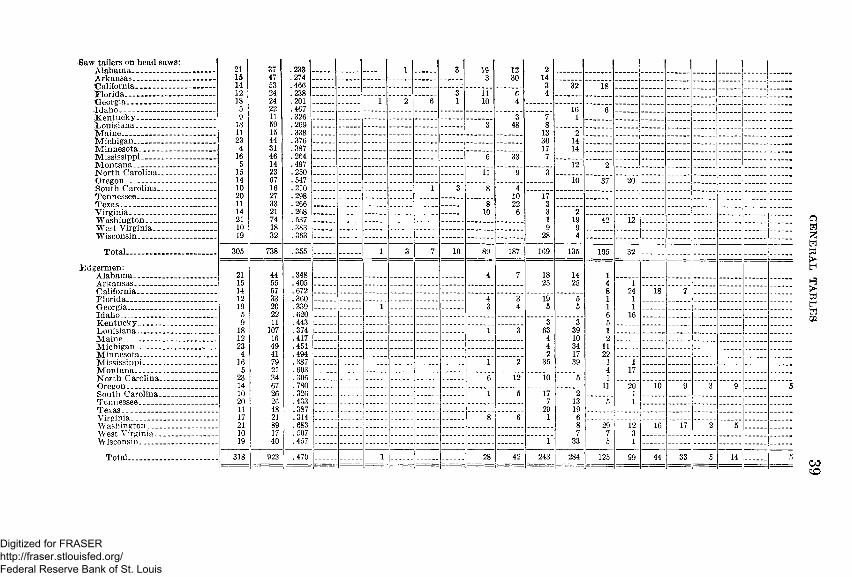
Saw tailers o n head saws:Alabama........................Arkansas............... ........'California.....................Florida-----------------------•Georgia.........................Idaho.............................-K entucky..............•Louisiana------------------M aine-----------------------M ichigan......................Minnesota....................Mississippi...................M on ta n a ....................North Carolina----------Oregon........................South Carolina...........Tennessee........ ............Texas_______________-Virginia-------- ------------Washington. . .............West Virginia------------Wisconsin___________
T ota l-
Edgermen:Alabama.............Arkansas.........California............Florida................Georgia................Idaho__________Kentucky...........Louisiana______Maine...... ............Michigan.............Minnesota....... .Mississippi........ .M ontana_______North Carolina..Oregon_________South Carolina..Tennessee.......... .Texas...................Virginia________Washington____West Virginia. _. Wisconsin______
Total..
21 37 .233 1 3 19 12 215 47 .274 3 30 14 *14 53 3 32 1812 24 .238 3 11 6 418 24 .201 1 2 6 1 10 45 22 .467 16 69 11 .326 3 7 1
18 59 .269 3 48 811 15 .338 13 223 44 .376 30 144 31 .387 17 14
16 46 .264 6 33 75 14 .497 12 2
15 23 .250 11 9 314 67 .547 10 37 2010 16 .210 1 3 8 420 27 .298 10 1711 33 .266 8 22 314 21 .268 10 6 3 221 74 . 537 1 19 42 1210 18 .383 9 919 32 .363 28 4
305 738 .355 1 3 7 10 89 187 169 135 105 32
21 44 .348 4 7 18 14 115 55 .405 25 25 4 114 57 .672 8 24 18 712 33 .360 4 3 19 5 1 119 20 .339 1 3 4 5 5 1 15 22 .620 6 169 11 .443 3 3 5
18 107 .374 1 3 63 39 112 16 .417 4 10 223 49 .451 4 34 114 41 .494 2 17 22
16 79 .387 1 2 35 39 1 15 21 .603 4 17
23 34 .305 6 12 10 5 114 67 .780 11 20 10 9 3 9 510 26 .326 1 5 17 2 120 26 .433 7 13 5 111 48 .387 29 1917 21 .314 8 6 1 621 89 .683 8 29 12 16 17 2 510 17 .507 7 7 319 40 .457 1 33 5 1
318 923 .470 1 28 42 243 284 125 99 44 33 5 14 5i- 1 — CO
CO
GEN
ERAL TA
BLE
S
Digitized for FRASER http://fraser.stlouisfed.org/ Federal Reserve Bank of St. Louis
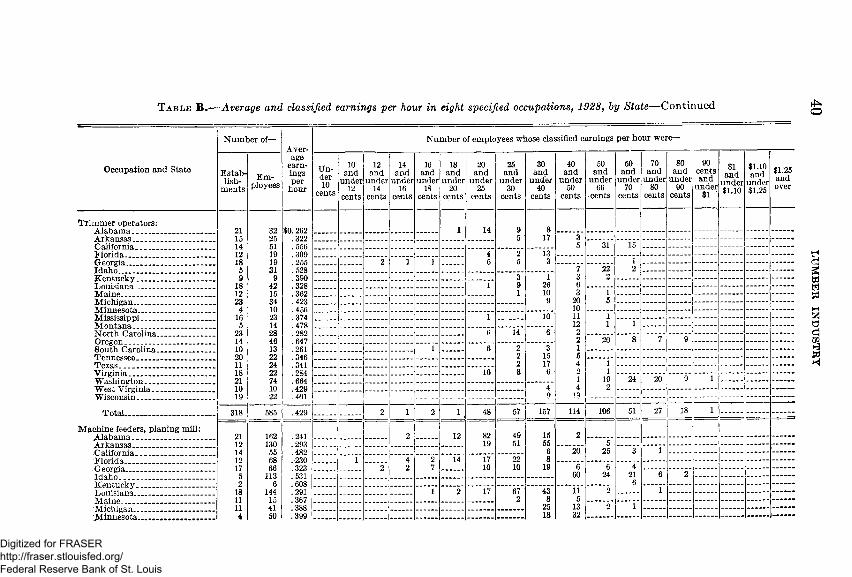
T a b l e B .— Average and classified earnings per hour in eight specified occupationst 1928, by State— Continued
Number of—Aver
Number of employees whose classified earnings per hour were—
Occupation and State Establish
mentsEm
ployees
ageearningsper
hour
Under10
cents
10and
under12
cents
12and
under14
cents
14and
under16
cents
16and
under18
cents
18and
under20
cents'
20and
under25
cents
25and
under30
cents
30and
under40
cents
40and
under50
cents
50and
under60
cents
60and
under70
cents
70and
under80
cents
80and
under90
cents
90centsand
under$1
$1and
under$1.10
$1.10and
under$1.25
$1:25andover
Trimmer operators:21151412185
3225511919319
$0.262 .322 .556 .309 .255 .528
1 14 9 85 17 3
5 31 154 2 13
frPArcria 2 1 1 6 5 3 1Idaho 7 22 2Kentucky 9
1812
.390
.328
.362
3 1 3 2T .rvniciQTici 42
151 9 26 6
Maine 1 10 3 1TWiphifffln 234
3410231428461322
.423
.456
.374
.478
.282
.647
.261
.346
.341
.284
.664
.429401
9 20 5Minnesota 10Mississippi 16
51 10 11 1
A/T nntoTifl 12 1 1‘NTnrth flnmlinn 23
1410201118211019
6 14 6 2Orpcnn 2 20 8 7 9
1 6 2 3 1Tennessee 2 15 5
24 2 17 4 1Viren nia 22
741022
10 3 6 2 1Wfl'jhirtcrf'nTi 1 19 24 20 9 1West Virginia_______________Wisconsin___________________
4 4 2Q
Total.........................................i
318 585 .429 2 1 2 1 48 57 157 114 1-06 51 27 18 1
Machine feeders, planing mill:A lohcjmo 21
121412175
1621305568
.241
.293
.482
.230
.323
.531
. 608
2 12 82 49 15 2A tItqtiqqq 19 51 55 5
6 20 25 3 1T?1 / T*l H Q 1 4 2 14 17 22 8
66113
6
2 2 7 10 10 19 6 6 460 24 21 6 2
2 6T ,nnici q tiq 18
11114
144 291 1 2 17 67 43 11 2 1 _1541
.367
.3882 8 5
■ 1VT i ph i era n 25 13 2 1M in n e s o ta ... .. . . . . . . ................ 50 .399 18 32
Digitized for FRASER http://fraser.stlouisfed.org/ Federal Reserve Bank of St. Louis

Mississippi____M ontana...........North Carolina.Oregon________South Carolina.Tennessee_____Texas.................Virginia_______Washington___WTest Virginia.. Wisconsin_____
Total...... ........
Laborers:Alabama______Arkansas______California_____Florida________Georgia________Idaho..............Kentucky_____Louisiana..........Maine_________Michigan.........Minnesota____Mississippi____M ontana.........North Carolina.Oregon________South Carolina.Tennessee........ .Texas................ .V irginia..........Washington___West Virginia.. Wisconsin_____
Total________
14 126 .285 11 70 38 5 25 46 .477 26 2010 26 .249 1 1 2 11 6 2 2 1
14 175 .554 2 28 122 19 1 1 1 18 59 .223 2 6 8 1 22 12 85 26 .305 2 7 15 2
11 98 .299 1 10 46 33 3 4 12 4 .308 4
21 276 .524 76 174 20 4 26 16 .426 5 7 4
17 80 .350 75 5240 1, 782 .373 1 • 4 15 20 31 201 342 379 303 391 75 13 3 2 1 1
21 1,795 .198 6 26 80 76 195 310 979 97 17 915 1,472 .243 2 24 6 635 694 96 4 10 114 1,078 .423 1 399 562 90 1 22 312 864 .207 5 5 92 189 66 288 199 19 119 704 .185 1 5 59 154 146 78 187 61 135 569 .460 4 18 472 36 20 8 8 39 164 .267 4 1 33 80 43 318 1,950 .231 7 7 28 97 1,138 606 66 112 192 .301 13 63 109 3 2 2
23 828 .345 4 737 68 10 7 24 753 .363 625 107 18 316 1,967 .237 2 10 11 1,223 661 55 55 422 .436 9 371 40 223 1,052 .213 4 15 37 115 125 505 240 10 114 1,528 .486 52 805 626 19 13 9 410 785 .165 2 15 87 322 191 63 87 16 219 688 .248 1 2 1 217 436 3111 915 .242 408 460 46 114 366 .247 1 3 6 11 188 91 62 421 2, 510 .488 51 1, 716 540 76 62 35 13 1110 313 .354 19 254 4019 1,111 .322 7 1,078 19 7
314 22,026 .303 9 56 253 700 907 768 5, 9P1 3,739 3,792 4,192 1,379 131 107 52 20 14 6
GEN
ERAL TA
BLE
S
Digitized for FRASER http://fraser.stlouisfed.org/ Federal Reserve Bank of St. Louis
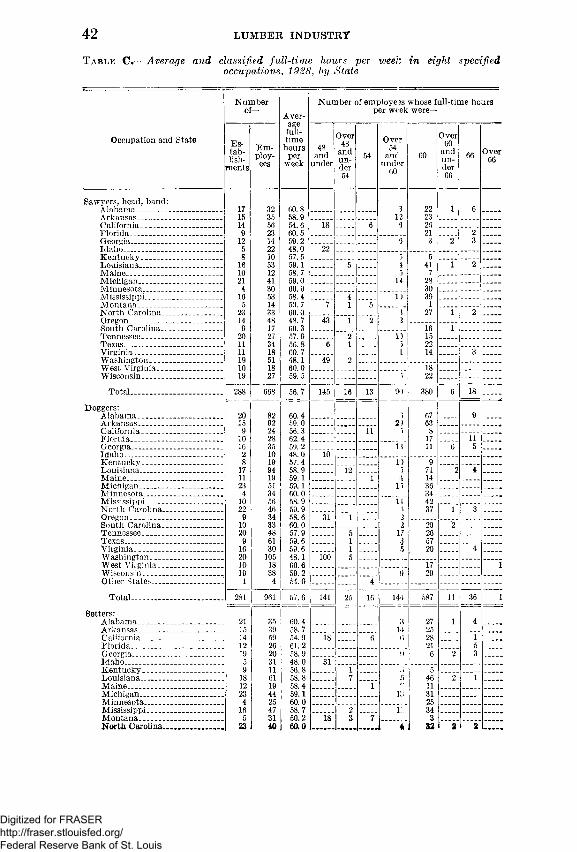
42 LUMBER INDUSTRY
T a b l e C.— Average and classified full-time hours per week in eight specifiedoccupations, 1928 , by State
Numberof— Aver
Number of employe es whose full-time hours per we ek were—
Occupation and State Es-tab-lish-
ments
Em ployees
agefulltimehours
perweek
48and
under
Over48
andunder54
54
Over54
ancunder
60
60
Over60
andunder66
66 Over66
Sawyers, head, band:17 32 60. 8 3 22 1 615 35 58.9 2314 56 54.6 18 6 269 23 60. 5 21 2
12 14 59.2 >3 3 2 35 22 48.0 228 10 57.5 5 5
Louisiana_____________ ______ 16 53 59.1 5 1 41 1 2Maine ______________________ 10 12 58.7 7M ichigan____________________ 21 41 59.0 1 i 28M innesota___________________ 4 30 60.0 30
16 53 58.4 4 1) 395 14 50.7 7 1 5 1
North Carolina _____________ 23 33 60.0 I 27 1 214 48 48. 7 43 1 2 2
South Carolina_______________ 9 17 60.3 16 120 27 57.9 2 1) 1511 34 56. 8 6 1 22
Virginia _________________ 11 18 60. 7 L 14 3Washington _________________ 19 51 48.1 49 2West Virginia________________ 10 18 60.0 18Wisconsin____________________ 19 27 59.5 22
Total_______________________ 288 668 56.7 145 16 13 90 380 6 18 .Doggers:
Alabama__ __________________ 20 82 60.4 67 9Arkansas ____ ___________ 15 92 59. 0 2) 63California _____________ ___ 9 24 56.3 11 8Florida_______________________ 10 28 62.4 17 11Georgia_______________ ______ 16 35 59. 2 li 11 6 5Idaho________________________ 2 10 48.0 10Kentucky __________________ 8 19 57.4 10 9Louisiana___________________ 17 94 58.9 12 71 2 4Maine ________________ 11 19 59.1 1 4 14Michigan_____________________ 23 51 59.1 1 ) 36Minnesota___________________ 4 34 60.0 34Mississippi _________________ 10 56 58.9 It 42North Carolina_______________ 22 46 59.9 37 1 3Oregon . _______ ________ 9 34 58. 6 31 1South Carolina_______________ 10 33 60. 0 29 2Tennessee____________________ 20 48 57.9 5 17 26T exa s_______________________ 9 61 59. 6 1 57Virginia.. ___________________ 16 30 59. 6 1 5 20 4Washington __ ______________ 20 105 48.1 100 5West Virginia________________ 10 18 60.6 17 1Wisconsin __________________ 19 38 59.2 9 29Other States............................ . 1 4 54.0 4
Total_______________________ 281 961 57.6 141 25 16 144 587 11 36 1
Setters:Alabama_____________________ 21 35 60.4 H 27 1 4A rkansas_________ _________ 15 39 58.7 14
ii25
California____________________ 14 59 54.9 18 6 28 1F lorid a______________________ 12 26 61.2 21 5Georgia_______________________ 19 20 58.9 !l 6 2 3Idaho_________________ ______ 5 31 48.0 31Kentucky____________________ 9 11 56.8 1 5Louisiana____________________ 18 61 58.8 7 f> 46 2 1Maine________________________ 12 19 58.4 1 11Michigan_____________________ 23 44 59.1 11! 31Minnesota___________________ 4 25 60.0 25Mississippi___________________ 16 47 58.7 2 l: 34Montana. ___________________ 5 31 50.2 18 3 7 3North Carolina........................... 23 40 6a o 32 2 2
Digitized for FRASER http://fraser.stlouisfed.org/ Federal Reserve Bank of St. Louis
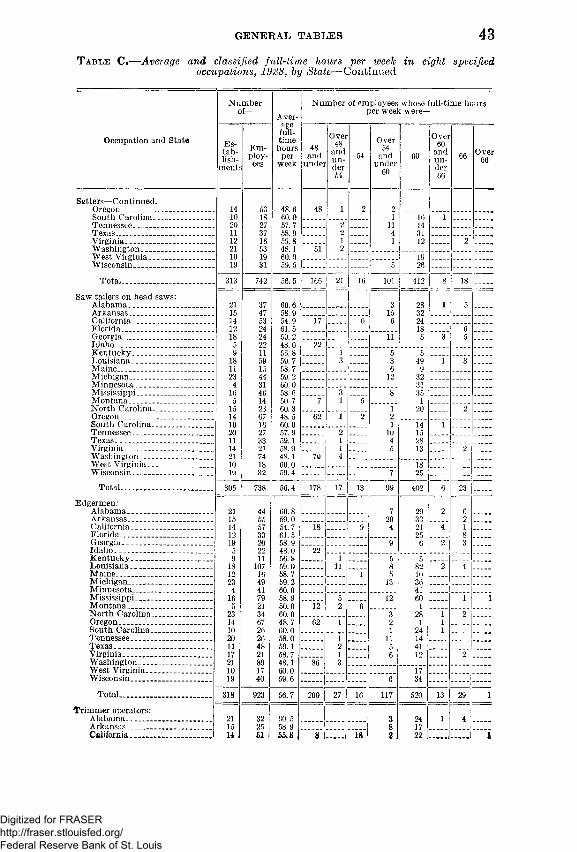
GENERAL TABLES 43T a b l e C .— Average and classified full-time hours per week in eight specified
occupations, 1928, by State— Continued
Numberof— Aver
Number of employees whose full-time hours per week w ere—
Occupation and State Es-tab-lish-
ments
Employees
agefulltimehours
perweek
48and
under
Over 48
and , un
der 54
54
Over54
andunder
60
60
Over60
andunder66
66 Over66
Setters—Continued.Oregon__ _______ _______ 14 53 48.6 48 1 2 2South Carolina.................. ........ 10 18 60.0 1 16 1Tennessee.................... ............... 20 27 57.7 2 11 14Texas________________ ______ _ 11 37 58.9 2 4 31Virginia. ________ ____ ___ 12 16 59.8 1 1 12 2Washington _________________ 21 53 48.1 51 2West Virginia________________ 10 19 60.0 19Wisconsin____________________ 19 31 59.5 5 26
Total_______________________ 313 742 56.5 166 21 16 101 412 8 18 ____Saw tailers on head saws:
Alabama . . . ....... 21 37 60.6 3 28 1 5Arkansas _ ____ _ ___ 15 47 58.9 15 32California____________________ 14 53 54.9 17 6 6 24Florida_______________________ 12 24 61. 5 18 6Georgia______________________ 18 24 59. 2 11 5 3 5Idaho ........... ............................ 5 22 48.0 22Kentucky................. ................... 9 11 56.8 1 5 5Louisiana ____ ___________ 18 59 59. 7 3 3 49 1 3Maine. __________________ 11 15 58. 7 6 9Michigan__________________ 23 44 59. 2 12 32Minnesota .......... ....................... 4 31 60.0 31Mississippi........... ...................... 16 46 58. 6 3 8 35Montana .................................... 5 14 50. 7 7 1 5 1North Carolina........................ . 15 23 60.3 1 20 2Oregon. __ _ ________ _____ _ 14 67 48. 5 62 1 2 2South Carolina........................... 10 16 60.0 1 14 1Tennessee.... .......... .................... 20 27 57.9 2 10 15Texas. ____________________ 11 33 59.1 1 4 28Virginia_______ ____ _________ 14 21 58.9 1 5 13 2Washington__________________ 21 74 48.1 70 4West Virginia________________ 10 18 60.0 18Wisconsin _______________ _ 19 32 59.4 7 25
Total......................................... 305 738 56.4 178 17 13 99 402 6 23Edgermen:
Alabama_____________________ 21 44 60. 8 7 29 2 6Arkansas. ............................... . 15 55 59.0 20 33 2California_______________ ____ 14 57 54. 7 18 9 4 21 4 1Florida......................................... 12 33 61. 5 8Georgia....................................... 19 20 58.9 9 "e 2 3Idaho ................................ ....... 5 22 48.0 22Kentucky____ ______ ________ 9 11 56.8 1 5 5Louisiana_________ ____ ____ 18 107 59.0 11 8 82 2 4Maine_______ __________ _____ 12 16 58. 7 1 5 10Michigan. .................. ........... . 23 49 59.2 13 36Minnesota.............................. . 4 41 60.0 41M ississippi............. .................. 16 79 58.9 5 12 60 1 1M o n ta n a ....... ............ ............... 21 50.0 12 2 6 1North Carolina.............. ........... 23 34 60.0 3 28 1 2Oregon...... .................................... 14 67 48.7 62 1 2 1 1South C arolina......................... 10 26 60.0 1 24 1Tennessee.................................... 20 26 58.0 1 11 14Texas ............................. ............ 11 48 59.1 2 5 41Virginia........ ............................... 17 21 58.7 1 6 12 2Washington................................. 21 89 48.1 86 3West Virginia............................ . 10 17 60.0 17Wisconsin............. ....................... 19 40 59.6 6 34
Total______________ ________ 318 923 56.7 200 27 16 117 520 13 29 1
trim m er operators:Alabama_____________________ 21 32 60. 5 3 24 1 4Arkansas ........... ........................ 15 25 58.9 1 8 17California..................................... 14 61 55.8 8 1 18 2 I 22 1
Digitized for FRASER http://fraser.stlouisfed.org/ Federal Reserve Bank of St. Louis

44 LUMBER INDUSTRY
T a b l e C .— Average and classified full-time hours per week in eight specifiedoccupations, 1928, by State— C o n t in u e d
Occupation and State
Trimmer operators-Florida________Georgia------------Idaho_________Kentucky_____Louisiana--------Maine_________Michigan..........Minnesota____Mississippi____Montana______North Carolina.Oregon________South Carolina .Tennessee_____Texas_________Virginia............Washington___West Virginia. . Wisconsin_____
-Continued.
Total..Machine feeders, planing mill:
Alabama________ ________ _Arkansas........................ ........California_______ _________Florida______ _____________Georgia___________________Idaho------- ------- -----------------Kentucky_________________Louisiana_________________Maine____________________M ichigan.._____ __________Minnesota____________ ___Mississippi. _____ _______Montana...................... ..........North Carolina------------------Oregon__________ ____ ____South Carolina____________Tennessee. ______ _______Texas__________________ _Virginia___________________W ashington............. .............West Virginia_______ _____Wisconsin...............................
Total..Laborers:
Alabama........ .Arkansas_______California-.........Florida. ............. .Georgia.............. .Idaho.............. .Kentucky...........Louisiana....... .Maine__________Michigan_______Minnesota_____Mississippi_____Montana_______North Carolina..Oregon_________South Carolina..Tennessee______Texas__________Virginia________Washington____West Virginia... Wisconsin______
Total................................. 314 122,026
Numberof—
Es-tab-lish-
ments
240
Employ-
585
21 162 60.512 130 59.114 55 56.912 68 61.417 66 59.05 113 48.02 6 50.8
18 144 59.411 15 58.711 41 58. 34 50 60.0
14 126 59.95 46 52.0
10 26 58.814 175 48.18 59 60. 15 26 57.7
11 98 58.92 4 60.0
21 276 48.06 16 60.0
17 80 59.9
1,782
1, 795 1,472 1, 078
864 704 569 164
1,950 192 828 753
1,967 422
1,052 1, 528
785 688 915 366
2,510 313
1,111
Averagefulltimehours
perweek
61.659.148.056.758.0 58.459.060.059.049.960.048.9 60.057.858.858.2 48.1 61.0 59.6
55.8
55.7
60.559.256.461.459.548.057.059.559.559.060.1 59.750.660.2 48.3 60.2 58.257.6 60.148.060.159.6
Number of employees whose full-time hours per veek were—
48and
under
40
159
21
~I?3
569
257
l,46l'
2, 455
56.9 j 4,983 452 303
Over48
andunder54
35
Over 14
ai id unler
to
] 13474
5-39
138
40165
22620618
60
14287385229
1950
1226
15
932
1,430986651669253
751,665
150536742
1,81127
8414
739423591329
1311921
2,090 13,155 299 697
Over60
andunder66
45
62
Over66
21012
Digitized for FRASER http://fraser.stlouisfed.org/ Federal Reserve Bank of St. Louis

T a b l e D .— Average and classified hours actually worked in one week in eight specified occupations, 1928, by State
Number of— Average
Number of employees whose classified hours worked in one week were—
Occupation and State Establish
ments
Employ
ees
hours ac
tually worked in one week
Under
5
5,under10
10,under15
15,under20
20,under25
25,under30
30,under35
35,under40
40,under45
45,under48
48
Over48,under50
50,under54
54
Over54,
under60
60
Over60,under65
65,under70
70,under75
75,under80
80,under85
85,under90
90andover
Sawyers, head, band.Alabama_________________ 17 32 60.2 1 5 18 2 6Arkansas_________________ 15 35 56.9 1 1 2 12 19California________________ 14 56 53.6 1 1 2 2 7 5 8 8 21 1Florida____________ 9 23 58.4 1 1 20
41
Georgia____________ ___ 12 14 58.1 1 5 1 3Idaho____________________ 5 22 45.8 1 1 20Kentucky________________ 8 10 52.0 1 1 1 4 3Louisiana__________ ______ 16 53 57.3 1 1 12 9
519 6 3 1 1M aine____________________ 10 12 58.7
Michigan________________ 21 41 56.4 1 2 2 16 17 2 1Minnesota__ ____________ 4 30 56.7 1 1 1 27M ississippi_____________ 16 53 53.7 1 1 1 2 3 1 6 14 20 3 1Montana_________________ 5 14 50.7 2 5 1 4 1 1North Carolina___________ 23 33 56.9 1 2 3 3 20 2 2Oregon______________ . . . 14 48 46.6 ~~2~ 1 10 21 1 2 7 4South Carolina___________ 9 17 59.1 1 1 13 1 1Tennessee_________ ______ 20 27 55.1 1 1 4 8 10 3Texas_______________ ___ 11 34 53.9 1 5 1 6 1 6 14Virginia _____ ________ 11 18 57.9 1 1 1 12 1 2Washington___ _______ 19 51 44.9 3 7 3 29 4 4 1West Virginia____________ 10 18 60.1 4 10 2 2Wisconsin_______________, 19 27 58.4 10 16 1
Total______ __________ 288 668 54.4 3 5 1 6 6 4 33 9 88 7 50 21 115 271 26 20 2 !1 i 1
Doggers:Alabama_________________ 20 82 53.3 1 2 1 3 2 3 5 2 9 2 17 « 24 3 6 1 1Arkansas ________________ 15 92 44.2 ~T 3 7 3 2 2 1 3 11 9 8 22 19 1California_______________ 9 24 46.4 1 1 1 1 2 2 3 3 3 5 1 1Florida___________________ 10 28 59.8 2 2 4 7 2 10 1Georgia_________________ _ 16 35 50.8 3 3 1 2 1 2 1 10 10 2Id a h o ..____ ______________ 2 10 47.2 1 9Kentucky________________ 8 19 47.9 1 3 2 6 3 4Louisiana________________ 17 94 47.8 2 3 1 3 6 1 7 1 1 31 1 16 14 2 2 1 1Maine___________________ 11 19 55.2 1 1 1 2 3 11M ich ig a n ..._____________ 23 51 55.7 2 ----- 1 1 3 17
21927
5 1 1Minnesota_______________ 4 34 55.6 __ 1 1 1 1 ____ 1 ____
GENEEAL
TAB
LES
Digitized for FRASER http://fraser.stlouisfed.org/ Federal Reserve Bank of St. Louis
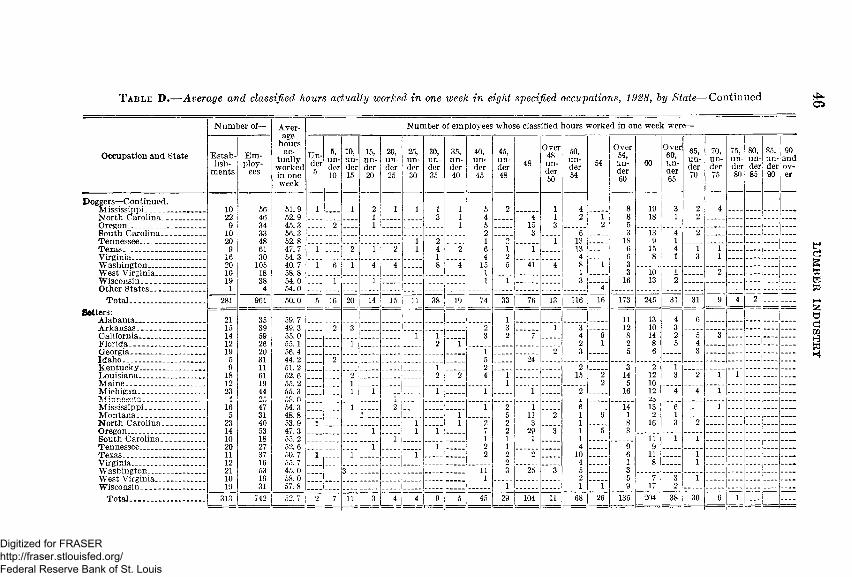
T a b l e D .— Average and classified hours actually worked in one week in eight specified occupations, 1928, by State— C o n t in u e d
Occupation and State
Number of—
Establish
ments
Employ
ees
Average
hours ac
tually worked in one week
Number of employees whose classified hours worked in one week were—
Under5
5,under10
10,under15
15,under20
20,under25
25,under30
30,under35
35,under40
40,under45
45,under48
48
Over48under50
50,under54
54
Over54,under60
60
Over60,under65
65,under70
70,under75
75,under80
80,under85
85,under90
90andover
1 1 2 1 1 13
1 5 2 1 4 8 19 3 2 41 1 4 4 1 2 1 8 18 1 2
o 1 1 5 15 3 2 52 3 6 3 13 4 2
1 2 1 2 1 13 18 9 11 ? 1 2 1 4 2 6 1 1 13
46 15 4 1 1
1 4 2 6 8 1 3 11 6 1 4 4 8 4 15
15 41 4 8 1 3
1 3 10 1 21 1 1 1 3 16 13 2
41 5 16 20 14 15 I n 38 19 74 33 j 76 13 116 16 173 245 31 31 9 4 2 11 ° ... L .1
1 11 13 4 62 3 2 3 1 3 12 10 3
1 1 3 2 7 4 9 8 14 2 5 31 1 2 1 2 8 5 4
1 2 3 5 6 32 5 24
1 2 2 3 2 12 2 2 4 1 15 2 14 12 3 2 1 11 1 2 5 101 1 1 1 2 16 12 4 4 1- 1 261 2 1 1 2 1 6 14 13 6 1
1 1 5 11 2 1 6 1 2 11 1 1 2 2 3 1 8 16 3 2
1 1 1 2 29 3 1 5 31 1 1 1 1 11 1 1
1 1 2 1 4 9 91 1 1 2 2 2 10 6 11 1
2 4 1 8 13 ' ! 11 3 25 3 5 3
1 2 5 7 3 11 1 1 9 17 2
2 7 11 I 3 4 4 9 5 45 29 104 11 68 26 135 204 38 I 30 !-------
6 11 ° ------ ----- -
Doggers—Continued.Mississippi_____North Carolina..Oregon_________South Carolina..Tennessee...........T exas..................Virginia________Washington____West Virginia___Wisconsin........... .Other States____
Total_________Setters:
Alabama________Arkansas_______California_______Florida_________Georgia--------------Idaho...... ............Kentucky______Louisiana_______Maine.......... ........Michigan........ .Minnesota______Mississippi_____Montana_______North Carolina..Oregon_________South Carolina..Tennessee______Texas___________Virginia..............Washington____West Virginia___Wisconsin........... .
Total................ .
56463433486130
10518
961
51.952.945.356.3 52.847.754.340.758.854.054.050.0 I
21 35 59. 715 39 49.314 59 55.012 26 55. 119 20 56.45 31 44.29 11 51.2
18 61 52.612 19 55.223 44 55.34 25 58. 016 47 54.35 31 48.8
23 40 53.914 53 47.310 18 55.220 27 52.611 37 50. 712 16 55. 721 53 45.010 19 58.019 31 57.8
LUMBER
IND
USTR
Y
Digitized for FRASER http://fraser.stlouisfed.org/ Federal Reserve Bank of St. Louis

Saw tailers on head saws:Alabama.................. .Arkansas____________California______ _____Florida.........................Georgia........................Idaho............................Kentucky....................Louisiana...... ..........M aine_______________Michigan.......... ..........Minnesota........ ..........Mississippi__________Montana____________North Carolina_____Oregon. _.....................South Carolina...........Tennessee___________T exa s ..........................Virginia________ _____Washington_________West Virginia.........Wisconsin........... .........
Total.........................
ISdgermen:Alabama____________Arkansas____________California.......... .........Florida.........................Georgia........ ................Idaho...... .............. .......Kentucky....................Louisiana.....................M aine_______________Michigan___________Minnesota__________Mississippi..................Montana.....................North Carolina______Oregon._____________South Carolina...........Tennessee....................Texas. ..........................Virginia.......................Washington_________West Virginia........ .....Wisconsin....................
Total______________
21 37 54.4 2 1 1 1 2 3 1 9 9 4 415 47 40.2 1 5 4 1 1 3 5 4 1 3 11 814 53 55.6 1 2 2 3 3 2 1 7 113
108
4 3 3 112 24 59.5 1 1 1 1
29
18 24 53.2 2 3 2 1 6 5 35 22 45.2 ___ 1 1 1 17 1 19 11 48.9 2 1 4 2 218 59 50.5 4 2 3 1 2 19 1 4 8 9 5 1
11 15 54. 7 1 1 6 723 44 53.7 1 1 2 3 2 1 2 14 14 3 14 31 52.3 2 1 1 2 2 2316 46 50.5 1 2 1 2 1 4 4 1 12 7 6 3 25 14 49.6 1 2 5 1 4 115 23 55.7 1 1 4 1 5 8 2 114 67 46.8 1 2 1 2 10 1 35 2 6 7 110 16 54.4 1 1 2 1 1 7 2 1
11
20 27 52.6 1 2 2 1 4 8 6 211 33 53.1 1 1 1 1 1 8 7 11 1 114 21 53.8 1 2 4 6 5 1 221 74 43.2 ___ 5 3 3 11 4 32 3 5 2 5 110 18 59.6 4 12 1 119 32 54.3 1 2 1 3 9 12 1 1 2
305 738 50.8 2 14 14 9 17 4 14 8 51 21 100 13 70 23 130 163 37 37 9 2
21 44 60.0 1 1 1 1 1 11 11 8 6 315 55 49.1 ___ 1 2 2 1 3 2 2 3 3 18 9 8 114 57 56.0 1 2 1 5 6 9 8 17 2 5 112 33 58.8 1 1 2 4 17 2 619 20 53.6 1 1 1 1 1 1 6 5 35 22 45.8 ___ 1 1 1 199 11 47.8 1 1 1 1 4 1 1 1
18 107 50.6 1 1 6 5 1 2 2 6 2 21 1 16 21 11 6 2 1 212 16 55.6 1 1 1 5 7 123 49 57.3 1 2 2 19 19 5 14 41 54.1 ___ 1 2 1 1 2 2 3216 79 54.8 . . . 1 1 1 1 1 2 3 1 1 10 21 17 11 4 3 15 21 43.9 2 1 3 6 6 1 123 34 55.9 1 1 1 1 1 1 8 17 2 114 67 48.0 ___ 1 1 2 1 1 3 1 32 2 7 6 8 1 110 26 56.6 1 4 2 1 15 2 120 26 55.1 1 1 7 9 4 2 211 48 46.8 3 1 1 5 5 2 2 1 8 3 16 117 21 55.2 1 2 4 5 6 1 221 89 43.4 3 2 1 2 1 1 17 6 41 9 4 210 17 59.8 5 9 1
12
19 40 58.9 1 13 22 1 2318 923 52. 3 5 10 17 6 12 3 19 14 44 22 114 7 92 29 166 247 58 41 13 1 3
GEN
EKAL TA
BLE
S
Digitized for FRASER http://fraser.stlouisfed.org/ Federal Reserve Bank of St. Louis

T a b l e D .— Average and classified hours actually worked in one week in eight specified occupations, 1928, by State— Continued!
Number of— Aver Number of employees whose classified hours worked in one week were—age
hoursOccupation and State Estab
lishments
Employ
ees
actually worked in one week
Under5
5,under10
10,under15
15,under20
20,under25
25,under30
30,under35
35,under40
40,under45
45,under48
48
Over48under50
50,under54
54
Over54,under60
60
Over60,under65
65,under70
70,under75
75,under80
80,.under85
85,under90
90andover
Trimmer operators:Alabama................................ 21 32 53.0 1 1 2 2 3 1 1 3 11 3 2 2Arkansas....... ................. . 15 25 51.5 2 2 2 1 1 8 8 1California........................ . 14 51 54.4 1 2 1 10 1 3 8 3 11
105
4 4 2 1Florida.................................. 12 19 57. 0 1 1 3 1 3Georgia_____________ __ 18 19 54.5 1 1 1 1 1 6 1 2 "Idaho................................. 5 31 41.4 1 1 1 2 2 3 19 1 1Kentucky...... ..................... . 9 9 51.4 1 1 4 1 1 1Louisiana.............................. 18 42 55.2 2 1 1 1 1 8 5 13 3 2 4 1Maine..................... .............. 12 15 57.4 1 1 5 8Michigan.............................. 23 34 56.5 2 2 2 12 12 2 2Minnesota_______________ 4 10 60.0 10Mississippi_______________ 16 23 58.9 1 I 1 6 6 3 3 1 1Montana_________________ 5 14 48.7 1 2 1 5 1 3 1North Carolina___________ 23 28 53.2 1 1 1 1 2 6 5 8 1 1 1Oregon........................ ........... 14 46 50.0 2 4 23 1 3 4 7 1 1South Carolina........... ......... 10 13 58.1 1 1 2 7 I 1Tennessee........... .................. 20 22 52.5 1 2 1 1 5 7 4 1Texas____________________ 11 24 47.1 4 2 5 5 8Virginia.............. ................. 18 22 54.2 1 2 1 3 6 6 3Washington_____ _________ 21 74 48.2 2 9 4 45 1 3 2 5 1 1 1 'West Virginia ----------------- 10 10 61.0 9 1Wisconsin_______ _________ 19 22 56.1 1 1 6 12 2
Total____>_____________ 318 585 52.6 l 1 9 11 1 5 1 4 11 31 | | y» i .. XOJ.1 * I 1 * 1 | A) Ad zo 1 °Machine feeders, planing mill:
Alabama........................ ....... 21 162 54.81
2 1 2 2 4I
3 41
6 2 . 1 15 2 50 4028
104
10 7 1Arkansas..._____ _________ 12 130 49.8 1 5 1 1 6 22 6 1 25 30California________________ 14 • 55 55.3 1 1 1 1 1 3 1 1 2 9 1 27 2 4Florida...........—.................... 12 68 57.6 1 1 1 3 1 6 11 22 5 17Georgia__________________ 17 66 60.1 2 3 3 2 2 18 10 3 13 6 4Idaho........ ............................. 5 113 42.4 6 7 4 7 7 63 9 3 3 1 1 2Kentucky________________ 2 6 50.0 6Louisiana________________ 18 144 55.1 2 1 1 3 6 6 4 3 23 40 28 13 9 4 1M aine____________________ 11 15 53. 2 1 2 1 1 5 5M ichigan________________ 11 41 53.5 1 1 7 1 3 1 1 9 15 2Minnesota............................ 4 50 1 1 1 7 6 6 1 24 1 2
LtJMBER
IND
tfSTR
Y
Digitized for FRASER http://fraser.stlouisfed.org/ Federal Reserve Bank of St. Louis
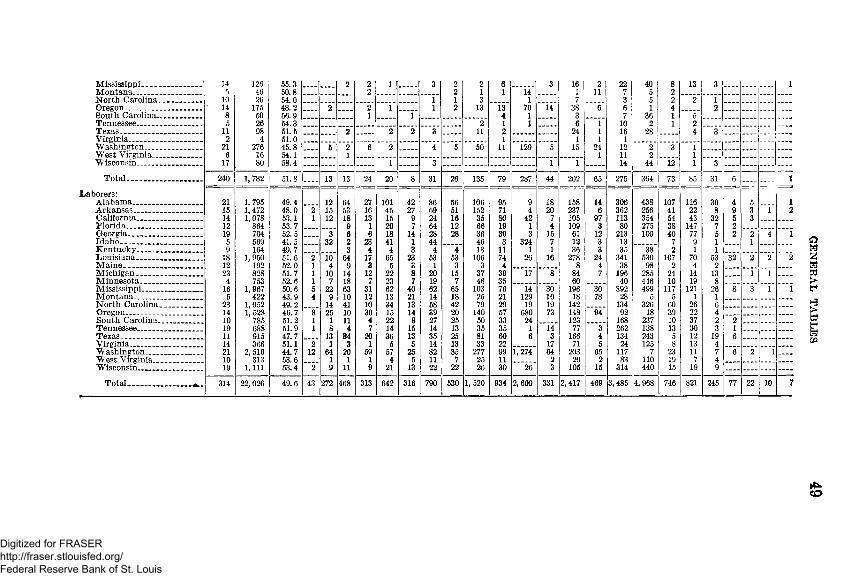
Mississippi____Montana—.........North Carolina.Oregon________South Carolina..Tennessee.........Texas............... .Virginia_______Washington___West Virginia... Wisconsin_____
Total..............
Laborers:Alabama______Arkansas______California........ .Florida...... ........Georgia------------Id a h o .......... .Kentucky_____Louisiana_____M aine_________M ichigan_____Minnesota____Mississippi........Montana______North Carolina.Oregon...............South Carolina.Tennessee.........Texas.................Virginia_______Washington___West Virginia. _ Wisconsin_____
Total________
14 126 55.3 ? 2 1 3 2 2 6 3 16 2 22 40 8 13 35 46 50.8 2 2 1 1 14 1 11 7 5 2
10 26 54.0 1 1 3 1 7 3 5 2 2 114 175 48.2 ? 2 1 1 2 13 13 70 14 38 6 1 4 2
8 59 56.9 1 1 4 1 3 7 36 1 55 26 54.3 2 1 1 6 1 10 2 1 2
11 98 51.5 ? 2 2 3 11 2 24 1 16 28 4 39, 4 51.0 1 1 1 1
21 276 45.8 5 ? 6 2 4 5 50 11 129 5 15 24 12 2 3 16 16 54.1 1 1 11 2 1
17 80 58.4 1 3 1 1 14 44 12 1 3
240 1,782 51.8 . . . . 13 13 24 20 8 31 26 135 79 287 44 202 65 275 364 73 85 31
21 1, 795 49.4 12 64 27 101 42 86 56 106 95 9 18 158 14 306 438 107 116 3015 1,472 48.0 " T 15 53 16 45 27 69 51 152 71 4 20 237 6 362 256 41 22 814 1,078 53.1 i 12 18 13 15 9 24 16 35 80 42 7 105 97 113 354 54 43 3212 864 53.7 9 1 20 7 64 12 66 19 1 4 109 3 80 275 38 147 719 704 52.5 3 6 6 18 14 28 28 36 80 3 15 61 12 213 100 40 77 55 569 41.5 32 2 23 41 1 44 46 3 324 7 12 3 13 7 9 19 164 49.7 3 4 4 3 4 4 13 11 1 1 36 3 35 38 2 1 1
18 1,950 51.6 2 10 64 17 65 23 53 53 106 74 26 16 278 24 341 530 107 70 5312 192 52.0 1 4 9 3 5 3 1 3 3 4 8 4 38 98 2 4 223 828 51.7 1 10 14 12 22 8 20 15 37 39 17 8 84 7 196 285 24 14 13
4 753 52. 6 1 7 18 7 23 7 19 7 46 35 60 40 446 10 19 816 1,967 50.6 5 22 63 31 62 40 62 65 103 76 14 30 196 "1 6 “ 392 499 117 121 26
5 422 43.9 4 9 10 12 13 21 14 18 25 21 129 10 18 78 28 5 5 1 123 1,052 49.2 14 41 10 34 13 58 42 79 29 19 19 142 134 326 60 26 614 1, 528 46.7 ' T 25 10 30 15 14 39 20 140 57 680 73 148 ~‘ 94_ 92 18 39 22 410 785 51.2 i 1 11 4 22 8 27 25 50 33 24 123 168 237 10 37 219 688 51.9 i 8 4 7 14 15 14 13 35 35 1 14 77 3 262 138 13 30 311 915 47.7 13 84 20 36 13 35 25 81 60 6 3 166 4 134 243 5 12 1914 366 51.1 " T 1 3 1 5 5 14 13 33 22 17 71 5 24 125 8 13 421 2,510 44.7 12 64 20 59 57 25 82 35 277 99 1,274 64 203 65 117 7 23 11 710 313 53.6 . . . . 1 1 1 4 5 11 7 25 11 2 20 2 83 110 19 7 419 1 ,111 53.4 9 H 9 21 13 22 22 26 30 26 3 105 15 314 440 15 19 9
314 22 , 026 49.6 43 272 468 313 642 316 790 530 1, 520 934 2,600 331 2,417 469 3,485 4,968 746 821 245
32
245 77 22 10
CD
GEN
ERAL TA
BLE
S
Digitized for FRASER http://fraser.stlouisfed.org/ Federal Reserve Bank of St. Louis
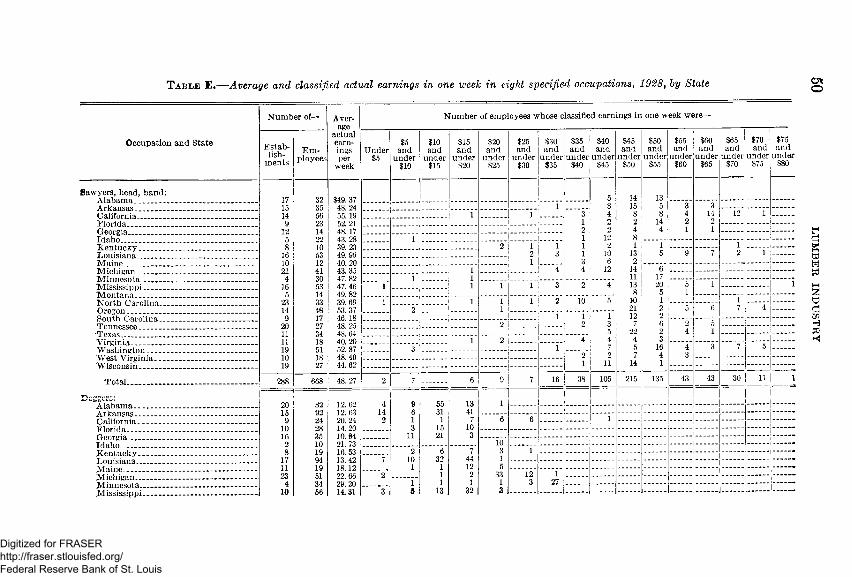
T a b l e E .— Average and classified actual earnings in one week in eight specified occupations, 1928 , by State
Occupation and State
Sawyers, head, band:A labam a............. .Arkansas________California_______Florida................. .Georgia..................Idaho.................... .Kentucky.............Louisiana..............Maine....................Michigan________Minnesota....... .Mississippi______M o n ta n a ............North Carolina...Oregon__________South Carolina...Tennessee.............Texas.................... .Virginia............... .Washington_____Wrest Virginia___Wisconsin_______
Total..................
'Cg0Ci. G.A labam a... Arkansas... California..Florida.......Georgia.......Idaho_____Kentucky..Louisiana...M aine........Michigan...Minnesota..Mississippi.
Number of—
Establish
ments
288
Employees
Average
actualearningsper
week
$49.48.55.52.48. 43.39.49.40. 43. 47.47. 49.39.53. 46.48. 48.40. 52.
48. 27
Number of employees whose classified earnings in one week were—
Under$5
$5and
under$10
$10and
under$15
$15and
under$20
$20and
under$25
$25and
under$30
$30and
under$35
$35and
under$40
$40and
under$45
$45and
under$50
$50and
under$55
$55and
under$60
$60and
under$65
$65and
under$70
$70and
under$75
$75and
under$80
5 14 131 8 15 5 3 3
1 1 3 4 8 8 4 14 12 11 2 2 14 2 22 2 4 4 1 1
1 1 12 82 1 1 1 2 1 1 1
2 3 1 10 13 5 9 7 2 11 3 6 2
111
4 4 12 14 61 11 17
1 1 1 3 2 4 13 20 5 1 18 5 1
1 1 1 1 2 10 5 10 1 12 1 21 2 5 6 7 4
1 1 1 12 22 2 3 7 6 2 5
5 22 2 4 11 2 4 4 4 3
3 1 7 5 16 4 3 7 52 2 7 4 31 11 14 1
2 7 6 9 7 16 38 105 215 135 43 43 30 11 1
A1
g1
55 13 1! i
*±
14 6 31 412 1g 1
157 0 6 1
10321
103o 6 7 1
7&
10 32 44122
15/
1o 11
13
3313
123
115
i 273 32
12. 6212. 63 20. 24 14. 20 10.94 21.73 16. 5313. 42 18.12 22. 66 29.20 14.31
LUMBER
IND
USTR
Y
Digitized for FRASER http://fraser.stlouisfed.org/ Federal Reserve Bank of St. Louis

Nortn Carolina_____Oregon......................South Carolina.........Tennessee-................Texas______________Virginia................ ....Washington________West Virginia______Wisconsin_________Other States_______
Total......................Setters:
Alabama......... .........Arkansas_________ _California...... ...........Florida................... .Georgia......................Idaho.........................Kentucky.............. .Louisiana__________Maine......... ..............Michigan. .................Minnesota_________Mississippi________Montana.................North Carolina........Oregon......... .............South Carolina........Tennessee..................Texas.........................Virginia.-.................Washington________West Virginia______Wisconsin.................
Total......................Saw tailers on head saws:
Alabama___________Arkansas. .................California__________Florida......... .............Georgia...................Idaho........................Kentucky__________Louisiana__________Maine_____________Michigan...................M innesota...______Mississippi_________
22 46 13.44 1 5 19 20 19 34 24. 58 1 2 2 8 15 6
10 33 12. 54 3 26 3 120 48 16. 56 1 7 35 59 61 14.07 4 8 16 31 2
16 30 14.37 2 14 12 220 105 21.13 7 4 6 14 45 26 2 110 18 24. 27 2 10 4 219 38 22.02 1 1 2 26 81 4 24. 30 4
281 961 16.74 46 75 265 293 167 75 38 1 1
21 35 20. 57 1 15 17 215 39 18.94 5 1 13 15 4 114 59 34. 37 1 1 1 14 7 24 9 1 112 26 20. 50 1 2 8 8 719 20 18.10 1 5 8 5 15 31 28. 71 1 1 3 11 11 49 11 21.78 3 1 2 3 2
18 61 21.63 2 3 18 21 11 5 1 i12 19 22.29 1 1 14 323 44 26. 47 2 1 7 20 13 14 25 31.28 1 1 23
16 47 23.38 3 2 3 23 10 5 15 31 29.48 1 1 18 8 3
23 40 16. 65 1 2 11 19 6 114 53 32.16 1 1 1 9 32 4 510 18 18. 69 1 1 9 720 27 22.07 1 1 8 6 10 111 37 18. 51 2 4 13 17 112 16 19. 26 4 7 2 1 221 53 27.35 2 1 5 34 9 1 110 19 27.27 1 3 11 419 31 26.12 13 14 4
313 742 24.64 15 13 41 127 177 184 129 39 14 1 1 1— ■ - 1 = r ■ = - « = = = ===== =
21 37 12. 70 2 2 26 715 47 11.03 11 3 17 1614 53 25. 95 1 2 15 24 10 112 24 14.15 2 13 918 24 10. 70 11 11 25 22 21. 12. 1 1 1 18 19 11 15. 96 2 2 5 2
18 59 13. 56 4 6 20 27 211 15 18. 46 1 9 523 44 20.17 2 1 11 29 14 31 20.25 i 3 4 23
16 46 13.36 5 4 lo 26 1 Cn
GEN
ERAL TA
BLE
S
Digitized for FRASER http://fraser.stlouisfed.org/ Federal Reserve Bank of St. Louis

T a b l e E .— Average and classified actual earnings in one week in eight specified occupations, 1928, by State— Continued C7Tt o
Number of— Average
Number of employees whose classified earnings in one week were—
Occupation and State Establish
mentsEm
ployees
actualearn
ingsper
week
Under$5
$5and
under$10
$10and
under$15
$15and
under$20
$20and
under$25
$25and
under$30
$30and
under$35
$35and
under$40
$40and
under$45
$45and
under$50
$50and
under$55
$55and
under$60
$60and
under$65
$65and
under$70
$70and
under$75
$75and
under$80
Saw tailers on head saws—Continued.Montana. _______ _________ ______ ____ 5 14 $24.63 1 6 7North Carolina________________ ______ 15 23 13.91 1 12 9 1Oregon___________________________________ _ 14 67 25. 58 1 3 2 24 31 5 1South Carolina............ ............................. 10 16 11.41 3 12 1Tennessee___________________________ 20 27 15. 66 2 5 18 2Texas_____________ ___________ _ ____ _____ 11 33 14.15 1 2 18 10 2Virginia.................................................. 14 21 14. 40 1 13 5 2Washington___ ___ _______ ________ ______ 21 74 23.19 5 3 3 2 24 29 6 2West Virginia ........................................................ ... 10 18 22. 81 1 17Wisconsin___________________________ 19 32 19. 75 3 1 10 15 3
Total____ __ ................ ................... 305 738 18.05 33 49 169 178 186 98 21 4 iEdgermen:
Alabama___________________________. . . . 21 44 20.84 3 15 19 4 3Arkansas_______________ _______ _____________ 15 55 19. 89 3 3 5 10 24 5 4 1California_________________________________ 14 57 37. 63 1 18 19 15 3 1Florida________________________________ 12 33 21.13 4 7 18 3 1Georgia....... ............ ........ ............................. 19 20 18.16 2 3 8 5 2Idaho_______________________________ 5 22 28.41 1 1 11 9Kentucky ................................................. ............... 9 11 21.13 1 6 1 2 1Louisiana_____ _____ _________________ 18 107 18.91 8 5 9 27 45 12 1Maine________ _____ ___________________ 12 16 23.16 1 4 5 3 3Michigan_____ _______________________ 23 49 25. 86 1 16 28 4Minnesota____ _____ ______________ 4 41 26. 73 3 1 4 12 21Mississippi____________________________ 16 79 21. 20 2 1 4 16 44 8 3 1 j
M ontana______ __________ ___________ 5 21 26. 44 I 2 1 9 6 2 ________ 1i_ _ _____
North Carolina________________________ 23 34 17. 03 1 1 9 14 8 1Oregon_________________________________ 14 67 37.42 1 4 7 24 8 8 5 6 4South Carolina_________________ _______ 10 26 18. 44 3 17 4 1 1Tennessee_____________________________ 20 26 23.89 2 3 11 7 3Texas_______________ _______ _________ 11 48 18.11 3 2 9 11 20 3Virginia........... .........................................Washington___________________________
17 21 17.31 12 3 4 221 89 29. 65 4 3 1 5 12 22 14 10 10 8
West Virginia_____ _________________ 10 17 30.29 1 6 7 3Wisconsin____________________-______ 19 40 26. 94 13 21 6
Total______ _ _ ______________ 318 923 24.61 27 22 64 147 257 166 133 45 35 16 7 ! 4
LUMBER
IND
UST
RY
Digitized for FRASER http://fraser.stlouisfed.org/ Federal Reserve Bank of St. Louis

Trimmer operators:Alabama...............................Arkansas..............................California..............................Florida_____________ _____Georgia.................................Idaho............... ....................Kentucky.............................Louisiana............... .............Maine................. .................Michigan.................... ..........Minnesota..........................Mississippi_______________Montana________________North Carolina................Oregon,............. .................South Carolina................... .Tennessee.............................Texas......................... ..........Virginia________ ____ ____Washington.........................West Virginia..................Wisconsin........................ .
Total................................ .Machine feeders, planing mill:
Alabama...............................Arkansas............................. .California_______ _____ _Florida__________________Georgia.................. _........... .Idaho................................... .Kentucky.........................Louisiana..... ........................Maine............ ...... ........... .Michigan________________Minnesota_______________Mississippi.........................Montana._______________North Carolina............ .......Oregon.................................South Carolina...................Tennessee............................Texas_______ ____ _______Virginia........................ ......Washington____ _________West Virginia.............. .......Wisconsin............................
Total..
2115 14 12 1859
18 12 234
165
23 14 10 20 11 18 2110 19
318
2112141217 5 2
18 11 114
145
10 1485
112
216
17
240
3225511919319
42 15 34 1023 14 28 46 13 2224 22 7410 22
162130556866
1136
144154150
1264626
17559
42761680
$13.16.30.17. 13. 21. 20.18. 20. 23. 27. 22. 23. 15. 32.15. 18.16. 15. 32. 26. 22.
$13.14. 26. 13. 19. 22. 30. 16.19.20. 21.15. 24. 13. 26. 12.16. 15. 15. 24. 23. 20.
1,782 19.31 26
1813 1 4 6 7
" T1
~T72 4 2
14
99
91571
4221
60222
112
27113313
407
1415
"_5“523
16
41
1024
1313611
130
42514
1813 6
“ 56"4
1114793
1611443
283
26
449
233 9 1 9 2
105
18
1164 1 4 3 1 8 3
16
132
5 162
1057
” 146
21 204
171
32127
’ 167’5
46
381
117
14
15
1021
“ 12’1122
1945
101
118
23
133
211
302
1231
70
211
56
203
83
171
37
10 CJ1CO
GE
NE
RA
Ij TAB
LES
Digitized for FRASER http://fraser.stlouisfed.org/ Federal Reserve Bank of St. Louis

T a b l e E .— Average and classified actual earnings in one week in eight specified occupations, 1928, by State— Continued
Occupation and State
Number of—
Establish
mentsEm
ployees
Average
actualearningsper
week
Number of employees whose classified earnings in one week were—
Under$5
andunder
$10
$10and
under$15
$15and
under
$20and
under$25
$25and
under$30
$30and
under$35
$35and
under
$40and
under$45
$45and
under$50
$50and
under$55
$55and
under$60
$60and
under$65
$65and
under$70
$70and
under$75
$75and
under$80
Laborers:Alabama.............Arkansas_______California--.......Florida_________Georgia________Idaho__________Kentucky.......... .Louisiana______Maine__________Michigan_______Minnesota______Mississippi........ .Montana.............North Carolina..Oregon.............. .South Carolina..Tennessee.......... .Texas__________Virginia________Washington.......West Virginia. Wisconsin.........
1,795 1,472 1,078
864 704 569 164
1, 950 192 828 753
1,967 422
1, 052 1,528
785 688 915 366
2,510 313
1, 111
$9. 77 11.64 22.45 11.10 9. 71
19.09 13.26 11.90 15.6617. 8319.10 11.97 19.13 10.48 22. 698.48
12. 85 11. 57 12.62 21. 7918. 98 17.19
223.10129324034 8
139152728
16516
10235 6627 76 11 713
28
55225831
2553873019
2621453 39
26929
28339
52567
14572
1001554
93580760
4562226573
1,185178164
1,15137
53343
1824084721811183574
77285149118485461
35113742725936760
13114012
18421996
31086
793
716
51327
3193
123
18329315
2392
854
14
2041
59
381
323
235
.,420164148
1279
910
Total.. 314 22,026 15. 05 7,199 4,364 4,210 1.011 250 114 55 23
LUMBER
IND
USTR
Y
Digitized for FRASER http://fraser.stlouisfed.org/ Federal Reserve Bank of St. Louis
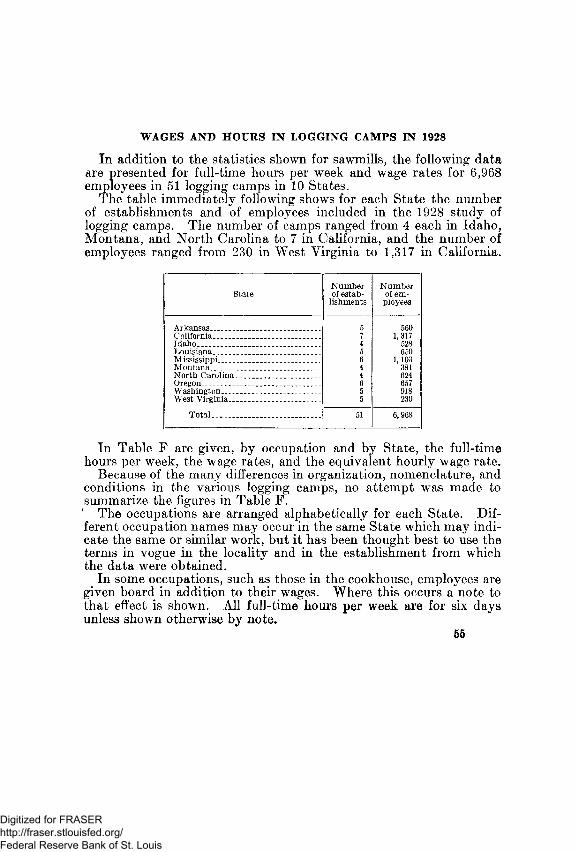
In addition to the statistics shown for sawmills, the following data are presented for full-time hours per week and wage rates for 6,968 employees in 51 logging camps in 10 States.
The table immediately following shows for each State the number of establishments and of employees included in the 1928 study of logging camps. The number of camps ranged from 4 each in Idaho, Montana, and North Carolina to 7 in California, and the number of employees ranged from 230 in West Virginia to 1,317 in California.
WAGES AND HOURS IN LOGGING CAMPS IN 1928
StateNumber of estab
lishments
Number of em
ployees
Arkansas..................... ................. .......... 5 560California__________ _ . ___ 7 1,317
528Idaho........... .......................................... . 4Louisiana............... ........................ ........ 5 650Mississippi....... ............. .................... . 6 1,103Montana..................... ........................ . 4 381North Carolina.................................... 4 624Oregon............ ................... ........... ....... 6 657Washington.......................................... 5 918West Virginia......................................... 5 230
Total................................................. 51 6,968
In Table F are given, by occupation and by State, the full-time hours per week, the wage rates, and the equivalent hourly wage rate.
Because of the many differences in organization, nomenclature, and conditions in the various logging camps, no attempt was made to summarize the figures in Table F.’ The occupations are arranged alphabetically for each State. Different occupation names may occur in the same State which may indicate the same or similar work, but it has been thought best to use the terms in vogue in the locality and in the establishment from which the data were obtained.
In some occupations, such as those in the cookhouse, employees are given board in addition to their wages. Where this occurs a note to that effect is shown. All full-time hours per week are for six days unless shown otherwise by note.
55
Digitized for FRASER http://fraser.stlouisfed.org/ Federal Reserve Bank of St. Louis
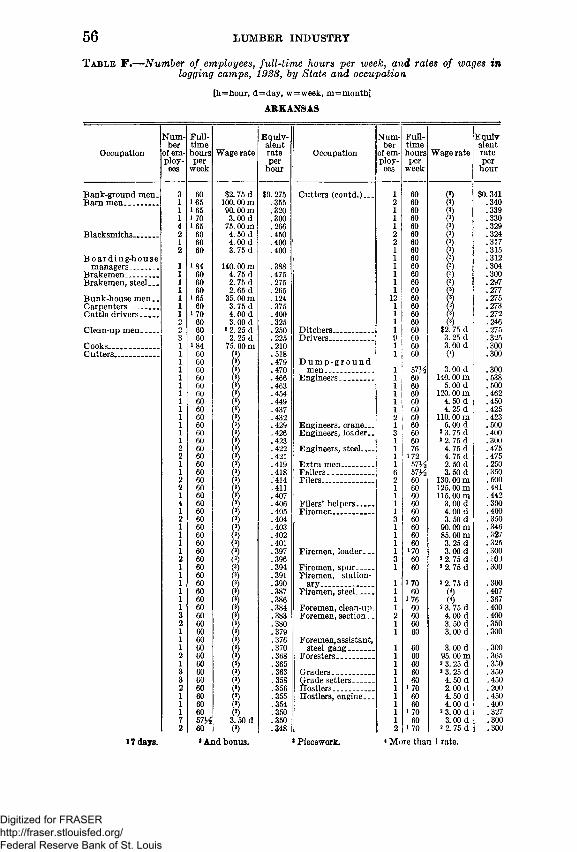
T a b l e F .— Number of employees, full-time hours per week, and rates of wages in logging camps, 1928, by State and occupation
56 LUMBER INDUSTRY
[h=hour, d=day, w=week, m=month] ARKANSAS
Occupation
Number
of employees
Fulltimehoursper
week
Wage rate
Equivalentrateper
hour
Occupation
Number
of employees
Full-timehoursper
week
Wage rate
Equivalentrateper
hour
Bank-ground men. 3 60 $2.75 d $0. 275 Cutters (contd.)..- 1 60 (*> $0.341Barn men................ 1 i 65 100.00 m .355 2 60 (*> .340
1 i 65 90.00 m .320 1 60 (*> .3391 i 70 3.00 d .300 1 60 (3) .3304 i 65 75.00 m .266 1 60 3) .329
Blacksmiths______ 2 60 4.50 d .450 60 (3) .3241 60 4.00 d .400 60 (3) .3172 60 3.75 d .400 1 60 (3) .315
B o a rd in g -h o u se 1 60 (3) .312managers............. 1 184 140.00 m .388 1 60 (3) .304
Brakemen............... 1 60 4. 75 d .475 1 60 (3) .300Brakemen, steel... 1 60 2.75 d .275 1 60 (3) .297
1 60 2.65 d .265 1 60 (3) .277Bunk-house m en .. 1 i 65 35.00 m .124 12 60 (8) .275Carpenters........ . 1 60 3.75 d .375 1 60 (3) .273Cattle drivers____ 1 i 70 4.00 d .400 1 60 (3) .272
2 60 3. 00 d .325 1 60 (3) .246Clean-up men____ 2 60 2 2. 25 d .250 Ditchers._________ 1 60 $2. 75 d .275
3 60 2. 25 d .225 Drivers................... 60 3. 25 d .325Cooks____________ 1 184 75.00 m .210 1 60 3.00 d .300Cutters-................... 1 60 (3) .518 1 60 0) .300
1 60 (3) .479 D u m p -g r o u n d1 60 (3) .470 men____________ 1 57^ 3.00 d .3001 60 (3) .466 Engineers. ............. 1 60 140.00 m .5381 60 (3) .463 1 60 5.00 d .5001 60 (3) . 454 1 60 120.00 m .4621 60 (3) .449 1 60 4. 50 d .4501 60 (3) .437 1 60 4. 25 d .4251 60 3) .432 60 110.00 m .4231 60 h .429 Engineers, crane... 1 60 5.00 d .5001 60 (3) .426 Engineers, loader.. 60 2 3. 75 d .4001 60 (3) .423 1 60 2 2. 75 d .3002 60 (3) .422 Engineers, steel___ 1 76 4. 75 d .4752 60 (3) .421 1 172 4. 75 d .4751 60 (? .419 Extra m en ............. 1 57H 2. 50 d .2501 60 .418 57^ 3.50 d .3502 60 (3) .414 Filers......... .............. 60 130.00 m .5002 60 (3) .411 1 60 125.00 m .4811 60 (3) .407 1 60 115.00 m .4424 60 .406 Filers' helpers........ 1 60 3.00 d .3001 60 (3) .405 Firemen............. . 1 60 4.00 d .4002 60 (3) .404 60 3. 50 d .3501 60 (3) .403 1 60 90.00 m .3461 60 (3) .402 1 60 85.00 m .3271 60 (3) .401 1 60 3.25 d .3251 60 (3) .397 Firemen, loader.. . 1 170 3.00 d .3002 60 (3) .396 60 * 2.75 d . cOJ1 60 (3) .394 Firemen, spur____ 1 60 2 2.75 d .3001 60 (3) .391 Firemen, station-1 60 (3) .390 1 170 2 2.75 d .3001 60 (8) .387 Firemen, steel........ 1 60 (*) .4071 60 (3) .386 1 i 76 (4) .3671 60 (3) .384 Foremen, clean-up. 1 60 2 3.75 d .4003 60 (3) .383 Foremen, section. _ 60 4.00 d .4002 60 (3) .380 1 60 3.50 d .3501 60 (3) .379 1 60 3.00 d .3001 60 (3) .376 Foremen, assistant,1 60 (3) .370 steel gang............ 1 60 3.00 d .3002 60 (3) .368 Foresters................. 1 60 95.00 m .3651 60 (3) .365 1 60 2 3.25 d .3503 60 (3) .363 Graders................... 1 60 2 3. 25 d .3503 60 (3) .358 Grade setters_____ 1 60 4.50 d .4502 60 (*) .356 Hostlers................... 1 i 70 2.00 d .2001 60 (J) .355 Hostlers, engine... 1 60 4. 50 d .4501 60 (3) .354 1 60 4.00 d .4001 60 (3) .350 1 170 2 3.00 d .3277 57 H 3.50 d .350 1 60 3.00 d .3002 60 (3) .348 2 i 70 2 2.75 d .300
* 7 dayB. 1 And bonus. * Piecework. 4 More than 1 rate.
Digitized for FRASER http://fraser.stlouisfed.org/ Federal Reserve Bank of St. Louis

T a b l e F.— Number of employees, full-time hours per week, and rates of wages in logging camps, 1928, by State and occupation— Continued
WAGES AND HOURS IN LOGGING CAMPS IN 1928 57
ARKANSAS—Continued
Occupation
Number
of employees
Fulltimehoursper
week
Wage rateEquivalentper
hourOccupation
Number
of employees
Fulltimehoursper
week
Wage rateEquivalentper
hour
Laborers, section.. 1 60 $3.00 d $0.300 Scalers (contd.)___ 2 60 $3.75 d $0. 3751 60 (3) .286 2 60 95. 00 m .365
32 60 2. 50 d .250 1 57 y2 3. 50 d . 3503 60 * 2. 25 d .250 2 60 2 2. 75 d .300
10 60 2. 25 d .225 Scavengers.............. 1 60 66. 00 m .2541 57H 2. 25 d .225 Scraper dum pers._ 1 60 2. 75 d .2751 60 2. 05 d .205 Skidders................ 1 60 3. 50 d .350
10 57H 2.00 d .200 Spikers................... 5 60 2. 65 d .265L a b o r e r s , steel Surveyors................ 1 60 2101. 00 m .631
gang...................... 1 60 2 2. 75 d .318 1 60 120. 00 m .4626 60 2 2. 75 d .300 1 60 17. 50 w .2923 60 2 2. 65 d .290 Swampers............... 5 57^ 3. 00 d .300
14 60 2. 75 d .275 5 60 2 2. 75 d .3001 60 (4) .267 27 60 2. 75 d .2751 60 2 2. 65 d .266 1 57H 2.75 d .275
10 60 2. 65 d .265 1 60 2. 70 d .2701 60 (4) .258 10 60 2. 50 d .250
• 8 60 2. 50 d .250 1 60 2 2. 25 d .230Loader m en........... 1 57^ 150.00 m .602 1 60 2. 25 d .225
1 60 150.00 m .577 5 60 2.15 d .2153 60 2 5. 25 d .550 1 60 2. 00 d .2001 60 5. 25 d .525 Swampers, head... 1 60 3. 00 d .3001 i 70 150. 00 m .495 Team boss..... ......... 1 60 5.00 d .500
Loader men, assist Team helpers......... 2 60 2. 75 d .275ant....................... 1 60 4.00 d .400 Teamsters________ 1 571/2 2 3. 75 d .379
Log-up men............ 4 57H 3. 00 d .300 2 57/2 3. 75 d .375Machinists............. 1 60 200. 00 m .769 3 57/ j 3. 50 d .350
1 60 2 5. 00 d .525 1 60 2 2. 75 d .337Mule skinners____ 11 60 3. 75 d .375 1 60 3. 25 d .325Pump-engine men. 1 60 2 2.75 d .300 7 60 2 3. 00 d .325Pumpers_________ 1 60 55. 00 m .212 2 60 2 2. 75 d .325Right-of-way men. 7 60 2 2. 75 d .300 1 60 0) .323
1 60 0) .289 1 60 h .3202 60 (4) .278 3 60 2 2.75 d .312
10 60 2. 75 d .275 1 60 (4) .3023 60 2 2. 50 d .275 18 60 3.00 d .3001 60 (4) .260 4 60 * 2. 75 d .3001 60 (4) .253 1 60 2.75 d .2871 60 2. 50 d .250 8 60 2.75 d .2755 60 2 2. 25 d .250 Tongers................... 1 60 3. 75 d .3751 60 0) .243 2 60 3. 25 d .3251 60 (*) .237 Tong hookers_____ 6 60 3. 25 d .3254 60 2. 35 d .235 1 60 (4) .3203 60 2. 25 d .225 4 60 2 2.85 d .3102 60 2.15 d .215 3 60 3. 00 d .300
Sawyers................... 22 60 3. 00 d .300 1 60 2.85 d .285Scalers....... .............. 1 60 5.00 d .500 Tong hookers and
1 60 125. 00 m .481 pullers................. 2 57/j 2. 50 d .2501 60 4. 25 d .425 Top loaders............ 2 60 2 3.10 d .3351 60 4. 60 d .400 1 60 3.10 d .3101 60 100.00 m .385 Water boys______ 1 60 1.50 d .150
CALIFORNIA
Axmen..................... 1 54 $0. 55 h $0. 550 Barkers or peelers.. 1 54 (3) $0. 9081 54 . 50 h .500 (continued) 1 53 (3) .8861 48 .50 h .500 54 (3) .855
Bakers___________ 1 1 56 190.00 m .783 1 53 (8) .8431 149 150.00 m .707 1 54 (3) .8381 1 70 170.00 m .560 1 54 (3) .8351 1 70 5. 51 d .551 1 53 (3) .7911 149 100.00 m .471 1 53 (3) .790
Bakers' helpers___ 1 60 110.00 m .363 1 53 (3) .772Barkers on cars___ 1 54 2. 52 h .586 1 54 (*) .770
1 54 2.52 h .548 1 54 (3) .7271 54 2.52 h .547 1 53 (3) .723
Barkers or peelers. 1 54 (*) 1.316 1 53 (3) .7191 53 0 1.114 1 54 (3) .7141 54 (8) 1.019 1 53 (3) .7091 54 (’ ) .944 1 53 (») .6961 53 (3) .930 1 54 (>) .674
17 days. :And bonus. * Piecework, * More than 1 rate.
Digitized for FRASER http://fraser.stlouisfed.org/ Federal Reserve Bank of St. Louis
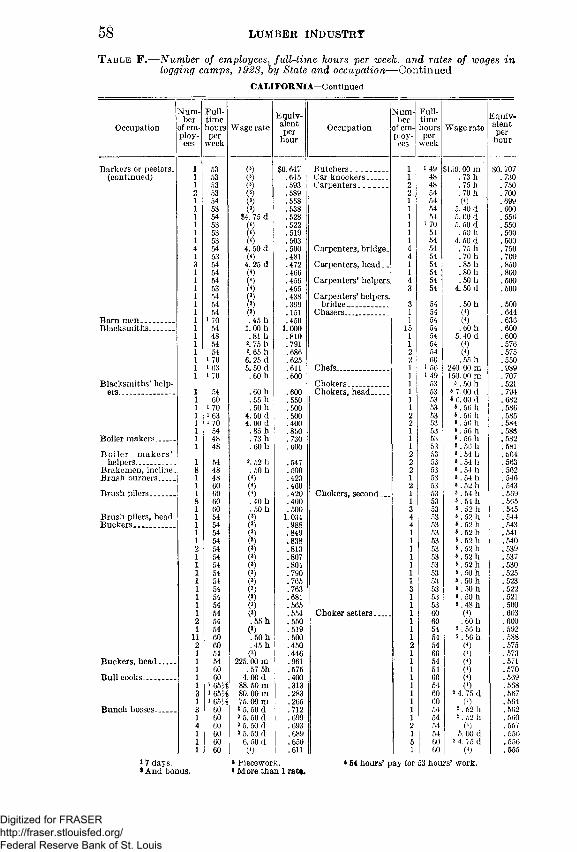
in
iiv-nt?rur
707730750700699600556550500500750700850800500500
500644636600600576575550989707521794
,682586
,585584
,588,582,581.564.563.562.546.543.569.565.545.544.543.541.540.539.537.530.525.523.522.521. 500.603.600.592.588.575. 573.571.570.569.568.567.564. 502.560.557.556.556.555
LUMBER INDUSTRY
nber of employees, full-time hours per week. and raUing camps, 1928 , by State and occupation— Continue
C ALIFO RN IA —Continued
Number
of employees
Fulltimehoursper
week
Wage rate
53 (3)53 (3)53 (3)53 (3)54 (3)53 (3)54 $4. 75 d53 0)53 (<)53 0)54 4. 50 d53 (<)54 4.25 d54 (<)54 <<)53 (<)5454 (3)54 (3)
i 70 .45 h54 1. 00 h48 .81 li54 2. 75 h54 2. 65 h
i 70 6.25 di 63 5.50 di 70 . 60 h
54 . 60 h60 .55 h
i 70 . 50 hi 63 4. 50 di 70 4.00 d
54 .85 h48 .73 h48 . 60 h
54 2. 52 h48 .50 h48 0)60 (4)60 (4)60 . 40 h60 .50 h54 (3)54 (3)54 (3)54 (•)54 (3)54 (*)54 (3)54 (3)54 (3)54 (•)54 (3)54 (3)54 (3)54 . 55 h54 (a)60 . 50 h60 .45 h54 (3)54 225.00 m60 .57 5h60 4.00 d
i 65 Mi 88.50 mi 65^, 80.00 mi 65H 75.00 m
60 2 5. 50 d60 2 5. 50 d60 2 5. 50 d60 2 5. 50 d60 6. 50 d60 0)
Equivalentper
hourOccupation
Number
of employees
Fulltimehoursper
week
$0.647 Butchers_________ 1 i 49 <1.645 Car knockers_____ 1 48.593 Carpenters............. 2 48.589 2 54.558 1 54.538 1 54.528 1 54.522 1 i 70.519 1 54.503 1 54.500 Carpenters, bridge. 4 54.481 4 54.472 Carpenters, head. _ 1 54.466 1 54.456 Carpenters’ helpers 4 54.455 3 54.438.399
Carpenters’ helpers, bridge................... 3 54
.151 Chasers................... 1 54
.450 1 541.000 15 54.810 1 54.791 1 54.686 2 54.625 2 60.611 Chefs......... ............. 1 1 56.600 1 i 49
Chokers__________ 1 53.600 Chokers, head........ 1 53.550 1 53.500 1 53.500 2 53.400 2 53.850 1 53.730 1 53.600 1 53
.54722
5353
.500 2 53
.423 1 53
.460 2 53
.420 Chokers, second . . . 1 53
.400 1 53
.500 3 531.034 4 53.988 4 53.849 1 53.838 1 53.813 1 53.807 1 53.804 1 53.790 1 53.765 1 53.763 3 53.681 1 53.565 1 53.554 Choker setters 1 60.550 1 60.519 1 54.500 1 54.450 2 54.446 1 60.961 1 54.575 1 54.400 1 60.313 1 54.283 1 60.265 1 60.712 1 54.699 1 54.693 2 54.689 1 54.650 5 60.611 1 60
. 73 h
.75 h
. 70 h 0)
5. 40 d 5. 00 d 5. 50 d .5011
4. 50 d . 75 h .70 h .85 h .80h . 50 h
4. 50 d
us.* Piecework.* More than 1 rate.
4 54 hours’ pay for 53 hours’ work.
Digitized for FRASER http://fraser.stlouisfed.org/ Federal Reserve Bank of St. Louis

T a b l e F.— Number of employees, full-time hours per week, and rates of wages in logging camps, 1928, by State and occupation— C on tin u ed
WAGES AND HOURS IN LOGGING CAMPS IN 1928 59
C ALIFO RN IA —Continued
Occupation
Number
of employees
Fulltimehoursper
week
Wage rateEquivalentper
hourOccupation
Number
of employees
1 Fulltime hours per
week
Wage rateEquivalentper
hour
Choker setters........ 1 60 (4) $0. 554 Choppers (contd.). 1 53 (3) $0. 527(continued) 1 54 (4) .554 1 53 (3) .523
1 54 2 $0. 52 h .553 1 54 $4. 50 d .50026 54 . 55 h .550 1 54 (3) .5001 48 .55 h .550 1 54 (3) .4961 54 2.52 h .550 1 54 (3) .4761 54 8 .52 h .549 1 54 (3) .424
54 *. 52 h .548 1 54 (3) .41954 5. 52 h .547 53 (3) .401
1 60 > 4. 75 d .547 Chute builders___ 1 60 . 70 h .7004 54 2 0. 52 h . 546 1 i 70 195.00 m .643
60 2 4.75 d .546 i 84 115. 00 m .3161 60 2 4.75 d .545 Cooks, head.........._ 1 i 56 200.00 m .8241 54 2.52 h .544 1 i 49 125. 00 in .5891 54 2.52 h .543 i 65 110. 00 m .389
60 2 4. 75 d .541 Cooks, hospital___ 1 i 49 60.00 m .2831 54 (4) .531 Cooks, night______ 1 i 56 115. 00 m .4741 54 (4) .525 Cooks, second____ 1 i 70 3. 68 d .368
60 2 4. 50 d .521 165H 90. 00 m .3191 54 . 52 h .520 i 65^ 85.00 m .301
60 2 4. 75 d .518 1 i 49 60. 00 m .2831 60 (4) .518 i 84 95. 00 m .2611 60 <r4. 75 d .506 Cooks, third........... 1 i 56 (4) . .446
10 60 2 4. 25 d .506 Cranemen________ 1 66 . 90 h .9001 54 (4) .506 1 60 . 80 h .800
60 . 50 h .500 54 . 80 h .8001 48 . 50 h .500 Dishwashers______ 1 i 56 105. 00 m .4331 60 2 4. 25 d .497 1 i 56 100.00 m .4201 60 2 4. 25 d .495 1 i 70 110.00 m .3631 60 2 4. 25 d .494 1 i 70 3. 35 .3351 60 2 4. 25 d .493 i 49 60. 00 m* .2831 60 2 4. 25 d .484 Donkey-engine re1 54 (4) .481 pairmen............... 1 i 63 250. 00 m .9161 60 4.75 d .475 1 54 2. 66 h .697
Choker s e t t e r s , 1 54 6.00 d .667head_________ 1 54 2.62 h .661 1 54 2. 60 h .637
1 54 2.62h .652 Donkey-engine re1 54 2.60 h .636 pairmen’s help1 54 2.60h .632 ers......................... 1 i 63 . 60 h .600
Choppers_________ 1 54 (3) 1.194 D rivers ....___ . . . 48 2. 80 h 1.0161 54 (3) 1.162 1 48 2. 80 h 1.0071 54 (3) 1.160 48 2. 80 h .9981 54 (3) 1.116 48 2. 80 h .9921 54 (3) .979 1 48 2.80 h .9751 54 (3) .955 1 48 2.80 h .8891 54 (3) .949 1 48 (4) .8401 54 (3) .917 1 54 . 80 h .8001 54 (3) .915 1 48 .80 h .8001 54 (3) .912 60 . 78 h .7801 53 (3) .879 1 60 (4) .7791 54 (3) .866 1 48 2. 60 h .7621 54 (3) .847 54 6.75 d .7501 54 (3) .820 25 60 7. 25 d .7251 54 (3) .814 1 54 . 70 h .7001 54 (3) .778 1 60 (4) .6971 54 (3) .775 1 53 8 6.00 d .6841 54 (3) .752 1 53 *6.00 d .6831 54 (3) .747 1 53 5 6.00 d .6791 54 (3) .745 1 53 (4) .6741 54 (3) .722 1 54 (4) .6641 53 (3) .682 1 53 (4) .6251 54 (3) .679 1 53 (4) .6041 53 (3) .679 1 53 * 5. 25 d .6001 53 (3) .677 1 53 *. 50 h .520
53 (3) .664 Electricians............. 54 . 80 h .8001 54 (3) .652 1 48 .75 h .750
12 54 5. 85 d .650 Engineers, bridge.. 54 .65 h . 6501 53 (3) .648 Engineers, crane... 1 48 .85 h .8501 53 (3) . 644 1 60 . 80 h .800
54 5.40 d .600 Engineers, Diesel53 (3) .600 shovel................... 1 53 5.70 h .757
1 53 (3) .596 1 53 *.58 h .6271 53 (3) .583 Engineers, duplex. 1 60 . 70 h .7001 53 (3) .580 7 54 .70 h .700
* 7 days. 3 Piecework. * 54 hours’ pay for 53 homs’ work,* And bonus. * More than 1 rate.
Digitized for FRASER http://fraser.stlouisfed.org/ Federal Reserve Bank of St. Louis
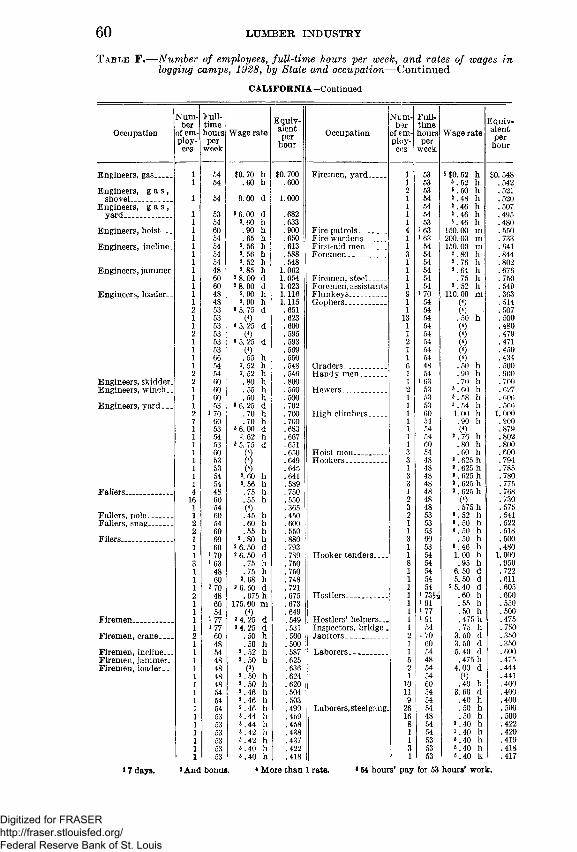
in
iiv-snteriur
548542521520507495480550733641844802676750549363514507500480479471450434500900
,700,627,600,566,000,900,879.802,800,600,794.785.780.775.768.730.575.541.522.518.500.480.000.950.722.611.605.600.550.500.475.750. 350.350.600.475.444.441.400.400.400.500.500.422.420.419.418.417
LUMBER INDUSTRY
rnber of employees, full-time hours per week, and ratidng camps, 1928 , by State and occupation-—Continue
C ALIFO RN IA —Continued
Number
of employ
ees
Fulltimehoursper
week
Wage rateEquivalentper
hourOccupation
1 1
1
Fulltimehoursper
week
54 $0.70 h $0. 700 Firemen, yard 1 5354 .60 h .600 1 53
2 5354 9.00 d 1.000 1 54
1 5453 8 6.00 d .682 1 5454 2. 60 h .633 1 5360 .90 h .900 Fire patrols_______ 4 i 6354 .65 h .650 Fire wardens.......... 1 i 6354 2. 56 h .613 First-aid men......... 1 5454 *. 56 h .588 Foremen................. 3 5454 2. 52 h .548 1 5448 2.85 h 1.062 1 5460 2 8.00 d 1.054 Firemen, steel____ 1 5460 2 8.00 d 1.023 Foremen, assistants 1 5448 2.90 h 1.116 Flunkeys............... 9 i 7048 2.90 h 1.115 Gophers................... 1 5453 *5. 75 d .651 1 5453 (4) .623 13 5453 *5. 25 d .600 1 5453 (4) .595 1 5453 •5. 25 d .593 2 5453 (4) .569 1 5466 .55 h .550 1 5454 2. 52 h .548 Graders................... 6 4854 2. 52 h .546 Handy men............ 1 5460 .80 h .800 1 i 6360 .55 h .550 Hewers. .................. 2 5360 .50 h .500 1 5353 *6. 25 d .702 1 53
i 70 .70 h .700 High climbers____ 1 6060 .70 h .700 1 5453 8 6. 00 d .683 1 5454 2. 62 h .667 1 5453 *5. 75 d .651 1 6060 (4) .650 Hoist m en ............. 3 5453 (4) .649 Hookers................... 3 4853 (4) .645 1 4854 2. 60 h .641 3 4854 2. 56 h .589 3 4848 .75 h .750 1 4860 .55 h .550 2 4854 (4) .365 3 4860 .45 h .450 2 5354 .60 h .600 1 5360 .55 h .550 1 5360 2.80 h .880 3 6060 2 6. 50 d .793 1 53
1 70 2 6. 50 d .789 Hooker tenders___ 1 541 63 .75 h .750 8 54
48 .75 h .750 1 5460 2.68 h .748 1 54
1 70 2 6. 50 d .721 1 5448 .675■ h .675 H ostlers................. 160 175. 00 m .673 1 i 9154 (4) .649 1 l 77
l 77 2 4. 25 d .549 Hostlers’ helpers... 1 i 91l 77 2 4.25 d .531 Inspectors, bridge _ 1 54
60 .50 h .500 Janitors_____ ____ 2 i 7048 .50 h .500 1 6054 2.52 h .587 Laborers....... .......... 1 5448 2.50 h .625 5 4848 (3) .636 2 5448 2.50 h .624 1 5448 *.50 h .620 10 6054 2.46 h .504 11 5454 2.46 h .503 9 5454 2.46 h .499 Laborers, steel gang. 26 5453 8.44 h .459 16 4853 8.44 h .458 8 5453 8.42 h .438 1 5453 8.42 h .437 1 5353 8.40 h .422 3 5353 8.40 h .418 1 53
1 And bonus. * More than 1 rate. • 64 hours’ pay for 53
Digitized for FRASER http://fraser.stlouisfed.org/ Federal Reserve Bank of St. Louis
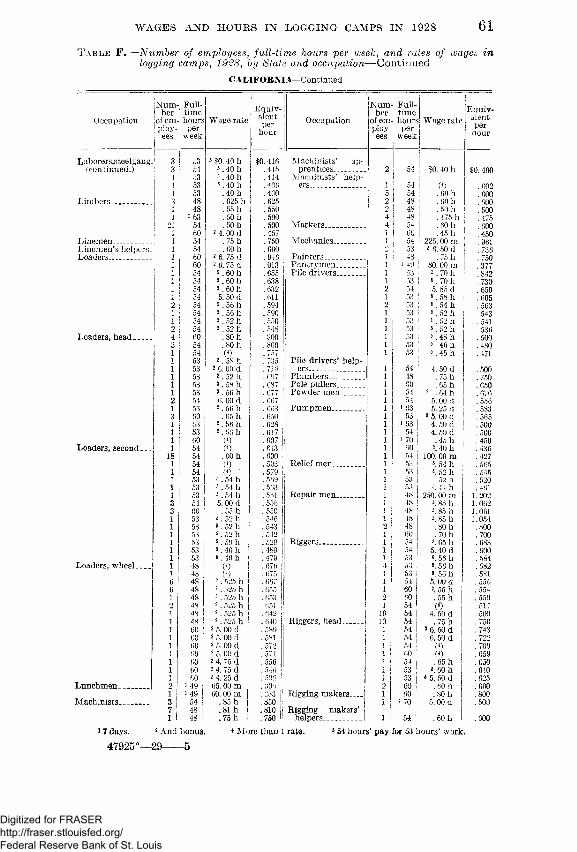
61
; in
luiv-ent:>erour
I. 400.602.600.600.500. 475.600.450. 961.736. 750.377.842.730.650.605.563.543.541.536. 500.480.471.500.750.650.676.556.583. 565.500.500.450.436.427. 565.545. 520.461202,062. 061,054,800.700. 683,600.584, 582581556554550517500750743722709659CoO640625600800500600
AND HOURS IN LOGGING CAMPS IN 1928
of employees, full-time hours per week, and rates ofamps, 1928, by State and occupation— Continued
C ALIFO RN IA —Continued
Fulltimehoursperweek
iWage rate
EquivalentperhourOccupation
Number of employees
- Fulltime ■j hours per week: Wage rate
53 s $0. 40 h $0. 416 Machinists’ ap54 s .40 h .415 prentices____ 2 54 $0. 40 h53 s .40 h .414 Maemmsts’ help-53 « .40 h .406 1 54 (4)53 . 40 h .400 5 54 . 60 h48 . 625 h .625 2 48 ! . 60 h48 . 55 h .550 2 ! 48 . 50 h !i 63 .50 h .500 4 ! 48 . 475 h |54 .50 h .500 Markers.............. 4 1 54 . 60 h !60 2 4. 00 d .457 1 60 . 45 h i54 .75 h .750 Mechanics........... 1 ! 54 225. 00 m54 . 60 h . 600 2 ! 53 5 6. 50 d60 2 6. 75 d .946 Painters-- ____ 1 | 48 . 75 h60 2 6. 75 d .913 Pantrymen____ 1 ! i 49 ! 80. 00 m54 2.60 h .655 Pile drivers.......... 1 ! 53 1 2. 70 h54 2.60 h .638 1 ! 53 i s. 70 h54 2.60 h . 632 2 ; 54 5.85 d54 5. 50 d . 611 i ; 53 ! 6. 58 h54 2.56 h .594 2 i 53 1 6. 54 h54 2.56 h . 590 1 j 53 1 5 . 52 h54 2.52 h . 550 1 53 j 5 . 52 h54 2.52 h . 548 1 53 1 5. 52 h60 . 80 h .800 1 53 I 5 . 48 h54 . 80 h .800 1 53 ! 5 46 h54 (4) . 757 1 53 ; 5.45 h53 2 . 58 h . 735 Pile drivers’ help53 2 6. 00 d . 716 ers------------- 1 54 I 4. 50 d53 2.52 h . 697 Plumbers_____ 1 48 .75 h53 2.58 h .687 Pole pullers____ 1 60 . 65 h53 2.56 h .677 | Powder men___ 1 54 1 2 ,64h54 6.00 d .667 1 54 5. 00 d53 * .56h . 663 Pumpmen........ 1 1 63 5. 25 d60 . 65 h .650 1 53 5 5.00 d53 2.56h .628 1 i 63 4. 50 d53 2.56 h .617 1 54 4. 50 d60 (4) .607 1 i 70 .45 h54 (4) .643 1 60 2. 40 h54 .60h .600 1 54 100.00 m54 (4) . 593 Relief men____ 1 53 1 5. 54 h54 (4) ' .579 1 53 52 h53 s .54 h .569 1 53 . 52 h53 s. 54 h . 563 1 53 5. 44 h53 ®. 54 h .561 Repair men......... 1 48 250. 00 m54 5.00 d .556 1 48 85 h60 . 55 h .550 1 48 2. 85 h53 s .52h . 546 1 48 a. 85 h53 «.52h .543 48 . 80 h53 ® . 52 h . 542 1 60 . 70 h53 «. 50 h .520 Riggers........... . 1 54 2. 65 h53 ®. 46 h .480 1 54 5. 40 d53 *. 46 h .479 53 5. 56 h48 (4) .676 4 53 «. 56 h48 (4) . 675 1 53 «. 56 h48 2.525 h .667 1 54 5. 00 d48 2.525 h .655 1 60 I 55 h48 2.525 h . 653 60 .55 h48 s . 525 h .051 54 (4)48 2. 525 h . 642 19 ! 54 4. 50 d48 2 .525 h .640 Riggers, head....... 10 ! 54 . 75 h60 2 5. 00 d . 589 1 54 2 6.50 d60 2 5. 00 d .581 1 54 6. 50 d60 2 5.00 d .572 1 54 (4)60 2 5. 00 d .571 1 60 I (4)60 2 4. 75 d . 556 1 54 | . 65 h60 2 4. 75 d . 546 1 53 j s. 60 h60 2 4. 25 d . 506 1 53 j * 5.50 di 49 65. 00 m .305 60 : . 60 hi 49 60.00 in . 283 Rigging makers_ 1 60 i . 80 h54 . 85 h .850 i i 1 70 | 5.00 d48 .81 h .810 i Rigging makers’ 148 . 75 h .750 ! helpers_____ 1 54 . 60 h
bonus, * More than 1 rate. 4 54 hours’ pay for 53 hours' work.5
Digitized for FRASER http://fraser.stlouisfed.org/ Federal Reserve Bank of St. Louis
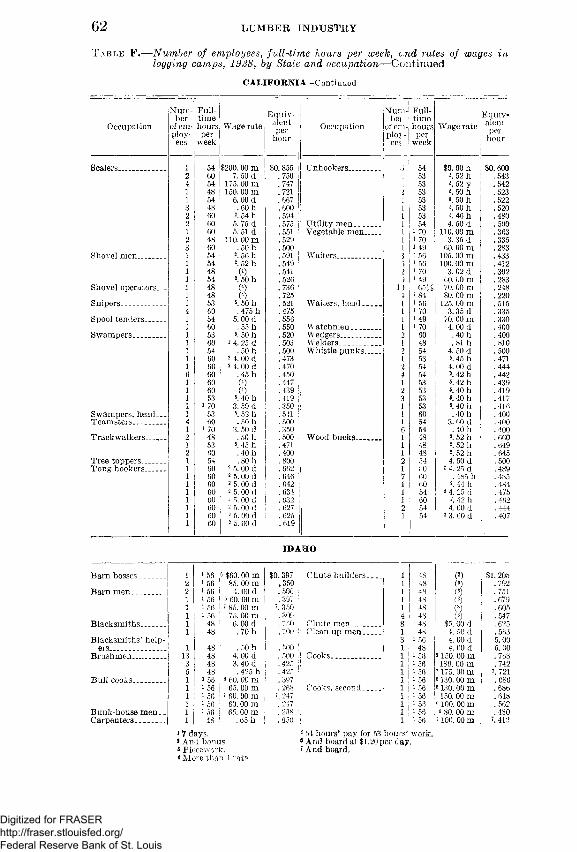
6 2 LUMBER INDUSTRY
T a b l e F.— Number of employees, full-time hours per week, end rates of wages inlogging camps, 1928, by Stale and occupation— Continued
C ALIFO RN IA —Continued
OccupationNumber of employees
Scalers..
Shovel men..
Shovel operators.Snipers_____Spool tenders_Swampers___
Swampers, head Teamsters___Trackwalkers...,
Tree toppers__Tong hookers_
Fulltimehoursperweek
53 6054 6053 6054 60 60 60 60 60 53i 70 53 60 i 70 4853 6054 60 60 60 60 60 60 60 60
Wage rate
$200.00 m 7.50 d 175. 00 m 150.00 m 6.00 d . 60 h 2. 54 h 5. 75 d 5. 51 d
110. 00 m . 50 h 2. 56 h 2. 52 h (4)2. 50 h(4)(4)s. 50 h . 475 h 5. 00 d .55 h 5. 50 h
2 4. 25 d . 50 h 2 4. 00 d 2 4. 00 d . 45 h
0)(*)
8. 40 h3. 50 d 5. 52 h .50 h3. 50 d .50 h s. 45 h . 40 h . 80 h 2 5.00 d 2 5. 00 d 2 5.00 d 2 5. 00 d 2 5. 00 d 2 5. 00 d 2 5. 00 d 2 5. 00 d
Equivalentperhour
$0.855 .750 .747 .721 .667 .600 .594 .575 .551 .529 .500 .591 .549 .541 .526 .736 .725 .521 .475 .556 .550 .520 .503 .500 .473 .470 . 450 . 447 .439 .419 .350 .541 .500 .350 .500 .471 .400 .800 .662 .646 .642 . 634 . 632 .627 .625 .619
Occupation
Unhookers..
Wood bucks..
Num- bei of er l- ploy- ees
Utility men... Vegetable men.
Waiters.........
Waiters, head.
Watchmen__Wedgers___WTelders___Whistle punks.
Fulltimehoursperweek
5453535353535354 i 70 i 70 i 49 i 56 1 56 i 70 i 49i 6 5H i 84 i 56 i 70 i 49 i 70 60 48 545354 54 53 53 5353 6054 54 48 48 48 54 60 60 60 54 60 54 54
Wage rateEquivalentperhour
$0.60 hs. 52 h 5.52 y s. 50 h 5. 50 h 5. 50 h 5. 46 h 4.50 d110.00 m 3. 35 d60.00 m 105. 00 m 100. 00 m3. 02 d60.00 m70.00 m 80. 00 m125.00 m3. 35 d 70. 00 m4.00 d . 40 h .81 h4. 50 d s. 45 h4.00 d \ 42 h «. 42 h *. 40 h «. 40 h *. 40 h . 40 h3. 60 d .40 h
2. 52 h 2. 52 h 2. 52 h4. 50 d
2 4. 25 d. 485 h 2. 44 h 2 4. 25 d
2. 42 h 4. 00 d 2 3. 60 d
$0. 600.543 .542 .523 .522 .520 .480 .500 .363 .335 .283 .433 .412 .302 .283 .248 .220 .515 .335 .330 .400 .400 .810 .500 .471 .444 .442 .439 .419 .417 .416 .400 . 400 .400 . 660 .649 . 645 .500 .489 . 4S5 .484 .475 . 462 .444 .407
IDAHO
Barn bosses____ 1 1 56 e $60.00 m $0. 397 Chute builders__ 1 48 (3)2 i 56 85. 00 m .350 1 48 (3)Barn men.......... . 2 i 56 4. 00 d .500 1 48 f3)1 i 56 6 60. 00 m .397 1 48 (3)1 1 56 7 85. 00 m 7. 350 1 4S (3)1 1 56 75. 00 m .309 4 48 (3)Blacksmiths. __ 1 48 6. 00 d .750 I Chute men......... 8 48 $5. 00 d1 48 . 70 h .700 |Clean-up men__ 1 48 4. 50 dBlacksmiths’ help 3 1 56 4. 00 ders________ ! i 48 . 50 h . 500 1 48 4. 00 dBrushmen .. 13 48 4. 00 d . 500 ! Cooks.......... ...... 1 i 56 6 150. 00 m3 48 3.40 d .425 ! 1 i 56 180. 00 m5 48 .425 h .425 | 1 i 56 7 175. 00 mBull cooks____ 1 1 56 J 6 60. 00 m .397 1 i 56 6130.00 m1 1 56 | 65. 00 m .268 ’ Cooks, second__^ 1 i 56 6130. 00 m1 i 56 7 60. 00 m 7. 247 1 i 56 150. 00 m1 i 56 | 60. 00 m .247 1 ; i 56 e 100. 00 mBunk-house men.. 1 156 | 65. 00 m .268 ; 1 1i 56 6 80. 00 mCarpenters.......... 1 48 j . 65 h .650 1 1i 56 j7 100. 00 m
i 7 days.* And bonus.* Piecework.< More than i rafcs.
5 54 hours’ pay for 53 hours’ work. * And board at $1.20 per cay.7 And board.
$1. 205 .792 . 751 .679 .605 .547 .625 . 563 5. 00 5. 00 .768 .742 7. 721 . 686 . 686 .618 . 562 .480 7.412
Digitized for FRASER http://fraser.stlouisfed.org/ Federal Reserve Bank of St. Louis

WAGES AND HOURS IN LOGGING CAMPS IN 1928 63T a b l e F .— Number of employees, full-time hours per week, and rates of wages in
logging camps, 1928, by State and occupation— Continued
ID A H O — C ontinued
OccupationNumber of employees
FulltimehoursperweekWage rate
EquivalentperhourOccupation
Number of employees
FulltimehoursperweekWage rate
Equivalentperhour
Dishwashers___ 1 i 56 e $60.00 m $0.397 Sawyers (contd.).. 8 48 $5. 00 d $0. 562Engineers_____ 4 48 6. 00 d .750 2 48 (3) .614Engineers, loader.... 1 48 (3) 1. 097 2 48 (3) .6125 48 6.00 d .750 4 48 (3) .606Firemen, loader_ 1 48 5.00 d .625 6 48 (3) .6031 48 (3) .609 2 48 (3) .598Flunkevs............ 11 i 56 6 60.00 m .397 1 48 (3) .5971 48 2. 00 d .250 2 48 (3) .5964 i 56 7 60. 00 m 7. 247 2 48 (3) .5946 i 56 60.00 m .247 2 48 (3) .591Flunkeys, female 2 i 56 e 60.00 m .397 2 48 (3) .589Laborers, skidway. 3 48 . 575 h .575 1 48 (3) . 5872 48 3.40 d .425 4 48 (3) .578Loaders______ 1 48 (3) 1. 568 2 48 (3) .5741 48 (3) 1. 508 2 48 (3) .5611 48 (3) 1.459 2 48 (3) . 5501 48 (8) .810 2 48 (3) .5381 48 (3) .716 2 48 (3) .5261 48 (3) .659 1 48 (3) . 5201 48 (3) .615 2 48 (3) .5181 48 (3) .597 2 48 (3) .5071 48 (3) .554 2 48 (3) .4851 48 (3) .500 2 48 (3) .4832 48 . 50 h .500 2 48 (3) .438Maintenance men. 1 48 .60 h .600 2 48 (3) .392Repair men__ 2 48 .65 h .650 2 48 (3) .365: l 48 . 60 h .600 1 48 (3) .122
i 3 48 . 54 h .540 Scalers ................ 6 48 6 90. 00 m .608! 1 48 4. 00 d .500 1 48 «80. 00 m .560i 3 48 . 50 h .500 Shopmen............ 1 48 6 90. 00 m .608Sawyers________ 1 48 (3) 1. 245 Skidders______ 1 48 (3) 1.548
2 48 (3) 1.138 1 48 (3) 1.3672 48 (3) .926 2 48 (3) 1.3372 48 (3) .922 3 48 (3) 1. 2831 48 (3) .915 1 48 (3) 1.2122 48 (3) .886 1 48 (3) 1.1171 48 (3) .885 2 48 (3) 1.0211 48 (3) .879 1 48 (3) .9811 48 (3) .850 1 48 (3) .9762 48 (3) .849 1 48 (3) .9562 48 (3) .833 2 48 (3) .9402 48 (3) .811 1 48 (3) .9351 48 (3) .806 1 48 (3) .9212 48 (3) .792 2 48 (3) .9031 48 (3) .786 2 48 (3) .8972 48 ! (3) .785 1 48 (3) .8882 48 (3) .782 2 48 (3) .8781 48 (3) .780 1 48 (3) .8481 48 (3) .779 1 48 (3) .8441 48 (3) .770 1 48 (3) .8434 48 (3) .767 4 48 (3) .8382 48 (3) .763 2 48 (3) .8372 48 6. 00 d .750 1 48 (3) .8192 48 (3) .734 1 48 (3) .8161 48 (3) .725 2 48 (3) .7952 48 (3) .722 1 48 (3) .7622 48 (3) . 705 3 48 (3) .7542 48 (3) .702 2 48 (3) .7521 48 (3) . 696 2 48 (3) .7482 48 (3) .692 2 48 (3) . 7472 48 (3) .688 2 48 (3) .7392 48 (3) . 686 2 48 (3) .7382 48 (3) . 685 2 48 (3) .7302 48 (3) .683 1 48 (3) .7292 48 (3) . 657 2 48 (3) .7231 48 (3) .644 2 48 (3) .7192 48 (3) . 638 1 48 (3) .7162 48 (3) . 634 2 48 (3) .6862 48 (3) . 633 2 48 (3) .6834 48 (3) . 630 2 ! 48 (3) .6822 48 (3) .626 2 48 (3) . 0722 48 (3) .625 |! 2 | 48 (8) .670
*7 days. 8 Piecework. 6 And board at $1.20 per day. 7 And board.
Digitized for FRASER http://fraser.stlouisfed.org/ Federal Reserve Bank of St. Louis
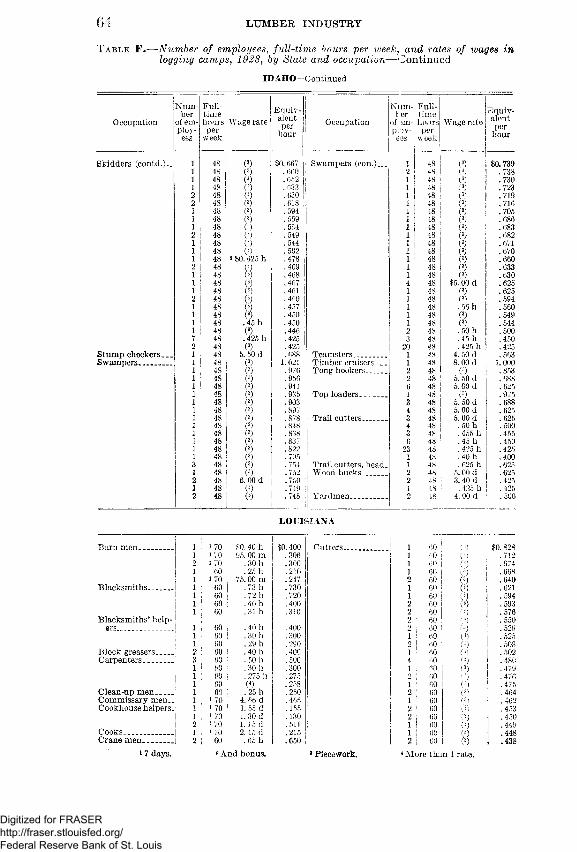
64- l u m b e r INDUSTRY
T a b l e F.— Number of employees, full-time hours per week, and rates of wages inlogging camps, 1928 , by State and occupation— Continued
IDAHO—Continued
OccupationNumber of em ployees
FulltimehoursperweekWage rate
EquivalentperhourOccupation
Num- ler of 3 m -pl 3y-ees
FulltimehoursperweekWage rate
Equivalentperhour
Skidders (contd.).. 1 48 0 $0. 667 i Swampers (con.)„_ 1 48 0 $0.7391 48 (3) .660 2 48 0 .7381 48 (3) .652 1 48 0 .7301 48 0 . 633 1 48 0 .72348 (3) .630 1 48 0 .71948 (3) . 618 1 48 0 .7161 48 (3) .594 1 48 0 .7051 48 (3) . 559 1 48 0 .6861 48 0 .554 1 48 0 .6832 j 48 0 .549 1 48 0 .6821 48 0 .544 1 48 0 .6711 48 0 .502 1 48 0 .6701 48 * $0. 425 h .478 1 48 0 .6602 48 (s) .469 1 48 0 .6331 48 (3) .468 1 48 0 .6301 48 (3) .467 4 48 $5.00 d .6251 48 (3) .461 1 48 0 .62548 (3) .460 1 48 0 .5941 48 (3) .457 1 I 48 . 56 h .5601 48 (3) .450 1 48 0 .5491 48 . 45 h .450 1 : 48 0 .5441 48 0 .446 2 48 . 50 h .5007 48 .425 h .425 3 48 . 45 h .4502 ; 48 0 .425 20 48 .425 h .425Stump checkers_ 1 ! 48 5. 50 d .688 Teamsters.......... 1 48 4. 50 d .563Swampers............ 1 j 48 0 1.021 Timber cruisers_ 1 48 8. 00 d 1.0001 | 48 0 .976 Tong hookers___ 2 48 0 .8531 | 48 0 .956 2 48 ! 5. 50 d .6881 | 48 0 .941 6 i 48 5. 00 d .6251 I 48 0 .935 Top loaders. __ 1 : 48 0 .9751 i 48 0 .903 3 ! 48 5. 50 d .688.1 ! 48 0 .897 4 48 5.00 d . 6251 ! 48 0 .878 Trail cutters_. _ __ 3 ! 48 5. 00 d .6251 ! 48 0 .848 4 i 48 . 50 h .5001 48 0 .838 3 48 .455 h . 4551 48 0 .837 6 1 48 .45 h .4501 48 0 .822 23 48 . 425 h .4251 48 0 . 795 1 48 .40 h .40048 0 . 754 Trail cutters, head. 1 48 1 .625 h .6251 48 0 . 752 Wood bucks___ 2 48 ! 5.00 d .62548 6.00 d * 750 2 i 48 ! 3.40 d .4251 48 0 .749 1 48 ! .425 h .4252 48 0 .748 Yardmen. .......... 2 i 48 4.00 d 1 .500
LOUISIANA
Barn men_____ 1 i 70 JO. 40 h $0.400 Cutters____ 1 60 I 00
$0. 8281 i 70 ! 95. 00 m .306 1 1 00 i .712i 70 . 30 h .300 1 ! 60 . 6741 60 .25 h . 250 1 60 C3) .6681 i 70 75.00 m .247 2 60 0 .640Blacksmiths......... 1 60 .73 h .730 1 60 (3) .6211 60 . 72 h .720 1 60 0 .5941 60 . 40 h .400 2 60 0 , 5931 60 .31 h .310 2 60 0 .576Blacksmiths’ help 2 60 0 .550ers................... 1 60 . 40 h .400 2 60 0 .5291 60 | . 30 h .300 1 60 0 . 5251 60 . 29 h . 290 2 60 0 .508Block greasers__ 60 . 40 h .400 1 60 0 . 502Carpenters.......... 60 . 50 h .500 4 60 0 .4801 60 .30 h .300 1 60 0 .4791 60 . 275 h .275 2 60 0 .4761 60 (4) .258 1 60 0 . 475Clean-up men__ 1 60 .25 h . 250 2 60 0 .464Commissary men.. 1 J 1 70 4. 66 d . 466 1 60 0 .462Cookhouse helpers. 1 ! i 70 ! 1. 55 d . 155 2 60 {3) . 4531 I i 70 1. 30 d .130 2 60 0 .4502 1 70 1.15 d .511 1 60 0 .449Cooks.__ ____ 1 ! 1 70 j 2.15 d .215 1 60 0 .448Crane men......... . 2 I 60 . 65 h .650 2 i 60 0 .438
17 days. 2 And bonus. 8 Piecework. * More than 1 rate.
Digitized for FRASER http://fraser.stlouisfed.org/ Federal Reserve Bank of St. Louis

WAGES AND HOURS IN LOGGING CAMPS IN 1928 65T a b l e F.— Number of employees, full-time hoars per week, and rates of wages in
logging camps, 1928, by State and occupation— ContinuedLO U ISIA N A —Continued
Occupation
Cutters (contd.)—-
Deckers.
Num- ber
of em- ploy-
Drivers.
Drivers, tractor___jDrum men...........|Drum pullers...
Dynamite m en... Engineers, loader. Extra men.......
Fallers...................Filers.....................
Firemen, loader ...
Firemen, shop.......Firemen, skidder..
Flagmen.................
Flagmen, skidder.. Foremen, bridge
gang................Foremen, cutters.. Foremen, graders.. Foremen, section..
Foremen, skidders. Foremen, team s...
1 7 days.
Fulltimehoursper
week
W age rate
3 60 (3) $0. 4251 60 (3) .4221 60 3) .3872 60 h .3791 60 (3) .3632 60 (3) .3622 60 (3) .3601 60 (3) .3471 60 (3) .3452 60 (3) .3362 60 (3) .3331 60 (3) .3302 60 (3) .3201 60 (3) .3095 60 (3) .3003 60 $0. 325 h . 3251 60 (4) .3089 60 . 30 h .3001 60 (4) .3001 60 (*) .2955 60 . 275 h .2751 60 (4) .2651 60 . 375 h .37515 60 . 30 h .3002 60 (4) .2982 60 (4) .2961 60 (4) .2921 60 (4) .2911 60 (4) .2901 60 (4) .28231 60 . 28 h .2801 60 (4) .2792 60 (4) .2782 60 . 275 h . 2751 60 (4) . 2751 60 (4) .2721 60 (4) . 2701 60 (4) . 2681 60 (4) . 2671 60 (4) . 2659 60 . 25 h . 2501 60 (4) .2181 60 . 45 h . 4508 60 . 40 h .4001 60 (4) .4671 60 . 45 h .4501 60 (4) .4483 60 . 375 h .3751 60 .30 h .3003 60 160.00 m .6152 60 .50 h . 5001 60 2.325 h .35141 60 .31 h .3101 60 (3) 1.0632 60 .45 h .4502 60 .30 h .3001 i 70 . 40 h .4001 60 95.00 m .3801 60 . 325 h .3253 60 . 275 h .2751 60 . 40 h .4003 60 . 40 h .4001 60 .375 h .3753 60 . 275 h .2751 60 (4) .2741 60 (4) .260'1 60 . 25 h .2501 60 . 50 h .5002 60 . 50 h .5001 60 . 60 h .6001 60 .45 h .4503 60 .40h .4002 60 1.00 h 1.0001 60 . 60 h .600
* And bonus.
Equivalentper
hourOccupation
Number
of employees
Fulltimehoursper
week
Wage rateEquivalentperhour
Graders ................. 2 60 $0.30 h $0.3001 60 .26 h .2601 60 (4) .25923 60 .25 h , .25019 60 . 225 h .225
Horse changers___ 1 60 . 30 h .300Hostlers................... 1 i 70 .55 h . 550
1 i 70 . 35 h .3501 60 .325 h .3251 60 . 25 h .250
Hostlers’ helpers... 60 . 30 h .3001 60 .25 h .250
Laborers_________ 1 60 .30 h . 300Laborers, section.. 60 .25 h .250
1 60 (4) .24760 . 24 h .2401 60 (4) .2401 60 (4) .2341 60 (4) .23043 60 . 225 h .2251 60 . 20 h .200
11 60 .28 h .280L a b o re rs , s teel
gang.................. 20 60 .275 h .2751 60 (4) .2401 60 (4) .22718 60 .225 h .2251 60 (4) .224
Loader men............ 60 l.OOh 1. 000Loader operators.. 1 60 180.00 m .692
1 60 175.00 m .673Loaders __............. 60 .30 h .300Logrollers ______ 60 .25 h .250Machine operators. 1 60 . 30 h .300Machinists_______ 60 . 73 h .730
1 60 . 55 h .550Machinists’ helpers 1 60 . 325 h .325
1 60 (4) .304Mail carriers____ 1 60 30.00 w .500Master mechanics. 1 60 .90 h .900Pile-driver helpers. 60 . 30 h .300
1 60 (4) .258Pile-driver opera
tors....................... 1 60 . 40 h .400Pump men_______ 1 60 .40 h .400Repair men............ 1 60 . 50 h .50060 . 40 h .400
1 60 .35 h .3501 60 . 30 h .300
Riders......... ............ 60 .25 h .250Scalers....... .............. 1 60 130.00 m .500
62 . 50 h • 5001 60 125.00 m .4811 60 . 475 h .4751 60 . 45 h .4501 60 .40 h .4001 60 95.00 m . 3S0
Scavengers____ . . . 1 60 . 275 h .275Shop helpers........... 1 60 .4011 .400
1 60 . 35 h .350Skidder helpers___ 60 . 50 h . 500Slack pullers........... 60 (4) .26560 . 25 h .250Spikers, steel gang. 60 . 28 h • .280Straw bosses........... 1 60 .325 h .325Supply men........... 1 60 . 36 h . 360Swampers............... GO .325 h .325
1 60 . 30 h .3001 60 (4) .2871 60 (4) .28415 60 . 275 h . 2751 60 (4) .26460 (4) .2601 60 h i .256
3 Piecework. 4 More than 1 rate.
Digitized for FRASER http://fraser.stlouisfed.org/ Federal Reserve Bank of St. Louis
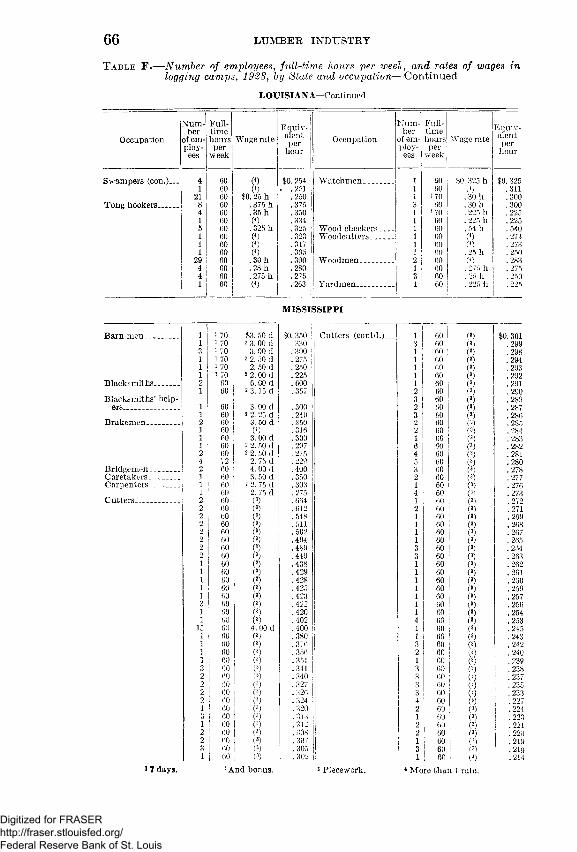
6 6 LUMBER INDUSTRY
LOUISIANA—Continued
T a b l e F.— Number of employees, full-time hours per weel, and rates of wages inlogging camps, 1928, by State and occupation— Continued
OccupationNumber of employees
FulltimehoursperweekWage rate
EquivalentperhourOccupation
Is [umber of employees
FulltimehoursperweekW age rate
Equivalentperhour
Swampers (con.)-— 4 60 0) $0. 254 Watchmen.......... 1 60 $0. 325 h $0. 3251 60 0 . . 251 1 60 0 .311
21 60 $0.25 h .250 1 170 . 30 h .300Tong hookers....... 8 60 . 375 h .375 60 . 30 h .3004 60 . 35 h .350 1 170 . 225 h .2251 60 0 .334 1 60 . 225 h .2255 60 . 325 h .325 Wood checkers__ 1 60 . 54 h .5401 60 0 .323 Woodcutters___ 1 60 0 .2741 60 0 .317 1 60 0 .2731 60 0 .305 1 60 .25 h . 25029 60 . 30 h .300 Woodmen........... 1 60 (4) .2834 60 .28 h .280 1 | 60 . 275 h . 2754 60 . 275 h .275 60 . 25 h . 2501 60 0 .263 Y ardmen............. 1 60
1
. 225 h . 225
MISSISSIPPI
Barn men.
Blacksmiths.......Blacksmiths’ helpers___ ____Brakemen_....... .
BridgemenCaretakers.CarpentersCutters__
* 7 days.
70 $3. 50 d $0. 35070 2 3. 00 d . 33070 3.00 d .300■ 70 2 2. 50 d .275- 70 2. 50 d .250 70 2 2. 00 d .22560 6. 00 d .60060 2 3.15 d .35760 3. 00 d .30060 2 2. 25 d .24960 3. 50 d .35060 (0 .31660 3. 00 d .30060 2 2. 50 d .29760 2 2. 50 d .27572 2. 75 d .22960 4. 00 d .40060 3. 50 d . 35060 2 2. 75 d .30360 2. 75 d . 27560 (3) .66460 (3) .61260 0 .54860 (3) .51160 (3) .50260 (3) .49460 (3) .48960 (3) .44960 (s) .43860 (3) .42960 (3) .42860 0 .42560 (3) .42360 (3) .42260 (3) .42060 (3) .40260 4. 00 d .40060 (3) .38060 (3) . 37660 0 .35660 0 .35160 (3) .34160 (3) .34060 (3) .32760 (3) .32660 0 .32460 (3) .32060 (3) .31360 (3) .31260 0 .30860 0 .30760 0 .30560 (3) . 302*And bonus.
Cutters (contd.)-.
8 Piecework.
1 60 C8) $0. 3013 60 0 .2991 60 (3) .2981 60 (3) .2941 60 (3) .2931 60 (3) .2921 60 0 .2912 60 (3) .2903 60 (3) .2892 60 (8) .2873 60 0 .2862 60 (3) .2852 60 ( 3 ) .2841 60 (3) .2836 60 (3) .2824 60 (3) .2815 60 (3) .2803 60 (3) .2782 60 (3) .2771 60 0 .27660 0 .2731 60 (3) .27260 (3) .2711 60 (8) .2691 60 (3) .2681 60 (3) .2671 60 (3) .26560 (3) .25460 (3) . 2631 60 (3) .2621 60 (3) .2611 60 0 .2601 60 (3) .2591 60 (3) .2571 60 (3) .2561 60 0 .25460 0 .2531 60 0 .2451 60 0 .2433 60 0 .2422 60 0 .2401 60 0 .2393 60 0 .2383 60 0 .2373 60 0 .2353 60 0 j . 2334 60 0 .2272 60 0 .2241 60 ! 0 . 2232 60 i 0 ’. 2212 60 I 0 .2201 60 ! 0 .2193 60 1 0 .2191 60 , (3) .214
More than 1 rate.
Digitized for FRASER http://fraser.stlouisfed.org/ Federal Reserve Bank of St. Louis
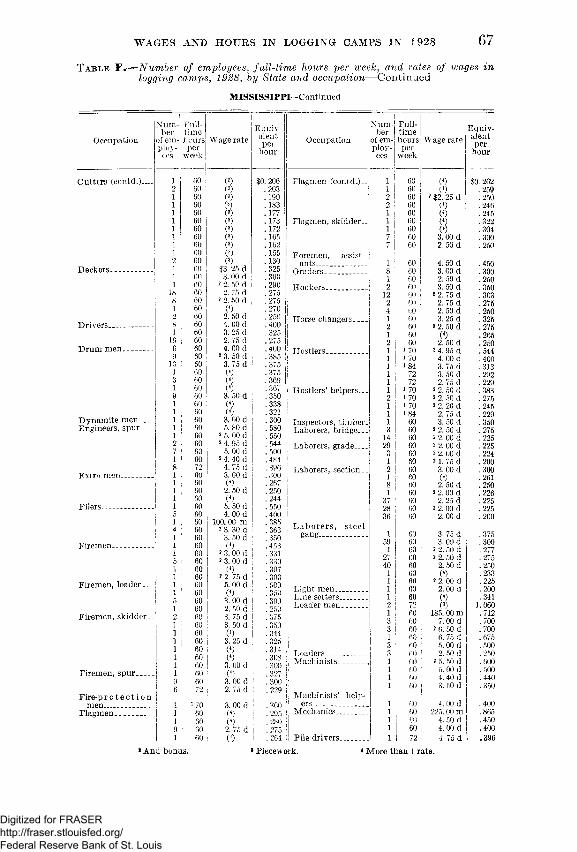
WAGES AND HOURS IN LOGGING CAMPS IN 1928 67T a b l e F.— Number of employees, full-time hours per week, and rates of wages in
logging camps, 1928, by State and occupation— Continued
M ISSISSIPPI—Continued
NumberOccupation of ein- ploy-
Cutters (contd.
Deckers .
Drivers__
Drum men.
Dynamite men... Engineers, spur...
Filers..
Firemen .
Firemen, loader..
Firemen, skidder.
Firemen, spur__
Fire-p rotectionmen_______Flagmen............ .
Fulltimehoursperweek
1 602 601 601 601 601 601 601 601 601 602 601 601 601 6018 608 601 | 602 I 608 j 601 1 6016 I 606 ! 609 6013 ; 601 ! 603 i 601 : 609 601 601 601 601 601 602 607 601 608 721 601 601 ; 601 601 605 601 ; 604 ! 601 601 601 605 601 601 601 601 605 601 602 601 601 601 601 601 601 601 609 606 ! 721 I 1701 601 ; 609 1 601 60
Wage rate
(3)(3)(3)(3)( 3 )
(3)(3)(3)(3)(3)(3)$3. 25 d3. 00 d
2 2. 50 d2. 75 d 2 2. 50 d
(4)2. 50 d4. 00 d3. 25 d2. 75 d4. 00 d 2 3. 50 d3. 75 d
(4)(4)(4)3. 50 d(4)(4)3. 00 d5. 80 d
2 5. 00 d 2 4. 95 d5. 00 d 2 4. 40 d4. 75 d3. 00 d
(4)2. 50 d(4)5. 50 d4. 00 d
100. 00 m2 3. 30 d3. 50 d
(4)2 3. 00 d 2 3. 00 d
(4)2 2. 75 d
5. 00 d (4)3. 00 d2. 50 d3. 75 d 3. 50 d (4)3. 25 d (4)(4)3. 00 d (4)3. 00 d2. 75 d3. 00 d (4)(4)2. 75 d (4)
Equivalentperhour
I. 206 .203 . 190 . 183 .177 .173 .172 .165 .162 .155 .130 .325 .300 .290 .275 .275 .270 .250 .400 .325 .275 .400 .385 .375 . 375 .369 .367 .350 .338 .321 .300 .580 .550 . 544 .500 . 484 .396 . 300 . 267 . 250 . 244 .550 .400 .385 .363 .350 .453 .331 . 330 .307 .303 .500 .350 .300 .250 . 375 .350 .344 .325 .314 .308 . 300 . 327 .300 .229.300.295.280.275.264
Occupation
Flagmen (contd.)„
Flagmen, skidder..
Foremen, assistants...__ ___Graders______Hookers.
Horse changers_
Hostlers .
Hostlers’ helpers...
Inspectors, timber. Laborers, bridge...Laborers, grade_
Laborers, section..
Laborers, steel
Light men... Line setters.. Loader men.
Loaders__Machinists.
Machinists’ helpers_______Mechanics.........
Pile drivers..
umberem-loy-ses
FulltimehoursperweekWage rate
Equivalentperhour
1 60 (4) $0. 2621 60 I4) .2592 60 2 $2. 25 d .2502 60 (4) .2461 60 (4) .2451 60 (4) .3221 60 (4) .3047 60 3.00 d .3007 60 2. 50 d .2501 60 4.50 d .4508 60 3. 00 d .3001 60 2. 50 d .2502 60 3. 50 d .350
12 60 2 2. 75 d .3032 60 2. 75 d .2754 60 2. 50 d .2501 60 3. 25 d .3252 60 2 2. 50 d .2751 60 (4) .2652 60 2. 50 d .2501 i 70 ! 2 4. 95 d .5441 i 70 4. 00 d .4001 i 84 3. 75 d .3131 72 3. 50 d .2921 72 2. 75 d . 2291 i 70 2 2. 50 d .3832 i 70 2 2. 50 d .2751 i 70 2 2. 20 d .2451 184 2. 75 d .2291 60 3. 50 d .3503 60 2 2. 50 d .27514 60 2 2. 00 d .22529 60 2 2. 00 d .2253 60 2 2. 00 d .2241 60 21. 75 d .2002 60 3. 00 d .3001 60 (4) .2618 60 2. 50 d .2501 60 2 2. 00 d .22637 1 60 2. 25 d .22528 j 60 2 2.00 d .22536 60 2.00 d .200
1 60 3. 75 d .37559 60 3. 00 d .3001 60 2 2. 50 d . 27727 60 2 2. 50 d .27540 60 2. 50 d .2501 60 (4) .2331 60 2 2. 00 d .2251 60 2. 00 d .2001 60 (4) .3412 72 ! (3) 1.0601 60 , 185. 00 m .7123 60 i 7. 00 d .7003 60 2 e. 50 d .7001 60 1 6. 75 d .6753 60 5. 00 d .5003 60 ! 2. 50 d .2501 60 : 2 5. 50 d .6001 60 ! 5. 00 d .5001 60 : 4. 40 d .4401 60 j 3. 50 d .3501 60 4. 00 d .4001 60 225. 00 m .8651 60 4. 50 d .4501 60 j 4. 00 d .4001 72 S 4. 75 d i .396
* And bonus. * Piecework. * More than 1 rate.
Digitized for FRASER http://fraser.stlouisfed.org/ Federal Reserve Bank of St. Louis
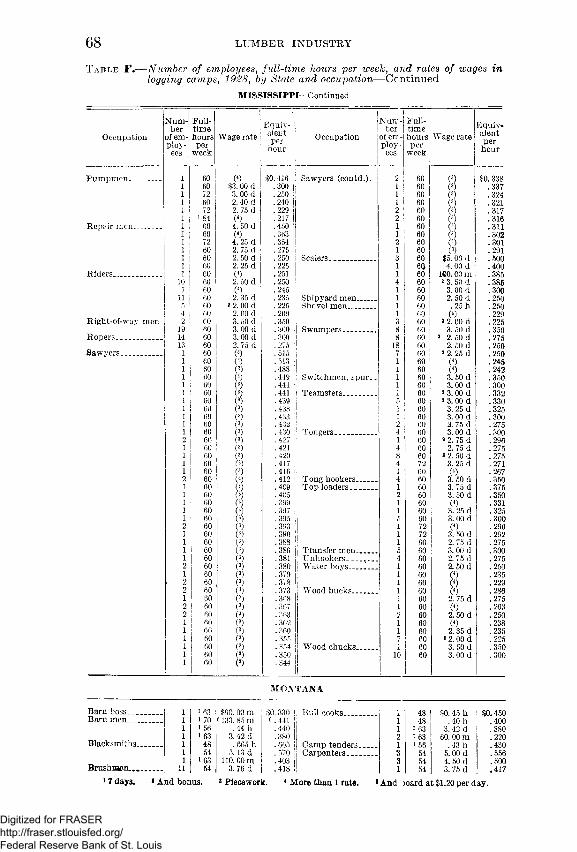
6 8 L U M B E R I N D U S T R Y
• M ISSISSIPPI—Continued
T a b l e F.— Number of employees, full-time hours per week, and rates of wages inlogging camps, 1928, by State and occupation— C o n t in u e d
Occupation
Number
of employees
Fulltimehoursper
week
Wage rateEquivalentper
hourOccupation
Number
of employ
ees
Fulltimehoursper
week
Wage rateEquivalentper
hour
Pumpmen............... 1 60 (4) $0,416 Sawyers (contd.).. 2 60 (3) $0. 3381 60 $3. 00 d .300 1 60 (3) .3371 72 3. 00 d .250 1 60 (3) .3241 60 2. 40 d .240 1 60 (3) .3211 72 2. 75 d .229 2 60 (3) .3171 i 84 (4) .217 2 60 (3) .316
Repair men_______ 1 60 4. 50 d .450 1 60 (3) .3111 60 (4) .363 1 60 (3) .3021 72 4. 25 d .354 2 60 (3) .3011 60 2. 75 d .275 1 60 (3) .2911 60 2. 50 d .250 3 60 $5. 00 d .5001 60 2. 25 d .225 1 6Q 4. 00 d .400
Riders...................... 1 60 (4) .251 1 60 ICO. 00 m .38510 60 2. 50 d .250 4 60 2 3. 50 d .3851 60 (4) .245 1 60 3. 00 d .300
11 60 2. 35 d .235 Shipyard men......... 1 60 2. 50 d .2505 60 2 2.00 d .225 Shovel men_______ 1 60 . 25 h .2504 60 2. 00 d .200 1 60 (4) .229
Right-of-way men. 2 60 3. 50 d .350 3 60 ® 2. 00 d .22519 60 3. 00 d .300 Swampers............... 8 60 3. 50 d .350
Ropers...... .......... . 14 60 3.00 d .300 8 60 2 2. 50 d .27513 ; 60 2. 75 d .275 18 60 2. 50 d .250
Sawyers................... 1 60 (3) . 515 7 60 2 2. 25 d . 2501 60 (3) .513 1 60 (4) .2451 60 (3) .488 1 60 (4) .2421 60 (3) .449 | Switchmen, spur.. 1 60 3. 50 d .3501 60 (3) . 444 1 60 3. 00 d .3001 60 (3) .441 Teamsters. ........... 1 60 2 3. 00 d .3321 60 0 .439 60 2 3. 00 d .3301 60 (3) .438 1 60 3. 25 d .3251 60 (3) . 433 1 60 3. 00 d .3001 60 (3) .432 60 2. 75 d .2751 60 (3) .430 Tongers................... 4 60 3. 00 d .3002 60 (3) . 427 1 60 2 2. 75 d .2961 60 (3) .421 60 2. 75 d .2751 60 (3) .420 60 2 2. 50 d .2751 60 (3) .417 4 72 3. 25 d .2711 60 (3) .416 1 60 (4) .2672 60 (S) .412 Tong hookers......... 4 60 3. 50 d .3501 60 (») .409 Top loaders-.......... 1 60 3. 75 d .3751 60 (3) .405 60 3. 50 d .3501 60 (3) .399 1 60 (4) .3311 60 (3) .397 1 60 3. 25 d .3251 60 (3) .395 60 3. 00 d .3002 60 (3) . 393 1 72 (4) .2961 60 (3) .390 1 72 3. 50 d .2921 60 (3) .388 1 60 2. 75 d .2751 60 (3) .386 Transfer men......... 60 3.00 d .3001 60 (3) .381 Unhookers ............ 4 60 2.75 d .2752 60 (3) .380 Water boys___ 1 60 2.50 d .2501 60 (3) .379 1 60 (4) .2352 60 (3) .378 1 60 (4) .2292 60 (3) .373 Wood bucks........... 1 60 (4) .2861 60 (3) . 368 1 60 2. 75 d .2752 60 (3) .367 1 60 (4) .2632 60 (3) .383 60 2. 50 d .2501 60 (3) .362 1 60 (4) .2381 60 (3) .360 1 60 2.35 d .2351 60 (3) . 355 7 60 2 2.00 d .2251 60 (3) .354 Wood chucks......... 1 60 3. 50 d .3501 60 0 .350 10 60 3.00 d .3001 60 (3) . 344
M O N TA N A
Barn boss.. Barn men..
Blacksmiths..
Brushraen__17 days.
1 i 63 $90. 00 m $0. 330 ! Bull cooks............... 1 48 $0. 45 h1 i 70 e 133.85 m «.441 1 48 .40 h1 i 56 .44 11 .440 1 i 63 3. 42 d1 i 63 3.42 d .380 2 i 63 60. 00 m1 48 . 665 h .665 Camp tenders........ 1 i 56 .43 h1 54 5.13 d . 570 Carpenters_______ 3 54 5.00 d1 i 63 110. 00 m .403 3 54 4. 50 d
11 54 3. 76 d .418 1 54 ; 3. 75 d
iO. 450 .400 .380 .220 .430 .556 .500 .417
* And bonus. * Piecework. * More than 1 rate. • And ooard at $1.20 per day.
Digitized for FRASER http://fraser.stlouisfed.org/ Federal Reserve Bank of St. Louis

WAGES AND HOURS IN LOGGING CAMPS IN 1928 69T a b l e F.— Number of employees, full-time hours per week, and rates of wages in
logging camps, 1928, by State and occupation— Continued
M O N TA N A —Continued
Occupation
Number
of employees
Fulltimehoursper
week
Wage rateEquivalentper
hourOccupation
Number
of employees
Fulltimehoursper
week
Wage rateEquivalentper
hour
Chainmen________ 1 54 $3.75 d $0.417 Roll-out men. 1 48 $0.42 h $0.420Chokers__________ 1 48 . 50 h .500 Sawyers__ . . 2 48 (3) 1.407
4 54 4.10 d . 456 2 54 (3) .9028 48 . 42 h .420 1 54 (3) .832
Chute builders___ 1 48 .61 h .610 1 54 (3) .831Chute men_______ 1 48 . 56 h .560 1 54 (*) .822Chute tenders____ 5 48' . 42 h .420 1 54 (3) .760Cookees................... 3 i 56 . 40 h .400 2 54 (3) 0. 723
3 i 63 3.42 d .380 2 48 (3) .720Cooks...................... 1 i 63 5.93 d .659 1 48 (3) .709
1 i 56 155.00 m .639 1 54 (3) .6761 i 70 s 161.00 m 8. 531 3 54 (3) . 6671 i 63 140.00 m .513 2 48 (3) .646
Cooks, second____ 1 i 70 e 150. 00 m 8.495 1 48 (3) .6421 i 56 100. 00 m .412 2 54 (3) .640
D rivers................. 4 54 5. 93 d .659 2 54 (3) .6302 48 . 60 h .600 1 54 (3) .626
Dump men_______ 1 48 . 42 h .420 1 54 (3) .601Engineers________ 1 54 5. 29 d .588 1 60 (3) .582Engineers, loader. _ 1 54 6. 50 d .722 1 54 (3) .582Filers_____________ 1 48 .53 h .530 3 54 (3) .575
1 54 4. 32 d .480 2 54 (3) .5651 54 100.00 m .427 1 54 (3) .563
Firemen_____ ____ 1 54 4.00 d .444 2 54 (3) .557Firemen, loader.._ 1 54 4. 50 d . 500 2 48 (3) .547Flunkeys................ 2 i 70 s133. 85 m 6. 441 1 48 (3) .516
1 i 56 . 40 h .400 2 48 (3) .5101 i 70 6 9. 540 m 6.314 1 60 h .4813 i 63 55. 00 m .201 1 60 (3) .458
Foremen, section.. 1 54 . 50 h .500 5 48 . 45 h .450Handy men______ 1 54 4. 55 d .506 2 48 (3) .268Hookers. ............... 4 54 4.10 d .456 Scalers. _ __ __ 1 48 180.00 m . 742
1 54 3. 75 d .417 1 54 4. 32 d .480Laborers.................. 5 54 3. 79 d .421 1 54 80. 00 m .342
9 48 . 42 h .420 1 i 63 90. 00 m .3303 54 3. 75 d .417 1 i 63 80.00 m .293
Laborers, log road. 3 60 . 50 h .500 Section boss............ 1 54 . 50 h .5001 60 . 45 h .450 Skidders__________ 1 54 (3) 1.130
Laborers, section. _ 3 54 . 38 h .380 1 54 (3) .763Landing cleaners.. 2 54 4.00 d .444 1 54 (3) .761Landing men_____ 1 54 4.10 d .456 1 54 (3) .751
3 54 3.87 d .430 1 54 (3) .6951 48 .42 h .420 2 54 (3) .661
Landing tenders... 6 48 . 42 h .420 1 54 (3) .659Loaders................... 1 54 (3) 1. 088 1 54 ( 3) .634
1 54 ( 3) 1. 025 1 54 ( 3) .6181 54 ( 3 ) 1.010 1 54 ( 3) .6091 54 (3) .861 1 54 (3) .5712 54 (3) .777 1 54 (3) .4621 54 (3) .756 1 60 . 45 h .4501 54 (3) .741 2 60 . 425 h .4251 54 6. 50 d . 722 1 54 3. 75 d .4171 54 ( 3) . 717 10 54 3.65 d .4064 54 ( 3) .698 4 60 . 40 h .4002 60 . 50 h .500 Skid yard tenders.. 7 48 . 42 h .4202 60 .425 h .425 Swampers............... 2 60 . 50 h .5001 60 .415 h .415 5 54 3.83 d .4283 60 . 40 h .400 1 60 . 425 h .425
Log shippers........... 1 60 . 58 h .580 44 48 . 42 h .4201 60 . 50 h .500 1 54 3. 65 d .4061 60 . 438 h .438 13 60 . 40 h .4002 60 .425 h .425 18 54 3.40 d .3784 60 . 40 h .400 Talleymen. ............ 2 48 . 42 h .420
Pull-out men_____ 1 48 . 42 h .420 Teamsters........... 4 8 50 . 45 h .450Pump men_______ 1 i 63 130. 00 m .476 12 48 . 45 h .450Right-of-way men. 2 54 3. 87 d .430 3 54 3. 97 d .441Roadmen.............. . 1 48 . 45 h .450 6 54 3. 87 d .430
1 60 .425 h .425 Top loaders............ 1 54 4. 60 d .5113 48 . 42 h .420 Tow path men___ 1 48 . 42 h .4204 60 . 40 h .400
17 days. * And bonus. 8 Piecework. 4 More than 1 rat*. • Including board at $1.20 per day.
Digitized for FRASER http://fraser.stlouisfed.org/ Federal Reserve Bank of St. Louis
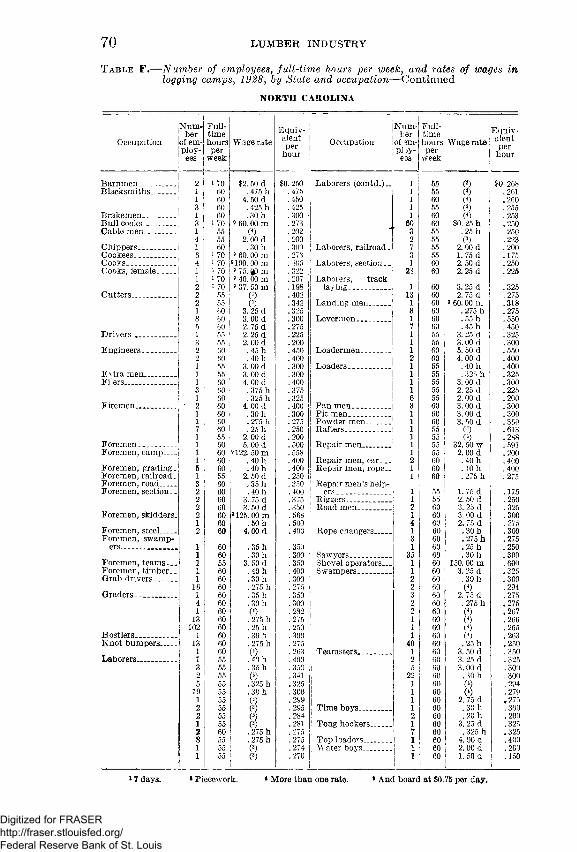
70 LUMBER INDUSTRY
N O R TH CAR O LIN A
Table F .— Number of employees, full-time hours per week, and rates of wages inlogging camps, 1928, by State and occupation— Continued
Occupation
Number
of employees
Fulltimehoursper
week
Wage rateEquivalentper
hourOccupation
Number
of employ
ees
Fulltimehoursper
week
Wage rateEquivalentper
hour
Barnmen. ______ 2 i 70 $2. 50 d $0.250 Laborers (contd.) „ 1 55 (3) j $0. 268Blacksmiths.......... 1 60 . 475 h .475 1 55 ( 3 ) i .261
1 60 4. 50 d .450 1 60 (4) .2603 60 .425 h .425 1 55 0 .255
B ra k em en ...____ 1 60 . 30 h .300 1 60 0) .253Bull cooks________ 3 i 70 0 60.00 m .273 60 60 $0. 25 h .250Cable men________ 1 55 (4) .202 ‘ 3 55 .25 h .250
4 55 2.00 d .200 2 55 ( 3 ) .223Chippers... _____ 1 60 . 30 h .300 Laborers, railroad. 7 55 2. 00 d .200Cookees__________ 6 i 70 » 60.00 m . 273 3 55 1. 75 d .175Cooks___ ________ 4 i 70 9 100. 00 m .405 Laborers, section._ ] 1 60 2.50 d .250Cooks, fem ale___ 1 i 70 9 75. QP m .322 23 60 2.25 d .225
1 i 70 9 40.00 m .207 Laborers, track2 i 70 « 37.50 m .198 laying----------------! 1 60 3.25 d .325
Cutters................... 2 55 (3) .402 13 60 2. 75 d . 2752 55 (3) .342 Landing men_____ 1 60 9 60.00 m .3181 60 3. 25 d .325 8 60 . 275 h .2758 60 3. 00 d .300 Leverm en............. 1 60 . 55 h .5505 60 2. 75 d .275 7 60 . 45 h .450
Drivers.............. . 1 55 2.25 d .225 1 55 3. 25 d .3253 55 2. 00 d .200 1 55 3.00 d .300
Engineers............... 2 60 .45 h .450 Loader men_______ 1 60 5. 50 d . 5502 60 . 40 h .400 2 60 4. 00 d .4001 55 3. 00 d .300 Loaders........ .......... 1 55 i . 40 h .400
Extra men.............. 1 55 3.00 d .300 1 55 . 325 h .325Filers...................... 1 60 4. 00 d .400 1 1 55 3. 00 d .300
3 60 . 375 h .375 1 55 2. 25 d .2251 60 .325 h .325 6 55 2. 00 d .200
Firemen____ ____ _ * 2 60 4.00 d . 400 Pan men_____ _ _ 3 60 3. 00 d . 3001 60 . 30 h .300 Pit men____ ______ 1 60 3.00 d .3001 60 .275 h . 275 Powder men. 1 60 3. 50 d .3507 60 . 25 h .250 Rafters___________ 1 55 (3) .6131 55 2.00 d .200 1 55 (3) .288
F orem en-.............. 1 60 5. 00 d .500 Repair men______ 1 55 32. 50 w . 591Foremen, camp___ 1 60 9122. 50 m .558 1 55 2. 00 d .200
1 60 .40h .400 Repair men, car__ 2 60 . 40 h .400Foremen, grading. 5 60 . 40 h .400 Repair men, rope— 1 60 . 40 h .400Foremen, railroad. 1 55 2. 50 d .250 1 60 . 275 h . 275Foremen, road____ 3 60 . 35 h .350 Repair men’s helpForemen, section.. 2 60 . 40 h .400 ers_____________ 1 55 1.75 d .175
2 60 3. 75 d .375 ! Riggers----------------- 1 55 ! 2. 50 d . 2502 60 3. 50 d .350 1 Road men............... 2 60 ; 3. 25 d .325
Foremen, skidders. 2 60 *125.00 m .568 1 60 i 3. 00 d .3001 60 . 50 h .500 4 60 | 2. 75 d .275
Foremen, steel____ 2 60 4.00 d .400 j Rope changers____ 1 60 . 30 h .300Foremen, swamp 3 60 . 275 h .275
ers. _............. ......... 1 60 . 35 h .350 1 60 .25 h .2501 60 .30 h .300 Sawyers_____ _____ 35 60 . 30 h .300
Foremen, teams.. . 1 55 3.50 d .350 Shovel operators.— 1 60 150. 00 m .600Foremen, timber. . 1 60 . 40 h .400 Swampers............... 1 60 3.25 d .325Grab drivers.......... 1 60 . 30 h .300 2 60 . 30 h .300
16 60 . 275 h .275 2 60 ( 4 ) .294Graders.-............... 1 60 . 35 h .350 3 60 2. 75 d .275
4 60 . 30 h .300 2 60 . 275 h .2751 60 (4) .282 2 60 (4) .267
13 60 . 275 h .275 1 60 (4) .266102 60 . 25 h .250 1 60 (4) .265
Hostlers__________ 1 60 . 30 h .300 1 60 (4) .263Knot bumpers____ 13 60 .275 h .275 40 60 .25 h .250
1 60 (4) . 263 Teamsters.............. 1 60 3. 50 d .350Laborers.................. 1 55 . 40 h .400 2 60 3. 25 d .325
3 55 . 35 h .350 5 60 3.00 d .3002 55 (3) .341 22 60 .30 h .3005 55 .325 h .325 1 60 (4) .294
19 55 . 30 h .300 1 60 (0 .2791 55 (3) .299 1 60 2. 75 d .2752 55 (3) .295 Time boys............... 1 60 . 30 h .3002 55 ( 3 ) .284 2 60 . 20 h .2001 55 ( 3 ) .281 Tong hookers......... 1 60 3. 25 d .3252 60 . 275 h .275 7 60 . 325 h .3258 55 ! .275 h .275 Top loaders............ 1 60 4. 00 d .4001 55 ! (3) .274 Water boys_______ 1 60 2.00 d .2001 55 (3) .270 1 60 1. 50 d .150
i17 days. 8 Piecework. * More than one rate. • And board at $0.75 per day.
Digitized for FRASER http://fraser.stlouisfed.org/ Federal Reserve Bank of St. Louis
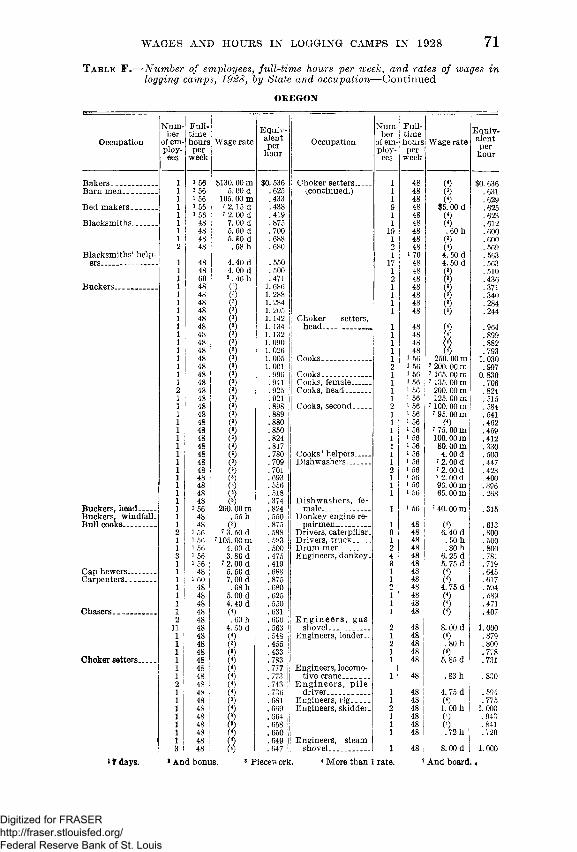
WAGES AND HOURS IN LOGGING CAMPS IN 1928 71
OREGON
Table F.— Number of employees, full-time hours per week, and rates of wages inlogging camps, 1928, by State and occupation— Continued
Occupation
Number
of employees
Fulltimehoursper
week
Wage rateEquivalentper
hourOccupation
Number
of employees
Fulltimehoursper
week
Wage rateEquivalentper
hour
Bakers _________ 1 i 56 $130.00 m $0. 536 Choker setters___ 1 48 (4) $0. 636Barn men............... 1 i 56 5.00 d .625 (continued.) 1 48 (3) .631
1 i 56 105.00 m .433 1 48 (4) .629Bed makers ............ 1 i 56 " 2.15 d .438 9 48 $5. 00 d .625
1 i 56 7 2. 00 d .419 1 48 (4) .623Blacksmiths______ 1 48 7. 00 d .875 1 48 (4) .612
1 48 5. 60 d .700 19 48 . 60 h .6001 48 5.60 d .688 1 48 (3) .600
48 . 68 h .680 2 48 (4) .569Blacksmiths’ help 1 i 70 4. 50 d .563
ers--------- ------------ 1 48 4.40 d .550 17 48 4. 50 d .5631 48 4. 00 d .500 1 48 (3) .5101 60 2.46 h .471 2 48 (3) .436
Buckers...... ............ 1 48 (3) 1.686 1 48 (3) .3711 48 (3) 1. 288 1 48 (3) .3401 48 (3) 1. 284 1 48 (3) .2841 48 (3) 1. 205 1 48 (3) .2441 48 (3) 1.142 Choker setters,1 48 (8) 1.134 head____ _______ 1 48 (4) .9641 48 (3) 1.132 ! 1 48 (4) .8991 48 (3) 1.090 1 48 (4) .8821 48 (3) 1. 026 1 48 (4) .7931 48 (3) 1.005 Cooks.......... ............ 1 i 56 250. 00 m 1.0301 48 (8) 1.001 2 1 56 7 200. 00 m .9971 48 (3) .996 Cooks.. _ ........... 1 i 56 7 165. 00 m 0. 8301 48 (3) .941 Cooks, female......... 1 1 56 7 135. 00 m .706
48 (3) .925 Cooks, head______ 1 1 56 200. 00 m .8241 48 (3) .921 1 i 56 125. 00 m .5151 48 (3) .898 Cooks, second____ 2 i 56 7 100. 00 m .5841 48 (3) .889 1 i 56 7 95. 00 m .5411 48 (3) .880 1 i 56 (4) .4621 48 (3) .850 1 i 56 7 75.00 m .4591 48 (3) .824 1 i 56 100. 00 m .4121 48 (a) .817 1 1 56 80.00 m .3301 48 (3) .780 Cooks’ helpers___ 1 i 56 4.00 d .5001 48 (3) .709 Dishwashers______ 1 i 56 7 2.00 d .447I 48 (3) .701 2 i 56 7 2. 00 d .4231 48 (a) .693 1 i 56 7 2. 00 d .4001 48 (3) .556 1 i 56 96. 00 m .3961 48 (3) . 518 1 i 56 65.00 m .2681 48 (3) .374 Dishwashers, fe
Buckers, head____ 1 1 56 200. 00 m . 824 male.. _____ 1 1 56 7 40.00 m 1 .315Buckers, windfall. 1 48 . 55 h .550 Donkey engine reBull cooks.......... 1 48 (3) .875 pairmen________ 1 48 (*) .613
i 56 7 3. 50 d .588 Drivers, caterpillar. 9 48 6.40 d .8001 i 56 7105.00 m .583 Drivers, truck. . . . 1 48 . 50 h .5001 i 56 | 4. 00 d .500 Drum men_______ 2 48 . 80 h .800
i 56 3. 80 d .475 Engineers, donkey. 4 48 6. 25 d .7811 i 56 7 2.00 d .419 3 48 5. 75 d .719
Cap hewers----------- 1 48 5.50 d .688 1 48 (4) .645Carpenters- _____ 1 i 60 7.00 d .875 1 48 (4) .617
1 48 . 68 h .680 2 48 4.75 d .5941 48 5.00 d .625 1 48 (4) .5891 48 4.40 d .550 1 48 (4) .471
Chasers................. 1 48 (4) .631 1 48 (4) .40748 . 60 h .600 E n g in e e rs , gas
11 48 4. 50 d .563 shovel... ______ 2 48 8.00 d 1.0001 48 (4) .548 Engineers, loader._ 1 48 (4) .8791 48 (3) .455 2 48 . 80 h .8001 48 (8) .433 1 48 (<) .778
Choker setters........ 1 48 (4) .783 1 48 6. 85 d .7311 48 (4) .777 Engineers, locomo1 48 (4) .773 tive crane_______ 1 48 . 83 h .830
48 (4) .743 E n gin eers, p ile1 48 (4) .736 driver__________ 1 48 4.75 d .5941 48 (3) .681 Engineers, rig____ 1 48 (4) .7751 48 (4) .669 Engineers, skidder. 2 48 l.OOh 1.0001 48 (3) .664 1 48 (4) .9431 48 (*) .658 1 48 (4) .8411 48 (4) . 650 1 48 . 72 h .7201 48 (4) .649 Engineers, steam3 48 (4) .647 shovel.................. 1 48 8.00 d 1.000
17 days. 1 And bonus. 3 Piecework. 4 More than 1 rate. 7 And board.«
Digitized for FRASER http://fraser.stlouisfed.org/ Federal Reserve Bank of St. Louis
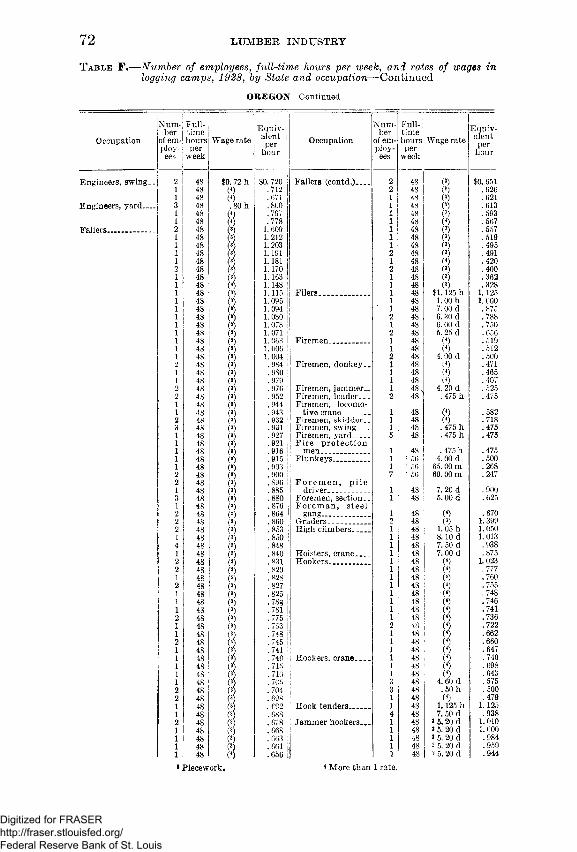
72 LUMBER INDUSTRY
T a b l e F .— Number of employees, full-time hours per week, and rates of wages inlogging camps, 1928, by State and occupation— Continued
O REGON —Continued
Occupation
Number
of employees
Fulltimehoursper
week
Wage rateEquivalentper
hour
Engineers, swing. _ 2 48 $0. 72 h $0.7201 48 (4) .7121 48 (4) .671
Engineers, yard— 3 48 . 80 h .8001 48 (0 .7971 48 (4) .778
Faliers---------------- - 2 48 (3) 1. 6091 48 (3) 1. 2121 48 (3) 1.2031 48 (3) 1.1911 48 (3) 1.1812 48 (3) 1.1701 48 (3) 1.1631 48 ( 3 ) 1.1481 48 ( 3 ) 1.1151 48 (3) 1. 0951 48 (3) 1.0941 48 (3) 1. 0801 48 (3) 1.0781 48 (3) 1. 0711 48 (3) 1.0631 48 (3) 1. 0061 48 (3) 1.0042 48 (3) .9841 48 C3) .9801 48 (3) .9792 48 (3) .9762 48 (3) . 9521 48 (3) .9441 48 (3) .9432 48 (3) .9323 48 (3) .9311 48 (3) .9271 48 (3) .9211 48 (3) .9161 48 (3) .9151 48 (3) .9032 48 (3) .9002 48 (3) .8961 48 (3) .8853 48 (3) .8801 48 (3) .8762 48 (8) .8642 48 (3) .8602 48 (3) .8531 48 (3) .8504 48 (3) .8481 48 (3) .8402 48 ( 3 ) .8312 48 (3) .8291 48 (3) .8282 48 (3) .8271 48 (3) .8251 48 (3) .7881 48 (3) .7812 48 (3) .7751 48 (3) .7531 48 (3) .7482 48 (4) .7451 48 (3) .7411 48 (3) . 7401 48 3) .7151 48 (3) . 7101 48 (3) . 7052 48 (3) .7042 48 (3) . 6981 48 (3) . 6921 48 (3) .6882 48 (3) .6781 48 (3) .6681 48 (3) .6631 48 (8) .6611 48 (0 .656* Piecework*
Occupation
Number
of employees
Fulltimehoursper
week
Wage rateEquivalentper
hour
Fallers (contd.)___ 2 48 (3) $0.6512 48 (8) .6261 48 (3) .6211 48 (3) .6131 48 (3) .5931 48 (4) .5671 48 (3) .5571 48 (3) .5191 48
48(3)(3)
.495
.4911 48
48(4)(3)
.420
.4001 48 (3) .3621 48 (3) .328
Filers....................... 1 48 $1.125 h 1.1251 48 1. 00 h 1. 000
4848
7. 00 d 6. 30 d
.875
.7881 48
486. 00 d 5. 25 d
. 750
. 656Firemen........... ....... 1 48 (4) .519
1 4848
(4)4.00 d
.512
.500Firemen, donkey.. 1 48 (4) .471
1 48 (4) .4651 48 (4) .407
Firemen, jammer.. 1 48, 4. 20 d .525Firemen, loader__ 48 .475 h . 475Firemen, locomo
tive crane_______ 1 48 (4) .582Firemen, skidder. _ 1 48 (4) .718Firemen, swing___ 1 48 .475 h .475Firemen, yard____ 48 .475 h .475Fire protection
m e n ................ . 1 48 . 475 h .475Flunkeys_________ 1 i 56 4. 00 d .500
1 i 56 65. 00 m .2687 i 56 60. 00 m .247
F o re m e n , p ile1 48 7. 20 d .900
Foremen, section __ 1 48 5. 00 d .625F orem an, steel
gang........... .......... 1 48 P .670Graders__________ 48 (3) 1.399High climbers____ 1 48 1. 05 h 1. 050
1 48 8.10 d 1. 0131 48 7. 50 d .938
Hoisters, crane___ 1 48 7.00 d .875Hookers__________ 1 48 (“) 1. 023
1 48 (4) .7771 48 (4) .7601 48 (4) .7551 48 '( 4) .7481 48 (4) .7461 48 (4) .7411 48
48.736.722
1 48 h .6621 48 (4) .6601 48 (4) .647
Hookers, crane___ 1 48 (4) .7401 48 (4) .6981 48
4848
(4)4. 60 d . 50 h
.643
.575
.5001 48 (4) .479
Hook tenders......... 1 4848
1.125 h7.50 d
1.125 .938
Jammer hookers. __ 1 48 3 5.20 d 1.0101 48 2 5. 20 d 1. 0001 48 » 5.20 d .9841 48 2 5.20 d .9501 48 2 5. 20 d .944
4 More than 1 rate.
Digitized for FRASER http://fraser.stlouisfed.org/ Federal Reserve Bank of St. Louis
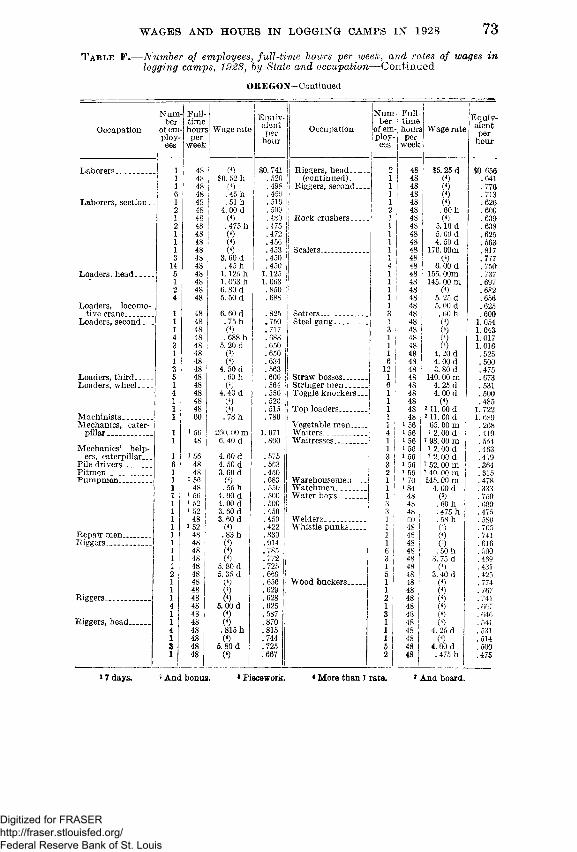
WAGES AND HOURS IN LOGGING CAMPS IN 1928 73T a b l e F .— Number of employees, full-time hours per week, and rates of wages in
logging camps, 1928, by State and occupation— Continued
O R E G O N —Continued
Occupation
Laborers.
Number
of employ-
Laborers, section. .
Loaders, head-
Loaders, locomotive crane...........
Loaders, second __
Loaders, third.. Loaders, wheel.
Machinists______Mechanics, cater
pillar...................
Mechanics’ helpers, caterpillar..
Pile drivers______Pitmen__________Pumpmen........... .
Repair men_. Riggers.........
Riggers........... .
Riggers, head..
Fulltimehoursper
week
4848484848484848484848484860
1 56 48
i 56 48 48
i 56 48
i 56 i 52 i 52
48 i 52
48 - 48
48 48
Wage rate
0 $0. 52 h0
.45 h
.51 h4. 00 d 0. 475 h (4)00
3. 60 d . 45 h
1.125 h 1. 063 h 6. 80 d5. 50 d
6. 60 d . 75 h (4). 688 h
5. 20 d 0 0
4. 50 d . 60 h 0
4. 40 d 0 0. 78 h
260. 00 m6. 40 d
4. 60 d 4. 50 d 3.60 d0. 55 h
4. 00 d4.00 d 3. 60 d 3. 60 d0. 83 h 0 0 0
5. 80 d 5. 35 d000
5.00 d 0 0. 815 h 0
5.80 d 0
Equivalentper
hour
.453
.450
.450 1.125 1. 063 .850 .688
.825
.750
.717 .688
. 650
.650
.634
.563
.600
.564
.550
.520
.515
.780
L 071 .800
.575
.563
.450
.683
. 550
. 500
.500
.450
.450
.422
.830
.914
.785
.772
.725
.669
.656
.629
.628
.625
.587
.870
.815
.744
.725
.667
Occupation
Num ber
of employees
- Fulltime
- hoursper
week
I
s Wage rateEquivalentper
hour
Riggers, head____ 0 48 $5. 25 d $0. 656i (continued). 1 48 0 .641; Riggers, second___ 1 48 0 .7761 1 48 0 .713
1 48 0 .62648 . 60 h .600
Rock crushers 1 48 0 .6391 48 5.10 d .6381 48 5.00 d .6251 48 4. 50 d .563
Scalers..................... 1 48 170.00m .8171 48 0 .777
48 6. 00 d .7501 48 155. 00m .7371 48 145. 00 m .6971 48 0 .6821 48 5. 25 d . 6561 48 5. 00 d . 625
Setters......... ............ 48 . 60 h .600Steel gang............... 1 48 0 1.054
48 0 1.0431 48 0 1. 0171 48 0 1. 0161 48 4. 20 d . 525
48 4. 00 d .50012 48 3.80 d .475
Straw bosses........... 1 48 140. 00 m .673Stringer m en ......... i 48 4. 25 d .531Toggle knockers. 1 48 4.00 d .500
1 48 0 .485Top loaders............ 1 48 2 11. 00 d 1. 722
1 48 211. 00 d 1.689Vegetable men____ 1 i 56 65. 00 m .268Waiters__________ i 56 2. 00 d .419Waitresses— .......... 1 i 56 7 98. 00 m .554
1 i 56 7 2. 00 d .4633 i 56 7 2. 00 d .4193 i 56 7 52. 00 m | .3642 1 56 7 40. 00 m .315
Warehousemen___ 1 i 70 145.00 m .478Watchmen_______ 1 i 84 1 4. 00 d .333Water boys_______ 1 48 | 0 . 750
3 48 i . 60 h .6003 48 ! .475 h .475
Welders__________ 1 ! 60 .58 h . 580Whistle punks 1 48 0 .765
1 48 0 .7411 48 0 .6166 48 . 50 h . 5003 48 3. 75 d .4691 48 0 .4315 48 3.40 d .425
i Wood buckers........ 1 48 0 .7741 48 0 . 7672 48 0 .7411 48 0 .6673 48 0 . 6461 48 0 .5411 48 4. 25 d . 5311 48 0 .5145 48 4.00 d .5002 48 .475 h .475
* 7 days. 2 And bonus. * Piecework. « More than 1 rate. T And board.
Digitized for FRASER http://fraser.stlouisfed.org/ Federal Reserve Bank of St. Louis

74 LUMBER INDUSTRY
T a b l e F.— Number of employees, full-time hours per week, and rates of wages inlogging camps, 1928, by State and occupation— Continued
W ASH IN G TO N
Occupation
Number
ofem-ploy-
Full-timehoursper
week
Wage rateEquivalentper
hourOccupation
Number
of em- ploy-
Full-timehoursper
week
Wage rateEquivalentper
hour
Bakers_____
Barn m en ...
Bedmakers..Blacksmiths.
Blacksmiths’ helpers .......................
Brakemen...............
Brakemen, second.
Buckers.............
48156156156156
48484848
484848484848484848484848484848484848484848
i°$115.00 m ioi20.00m
. 40h 75.00 m
125.00 m 8.00 d7.00 d .68 h .55 h
5.00 d6.50 d6.00 d 5.75 d (<)5.50 d(3)
(3)(3)(3)(3)0(3)(3)(3)(3)(3)(3)(3)(3)(3)(3)(3)(3)(3)(3)(3)(3)
$0,750 .663 .400 .309 .515 1.000 .875 .680
. .550
.625
.813
.750
.719
.701
.688 1.611 1.252 1.209 1.154 1.150 1.105 1.066 1.061 1.036 1.028 1.024 1.020 .991
.966
.953
.942
.936
.928
.924
.920
.917
.913,912.911.910.907.904.901
.891
.884
.879
.876
.873
.868
.857
.854
.850
.838
.828
.824
.817
.804
.802
.795
.790
.789
.782
.779
.765
.763
Buckers (contd.).
Buckers, head..
Bull cooks.........
Camp helpers..
Carpenters........
Caterpillar men
Chainmen.........
48
48 156 i 56 156
48 156 156 i 56
48 48 48 48 48 48
i 56 48
$6.00 d
(3)5.50 d(3)
(3)(3)(3)(3)(3)(3)(3)(3)(3)(3)(3)88(3).60h(3)
(3)(3)(3)0 (3)8.50 d
i° 175.00 m6.50 d4.50 d
125.00 mii 60.00 m
.40 h i° 80.00 m i° 70.00 m io 60.00 m
7.50 d7 .00 d6.50 d
. 75 h
. 725 h
.60 h ii 5 .00 d
5.00 d
$0,760.759.757.750.743.737.730.729.726.725.717.716
.685
.681
.672
.665
.658
.657
.651
.648
.644
.643
.639
.633
.631
.628
.623
.621
.620
.619
.618
.600
.590
.586
.571
.566
.541
.537
.531
.527
.520
. 518
.506
.500
.463
.430
.403
.374
.328 1.063 1.038 .813 .563 .515 .414 .400 .498 .457 .416 .938 .875 .813 .750 .725 .600 .794 .625
7 days.Piecework.More than 1 rate.
10 And board at $1.35 per day.11 And board at $1.33 per day.
Digitized for FRASER http://fraser.stlouisfed.org/ Federal Reserve Bank of St. Louis
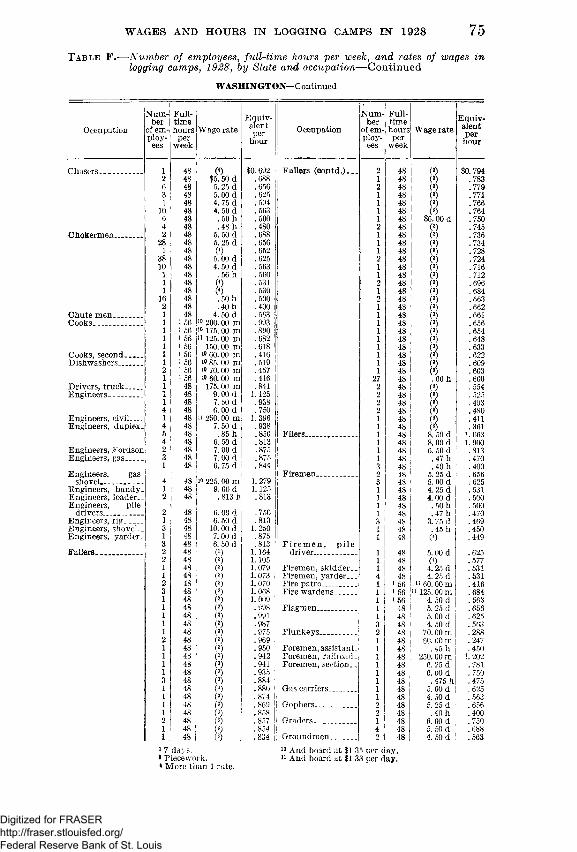
WAGES AND HOURS IN LOGGING CAMPS IN 1928 75T a b l e F.— Number of employees, full-time hours per week, and rates of wages in
logging camps, 1928, by State and occupation— Continued
W ASH IN GTON —Continued
Occupation
Number
of employ
ees
Fulltimehours
perweek
Wage rateEquivalentper
hourOccupation
Number
of employees
Fulltimehoursper
weekWage rate
Equivalentper
hour
C hasers..-............. 1 48 (4) $0.692 Fallers (con td .)... 2 48 (3) $0. 7942 48 $5.50 d .688 1 48 (3) .7836 48 5.25 d .656 2 48 (3) .7793 48 5.00 d .625 1 48 (3) .7711 48 4. 75 d .594 1 48 (3) .766
10 48 4. 50 d .563 1 48 (3) .7646 48 . 50 h .500 1 48 $6.00 d .7504 48 . 48 h .480 48 (3) .745
Chokermen............. 2 48 5.50 d .688 1 48 (3) .73628 48 5.25 d .656 1 48 (3) .7341 48 0) .652 1 48 (3) .728
38 48 5.00 d .625 48 (3) .72410 48 4. 50 d .563 1 48 (3) .7161 48 .56 h .560 1 48 (3) .7121 48 (4) .531 48 (3) .6961 48 (4) .530 1 48 (3) .684
16 48 . 50 h .500 48 (3) .6632 48 . 40 h .400 1 48 (3) .662
Chute men............. 1 48 4. 50 d .563 1 48 (3) .661C ook s.................... 1 i 56 10 200.00 m .993 1 48 (3) . 656
1 i 56 10 175.00 m .890 1 48 (3) .6541 i 56 u 125.00 m .682 1 48 (3) .6481 i 56 150.00 m .618 1 48 (3) .633
Cooks, second____ 1 i 56 io 60.00 m .416 1 48 (3) .622Dishwashers........... 1 i 56 io 85.00 m .519 1 48 (3) .609
2 i 56 io 70.00 in .457 1 48 (3) .6031 i 56 io 60.00 m .416 27 48 . 60 h .600
Drivers, truck........ 1 48 175.00 m .841 2 48 (3) .554Engineers. _......... . 1 48 9.00 d 1.125 2 48 (8) . 525
1 48 7. 50 d .938 2 48 (8) .4934 48 6.00 d .750 2 48 (3) .480
Engineers, civil___ 1 48 ii 250. 00 m 1.396 1 48 (3) . 4] 1Engineers, duplex. 4 48 7. 50 d .938 1 48 (3) .361
5 48 . 85 h .850 Filers....................... 1 48 8. 50 d 1. 0634 48 6. 50 d .813 1 48 8. 00 d 1. 000
Engineers, Fordson 2 48 7. 00 d . 875 1 48 6. 50 d .813Engineers, gas____ 3 48 7.00 d .875 1 48 . 47 h .470
1 48 6.75 d .844 3 48 . 40 h .400Engineers, gas Firemen____ ____ 2 48 5. 25 d .656
shoveL__________ 4 48 io 225. 00 m 1.279 3 48 5.00 d .625Engineers, handy. 1 48 9. 00 d 1.125 1 48 4. 25 d .531Engineers, loader,_ 2 48 . 813 h .813 1 48 4. 00 d .500Engineers, pile 1 48 . 50 h .500
drivers__________ 2 48 6.00 d .750 1 48 . 47 h .470Engineers, rig 1 48 6. 50 d .813 3 48 3. 75 d .469Engineers, shovel— 3 48 10. 00 d 1. 250 1 48 .45 h .450Engineers, yarder. 1 48 7. 00 d .875 1 48 (4) .449
3 48 6. 50 d .813 F ire m e n , p ileFallers___________ 2 48 (3) 1.164 driver__________ 1 48 5.00 d . 625
2 48 (3) 1.105 1 48 (4) .5771 48 (3) 1.079 Firemen, skidder__ 1 48 4.25 d .5311 48 (3) 1. 073 Firemen, yarder.__ 4 48 4. 25 d .5312 48 (3) 1.070 Fire patrol_______ 1 i 56 ii 60.00 m .4163 48 (3) 1. 068 Fire wardens_____ 1 i 56 ii 125. 00 m .6841 48 (3) 1. 009 1 1 56 4. 50 d .5631 48 (3) .998 Flagmen.................. 1 48 5. 25 d .6561 48 (3) .991 1 48 5. 00 d .6251 48 (3) .987 3 48 4. 50 d .5631 48 (3) .975 Flunkeys_________ 2 48 70. 00 m .2882 48 (3) .969 1 48 60. 00 m .2471 48 (3) .950 Foremen, assistant. 1 48 .45 h .4501 48 (3) .942 Foremen, railroad . 1 48 250.00 m 1. 2021 48 (3) .941 Foremen, section.. 1 48 6. 25 d .7811 48 (3) . 935 1 48 6. 00 d .7503 48 (3) .884 1 48 . 475 h . 4751 48 (3) .880 Gas carriers_______ 1 48 5. 00 d .6251 48 (3) .874 1 48 4. 50 d .5631 48 (3) .869 G ophers................ 2 48 5. 25 d .6561 48 (3) .858 2 48 . 40 h .4002 48 (3) .857 Graders................... 1 48 6. 00 d .7501 48 (3) .854 4 48 5. 50 d .6881 48 (3) .834 | Groundmen______ 2 48 4.50 d .563
i 7 days.* Piecework** More than 1 rate.
10 And board at $1.35 per day.11 And board at $1.33 per day.
Digitized for FRASER http://fraser.stlouisfed.org/ Federal Reserve Bank of St. Louis

76 LUMBER INDUSTRY
T a b l e F.— Number of employees, full-time hours per week, and rates of wages inlogging camps, 1928, by State and occupation— Continued
W ASH IN G TO N —Continued
Occupation
Number
of employees
Handy men—
High climbers.
Hookers...........
Hook tenders.
Inspectors___Jammers------
Kitchen helpers__
Knotters. ..........
Laborers.............
Laborers, section. _ Laborers, steel
gang------------------Lever men_______Lever men, loading. Lever men, skid
ding-------------------Light plant m en... Loaders_______
Loaders, head.
Loaders, second. _
Loaders, third. Markers______
Mechanics___Pile drivers...
Pile hewers. Pile peelers. Pilers......... .
Fulltimehoursper
week
48 48 48
i 56 i 56 i 56
48
4848
484848
48i 56
48 48 48 48 48 48 48 48 48 48 48 48
48 48 48
i 56 48 48 48
48
Wage rate
$7. 50 d 6. 00 d 5. 50 d5. 25 d 4. 00 d
10. 00 d7. 50 d6. 00 d 4. 50 d. 50 h . 475 h .40 h
10. 00 d8. 50 d 8.00 d 7. 50 d
14.115 d . 60 h . 575 h . 475 h
io 80. 00 m10 65. 00 m11 60. 00 m
(4)4. 50 d
(4)3. 50 d
(4). 42 h .40 h
4.00 d
4. 25 d (4)
9.50 d
9.50 d io 80. 00 m
. 70 h
. 56 h
. 525 h
.425 h
.40 h9.00 d8.00 d 6. 50 d 6.00 d
(4)5. 55 d
(4)5. 25 d
(4)(4)
5. 00 d10150.00 m
7.00 d10250.00 m
6.00 d (<)(4)(4)
4.00 d7.00 d 5. 25 d
(>)
Equivalentper
hour
SO. 938 . 750 .688 , .656 .500 1. 250 .938 . 750 .563 .500 .475 .400 1. 250 1.063
1. 000 .938 1. 764 .600 .575 .475 .498 .437 .414 .610 .563 .533 .438 .424 .420 .400 .500.531.8841.187
1.187 .498 .700 . 560 . 525 .425 .4001. 125 1. 000 .813 .750 . 691 .688 .671 .656 .647 .633 .625 .918 .875
1.199 .750 .722 .683 .613 .500 . 875 .656 .718
Occupation
Number
of employ
ees
Fulltimehoursper
week
Wage rateEquivalentperhour
1 48 !$200.00 m $0. 96148 ! 6. 00 d .750
1 48 | 5. 50 d .688Powder m en ......... 48 6. 50 d .813
1 48 (4) .7841 48 6.00 d .7501 48 5.00 d .625
P o w d e r m e n ’ shelpers.................. 48 6.00 d .750
1 48 5. 50 d .688Pumpmen............... 48 1 4. 50 d . 563
1 i 56 j 125. 00 m s .5151 i 56 100.00 m .412
Repair men......... 1 48 . 525 h ! .5251 48 . 40 h | .400
Riggers.............. . 1 48 . 85 h ! .8501 48 . 70 h .700
Riggers, head......... 1 48 10.00 d 1. 2501 48 10200.00 m 1.1581 48 I 9.00 d 1.125
Riggers, second___ 48 8.00 d 1. 0001 48 (4) .9201 48 6. 50 d .8131 48 (4) .7711 48 (4) .661
Riggers, third____ 48 5. 25 d .6561 48 (4) .633
18 48 5.00 d .6251 48 4. 50 d .563
Rig slingers........... 1 ! 48 7.00 d .8751 48 6.75 d .844
1 48 (4) . 764! 48 6. 00 d .7501 48 5. 50 d .688
Sawyers................... 1 ! 48 (3) .9731 1 48 (3) .8941 S 48 (3) .641
48 . 40 h .400Scalers............ ......... 1 48 I io 190.00 m 1,110
48 iio 175.00 m 1.0381 48 io 150.00 m .9181 48 175. 00 m .8411 1 48 6. 50 d .8131 I 48 150. 00 m .7211 ! 48 125. 00 m . 6011 i 48 . 50 h .500
Shovel operators... 1 ! 48 10.00 d 1. 2501 48 8.00 d 1. 000
Swampers________ 1 1 48 4.00 d .5003 48 3.75 d .4699 I 48 . 40 h . 4004 ! 48 . 375 h .375
Teamsters.........___ 8 ! 48 . 40 h .400Timekeepers.......... 1 i 56 10200.00 m .993Tongmen................ 11 48 6.00 d .750
1 48 5.25 d .65618 48 . 56 h .560
Unloaders............... 3 48 . 50 h .500Waiters.................. 4 i 56 io 70.00 m .457Waitresses............. 1 i 56 io 60.00 m .416
8 156 io 55.00 m .395Watchmen_______ 1 l 77 (4) .578Whistle punks 1 48 4. 75 d .594
2 48 4. 50 d .5633 48 4.00 d .500
Wood bucks........... 1 48 4.00 d .56311 48 3. 75 d .469
i 7 days.* Piecework.* More than 1 rata.
i° And board at $1 35 per day. h And board at $1 33 per day.
Digitized for FRASER http://fraser.stlouisfed.org/ Federal Reserve Bank of St. Louis
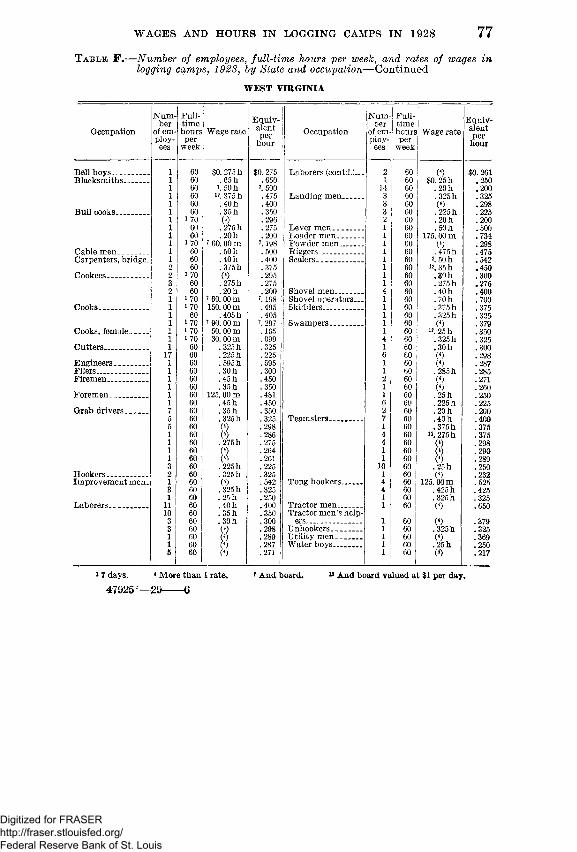
T a b l e F .— Number of employees, full-time hours per week, and rates of wages in logging camps, 1928, by State and occupation— Continued
WEST VIRGINIA
WAGES AND HOURS IN LOGGING CAMPS IN 1928 77
Occupation
Number
of employees
Fulltimehoursper
week
Wage rateEquivalentper
hourOccupation
Number
of employ
ees
Fulltimehoursper
weekWage rate
Equivalentper
hour
Bell boys................ 1 60 $0. 275 h $0,275 Laborers (contd.).. . 2 60 (4) $0.261Blacksmiths........... 1 60 . 65 h .650 ! 1 60 $0. 25 h .250
1 60 7. 50 h 7. 500 i 14 60 . 20 h .2001 60 12. 375 h .475 ! Landing men.......... 3 60 . 325 h .3251 60 . 40 h .400 : 3 60 (4) .298
Bull cooks............... 1 60 . 35 h .350 1 3 60 . 225 h .2251 i 70 (4) . 296 2 60 . 20 h .2001 60 . 275 h .275 Lever men________ 1 60 . 50 h .5001 60 . 20 h .200 Loader men............ 1 60 175. 00 m .7341 i 70 7 60. 00 m 7. 198 Powder m en..____ 1 60 (4) .298
Cable men________ 1 60 . 50 h .500 Riggers.................... 1 60 . 475 h .475Carpenters, bridge. 1 60 . 40 h .400 1 60 2. 50 h .542
2 60 . 375h .375 | 1 60 12.35 h .450Cookees................... 2 i 70 0) .295 1 60 . 30 h .300
3 60 . 275 h .275 : 1 60 . 275 h .2752 60 . 20 h .200 ! Shovel men_______ 4 60 . 40 h .4001 i 70 7 60. 00 m 7.i98 ! Shovel operators.._ 1 60 . 70 h .700
Cooks____________ 1 i 70 150.00 m .495 Skidders__________ 1 60 . 375 h . 3751 60 . 405 h .405 1 60 . 325 h .3251 i 70 7 90. 00 m 7. 297 : Swampers............... 1 60 (4) .379
Cooks, female____ 1 i 70 50. 00 m .165 ! 1 60 12. 25 h . 3501 i 70 30.00 m .099 1 60 . 325 h .325
Cutters................ . 1 60 . 325 h .325 1 60 . 30 h .30017 60 . 225 h .225 60 ( 4 ) .298
Engineers________ 1 60 . 595 h .595 1 60 (4) .287Filers..... ................. 1 60 . 30 h .300 1 60 . 285 h .285Firemen................. 1 60 . 45 h .450 60 (4) .271
1 60 . 35 h .350 1 60 (4) .260Foremen. ............... 1 60 125.00 m .481 1 60 . 25 h .250
1 60 . 45 h .450 60 . 225 h .225Grab drivers______ 7 60 . 35 h .350 60 . 20 h .200
5 60 . 325 h .325 Teamsters............... 7 60 . 40 h .4005 60 (4) .298 1 60 . 375 h .3751 60 (*) .286 60 12. 275 h .3751 60 . 275 h .275 60 (4) .2981 60 (4) .264 1 60 (4) .2901 60 (*) .261 1 60 (4) .2893 60 . 225 h .225 10 60 . 25 h .250
Hookers__________ 2 60 . 325 h .325 1 60 (4) .232Improvement men. 1 60 (4) .542 Tong hookers......... 60 125.00 m .525
3 60 . 325 h .325 4 60 . 425 h .4251 60 . 25 h .250 1 60 . 325 h .325
Laborers__________ 11 60 . 40 h .400 Tractor men______ 1 60 (4) .65010 60 . 35 h .350 Tractor men’s help-3 60 . 30 h .300 ers__..................... 1 60 (4) .3793 60 (4) .298 Unhookers..... ........ 1 60 . 325 h .3251 60 (4) .289 Utility m e n .......... 1 60 (4) .3691 60 (4) .287 Water boys............. 1 60 . 25 h .2505 60 (4) .271 1 60 (4) .217
» 7 days. 4 More than 1 rate. T And board. u And board valued at $1 per day. 47925°—29------ 6
Digitized for FRASER http://fraser.stlouisfed.org/ Federal Reserve Bank of St. Louis

Digitized for FRASER http://fraser.stlouisfed.org/ Federal Reserve Bank of St. Louis

LIST OF BULLETINS OF THE BUREAU OF LABOR STATISTICS
The following is a list o f a ll bulletins o f the Bureau o f Labor Statistics published since Ju ly , 1912, except th at in the case o f bulletins giving the results of periodic surveys of the bureau, only the latest bulletin on any one subject is here listed.
A complete list o f the reports and bulletins issued prior to Ju ly , 1912, as well as the bulletins published since that date , will be furnished on application . Bulletins marked thus (*) are out o f p rin t .
Conciliation and arbitration (including strikes and lockouts).•No. 124. Conciliation and arbitration in the building trades of Greater New York. [1913.]•No. 133. Report of the industrial council of the British Board of Trade on its inquiry into industrial
agreements. [1913.]No. 139. Michigan copper district strike. [1914.]No. 144. Industrial court of the cloak, suit, and skirt industry of New York City. [1914.]No. 145. Conciliation, arbitration, and sanitation in the dress and waist industry of New York City.
[1914.]•No. 191. Collective bargaining in the anthracite-coal industry. [1916.]•No. 198. Collective agreements in the men’s clothing industry. [1916.]No. 233. Operation of the industrial disputes investigation act of Canada. [1918.No. 255. Joint industrial councils in Great Britain. [1919.]No. 283. History of the Shipbuilding Labor Adjustment Board, 1917 to 1919.No. 287. National War Labor Board: History of its formation, activities, etc. [1921.]No. 303. Use of Federal power in settlement of railway labor disputes. [1922.]No. 341. Trade agreement in the silk-ribbon industry of New York City. [1923.]No. 402. Collective bargaining by actors. [1926.]No. 468. Trade agreements, 1927.No. 481. Joint industrial control in the book and job printing industry. [1928.]
Cooperation.No. 313. Consumers’ cooperative societies in the United States in 1920.No. 314. Cooperative credit societies in America and in foreign countries. [1922.]No. 437. Cooperative movement in the United States in 1925 (other than agricultural).
Employment and unemployment.•No. 109. Statistics of unemployment and the work of employment offices in the United States. [1913.] No. 172. Unemployment in New York City, N. Y . [1915.]
•No. 183. Regularity of employment in the women’s ready-to-wear garment industries. [1915.]•No. 195. Unemployment in the United States. [1916.]No. 196. Proceedings of the Employment Managers’ Conference held at Minneapolis, Minn.,
January 19 and 20, 1916.•No. 202. Proceedings of the conference of Employment Managers’ Association of Boston, Mass., held
M ay 10, 1916.No. 206. The British system of labor exchanges. [1916.]No. 227. Proceedings of the Employment Managers’ Conference, Philadelphia, Pa., April 2 and 3,1917. No. 235. Employment system of the Lake Carriers’ Association. [1918.]
•No. 241. Public employment offices in the United States. [1918.]No. 247. Proceedings of Employment Managers’ Conference, Rochester, N. Y .f M ay 9-11, 1918.No. 310. Industrial unemployment: A statistical study of its extent and causes. [1922.]No. 409. Unemployment in Columbus, Ohio, 1921 to 1925.
Foreign Labor Laws.•No. 142. Administration of labor laws and factory inspection in certain European countries. [1914.] No. 494. Labor legislation of Uruguay. [1929.]
Housing.•No. 158. Government aid to home owning and housing of working people in foreign countries. [1914.J No. 263. Housing by employers in the United States. [1920.]No. 295. Building operations in representative cities in 1920.No. 469. Building permits in the principal cities of the United States in [1921 to] 1927.
t i ]
Digitized for FRASER http://fraser.stlouisfed.org/ Federal Reserve Bank of St. Louis
Industrial Accidents and Hygiene.^ead poisoning in potteries, tile works, and porcelain enameled sanit ary ware factories. [1912.] BCygiene of the painter’s trade. [1913.]Dangers to workers from dusts and fumes, and methods of protect: on. [1913.]Lread poisoning in the smelting and refining of lead. [1914.] ndustrial accident statistics. [1915.]liead poisoning in the manufacture of storage batteries. [1914.] ndustrial poisons used in the rubber industry. [1915.]Report of British departmental committee on the danger in the use of lead in the painting
of buildings. [1916.]Report of committee on statistics and compensation insurance cost of the International
Association of Industrial Accident Boards and Commissions, i 1916.]Causes of death, by occupation. [1917.] lygiene of the printing trades. [1917.]
*No. 104.No. 120.
*No. 127.♦No. 141.♦No. 157.♦No. 165.♦No. 179.No. 188.
o*
201.
♦No. 207.♦No. 209.♦No. 219.No. 221.No. 230.
♦No. 231.♦No. 234.No. 236.No. 249.
♦No. 251.No. 256.No. 267.No. 276.No. 280.No. 291.No. 293.No. 298.No. 306.
No. 339.No. 392.No. 405.
No. 425.No. 426.No. 427.No. 428.
No. 460.No. 466.No. 488.No. 490.
Hours, fatigue, and health in British munition factories. [1917.] Industrial efficiency and fatigue in British munition factories. [1017.]
[1917.]
[1918.]
Effects of the air hammer on the hands of stonecutters. [1918.]ndustrial health and efficiency. Final report of British Health of Munition Workers5
Committee. [1919.]Preventable death in the cotton-manufacturing industry. [1919.]Occidents and accident prevention in machine building. [1919. ]Lnthrax as an occupational disease. [1920.]Standardization of industrial accident statistics. [1920. ]ndustrial poisoning in making coal-tar dyes and dye intermediates. [1921.]Darbon-monoxide poisoning. [1921.]Dhe problem of dust phthisis in the granite-stone industry. [1921:.]
ardous occupations. [1922.]Statistics of industrial accidents in the United States. [1923.] Survey of hygienic conditions in the printing trades. [1925.]
[1926.]lecord of industrial accidents in the Deaths from lead poisoning. [1927.]
July 14-16, 1926.± new test for industrial lead poisoning. [1928.] settlement for accidents to American seamen. [1928.]Deaths from lead poisoning, 1925-1927. [1929.]statistics of industrial accidents in the United States to the end of 1927.
Industrial Relations and Labor Conditions.No. 237. Industrial unrest in Great Britain. [1917.]No. 340. Chinese migrations, with special reference to labor conditions. [ 1923.]No. 349. Industrial relations in the West Coast lumber industry. [1923.]No. 361. Labor relations in the Fairmont (W. Va.) bituminous-coal field. [1924.No. 380. Postwar labor conditions in Germany. [1925.]No. 383. Works council movement in Germany. [1925.]No. 384. Labor conditions in the shoe industry in Massachusetts, 1920-1924.No. 399. Labor relations in the lace and lace-curtain industries in the United States. [1925.
Labor Laws of the United States (including decisions of courts relating to labor).No. 211. Labor laws and their administration in the Pacific States. [1917.]No. 229. Wage-payment legislation in the United States. [1917.]No. 285. Minimum-wage laws of the United States: Construction and operation. [1921.] No. 321. Labor laws that have been declared unconstitutional. [1922.]No. 322. Kansas Court of Industrial Relations. [1923.]No. 343. Laws providing for bureaus of labor statistics, etc. [1923.]No. 370. Labor laws of the United States, with decisions of courts relating thereto. [1925. No. 408. Laws relating to payment of wages. [1926.]No. 444. Decisions of courts and opinions affecting labor, 1926.No. 486. Labor legislation of 1928.
M
Digitized for FRASER http://fraser.stlouisfed.org/ Federal Reserve Bank of St. Louis

Proceedings of Annual Conventions of the Association of Governmental Labor Officials of the United States and Canada. Name changed in 1928 to Association of Governmental Officials in Industry ofthe United States and Canada.*No. 266. Seventh, Seattle, Wash., July 12-15, 1920.No. 307. Eighth, New Orleans, La., May 2-6, 1921,No. 323. Ninth, Harrisburg, Pa., M ay 22-26, 1922.No. 352. Tenth, Richmond, Va., M ay 1-4, 1923.
*No. 389. Eleventh, Chicago, 111., M ay 19-23, 1924.*No. 411. Twelfth, Salt Lake City, Utah, August 13-15, 1925.No. 429. Thirteenth, Columbus, Ohio, June 7-10, 1926.No. 455. Fourteenth, Paterson, N. J., M ay 31 to June 3, 1927.No. 480. Fifteenth, New Orleans, La., M ay 15-24, 1928.
Proceedings of Annual Meetings of the International Association of Industrial Accident Boards and Commissions.
No. 210. Third, Columbus, Ohio, April 25-28, 1916.No. 248. Fourth, Boston, Mass., August 21-25, 1917.No. 264. Fifth, Madison, Wis., September 24-27,1918.
♦No. 273. Sixth, Toronto, Canada, September 23-26, 1919.No. 281. Seventh, San Francisco, Calif., September 20-24, 1920.No. 304. Eighth, Chicago, 111., September 19-23, 1921.No. 333. Ninth, Baltimore, Md., October 9-13, 1922.No. 359. Tenth, St. Paul, Minn., September 24-26, 1923.No. 385. Eleventh, Halifax, Nova Scotia, August 26-28, 1924.No. 395. Index to proceedings, 1914-1924.No. 406. Twelfth, Salt Lake City, Utah, August 17-20, 1925.No. 432. Thirteenth, Hartford, Conn., September 14-17, 1928.No. 456. Fourteenth, Atlanta, Ga., September 27-29, 1927.No. 485. Fifteenth, Paterson, N. J., September 11-14, 1928.
Proceedings o f Annual Meetings of International Association o f Public Employment Services.No. 192. First, Chicago, December 19 and 20, 1913; sec§nd, Indianapolis, September 24 and 25, 1914.’
third, Detroit, July 1 and 2, 1915.No. 220. Fourth, Buffalo, N. Y., July 20 and 21, 1916.No. 311. Ninth, Buffalo, N. Y., September 7-9, 1921.No. 337. Tenth, Washington, D. C., September 11-13, 1922.No. 355. Eleventh, Toronto, Canada, September 4-7, 1923.No. 400. Twelfth, Chicago, 111., M ay 19-23, 1924.No. 414. Thirteenth, Rochester, N. Y., September 15-17, 1925.No. 478. Fifteenth, Detroit, Mich., October 25-28, 1927.
Productivity of Labor.No. 356. Productivity costs in the common-brick industry. [1924.]No. 360. Time and labor costs in manufacturing 100 pairs of shoes, 1923.No. 407. Labor costs of production and wages and hours of labor in the papel: box-board industry.
[1926.]No. 412. Wages, hours, and productivity in the pottery industry, 1925.No. 441. Productivity of labor in the glass industry. [1927.]No. 474. Productivity of labor in merchant blast furnaces. [1928.]No. 475. Productivity of labor in newspaper printing. [1929.]
Retail Prices and Cost of Living.*No. 121. Sugar prices, from refiner to consumer. [1913.]*No. 130. Wheat and flour prices, from farmer to consumer. [1913.No. 164. Butter prices, from producer to consumer. [1914.]No. 170. Foreign food prices as affected by the war. [1915.]No. 357. Cost of living in the United States. [1924.]No. 369. The use of cost-of-living figures in wage adjustments. [1925.No. 495. Retail prices, 1890 to 1928.
Safety Codes.♦No. 331. Code of lighting: Factories, mills, and other work places.
No. 336. Safety code for the protection of industrial workers in foundries.No. 350. Specifications of laboratory tests for approval of electric headlighting devices for motor
vehicles.No. 351. Safety code for the construction, care, and use of ladders.No. 375. Safety code for laundry machinery and operations.No. 378. Safety code for woodworking plants.No. 382. Code of lighting school buildings.No. 410. Safety code for paper and pulp mills.No. 430. Safety code for power presses and foot and hand presses.No. 433. Safety codes for the prevention of dust explosions.No. 436. Safety code for the use, care, and protection of abrasive wheels.No. 447. Safety code for rubber mills and calenders.No. 451. Safety code for forging and hot-metal stamping.No. 463. Safety code for mechanical power-transmission apparatus—first revision.
[in]
Digitized for FRASER http://fraser.stlouisfed.org/ Federal Reserve Bank of St. Louis
Vocational and Workers’ Education.*No. 159. Short-unit courses for wage earners, and a factory school experiment. [1915.]*No. 162. Vocational education survey of Richmond, Va. [1915.]No. 199. Vocational education survey of Minneapolis, Minn. [1917.]No. 271. Adult working-class education in Great Britain and the United States. [1920.]No. 459. Apprenticeship in building construction. [1928.]
Wages and Hours of Labor.*No. 146. Wages and regularity of employment and standardization of piece rntes in the dress and waist
industry of New York City. [1914.]*No. 147. Wages and regularity of employment in the cloak, suit, and skirt industry. [1914.]No. 161. Wages and hours of labor in the clothing and cigar industries, 1911 to 1913.No. 163. Wages and hours of labor in the building and repairing of steam ra lroad cars, 1907 to 1913.
♦No. 190. Wages and hours of labor in the cotton, woolen, and silk industries. 1907 to 1914.No. 204. Street-railway employment in the United States. [1917.]No. 225. Wages and hours of labor in the lumber, millwork, and furniture industries, 1915.No. 265. Industrial survey in selected industries in the United States, 1919.No. 297. Wages and hours of labor in the petroleum industry, 1920.No. 356. Productivity costs in the common-brick industry. [1924.]No. 358. Wages and hours of labor in the automobile-tire industry, 1923.No. 360. Time and labor costs in manufacturing 100 pairs of shoes, 1923.No. 365. Wages and hours of labor in the paper and pulp industry, 1923.No. 394. Wages and hours of labor in metalliferous mines, 1924.No. 407. Labor cost of production and wages and hours of labor in the paper box-board industry [1925.] No. 412. Wages, hours, and productivity in the pottery industry, 1925.No. 413. Wages and hours of labor in the lumber industry in the United States, 1925.No. 410. Hours and earnings in anthracite and bituminous coal mining, 1921 and 1924.No. 435. Wages and hours of labor in the men's clothing industry, 1911 to 1!>26.No. 438. Wages and hours of labor in the motor-vehicle industry, 1925.No. 442. Wages and hours of labor in the iron and steel industry, 1907 to 1926.No. 450. Wages and hours of labor in the boot and shoe industry, 1907 to 191J6.No. 452. Wages and hours of labor in the hosiery and underwear industries, 1907 to 1926.No. 454. Hours and earnings in bituminous-coal mining, 1922, 1924, and 1926.No. 471. Wages and hours of labor in foundries and machine shops, 1927.No. 472. Wages and hours of labor in the slaughtering and meat packing industry, 1927.No. 476. Union scales of wages and hours of labor, 1927. [Supplement to Bui. No. 457.]No. 482. Union scales of wages and hours of labor, May 15, 1928.No. 484. Wages and hours of labor of common street laborers, 1928.No. 487. Wages and hours of labor in woolen and worsted goods manufacturing, 1910 to 1928.No. 492. Wages and hours of labor in cotton-goods manufacturing, 1910 to 1928.
Welfare Work.*No. 123. Employers’ welfare work. [1913.]No. 222. Welfare work in British munitions factories. [1917.
*No. 250. Welfare work for employees in industrial establishments in the Urited States. [1919.]No. 458. Health and recreation activities in industrial establishments, 1926.
Wholesale Prices.No. 284. Index numbers of wholesale prices in the United States and foreign countries. [1921.]No. 453. Revised index numbers of wholesale prices, 1923 to July, 1927.No. 493. Wholesale prices, 1913 to 1928.
Women and Children in Industry.No. 116. Hours, earnings, and duration of employment of wage-earning women in selected industries-
in the District of Columbia. [1913.]*No. 117. Prohibition of night work of young persons. [1913.]No. 118. Ten-hour maximum working-day for women and young persons. [1913.]No. 119. Working hours of women in the pea canneries of Wisconsin. [1912.]
*No. 122. Employment of women in power laundries in Milwaukee. [1913. j
No. 160. Hours, earnings, and conditions of labor of women in Indiana mercantile establishments and garment factories. [1914.]
*No. 167. Minimum-wage legislation in the United States and foreign countries. [1915.]*No. 175. Summary of the report on conditions of woman and child wage earners in the United States.
[1915.]*No. 176. Effect of minimum-wage determinations in Oregon. [1915.]*No. 180. The boot and shoe industry in Massachusetts as a vocation for women. [1915.]*No. 182. Unemployment among women in department and other retail stores of Boston, Mass. [1916.] No. 193. Dressmaking as a trade for women in Massachusetts. [1916.]No. 215. Industrial experience of trade-school girls in Massachusetts. [1917.]
*No. 217. Effect of workmen’s compensation laws in diminishing the necessity of industrial employment of women and children. [1918.]
No. 223. Employment of women and juveniles in Great Britain during the war. [1917.]No. 253. Women in the lead industries. [1919.]
[IV ]
Digitized for FRASER http://fraser.stlouisfed.org/ Federal Reserve Bank of St. Louis
Workmen’s Insurance and Compensation (including laws relating thereto).*No. 101. Care of tuberculous wage earners in Germany. [1912.]*No. 102. British national insurance act, 1911.No. 103. Sickness and accident insurance law of Switzerland. [1912.]No. 107. Law relating to insurance of salaried employees in Germany. [1913.]
*No. 155. Compensation for accidents to employees of the United States. [1914.]No. 212. Proceedings of the conference on social insurance called by the International Association of
Industrial Accident Boards and Commissions, Washington, D. C., December 5-9,1916.*No. 243. Workmen’s compensation legislation in the United States and foreign countries, 1917 and 1918. No. 301. Comparison of workmen’s compensation insurance and administration. [1922.]No. 312. National health insurance in Great Britain, 1911 to 1921.No. 379. Comparison ofworkmen’s compensation laws of the United States as of January 1,1925.No. 423. Workmen’s compensation legislation of the United States and Canada as of July 1,1926.No. 477. Public-service retirement systems, United States and Europe. [1928.]No. 496. Workmen’s compensation legislation of the United States and Canada as of January, 1929.
With text of legislation enacted in 1927 and 1928.Miscellaneous Series.
*Nq. 174. Subject index of the publications of the United States Bureau of Labor Statistics up to May 1, 1915.
No. 208. Profit sharing in the United States. [1916.No. 242. Food situation in central Europe, 1917.No. 254. International labor legislation and the society of nations. [1919.]No. 268. Historical survey of international action affecting labor. [1920.]No. 282. Mutual relief associations among Government employees in Washington, D. C. [1921.]No. 299. Personnel research agencies: A guide to organized research in employment management, in
dustrial relations, training, and working conditions. [1921.]No. 319. The Bureau of Labor Statistics: Its history, activities, and organization. [1922.]No. 326. Methods of procuring and computing statistical information of the Bureau of Labor Statis
tics. [1923.]No. 342. International Seamen’s Union of America: A study of its history and problems. [1923.3 No. 346. Humanity in government. [1923.]No. 372. Convict labor in 1923.No. 386. Cost of American almshouses. [1925. ^No. 398. Growth of legal-aid work in the United States. [1926.No. 401. Family allowances in foreign countries. [1926.]No. 420. Handbook of American trade-unions. [1926.]No. 439. Handbook of labor statistics, 1924 to 1926.No. 461. Labor organizations in Chile. [1928.]No. 462 Park recreation areas in the United States. [1928.]No. 465,. Beneficial activities of American trade-unions. [1928]No. 479. Activities and functions of a State department of labor. [1928.No. A83.. Conditions in the shoe industry in Haverhill, Mass., 1928.No. 4W, Care of aged persons in the United States. (In press.)No. 491. Handbook of labor statistics: 1929 Edition.
( r )
Digitized for FRASER http://fraser.stlouisfed.org/ Federal Reserve Bank of St. Louis