bloody foreigners! overseas equity on the london stock exchange, 1870-1913 richard s. grossman...
TRANSCRIPT

Bloody Foreigners! Overseas Equity on the London Stock Exchange, 1870-1913
Richard S. Grossman
Workshop on Monetary and Financial History
Federal Reserve Bank of Atlanta/Emory University
June 26, 2013

Objective
• New indices on overseas equity traded on British stock exchanges (primarily, but not exclusively, London)– Quantity– Returns, capital gains, and dividends

Available data
• Existing indices– Barclays de Zoete Wedd: 30 blue chips from 1919– LCES: 20 “companies that had been important in
1913” from 1923– Bowley, Schwartz, and Smith (reconstituite LCES
for 1924-31, using 72 securities)– Smith and Horne (monthly, 1867-1914, 25-77
industrial securities)

Drawbacks of Smith and Horne• Small sample, 25-77 securities• Industrial, so no observations on banks,
discount companies, insurance companies, or railways
• No dividends, so total returns not available• No sensible weighting scheme
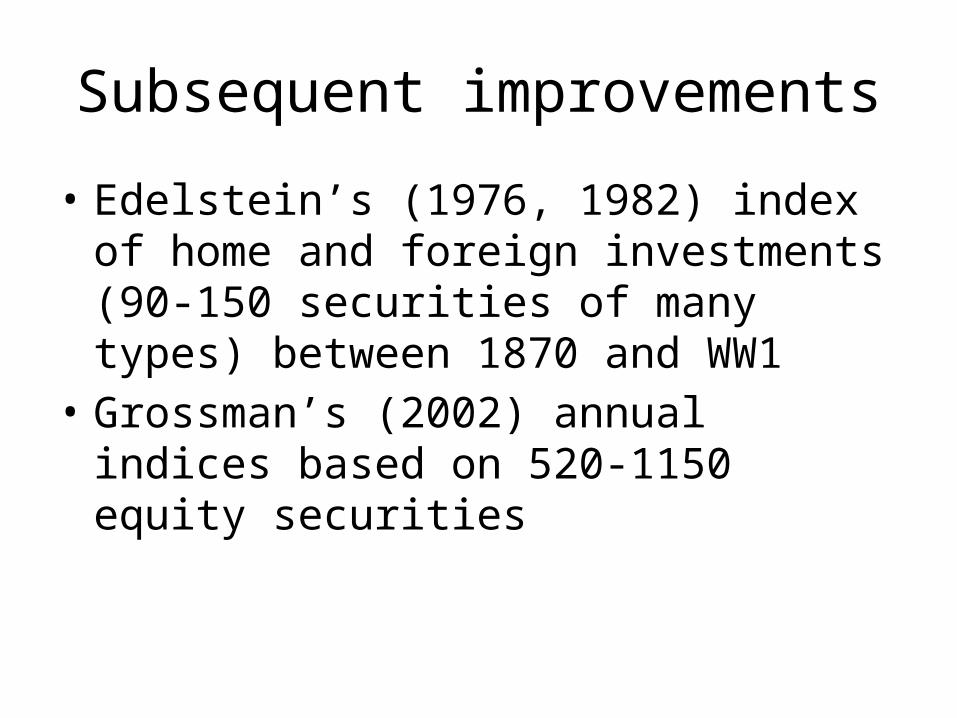
Subsequent improvements
• Edelstein’s (1976, 1982) index of home and foreign investments (90-150 securities of many types) between 1870 and WW1
• Grossman’s (2002) annual indices based on 520-1150 equity securities

Motivation
• Explain slowdown in Victorian growth– Investment was low in UK relative to US, Germany
and capital outflow was substantial–Was it more costly to raise capital in London?–Was London better at channeling capital overseas
than directing toward domestic industry?– Or, were investors just seeking diversification

Literature
• Goetzmann and Ukhov (2006) use Edelstein’s data
• Chabot and Kurz (2010) collect 500,000 observations on US and UK stocks and bonds (4000 total)
• Both find that overseas investment was attractive because of higher returns and greater diversification

Motivation, con’t
• Finance issues– Dividend policy, Merton and Modigliani (1961),
Black (1976)– Debt vs. equity returns, Mehra and Prescott (1985)– Home bias, French and Poterba (1991)– Contingent liability, Jefferys (1938 [1977]; (1946),
Kashyap, Rajan, and Stein (2008), Flannery (2009), and Grossman and Imai (2011)
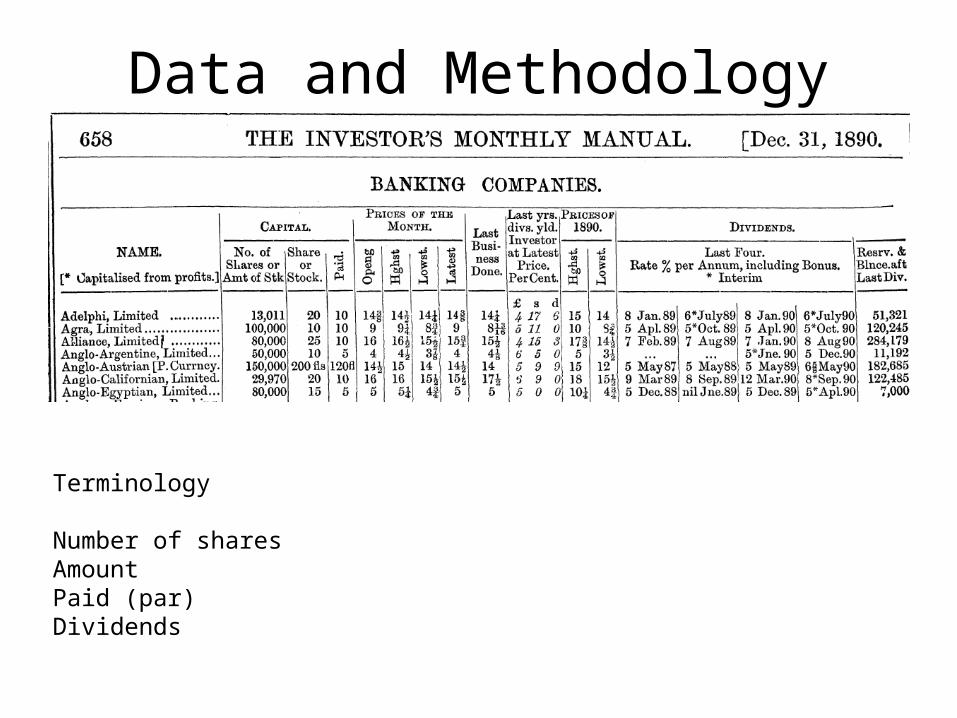
Data and Methodology
Terminology
Number of sharesAmountPaid (par)Dividends

Calculating returns
• Capital gaint = (Pt- Pt-1)/Pt-1
• Dividend yieldt = (Dividendt * Part)/ Pt-1
• Total return = capital gain + yield

Problems• Distinguishing debt from equity–What does the word “stock” actually mean in Britain
• Types of securities• Foreign currencies• Dates of dividends• Par changes• Missing data

Data set
• 39,240 security-year observations• 2913 securities• 2588 firms
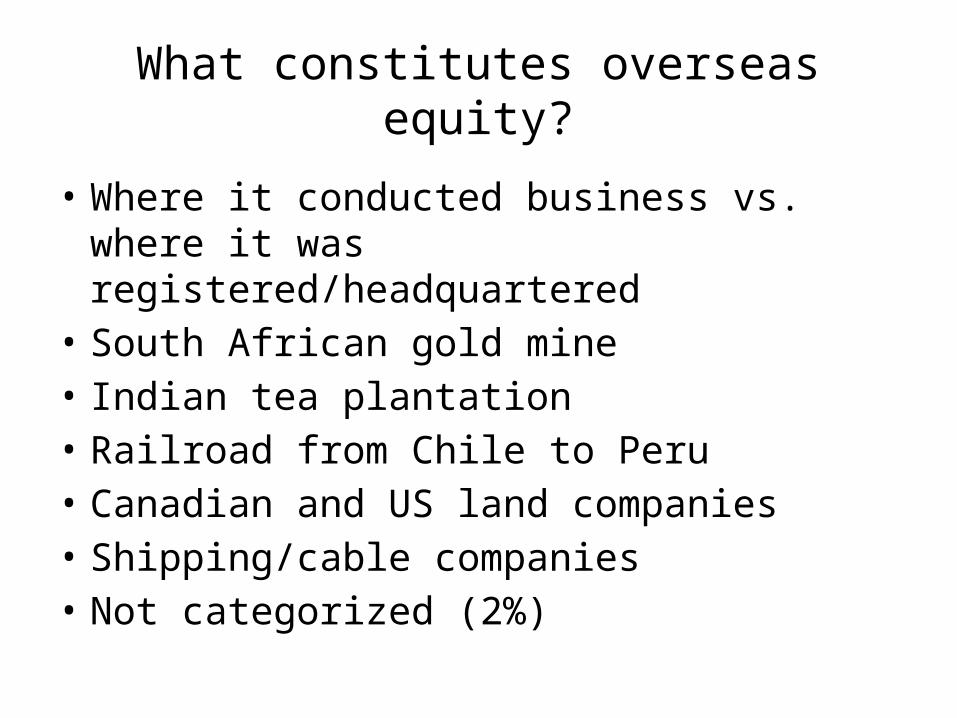
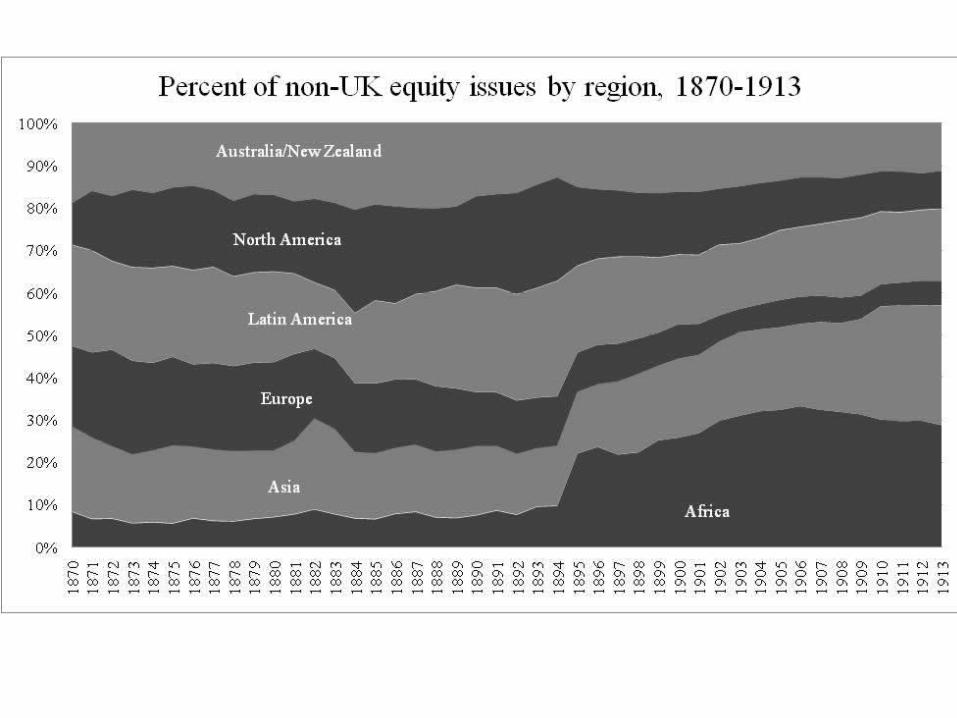
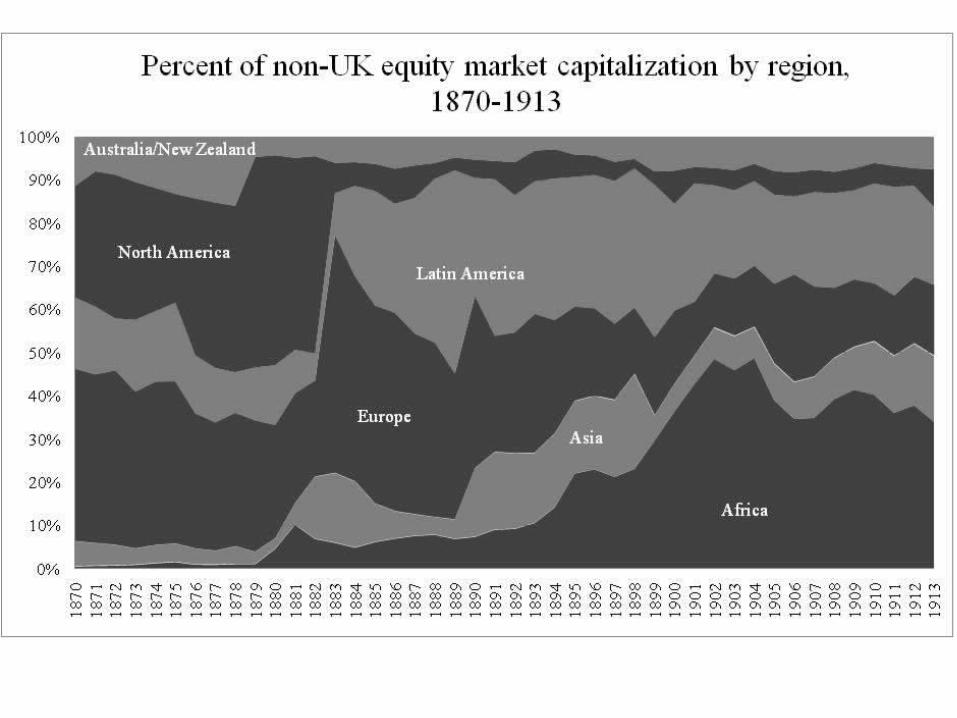
What constitutes overseas equity?
• Where it conducted business vs. where it was registered/headquartered
• South African gold mine• Indian tea plantation• Railroad from Chile to Peru• Canadian and US land companies• Shipping/cable companies• Not categorized (2%)


100
1000
10000
1870
1871
1872
1873
1874
1875
1876
1877
1878
1879
1880
1881
1882
1883
1884
1885
1886
1887
1888
1889
1890
1891
1892
1893
1894
1895
1896
1897
1898
1899
1900
1901
1902
1903
1904
1905
1906
1907
1908
1909
1910
1911
1912
1913
Log
sca
le (1
870=
100)
Total return indices (unweighted), by region, 1870-1913
Africa
Asia
Australia/New Zealand
North America
Europe
UK
LatinAmerica


Capital gain (unweighted)
Dividend yield (unweighted)
Total return (unweighted)
Capital gain (MK)
Dividend yield (MK)
Total return (MK)
Capital gain (PK)
Dividend yield (PK)
Total return (PK)
dividend share (unweighted)
dividend share (MK weighted)
dividend share (PK weighted)
Africa
Average 0.0635 0.0561 0.1195 0.0876 0.0501 0.1376 0.0496 0.0450 0.0945 0.470 0.364 0.476
Standard deviation 0.2484 0.0210 0.2545 0.2891 0.0290 0.3009 0.2395 0.0225 0.2487
Asia
Average 0.0468 0.0540 0.1005 0.0728 0.0448 0.1173 0.0532 0.0394 0.0921 0.537 0.382 0.428
Standard deviation 0.1517 0.0124 0.1533 0.1477 0.0139 0.1536 0.1376 0.0134 0.1449
Europe
Average 0.0183 0.0587 0.0763 0.0147 0.0343 0.0489 0.0034 0.0253 0.0286 0.770 0.701 0.885
Standard deviation 0.0961 0.0100 0.0986 0.1280 0.0140 0.1310 0.1580 0.0195 0.1621
Latin America
Average 0.0360 0.0527 0.0878 0.0714 0.0458 0.1171 0.0757 0.0373 0.1129 0.600 0.391 0.331
Standard deviation 0.1351 0.0101 0.1371 0.1908 0.0138 0.1915 0.2780 0.0138 0.2765
North America
Average 0.0175 0.0600 0.0774 0.0372 0.0433 0.0804 0.0094 0.0408 0.0502 0.775 0.538 0.813
Standard deviation 0.1588 0.0152 0.1670 0.1359 0.0113 0.1388 0.1600 0.0178 0.1638
Australia/New Zealand
Average -0.0002 0.0663 0.0664 0.0324 0.0615 0.0936 0.0090 0.0606 0.0693 0.998 0.657 0.874
Standard deviation 0.1103 0.0129 0.1150 0.1146 0.0136 0.1209 0.1124 0.0159 0.1169
UK
Average 0.0143 0.0539 0.0680 0.0279 0.0453 0.0728 0.0131 0.0373 0.0500 0.792 0.622 0.746
Standard deviation 0.0586 0.0063 0.0585 0.0536 0.0051 0.0553 0.0773 0.0081 0.0779
All equities
Average 0.0163 0.0546 0.0707 0.0394 0.0433 0.0824 0.0237 0.0336 0.0571 0.773 0.525 0.589
Standard deviation 0.0625 0.0056 0.0630 0.0711 0.0054 0.0725 0.1096 0.0045 0.1100
Unweighted
Africa Asia EuropeLatin America
North America
Australia/New Zealand UK All
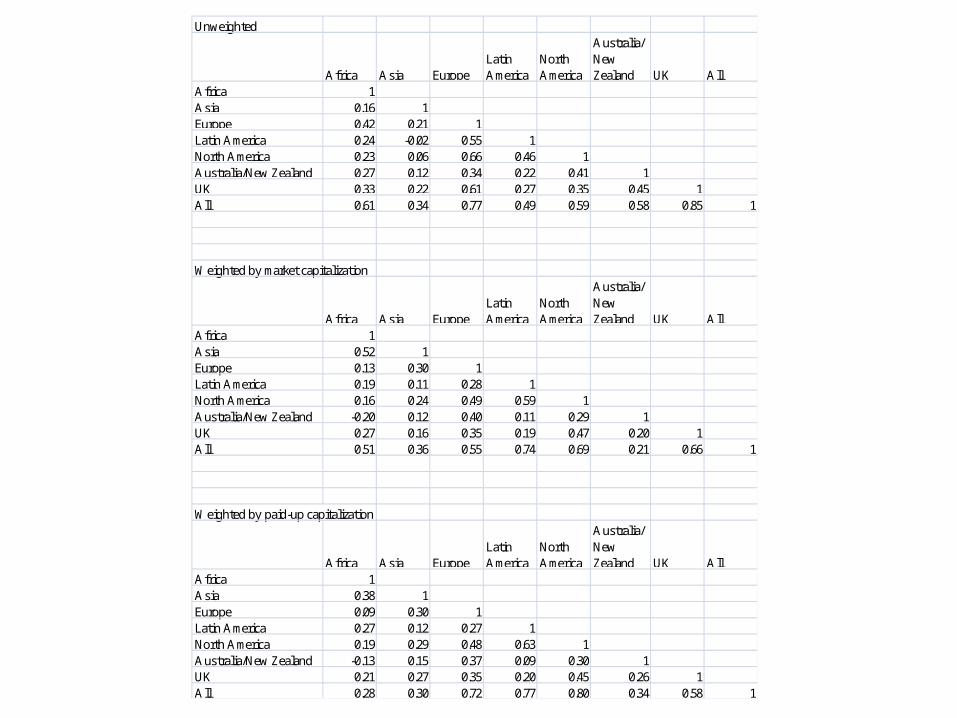
Africa 1Asia 0.16 1Europe 0.42 0.21 1Latin America 0.24 -0.02 0.55 1North America 0.23 0.06 0.66 0.46 1Australia/New Zealand 0.27 0.12 0.34 0.22 0.41 1UK 0.33 0.22 0.61 0.27 0.35 0.45 1All 0.61 0.34 0.77 0.49 0.59 0.58 0.85 1
Weighted by market capitalization
Africa Asia EuropeLatin America
North America
Australia/New Zealand UK All
Africa 1Asia 0.52 1Europe 0.13 0.30 1Latin America 0.19 0.11 0.28 1North America 0.16 0.24 0.49 0.59 1Australia/New Zealand -0.20 0.12 0.40 0.11 0.29 1UK 0.27 0.16 0.35 0.19 0.47 0.20 1All 0.51 0.36 0.55 0.74 0.69 0.21 0.66 1
Weighted by paid-up capitalization
Africa Asia EuropeLatin America
North America
Australia/New Zealand UK All
Africa 1Asia 0.38 1Europe 0.09 0.30 1Latin America 0.27 0.12 0.27 1North America 0.19 0.29 0.48 0.63 1Australia/New Zealand -0.13 0.15 0.37 0.09 0.30 1UK 0.21 0.27 0.35 0.20 0.45 0.26 1All 0.28 0.30 0.72 0.77 0.80 0.34 0.58 1

Table 11: Regional Betas Panel A: Unweighted indices
All Africa Asia Australia Europe Latin America North America UK return – Consol rate 1.024*** 1.141*** 0.914*** 1.121*** 0.896*** 1.072*** 1.002*** (0.0370) (0.0995) (0.0742) (0.137) (0.0706) (0.0390) (0.0793) Constant 0.0873 0.454 -0.217 0.355 -0.303 0.212* 0.0235 (0.108) (0.287) (0.208) (0.407) (0.209) (0.112) (0.231) Observations 258 43 43 43 43 43 43 R-squared 0.755 0.611 0.703 0.796 0.852 0.945 0.803 Adj. R-squared 0.754 0.602 0.696 0.791 0.848 0.944 0.798
Panel B: Indices weighted by market capitalization
All Africa Asia Australia Europe Latin America North America UK return – Consol rate 0.965*** 0.910*** 0.960*** 1.000*** 0.987*** 0.948*** 0.984*** (0.0359) (0.122) (0.0938) (0.0700) (0.0766) (0.0687) (0.0865) Constant -0.0749 -0.194 -0.0714 0.00739 -0.0172 -0.173 -0.00135 (0.101) (0.327) (0.265) (0.201) (0.230) (0.205) (0.235) Observations 258 43 43 43 43 43 43 R-squared 0.608 0.347 0.676 0.781 0.778 0.764 0.595 Adj. R-squared 0.607 0.331 0.668 0.776 0.773 0.758 0.585
Panel C: Indices weighted by paid-up capitalization
All Africa Asia Australia Europe Latin America North America UK return – Consol rate 0.965*** 0.910*** 0.960*** 1.000*** 0.987*** 0.948*** 0.984*** (0.0359) (0.122) (0.0938) (0.0700) (0.0766) (0.0687) (0.0865) Constant -0.0749 -0.194 -0.0714 0.00739 -0.0172 -0.173 -0.00135 (0.101) (0.327) (0.265) (0.201) (0.230) (0.205) (0.235) Observations 258 43 43 43 43 43 43 R-squared 0.608 0.347 0.676 0.781 0.778 0.764 0.595 Adj. R-squared 0.607 0.331 0.668 0.776 0.773 0.758 0.585
Robust standard errors in parentheses, *** p<0.01, ** p<0.05, * p<0.1

Table 17a: Sector Betas (unweighted indices) Finance Raw materials Transportation Utilities UK return – Consol rate 0.939*** 1.070*** 0.966*** 0.981*** (0.0292) (0.0585) (0.0342) (0.0412) Constant -0.158* 0.230 -0.0857 -0.0695 (0.0824) (0.171) (0.0950) (0.120) Observations 258 258 245 184 R-squared 0.747 0.565 0.662 0.689 Adj. R-squared 0.746 0.563 0.660 0.687
Robust standard errors in parentheses, *** p<0.01, ** p<0.05, * p<0.1 Table 17b: Raw materials betas by region (unweighted indices)
Africa Asia Australia Europe Latin America North America UK return – Consol rate 1.191*** 0.891*** 0.884*** 1.132*** 1.015*** 1.307*** (0.111) (0.117) (0.0926) (0.0627) (0.156) (0.236) Constant 0.599* -0.255 -0.342 0.409** 0.0628 0.904 (0.326) (0.326) (0.272) (0.176) (0.448) (0.702) Observations 43 43 43 43 43 43 R-squared 0.553 0.440 0.753 0.709 0.428 0.684 Adj. R-squared 0.542 0.427 0.747 0.702 0.414 0.676
Robust standard errors in parentheses, *** p<0.01, ** p<0.05, * p<0.1

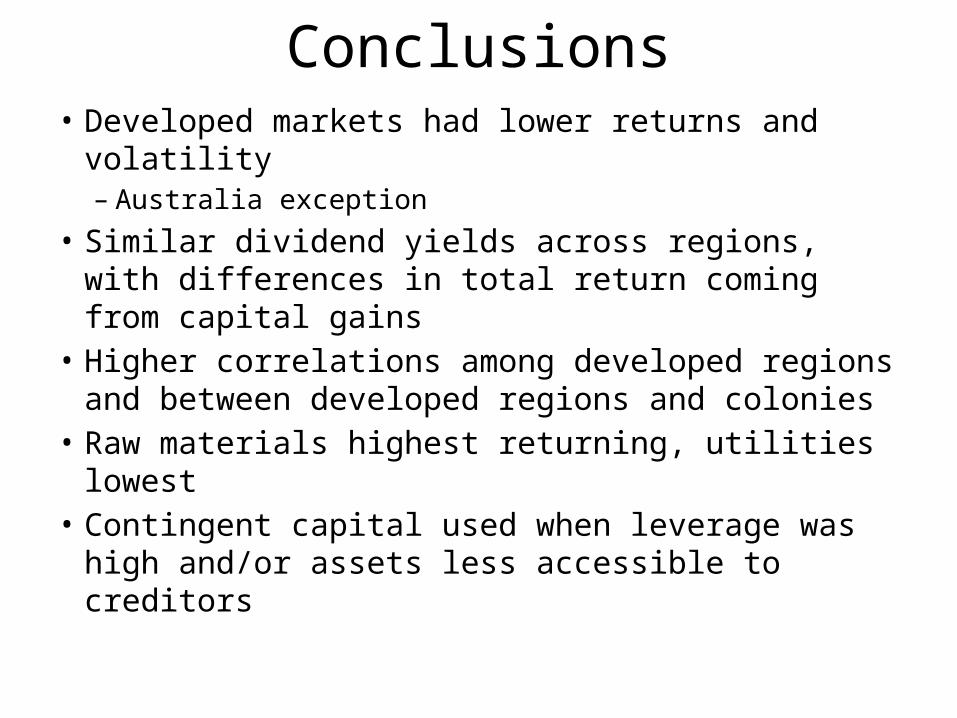
Conclusions• Developed markets had lower returns and
volatility– Australia exception
• Similar dividend yields across regions, with differences in total return coming from capital gains
• Higher correlations among developed regions and between developed regions and colonies
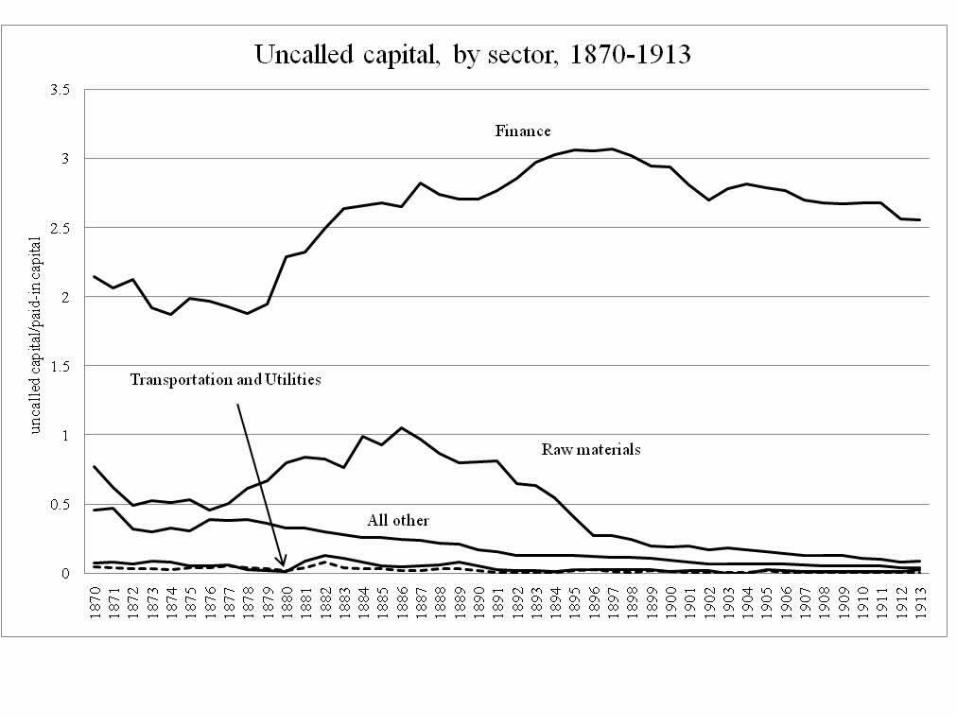
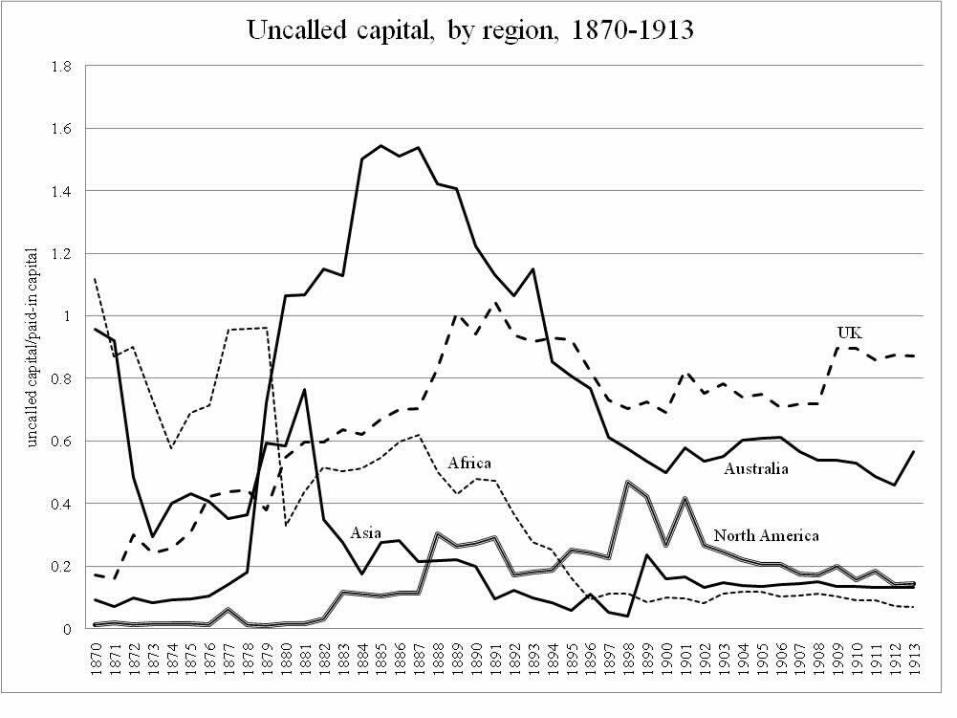
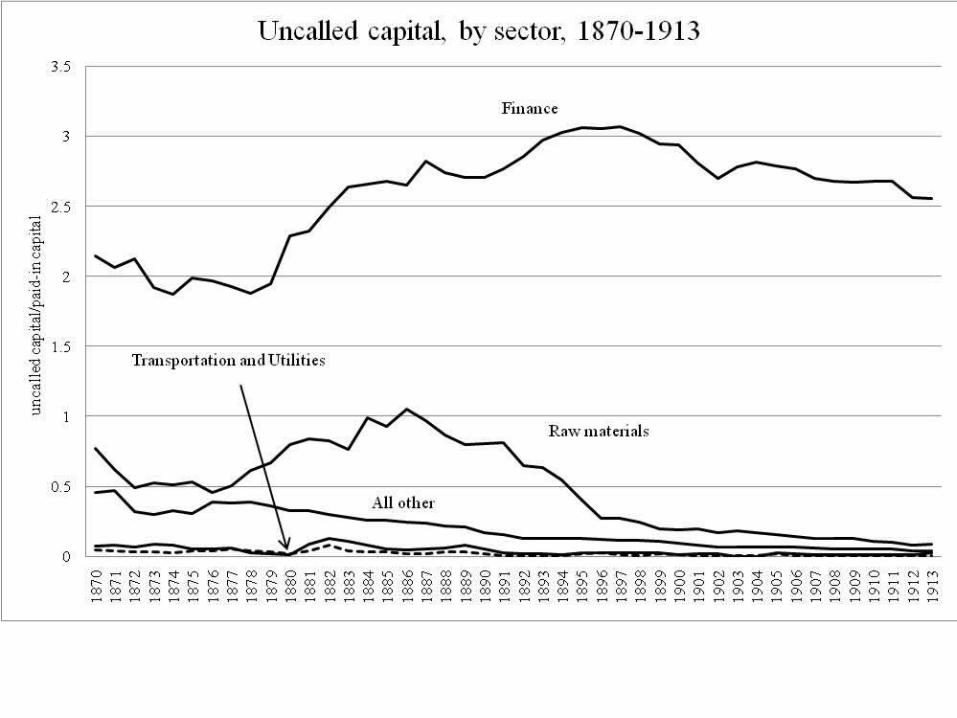
• Raw materials highest returning, utilities lowest• Contingent capital used when leverage was high
and/or assets less accessible to creditors
Improving the data
• Extending the data to 1929, using Yale ICF data
• Including foreign currency issues• Including “stock”s