blood cancers data quality report - ncin
TRANSCRIPT

1
Blood Cancers Data Quality Report
National Cancer Data Repository (NCDR) - 2010 Haematological Malignancies
Site-Specific Clinical Reference Group
Knowledge and Intelligence Team (Northern and Yorkshire) National Cancer Registration Service (Northern and Yorkshire)
Public Health England
2
Contents
Contents ........................................................................................................................... 2
Tables ............................................................................................................................... 2
Introduction ...................................................................................................................... 3
Key messages .................................................................................................................... 3
Data included in the quality report .................................................................................... 4
Registration quality summary ............................................................................................ 5
Number of registrations .................................................................................................. 10
Staging ............................................................................................................................ 16
Treatment: ...................................................................................................................... 17
Chemotherapy ................................................................................................................................................. 17 Radiotherapy .................................................................................................................................................... 20
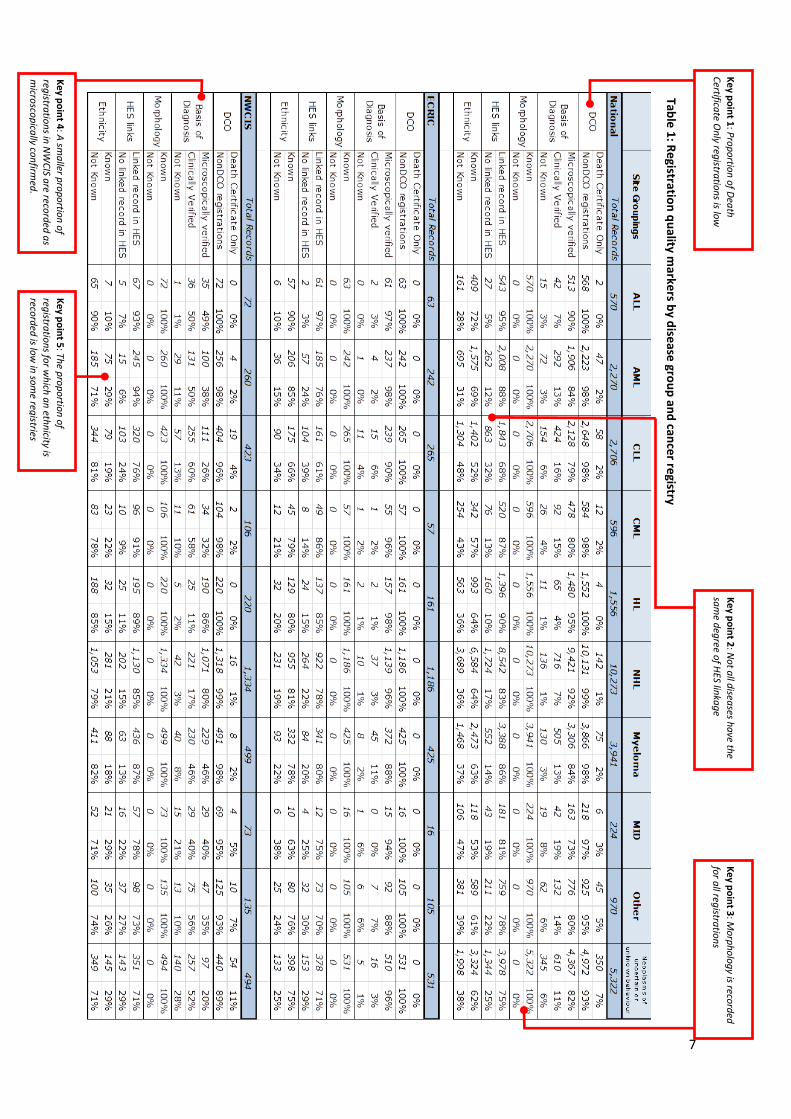
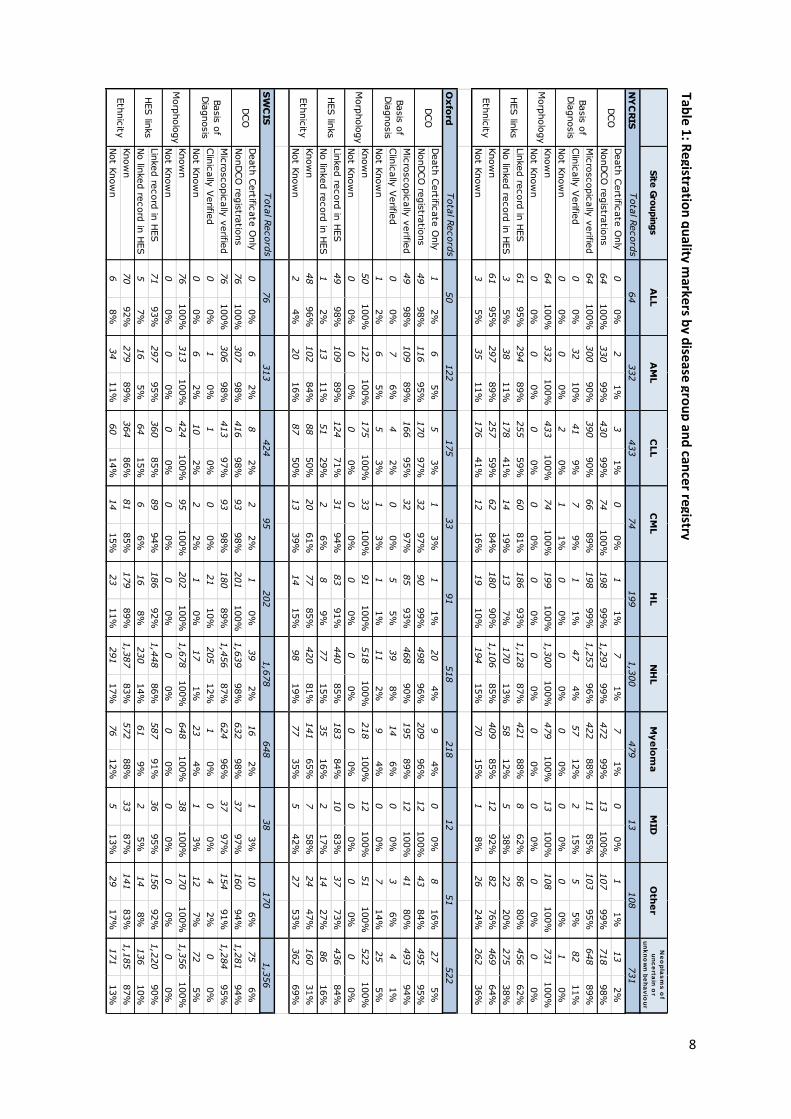
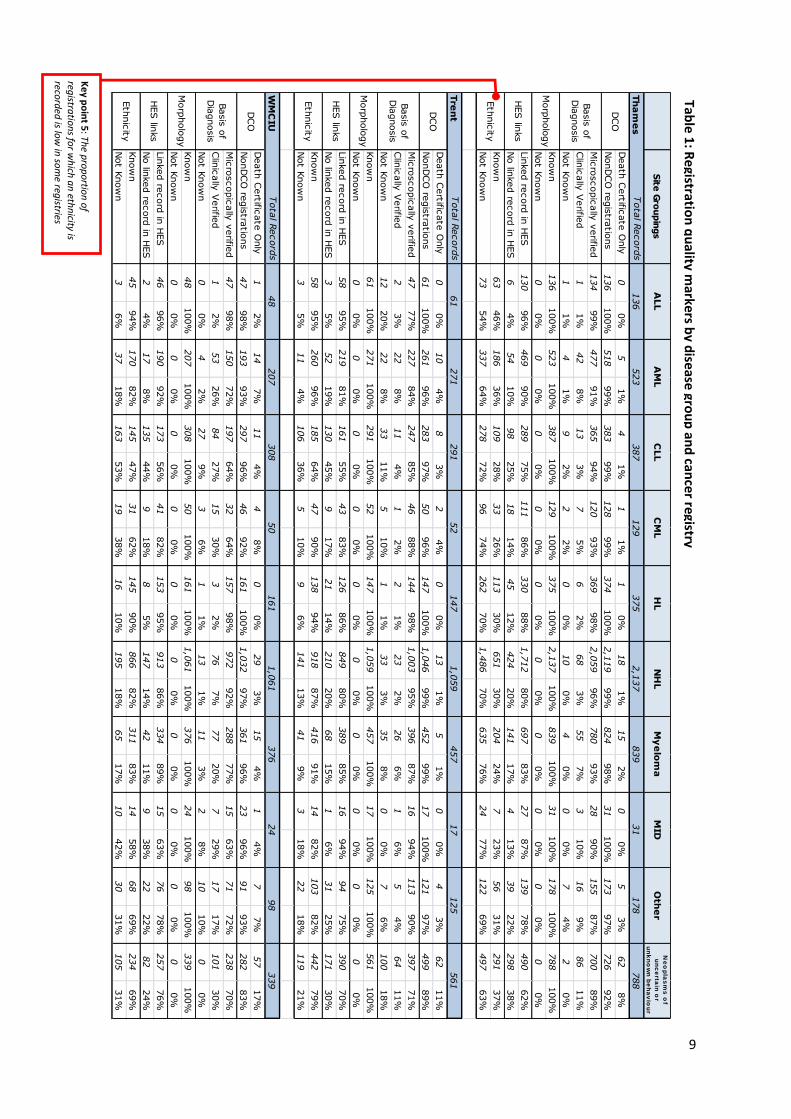
Tables Table 1: Registration quality markers by disease group and cancer registry ......................................... 7
Figures Figure 1: All Haematological malignancies registrations 2000-2010 .................................................... 10 Figure 2: Acute lymphoblastic leukaemia registrations 2000-2010 ..................................................... 11 Figure 3: Acute myeloid leukaemia registrations 2000-2010 ............................................................... 11 Figure 4: Chronic lymphocytic leukaemia registrations 2000-2010 ..................................................... 12 Figure 5: Chronic myeloid leukaemia registrations 2000-2010 ............................................................ 12 Figure 6: Hodgkin lymphoma registrations 2000-2010 ........................................................................ 13 Figure 7: Non-Hodgkin lymphoma registrations 2000-2010 ................................................................ 13 Figure 8: Myeloma registrations 2000-2010 ......................................................................................... 14 Figure 9: Malignant Immunoproliferative Disease registrations 2000-2010 ........................................ 14 Figure 10: Other Haematology malignancies registrations 2000-2010 ................................................ 15 Figure 11: Neoplasms of uncertain or unknown behaviour registrations 2000-2010 .......................... 15 Figure 12: Staging information 2010 registrations - Hodgkin lymphoma ............................................. 16 Figure 13: Staging information 2010 registrations - Non-Hodgkin lymphoma ..................................... 16 Figure 14: Chemotherapy recorded within 2010 for Acute lymphoblastic leukaemia ......................... 17 Figure 15: Chemotherapy recorded within 2010 for Acute myeloid leukaemia .................................. 17 Figure 16: Chemotherapy recorded within 2010 for Chronic lymphocytic leukaemia ......................... 18 Figure 17: Chemotherapy recorded within 2010 for Chronic myeloid leukaemia ............................... 18 Figure 18: Chemotherapy recorded within 2010 for Hodgkin lymphoma ............................................ 19 Figure 19: Chemotherapy recorded within 2010 for Non-Hodgkin lymphoma .................................... 19 Figure 20: Chemotherapy recorded within 2010 for Myeloma ............................................................ 19 Figure 21: Radiotherapy recorded within 2010 for Hodgkin lymphoma .............................................. 20 Figure 22: Radiotherapy recorded within 2010 for Non-Hodgkin lymphoma ...................................... 20 Figure 23: Radiotherapy recorded within 2010 for Myeloma .............................................................. 21
3
Introduction
The National Cancer Intelligence Network (NCIN) Haematological Site Specific Clinical Reference Group advises which data should be collected and analysed with the aim of improving clinical care in the area of haematological cancers. The Public Health England’s Knowledge and Intelligence Team (Northern and Yorkshire) analyses these cancers using the records held in the National Cancer Data Repository (NCDR). In order to produce robust analyses it is important to recognise and understand where data are missing or data quality is poor. This report aims to assess the data quality and completeness of the cancer registry data within the NCDR where diagnosis occurred between 2000 and 2010. More detailed analyses have been conducted for tumours diagnosed in 2010. Blood cancers are a very diverse range of diseases including various forms of leukaemia, lymphomas and myeloma. These diseases differ in how they present to services, in how they are diagnosed and treated and in their eventual outcome, all factors that can influence the quality of information available and recorded in cancer registries. Therefore, in this report, the quality of data is examined separately for a range of broad disease groups. Over the time period covered in this report the eight English cancer registries operated separate data collection and quality assurance processes and therefore the quality of data has also been presented on each individual registry.
Key messages
The completeness of ascertainment of blood cancers by English cancer registries has varied over the period 2000-2010. There have been substantial changes in the numbers of some forms of cancer recorded in some registries.
The disease groups in which changes in ascertainment have been most marked are chronic lymphocytic leukaemia, chronic myeloid leukaemia and myeloma.
The cancer registry catchment areas in which most variation has been seen over time in registrations for blood cancers are the North West Cancer Intelligence Service, Oxford Cancer Intelligence Unit, South West Cancer Intelligence Service and Thames Cancer Registry Service.
Information held in the NCDR 2010 on the staging and treatment of blood cancers is not sufficiently complete to support national analysis.
4
Data included in the quality report
The data analysed for this report comprise all cancer registrations with a haematological malignancy with a diagnosis date between 1 January 2010 and 31 December 2010. Additional analyses on time trends include all registrations from 1 January 2000. These data are made up of tumour level records submitted to the Office of National Statistics (ONS) by the eight English Cancer Registries. The ONS dataset has been collated, cleaned and uses standardised data items. To establish the NCDR, the ONS dataset has been further linked to an extract of the English NHS Hospital Episode Statistics (HES). Data have been presented for haematological cancers categorised into disease groups on the basis of the following ICD-10 (International Classification of Diseases) codes:
Acute lymphoblastic leukaemia (ALL) - C910
Acute myeloid leukaemia (AML) - C920, C924, C925, C930, C940, C942
Chronic lymphocytic leukaemia (CLL) - C911
Chronic myeloid leukaemia (CML) - C921
Hodgkin lymphoma (HL) - C81
Non-Hodgkin lymphoma (NHL) - C82-C85
Myeloma - C90
Malignant Immunoproliferative Disease (MID) - C88
Other haematological malignancies - C912-9, C922-3, C927-9, C931-9, C943-9, C95, C96
Neoplasms of uncertain or unknown behaviour (Myelodysplasia, Myeloproliferative Neoplasms,. Monoclonal Gammopathy of Uncertain Significance) – D45, D46, D47
As the quality of cancer registration may vary between cancer registries data have also been presented separately for each of the eight English cancer registries.
Eastern Cancer Registration and Information Centre (ECRIC)
North West Cancer Intelligence Service (NWCIS)
Northern and Yorkshire Cancer Registry and Information Service (NYCRIS)
Oxford Cancer Intelligence Unit (OCIU)
South West Cancer Intelligence Service (SWCIS)
Thames Cancer Registry Service (Thames)
Trent Cancer Registry (Trent)
West Midlands Cancer Intelligence Unit (WMCIU) Over the registration period 1 January 2010 and 31 December 2010 there were 28,428 cancer registrations for haematological malignancies.
5
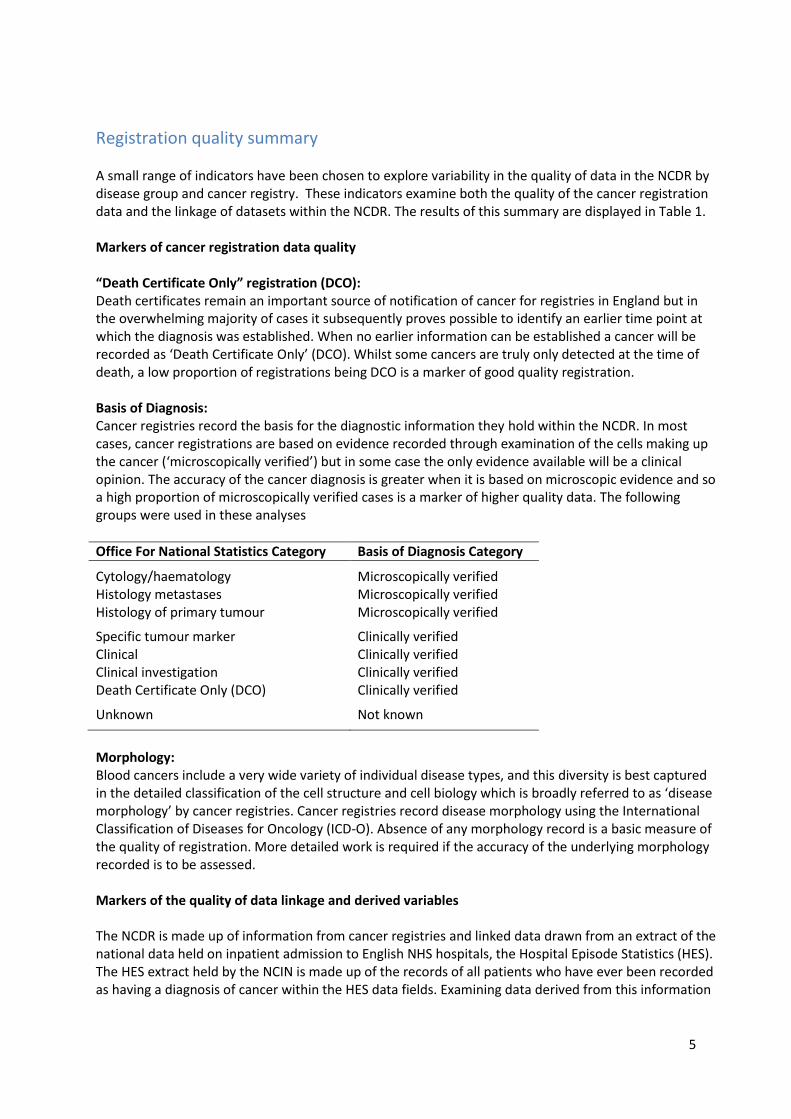
Registration quality summary A small range of indicators have been chosen to explore variability in the quality of data in the NCDR by disease group and cancer registry. These indicators examine both the quality of the cancer registration data and the linkage of datasets within the NCDR. The results of this summary are displayed in Table 1. Markers of cancer registration data quality
“Death Certificate Only” registration (DCO): Death certificates remain an important source of notification of cancer for registries in England but in the overwhelming majority of cases it subsequently proves possible to identify an earlier time point at which the diagnosis was established. When no earlier information can be established a cancer will be recorded as ‘Death Certificate Only’ (DCO). Whilst some cancers are truly only detected at the time of death, a low proportion of registrations being DCO is a marker of good quality registration. Basis of Diagnosis: Cancer registries record the basis for the diagnostic information they hold within the NCDR. In most cases, cancer registrations are based on evidence recorded through examination of the cells making up the cancer (‘microscopically verified’) but in some case the only evidence available will be a clinical opinion. The accuracy of the cancer diagnosis is greater when it is based on microscopic evidence and so a high proportion of microscopically verified cases is a marker of higher quality data. The following groups were used in these analyses
Office For National Statistics Category Basis of Diagnosis Category
Cytology/haematology Microscopically verified Histology metastases Microscopically verified Histology of primary tumour Microscopically verified
Specific tumour marker Clinically verified Clinical Clinically verified Clinical investigation Clinically verified Death Certificate Only (DCO) Clinically verified
Unknown Not known
Morphology: Blood cancers include a very wide variety of individual disease types, and this diversity is best captured in the detailed classification of the cell structure and cell biology which is broadly referred to as ‘disease morphology’ by cancer registries. Cancer registries record disease morphology using the International Classification of Diseases for Oncology (ICD-O). Absence of any morphology record is a basic measure of the quality of registration. More detailed work is required if the accuracy of the underlying morphology recorded is to be assessed. Markers of the quality of data linkage and derived variables The NCDR is made up of information from cancer registries and linked data drawn from an extract of the national data held on inpatient admission to English NHS hospitals, the Hospital Episode Statistics (HES). The HES extract held by the NCIN is made up of the records of all patients who have ever been recorded as having a diagnosis of cancer within the HES data fields. Examining data derived from this information
6
is dependent on the quality of (i) information needed to link datasets (unique personal identifiers) (ii) the completeness and accuracy of the HES data set. HES link: Whilst not every patient with a diagnosis of cancer requires inpatient care, and therefore not every registered cancer will have a linked HES record, a high proportion of cases having such a link is an indicator of a high quality of linkage.
Ethnicity: One variable in the NCDR currently derived from linkage to HES is an indicator of the ethnicity of patients with cancer. This information is clearly only available if a link with HES has been achieved for a patient, but the completeness of this field is also dependent on the information held in HES. Records have been categorised as having a ‘Known’ (that is that the HES records contain a valid ethnicity code) or ‘Not Known’ (that is that the HES records do not contain a valid code or there is no link to HES). A higher level of ‘Known’ ethnicity has been taken as a marker of higher data quality. Key points to note in Table I 1. The proportion of registrations that were Death Certificate Only was low across disease groupings
and cancer registries with the percentage of DCO registrations generally between 0-4%. Registrations for neoplasms of uncertain or unknown behaviour were more likely to be DCO. These are often more chronic, long-term conditions and it is harder to obtain good quality trace back information.
2. It is noticeable that registrations of Chronic Lymphocytic Leukaemia (CLL) are less likely to have a
link with HES data. Individuals with CLL may be managed entirely in the community and therefore have never had a hospital admission in which a diagnosis of cancer was recorded. Levels of HES linkage are also lower in neoplasms of uncertain or unknown behaviour. Many of these cases will also be managed in the community and in addition it is possible that the coding of these cases is less complete in hospital admissions, and therefore, fewer cases will be included in the HES extract.
3. Morphology was recorded for all registrations. However more detailed review will be required to
determine the proportion of registrations that have disease-specific morphologies recorded.
4. In general, registrations were microscopically verified. In NWCIS this was not the case, with only registrations with lymphomas having high rates of microscopic verification. In 2010, NWCIS acknowledged under-reporting from some laboratories and also increased use of data flows that did not contain basis of diagnosis. This was expected to improve year on year. (UKACR Annual Performance Indicators 2012).
5. There were low levels of ethnicity data available in two registries, NWCIS and Thames. In NWCIS it
seems that ethnicity data has not been drawn comprehensively from available HES data. In Thames there are also high levels of linked HES records that lack specific ethnicity data.
7
Ke
y po
int 2
: No
t all d
iseases h
ave th
e
sam
e deg
ree of H
ES linka
ge
Ke
y po
int 1
: Pro
po
rtion
of D
eath
Certifica
te On
ly registra
tion
s is low
Ke
y po
int 4
: A sm
aller p
rop
ortio
n o
f
registra
tion
s in N
WC
IS are reco
rded
as
micro
scop
ically co
nfirm
ed.
Ke
y po
int 5
: The p
rop
ortio
n o
f
registra
tion
s for w
hich
an
ethn
icity is reco
rded
is low
in so
me reg
istries
Ke
y po
int 3
: Mo
rph
olo
gy is reco
rded
for a
ll registra
tion
s
Table
1: R
egistratio
n q
uality m
arkers b
y dise
ase gro
up
and
cance
r registry
8
Site
Gro
up
ing
s
NYCRIS
Tota
l Record
s
Death
Certific
ate
Only
00%
21%
31%
00%
11%
71%
71%
00%
11%
13
2%
NonDCO
regis
tratio
ns
64
100%
330
99%
430
99%
74
100%
198
99%
1,2
93
99%
472
99%
13
100%
107
99%
718
98%
Mic
roscopic
ally
verifie
d64
100%
300
90%
390
90%
66
89%
198
99%
1,2
53
96%
422
88%
11
85%
103
95%
648
89%
Clin
ically
Verifie
d
00%
32
10%
41
9%
79%
11%
47
4%
57
12%
215%
55%
82
11%
Not K
now
n0
0%
00%
20%
11%
00%
00%
00%
00%
00%
10%
Know
n
64
100%
332
100%
433
100%
74
100%
199
100%
1,3
00
100%
479
100%
13
100%
108
100%
731
100%
Not K
now
n0
0%
00%
00%
00%
00%
00%
00%
00%
00%
00%
Lin
ked re
cord
in H
ES
61
95%
294
89%
255
59%
60
81%
186
93%
1,1
28
87%
421
88%
862%
86
80%
456
62%
No lin
ked re
cord
in H
ES
35%
38
11%
178
41%
14
19%
13
7%
170
13%
58
12%
538%
22
20%
275
38%
Know
n
61
95%
297
89%
257
59%
62
84%
180
90%
1,1
06
85%
409
85%
12
92%
82
76%
469
64%
Not K
now
n3
5%
35
11%
176
41%
12
16%
19
10%
194
15%
70
15%
18%
26
24%
262
36%
Oxford
Tota
l Record
s
Death
Certific
ate
Only
12%
65%
53%
13%
11%
20
4%
94%
00%
816%
27
5%
NonDCO
regis
tratio
ns
49
98%
116
95%
170
97%
32
97%
90
99%
498
96%
209
96%
12
100%
43
84%
495
95%
Mic
roscopic
ally
verifie
d49
98%
109
89%
166
95%
32
97%
85
93%
468
90%
195
89%
12
100%
41
80%
493
94%
Clin
ically
Verifie
d
00%
76%
42%
00%
55%
39
8%
14
6%
00%
36%
41%
Not K
now
n1
2%
65%
53%
13%
11%
11
2%
94%
00%
714%
25
5%
Know
n
50
100%
122
100%
175
100%
33
100%
91
100%
518
100%
218
100%
12
100%
51
100%
522
100%
Not K
now
n0
0%
00%
00%
00%
00%
00%
00%
00%
00%
00%
Lin
ked re
cord
in H
ES
49
98%
109
89%
124
71%
31
94%
83
91%
440
85%
183
84%
10
83%
37
73%
436
84%
No lin
ked re
cord
in H
ES
12%
13
11%
51
29%
26%
89%
77
15%
35
16%
217%
14
27%
86
16%
Know
n
48
96%
102
84%
88
50%
20
61%
77
85%
420
81%
141
65%
758%
24
47%
160
31%
Not K
now
n2
4%
20
16%
87
50%
13
39%
14
15%
98
19%
77
35%
542%
27
53%
362
69%
SWCIS
Tota
l Record
s
Death
Certific
ate
Only
00%
62%
82%
22%
10%
39
2%
16
2%
13%
10
6%
75
6%
NonDCO
regis
tratio
ns
76
100%
307
98%
416
98%
93
98%
201
100%
1,6
39
98%
632
98%
37
97%
160
94%
1,2
81
94%
Mic
roscopic
ally
verifie
d76
100%
306
98%
413
97%
93
98%
180
89%
1,4
56
87%
624
96%
37
97%
154
91%
1,2
84
95%
Clin
ically
Verifie
d
00%
10%
10%
00%
21
10%
205
12%
10%
00%
42%
00%
Not K
now
n0
0%
62%
10
2%
22%
10%
17
1%
23
4%
13%
12
7%
72
5%
Know
n
76
100%
313
100%
424
100%
95
100%
202
100%
1,6
78
100%
648
100%
38
100%
170
100%
1,3
56
100%
Not K
now
n0
0%
00%
00%
00%
00%
00%
00%
00%
00%
00%
Lin
ked re
cord
in H
ES
71
93%
297
95%
360
85%
89
94%
186
92%
1,4
48
86%
587
91%
36
95%
156
92%
1,2
20
90%
No lin
ked re
cord
in H
ES
57%
16
5%
64
15%
66%
16
8%
230
14%
61
9%
25%
14
8%
136
10%
Know
n
70
92%
279
89%
364
86%
81
85%
179
89%
1,3
87
83%
572
88%
33
87%
141
83%
1,1
85
87%
Not K
now
n6
8%
34
11%
60
14%
14
15%
23
11%
291
17%
76
12%
513%
29
17%
171
13%
Myeloma
479
218
648
HL
NHL
MID
Other
Ne
op
las
ms
of
un
ce
rtain
or
un
kn
ow
n b
eh
av
iou
rALL
AML
CLL
CML
202
1,6
78
38
170
1,3
56
76
313
424
95
91
518
12
51
522
50
122
175
33
199
1,3
00
13
108
731
64
332
433
74
DCO
Basis
of
Dia
gnosis
Morp
holo
gy
HES lin
ks
Eth
nic
ity
DCO
Basis
of
Dia
gnosis
Morp
holo
gy
HES lin
ks
Eth
nic
ity
DCO
Basis
of
Dia
gnosis
Morp
holo
gy
HES lin
ks
Eth
nic
ity
Table 1
: Re
gistration
qu
ality markers b
y disease gro
up
and
cance
r registry
9
Site
Gro
up
ing
s
Thames
Tota
l Record
s
Death
Certific
ate
Only
00%
51%
41%
11%
10%
18
1%
15
2%
00%
53%
62
8%
NonDCO
regis
tratio
ns
136
100%
518
99%
383
99%
128
99%
374
100%
2,1
19
99%
824
98%
31
100%
173
97%
726
92%
Mic
roscopic
ally
verifie
d134
99%
477
91%
365
94%
120
93%
369
98%
2,0
59
96%
780
93%
28
90%
155
87%
700
89%
Clin
ically
Verifie
d
11%
42
8%
13
3%
75%
62%
68
3%
55
7%
310%
16
9%
86
11%
Not K
now
n1
1%
41%
92%
22%
00%
10
0%
40%
00%
74%
20%
Know
n
136
100%
523
100%
387
100%
129
100%
375
100%
2,1
37
100%
839
100%
31
100%
178
100%
788
100%
Not K
now
n0
0%
00%
00%
00%
00%
00%
00%
00%
00%
00%
Lin
ked re
cord
in H
ES
130
96%
469
90%
289
75%
111
86%
330
88%
1,7
12
80%
697
83%
27
87%
139
78%
490
62%
No lin
ked re
cord
in H
ES
64%
54
10%
98
25%
18
14%
45
12%
424
20%
141
17%
413%
39
22%
298
38%
Know
n
63
46%
186
36%
109
28%
33
26%
113
30%
651
30%
204
24%
723%
56
31%
291
37%
Not K
now
n73
54%
337
64%
278
72%
96
74%
262
70%
1,4
86
70%
635
76%
24
77%
122
69%
497
63%
Trent
Tota
l Record
s
Death
Certific
ate
Only
00%
10
4%
83%
24%
00%
13
1%
51%
00%
43%
62
11%
NonDCO
regis
tratio
ns
61
100%
261
96%
283
97%
50
96%
147
100%
1,0
46
99%
452
99%
17
100%
121
97%
499
89%
Mic
roscopic
ally
verifie
d47
77%
227
84%
247
85%
46
88%
144
98%
1,0
03
95%
396
87%
16
94%
113
90%
397
71%
Clin
ically
Verifie
d
23%
22
8%
11
4%
12%
21%
23
2%
26
6%
16%
54%
64
11%
Not K
now
n12
20%
22
8%
33
11%
510%
11%
33
3%
35
8%
00%
76%
100
18%
Know
n
61
100%
271
100%
291
100%
52
100%
147
100%
1,0
59
100%
457
100%
17
100%
125
100%
561
100%
Not K
now
n0
0%
00%
00%
00%
00%
00%
00%
00%
00%
00%
Lin
ked re
cord
in H
ES
58
95%
219
81%
161
55%
43
83%
126
86%
849
80%
389
85%
16
94%
94
75%
390
70%
No lin
ked re
cord
in H
ES
35%
52
19%
130
45%
917%
21
14%
210
20%
68
15%
16%
31
25%
171
30%
Know
n
58
95%
260
96%
185
64%
47
90%
138
94%
918
87%
416
91%
14
82%
103
82%
442
79%
Not K
now
n3
5%
11
4%
106
36%
510%
96%
141
13%
41
9%
318%
22
18%
119
21%
WMCIU
Tota
l Record
s
Death
Certific
ate
Only
12%
14
7%
11
4%
48%
00%
29
3%
15
4%
14%
77%
57
17%
NonDCO
regis
tratio
ns
47
98%
193
93%
297
96%
46
92%
161
100%
1,0
32
97%
361
96%
23
96%
91
93%
282
83%
Mic
roscopic
ally
verifie
d47
98%
150
72%
197
64%
32
64%
157
98%
972
92%
288
77%
15
63%
71
72%
238
70%
Clin
ically
Verifie
d
12%
53
26%
84
27%
15
30%
32%
76
7%
77
20%
729%
17
17%
101
30%
Not K
now
n0
0%
42%
27
9%
36%
11%
13
1%
11
3%
28%
10
10%
00%
Know
n
48
100%
207
100%
308
100%
50
100%
161
100%
1,0
61
100%
376
100%
24
100%
98
100%
339
100%
Not K
now
n0
0%
00%
00%
00%
00%
00%
00%
00%
00%
00%
Lin
ked re
cord
in H
ES
46
96%
190
92%
173
56%
41
82%
153
95%
913
86%
334
89%
15
63%
76
78%
257
76%
No lin
ked re
cord
in H
ES
24%
17
8%
135
44%
918%
85%
147
14%
42
11%
938%
22
22%
82
24%
Know
n
45
94%
170
82%
145
47%
31
62%
145
90%
866
82%
311
83%
14
58%
68
69%
234
69%
Not K
now
n3
6%
37
18%
163
53%
19
38%
16
10%
195
18%
65
17%
10
42%
30
31%
105
31%
Myeloma
HL
NHL
MID
Other
Ne
op
las
ms
of
un
ce
rtain
or
un
kn
ow
n b
eh
av
iou
r
ALL
AML
CLL
CML
161
1,0
61
24
98
339
48
207
308
50
376
147
1,0
59
17
125
561
61
271
291
52
457
375
2,1
37
31
178
788
136
523
387
129
839
DCO
Basis
of
Dia
gnosis
Morp
holo
gy
HES lin
ks
Eth
nic
ity
DCO
Basis
of
Dia
gnosis
Morp
holo
gy
HES lin
ks
Eth
nic
ity
DCO
Basis
of
Dia
gnosis
Morp
holo
gy
HES lin
ks
Eth
nic
ity
Ke
y po
int 5
: The p
rop
ortio
n o
f
registra
tion
s for w
hich
an
ethn
icity is reco
rded
is low
in so
me reg
istries
Table 1
: Re
gistration
qu
ality markers b
y disease gro
up
and
cance
r registry
10
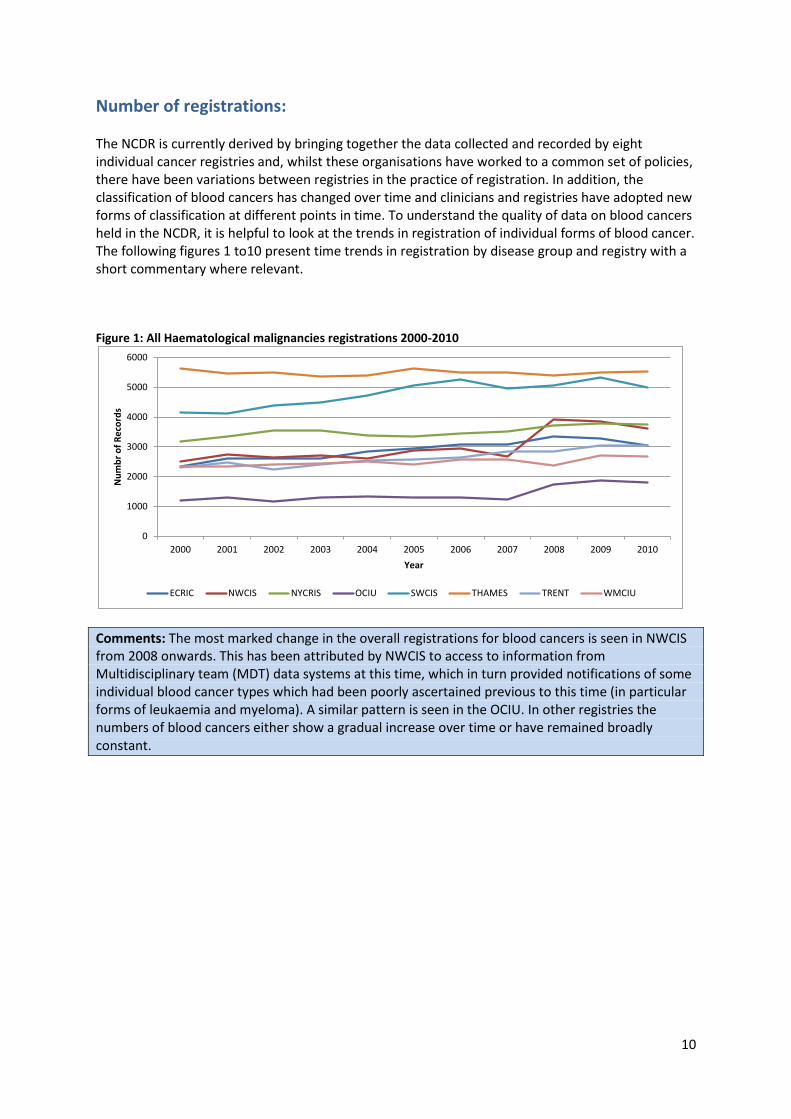
Number of registrations: The NCDR is currently derived by bringing together the data collected and recorded by eight individual cancer registries and, whilst these organisations have worked to a common set of policies, there have been variations between registries in the practice of registration. In addition, the classification of blood cancers has changed over time and clinicians and registries have adopted new forms of classification at different points in time. To understand the quality of data on blood cancers held in the NCDR, it is helpful to look at the trends in registration of individual forms of blood cancer. The following figures 1 to10 present time trends in registration by disease group and registry with a short commentary where relevant. Figure 1: All Haematological malignancies registrations 2000-2010
Comments: The most marked change in the overall registrations for blood cancers is seen in NWCIS from 2008 onwards. This has been attributed by NWCIS to access to information from Multidisciplinary team (MDT) data systems at this time, which in turn provided notifications of some individual blood cancer types which had been poorly ascertained previous to this time (in particular forms of leukaemia and myeloma). A similar pattern is seen in the OCIU. In other registries the numbers of blood cancers either show a gradual increase over time or have remained broadly constant.
0
1000
2000
3000
4000
5000
6000
2000 2001 2002 2003 2004 2005 2006 2007 2008 2009 2010
Nu
mb
r o
f R
eco
rds
Year
ECRIC NWCIS NYCRIS OCIU SWCIS THAMES TRENT WMCIU
11
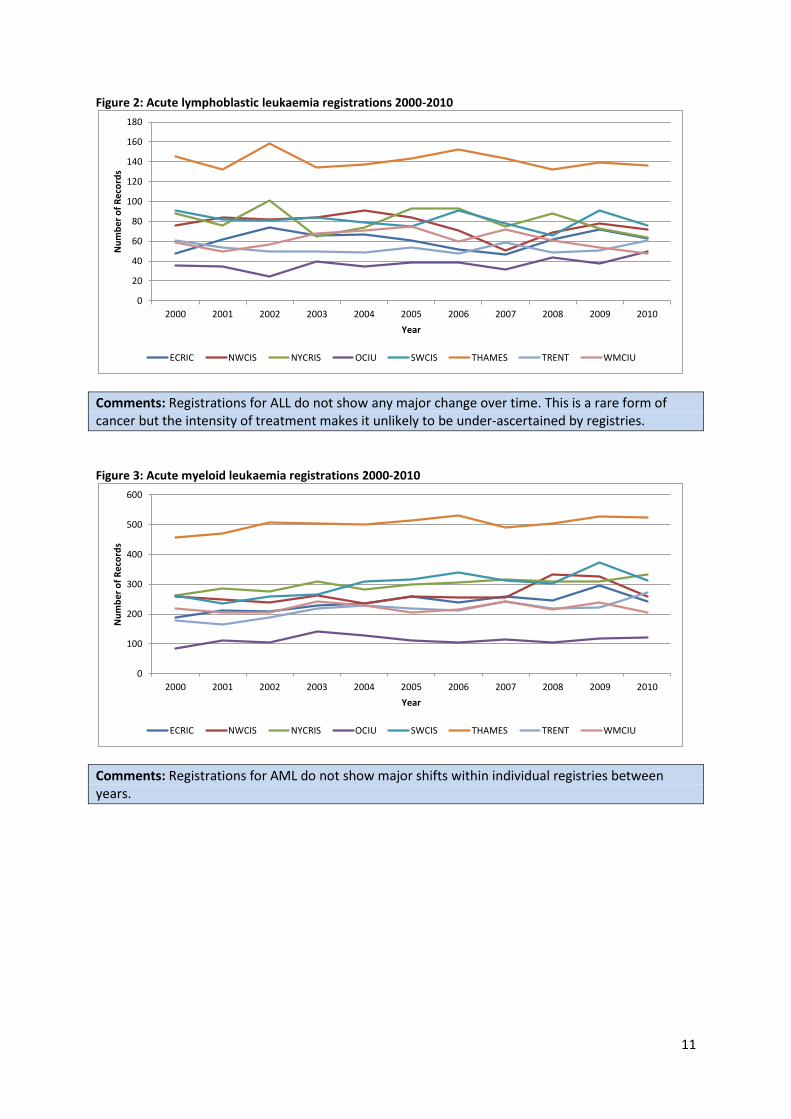
Figure 2: Acute lymphoblastic leukaemia registrations 2000-2010
Comments: Registrations for ALL do not show any major change over time. This is a rare form of cancer but the intensity of treatment makes it unlikely to be under-ascertained by registries.
Figure 3: Acute myeloid leukaemia registrations 2000-2010
Comments: Registrations for AML do not show major shifts within individual registries between years.
0
20
40
60
80
100
120
140
160
180
2000 2001 2002 2003 2004 2005 2006 2007 2008 2009 2010
Nu
mb
er
of
Re
cord
s
Year
ECRIC NWCIS NYCRIS OCIU SWCIS THAMES TRENT WMCIU
0
100
200
300
400
500
600
2000 2001 2002 2003 2004 2005 2006 2007 2008 2009 2010
Nu
mb
er
of
Re
cord
s
Year
ECRIC NWCIS NYCRIS OCIU SWCIS THAMES TRENT WMCIU
12
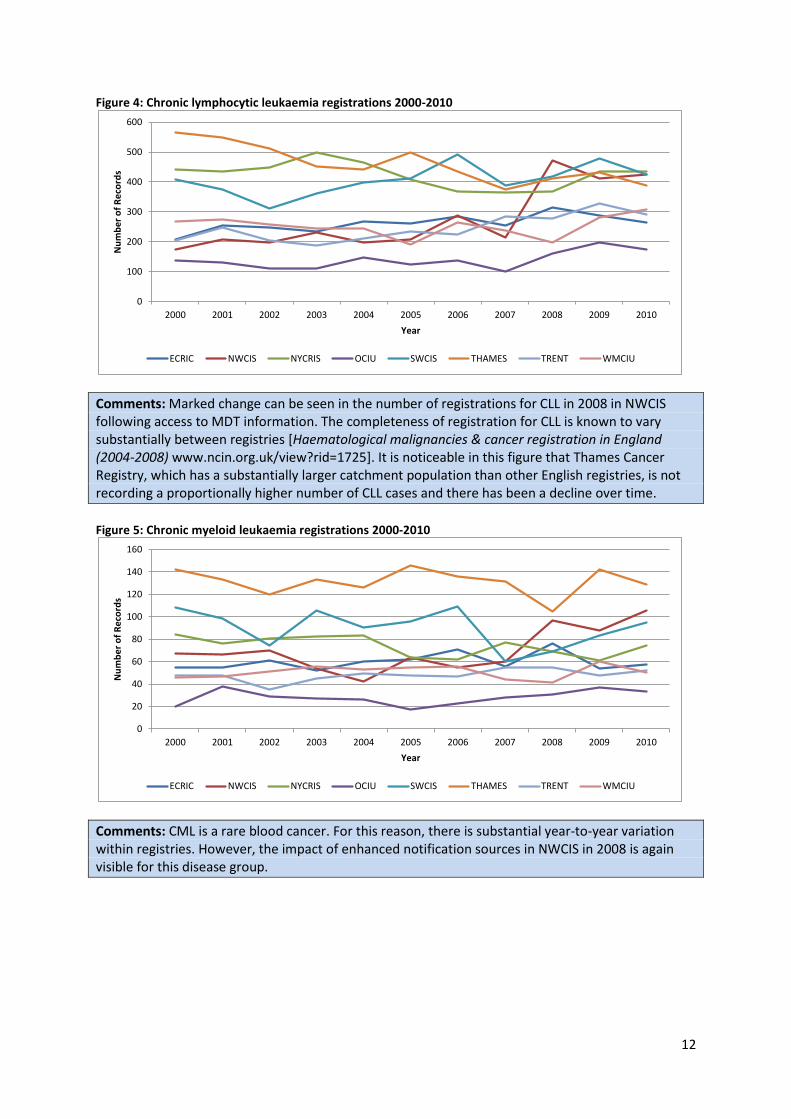
Figure 4: Chronic lymphocytic leukaemia registrations 2000-2010
Comments: Marked change can be seen in the number of registrations for CLL in 2008 in NWCIS following access to MDT information. The completeness of registration for CLL is known to vary substantially between registries [Haematological malignancies & cancer registration in England (2004-2008) www.ncin.org.uk/view?rid=1725]. It is noticeable in this figure that Thames Cancer Registry, which has a substantially larger catchment population than other English registries, is not recording a proportionally higher number of CLL cases and there has been a decline over time.
Figure 5: Chronic myeloid leukaemia registrations 2000-2010
Comments: CML is a rare blood cancer. For this reason, there is substantial year-to-year variation within registries. However, the impact of enhanced notification sources in NWCIS in 2008 is again visible for this disease group.
0
100
200
300
400
500
600
2000 2001 2002 2003 2004 2005 2006 2007 2008 2009 2010
Nu
mb
er
of
Re
cord
s
Year
ECRIC NWCIS NYCRIS OCIU SWCIS THAMES TRENT WMCIU
0
20
40
60
80
100
120
140
160
2000 2001 2002 2003 2004 2005 2006 2007 2008 2009 2010
Nu
mb
er
of
Re
cord
s
Year
ECRIC NWCIS NYCRIS OCIU SWCIS THAMES TRENT WMCIU
13
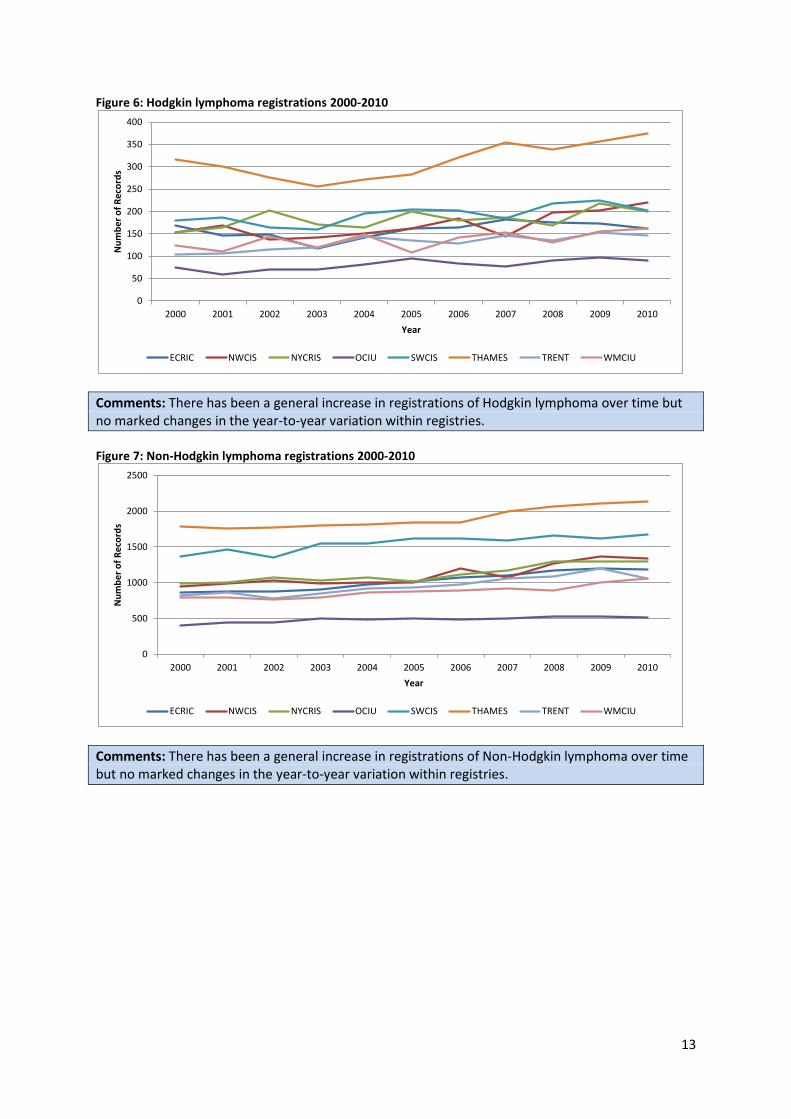
Figure 6: Hodgkin lymphoma registrations 2000-2010
Comments: There has been a general increase in registrations of Hodgkin lymphoma over time but no marked changes in the year-to-year variation within registries.
Figure 7: Non-Hodgkin lymphoma registrations 2000-2010
Comments: There has been a general increase in registrations of Non-Hodgkin lymphoma over time but no marked changes in the year-to-year variation within registries.
0
50
100
150
200
250
300
350
400
2000 2001 2002 2003 2004 2005 2006 2007 2008 2009 2010
Nu
mb
er
of
Re
cord
s
Year
ECRIC NWCIS NYCRIS OCIU SWCIS THAMES TRENT WMCIU
0
500
1000
1500
2000
2500
2000 2001 2002 2003 2004 2005 2006 2007 2008 2009 2010
Nu
mb
er
of
Re
cord
s
Year
ECRIC NWCIS NYCRIS OCIU SWCIS THAMES TRENT WMCIU
14
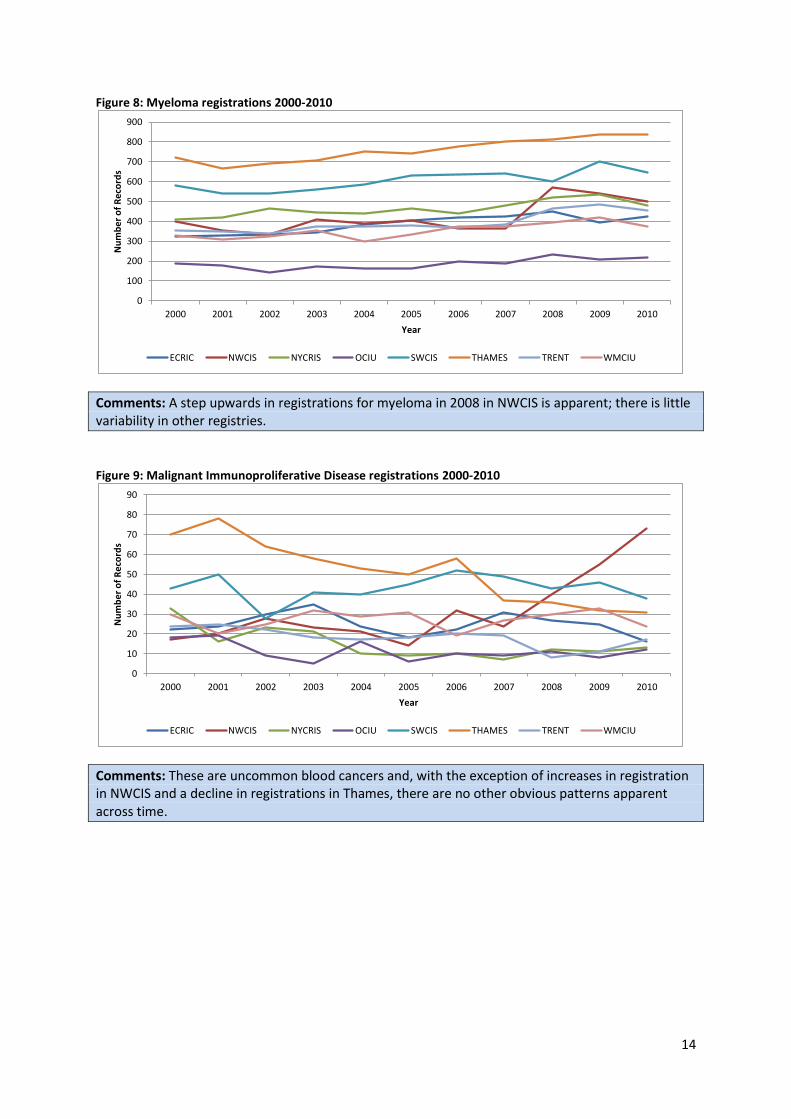
Figure 8: Myeloma registrations 2000-2010
Comments: A step upwards in registrations for myeloma in 2008 in NWCIS is apparent; there is little variability in other registries.
Figure 9: Malignant Immunoproliferative Disease registrations 2000-2010
Comments: These are uncommon blood cancers and, with the exception of increases in registration in NWCIS and a decline in registrations in Thames, there are no other obvious patterns apparent across time.
0
100
200
300
400
500
600
700
800
900
2000 2001 2002 2003 2004 2005 2006 2007 2008 2009 2010
Nu
mb
er
of
Re
cord
s
Year
ECRIC NWCIS NYCRIS OCIU SWCIS THAMES TRENT WMCIU
0
10
20
30
40
50
60
70
80
90
2000 2001 2002 2003 2004 2005 2006 2007 2008 2009 2010
Nu
mb
er
of
Re
cord
s
Year
ECRIC NWCIS NYCRIS OCIU SWCIS THAMES TRENT WMCIU
15
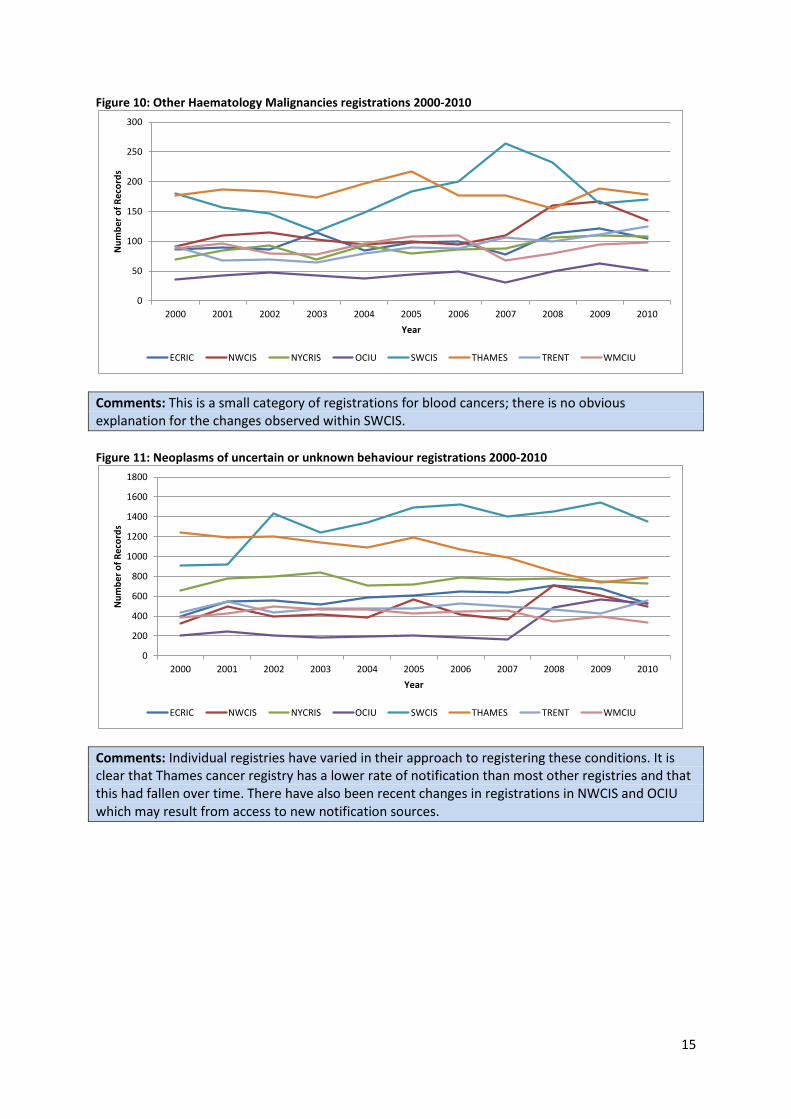
Figure 10: Other Haematology Malignancies registrations 2000-2010
Comments: This is a small category of registrations for blood cancers; there is no obvious explanation for the changes observed within SWCIS.
Figure 11: Neoplasms of uncertain or unknown behaviour registrations 2000-2010
Comments: Individual registries have varied in their approach to registering these conditions. It is clear that Thames cancer registry has a lower rate of notification than most other registries and that this had fallen over time. There have also been recent changes in registrations in NWCIS and OCIU which may result from access to new notification sources.
0
50
100
150
200
250
300
2000 2001 2002 2003 2004 2005 2006 2007 2008 2009 2010
Nu
mb
er
of
Re
cord
s
Year
ECRIC NWCIS NYCRIS OCIU SWCIS THAMES TRENT WMCIU
0
200
400
600
800
1000
1200
1400
1600
1800
2000 2001 2002 2003 2004 2005 2006 2007 2008 2009 2010
Nu
mb
er
of
Re
cord
s
Year
ECRIC NWCIS NYCRIS OCIU SWCIS THAMES TRENT WMCIU
16
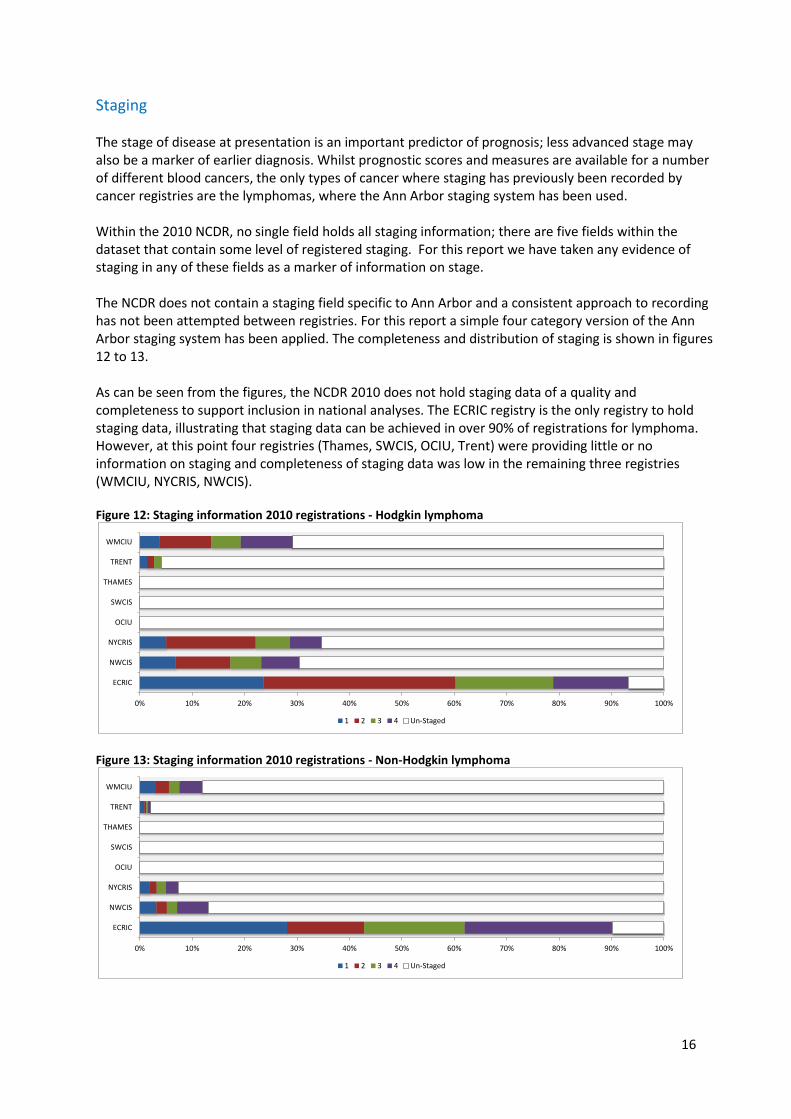
Staging The stage of disease at presentation is an important predictor of prognosis; less advanced stage may also be a marker of earlier diagnosis. Whilst prognostic scores and measures are available for a number of different blood cancers, the only types of cancer where staging has previously been recorded by cancer registries are the lymphomas, where the Ann Arbor staging system has been used. Within the 2010 NCDR, no single field holds all staging information; there are five fields within the dataset that contain some level of registered staging. For this report we have taken any evidence of staging in any of these fields as a marker of information on stage. The NCDR does not contain a staging field specific to Ann Arbor and a consistent approach to recording has not been attempted between registries. For this report a simple four category version of the Ann Arbor staging system has been applied. The completeness and distribution of staging is shown in figures 12 to 13. As can be seen from the figures, the NCDR 2010 does not hold staging data of a quality and completeness to support inclusion in national analyses. The ECRIC registry is the only registry to hold staging data, illustrating that staging data can be achieved in over 90% of registrations for lymphoma. However, at this point four registries (Thames, SWCIS, OCIU, Trent) were providing little or no information on staging and completeness of staging data was low in the remaining three registries (WMCIU, NYCRIS, NWCIS). Figure 12: Staging information 2010 registrations - Hodgkin lymphoma
Figure 13: Staging information 2010 registrations - Non-Hodgkin lymphoma
0% 10% 20% 30% 40% 50% 60% 70% 80% 90% 100%
ECRIC
NWCIS
NYCRIS
OCIU
SWCIS
THAMES
TRENT
WMCIU
1 2 3 4 Un-Staged
0% 10% 20% 30% 40% 50% 60% 70% 80% 90% 100%
ECRIC
NWCIS
NYCRIS
OCIU
SWCIS
THAMES
TRENT
WMCIU
1 2 3 4 Un-Staged
17
Treatment Cancer registries seek to record treatment received by patients in the first six months following diagnosis, and have classified treatment received in to broad categories (not mutually exclusive): chemotherapy, radiotherapy, hormone therapy and surgery. The numbers and proportions of individuals registered with blood cancers in 2010 with information indicating treatment with chemotherapy and radiotherapy for a range of disease groups are shown in figures 14 to 20.
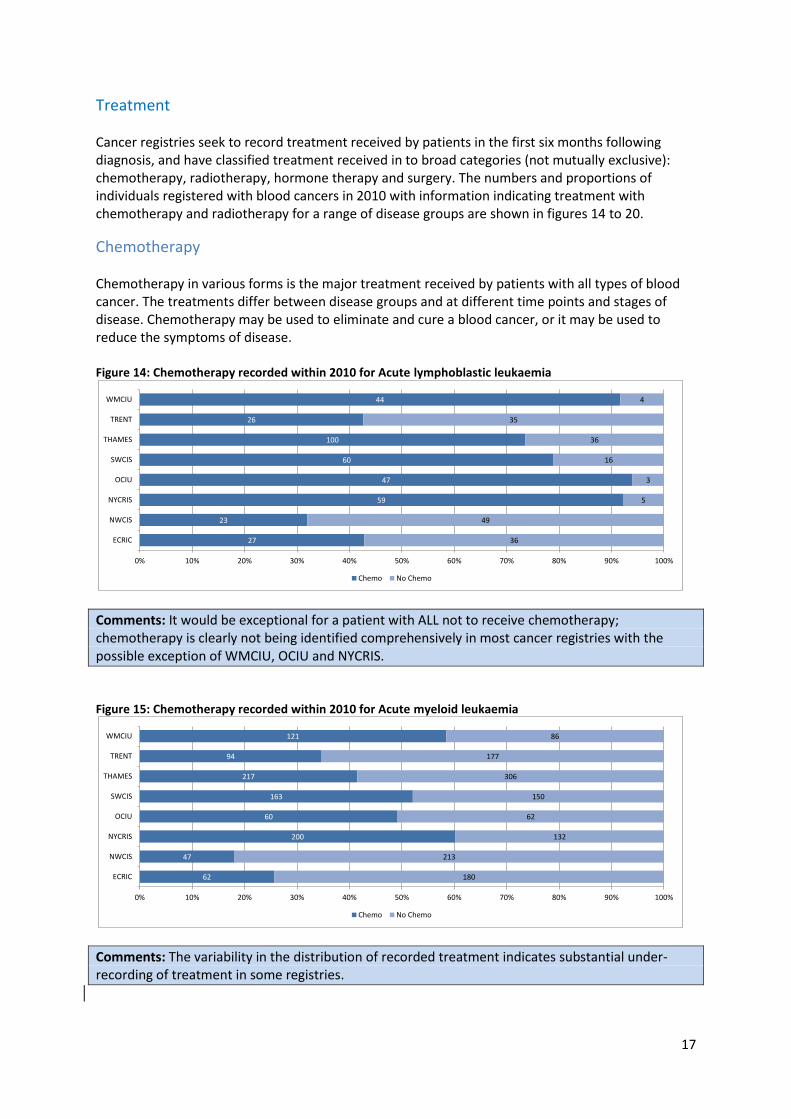
Chemotherapy Chemotherapy in various forms is the major treatment received by patients with all types of blood cancer. The treatments differ between disease groups and at different time points and stages of disease. Chemotherapy may be used to eliminate and cure a blood cancer, or it may be used to reduce the symptoms of disease. Figure 14: Chemotherapy recorded within 2010 for Acute lymphoblastic leukaemia
Comments: It would be exceptional for a patient with ALL not to receive chemotherapy; chemotherapy is clearly not being identified comprehensively in most cancer registries with the possible exception of WMCIU, OCIU and NYCRIS.
Figure 15: Chemotherapy recorded within 2010 for Acute myeloid leukaemia
Comments: The variability in the distribution of recorded treatment indicates substantial under-recording of treatment in some registries.
27
23
59
47
60
100
26
44
36
49
5
3
16
36
35
4
0% 10% 20% 30% 40% 50% 60% 70% 80% 90% 100%
ECRIC
NWCIS
NYCRIS
OCIU
SWCIS
THAMES
TRENT
WMCIU
Chemo No Chemo
62
47
200
60
163
217
94
121
180
213
132
62
150
306
177
86
0% 10% 20% 30% 40% 50% 60% 70% 80% 90% 100%
ECRIC
NWCIS
NYCRIS
OCIU
SWCIS
THAMES
TRENT
WMCIU
Chemo No Chemo
18
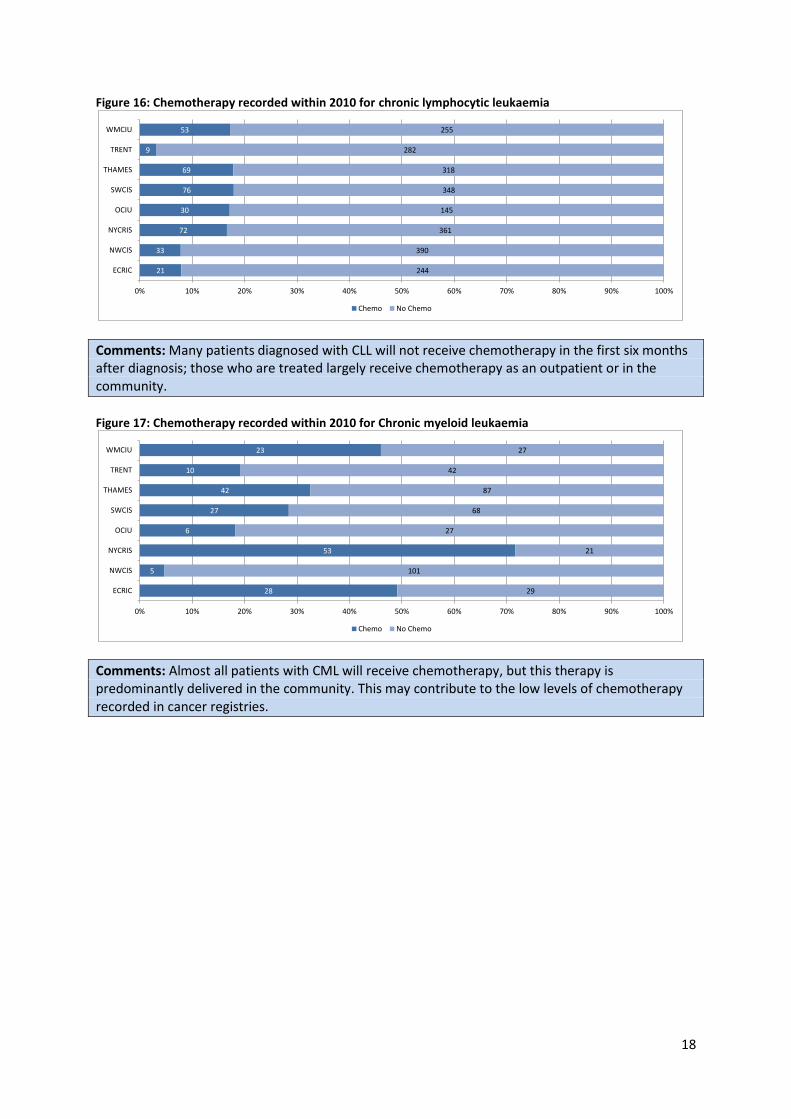
Figure 16: Chemotherapy recorded within 2010 for chronic lymphocytic leukaemia
Comments: Many patients diagnosed with CLL will not receive chemotherapy in the first six months after diagnosis; those who are treated largely receive chemotherapy as an outpatient or in the community.
Figure 17: Chemotherapy recorded within 2010 for Chronic myeloid leukaemia
Comments: Almost all patients with CML will receive chemotherapy, but this therapy is predominantly delivered in the community. This may contribute to the low levels of chemotherapy recorded in cancer registries.
21
33
72
30
76
69
9
53
244
390
361
145
348
318
282
255
0% 10% 20% 30% 40% 50% 60% 70% 80% 90% 100%
ECRIC
NWCIS
NYCRIS
OCIU
SWCIS
THAMES
TRENT
WMCIU
Chemo No Chemo
28
5
53
6
27
42
10
23
29
101
21
27
68
87
42
27
0% 10% 20% 30% 40% 50% 60% 70% 80% 90% 100%
ECRIC
NWCIS
NYCRIS
OCIU
SWCIS
THAMES
TRENT
WMCIU
Chemo No Chemo

19
Figure 18: Chemotherapy recorded within 2010 for Hodgkin lymphoma
Comments: Most patients with Hodgkin lymphoma will receive chemotherapy in the first six months after diagnosis. The variability in the distribution of recorded treatment indicates substantial under-recording of treatment in some registries.
Figure 19: Chemotherapy recorded within 2010 for Non-Hodgkin lymphoma
Comments: The variability in the distribution of recorded treatment indicates substantial under-recording of treatment in some registries.
Figure 20: Chemotherapy recorded within 2010 for Myeloma
Comments: The variability in the distribution of recorded treatment indicates substantial under-recording of treatment in some registries.
69
58
157
74
158
228
41
149
92
162
42
17
44
147
106
12
0% 10% 20% 30% 40% 50% 60% 70% 80% 90% 100%
ECRIC
NWCIS
NYCRIS
OCIU
SWCIS
THAMES
TRENT
WMCIU
Chemo No Chemo
368
241
741
297
925
891
159
579
818
1093
559
221
753
1246
900
482
0% 10% 20% 30% 40% 50% 60% 70% 80% 90% 100%
ECRIC
NWCIS
NYCRIS
OCIU
SWCIS
THAMES
TRENT
WMCIU
Chemo No Chemo
116
50
255
83
296
308
72
195
309
449
224
135
352
531
385
181
0% 10% 20% 30% 40% 50% 60% 70% 80% 90% 100%
ECRIC
NWCIS
NYCRIS
OCIU
SWCIS
THAMES
TRENT
WMCIU
Chemo No Chemo
20
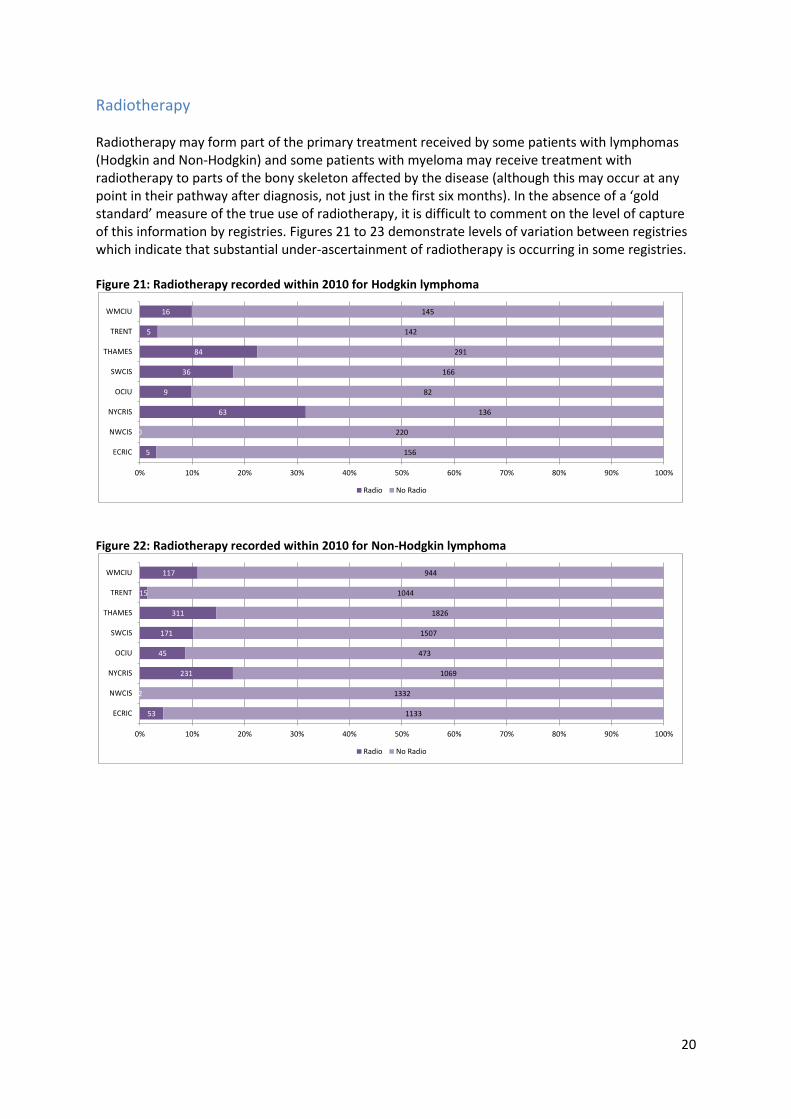
Radiotherapy Radiotherapy may form part of the primary treatment received by some patients with lymphomas (Hodgkin and Non-Hodgkin) and some patients with myeloma may receive treatment with radiotherapy to parts of the bony skeleton affected by the disease (although this may occur at any point in their pathway after diagnosis, not just in the first six months). In the absence of a ‘gold standard’ measure of the true use of radiotherapy, it is difficult to comment on the level of capture of this information by registries. Figures 21 to 23 demonstrate levels of variation between registries which indicate that substantial under-ascertainment of radiotherapy is occurring in some registries. Figure 21: Radiotherapy recorded within 2010 for Hodgkin lymphoma
Figure 22: Radiotherapy recorded within 2010 for Non-Hodgkin lymphoma
5
0
63
9
36
84
5
16
156
220
136
82
166
291
142
145
0% 10% 20% 30% 40% 50% 60% 70% 80% 90% 100%
ECRIC
NWCIS
NYCRIS
OCIU
SWCIS
THAMES
TRENT
WMCIU
Radio No Radio
53
2
231
45
171
311
15
117
1133
1332
1069
473
1507
1826
1044
944
0% 10% 20% 30% 40% 50% 60% 70% 80% 90% 100%
ECRIC
NWCIS
NYCRIS
OCIU
SWCIS
THAMES
TRENT
WMCIU
Radio No Radio
21
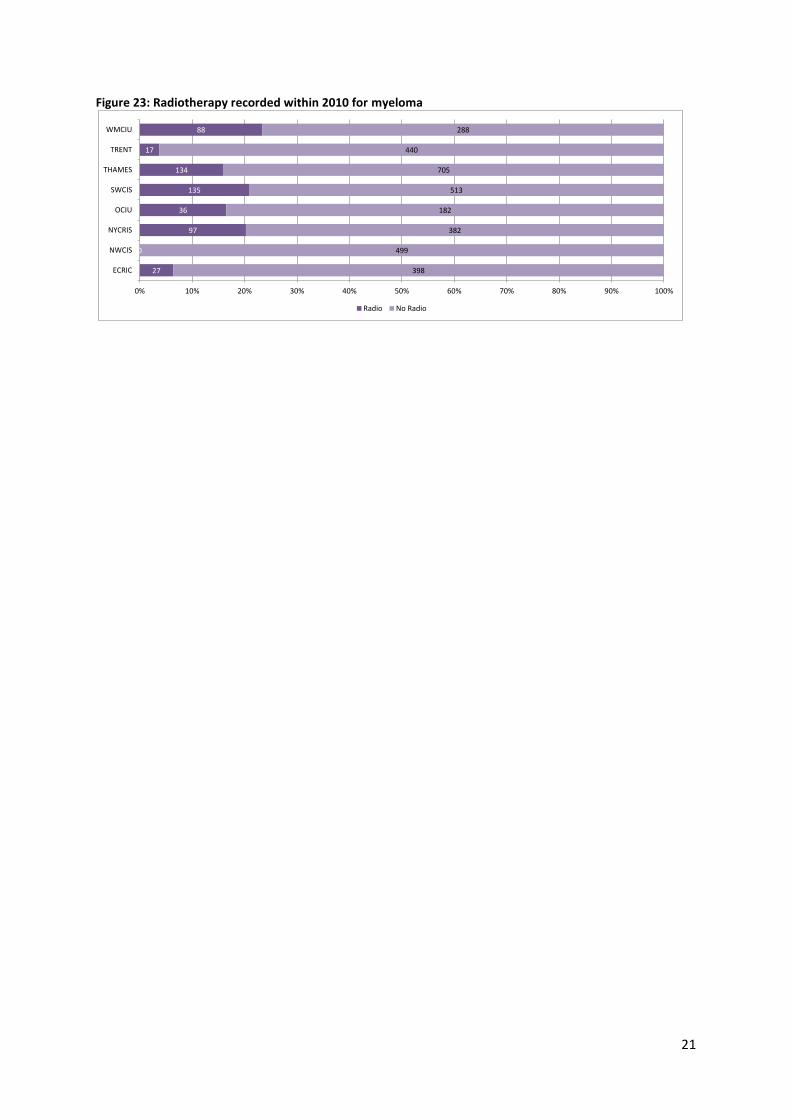
Figure 23: Radiotherapy recorded within 2010 for myeloma
27
0
97
36
135
134
17
88
398
499
382
182
513
705
440
288
0% 10% 20% 30% 40% 50% 60% 70% 80% 90% 100%
ECRIC
NWCIS
NYCRIS
OCIU
SWCIS
THAMES
TRENT
WMCIU
Radio No Radio

22
The National Cancer Intelligence Network (NCIN) is a UK-wide partnership operated by Public Health England. The NCIN coordinates and develops analysis and intelligence to drive improvements in prevention, standards of cancer care and clinical outcomes for cancer patients.