blast vibration monitoring in opencast …ethesis.nitrkl.ac.in/5680/1/110mn0389-11.pdfnational...
TRANSCRIPT

BLAST VIBRATION MONITORING IN
OPENCAST MINES
A THESIS SUBMITTED IN PARTIAL FULFILLMENT OF THE
REQUIREMENTS FOR THE DEGREE OF
BACHELOR OF TECHNOLOGY
IN
MINING ENGINEERING
BY
SHIV SHANKAR KUMAR CHOUDHARY (110MN0389)
&
RAVI RANJAN (110MN0436)
DEPARTMENT OF MINING ENGINEERING
NATIONAL INSTITUTE OF TECHNOLOGY ROURKELA
2013-2014

BLAST VIBRATION MONITORING IN
OPENCAST MINES
A THESIS SUBMITTED IN PARTIAL FULFILLMENT OF THE
REQUIREMENTS FOR THE DEGREE OF
BACHELOR OF TECHNOLOGY
IN
MINING ENGINEERING
BY
SHIV SHANKAR KUMAR CHOUDHARY (110MN0389)
&
RAVI RANJAN (110MN0436)
Under the Guidance of
Prof. B. K. Pal
DEPARTMENT OF MINING ENGINEERING
NATIONAL INSTITUTE OF TECHNOLOGY ROURKELA
2013-2014

National Institute of Technology
Rourkela
CERTIFICATE This is to certify that the thesis entitled, ―Blast Vibration Monitoring in opencast Mines
submitted by Mr. Shiv Shankar Kumar Choudhary and Mr. Ravi Ranjan in partial fulfilment of
the requirement for the award of Bachelor of Technology Degree in Mining Engineering at the
National Institute of Technology, Rourkela (Deemed University) is an authentic work carried out
by him under my supervision and guidance. To the best of my knowledge, the matter embodied in
the thesis has not been submitted to any University/Institute for the award of any Degree or
Diploma.
Date:
Prof. B. K. Pal
Dept. Of Mining Engineering
National Institute of Technology
Rourkela – 769008

ACKNOWLEDGEMENT
The most pleasant point of presenting a thesis is the opportunity to thank those who have
contributed to it. Unfortunately, the list of expressions of thank no matter how extensive is always
incomplete and inadequate. Indeed this page of acknowledgment shall never be able to touch the
horizon of generosity of those who tendered their help to me.
First and foremost, I would like to express my gratitude and indebtedness to Prof B. K.Pal for his
kindness in allowing me to do work in the present topic and for his inspiring guidance, constructive
criticism and valuable suggestion throughout this project work. I am sincerely thankful to him for
his able guidance and pain taking effort in improving my understanding of this project.
An assemblage of this nature could never have been attempted without reference to and inspiration
from the works of others whose details are mentioned in reference section. I acknowledge my
indebtedness to all of them.
And my sincere thanks to all my friends who have patiently extended all sorts of help for
accomplishing this undertaking.
Date:
Shiv Shankar Kumar Choudhary (110MN0389)
Ravi Ranjan(110MN0436)
Dept. of Mining engineering
National Institute of Technology
Rourkela – 769008

INDEX SL.NO TOPIC PAGE
NO
I Abstract I
II List of Tables II
III List of Figures III
CHAPTER-01: INTRODUCTION
1.1 Objective of the Project 3
CHAPTER 03: EXPLOSIVE
2.1 Introduction: 5
2.2 Ammonium Nitrate 5
2.3 Ammonium Nitrate and Fuel Oil 5
2.4 Site Mixed Slurry 5-6
2.5 Emulsion Explosive 6-7
2.6 Choice of explosive depends on the following factors: 7
2.6.1 Strength 8
2.6.2 Velocity of Detonation (VOD) 8
2.6.3 Density 8
2.6.4 Loading Density (LD) 8
2.6.5 Water Resistance 8
2.6.6 Fume Class 8
2.6.7 Temperature 8
2.6.8 Shelf Life 8
2.6.9 Sensitivity 10
2.6.10 Fragmentation and Moving 10
2.6.10 Muck profile 10
CHAPTER 04: BLASTING
3.0 Blasting 12
3.1 Optimum results of blasting of the following parameters is
required:
12
3.2 Mechanism of rock fracturing by blasting 13
3.3 Drilling 14
3.3.1 Classification of Drilling Systems:- 14
3.3.2 Rotary Drilling 14-15
3.4 Drilling pattern 15-16
3.5 Blasting Pattern Followed in Opencast Mines 16
3.5.1 Single row firing pattern 16
3.5.2 Multi Row firing pattern 17
3.5.3 Beside cut pattern other pattern of blasting in multiple row of firing
are as given below
18-19
CHAPTER 02: GROUND VIBRATION
4.1 Blast Vibration 21
4.2 Ground Vibration 21

4.3 Generation of blast vibration 22
4.4 Energy balance 22-23
4.5 Factors Taken into Account during Ground Vibration 23
4.5.2 Natural Frequencies 24
4.5.2 Structural response 24
4.6 Shock wave propagation causing vibration 25
4.6.1 Properties of blasting waves 25
4.6.2 Types of Waves Generated by the Blast 25-28
4.7 Parameters influencing propagation and intensity of ground
vibration
29
4.8 Reduction of ground vibration 29-30
4.9 Predictor equation for ground vibration 30-32
CHAPTER 05: DAMAGE CRITERIA & DGMS REGULATIONS
5.1 Major factors affecting particle velocity of ground vibration 36
CHAPTER 06: BLASTING SEISMOGRAPHS
6.1 Blasting seismographs : 38-39
6.2 Specifications of Minimate Blaster 39-40
6.3 Procedure for Monitoring 41
CHAPTER 07: CASE STUDY
7.1 Blast vibration study at open cast iron mine – a case study 43
7.1.1 Geology of the iron ore area 43
7.1.2 Description of the formation 44-46
7.1.3 Surface Blast Design 46-47
7.1.3 Observations of blast vibration of iron ore mine 47-51
7.2 blast vibration study at open cast coal mine – a case study 52
7.2.1 Geology of coal area 52
7.2.2 Regional Geology 52-53
7.2.3 Geological Structure 53-54
7.2.4 Observation and calculation:- 54-62
CHAPTER 08: CONCLUSION
8.1 Conclusion 64-65
8.2 References 67-68

I
ABSTRACT
In this report the blast vibration monitoring techniques is studied. Ground vibration induced by
blasting practices in mines has become a serious environmental issue in today’s scenario. Various
factors influence the blast vibration being produced from the blasting practices such as the pattern
of blasting, drilling pattern, quality and quantity of explosives being used, delay pattern etc. Also
the vibration which is being generated by the blasting practices is comprised of two types of waves,
body and surface waves. Some of the after blast features are also required to be studied in order to
determine the safe blasting practices. Three types of adverse effects are generally associated with
the blasting practices, Air blast, Fly rock and Ground vibration, However the amplitude, frequency
and duration of the ground vibration is determined by the non-controllable(local geology, rock
characteristic and distances of the structure from blast site) and controllable parameters(Charge
weight, Delay interval, Type of explosive ,Direction of blast progression, Coupling, confinement,
Spatial distribution of charges, Burden, spacing and specification and specific charge). For the
purpose of determination of the safe Charge per Delay a number of researchers have given various
theories and equations. The feasibility of the CMRI equation is studied in this report. Also there
are various equipment’s available globally for measuring the ground vibration and air blast. In the
present study Minimate Blaster specification has been studied in detail. All the blasting operations
were obtained at different- different distances.
According graphs were plotted for the data’s available from the blasting practices and the safe
Charge per Delay and Peak Particle Velocity is determined for the mine in accordance with the
DGMS regulations.

III
LIST OF FIGURES
Figure No. Title Page No
01 Emulsion explosive 06
02 Blast geometry 12
03 After blast fractured rock 13
04 Drilling Pattern 15
05 Sequence of initiation in single row blasting 16
06 Multiple row firing 17
07 Transverse blasting pattern 18
08 Wedge blasting pattern 18
09 Diagonal pattern 19
10 Typical detonation sequence 19
11 Movement of particles by blast induced ground vibration 22
12 Different mode of release of energy from blasting 323
13 Vibration wave from a cratering charge(Bauer 1981) 27
14 Vibration Direction 28
15 (a)Geophone sensor operation (b) A tri-axial geophone 38
16 Parts of seismograph 38
17 Minimate blast mate 40
18 Blast design pattern 47
19 Mine bench face after blasting operation 49
20 After blasting size of coal 55
21 Typical blast vibration data related to blast 57
22 After blasting size of overburden 61

II
LIST OF TABLES
Table no Title Page no
1 Characteristic of SME 7
2 Factors that affect the performance of drill 15
3 Typical P and S Wave velocities of rocks 27
4 Predictor equation by researchers 31
4.1 Predictor equation by researchers 32
5 DGMS Damage criteria vis-à-vis buildings/structures belonging to
the owner/not belongs to owner
34
6 Limiting blasting vibration criteria 35
7 Ground vibration limits(Distance Vs SD) 35
9 Effect of ground vibration on human beings 35
10 Specification of the vibration monitoring equipment –MINIMATE
BLASTER
39
11 Observation of blast vibration for iron ore 48
12 Generalized stratigraphic sequence of Singrauli coalfield 53
13 Observation of blasting data in coal mine 54-55
14 Observation of blast vibration for coal 56
15 Site constant and correlation coefficient from different predictor
equation(coal)
58
16 Observation of blast vibration for overburden 60
17 Site constant and correlation coefficient from different predictor
equation(overburden)
61

1
CHAPTER 01
INTRODUCTION

2
CHAPTER-01: INTRODUCTION
Drilling and blasting combination is still an economical and viable method for rock excavation
and displacement in mining as well as in civil construction works. The adverse effects of
blasting, i.e. ground vibrations, air blasts, fly rocks, back breaks, noises, etc. are not avoidable
and cannot be completely eliminated but certainly minimize up to permissible level to eliminate
damage to the surrounding environment with the present structures . Among all the adverse
effects, ground vibration is a matter of major concern to the planners, designers and
environmentalists. A number of researchers have suggested several methods to lessen the ground
vibration level during the blasting operation. Ground vibration directly depends upon the
quantity of explosive used and distance between blast face to monitoring point as well as
geological and geotechnical conditions of the rock units in excavation area.
Blast induced ground vibration is an influence from the use of explosives that has historically
been a very difficult problem to effectively diminish. Many variables and site constants are
involved in the equation that when get combined, result in the creation of a complex vibration
waveform produced by the confined detonation of an explosive charge. The application of proper
field controls during all steps of the drilling and blasting operation will help to minimize the ill
impacts of ground vibrations, providing a well-designed blast plan that has been engineered. This
design will help in bearing in mind the proper hole diameter and pattern that would reflect the
efficient utilization and distribution of the explosives energy laden into the blast hole. It would
also provide for the appropriate amount of time between adjacent holes in a blast to provide the
explosive the optimal level of energy confinement. When the blast is properly designed, then the
parameters that have the greatest effect on the composition of the ground vibration waveform
are:
• Geology between the blast site and the monitoring location
• Accurate timing between blast holes in a detonation sequence
Geological and geotechnical conditions and distance between blast face to monitoring point
cannot be changed but the only factor, i.e. quantity of explosive can be expected based on certain
empirical formulae anticipated by the different researchers to make ground vibrations in a

3
permissible limit. A suitable and rock friendly blasting can be only alternate for smooth progress
of the rock removal process.
1.1 Objective of the Project
To study the blast vibration which is generated by the surface mine blasting operation and to
predict the equation for the safe explosive charge so that surface structures can be protected from
the impact of the blast vibration.

4
CHAPTER 02
EXPLOSIVE

5
CHAPTER 02: EXPLOSIVE
2.1 Introduction:
Dangerous are chemical mixtures or aggravate that, when subjected to heat, impact or shock are
fit for experiencing a quick decomposition that discharge heat and gasses, which thusly expand
to form high pressures.
Fuels (or sensitizers) + Oxidizers (oxygen source) → Explosive
{Fuel oil (FO), TNT} {Ammonium nitrate (AN),
Sodium nitrate}
Stabilizers such as magnesium and calcium carbonates are also used and sensitizers like metallic
powders are used in explosive mixture. Explosives are classified into three categories:-
I. Low Explosive (LE)
II. High Explosive (HE)
III. Blasting Agent (BA)
2.2 Ammonium Nitrate: It is a very high explosive which is having a good oxidizing and
cooling agent. It is very safe to handle. AN is mixed with a sensitizers (fuel oil or NG or
Trinitrotoluene) so as to form an explosive which is hygroscopic in nature. It has low
temperature of detonation and less Power as compared to NG. It is inexpensive, safe to handle
and gives better fragmentation. Generally Prilled AN of fertilizer grade mixed with diesel oil is
used for larger diameter hole in opencast mines.
2.3 Ammonium Nitrate and Fuel Oil: It is the mixture of prilled AN and fuel oil, at the nearly
oxygen balanced ratio of 94/6 AN/FO. Both the sensitivity and performance depend upon prill
properties. It does not get detonated ideally and its performance properties depend upon charge
diameter and confinement. For dry hole condition it is excellent, and also it should be initiated as
soon as it is loaded. It is initiated by small quantity of O.C.G. or booster.
2.4 Site Mixed Slurry: For blasting on a large scale in an opencast mine these explosives are
used. It involves specially designed pump trucks for transport to the blasting site ingredients
required for SMS system. It is basically consists of a mother support plant where intermediate

6
non-explosive slurry is, initially, prepared for its application. This intermediate slurry
subsequently, is transferred to a 10 ton capacity stainless steel tank.
3.5 Emulsion Explosive: It is a liquid mixture of oxidizer and fuel. With the help of emulsifying
agent an intimate mix of oil and water is possible. Delivery rate of 200-300 kg/min can be
achieved by the Load cells/digital meters. Straight emulsion explosive is considered to have high
bulk strength. Support tankers of 10-12 tones capacity or more which can be used for carrying
Emulsion matrix which is transferred at site thus saving time. It ensures uninterrupted charging.
It is recommended that 500 gm. Pentolite boosters can be used for boosting. Manpower savings
are obtained with less deployment of van drivers or helper, blasting crew and magazine staff.
Full borehole coupling expanded burden/spacing parameters on blasting efficiency. It does not
give explosive pilferage.
Figure No-01: Emulsion explosive

7
Table No-01: characteristics of SME
Site Mix Emulsion Explosive
SL.NO Characteristics Values
1. VOD (m/s) 4500m/s
2 Initial density 1.35g/cc
3 Final density 1.15g/cc
4 Bulk strength 1.37-1.47
5 Water resistance Excellent
6 Specific energy 750-900
7 Wt. strength 1.00-1.05
8 Pumping rate 120kg/min
9 Booster % 0.1-0.2
10 Sleep time 2weeks
2.6 Choice of explosive depends on the following factors:
Choice of Explosive
Strength
Velocity of Detonation
(VOD)
Density
Water Resistance
Fume Class
Temperature
Shelf Life
Sensitivity
Fragmentation and Moving
Muck Profile

8
2.6.1 Strength
This is a measure of amount of energy released by an explosive during blasting and hence its
ability to do useful work. The total energy released from the detonation of explosives includes
both useful energy (energy that causes fragmentation or rocks) and waste energy (ground
vibration, air vibration, light, heat).
2.6.2 Velocity of Detonation (VOD)
It is the rate at which the detonation wave passé through a column of explosive and this is of
consideration importance as the shock energy of detonation increase rapidly with this velocity.
Most of the high explosives, slurry explosives and permitted explosives used in the mines have a
velocity of detonation between 2500-5000mps. For high explosives which is used as boosters
such as Primer VOD is around 7000mps. Velocity of detonation in any borehole can be
calculated by placing a gage inside the borehole. This gage is wired to an oscilloscope that logs
the speed of the detonation wave in the borehole.
The VOD values were highest near the primer and decaying towards the top of the
holes, as the density of the explosive decreased.
2.6.3 Density
The density is important when selecting an explosive for a particular use. With a high density
explosive the energy of the shot is concentrated- a desirable feature in tunneling and mining
operations. On the other hand when the output of lump coal from mine is important, it is
advisable to use a low density explosive, which distributes the energy along the shot hole.
2.6.4 Loading Density (LD)
An explosive loading density is defined as the weight of explosive per unit length of borehole at
a specified diameter of hole.
LD = W/L or LD = 0.3405£D2
Where D is the borehole diameter and L is the length of the charge £ is the explosive density.

9
2.6.5 Water Resistance
The ability of an explosive to withstand exposure to water without either losing power or
becoming desensitized is termed as water resistance explosives. The detonation energy of ANFO
mixtures that have been exposed to water in blast holes is far less than that of such mixtures
placed in dry holes. When blasting is to be performed under wet conditions a gelatinous or slurry
explosive should be used. The higher the nitroglycerine contents of an explosive, the better its
water resistance properties.
2.6.6 Fume Class
Fume class is a measure of amount of toxic gases, primarily CO and NOX, produced by the
detonation of an explosive. Slurry explosive and AN based explosives are preferable to the NG
based explosives. Any factor that may change the chemistry of an explosive during detonation
(such as balance of fuel to oxidizer) has the chance to upset the oxygen balance designed for the
mixture. Such factors include:-
I. Insufficient charge diameter
II. Inadequate priming
III. Improper delay timing
IV. Water deterioration
2.6.7 Temperature
Extremely low temperatures can affect the performance of water- based explosives, the
ingredients of which can solidify and aggregate, thereby reducing the particle surface area
available for reaction. At high temperature, the crystal structure of AN cab be affected.
Temperature fluctuations under this scenario can result in high density stages at which the
explosive may no longer detonate.
2.6.8 Shelf Life
The chemical stability and performance of an explosive change with age. The extent of
instabilities and rate of aging will depend upon the formulation and storage conditions of the
explosives; accordingly. Modern explosives material contains inhibitors and/or stabilizers that
lengthen their shelf life.

10
2.6.9 Sensitivity
The term sensitivity, as it pertains to explosives, has two meaning, the first meaning of the
sensitivity as it relates to explosives refers to various safety aspects and describes the ease with
which an explosive may be detonated or its sensitivity to accidental detonation from shock,
impact, friction, electrostatic discharge and heat. The second meaning has to do with
sensitiveness or an explosive’s ability to propagate. The two tests that are most applicable to
commercial explosives are:-
I. Cap sensitivity
II. Gap sensitivity
2.6.10 Fragmentation and Moving
A proper blast design will yield adequate fragmentation, which will lower downstream costs
related to hauling, equipment maintenance and crushing. Fragmentation distribution can be
determined by running a particle distribution on the muck pile. The general (conservative) thumb
rule is “2 millisecond per foot of burden” for designing delay times required for maximum
fragmentation.
2.6.11 Muck profile
The shape and location of the muck pile is an important element of shot design. Requirements
ranges from a need to extreme throw for example, to cast overburden under a coal- stripping
scenario; to buffer shooting, where the muck pile is confined to a certain area by rock that has
been previously blasted. The confined muck pile provides a high bank shot materials that will
increase shovel productivity. Mines with a high face that use front-end loader will often blast for
a low muck pile for the sake of safety consideration on the ground.

11
CHAPTER 03
BLASTING

12
CHAPTER 04: BLASTING
3.0 Blasting:
The blasting operation must be carried out to provide quality and quantity requirements of
production. The production of a well fragmentation and loosely packed muck pile that has not
been scattered around the excavation area facilitates loading and hauling operations.
Fragmentation characteristics influence mucking productivity, crusher throughput and energy
consumption, plant efficiency, yield and recovery, or the price itself of the end product in the
case of industrial minerals and aggregates. There are controllable parameters and the
uncontrollable parameter to control the fragmentation. Control parameters are types of
explosives, delay time, bench parameter, firing pattern etc. and the uncontrollable parameters are
the properties of rock, properties of explosives etc. The controllable parameters are adjust such
that to get optimum fragmentationThe production of riprap will involve the use of holes with a
spacing greater than the largest block size required.
3.1 Optimum results of blasting of the following parameters is required:
I. Type, weight, distribution of explosive
II. Nature of the rock
III. Bench height
IV. Blast hole diameter
V. Burden
VI. Spacing
VII. Sub-drilling
VIII. Initiation sequence for detonation of
explosive
IX. Powder factor
Figure No: 02: Blast geometry

13
3.2 Mechanism of rock fracturing by blasting
The mechanism by which rock is fractured by blasting is based on the design of blasting patterns,
whether for production. When an explosive is detonated, it is converted within a few thousands
of second into a high temperature and high pressure gas. When confined in blast hole, this rapid
reaction produces pressures, to be exerted against the blast hole wall. This energy is transmitted
into the surrounding rock mass in the form of a compressive strain that travels at a velocity of
2000-6000m/s.
Figure No-03: After-blast fractured rocks

14
3.3 Drilling
Drilling is the process of making a hole into a hard surface where the length of the hole is very large
compared to the diameter and for making holes, for placement of explosives for blasting. The objective of
drilling and blasting is to prepare well-fragmented loose rock amenable to excavation with better
productivity from the excavation machinery. The holes drilled for this purpose are defined as blast hole.
3.3.1 Classification of Drilling Systems:-
Drilling machines used in surface mining projects, construction work, etc., can be classified in
the following ways (Dey, 1995):
1) Depending upon the principle of working
i) Percussive Drilling
ii) Rotary Drilling
iii) Rotary-percussive Drilling
2) Depending upon types of prime mover
i) Used diesel driven drilling machine
ii) Electrically driven drilling machine
3) Depending upon the means of power transmission
i) Pneumatically operated machine
ii) Hydraulically operated machine
iii) Electrically operated machine in combination with hydraulic and pneumatic system.
3.3.2 Rotary Drilling
The boring tools used in this method are rotated and they crush, cut or abrade the rock. The rate of
drilling depends on:-
I. Nature of the rock
II. Pressure exerted by drilling bits and rods
III. The rpm of the bit
IV. Type of drilling bit
The simplest form is the hand augur. These are attached to rods and rotated by means of a simple cross
bar. In this method hollow drill rods of steel or aluminum are used. These are thread connected
and transmit torque and feed pressure to the drilling bit or drilling tool, which is attached at the end of
column of the drill rods. Rotation of the drill rods is through gearing driven by a prime mover at the
surface. The drill bit attacks the rock with energy supplied to it by a rotating drill rod, while a thrust is
applied to it by a pull down mechanism using up to 65% of the weight of the machine, forcing the bit into

15
the rock. As the rods rotate, the drilling tool/bit breaks the rock and the cuttings are cleared by
compressed air down the hole through the hollow drill rods. The air both cools the bit and provides a
medium for flushing the cuttings from the hole. The air, along with the cuttings, comes to the surface
through the space between the drill rods and the sides of the drill hole. The bit moves forward by the
effect of torque and thrust simultaneously applied to the rock surface. The mechanism of penetration rate
are related to shearing and friction processes. The shearing action of the leading edge of the cutting
component produces chipping, whereas friction creates wear of the bit-rock interface. Blast hole sizes
produced by rotary machines vary in the size range of 100 to 445mm diameter with the most
common sizes being 200, 250, 311, and 381mm in diameter. These drills usually operate in the vertical
position although many types can drill up to 25 or 300 off the vertical. To achieve high drilling speeds ,
and to drill holes to greater depths.
Air Pressure: For conventional rotary drilling upto depth of 80 m the air pressure is not very high. 3.5
kg/cm2 may be sufficient. In DTH the penetration rate is proportional to the air pressure in exploratory
drilling pressure up to 24kg/cm2 has been tried. Commonly, used DTH work at 7.5 kg/cm2.
Table No 02: Factors that affect the performance of drill
Type of Drilling Directly Proportional Inversely Proportional
Rotary 1. Thrust
2. Rotary Speed
3. Rock Hardness
1. Bit cutting angle
2. Bit hardness
3. Fluid flow rate
3.4 Drilling pattern: -
Basically three types of drill pattern.
I. Square pattern
II. Rectangular pattern
III. Staggered pattern
Square or Rectangular drilling pattern are used for firing V-cut rounds. The burdens and subsequent rock
displacement are at angle to the original free face either side of the blast round in V-cut. The staggered
drilling pattern is used for row-on-row firing where the holes of one row are fired before the holes in the
row immediately behind them with the burdens developed at a 45-degree angle to the original free face.
Figure No. 04: Drilling pattern

16
Optimum blast hole diameter increases with the height. In general an increase in blast hole
diameter decreases in drilling costs.
3.5 Blasting Pattern Followed in Opencast Mines
Row of the holes may be in single or multiple. So there are mainly two types of blasting pattern
followed in opencast mines. These are
a) Single Row blasting pattern
b) Multiple Row blasting pattern
3.5.1 Single row firing pattern
In single row blasting the fragmentation is low and specific explosive consumption is more than
multi-Row blasting, so multi-Row Blasting pattern is preferred.
In this the following pattern are used
I. The alternative delay pattern (used for softer rocks),
II. Consecutive shot delay pattern (rock with medium hardness),
III. Short delay firing with a cut (used for hard rocks).
Figure No-05: Sequence of initiation in single row blasting

17
3.5.2 Multi Row firing pattern
The Multi Row firing pattern is of mainly five types
I. Square grid in-line initiation (spacing (S) =Effective burden(B).)
II. Square grid ‘V’ pattern (S=B; SE=2.BE).
III. Square grid ‘V1’ pattern (S=B; SE=5.BE).
IV. Staggered grid ‘V’ pattern (S=B; SE=1.25BE).
V. Staggered grid ‘V1’ pattern (S=B; SE=3.25BE).
Figure No-06: Multiple row firing

18
3.5.3 Beside cut pattern other pattern of blasting in multiple row of firing are as given
below :
I. Transverse cut pattern
They are used where smaller width of muck pile is desired.
Figure No-07: Transverse
II. Wedge or Trapezoidal blasting pattern
They are used when the rock are medium hard and hard one. Due to motion in opposite direction
in case the big boulders are broken by supplementary collision.
Figure No-08: Wedge blasting pattern

19
III. Diagonal blasting pattern
With this it is possible to blast the rock towards the least resistance and improve the
fragmentation of rock.
Figure No-09: Diagonal pattern
Figure No-10: Typical detonation sequences (a)square “row-by-row” detonation; (b)
square “V” detonation sequence; (c) hole detonation using both surface and in-hole non-
electric delays (W.Forsyth)

20
CHAPTER 04
GROUND VIBRATION

21
CHAPTER 04: GROUND VIBRATION
4.1 Blast Vibration
It can be defined as the shivering of the ground caused by the elastic wave coming from a blast
and consisting of numerous individual particles which are either body waves or surface waves.
As the body waves reflected or refracted to the surface, become surface waves. Basically these
ground vibration combines for the Ground motion. These waves have effect on buildings and
structures of the surface and around the area of the excavation through compression and tension
and through vertical and horizontal shearing effects.
4.2 Ground Vibration
The movement of any particle in the ground can be described in three ways; displacement,
velocity and acceleration. Velocity transducers (geophones) produce a voltage which is
proportional the velocity of movement, and can be easily measured and recorded. They are
robust and relatively inexpensive and so are most frequently used for monitoring. It has been
shown in many studies, most notably by USBM that it is velocity which is most closely related to
the onset of damage, and so it is velocity which is almost always measured. If necessary, the
velocity recording can be converted to obtain displacement or acceleration. Each trace has a
point where the velocity is a maximum (+ve or -ve) and this is known as the Peak Particle
Velocity (or PPV) which has units of mm/s. Geophones are only able to respond to vibration in
one dimension and so to capture the complete signal it is necessary to have three geophones
arranged orthogonally (at right angles). One will always be vertical and the other two will be
horizontal, but the horizontal geophones can either be aligned with the cardinal points of the
compass or they can be arranged with reference to the blast position. In the latter case, one
geophone would be set along the line from blast to monitor (this is known as the longitudinal or
radial) so that the other would be perpendicular to this line (this is known as the transverse).
4.3 Generation of blast vibration
At the point when an explosive charge detonates, intense dynamic waves are generated around
the impact hole, because of sudden acceleration of the rock mass. The energy freed by the
explosive is transmitted to the rock mass as strain energy. The transmission of the energy

22
happens as the waves. The energy conveyed by these waves crushes the rock, which is the
prompt region of the hole, to a fine powder. The district in which this happens is called shock
zone. The radius of this zone is almost two times the radius of the hole. Past the shock zone, the
energy of the waves gets attenuated to some degree which causes the radial cracking of the rock
mass. The gas produced as a consequence of detonation enters into these cracks and removes the
rock further separated creating its fragmentation. The area in which this sensation happens is
called transition zone. The radius of this zone is twenty to fifty times the radius of the hole. As
an after effect of further weakening occurring in the transition zone, the waves in spite of the fact
that cause era of the cracks to a lesser degree yet they are not in a position to cause the
changeless deformation in the rock mass found outside the transition zone. On the off chance that
these attenuated waves are not reflected from a free face, then they may cause vibrations in the
rock. However in the event that a free face is accessible, the waves reflected from a free face
bring on additional breakage in the rock mass affected by the dynamic tensile stress.
Figure No: 11: movement of particles by blast induced ground vibration
4.4 Energy balance
It is valuable to view the blasting process as an 'Energy Balance' as indicated in the outline
beneath. Basically, the chemical energy of the explosives must be dispersed as fragmentation,
rock development, vibration and air overpressure. Not many rate of an explosive is continuously
used for breakage of rock mass i.e., something like 15 to 20% relying on the blasting technique.
Rest of the most extreme energy of the explosive is waste as vibration and air overpressure i.e.
around 40% in each one case.

23
Figure No: 12: Different mode of release of energy from blasting
As the disturbance passes at a given point an individual particle of the medium is displaced from
its rest position. One can record or measure this particle displacement; alternatively, one may
record the particle velocity or acceleration. Though the three quantities are related, it is not a
simple matter to deduce one from another because the wave is not a simple one. It is required
therefore to measure the quantity that is most merely and generally related to damage.
4.5 Factors Taken into Account during Ground Vibration
Three factors of ground vibrations are taken in account to determine how much effect it has:
ground vibration amplitude (PPV), ground vibration duration, which is not the same as blast
duration and Ground vibration frequency. Duration has importance because the longer ground
vibrations keep on shaking the structure, the greater the amplitude of the structural response. In
addition, studies have shown that human forbearance to vibration reduces the longer the
vibration continues. Generally seismographs report PPV and frequency, but duration often is
ignored. Frequency is considered to be the most important of the three factors of ground
vibration. When a structure is exposed to the ground vibrations near its fundamental frequency,
in that case the structure enlarges the vibrations. Besides these, two more things to be taken into
consideration are:
explosive energy
blast
fragmentation movement vibration airpressure

24
4.5.1 Natural Frequencies
Elements of building construction such as sprung floors, stud partition walls, ceiling and
windows can all react as mass-spring systems; each with its own natural frequencies of about 4-
24 Hz (low frequencies). The risk of damage increases as the Ground vibrations at these
frequencies amplified by the structures. When the low frequency ground vibration and natural
frequency coincides with each other the structure resonance is originated.
The resonance is a state in which the structure absorbs most energy increasingly becoming
deformed with time, until plastic deformation takes place. Therefore even the low peak particle
velocity of ground vibrations at natural frequency of structure is more damaging to the structure.
Natural frequencies of brick and concrete structure generally vary from 8- 16 Hz.
4.5.2 Structural response
Structural response is directly and linearly proportional to ground vibration amplitude. The wall
material and the cracking location have an influence on the particle velocity at which cracking
begins. If the complete structure is not inspected carefully, there may be chances of unfair
opinion on the type of cracks. Thus it is necessary to place the transducer properly for the correct
assessment of damage. When matter of mud houses is considered, numbers of cracks develop
before blasting and these cracks enlarged and extended with the passage of time. As the time
progresses these cracks are further widened and get extended due to blast induced ground
vibrations. Concrete structures vibrate for longer period than the brick and mud structures.
Concrete walls have free top and show no cracks at vibration levels for which mud and brick
walls can damage. Cracks develop in concrete walls with big vibration level. Cracks in brick-
structures can be detected in junction of walls, roof and at window corners. Brick walls with clay
mortar and cement sand mortar act in same manner. Steel structures have more capability that
can withstand more vibration level. The magnitude of the vibration on the structures is much
more compared to the magnitude of the vibration on ground. Duration of vibration in structure is
also longer than, that of ground vibration. Multistoried buildings are more sensitive to blast
vibration than that of the single-storied buildings.

25
4.6 Shock wave propagation causing vibration
4.6.1 Properties of blasting waves
At the instant spot of an explosion the disruption takes the form of a single pulse, whose peak
amplitude and duration depend on the properties of the medium and the properties and size of the
explosive charge. The resulting elastic wave generally has a strong initial build-up, which is
followed by an irregular series of oscillations.
4.6.2 Types of Waves Generated by the Blast
As an explosive is detonated in borehole, energy is transferred into the surrounding rock as a
result of the generated shock and gas pressures. Initially it is found that the pressure of the shock
wave is higher than that of the compressive strength of the rock and the rock which is present
around the borehole is crushed. However the shock pressure declines quickly to the values below
the compressive strength. At this stage it is noticed that the shock travels inside the rock without
breaking it in compression. Rock failure is a result of tension through the tensile component of
the shock wave or when the tensile wave is reflected back as a tensile wave at the media
boundaries. As the distance progresses the shock waves attenuates into an elastic wave. In this
case it is observed that the stresses make the particles of the rock to oscillate about their rest
positions as a spring-mass system. There is no huge movement or transport of matter during the
time of wave motion. The initial shock front applies a force to the rock in such a way that it will
compress it and reduce its volume which is causing a wave similar to a sound wave. Its property
is that which compresses and expands the rock by particle vibration along the direction of
propagation.
There are two types of wave
1. Body wave
2. Surface wave
•Compression or P waves
•Shear or S wavesBody Waves
•Love waves
•Rayleigh wavesSurface Waves

26
Body wave: it is the seismic wave which travels through the interior of the earth rather than
across the surface of the earth. Body waves usually have smaller amplitude and shorter
wavelength.
P wave (Compression and Tension Waves): This wave type is basically termed
compressional, dilatational, longitudinal or primary and is usually designated by the letter
P (P-wave).
S wave: It is another type of wave which is generated by the initial pressure pulse and the
later P wave which is intermingling with discontinuities in the rock is the S-wave. Such
type of wave is generated when the medium particles oscillate perpendicular to the
direction of propagation. Sometimes it is referred to as shear, transverse or secondary
wave.
Surface wave: Introduction of one or more boundaries across which there are differences in
elastic properties can cause the introduction of other types of waves. Surface of the earth is
considered to be the most significant boundary. There exist two basic surface waves. These
waves are basically guided by the surface and are characterized by an exponential decrease in
particle oscillation amplitude with the increasing distance from the boundary and by the
propagation of the wave from along the boundary. Raleigh waves and the Love waves are the
two fundamental surface waves.
Raleigh wave: The Raleigh wave causes the surface particles to describe an elliptical
counter clockwise orbit. These waves always exist in the vertical radial plane and have no
transverse component
Q wave: The Love wave (Q-wave) is characterized by the particle vibration of the shear
type and only in the horizontal transverse direction. These waves are confined to a
shallow surface zone.
27
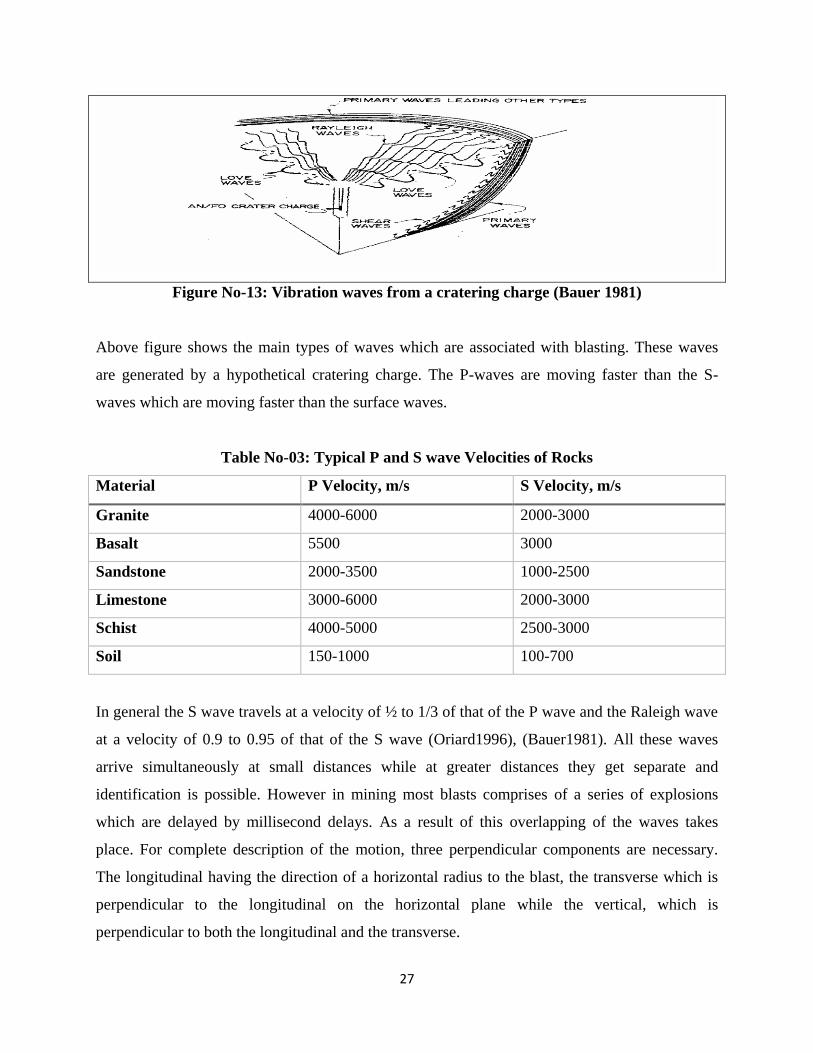
Figure No-13: Vibration waves from a cratering charge (Bauer 1981)
Above figure shows the main types of waves which are associated with blasting. These waves
are generated by a hypothetical cratering charge. The P-waves are moving faster than the S-
waves which are moving faster than the surface waves.
Table No-03: Typical P and S wave Velocities of Rocks
Material P Velocity, m/s S Velocity, m/s
Granite 4000-6000 2000-3000
Basalt 5500 3000
Sandstone 2000-3500 1000-2500
Limestone 3000-6000 2000-3000
Schist 4000-5000 2500-3000
Soil 150-1000 100-700
In general the S wave travels at a velocity of ½ to 1/3 of that of the P wave and the Raleigh wave
at a velocity of 0.9 to 0.95 of that of the S wave (Oriard1996), (Bauer1981). All these waves
arrive simultaneously at small distances while at greater distances they get separate and
identification is possible. However in mining most blasts comprises of a series of explosions
which are delayed by millisecond delays. As a result of this overlapping of the waves takes
place. For complete description of the motion, three perpendicular components are necessary.
The longitudinal having the direction of a horizontal radius to the blast, the transverse which is
perpendicular to the longitudinal on the horizontal plane while the vertical, which is
perpendicular to both the longitudinal and the transverse.

28
Ground vibration direction
:
Figure No: 14 Vibration direction
Peak particle velocity
Movements of the particles takes place as the seismic waves travel through the rock. This is
commonly termed as the vibration. Particle’s motion (vibration) occurs in three dimensions
which are vertical, radial and transverse. During the vibration each particle has a velocity and the
maximum velocity which is referred to as the peak particle velocity (PPV). Use of a seismograph
can be usually used for capturing this motion and the maximum velocities of all three directions
are given. The reading of the peak particle velocity is practiced by most as the standard for
measuring the intensity of the ground vibration. In the case of reporting, the maximum
measurement of any of the three components is used rather than the resultant vector of all three
components combined. In most of the cases the PPV is closely linked to the potential to damage
structures rather than the acceleration or displacement of the rock. For measuring this peak
vibration a standard unit is used which is either inches per second or millimeters per second (1.0
isp = 25.4mm/s). Peak particle velocities are also affected by the transmission and reflection of
vibration waves. In the case of two equal compression waves colliding, the stresses will add and
double. As they pass, they will resume their initial form and continue. In that case where two
opposite waves (compression and tension) collide, then the stresses will cancel one another and
continue on and resume their initial form.

29
4.7 Parameters influencing propagation and intensity of ground vibration
The parameters, which exhibit control on the amplitude, frequency and duration of the control
vibration, are divided in two groups as follows:
A. Non-controllable parameters
B. Controllable parameters
The Non-controllable parameters are those, over which the blasting engineer does not have any
control. The local geology, rock characteristic and distances of the structure from blast site is
non-controllable parameters. However, the control on the ground vibrations can be established
with the help of controllable parameters. The same have been reproduced below:
1. Charge weight
2. Delay interval
3. Type of explosive
4. Direction of blast progression
5. Coupling
6. confinement
7. Spatial distribution of charges
8. Burden, spacing and specification
and specific charge
4.8 Reduction of ground vibration
So as to protect a structure, it is necessary to diminish the ground vibrations from the blast. The
techniques which are acceptable for reduction and control of vibrations are:
A. Reduce the charge per delay; this is the most important measure for the purpose.
charge per delay can be controlled by :
I. Reducing the hole depth
II. Using small diameter holes
III. Delay initiation of deck charge in the blast holes
IV. Using more numbers of delay detonators series
V. Using sequential blasting machine
B. Reduce explosive confinement by:
I. Reducing excessive burden and spacing
II. Removing buffers in front of the holes
III. Reducing stemming but not to the degree pf increasing air blast and fly rock

30
IV. Reducing sub-grade drilling
V. Allowing at least one free face
VI. Using decoupled charges
VII. Drilling holes parallel to bench face
VIII. Accuracy in drilling
C. Limit the explosive confinement to bedrock if the overburden can be excavated by other
means.
D. Square patterns produce more vibration
E. Limit frequency of blasting
F. Time the blasts with high ambient noise levels
G. Use controlled blasting techniques
H. Use a low VOD and low density explosive
4.9 Predictor equation for ground vibration
Extensive research has been conducted to determine the mathematical relationship between
vibration level, charge size and distance. The relationship is known as the Propagation Law,
developed in the U.S Bureau of Mines Bulletin 656
V = H [D/Wα] β
Where,
1. V = Predicted particle velocity (in/s)
2. W = Maximum explosive charge weight per delay (lbs.)
3. D = Distance from shot to sensor measured in 100’s of feet (e.g. for distance of 500
feet, D = 5)
4. H = Particle velocity intercept
5. α = Charge weight exponent
6. β = Slope factor exponent
The values of α, β and H are determined by condition in the area, rock type, local geology,
thickness of overburden and other factors. The waves emanating from the blast holes can
cause damages to structures nearby to the mining areas. Thus a number of Blast Monitoring
Techniques have been advised based on the number of approaches devised by researchers.
Some of the approaches for the blast vibration monitoring are listed below in table
31
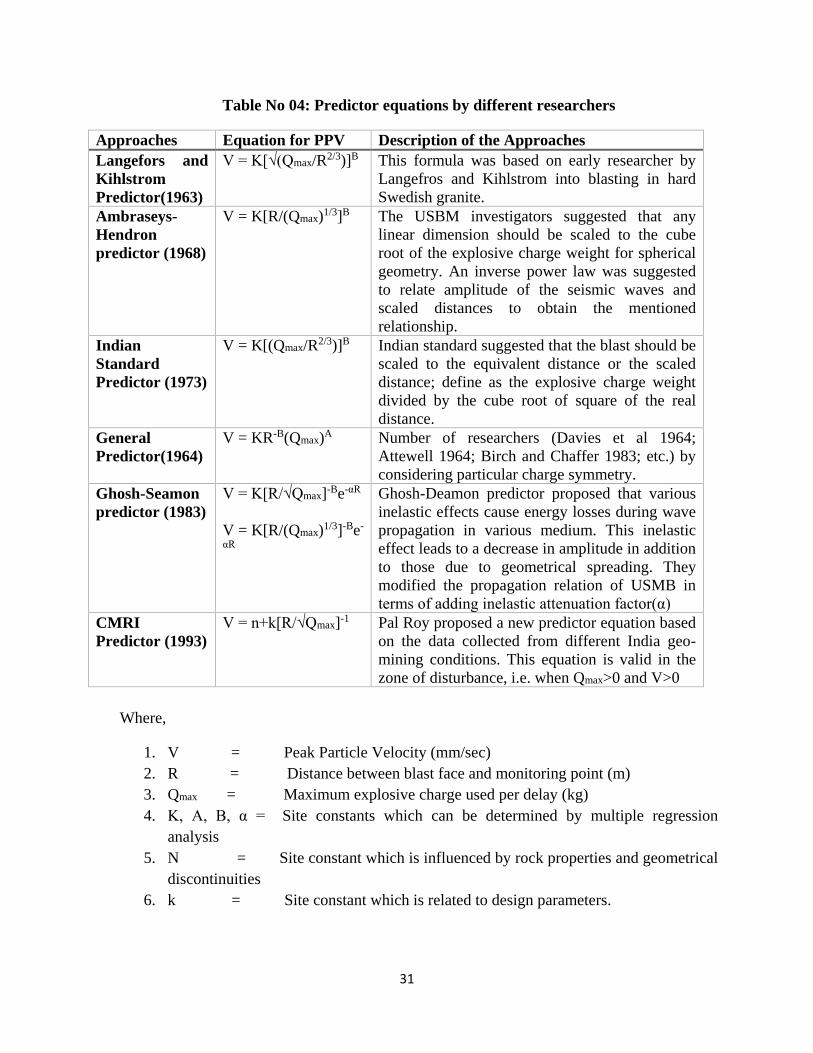
Table No 04: Predictor equations by different researchers
Approaches Equation for PPV Description of the Approaches
Langefors and
Kihlstrom
Predictor(1963)
V = K[√(Qmax/R2/3)]B This formula was based on early researcher by
Langefros and Kihlstrom into blasting in hard
Swedish granite.
Ambraseys-
Hendron
predictor (1968)
V = K[R/(Qmax)1/3]B The USBM investigators suggested that any
linear dimension should be scaled to the cube
root of the explosive charge weight for spherical
geometry. An inverse power law was suggested
to relate amplitude of the seismic waves and
scaled distances to obtain the mentioned
relationship.
Indian
Standard
Predictor (1973)
V = K[(Qmax/R2/3)]B Indian standard suggested that the blast should be
scaled to the equivalent distance or the scaled
distance; define as the explosive charge weight
divided by the cube root of square of the real
distance.
General
Predictor(1964)
V = KR-B(Qmax)A Number of researchers (Davies et al 1964;
Attewell 1964; Birch and Chaffer 1983; etc.) by
considering particular charge symmetry.
Ghosh-Seamon
predictor (1983)
V = K[R/√Qmax]-Be-αR
V = K[R/(Qmax)1/3]-Be-
αR
Ghosh-Deamon predictor proposed that various
inelastic effects cause energy losses during wave
propagation in various medium. This inelastic
effect leads to a decrease in amplitude in addition
to those due to geometrical spreading. They
modified the propagation relation of USMB in
terms of adding inelastic attenuation factor(α)
CMRI
Predictor (1993)
V = n+k[R/√Qmax]-1 Pal Roy proposed a new predictor equation based
on the data collected from different India geo-
mining conditions. This equation is valid in the
zone of disturbance, i.e. when Qmax>0 and V>0
Where,
1. V = Peak Particle Velocity (mm/sec)
2. R = Distance between blast face and monitoring point (m)
3. Qmax = Maximum explosive charge used per delay (kg)
4. K, A, B, α = Site constants which can be determined by multiple regression
analysis
5. N = Site constant which is influenced by rock properties and geometrical
discontinuities
6. k = Site constant which is related to design parameters.

32
Table No. 4.1 Predictor equations by different researchers
SL.No. Approach Equation
01 Gupta et al (1988) PPV= K [D/√W]-β e-α(D/W)
02 P pal roy 1993 PPV =α + K (Q1/2/D)-1
03 Temrock (1995) PPV = K (Q/R3/2)0.5
04 Ju & Vonppaisal (1996) PPV = BDI*(σcm/4)/d.c
05 Belgin et al PPV =(D/√W)α Bβ
06 (Ali kahriman 2004) PPV = K*(SD)-β
07 Rai et al (2005) Q= K[PPV*R2]B
08 Hossaini and sen,2004,2006 PPV= K.Ra.Qb
Q= charge per delay, PPV= peak particle velocity, R, D = Distance, K,B, a, b, β = site constant
Gupta et al. [1988] suggested the following equation. Here, the expression e-α(D/W)represents the
inelastic attenuation factor.
Ju and Vongpaisal (1996) suggested the following equation. Here, the BDI= blast damage
indicator, σcm = the compressive strength of the rock mass, d= the mass density of the rock, c =
the propagation speed of the seismic disturbance.
In Belgin et al suggested the following equation. Here, the B= burden, W= maximum charge per
delay, D= distance
Ali kahriman 2004 suggested the following equation. Here, the K, β = influence of blast design
and geology (). SD= R/Wd0.5 SD= scaled distance, R distance, Wd= maximum charge per
delay

33
CHAPTER 05
DGMS REGULATIONS
34
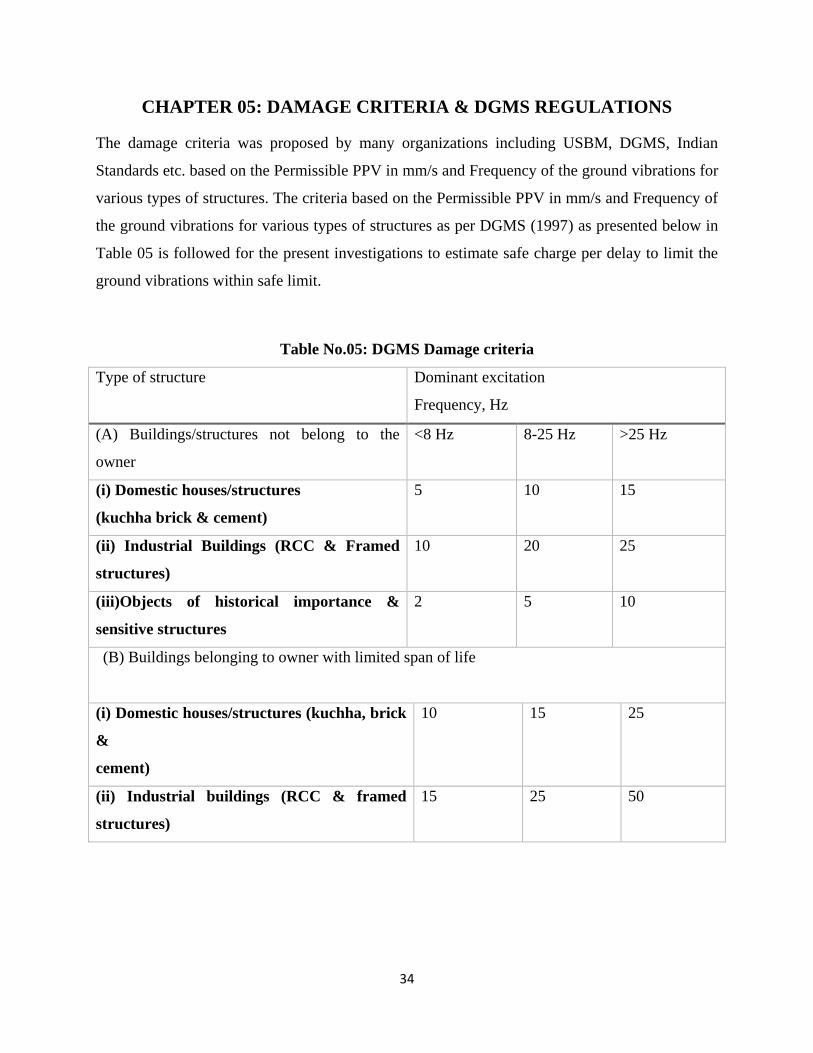
CHAPTER 05: DAMAGE CRITERIA & DGMS REGULATIONS
The damage criteria was proposed by many organizations including USBM, DGMS, Indian
Standards etc. based on the Permissible PPV in mm/s and Frequency of the ground vibrations for
various types of structures. The criteria based on the Permissible PPV in mm/s and Frequency of
the ground vibrations for various types of structures as per DGMS (1997) as presented below in
Table 05 is followed for the present investigations to estimate safe charge per delay to limit the
ground vibrations within safe limit.
Table No.05: DGMS Damage criteria
Type of structure Dominant excitation
Frequency, Hz
(A) Buildings/structures not belong to the
owner
<8 Hz 8-25 Hz >25 Hz
(i) Domestic houses/structures
(kuchha brick & cement)
5 10 15
(ii) Industrial Buildings (RCC & Framed
structures)
10 20 25
(iii)Objects of historical importance &
sensitive structures
2 5 10
(B) Buildings belonging to owner with limited span of life
(i) Domestic houses/structures (kuchha, brick
&
cement)
10 15 25
(ii) Industrial buildings (RCC & framed
structures)
15 25 50
35
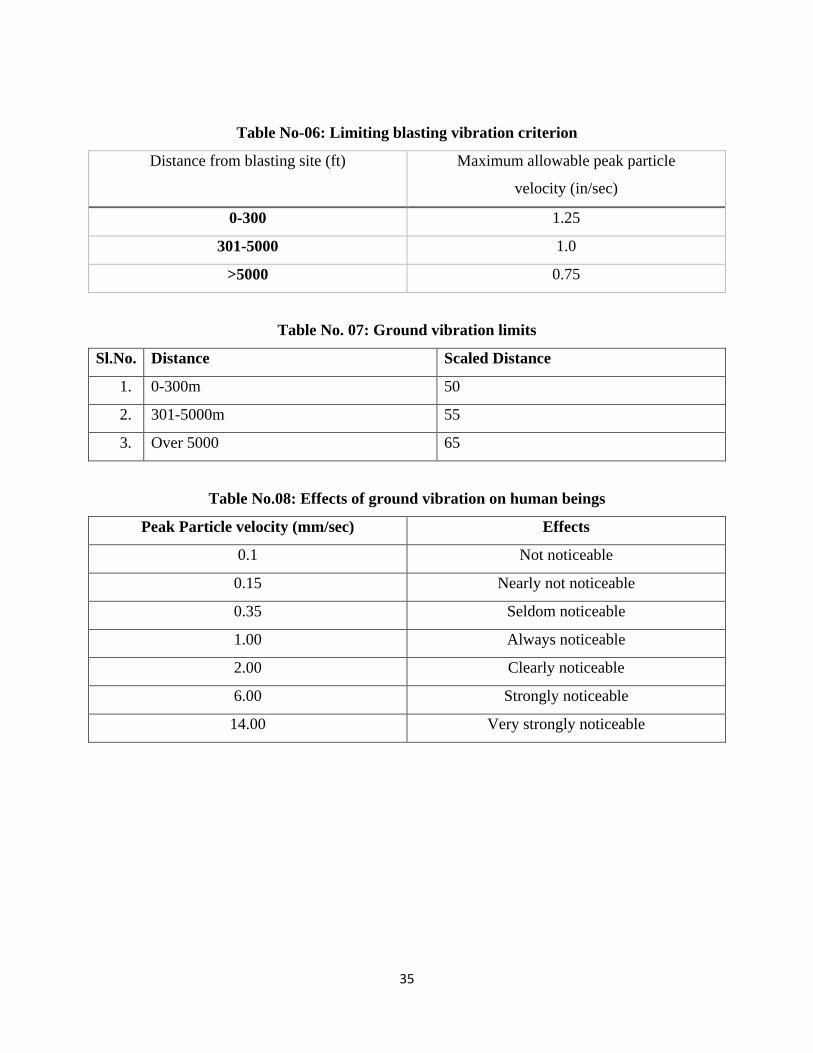
Table No-06: Limiting blasting vibration criterion
Distance from blasting site (ft) Maximum allowable peak particle
velocity (in/sec)
0-300 1.25
301-5000 1.0
>5000 0.75
Table No. 07: Ground vibration limits
Sl.No. Distance Scaled Distance
1. 0-300m 50
2. 301-5000m 55
3. Over 5000 65
Table No.08: Effects of ground vibration on human beings
Peak Particle velocity (mm/sec) Effects
0.1 Not noticeable
0.15 Nearly not noticeable
0.35 Seldom noticeable
1.00 Always noticeable
2.00 Clearly noticeable
6.00 Strongly noticeable
14.00 Very strongly noticeable

36
5.1 Major factors affecting particle velocity of ground vibration
Type and amount of explosive charge used.
Distance from the charge to the point of observation (surface structures).
Eological, structural and physical properties of the rock that transmits the vibrations.
Height of structures and blast geometry.
Delay-timing variations
Blasting technology
Site geology.
Parameters of waves propagating at a site.

37
CHAPTER 06
BLASTING SEISMOGRAPHS
38
CHAPTER 06: BLASTING SEISMOGRAPHS
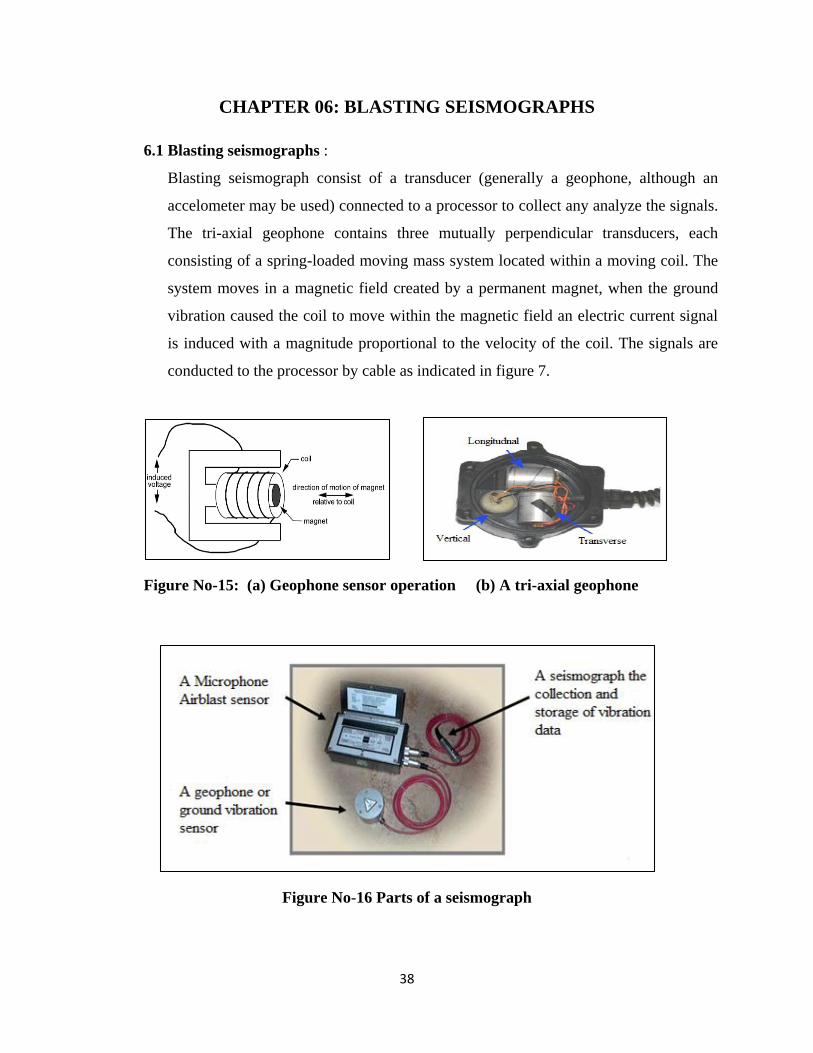
6.1 Blasting seismographs :
Blasting seismograph consist of a transducer (generally a geophone, although an
accelometer may be used) connected to a processor to collect any analyze the signals.
The tri-axial geophone contains three mutually perpendicular transducers, each
consisting of a spring-loaded moving mass system located within a moving coil. The
system moves in a magnetic field created by a permanent magnet, when the ground
vibration caused the coil to move within the magnetic field an electric current signal
is induced with a magnitude proportional to the velocity of the coil. The signals are
conducted to the processor by cable as indicated in figure 7.
Figure No-15: (a) Geophone sensor operation (b) A tri-axial geophone
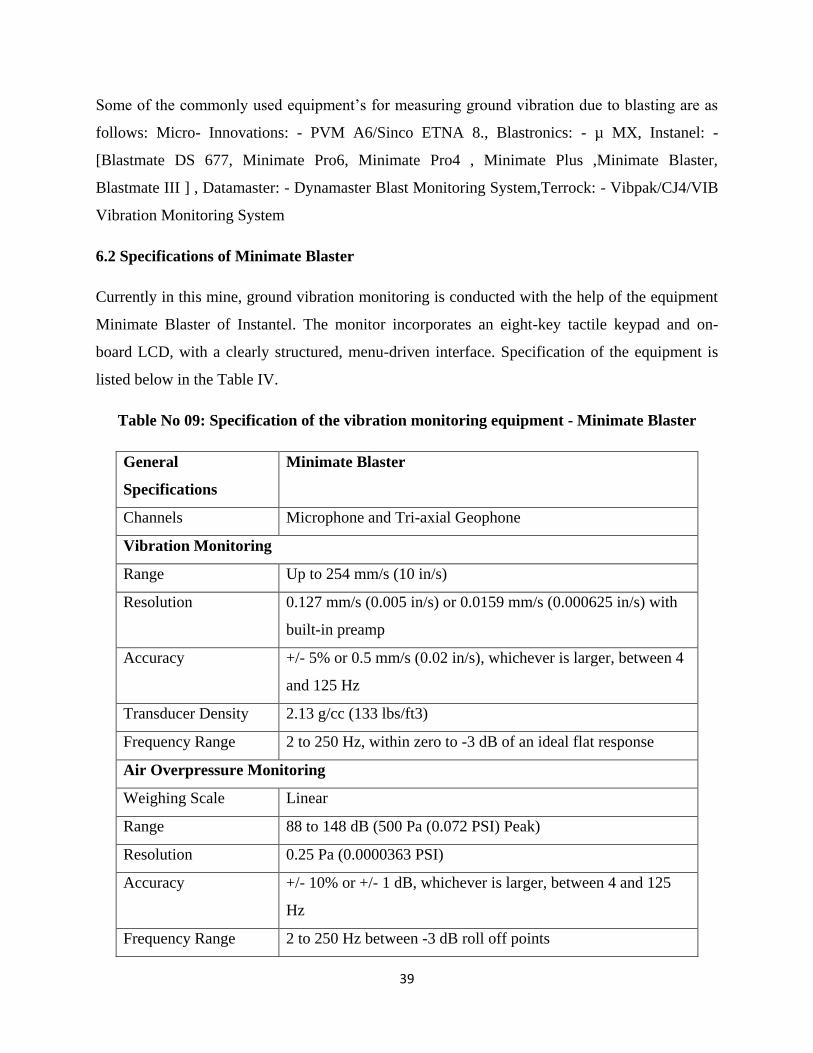
Figure No-16 Parts of a seismograph
39
Some of the commonly used equipment’s for measuring ground vibration due to blasting are as
follows: Micro- Innovations: - PVM A6/Sinco ETNA 8., Blastronics: - µ MX, Instanel: -
[Blastmate DS 677, Minimate Pro6, Minimate Pro4 , Minimate Plus ,Minimate Blaster,
Blastmate III ] , Datamaster: - Dynamaster Blast Monitoring System,Terrock: - Vibpak/CJ4/VIB
Vibration Monitoring System
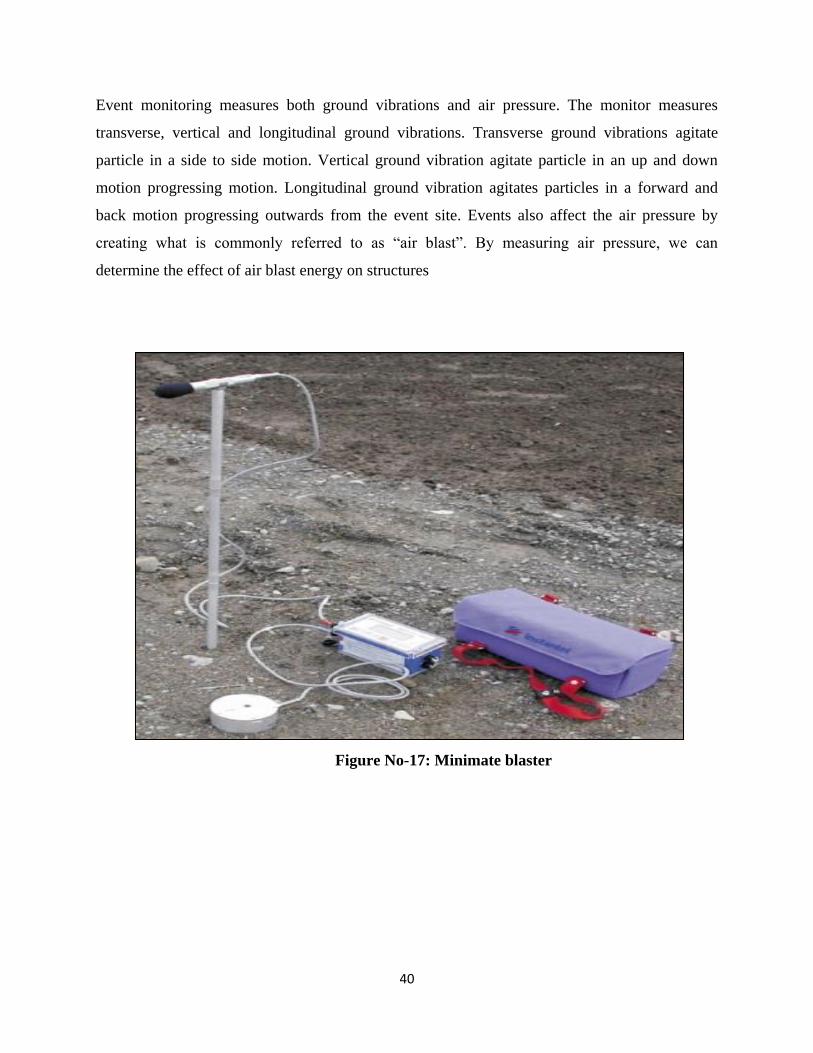
6.2 Specifications of Minimate Blaster
Currently in this mine, ground vibration monitoring is conducted with the help of the equipment
Minimate Blaster of Instantel. The monitor incorporates an eight-key tactile keypad and on-
board LCD, with a clearly structured, menu-driven interface. Specification of the equipment is
listed below in the Table IV.
Table No 09: Specification of the vibration monitoring equipment - Minimate Blaster
General
Specifications
Minimate Blaster
Channels Microphone and Tri-axial Geophone
Vibration Monitoring
Range Up to 254 mm/s (10 in/s)
Resolution 0.127 mm/s (0.005 in/s) or 0.0159 mm/s (0.000625 in/s) with
built-in preamp
Accuracy +/- 5% or 0.5 mm/s (0.02 in/s), whichever is larger, between 4
and 125 Hz
Transducer Density 2.13 g/cc (133 lbs/ft3)
Frequency Range 2 to 250 Hz, within zero to -3 dB of an ideal flat response
Air Overpressure Monitoring
Weighing Scale Linear
Range 88 to 148 dB (500 Pa (0.072 PSI) Peak)
Resolution 0.25 Pa (0.0000363 PSI)
Accuracy +/- 10% or +/- 1 dB, whichever is larger, between 4 and 125
Hz
Frequency Range 2 to 250 Hz between -3 dB roll off points
40
Event monitoring measures both ground vibrations and air pressure. The monitor measures
transverse, vertical and longitudinal ground vibrations. Transverse ground vibrations agitate
particle in a side to side motion. Vertical ground vibration agitate particle in an up and down
motion progressing motion. Longitudinal ground vibration agitates particles in a forward and
back motion progressing outwards from the event site. Events also affect the air pressure by
creating what is commonly referred to as “air blast”. By measuring air pressure, we can
determine the effect of air blast energy on structures
Figure No-17: Minimate blaster

41
6.3 Procedure for Monitoring
8.Turn the Minimate Blaster OFF
We are finished with the Minimate Blaster functioning, so we can turn it off, Just press cancel key to return to main window and then press hold the Enter key until the display disappears.
7.View the Events
We can view the events we have just recorded. From the main window, press the Up Arrow key to display the view event window.
6.Record Events
Now we can record the events, for this just press the Start Monitor key to begin monitoring.
5.Change the Minimate Blaster Setups
We can change the record mode, choose the trigger source, set the trigger level and choose a recording stop mode from various options available in the system of Minimate Blaster.
4.Review Setups
Before we begin, we can review the current Minimate Blaster setups. To review the setups, press the option key and the Test key together.
3.Check your installation
We can check our installation by pressing the Test key. This executes the sensor check program and tests the transducer and microphone.
2.Turn the Minimate Blaster On
Press and hold the enter key, located on the Minimate Blaster face panel, until you hear an audible beep.
1.Install the Minimate Blaster
Unpack the Minimate Blaster then attach the spikes to transducer and then place the transducer pointing in the direction of the event. Connect the microphone.

42
CHAPTER 07
CASE STUDY

43
CHAPTER 07: CASE STUDY
7.1 BLAST VIBRATION STUDY AT OPEN CAST IRON MINE – A CASE STUDY
7.1.1 Geology of the iron ore area
The iron ore deposits of the region belong to iron ore series of Dharwar age. The main rock types
of this series are shaley quartzite, banded hematite jasper and iron ore. Laterite occurs at places
as capping on the ore body and on shales. The stratigraphic succession on the areas is mentioned
below:-
Newer dolerite dyke & sills
Ultra basic igneous intrusion
Granite rocks
Shales with epidiorite & volcanic ash beds
BHJ with iron ore bodies
Shales with thin calcerous and sandstone bands
Limestone at places
Purple sandstone with basal conglomerate
Hornblend Mica Schists and Quartzites
Upper Shale, Tuffaceous ferruginious shale usually with fine lamination; contains a few
manganiferrous shale band. Banded Hematite Jasper,with thin intercalations of tuffaceous shale
and with supergene enrichment to Iron ore bodies. Lower Shale, which is tuffaceous along the
Eastern flank and slaty in the west Mafic Lavas (local).
The iron ore bodies generally occupy the top portion of the hills and are elongated in the north-
south direction. Structurally the area appears to be the eastern limb of an overturned syncline
whose western limb is overturned and falls outside the lease area. Eastern limb has a strike
variation between NE-SW to NNE-SSW and dip inclination varying between 160- 500 due
northwest to west. Lateritisation is also more towards eastern flank than the eastern flank.
Because of the structural features, ore seems to be concentrating more and more towards west in
depth. Minor structural features such as folds, joints and fissures are also present.

44
7.1.2 Description of the formation
The Iron ore body in the lease area can be considered to be having two ore zones, one to the west
of Bonaikora and another to the east. The western ore zone is mainly composed of laminated soft
ore with isolated patches of hard ore. The eastern ore zone has scattered float soft ore with
isolated patches of hard ore. The eastern ore zone has scattered float ore over a considerable
portion with patchy out crops of hard ore at the cliff sections.
The general agreement for the origin of iron ore is that it was formed due to continuous leaching
and replacement of BHJ and shale by the action of meteoric water which has percolated through
joint and fissures. The principal types of ores and waste found in this area are classified into
following names:-
Lateritic ore/Soft ore
Hard Ore
Friable & laky Ore
Blue dust and Powdery Ore (High concentration of Fe, but more friable)
BHJ and Shale
Laterite
Hard Ore: - It is a steel grey coloured, fine grained massive and homogeneous variety of iron
ore. The ore is bedded in nature having parallel and alternate bands of primary and secondary
hematite. The general range of variation of quality of hard ore is:-
Fe% - 64.50-68.50
SiO2% - 0.50-2.00
Al2O3 - 0.50-3.00
Soft Ore: - This type of ore is soft, spongy and laminated, often porous, due to which it has
undergone intense lateritisation within weaker zones. All the enriched laterities and geothites
belong to this category.
Fe% - 59.00-65.00

45
SiO2% - 1.70-5.00
Al2O3% - 2.50-7.00
Friable and Flaky Ore:- It is brownish to steel grey coloured ore enclosing flakes or hematite
containing sufficient secondary goethite as cementing material along bedding planes in addition
to kaolinious and shaly material safely preserving the original texture of parent BHJ. Most of
friable ore bands can easily be dug from a fresh working face because of its friable nature. The
general range of variation of quality of Flaky ore is:-
Fe% - 62.50 – 65.00
SiO2% - 0.80 – 4.00
Al2O3% - 0.70 – 4.00
Blue Dust: - It occurs as natural fines, often underlying Flaky and Friable ore containing
powdery hematite. It occurs at lower horizons of ore body. The general range of variation of
quality of Blue dust is:-
Fe% - 64.50 – 68.00
SiO2% - 1.00 – 3.50
Al2O3% - 0.80 – 3.00
Laterite: - Laterite occurs as a capping of iron ore and it is product of lateritisation of iron ore. It
is porous and spongy in nature and constitutes mainly of goethite (iron hydroxide). The laterite
capping varies in thickness from 2 – 20 m. The general variation of quality is:-
Fe% - 26.00 – 50.00
SiO2% - 2.00 – 37.00
Al2O3% - 7.00 – 33.00
BHJ and Shale: - It shows an even parallel arrangement of alternative hematite and Jasper bands
which taper lenticular along the bedding plane and often grade into friable flaky ore or blue dust.

46
Unbanded variety of BHJ also exists in nature which is very hard compact massive and fine
grained and contains only Jasper with disseminated hematite. This variety often grade laterally
into shaly type. Shales of various colours are also found in the area, but are usually confined to
lower levels of the eastern and southern escarpment, this form the base of the ore whose profile
is undulating.
7.1.3 Surface Blast Design
The primary objectives in rock blasting are to optimize blast performance and to ensure the
safety of everyone by implementing safe practices in and around the blast site. And the
secondary objectives include maintaining the stability of high walls so that men and equipment
working on and under them are safe, Fragmenting rock masses to reduce their downstream
hauling and crushing cost and to move rock masses to facilitate their load-out by site specific
equipment.
A proper blast design will yield adequate fragmentation, which will lower downstream costs
related to hauling, equipment maintenance and crushing. The shape and location of the muck pile
is an important element of shot design. Requirements range from a need for extreme throw.
Controlled blasting techniques are used to efficiently distribute explosive charges in rock mas,
thereby minimizing the fracturing of rock beyond the crest-line of the high wall or designed
boundary of main excavation areas. Such fracturing is basically called as over break. Here in
mines over break is not a big problem and it varies from face to face depending upon the
explosive used and bench configuration. Some of the methods used for preventing over break are
namely- Presplitting, Smoot blasting, Line drilling and Cushion blasting.

47
Figure No-18: Blast design pattern
7.1.4 Observations and calculation of blast vibration of iron ore mine
Values are recorded for different blasting site in which peak particle velocity, frequency is
measured through monitoring device and distance of the monitoring site form the blasting site is
also recorded. Accordingly charge per delay (Qmax) is calculated and for the various
observations:

48
Table No-10: observation of blast vibration for iron ore
Sl.
No.
Peak Vector Sum
(mm/sec)
Frequency
(Hz)
Holes
(Nos)
Qmax
(charge/delay)
Distance
(m)
√Qmax [D/√Q] Ln[D/√Q] Ln PPV
1 1.10mm/s at 0.034sec 13 76 242 215 15.5563 13.82 2.626 0.0953
2 3.30mm/s at 3.162sec 7 40 176 177 13.2665 13.34 2.5907 1.1939
3 3.14mm/s at 0.545sec 9 33 244 208 15.62049 13.36 2.5922 1.1442
4 0.651mm/s at0.006sec 8 42 165 212 12.84523 16.50 2.8033 -0.4292
5 1.33mm/s at 0.748sec 9 42 193 179 13.89244 12.88 2.5556 0.2851
6 0.603mm/s at 0.001sec 13 47 188 225 13.71130 16.40 2.7972 -0.5058
7 1.62mm/ at 1.929sec 10 36 239 226 15.45962 14.62 2.6823 0.4824
8 4.49mm/s at 0.731sec 4 63 171 178 13.07669 13.61 2.6108 1.5018
9 5.91mm/s at 0.458sec 7 48 166 196 12.88409 15.21 2.7219 1.7766
10 1.11mm/sec at 0.960sec 7 55 192 211 13.85640 15.23 2.7232 0.1043
11 1.44mm/s at 0.739sec 13 30 235 226 15.32971 14.74 2.6905 0.3646
12 2.59mm/s at 0.552 sec 8 27 156 176 12.48999 14.09 2.6454 0.9516
13 2.11mm/s at 0.581 sec 9 23 159 178 12.60952 14.12 2.6475 0.7466
14 3.24mm/s at 0.535 sec 7 40 223 229 14.93318 16.11 2.7794 1.17557
15 1.10mm/s at 0.319 sec 9 42 202 203 14.21267 14.28 2.6588 0.0953
16 1.24mm/s at 0.339 sec 8 58 250 213 15.81138 13.47 2.6004 0.2151
17 4.45mm/s at 0.339 sec 12 37 268 189 16.37071 11.54 2.4458 1.4929
18 1.6mm/s at 1.002 sec 12 40 265 175 16.27882 10.75 2.3749 0.4700
19 1.06 mm/s at 0.551 sec 11 42 243 219 15.58845 14.04 2.6419 0.05826
20 2.13 mm/s at 0.757 sec 13 121 191 205 13.82027 14.83 2.6966 0.7561
21 3.43 mm/s at 0.240 sec 7 38 233 199 15.26433 13.04 2.568 1.2325
22 1.71 mm/s at 0.420 sec 11 50 187 212 13.67479 15.50 2.7408 0.5364
23 4.18 mm/s at 0.850 sec 8 140 247 187 15.71623 11.90 2.4765 1.4303
24 3.71 mm/s at 0.320 sec 5 69 158 206 12.56981 16.39 2.7966 1.3110
25 3.10 mm/s at 0.631 sec 13 131 249 203 15.77973 12.86 2.5541 1.1314

49
In the present study analysis of the blast vibration data recorded for various blasts has been done
in order to find out the most suitable mathematical model that represent the given mine
condition, so that to predict the impact of future blasting operations on the nearby structures. The
fundamental equation used in the present study is produced below: -
Vm = k [D/√Qmax] α
Figure No. 19 mine bench face after blasting operation
So this X-Y relation for the straight line is solved via Regression Analysis method and the values
of the slope and constant (intercept on the Y axis) is find out and which eventually will give us
the values of the site constants.
Where,
1. Vm = Peak Particle Velocity
2. k, α = Site constants
3. D = Distance from the monitoring site to the blasting site
50
4. Qmax = Charge per delay in kg.
5. (D/√Qmax) = Scaled distance
For the fundamental equation taking log both side, we get:-
Ln ( Vm ) = Ln k+α*Ln ( D/√Qmax )
Now comparing the equation with the fundamental equation of a straight line, we get
Y = m*X + c
Where,
1. Y = Ln ( Vm )
2. X = Ln ( D/√Qmax )
3. c = Ln k
4. m = α
Thus the equation for the measured blasting data’s obtained via regression analysis is found out
to be:-
Y = 5.4399 – 1.7931X
Now comparing the equation with the general predictor equation then,
Ln k = 5.4399 ; k = Antilog (5.4399)
k = 230.419140 ; m = (- 1.7931)
So the predictor equation becomes:-
Vm = 230.4191[D/√Qmax]-1.7931

51
52
7.2 BLAST VIBRATION STUDY AT OPEN CAST COAL MINE – A CASE STUDY
7.2.1 Geology of coal area
Singrauli coalfield which is covering an area of 2202 Sq Km and is mainly located in the
Singrauli district of Madhya Pradesh except for 80 Sq Km which falls in the Sonebhadra district
of Uttar Pradesh. The Kachni River divides the coalfield into two parts viz. the major western
and southern part. The north-eastern part covers an area of 312 Sq Km and contains thick
quarriable coal seams making it the highest potential area of the coalfield and at present the
entire coal production of Singrauli Coalfield of around 58 Mt. is being mined out from this area.
7.2.2 Regional Geology
About 96% of the Singrauli coalfield occurs in the state of Madhya Pradesh, in the
Sidhi/Singrauli districts. The remainder (4%) of the coal field comes under Sonebhadra District,
Uttar Pradesh. The coalfield is aligned in East-West direction and is elongated in shape. The
length is around 102 Km and maximum width is about 45 Km in the central part of the coalfield.
A total of 6 series of formation have been recognized on broad lithic characteristics within the
Gondowna rocks of Singrauli Coalfield (after GSI). In ascending order they are Talchirs,
Barakar, Barren Measure, Raniganj, Panchet and Mahadeva. The coalfield is broadly divided in
two parts, the eastern most part of the coalfield and the western part. The beds have an almost
north-south strike in the east as well as in the west which gradually swings to east–west strike in
the southern part revealing a half basin whose northern part is cut by a prominent E-W trending
boundary fault. The Talchirs occupy the lower plains and the Barakars stand out as high plateau
with steep escarpment. The Barren Measures and Raniganj Formations occur as crescent shaped
outcrops around Jhingurdah Project in the north. The Precambrian basement on which the
Gondowna sediments rest with a profound unconformity, comprises Gneisses and Schists in the
south, while Phyllites and Quartzites are also observed on the north. The oldest sediments of
Gondowna group are the Talchirs, which unconformably lies over the basement and a large part
of it is submerged under Rihand Reservoir. The Barakar sediments cover a large tract in the
eastern part of the coalfield and define prominent landmarks because of the hard and compact

53
nature of the strata. The Barakar sequence mainly consists of medium to coarse grained
sandstones with a number of coal horizons and thin bands of shale and clay. Fine grained
sandstones are also observed but their proportion is much less than coarse grained sandstone.
The generalized stratigraphic sequence of Sigrauli Coalfield is as follows in below table:
Table No-11: Generalized stratigraphic sequence of Sigrauli Coalfield
7.2.3 Geological Structure
In the present mining block consisting of two blocks Block I and Block II, the southern part
which mainly comes in Block II is structurally distributed whereas the northern part of the Block
I is free from geological disturbances. There are altogether 11 faults in the southern part of which
six have continued from adjoining Block III. The beds have an almost E-W strike in the eastern
part which swings NW-SE in the southern part and gradually becomes almost N-S in the
northern part. The synclinal axis passes roughly in NE-SW direction. The dips are northerly,
north-easterly and easterly in relation to swings in strike. The undisturbed northern property has
Age Group Formation Lithology Thickness(m)
Cretaceous Intrusive Dolerite dykes and sills. Not Estimated.
Upper Triassic Upper
Gondwana
Mahadeva Coarse grained, ferruginous
sandstone with bands of shale,
clay and conglomerate.
Not Estimated.
Lower Triassic Lower
Gondwana
Panchet White, greenish white and
pink micaceous, medium to
coarse grained sandstone with
red beds, greenish brown silty
shales and conglomerates.
Not Estimated.
Upper Permian Raniganj Fine grained sandstone and
shales with coal seams.
215-403
Middle Permian Barren
Measures
Very coarse grained to
ferruginous sandstones,
green clay and shales
125-300
Lower Permian Barakars Medium to coarse grained
sandstone, shales, clays and
coal seams
325-600
Upper
Carboniferous
Talchir Tillite, Sandstones,
Siltstones, needle shales.
75-130
Unconformity
Precambrians Phyllites, Quartzites,
Schists and Gneisses

54
gentle dips of about 2° to 3°. In the southern part the gradient in general is steeper than northern
part. In the remaining part of the southern property the gradient generally varies from 3° to 5°
7.2.4 Observation and calculation:-
Table No-12: observation of blasting data in coal mine
BLAST NO. 1 2 3 4 5 6 7 8 9
Parameters
Location of blast 490 385 CO
AL
O/S 385 370 370 450 385
Spacing (mts) 10 11 7 5.5 11 9 9 10 10
Burden (mtrs) 9 9 6 4.5 9 8 8.5 9 9
Average Depth
(mtrs)
16 23 10 6 23 15 16 23 16
Average Depth
(mtrs) Excluding
subgrade
14.40 20.70 9.00 5.40 20.70 13.50 14.40 20.70 14.40
Total no. of holes
(nos.)
184 32 100 136 56 124 32 67 113
Dia. of hole (mm) 259 259 259 159 259 259 159 259 259
Name of SME Shakti-
Bulk10
1
Shakt
i-
Bulk
101
Sha
kti-
Bul
k10
1
Shakt
i-
Bulk
101
Shakt
i-
Bulk
101
Shakti
-
Bulk1
01
Shakti
-
Bulk1
01
Shakti
-
Bulk1
02
Shakti
-
Bulk1
01
Total quantity of
SME (kgs)
111,590 30,24
0
11,9
90
8,100 53,20
0
55,64
0
15,57
0
55,59
0
68,31
0
Total cast booster
(kgs)
172.5 56.3 25.0 34.0 84.3 93.0 24.0 84.5 125.0
Total quantityof
Explosive (kgs)
111,763 30,29
6
12,0
15
8,134 53,28
4
55,73
3
15,59
4
55,67
5
68,43
5
Decks/hole Nil Nil Nil Nil Nil Nil Nil Nil Nil
Total quantity of
D/F (mtrs)
9100 2500 320
0
2500 2750 5200 1700 3300 5350
Total quantityof
E.D. (nos.)
1 1 1 1 1 1 1 1 1
Total quantity of
C/R (nos.)
43 38 20 40 24 126 46 48 100
Charge/ hole (kgs) 606.47 945.0
0
119.
90
59.56 950.0
0
448.7
1
486.5
6
829.7
0
604.5
1
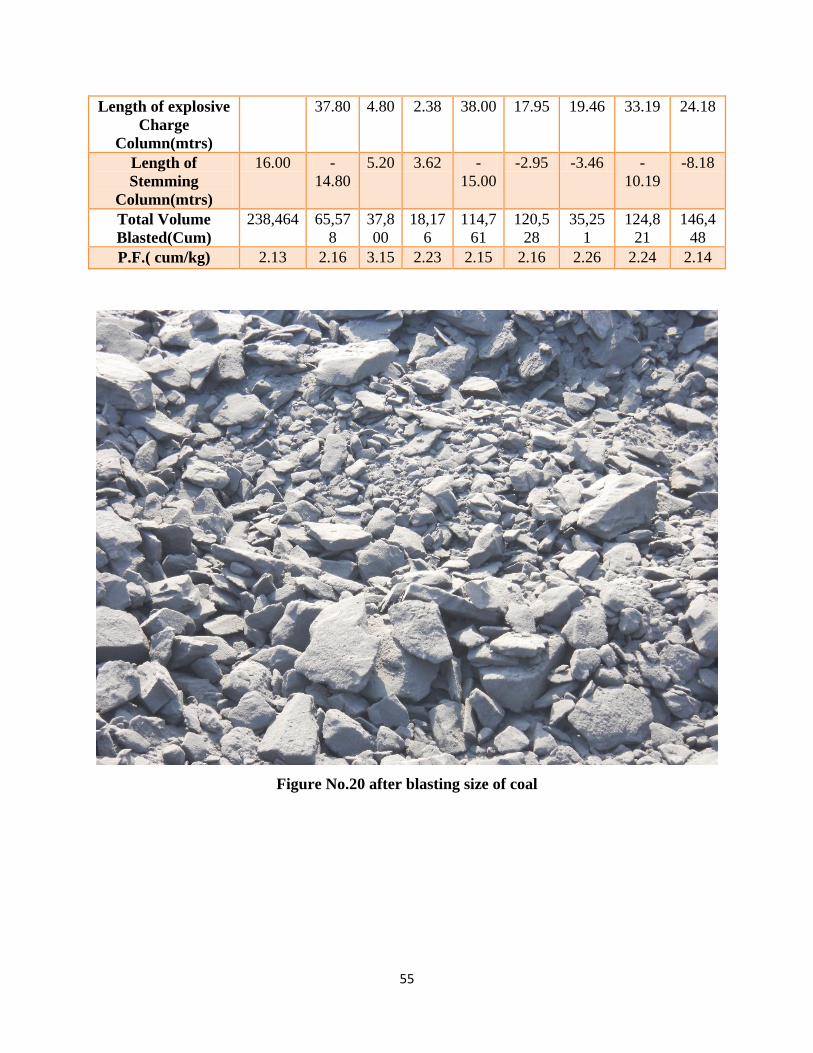
55
Length of explosive
Charge
Column(mtrs)
37.80 4.80 2.38 38.00 17.95 19.46 33.19 24.18
Length of
Stemming
Column(mtrs)
16.00 -
14.80
5.20 3.62 -
15.00
-2.95 -3.46 -
10.19
-8.18
Total Volume
Blasted(Cum)
238,464 65,57
8
37,8
00
18,17
6
114,7
61
120,5
28
35,25
1
124,8
21
146,4
48
P.F.( cum/kg) 2.13 2.16 3.15 2.23 2.15 2.16 2.26 2.24 2.14
Figure No.20 after blasting size of coal
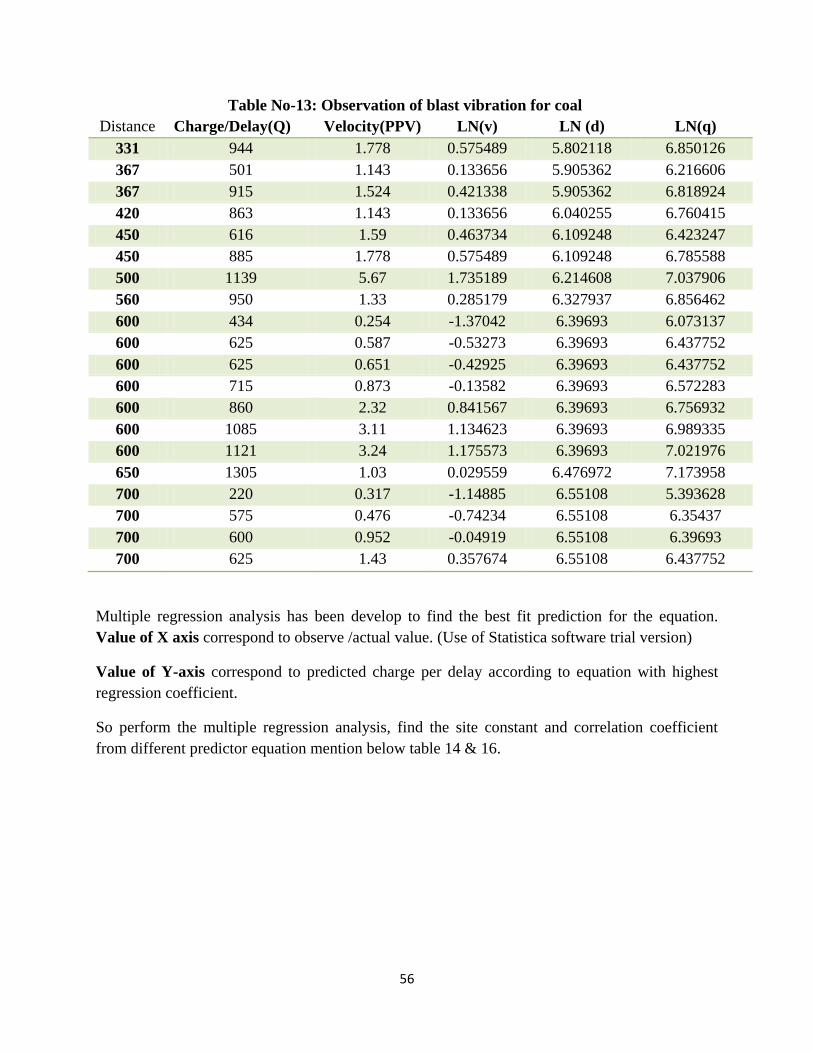
56
Table No-13: Observation of blast vibration for coal
Distance Charge/Delay(Q) Velocity(PPV) LN(v) LN (d) LN(q)
331 944 1.778 0.575489 5.802118 6.850126
367 501 1.143 0.133656 5.905362 6.216606
367 915 1.524 0.421338 5.905362 6.818924
420 863 1.143 0.133656 6.040255 6.760415
450 616 1.59 0.463734 6.109248 6.423247
450 885 1.778 0.575489 6.109248 6.785588
500 1139 5.67 1.735189 6.214608 7.037906
560 950 1.33 0.285179 6.327937 6.856462
600 434 0.254 -1.37042 6.39693 6.073137
600 625 0.587 -0.53273 6.39693 6.437752
600 625 0.651 -0.42925 6.39693 6.437752
600 715 0.873 -0.13582 6.39693 6.572283
600 860 2.32 0.841567 6.39693 6.756932
600 1085 3.11 1.134623 6.39693 6.989335
600 1121 3.24 1.175573 6.39693 7.021976
650 1305 1.03 0.029559 6.476972 7.173958
700 220 0.317 -1.14885 6.55108 5.393628
700 575 0.476 -0.74234 6.55108 6.35437
700 600 0.952 -0.04919 6.55108 6.39693
700 625 1.43 0.357674 6.55108 6.437752
Multiple regression analysis has been develop to find the best fit prediction for the equation.
Value of X axis correspond to observe /actual value. (Use of Statistica software trial version)
Value of Y-axis correspond to predicted charge per delay according to equation with highest
regression coefficient.
So perform the multiple regression analysis, find the site constant and correlation coefficient
from different predictor equation mention below table 14 & 16.

57
Figure No: 21; a typical blast vibration data related to the blast

58
Table No-14: Site constants and correlation coefficient from different predictor
equations (coal)
Equations k B A n R(correlation
coefficient)
Langefors and
Kihlstrom
Predictor(1963)
5.51 1.273 - - 0.67
Ambraseys- Hendron
predictor (1968)
24.26 -0.6485 - - 0.35
Indian Standard
Predictor (1973)
0.152 0.994 - - 0.69
General Predictor(1964) 0.779 0.058 0.779 - 0.63
CMRI Predictor (1993) 20.65 - - 0.85 0.58
Langefors and Kihlstrom Predictor (1963) Ambraseys- Hendron predictor (1968)

59
Indian Standard Predictor (1973) General Predictor (1964)
CMRI Predictor (1993)

60
Table No-15: Observation of Blast vibration for overburden
Distance(D) Charge/Delay(Q) Velocity(PPV) lnV lnQ lnD
500 2620 2.13 0.756122 7.87093 6.214608
500 3066 2.71 0.996949 8.028129 6.214608
500 4253 3.73 1.316408 8.355453 6.214608
500 4923 3.84 1.345472 8.501673 6.214608
560 1615 1.62 0.482426 7.38709 6.327937
600 975 1.71 0.536493 6.882437 6.39693
600 2840 2.29 0.828552 7.951559 6.39693
600 3644 2.75 1.011601 8.200837 6.39693
600 4445 3.05 1.115142 8.399535 6.39693
650 1391 1.9 0.641854 7.237778 6.476972
700 2004 0.254 -1.37042 7.6029 6.55108
700 2080 1.7 0.530628 7.640123 6.55108
700 2100 2.57 0.943906 7.649693 6.55108
700 2260 2.64 0.970779 7.72312 6.55108
700 3120 2.92 1.071584 8.045588 6.55108
700 3720 3.08 1.12493 8.221479 6.55108
750 1613 2.54 0.932164 7.385851 6.620073
750 1680 2.67 0.982078 7.426549 6.620073
750 3259 2.85 1.047319 8.089176 6.620073
800 2170 0.937 -0.06507 7.682482 6.684612
800 2580 1.46 0.378436 7.855545 6.684612
800 2954 1.97 0.678034 7.990915 6.684612
800 2980 2.16 0.770108 7.999679 6.684612
850 2459 2.41 0.879627 7.80751 6.745236
850 3320 3.24 1.175573 8.10772 6.745236
875 600 2.17 0.774727 6.39693 6.774224
875 2305 3.18 1.156881 7.742836 6.774224
900 3125 2.86 1.050822 8.04719 6.802395
980 2765 3.56 1.269761 7.924796 6.887553
1000 2268 1.73 0.548121 7.726654 6.907755
1000 2555 2.41 0.879627 7.845808 6.907755
1000 3300 2.92 1.071584 8.101678 6.907755
1210 3445 2.92 1.071584 8.144534 7.098376
1265 3185 1.14 0.131028 8.066208 7.142827

61
Figure No-22: After blasting size of overburden
Table No-16: Site constants and correlation coefficient from different predictor equations
(o/b)
Equations k B A n R(correlation
coefficient)
Langefors and Kihlstrom
Predictor(1963)
2.635 0.349 - - 0.47
Ambraseys- Hendron
predictor (1968)
11.66 -0.4148 - - 0.23
Indian Standard Predictor
(1973)
0.632 0.367 - - 0.36
General Predictor(1964) 1.217 0.08 0.178 - 0.64
CMRI Predictor (1993) 20.65 - - 0.85 0.37

62
Langefors and Kihlstrom Predictor(1963) Ambraseys- Hendron predictor (1968)
Indian Standard Predictor (1973) General Predictor (1964)
CMRI Predictor (1993)

63
CHAPTER 08
CONCLUSION

64
CHAPTER 08: CONCLUSION
8.1 Conclusion:
Analysis of the blast vibration data of the Peak Particle Velocities (PPVs) for various blasts was
recorded. It was found that for the different blast PPV varies and it is related to that of the charge
per delay. In most of the blasting operation PPV is found to be within the limits. It is possible
because of the use of different amounts of charge per delay for each blast. In this project,
vibrations generating from the blasting practices and how it will affect the nearby structure is
studied. According to the DGMS circulars the safe PPV for industrial buildings under the
frequency range of 8 to 25 Hz is 20mm/sec. In the present study the measured PPV and
frequency matches this configurations, in which industrial building such as Plant and crusher will
have no adverse impacts. A safe charge per delay is determined in accordance with the
regulations issued by the regulatory authority DGMS (Director General of Mine Safety),
Government of India.
So determination of specific amounts of charge per delay should be done for a blast hole to keep
PPV within the limits as stated by the DGMS when an explosive is detonated.
The vibration levels were found to be less than 5 mm/sec which is within the limits, when
following equations were used for finding safe charge during blasting.
The Equation is –
Case study 1: For Iron ore mine:
PPV = 230.4191[D/√Qmax]-1.7931

65
Case study 02: For coal mine:
The mine overburden comprises of sandstone, lime, etc. and below it lies coal. So two equation
are predicted separately. Now equation with highest correlation coefficient from the table 13 &
15, for coal & overburden can be stated as:
For coal:
PPV = 0.152[Q/D (2/3)] 0.994 with r2 =0.69
For overburden:
PPV = 1.217*D0.08 *Q0.178 with r2 =0.64
However, we can conclude that when specific amount of charge per delay is decided so as to
keep the PPV within the limits as stated by the DGMS during the blasting, with this we have
other advantages like maximum safety with optimum fragmentation and higher blasting
Efficiency causing lower ground vibration.

66
8.2 REFERNCES
1. ISRM. 1992, Suggested method for blast vibration monitoring. Int J Rock Mech Min Sci
Geomech Abstr; 29(2):145–6.
2. http://www.vulcanhammer.net/svinkin/prediction.php
3. http://terrock.com.au/vibration/blasting.html
4. Khandelwal Manoj, Singh T N, 2007, PhD thesis, Evaluation and prediction of blast
induced ground vibration and frequency for surface mine- a neural network
approach, pp- 1-30
5. Langefors U, Kihlstrom B, Westerberg H., 1958, Ground vibrations in blasting.
Water Power, 400p
6. Singh B, PalRoy P., 1993, Generation, propagation & prediction of ground vibration
from opencast blasting, Blasting in ground excavation & mines, pp- 21-35.
7. Singh P K, 2006, Standardisation of blast vibration damage threshold for the safety
of residential structures in mining areas.
8. Pal B.K and Brahma K.C. Department Of Mining Engineering , National Institute Of
Techonology , Rourkela ,odisha-769008 , An Application of Regression Model for
Evaluation of Blast Vibration in an Opencast Coal Mine – a Case Analysis ,
Canadian Journal on Computing in Mathematics, Natural Sciences, Engineering &
Medicine Vol. 1, No. 3, April 2010.
9. Jayanthu S. and Naveen Ch. , Rao G V, B R V Kumar Susheel Kumar , ground
vibrations in opencast mine blast onstructures vis-à-vis a local environmental effect
and its mitigation through mining technology.
10. Minimate Blaster Instantel ISO 9001 user manual.

67
11. Statistica and Minitab software trial version.
12. Misra G.B, (1979) Surface Mining, Dhanbad Publishers, Dhanbad, Explosives, pp.337-
392, Blasting, pp.393-448
13. Deshmukh D.J., (2011)Element of Mining Technology , Vol.-1 , Denett & co. Nagpur ,
Explosives, Accessories And Blasting Practices ,pp.8.1-8.69
14. Kalu L.C., (1994) D.G.M.S. Circulars, Lovely Prakashan, Dhanbad, Explosives and Shot
firing, pp.397-444.