blackwell science ltd multilocus nested haplotype...
TRANSCRIPT

Molecular Ecology (2001)
10
, 2409–2422
© 2001 Blackwell Science Ltd
Blackwell Science Ltd
Multilocus nested haplotype networks extended with DNA
fingerprints show common origin and fine-scale, ongoing
genetic divergence in a wild microbial metapopulation
IGNAZIO CARBONE and LINDA M. KOHN
Department of Botany, University of Toronto, 3359 Mississauga Road North, Mississauga ON Canada L5L 1C6
Abstract
Nested haplotype networks for three loci in a haploid, fungal plant pathogen,
Sclerotiniasclerotiorum
, in two natural, Norwegian populations of the woodland buttercup,
Ranunculusficaria
, were extended with DNA fingerprints to determine fine-scale population diver-
gence. To preserve the cladistic structure in the network for both nonrecombinant and
postrecombinant haplotypes in highly recombinant clades, recombinant events were not
removed (‘peeled off’), but instead were examined in alternative (marginal) networks.
Fungi from both sampling locations share a common origin with subsequent genetic diver-
gence, consistent with expectations for metapopulation structure. Evidence for divergence
includes (i) lack of shared fingerprints between the two locations, (ii) evolution of new fin-
gerprints, via transposition and recombination, within 2 years on a fine spatial scale within
one sampling location, and (iii) increase in the size of the intergenic spacer (IGS) in both
sampling locations. Sites of microsatellite repeat expansion and of an insertion were
consistent with the boundaries of two recombination blocks in the IGS. Both alternative
networks based on the recombination blocks were essential to finding all associations of
DNA fingerprints with IGS size, sampling site, sampling year and mycelial compatibility
group. Variation in the elongation factor 1
αααα
and calmodulin loci supported the topologies
and the recurrent, ongoing polarity of change in fingerprints and IGS size inferred from
the IGS.
Keywords
: fungi, genome size, IGS, microsatellite expansion, recombination block,
Sclerotinia
Received 7 January 2001; revision received 4 July 2001; accepted 11 July 2001
Introduction
Fungal pathogen populations in natural plant communitiesare likely to be patchy, ephemeral and smaller than popu-lations in seasonally replanted agricultural crops (Burdon1993). In a 13-year study of the dynamics of disease causedby the obligately parasitic rust,
Uromyces valerianae
in 30discrete populations of
Valeriana salina
, Ericson
et al
. (1999)reported strong temporal and spatial effects among thepathogen populations. Despite evidence of migration,epidemiological patterns among the populations wereasynchronous, consistent with expectations for demes in ametapopulation. Comparable results have been reportedfor some other parasitic rusts and smuts (Carlsson &Elmqvist 1992; Antonovics
et al
. 1994; Burdon
et al
. 1995).
Soil-borne fungi share the common feature of perennat-ing by means of durable propagules, analogous to seedsthat can remain dormant in soil. Many other fungi, such asrusts and smuts, produce copious, wind-dispersed sporesand may also attract flying insect vectors to their spores. Incontrast, some soil-borne fungi either endure a virtuallysoil-bound existence, or have limited aerial spore dispersal,with some dispersal by insects associated with soil(Malloch & Blackwell 1992), wind-dispersed dust, orsurface water (e.g. Couch & Kohn 2000). Often these fungiproduce spores that are maladapted to long-distance aerialdispersal (Gordon
et al
. 1992). We hypothesize that soil-borne fungi in natural (nonagricultural) systems exist inmetapopulations, comparable to the rusts and smuts stud-ied to date. We further suggest that if they undergo sexualreproduction at all, they breed in small genetic neighbour-hoods with limited migration. The best evidence of suchfine-scale spatial structuring of soil-borne fungal plant
Correspondence: Ignazio Carbone. Fax: 905-828-3792; E-mail:[email protected]
MEC_1380.fm Page 2409 Wednesday, September 19, 2001 4:26 PM

2410
I . CARBONE and L . M. KOHN
© 2001 Blackwell Science Ltd,
Molecular Ecology
, 10, 2409–2422
pathogens in native soil is the work of Gordon
et al
. (1992)on
Fusarium oxysporum
.
Sclerotinia sclerotiorum
is a haploid, filamentous asco-mycete with a wide host range and cosmopolitan distribu-tion in temperate climates. From previous studies of
S. sclerotiorum
, we found major differences between samplesfrom four fields of cultivated canola (
Brassica rapa
or
B. napus
) in Western Canada (Kohli
et al
. 1995), and fromtwo locations in Norway associated with a wild buttercup,
Ranunculus ficaria
(Kohn 1995).
R. ficaria
is a commonwoodland understorey species, especially in Europe. InNorthern Europe, populations of
R. ficaria
tend to be clonal,reproducing vegetatively by modified rhizomes (bulbils).
Clonality dominated in the
S. sclerotiorum
samples fromcanola, evidenced by association of each of a relativelylarge number of DNA fingerprints with a somatic self-recognition grouping, termed mycelial compatibility group(MCG); many clones were recovered repeatedly over largegeographical areas over several years. This was mediatedby asexual reproduction via long-lived, soil-borne prop-agules (sclerotia), and sexual reproduction (via apothecia)by preferential selfing. In contrast, in the
Ranunculus
samples clonality could not easily be distinguished frominbreeding, evidenced by very low fingerprint and MCGdiversity accompanied by disassociation of fingerprintwith MCG on a very local spatial scale (Kohn 1995).
In the present study, we revisit the Norwegian samplesof
S. sclerotiorum
associated with
R. ficaria
from Sandvikacollected in 1993 (Kohn 1995) and 1995 (Carbone & Kohn2001), and from Vestfold in 1993 (Kohn 1995). This study isbased on the nested haplotype networks previously pub-lished by Carbone & Kohn (2001) that were inferred fromnucleotide sequence variation in seven nuclear loci amongthese Norwegian isolates as well as isolates from agricul-tural crops in North America, Norway and New Zealand.In the present study, we use only the nested networks ofthe three loci that have sequence variation in the Norwe-gian buttercup sample and extend these networks withDNA fingerprints, distinguishing interior and tip position-ing of fingerprints. As an example of this approach, Bosch
et al
. (1999) extended one, single nucleotide polymorphism(SNP) parsimony network with more rapidly evolvingmicrosatellite loci to determine placement of microsatellitealleles in the network. Tests of association were at haplo-type (lineage) level. The goal was to determine whetherrepeat-number size differences were significantly largerbetween haplotypes than within. Bosch
et al
. (1999)showed that the mean size difference in the number ofrepeat units between pairs of haplotypes was alwayssignificantly larger than the mean size difference withinhaplotypes, suggesting a pattern of microsatellite variationthat is strongly structured by haplotype background. Inour present study as reported below, tests of associationare at nested clade, haplotype and fingerprint level.
If
S. sclerotiorum
at the Sandvika and Vestfold samplingsites constitute part of a metapopulation, we expected thatafter a common ancestry the subsequent histories at thetwo sites would have diverged. We addressed the follow-ing questions. (i) Were Sandvika and Vestfold colonizedfrom a common source and have they remained linked bygene flow? If colonized from a common source, and ifrecombination had not been too extensive, it would beexpected that some haplotypes would be sampled fromboth sites and these haplotypes would probably positionwithin interior clades. Evidence for contemporary geneflow would be fingerprints sampled at both sites thatposition within tip clades. (ii) Is contemporary geneticexchange and recombination occurring and on whatspatial scale? If recombination is ongoing in small geneticneighbourhoods, a significant association of DNA finger-prints with sampling quadrat or site, many unrecoveredintermediates between fingerprints, and shuffling offingerprint/MCG associations would be expected. (iii) Ifboth sites share common origin, have they subsequentlydiverged genetically? Evidence for divergence would be alack of shared fingerprints between the two sampling sites.Evidence of recurrent, ongoing divergence would be newfingerprints and mycelial compatibility groups evolvingbetween 1993 and 1995. (iv) Given an observed variation inintergenic spacer (IGS) size (Carbone & Kohn 2001), achange in IGS size in samples from each of both locationswould be consistent with population divergence. Todemonstrate this, we would have to determine whetherthere is polarity in IGS size over time.
Materials and methods
Sampling
The strains used in the present study represent asubsample of two samples made in 1993 (Kohn 1995) and1995 (Carbone & Kohn 2001). In 1993, two locations weresampled that were known to have harboured the fungusin previous years. Sandvika, a suburban area outside Oslowas at least 50 km from agricultural production areas andwas located in a wooded park. The site was
c
. 380 m long.The other location, Vestfold, an agricultural productionarea where some canola is grown, was located in ahedgerow between fields in a cereal–pasture rotation andwas
c
. 200 m long. The two locations were approximately200 km apart. At each area, six apothecia were sampledfrom each 1-m
2
quadrat, with quadrats spaced approx-imately 40–70 m apart. A total of five sibling singleascospore isolates was made from each of 36 apothecia atSandvika, and from each of 18 apothecia at Vestfold (Kohn1995). From the 1993 samples, a subsample of 10 isolatesfrom Sandvika and 13 isolates from Vestfold were used inthe present study. In 1995, only Sandvika was re-sampled
MEC_1380.fm Page 2410 Wednesday, September 19, 2001 4:26 PM
N E S T E D H A P L O T Y P E N E T W O R K S W I T H D N A F I N G E R P R I N T S
2411
© 2001 Blackwell Science Ltd,
Molecular Ecology
, 10, 2409–2422
(apothecia were no longer being observed at Vestfold,suggesting either that the fungal population might havebecome extinct or that conditions were unfavourable forapothecial production). In 1995, the same transect as in1993 was re-sampled, except that quadrats were measured50 m apart and three to six apothecia were sampled at each1-m
2
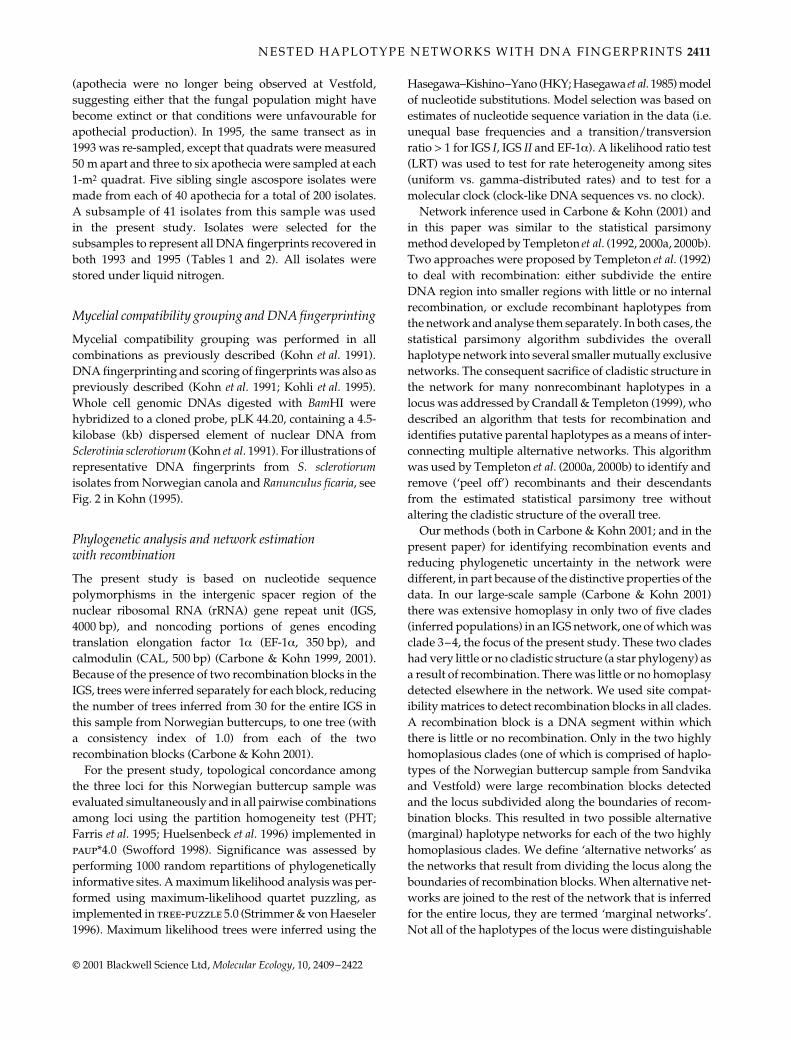
quadrat. Five sibling single ascospore isolates weremade from each of 40 apothecia for a total of 200 isolates.A subsample of 41 isolates from this sample was usedin the present study. Isolates were selected for thesubsamples to represent all DNA fingerprints recovered inboth 1993 and 1995 (Tables 1 and 2). All isolates werestored under liquid nitrogen.
Mycelial compatibility grouping and DNA fingerprinting
Mycelial compatibility grouping was performed in allcombinations as previously described (Kohn
et al
. 1991).DNA fingerprinting and scoring of fingerprints was also aspreviously described (Kohn
et al
. 1991; Kohli
et al
. 1995).Whole cell genomic DNAs digested with
Bam
HI werehybridized to a cloned probe, pLK 44.20, containing a 4.5-kilobase (kb) dispersed element of nuclear DNA from
Sclerotinia sclerotiorum
(Kohn
et al
. 1991). For illustrations ofrepresentative DNA fingerprints from
S. sclerotiorum
isolates from Norwegian canola and
Ranunculus ficaria
, seeFig. 2 in Kohn (1995).
Phylogenetic analysis and network estimation with recombination
The present study is based on nucleotide sequencepolymorphisms in the intergenic spacer region of thenuclear ribosomal RNA (rRNA) gene repeat unit (IGS,4000 bp), and noncoding portions of genes encodingtranslation elongation factor 1
α
(EF-1
α
, 350 bp), andcalmodulin (CAL, 500 bp) (Carbone & Kohn 1999, 2001).Because of the presence of two recombination blocks in theIGS, trees were inferred separately for each block, reducingthe number of trees inferred from 30 for the entire IGS inthis sample from Norwegian buttercups, to one tree (witha consistency index of 1.0) from each of the tworecombination blocks (Carbone & Kohn 2001).
For the present study, topological concordance amongthe three loci for this Norwegian buttercup sample wasevaluated simultaneously and in all pairwise combinationsamong loci using the partition homogeneity test (PHT;Farris
et al
. 1995; Huelsenbeck
et al
. 1996) implemented in
paup
*4.0 (Swofford 1998). Significance was assessed byperforming 1000 random repartitions of phylogeneticallyinformative sites. A maximum likelihood analysis was per-formed using maximum-likelihood quartet puzzling, asimplemented in
tree-puzzle
5.0 (Strimmer & von Haeseler1996). Maximum likelihood trees were inferred using the
Hasegawa–Kishino–Yano (HKY; Hasegawa
et al
. 1985) modelof nucleotide substitutions. Model selection was based onestimates of nucleotide sequence variation in the data (i.e.unequal base frequencies and a transition/transversionratio > 1 for IGS
I
, IGS
II
and EF-1
α
). A likelihood ratio test(LRT) was used to test for rate heterogeneity among sites(uniform vs. gamma-distributed rates) and to test for amolecular clock (clock-like DNA sequences vs. no clock).
Network inference used in Carbone & Kohn (2001) andin this paper was similar to the statistical parsimonymethod developed by Templeton
et al
. (1992, 2000a, 2000b).Two approaches were proposed by Templeton
et al
. (1992)to deal with recombination: either subdivide the entireDNA region into smaller regions with little or no internalrecombination, or exclude recombinant haplotypes fromthe network and analyse them separately. In both cases, thestatistical parsimony algorithm subdivides the overallhaplotype network into several smaller mutually exclusivenetworks. The consequent sacrifice of cladistic structure inthe network for many nonrecombinant haplotypes in alocus was addressed by Crandall & Templeton (1999), whodescribed an algorithm that tests for recombination andidentifies putative parental haplotypes as a means of inter-connecting multiple alternative networks. This algorithmwas used by Templeton
et al
. (2000a, 2000b) to identify andremove (‘peel off’) recombinants and their descendantsfrom the estimated statistical parsimony tree withoutaltering the cladistic structure of the overall tree.
Our methods (both in Carbone & Kohn 2001; and in thepresent paper) for identifying recombination events andreducing phylogenetic uncertainty in the network weredifferent, in part because of the distinctive properties of thedata. In our large-scale sample (Carbone & Kohn 2001)there was extensive homoplasy in only two of five clades(inferred populations) in an IGS network, one of which wasclade 3–4, the focus of the present study. These two cladeshad very little or no cladistic structure (a star phylogeny) asa result of recombination. There was little or no homoplasydetected elsewhere in the network. We used site compat-ibility matrices to detect recombination blocks in all clades.A recombination block is a DNA segment within whichthere is little or no recombination. Only in the two highlyhomoplasious clades (one of which is comprised of haplo-types of the Norwegian buttercup sample from Sandvikaand Vestfold) were large recombination blocks detectedand the locus subdivided along the boundaries of recom-bination blocks. This resulted in two possible alternative(marginal) haplotype networks for each of the two highlyhomoplasious clades. We define ‘alternative networks’ asthe networks that result from dividing the locus along theboundaries of recombination blocks. When alternative net-works are joined to the rest of the network that is inferredfor the entire locus, they are termed ‘marginal networks’.Not all of the haplotypes of the locus were distinguishable
MEC_1380.fm Page 2411 Wednesday, September 19, 2001 4:26 PM

2412
I . CARBONE and L . M. KOHN
© 2001 Blackwell Science Ltd,
Molecular Ecology
, 10, 2409–2422
DNA fingerprint Strain*
IGS haplotype
IGS size (bp)
Sampling site†
Sampling year MCG
A S1-A5-2 11 3997 SV-1-5 1993 1S3-A5-2 11 3997 SV-3-5 1993 1IC-170 5 4003 SV-1-3 1995 1IC-171 5 4003 SV-1-3 1995 1IC-212 5 4003 SV-2-5 1995 1IC-213 5 4003 SV-2-5 1995 1IC-215 5 4003 SV-2-5 1995 1IC-251 5 4003 SV-3-7 1995 1IC-255 5 4003 SV-3-7 1995 1IC-169 5 4003 SV-1-3 1995 1
B S3-A4-1 12 4024 SV-3-4 1993 2S3-A4-2 12 4024 SV-3-4 1993 3
C S6-A2-2 12 4024 SV-6-2 1993 4S6-A2-5 12 4024 SV-6-2 1993 4S6-A4-1 12 4024 SV-6-4 1993 4S6-A4-2 12 4024 SV-6-4 1993 4
D S1-A3-1 10 4024 SV-1-3 1993 1S1-A3-2 10 4024 SV-1-3 1993 1IC-277 8 4030 SV-5-4 1995 1IC-278 8 4030 SV-5-4 1995 1IC-284 8 4030 SV-6-1 1995 1IC-286 8 4030 SV-6-1 1995 1IC-288 8 4030 SV-6-1 1995 1IC-276 8 4030 SV-5-4 1995 1
E‡ IC-175 5 4003 SV-1-4 1995 6
F IC-174 5 4003 SV-1-4 1995 6
G IC-172 5 4003 SV-1-4 1995 6
H IC-178 5 4003 SV-1-5 1995 7IC-179 5 4003 SV-1-5 1995 7IC-180 5 4003 SV-1-5 1995 7IC-192 5 4003 SV-2-1 1995 8IC-193 5 4003 SV-2-1 1995 8IC-194 5 4003 SV-2-1 1995 8
I IC-186 5 4003 SV-1-7 1995 8IC-189 5 4003 SV-1-7 1995 8IC-190 5 4003 SV-1-7 1995 8
J IC-347 5 4003 SV-8-4 1995 9IC-348 5 4003 SV-8-4 1995 9
K IC-329 7 4030 SV-7-5 1995 10IC-341 7 4030 SV-8-2 1995 10IC-328 7 4030 SV-7-5 1995 10IC-327 7 4030 SV-7-5 1995 10IC-260 7 4030 SV-4-1 1995 10IC-259 7 4030 SV-4-1 1995 10IC-258 7 4030 SV-4-1 1995 10
L IC-238 6 4030 SV-3-3 1995 11IC-239 6 4030 SV-3-3 1995 11IC-271 6 4030 SV-5-3 1995 11IC-273 6 4030 SV-5-3 1995 11IC-236 6 4030 SV-3-3 1995 11
M IC-264 9 4031 SV-5-1 1995 14
Table 1 DNA fingerprints, IGS haplotypesand collection data for 64 strains ofSclerotinia sclerotiorum
MEC_1380.fm Page 2412 Wednesday, September 19, 2001 4:26 PM
N E S T E D H A P L O T Y P E N E T W O R K S W I T H D N A F I N G E R P R I N T S
2413
© 2001 Blackwell Science Ltd,
Molecular Ecology
, 10, 2409–2422
in each of the marginal networks. Such haplotypes werecollapsed into 0-step clades (see Fig. 1 in Carbone & Kohn2001). By considering both alternative networks, patternsof descent among recombinant haplotypes could beinferred. This was an important prerequisite for inferringthe interior/tip status of DNA fingerprints in theexpanded fingerprint networks in the present study.
Extension of nested networks with fingerprint data
Haplotype networks were converted into a nested designfollowing nesting rules (Templeton
et al
. 1987; Templeton& Sing 1993; Crandall 1996) as described in Carbone &Kohn (2001). Haplotype networks that were extended withfingerprints are termed ‘expanded networks’. Nestingfingerprints in the expanded networks was based on theassumption that when a mutation occurs, i.e. as a trans-position of a DNA element, or a loss/gain of a restrictionsite, a new fingerprint arises. As little as one recombinationevent could produce very different fingerprints amongsiblings, with many unrecovered intermediates in ournetworks. Without recombination, such large differencesamong fingerprints would require many transpositionevents, a less parsimonious explanation (Carbone
et al
.1999; see also Discussion). Given an origin in one or fewrecombination events, the long branches may imply moreevolutionary distance than is actually the case. We did notattempt to nest below the 1-step clade level; below thatlevel, inferences of relationships of fingerprints separatedby many unrecovered mutational intermediates werearbitrary, although we chose to portray them for the IGS.For the same reason, we did not nest below the 1-step levelfor EF-1
α
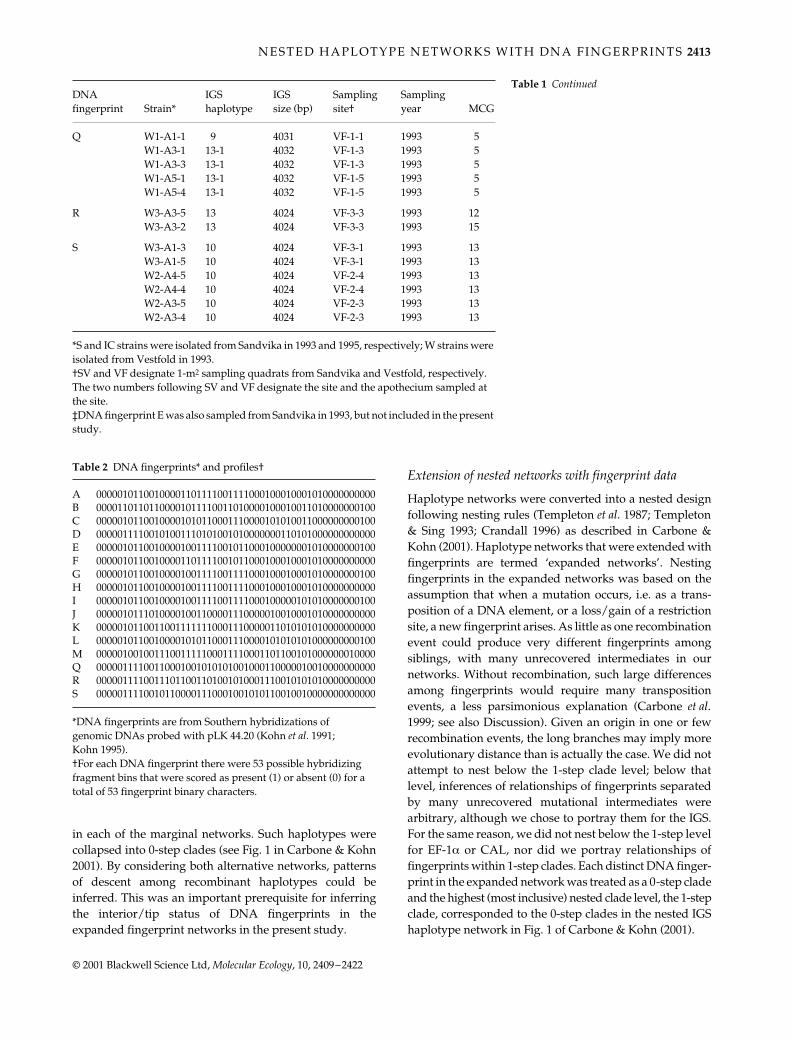
or CAL, nor did we portray relationships offingerprints within 1-step clades. Each distinct DNA finger-print in the expanded network was treated as a 0-step cladeand the highest (most inclusive) nested clade level, the 1-stepclade, corresponded to the 0-step clades in the nested IGShaplotype network in Fig. 1 of Carbone & Kohn (2001).
DNA fingerprint Strain*
IGS haplotype
IGS size (bp)
Sampling site†
Sampling year MCG
Q W1-A1-1 9 4031 VF-1-1 1993 5W1-A3-1 13-1 4032 VF-1-3 1993 5W1-A3-3 13-1 4032 VF-1-3 1993 5W1-A5-1 13-1 4032 VF-1-5 1993 5W1-A5-4 13-1 4032 VF-1-5 1993 5
R W3-A3-5 13 4024 VF-3-3 1993 12W3-A3-2 13 4024 VF-3-3 1993 15
S W3-A1-3 10 4024 VF-3-1 1993 13W3-A1-5 10 4024 VF-3-1 1993 13W2-A4-5 10 4024 VF-2-4 1993 13W2-A4-4 10 4024 VF-2-4 1993 13W2-A3-5 10 4024 VF-2-3 1993 13W2-A3-4 10 4024 VF-2-3 1993 13
*S and IC strains were isolated from Sandvika in 1993 and 1995, respectively; W strains were isolated from Vestfold in 1993.†SV and VF designate 1-m2 sampling quadrats from Sandvika and Vestfold, respectively. The two numbers following SV and VF designate the site and the apothecium sampled at the site.‡DNA fingerprint E was also sampled from Sandvika in 1993, but not included in the present study.
Table 1 Continued
Table 2 DNA fingerprints* and profiles†
A 00000101100100001101111001111000100010001010000000000B 00001101101100001011110011010000100010011010000000100C 00000101100100001010110001110000101010011000000000100D 00000111100101001110101001010000000110101000000000000E 00000101100100001001111001011000100000001010000000100F 00000101100100001101111001011000100010001010000000000G 00000101100100001001111001111000100010001010000000100H 00000101100100001001111001111000100010001010000000000I 00000101100100001001111001111000100000101010000000100J 00000101110100001001100001110000010010001010000000000K 00000101100110011111110001110000011010101010000000000L 00000101100100001010110001110000101010101000000000100M 00000100100111001111100011110001101100101000000010000Q 00000111100110001001010101001000110000010010000000000R 00000111100111011001101001010001110010101010000000000S 00000111100101100001110001001010110010010000000000000
*DNA fingerprints are from Southern hybridizations of genomic DNAs probed with pLK 44.20 (Kohn et al. 1991; Kohn 1995).†For each DNA fingerprint there were 53 possible hybridizing fragment bins that were scored as present (1) or absent (0) for a total of 53 fingerprint binary characters.
MEC_1380.fm Page 2413 Wednesday, September 19, 2001 4:26 PM

2414
I . CARBONE and L . M. KOHN
© 2001 Blackwell Science Ltd,
Molecular Ecology
, 10, 2409–2422
Tests of associations and nested analysis of variance
Significance of associations of DNA fingerprint with IGSsize, sampling site, sampling year and MCG was assessedby performing 1000 random, two-way, contingencypermutations using the algorithm of Roff & Bentzen (1989)implemented in
chiperm
Version 1.2 (D. Posada, available athttp://bioag.byu.edu/zoology/crandall_lab/programs.htm).The significant associations with IGS size and samplingyear were further examined by treating the different IGSsizes (3997, 4003, 4024, 4030, 4031, 4032 bp) and samplingyears (1993, 1995) as numerical variables (Table 1). Becausethe data at each nesting level were unbalanced, a nestedanalysis of variance was performed using the least squares,multiple regression technique (PROC GLM: procedure forgeneral linear models) as implemented in SAS (1990). TheGLM procedure was used to test further whether therewere any significant differences in mean IGS size andsampling year within each clade in the nested fingerprintnetworks. Specifically,
F
-tests were performed within eachdistinct clade in the network and this was followed bymultiple comparison tests using the sequential Bonferronimultiple contrast method. These sequential Bonferroni
t
-tests included all possible interior–interior, tip–interior,tip–tip contrasts that were known a priori from the nesteddesign. The objective was to determine whether anysignificant changes in IGS size or sampling year wereassociated with the interior to tip polarity in the network.
Results
The two alternative (marginal) nested phylogenetic networksare shown in Fig. 1A and 1B, where the IGS haplotypenetworks
I
and
II
(
without DNA fingerprints) are from aprevious study of North American and Norwegian samplesof
Sclerotinia sclerotiorum
(Carbone & Kohn 2001). There aredifferences in the topologies of the two alternative networks(e.g. haplotypes 5, 7 and 9 in interior clade 1-2-a in Fig. 1Aare not found in the interior-most 1-1-b in Fig. 1B). In thissample, there were 11 variable sites in the IGS consisting of
seven parsimony-informative and one uninformative basesubstitution, two simple microsatellites and one 27-bp indel(insertion or deletion) motif (Table 3). There were threevariable sites in EF-1
α
and one site in CAL (see Supple-mental Table 1, available at http://www.erin.utoronto.ca/~kohn/). All sequences and multiple alignments can befound in the GenBank (AF340283–AF342669). The threeloci with informative polymorphisms, the IGS, EF-1
α
andCAL, were physically unlinked (Carbone
et al
. 1999). Eachparsimony network in Fig. 1 had a consistency index of 1and the topology of each network was identical to thetopology of the maximum likelihood tree inferred using anHKY model of evolution (Hasegawa
et al
. 1985). Rates wereuniform among sites and all branch lengths were consistentwith a molecular clock (
P
> 0.05 for each LRT). Othersimpler or more complex (parameter-rich) models of DNAsubstitution were not evaluated or tested against the HKYmodel because of the observed low rate of nucleotidechange and absence of homoplasy in the networks. Underthese conditions, both maximum parsimony and maximumlikelihood methods would converge to the same phylo-genetic estimate (Felsenstein 1982; Sober 1988).
DNA fingerprints, IGS haplotypes, IGS sizes and MCGsfor all 13 1993 isolates and 41 1995 isolates from Sandvika,and 13 1993 isolates from Vestfold, are provided in Tables 1and 2. Fingerprint ‘E’ was recovered in 1993 (Kohn 1995)but is represented here by a 1995 isolate; both 1993 and1995 isolates with fingerprint E are associated with MCG 5.In the 1993 subsamples, there was evidence of segregationof different MCGs among sibling monosporous isolatesfrom each of three apothecia out of six from the Sandvikasubsample used in Kohn (1995) and the present paper, andtwo apothecia out of seven from the Vestfold subsample(e.g, S3-A4 and W3-A3 in Table 1; see also Kohn 1995). Inthe 1995 subsample, there was no evidence of outcrossingamong the 15 apothecia from Sandvika (Table 1).
In the expanded IGS networks, interior and tip finger-prints were defined as follows. In expanded network
I
, allfingerprints within 1-2-a were designated as interiorbecause 1-2-a directly connects to the greater haplotype
Fig. 1
(Opposite) The expanded fingerprint networks for IGS
I
(A), IGS
II
(B), EF-1
α
(C) and CAL (D) representing nonagricultural samplesof
Sclerotinia sclerotiorum
from
Ranunculus ficaria
in two locations in Norway. Following the IGS
I
, IGS
II
, EF-1
α
and CAL designations, inbrackets, are the clade designations from the nested haplotype networks in Fig. 1 of Carbone & Kohn (2001) that correspond to the highest(most inclusive) clade level in the expanded fingerprint networks portrayed in the present study. Clades 3-4-a and 3-4-b are marginal partsof comprehensive networks for North American and Norwegian agricultural and nonagricultural populations of
S. sclerotiorum
(Fig. 1 ofCarbone & Kohn 2001). Clades are designated with hyphenated numbers prefixed with a 1- (1-step clades), a 2- (2-step clades) or a 3- (3-step clades). Fingerprints are 0-step clades and are labelled using the fingerprint letter designations shown in Table 1. Haplotypes aredesignated with numbers, in brackets, following the clade designations. Strains are designated with the prefixes SV or IC (Sandvika) andVF (Vestfold). In the expanded fingerprint networks, a double-headed arrow between 0-step clades separates strains that differ by a singlehybridizing fragment in their DNA fingerprint profiles (Table 2); a double-headed arrow between 1-step clades separates haplotypes thatdiffer by a single base substitution. A ‘0’ between arrows designates either an inferred intermediate haplotype or DNA fingerprint notpresent in the sample and an asterisk indicates the point of attachment to the greater haplotype network shown in Fig. 1 of Carbone & Kohn(2001). A number next to an arrow identifies the site number and encoded state of an indel (insertion or deletion event) that supports thebranch (see Table 3). The inferred interior fingerprint clades are shaded.
MEC_1380.fm Page 2414 Wednesday, September 19, 2001 4:26 PM

N E S T E D H A P L O T Y P E N E T W O R K S W I T H D N A F I N G E R P R I N T S
2415
© 2001 Blackwell Science Ltd,
Molecular Ecology
, 10, 2409–2422
0
0
0
0
0
R W3-A3-5W3-A3-2
0
0
C S6-A2-2S6-A2-5S6-A4-1S6-A4-2
L IC-238IC-239IC-271IC-273IC-236
K IC-329IC-341IC-328IC-327IC-260IC-259IC-258
D IC-277IC-278IC-284IC-286IC-288IC-276
S1-A3-1 S1-A3-2
S W3-A1-3W3-A1-5W2-A4-5W2-A4-4W2-A3-5W2-A3-4
B S3-A4-1S3-A4-2
0 0 0 0 0 0 0 0 0 0 0 0 0 0 0
0 0 0 0 0 00
H IC-178IC-179IC-180IC-192IC-193IC-194
G IC-1720
E IC-175
I IC-186IC-189IC-190
00
0
Q W1-A3-1W1-A3-3W1-A5-1W1-A5-4W1-A1-1
0
0
0
0
0
0
0 0
J IC-347IC-348
0
0
0
0 0 0 0
0
0
0 0 0
0
0
0
0
0
0
0
M IC-264
0 0 0
0-step clades
1-step clades
2-step clades
3-step clades
1-2-a (5, 7, 9, 11, 13, 13-1)
1-1-a (8, 10)
1-3-a (6, 12)
(A) IGS I (clade 3-4-a)
2-1-a3-1-a
2-2-a
*
34-0
34-034-134-0
S1-A5-2S3-A5-2
A IC-170IC-171IC-212IC-213IC-215IC-251IC-255IC-169
F IC-174
0
0
0
0
(B) IGS II (clade 3-4-b)
Q W1-A1-1
A S1-A5-2S3-A5-2
D S1-A3-1S1-A3-2
L IC-238IC-239IC-271IC-273IC-236
K IC-329IC-341IC-328IC-327IC-260IC-259IC-258
D IC-277IC-278IC-284IC-286IC-288IC-276
C S6-A2-2S6-A2-5S6-A4-1S6-A4-2
B S3-A4-1S3-A4-2
0 0 0 0 0 0
000
0
0 0 0 0 0 0Q W1-A3-1
W1-A3-3W1-A5-1W1-A5-40
000
0
S W3-A1-3W3-A1-5W2-A4-5W2-A4-4W2-A3-5W2-A3-4
0 00000
0 0 0 0R W3-A3-5W3-A3-2
00000
A IC-170IC-171IC-212IC-213IC-215IC-251IC-255IC-169
H IC-178IC-179IC-180IC-192IC-193IC-194
G IC-1720
E IC-175
I IC-186IC-189IC-190
0
0
0
0 0
J IC-347IC-348
0 0
00
00 00 0 0
000000
000000
M IC-264
00000000000000
F IC-174
1-3-b (5, 6, 7, 8)
0
1-2-b (9)
2-2-b
2-1-b
3-1-b
*
23-144-1
1-1-b (10, 11, 12, 13, 13-1)
44-144-223-2
MEC_1380.fm Page 2415 Wednesday, September 19, 2001 4:26 PM

2416
I . CARBONE and L . M. KOHN
© 2001 Blackwell Science Ltd,
Molecular Ecology
, 10, 2409–2422
network as determined in Carbone & Kohn (2001) anddenoted in the present study with an asterisk in Fig. 1A–D.In expanded network
II
, all fingerprints within 1-1-b wereinterior, relative to fingerprints in 1-2-b and 1-3-b, for thesame reason. This follows exactly the interior/tip positions
of 0-step clades in the nested marginal haplotype networks(clades 3-4-a and 3-4-b in Fig. 1A of Carbone & Kohn 2001).For further interior/tip contrasts within 1-step clades,a fingerprint within a given 1-step clade was classifiedas interior if it was associated with a haplotype in the
R W3-A3-5W3-A3-2
C S6-A2-2S6-A2-5S6-A4-1S6-A4-2
L IC-238 IC-239 IC-271 IC-273 IC-236
K IC-329IC-341IC-328IC-327IC-260IC-259IC-258
S W3-A1-3W3-A1-5W2-A4-5W2-A4-4W2-A3-5W2-A3-4
B S3-A4-1S3-A4-2
H IC-178IC-179IC-180IC-192IC-193IC-194
G IC-172
E IC-175
I IC-186 IC-189 IC-190
J IC-347IC-348
M IC-264
1-1 (3)*
2-1
(D) CAL (entire)
F IC-174
1-2 (2)
(C) EF-1 (clade 1-4)
R W3-A3-5 W3-A3-2
L IC-238 IC-239 IC-271 IC-273 IC-236
K IC-329IC-341IC-328IC-327IC-260IC-259IC-258
S W3-A1-3W3-A1-5W2-A4-5W2-A4-4W2-A3-5W2-A3-4
H IC-178IC-179IC-180IC-192IC-193IC-194
G IC-172
E IC-175
I IC-186 IC-189 IC-190
J IC-347IC-348
M IC-264
F IC-174Q W1-A3-1
W1-A3-3W1-A5-1W1-A5-4W1-A1-1
C S6-A2-2S6-A2-5S6-A4-1S6-A4-2
B S3-A4-1S3-A4-2
D IC-277 IC-278 IC-284 IC-286 IC-288 IC-276
S1-A3-1 S1-A3-2
S1-A5-2S3-A5-2
A IC-170IC-171IC-212IC-213IC-215IC-251IC-255IC-169
1-1 (10)
S1-A5-2S3-A5-2
A IC-170IC-171IC-212IC-213IC-215IC-251IC-255IC-169
1-2 (9)
D IC-277 IC-278 IC-284 IC-286 IC-288 IC-276
S1-A3-1 S1-A3-2
Q W1-A3-1W1-A3-3W1-A5-1W1-A5-4W1-A1-1
2-1
0
0
0
0
*
(8)
(11)
Fig. 1 Continued
MEC_1380.fm Page 2416 Wednesday, September 19, 2001 4:26 PM
N E S T E D H A P L O T Y P E N E T W O R K S W I T H D N A F I N G E R P R I N T S
2417
© 2001 Blackwell Science Ltd,
Molecular Ecology
, 10, 2409–2422
interiormost clade of the alternative haplotype network. Forexample, within the ancestral, interior clades 1-2-a and 1-1-b, fingerprint clades A and R were interiors (shaded inFig. 1). These fingerprint clades contain strains belongingto IGS haplotypes 11 and 13, respectively (see Table 1). Inthe nested IGS haplotype networks, 11 and 13 were theonly haplotypes found in the most interior clades (1-2-aand 1-1-b) of both alternative networks (13-1 is derivedfrom 13). Such ‘parental’ haplotypes may have existed
before the recombination event in the IGS region that gaverise to the recombination blocks, or they may be the imme-diate descendants of a nonrecombinant ancestor.
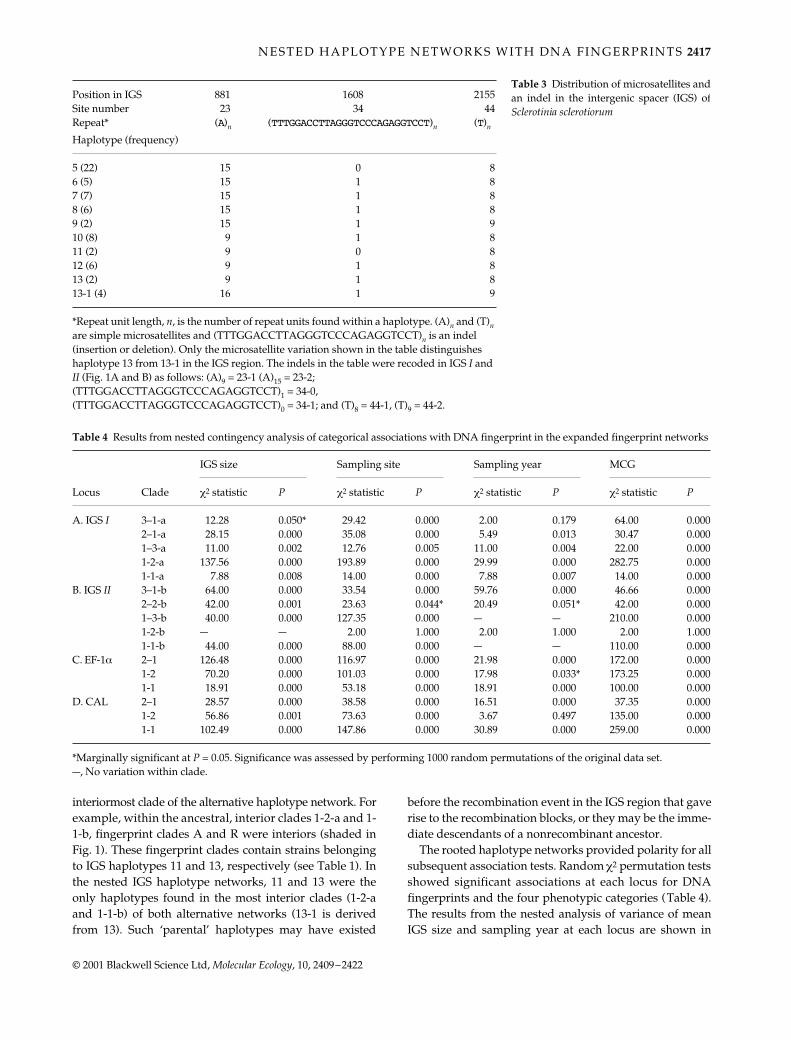
The rooted haplotype networks provided polarity for allsubsequent association tests. Random
χ
2
permutation testsshowed significant associations at each locus for DNAfingerprints and the four phenotypic categories (Table 4).The results from the nested analysis of variance of meanIGS size and sampling year at each locus are shown in
Position in IGS 881 1608 2155Site number 23 34 44Repeat* (A)n (TTTGGACCTTAGGGTCCCAGAGGTCCT)n (T)n
Haplotype (frequency)
5 (22) 15 0 86 (5) 15 1 87 (7) 15 1 88 (6) 15 1 89 (2) 15 1 910 (8) 9 1 811 (2) 9 0 812 (6) 9 1 813 (2) 9 1 813-1 (4) 16 1 9
*Repeat unit length, n, is the number of repeat units found within a haplotype. (A)n and (T)n are simple microsatellites and (TTTGGACCTTAGGGTCCCAGAGGTCCT)n is an indel (insertion or deletion). Only the microsatellite variation shown in the table distinguishes haplotype 13 from 13-1 in the IGS region. The indels in the table were recoded in IGS I and II (Fig. 1A and B) as follows: (A)9 = 23-1 (A)15 = 23-2; (TTTGGACCTTAGGGTCCCAGAGGTCCT)1 = 34-0, (TTTGGACCTTAGGGTCCCAGAGGTCCT)0 = 34-1; and (T)8 = 44-1, (T)9 = 44-2.
Table 3 Distribution of microsatellites andan indel in the intergenic spacer (IGS) ofSclerotinia sclerotiorum
Table 4 Results from nested contingency analysis of categorical associations with DNA fingerprint in the expanded fingerprint networks
Locus Clade
IGS size Sampling site Sampling year MCG
χ2 statistic P χ2 statistic P χ2 statistic P χ2 statistic P
A. IGS I 3–1-a 12.28 0.050* 29.42 0.000 2.00 0.179 64.00 0.0002–1-a 28.15 0.000 35.08 0.000 5.49 0.013 30.47 0.0001–3-a 11.00 0.002 12.76 0.005 11.00 0.004 22.00 0.0001-2-a 137.56 0.000 193.89 0.000 29.99 0.000 282.75 0.0001-1-a 7.88 0.008 14.00 0.000 7.88 0.007 14.00 0.000
B. IGS II 3–1-b 64.00 0.000 33.54 0.000 59.76 0.000 46.66 0.0002–2-b 42.00 0.001 23.63 0.044* 20.49 0.051* 42.00 0.0001–3-b 40.00 0.000 127.35 0.000 — — 210.00 0.0001-2-b — — 2.00 1.000 2.00 1.000 2.00 1.0001-1-b 44.00 0.000 88.00 0.000 — — 110.00 0.000
C. EF-1α 2–1 126.48 0.000 116.97 0.000 21.98 0.000 172.00 0.0001-2 70.20 0.000 101.03 0.000 17.98 0.033* 173.25 0.0001-1 18.91 0.000 53.18 0.000 18.91 0.000 100.00 0.000
D. CAL 2–1 28.57 0.000 38.58 0.000 16.51 0.000 37.35 0.0001-2 56.86 0.001 73.63 0.000 3.67 0.497 135.00 0.0001-1 102.49 0.000 147.86 0.000 30.89 0.000 259.00 0.000
*Marginally significant at P = 0.05. Significance was assessed by performing 1000 random permutations of the original data set.—, No variation within clade.
MEC_1380.fm Page 2417 Wednesday, September 19, 2001 4:26 PM

2418
I . CARBONE and L . M. KOHN
© 2001 Blackwell Science Ltd,
Molecular Ecology
, 10, 2409–2422
Table 5 Nested analysis of variance of IGS size and sampling year in the expanded fingerprint networks
Locus Source
IGS size Sampling year
SS d.f. MS F-Statistic SS d.f. MS F-Statistic
A. IGS I Within 3-1-a 933.576 1 933.576 6.30* 1.840 1 1.840 2.00Within 2-1-a 1890.276 1 1890.276 13.40** 4.782 1 4.782 5.89*Within 1-3-a 98.182 2 49.091 99999.99*** 10.909 2 5.455 99999.99***Within 1-2-a 7010.574 10 701.057 336.12*** 21.292 10 2.129 9.32***Within 1-1-a 69.429 1 69.429 15.43** 7.714 1 7.714 15.43**
B. IGS II Within 3-1-b 726.818 1 726.818 4.80* 55.033 1 55.033 873.81***Within 2-2-b 478.519 1 478.519 2.65 1.905 1 1.840 38.10***Within 1-3-b 7217.100 9 801.900 99999.99*** — — — —Within 1-2-b 0.000 1 0.000 — 2.000 1 2.000 —Within 1-1-b 1692.000 6 282.000 99999.99*** — — — —
C. EF-1α Within 2-1 5288.241 3 1762.747 21.91*** 20.237 3 6.746 10.46***Within 1-2 4546.036 8 568.255 236.77*** 7.661 8 0.958 3.59*Within 1-1 167.760 4 41.940 15.53*** 18.640 4 4.660 15.53***
D. CAL Within 2-1 2805.919 1 2805.919 23.80*** 15.206 1 15.206 21.56***Within 1-2 4344.919 5 868.984 316.82*** 1.007 5 0.201 0.66Within 1-1 2851.200 9 316.800 156.09*** 30.324 9 3.369 15.16***
SS, sum of squares of subclades within clade; d.f., degrees of freedom; MS, mean square, where MS = SS/d.f.; –, no variation within clade or undefined.F-values were calculated for clades as defined in the nested hierarchical design (Fig. 1). For example, in IGS I, F3-1-a = MSbetween 2-1-a, 2-2-a/MSwithin 2-1-a, 2-2-a; F2-1-a = MSbetween 1-1-a, 1-2-a/MSwithin 1-1-a, 1-2-a; F1-3-a = MSbetween B, C, L/MSwithin B, C, L; F1-2-a = MSbetween A, E, F, G, H, I, J, K, M, Q, R/MSwithin A, E, F, G, H, I, J, K, M, Q, R; F1-1-a = MSbetween D, S/MSwithin D, S.
Statistically significant F-values are indicated as follows: *P < 0.05, **P < 0.005, ***P < 0.0005.
Table 6 Results from multiple contrasts showing significant changes in mean IGS size and sampling year associated with fingerprints andthe interior to tip polarity in the expanded fingerprint networks
Locus Clade Mean IGS size Mean sampling year
A. IGS I 3-1-a 2-1-ai < 2-2-a (2-1-a, 2-2-a)ns
2-1-a 1-2-ai < 1-1-a 1-1-a < 1-2-ai
1-3-a Bi, Ci < L Bi, Ci < L1-2-a Hi, I, J, Gi, F, E, Ai < Ri < Q, M, K Q < M, E, F, Gi, Hi, I, J, K, Ai and Ri < Hi, I, J, K, Ai
1-1-a S < Di S < Di
B. IGS II 3-1-b 2-2-b < 2-1-bi 2-1-bi < 2-2-b
2-2-b (1-2-b, 1-3-b)ns 1-2-bi < 1-3-b
1-3-b Ei, Gi, Fi, Ii, Ji, Ai, Hi < D, Ki, L (A, D, E, F, G, H, I, J, K, L)ns
1-2-b (Q, M)ns (Q, M)ns
1-1-b Ai < B, C, D, S, Ri < Q (A, B, C, D, Q, R, S)ns
C. EF-1α 2-1 1-2 < 1-1i < Q 1-1i < Q < 1-2
1-2 H, I, J, G, F, E, A < R < K R < H, I, J, K, A
1-1 B, C, S < L, D B, C, S < L, D
D. CAL 2-1 1-2 < 1-1i 1-1i < 1-2*
1-2 H, J, G, A < K, M (A, G, H, J, K, M)ns*
1-1 E, F, I < C, B, S, R < D < L, Q B, C, S, Q, R < D < E, F, I, L*
ns, no significant variation within clade; i, interior fingerprints or clades (see Fig. 1).All contrasts in the table are significant at P = 0.05.Clades shown in bold type show a recurrent pattern of increasing mean IGS size or sampling year from interior to tip positions in the expanded fingerprint networks.*Polarity in mean sampling year from interior to tip clade in the CAL network is consistent with IGS II and EF-1α, with no evidence of significant reversals in polarity at lower clade levels in these networks.
MEC_1380.fm Page 2418 Wednesday, September 19, 2001 4:26 PM

N E S T E D H A P L O T Y P E N E T W O R K S W I T H D N A F I N G E R P R I N T S 2419
© 2001 Blackwell Science Ltd, Molecular Ecology, 10, 2409–2422
Table 5. The results from multiple contrasts are shown inTable 6 and indicate a significant increase in IGS size dur-ing the period between 1993 and 1995. The increase in IGSsize and sampling year was consistent with the interior totip polarity in the network and this pattern was recurrent(see shaded clades in Table 6). A significant reversal in theinterior to tip polarity at lower clade levels in the nestedhierarchy is consistent with contemporary recombinationbreaking up recurrent patterns, e.g. in expanded IGS I, thereversal in IGS size polarity in 2-1-a when moving from1-2-a to fingerprint D in 1-1-a. Such reversals were alsoobserved in the association of fingerprints with year ofsampling, e.g. the reversal in temporal polarity when movingfrom clade 2-1-a to 1-3-a in expanded network I (Table 6).The significant trends in IGS size and sampling yearobserved in alternative IGS networks I and II were corrob-orated by the significant trends in IGS size and temporalpolarity observed in the EF-1α and CAL networks (Table 6).
Results of the PHT across all networks simultaneouslyindicated significantly different topologies (P = 0.010)for all four data partitions (IGS I, IGS II, EF-1α and CAL).Further pairwise tests revealed significant discordancebetween alternative IGS networks I and II (P = 0.010); allother pairwise tests were not significant with P-values> 0.100. The significant discordance between alternativeIGS networks I and II (P = 0.010) is expected because of thelarge recombination blocks in the IGS, with each block con-taining three or four phylogenetically informative sites (seeFig. 2 in Carbone & Kohn 2001). A P-value of 1.000 of thePHT for EF-1α and IGS network I indicates that all rand-omized repartitions of phylogenetically informative sitesin this character partition have the same length as theoriginal data partition. Since these two loci have identicaltopologies, the position of fingerprints in EF-1α providesconfirmation of the inferred interior/tip status of finger-prints in expanded fingerprint network I. For example, inthe EF-1α network, the interior clade (1-1) contains all ofthe inferred interior fingerprints within clades 1-1-a and 1-3-a of expanded IGS network I. The inferred tip position ofQ and M in 1-2-a is confirmed in the EF-1α network by theirposition at the tips of the mutational network (Fig. 1C).Similarly, in the CAL network (Fig. 1D) clade 1-2 includesonly fingerprints that were designated as interiors inexpanded IGS network II (Fig. 1B).
Discussion
Based on the distribution of interior haplotypes, Sandvikaand Vestfold were colonized from a common source. IGShaplotypes 9 and 10 are shared between both locations inboth alternative networks, supporting a common origin.The internal clade 1-1-b in the expanded IGS network II,includes both Vestfold and Sandvika fingerprints from1993. The adjacent internal clade 1-2-b comprises a
Vestfold fingerprint (Q) and a Sandvika fingerprint (M)from 1995. The tip clade, 1-3-b, includes only 1995Sandvika fingerprints, consistent with current lack of geneflow between the two locations and evidence supportingthe recent evolution of fingerprints and MCGs in the 1995Sandvika sample. This pattern, showing common origin ofSandvika and Vestfold in the haplotype distributions ininternal clades, with divergence evident in tip clades isevident in the networks of all loci.
We can only address the question of whether there iscontemporary recombination by looking within each of thetwo alternative networks inferred from the recombinationblocks of the IGS. Because both recombination blocks weresampled from Sandvika and Vestfold, we conclude that theblocks represent past recombination events in the ancestorof isolates sampled from both locations. Evidence of trans-position of the repetitive element on which the fingerprintis based and of recombination indicates that DNA finger-prints and MCGs are evolving more rapidly and in a morerecent time frame than haplotypes in the IGS, EF-1α andCAL loci. For example, one haplotype, 5, is associated withseven fingerprints sampled in 1993, 1995, or both years. Insome cases more than one haplotype, e.g. 9 and 13-1, isassociated with only one fingerprint (Q), presumably theresult of mutations in the haplotype locus or recombination.
Our assumption that long branches linking fingerprintsrepresent recombination rather than transposition eventsis reinforced by the stability of fingerprints over 12 years oflaboratory maintenance of many Sclerotinia sclerotiorumstrains. In this time, we have observed one incident oftransposition as evidenced by the loss of a hybridizingfragment in a sector of the strain used as a standard in allSouthern hybridizations in our laboratory. One observa-tion, among approximately 3000 strains maintained underliquid nitrogen for a decade and periodically re-grown andfingerprinted, however, indicates that at least under labor-atory conditions, transposition is not occurring at an espe-cially high frequency, e.g. with every serial transfer. Analternative explanation, that long branches between recov-ered fingerprints are due to unrecovered transpositionalintermediates, is unlikely given the intensive samplingover small spatial areas in a two-year period and the rela-tively low genetic diversity observed.
The significant association of DNA fingerprints tosampling quadrat and location in both alternative extendednetworks (Table 4), as well as the number of unrecoveredintermediates between neighbouring fingerprints in one orboth of the alternate expanded networks indicates thatgenetic exchange has occurred mainly on a fine scale (smallgenetic neighbourhoods) within Sandvika (Kohn 1995).For example, in the 1995 sample in network II, there weremany unrecovered intermediates between quadrats SV-5(fingerprints L and M) and SV-8 (J) but not between SV-1(A, E, F, G, H, I) and SV-8.
MEC_1380.fm Page 2419 Wednesday, September 19, 2001 4:26 PM

2420 I . CARBONE and L . M. KOHN
© 2001 Blackwell Science Ltd, Molecular Ecology, 10, 2409–2422
Evolution of new fingerprints and MCGs was evidentbetween 1993 and 1995. Results from nested contingencyanalysis (Table 4) showed that clades in both extended IGSnetworks I and II have DNA fingerprints that are signifi-cantly associated with MCG and year of sampling. Inextended network II (Fig. 1B, Table 4) there was no varia-tion in the association of DNA fingerprint, MCG and yearof sampling within interior clade 1-1-b (1993 Sandvika andVestfold samples), and within tip clade 1-3-b (1995 Sand-vika sample). It appears that DNA fingerprints have beensignificantly associated with MCG and other phenotypiccategories throughout their evolutionary histories (Table 4).Comparing the results from Tables 4 and 5 for the quantit-ative phenotypic categories (IGS size and sampling year)indicates that the nested analysis of variance (Table 5) mayprovide more statistical power than the nonparametricpermutation analysis in testing for significant associations.For example, both clades 3-1-a and 2-2-b were only margin-ally significant (P-values close to 0.05) in the permutationanalysis (Table 4) but statistically significant in the nestedanalysis of variance (F-values with P < 0.05).
The recovery of some haplotypes from both locations,the lack of any fingerprints common to both locations, andthe ongoing pattern of fine-scale, spatially local, evolutionof new fingerprints at the one location sampled in both1993 and 1995, are all consistent with the hypothesis thatSandvika and Vestfold are part of a metapopulation ofS. sclerotiorum associated with Ranunculus ficaria ratherthan two isolated populations. Locating additional putat-ive demes is not easy. It is difficult to find apothecia pre-dictably during their short period of production, to detectsclerotia in soil, or to bait and isolate the fungus from soil(unpublished). Although the Sandvika population is relat-ively stable, we were fortunate to locate a second samplinglocation at Vestfold and that proved to be ephemeral; thislack of continuity among populations is also consistentwith a metapopulation. One approach to detecting thefungus and more extensively sampling its genetic diversitymight be to screen DNA from R. ficaria with selective PCRprimers.
The polarity in IGS size variants was from small (withininterior clades) to large (within tip clades), with the IGSincreasing in size in both Sandvika and Vestfold samples,further supporting the metapopulation hypothesis. TheIGS ranged in length from 3997 to 4032 bp in this sample ofisolates. An association between IGS length and position inthe network was evident in the IGS extended network Iand the extended network for EF-1α (Table 6). The increasein IGS size was the result of the expansion of two simplemicrosatellite motifs at positions 881 and 2155 and theacquisition of a 27-bp insertion at position 1608 in the IGSconsensus (Table 3). Consistent with the recombinationbreakpoint inferred from a site compatibility analysis plac-ing the recombination event between sites 1563 and 2247
(Fig. 2 of Carbone & Kohn 2001), the putative recombina-tion breakpoint lies between the 1608 and 2155 expansionmotifs. Another possible recombination breakpoint lieswithin the stretch of sequence flanked by the expansionsat sites 881 and 1608. This suggests an association betweenrecombination breakpoints, which could become theboundaries of recombination blocks, and expansion motifs.
Large expansions of a trinucleotide microsatellite motifhave been shown by both genetic and physical assays to bethe sites of chromosome breakage in Saccharomyces cerevi-siae (Freudenreich et al. 1998). Overall genome size may besignificantly increased by expansions at microsatellite andminisatellite loci throughout the genome. Even smallincreases in overall IGS length in S. sclerotiorum are signi-ficant because they are amplified within the tandem rDNAarray. A previous study (Carbone et al. 1999) showed thatthe S. sclerotiorum rDNA repeat units are homogeneous inlength and sequence within any given S. sclerotiorum strain,without the variable-length subrepeat arrays commonlyfound in the intergenic spacer regions of other eukaryoticrDNAs (Crease 1995; Ganley & Scott 1998). Homogeneityin rDNA repeat units comparable to that in S. sclerotiorumhas been reported in Neurospora crassa (Rodland & Russell1983) and Schizosaccharomyces pombe (Liu et al. 1997).Homogeneity in rDNA repeat unit size accompanied by arange in size variants in the array has been reported inexperimental populations of Candida albicans in serial cul-ture under selection for drug resistance (Cowen et al. 2000).
Both of the alternative IGS networks were needed todetect all the associations of interest: fingerprint with IGSsize, sample site, sampling year and MCG. Although 3-4-ais the most likely of the two marginal topologies based onmaximum likelihood analysis of the entire IGS network(Carbone & Kohn 2001), these topologies represent twoalternative histories of the Norwegian R. ficaria populationof S. sclerotiorum. Without the 3-4-b network, useful infer-ences would be lost. Notably, the microsatellite size expan-sions are significant within 3-4-a, while the trend towardnew DNA fingerprints is significant in 3-4-b but not 3-4-a.As in the study of Bosch et al. (1999) a pattern of micro-satellite variation structured by haplotype backgroundwas observed, but our analysis also detected polarity, e.g.a recurrent pattern of microsatellite expansion.
Analysing each locus separately rather than combin-ing them provided independent confirmation of trendsobserved in the IGS. A combined analysis, possible for IGSnetwork I, EF-1α, CAL and for IGS network II, EF-1α andCAL, would result in more finely resolved haplotypenetworks (see Carbone et al. 1999). It would not, however,provide further resolution or corroboration of patterns ofdescent among the more rapidly evolving fingerprints. Forexample, the assignment of fingerprints as interiors or tipsin expanded networks I and II is confirmed by their posi-tion in either interior or tip clades in the EF-1α and CAL
MEC_1380.fm Page 2420 Wednesday, September 19, 2001 4:26 PM

N E S T E D H A P L O T Y P E N E T W O R K S W I T H D N A F I N G E R P R I N T S 2421
© 2001 Blackwell Science Ltd, Molecular Ecology, 10, 2409–2422
loci. Furthermore, a separate analysis of the three unlinkedloci provided independent evidence of the significanttrends in IGS size and sampling year detected in expandednetworks I and II.
The results of this study reinforce the concept that meta-populations are the appropriate level of scale for studyingnatural plant pathogen populations (Burdon 1993). Oursampling localities meet criteria for metapopulations.The two sampling sites share a common origin yet havediverged genetically. For example, the sampling sites sharehaplotypes but neither fingerprints nor MCGs. The patho-gen populations have each developed their own fine-scalespatial distributions and patterns of breeding. Since S. scle-rotiorum was introduced to both locations, the IGS hasincreased in size. The sampling site that was smaller inarea, Vestfold, has apparently become extinct. Whetherour observations of microsatellite expansions and othergenomic changes within a metapopulation structure inS. sclerotiorum pertain generally merits further investigation.
Acknowledgements
For assisting us in sampling, we thank A. Hov, who located theVestfold site, and T. Schumacher (University of Oslo). Thisresearch was supported by a Research Grant to L.M.K. and a Post-graduate Scholarship to I.C., both from the Natural Sciences andEngineering Research Council of Canada.
References
Antonovics J, Thrall PH, Jarosz AM, Stratton D (1994) Ecologicalgenetics of metapopulations: the Silene-Ustilago plant-pathogensystem. In: Ecological Genetics (ed. Real, LA), pp. 146–170.Princeton University Press, Princeton, NJ.
Bosch E, Calafell F, Santos FR et al. (1999) Variation in shorttandem repeats is deeply structured by genetic background onthe human Y chromosome. American Journal of Human Genetics,65, 1623–1638.
Burdon JJ (1993) The structure of pathogen populations in naturalplant communities. Annual Review of Phytopathology, 31, 305–323.
Burdon JJ, Ericson L, Muller WJ (1995) Temporal and spatialchanges in a metapopulation of the rust pathogen Triphragmiumulmariae and its host, Filipendula ulmaria. Journal of Ecology, 83,979–989.
Carbone I, Kohn LM (1999) A method for designing primer sets forspeciation studies in filamentous ascomycetes. Mycologia, 91,553–556.
Carbone I, Kohn LM (2001) A microbial population–species inter-face: nested cladistic and coalescent inference with multilocusdata. Molecular Ecology, 10, 947–964.
Carbone I, Anderson JB, Kohn LM (1999) Patterns of descent inclonal lineages and their multilocus fingerprints are resolvedwith combined gene genealogies. Evolution, 53, 11–21.
Carlsson U, Elmqvist T (1992) Epidemiology of anther-smutdisease (Microbotryum violaceum) and numeric regulation ofpopulations of Silene dioica. Oecologia, 90, 509–517.
Couch BC, Kohn LM (2000) Clonal spread of Sclerotium cepivorumin onion production with evidence of past recombination events.Phytopathology, 90, 514–521.
Cowen LE, Sanglard D, Calabrese D, Sirjusingh C, Anderson JB,Kohn LM (2000) Evolution of drug resistance in experimentalpopulations of Candida albicans. Journal of Bacteriology, 182, 1515–1522.
Crandall KA (1996) Multiple interspecies transmissions of humanand simian T-cell leukemia/lymphoma virus type I sequences.Molecular Biology and Evolution, 13, 115–131.
Crandall KA, Templeton AR (1999) Statistical approaches todetecting recombination. In: The Evolution of HIV (ed. Crandall,KA), pp. 153–176. Johns Hopkins University Press, Baltimore.
Crease TJ (1995) Ribosomal DNA evolution at the populationlevel: Nucleotide variation in intergenic spacer arrays of Daphniapulex. Genetics, 141, 1327–1337.
Ericson L, Burdon JJ, Müller WJ (1999) Spatial and temporaldynamics of epidemics of the rust fungus Uromyces valerianae onpopulations of its host Valeriana salina. Journal of Ecology, 87,649–658.
Farris JS, Kallersjö M, Kluge AG, Bult C (1995) Testing significanceof incongruencies. Cladistics, 10, 315–319.
Felsenstein J (1982) Numerical methods for inferring evolutionarytrees. Quarterly Review of Biology, 57, 379–404.
Freudenreich CH, Kantrow SM, Zakian VA (1998) Expansion andlength-dependent fragility of CTG repeats in yeast. Science, 279,853–856.
Ganley ARD, Scott B (1998) Extraordinary ribosomal spacer lengthheterogeneity in a neotyphodium endophyte hybrid: Implica-tions for concerted evolution. Genetics, 150, 1625–1637.
Gordon TR, Okamoto D, Milgroom MG (1992) The structure andinterrelationship of fungal populations in native and cultivatedsoils. Molecular Ecology, 1, 241–249.
Hasegawa M, Kishino H, Yano T (1985) Dating of the human-apesplitting by a molecular clock of mitochondrial DNA. Journal ofMolecular Evolution, 22, 160–174.
Huelsenbeck JP, Bull JJ, Cunningham CW (1996) Combining datain phylogenetic analysis. Trends in Ecology and Evolution, 11,152–158.
Kohli Y, Brunner LJ, Yoell H et al. (1995) Clonal dispersal andspatial mixing in populations of the plant pathogenic fungus,Sclerotinia sclerotiorum. Molecular Ecology, 4, 69–77.
Kohn LM (1995) The clonal dynamic in wild and agriculturalplant-pathogen populations. Canadian Journal of Botany, 73,S1231–S1240.
Kohn LM, Stasovski E, Carbone I, Royer J, Anderson JB (1991)Mycelial incompatibility and molecular markers identifygenetic variability in field populations of Sclerotinia sclerotiorum.Phytopathology, 81, 480–485.
Liu Z, Zhao A, Chen L, Pape L (1997) Activated levels of rRNAsynthesis in fission yeast are driven by an intergenic rDNAregion positioned over 2500 nucleotides upstream of the initia-tion site. Nucleic Acids Research, 25, 659–667.
Malloch D, Blackwell M (1992) Dispersal of fungal diaspores. In:The Fungal Community: its Organization and Role in the Ecosystem(eds Carroll, GC, Wicklow, DT), 2nd edn, pp. 147–171. MarcelDekker, New York, Basel, Hong Kong.
Rodland KD, Russell PJ (1983) Ribosomal genes of Neurosporacrassa: constancy of gene number in the conidial and mycelialphases, and homogeneity in length and restriction enzymecleavage sites within strains. Molecular and General Genetics, 192,285–297.
Roff DA, Bentzen P (1989) The statistical analysis of mitochondrialDNA polymorphisms: Χ2 and the problem of small samples.Molecular Biology and Evolution, 6, 539–545.
MEC_1380.fm Page 2421 Wednesday, September 19, 2001 4:26 PM

2422 I . CARBONE and L . M. KOHN
© 2001 Blackwell Science Ltd, Molecular Ecology, 10, 2409–2422
SAS (1990) SAS/STAT User’s Guide, Version 6. SAS Institute Inc.,Cary, NC.
Sober E (1988) Reconstructing the Past: Parsimony, Evolution, andInference. MIT Press, Cambridge, MA.
Strimmer K, von Haeseler A (1996) Quartet puzzling: a quartetmaximum-likelihood method for reconstructing tree topologies.Molecular Biology and Evolution, 13, 964–969.
Swofford DL (1998) PAUP*. Phylogenetic Analysis Using Parsimony(*and Other Methods), Version 4.0. Sinauer Associates, Sunder-land, MA.
Templeton AR, Sing CF (1993) A cladistic analysis of phenotypicassociations with haplotypes inferred from restriction endonu-clease mapping. IV. Nested analyses with cladogram uncertaintyand recombination. Genetics, 134, 659–669.
Templeton AR, Boerwinkle E, Sing CF (1987) A cladistic analysis ofphenotypic associations with haplotypes inferred from restrictionendonuclease mapping. I. Basic theory and an analysis of alcoholdehydrogenase activity in Drosophila. Genetics, 117, 343–351.
Templeton AR, Crandall KA, Sing CF (1992) A cladistic analysis ofphenotypic associations with haplotypes inferred from restriction
endonuclease mapping and DNA sequence data. III. Cladogramestimation. Genetics, 132, 619–633.
Templeton AR, Clark AG, Weiss KM, Nickerson DA, BoerwinkleE, Sing CF (2000a) Recombinational and mutational hotspotswithin the human lipoprotein lipase gene. American Journal ofHuman Genetics, 66, 69–83.
Templeton AR, Weiss KM, Nickerson DA, Boerwinkle E, Sing CF(2000b) Cladistic structure within the human lipoprotein lipasegene and its implications for phenotypic association studies.Genetics, 156, 1259–1275.
This work was part of the PhD research of Ignazio Carbone. Thegoal was to understand the history of population divergence andspeciation in a cosmopolitan group of plant parasitic fungi, theSclerotiniaceae, by bringing a sequence of phylogenetic andcoalescent approaches to bear on a large multilocus data set. Thiswork is part of on-going research on the systematics of theSclerotiniaceae in the Kohn laboratory.
MEC_1380.fm Page 2422 Wednesday, September 19, 2001 4:26 PM