blackberry ir summary - blackberry software - secure …€¦ · blackberry ir summary ... secure...
TRANSCRIPT


SAFE HARBOR Forward-looking statements in this presentation are made pursuant to the "safe harbor" provisions of the U.S. Private Securities Litigation Reform Act of 1995 and applicable Canadian securities laws. When used herein, words such as "expect", "anticipate", "estimate", "may", "will", "should", "intend", "believe", and similar expressions, are intended to identify forward-looking statements. Forward-looking statements are based on estimates and assumptions made by BlackBerry Limited in light of its experience and its perception of historical trends, current conditions and expected futuredevelopments, as well as other factors that BlackBerry believes are appropriate in the circumstances. Many factors could cause BlackBerry's actual results, performance or achievements to differ materially from those expressed or implied by the forward-looking statements, including those described in the "Risk Factors" section of BlackBerry's Annual Information Form, which is included in its Annual Report on Form 40-F (copies of which filings may be obtained at www.sedar.com or www.sec.gov). These factors should be considered carefully, and readers should not place undue reliance on BlackBerry's forward-looking statements. BlackBerry has no intention and undertakes no obligation to update or revise any forward-looking statements, whether as a result of new information, future events or otherwise, except as required by law.BlackBerry and related trademarks, names and logos are the property of BlackBerry Limited and are registered and/or used in the U.S. and countries around the world. All other marks are the property of their respective owners. BlackBerry is not responsible for any third-party products or services.
2 Public

OUR VISIONA securely connected world.
OUR MISSIONTo be the world’s trusted and leading provider of technology platforms
for secure connectivity.
OUR VALUE PROPOSITIONWe deliver the most secure end-to-end mobility solutions to connect
you to the ‘things’ and people you need.

A DIFFERENTIATED MOBILE COMPUTING EXPERIENCE
Secure HardwarePassport, Classic, etc.
Secure OSBlackBerry 10
Secure SoftwareBlackBerry Balance
Secure NetworkBlackBerry Infrastructure
Secure ManagementBES12
Secure Instant MessagingBBM Protected, AtHoc
Secure VoiceSecuSUITE
Secure TextSecuSUITE
Secure ConferencingBBM Meetings
Secure File SharingWatchDox
• Delivering the only end-to-end platform for mobile security

SERVING THE ENTIRE MARKET• Taking our value proposition cross-platform
BBM cross-platform
Amazon App Store on BB10
Cross-platform EMM
Partner with Samsung to
manage Samsung devices
Android for Work CHACE
BTS / IoT WorkLife WatchDox AtHoc

CONNECTING ‘THINGS’• Expanding beyond mobile to a world of endpoints
Mobile Workforce
“Things”
Information/Analytics
Ente
rpris
e
BB
M
Dev
ices Internet of
Things PlatformMobile
Applications
Tech
nolo
gySo
lutio
ns
Productivity Applications
Security +
Leading Patent Portfolio
7 Public
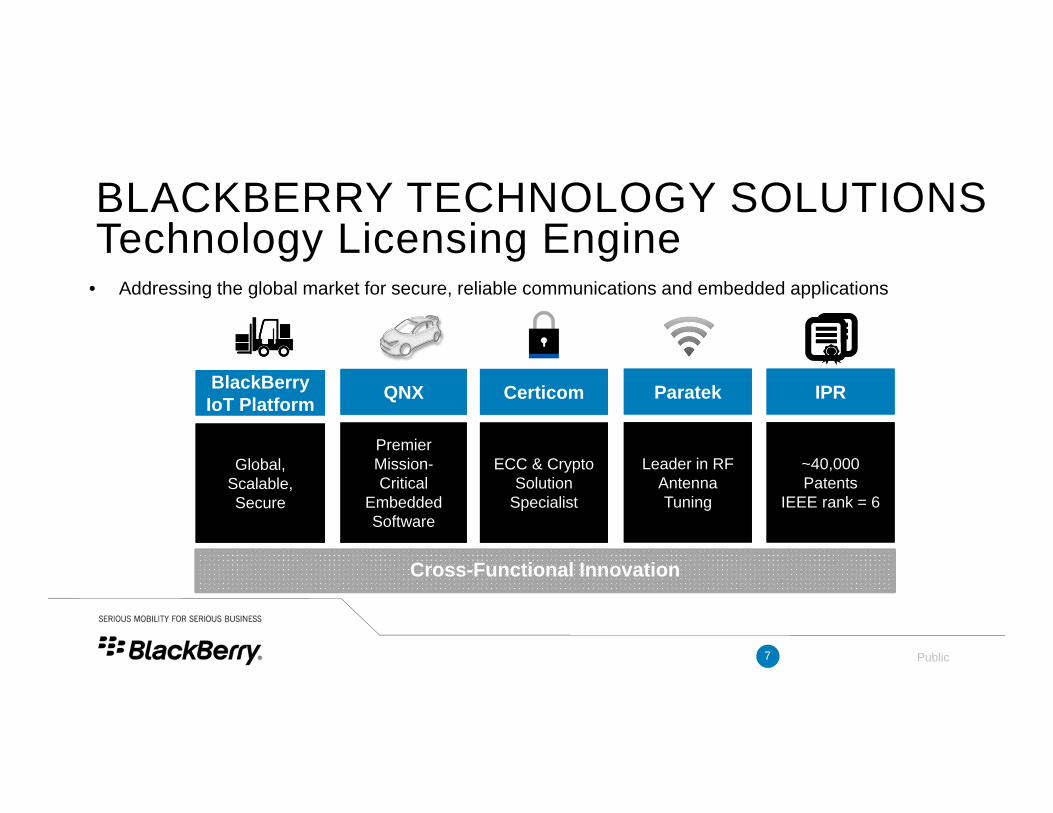
BLACKBERRY TECHNOLOGY SOLUTIONSTechnology Licensing Engine
• Addressing the global market for secure, reliable communications and embedded applications
Global, Scalable,Secure
Global, Scalable,Secure
Premier Mission-Critical
Embedded Software
Premier Mission-Critical
Embedded Software
ECC & Crypto Solution
Specialist
ECC & Crypto Solution
Specialist
Cross-Functional Innovation
Leader in RF Antenna Tuning
Leader in RF Antenna Tuning
~40,000 Patents
IEEE rank = 6
~40,000 Patents
IEEE rank = 6
BlackBerry IoT PlatformBlackBerry IoT Platform QNXQNX CerticomCerticom ParatekParatek IPRIPR

8 Public
THE BLACKBERRY IoT PLATFORM• Combines multiple BlackBerry assets to create solutions that manage and secure devices on the edge
of the network

9 Public
OUR MANAGEMENT TEAM
Billy HoEVP, Enterprise Products and VAS
Steve E. ZippersteinChief Legal Officer
Carl WiesePresident, Global Sales
Nita White-IvyEVP, Human Resources
James YershChief Financial Officer
Ron LouksPresident, Devices and Emerging Solutions
Marty BeardChief Operating Officer
Sandeep ChennakeshuPresident, Technology Solutions
John ChenChief Executive Officer and Executive Chair
James MackeyEVP, Corporate Development and Strategic Planning

10 Public
FINANCIAL HIGHLIGHTS
• Driving to non-GAAP profitability some time in FY16• Expect positive free cash flow to continue
>50% reduction in non-GAAP OpEx Tracking to sustainable profitability in Q4 FY16
Cash flow improved, stable cash balance
(40%)
(30%)
(20%)
(10%)
0%
10%
20%
30%
40%
50%
60%
$0
$200
$400
$600
$800
$1,000
$1,200
$1,400
Q1 FY14 Q2 FY14 Q3 FY14 Q4 FY14 Q1 FY15 Q2 FY15 Q3 FY15 Q4 FY15 Q1 FY16 Q2 FY16
Non‐GAAP OpEx Non‐GAAP Gross Margin Non‐GAAP operating margin
($0.80)($0.70)($0.60)($0.50)($0.40)($0.30)($0.20)($0.10)$0.00$0.10$0.20
$0
$500
$1,000
$1,500
$2,000
$2,500
$3,000
$3,500
Q1 FY14 Q2 FY14 Q3 FY14 Q4 FY14 Q1 FY15 Q2 FY15 Q3 FY15 Q4 FY15 Q1 FY16 Q2 FY16
Revenue ($M) Non‐GAAP Earnings (Loss) per Share
$0
$500
$1,000
$1,500
$2,000
$2,500
$3,000
$3,500
$4,000
Q1 FY14 Q2 FY14 Q3 FY14 Q4 FY14 Q1 FY15 Q2 FY15 Q3 FY15 Q4 FY15 Q1 FY16 Q2 FY16

11 Public
• Expected modest sequential revenue increases in each of the remaining quarters of FY16
• Expected software and technology revenue of about $500M in FY16
• SAF declining ~15% sequentially
NON-GAAP REVENUE DETAILS
$794 $724 $632 $548 $519 $421 $365 $301 $252 $211
$60 $63
$56 $56 $54
$62 $57 $74 $137 $74
↑$2,181
$770
$476 $358 $379 $418
$361 $274 $263
$201
$1,573
$1,193
$976 $966 $916 $793
$660 $658 $491
$0
$250
$500
$750
$1,000
$1,250
$1,500
$1,750
$2,000
Q1 FY14 Q2 FY14 Q3 FY14 Q4 FY14 Q1 FY15 Q2 FY15 Q3 FY15 Q4 FY15 Q1 FY16 Q2 FY16
Rev
enue
($M
)
Other Service Access Fees Software and Services Hardware

12 Public
• Cash balance of $3.35B, an increase of $37 million after using $47 million for share repurchases
• 6th consecutive quarter of positive free cash flow ($100M in Q2 FY16)
• In September, acquired AtHoc for $250M and announced agreement to acquire Good Technologies for $425M
FINANCIAL DISCIPLINE
$3,071
$2,569
$3,192
$2,658
$3,087 $3,098 $3,110 $3,266 $3,316 $3,353 $547
($248)
($123)
($575)
$276
$92 $169 $189
$123 $100
($750)
($500)
($250)
$0
$250
$500
$750
$0
$500
$1,000
$1,500
$2,000
$2,500
$3,000
$3,500
$4,000
Q1FY14
Q2FY14
Q3FY14
Q4FY14
Q1FY15
Q2FY15
Q3FY15
Q4FY15
Q1FY16
Q2FY16
Free Cash Flow
($M)
Bal
ance
s ($
M)
Cash and cash equivalents Short-term investments
Long-term investments & Restricted cash Free cash flow

FINANCIALS
Public

14 Public
GAAP INCOME STATEMENTGAAP Income Statement (Three Months Ended)
Q1 FY15 Q2 FY15 Q3 FY15 Q4 FY15 FY15 Q1 FY16 Q2 FY16Software and Services 54$ 62$ 57$ 74$ 247$ 137$ 73$ Hardware 379 418 361 274 1,432 263 201 Service Access Fees 519 421 365 301 1,606 252 211 Other 14 15 10 11 50 6 5
Revenue 966 916 793 660 3,335 658 490 Cost of Sales
Cost of sales 502 491 365 311 1,669 329 301 Inventory write-down 23 7 24 41 95 21 4 Supply commitment charges (recovery) (10) (7) (6) (10) (33) (2) - Total cost of sales 515 491 383 342 1,731 348 305
Gross profit 451 425 410 318 1,604 310 185 Operating expenses
Research and development 237 186 154 134 711 139 122 Selling, marketing and administration 400 195 171 172 938 174 191 Amortization 81 75 74 68 298 65 67 Debentures fair value adjustment (287) 167 150 50 80 (157) (228) Total operating expenses 431 623 549 424 2,027 221 152
Operating income (loss) 20 (198) (139) (106) (423) 89 33 Investment income (loss), net (26) (20) (21) 105 38 (16) (12)
Income (loss) before income taxes (6) (218) (160) (1) (385) 73 21 Income taxes (recovery) (29) (11) (12) (29) (81) 5 (30) Net income (loss) 23 (207) (148) 28 (304) 68 51 Earnings (loss) per share
Basic earnings (loss) per share 0.04$ $ (0.39) $ (0.28) $ 0.05 (0.58)$ $0.13 $0.10
Diluted earnings (loss) per share (0.37)$ $ (0.39) $ (0.28) $ 0.05 (0.58)$ ($0.10) ($0.24)
Weighted-average number of common shares outstanding (000’s)Basic 526,742 527,218 528,090 528,685 527,684 529,235 526,314 Diluted 658,228 527,218 528,090 543,556 527,684 670,539 667,321

15 Public
NON-GAAP ADJUSTMENTS AND EBITDA Non-GAAP adjustments (Pre-Tax)
Q1 FY15 Q2 FY15 Q3 FY15 Q4 FY15 FY15 Q1 FY16 Q2 FY16Rockstar sale adjustment -$ -$ -$ (115)$ (115)$ -$ -$ Debentures fair value adjustment (287) 167 150 50 80 (157) (228) CORE program charges 226 33 5 58 322 9 6 RAP charges - - - - - 52 79 Software deferred revenue acquired - - - - - - 1 Stock compensation expense 13 8 14 14 49 14 14 Acquired intangibles amortization 9 10 10 9 38 9 11 Total Non-GAAP adjustments (Pre-Tax) (39)$ 218$ 179$ 16$ 374$ (73)$ (117)$
Non-GAAP adjustments (After-Tax)Q1 FY15 Q2 FY15 Q3 FY15 Q4 FY15 FY15 Q1 FY16 Q2 FY16
Rockstar sale adjustment -$ -$ -$ (115)$ (115)$ -$ -$ Debentures fair value adjustment (287) 167 150 50 80 (157) (228) CORE program charges 204 29 4 57 294 9 6 RAP charges - - - - - 52 79 Software deferred revenue acquired - - - - - - 1 Stock compensation expense 13 8 14 14 49 14 14 Acquired intangibles amortization 9 10 10 9 38 9 11 Total Non-GAAP adjustments (After-Tax) (61)$ 214$ 178$ 15$ 346$ (73)$ (117)$
Non-GAAP gross profitQ1 FY15 Q2 FY15 Q3 FY15 Q4 FY15 FY15 Q1 FY16 Q2 FY16
GAAP revenue 966$ 916$ 793$ 660$ 3,335$ 658$ 490$ Software deferred revenue acquired - - - - - - 1 Non-GAAP revenue 966 916 793 660 3,335 658 491 Total cost of sales (515) (491) (383) (342) (1,731) (348) (305) Non-GAAP adjustments to cost of sales 13 10 - 2 25 21 15 Non-GAAP gross profit 464$ 435$ 410$ 320$ 1,629$ 331$ 201$

16 Public
NON-GAAP ADJUSTMENTS AND EBITDA (cont)
Adjusted EBITDAQ1 FY15 Q2 FY15 Q3 FY15 Q4 FY15 FY15 Q1 FY16 Q2 FY16
GAAP operating income (loss) 20$ (198)$ (139)$ (106)$ (423)$ 89$ 33$ Non-GAAP adjustments to operating income (39) 218 179 131 489 (73) (117) Non-GAAP operating income (loss) (19) 20 40 25 66 16 (84) Amortization 191 171 170 162 694 164 163
Acquired amortization intangibles (9) (10) (10) (9) (38) (9) (11) Adjusted EBITDA 163$ 181$ 200$ 178$ 722$ 171$ 68$
Reconciliation from GAAP net income (loss) to non-GAAP net income (Loss) and non-GAAP earnings (loss) per shareQ1 FY15 Q2 FY15 Q3 FY15 Q4 FY15 FY15 Q1 FY16 Q2 FY16
GAAP net income (Loss) 23$ (207)$ (148)$ 28$ (304)$ 68$ 51$ Total Non-GAAP adjustments (after-tax) (61) 214 178 15 346 (73) (117) Non-GAAP Net Income (Loss) (38) 7 30 43 42 (5) (66)
Non-GAAP Earnings (Loss) per Share (0.07)$ $ 0.01 $ 0.06 $ 0.08 0.08$ $ (0.01) $ (0.13)Shares outstanding for Non-GAAP Loss per Share reconciliation 526,742 537,959 540,400 543,556 542,123 529,235 526,314
Non-GAAP revenue, non-GAAP loss before income taxes, non-GAAP net loss, non-GAAP gross profit, adjusted EBITDA and non-GAAP loss per share do not have a standardized meaning prescribed by GAAP and thus are not comparable to similarly titled measures presented by other issuers. The Company believes that the presentation of these non-GAAP measures enables the Company and its shareholders to better assess the Company’s operating results relative to its operating results in prior periods and improves the comparability of the information presented. This non-GAAP information should not be considered as a substitute for, or superior to, measures of financial performance prepared in accordance with GAAP. You are encouraged to review the Company’s filings on SEDAR and EDGAR. The Company makes no commitment to update the information above subsequently.

17 Public
AMORTIZATION AND RESTRUCTURING DETAILS

18 Public
• BlackBerry’s stock has outperformed TSX since the beginning of 2014
• Outperformed publicly traded EMM competition
BLACKBERRY STOCK
01,0002,0003,0004,0005,0006,0007,0008,000
$0.00
$2.00
$4.00
$6.00
$8.00
$10.00
$12.00
$14.00
Jan, 201
4
Feb, 201
4Mar, 201
4
Apr, 2014
May, 2014
Jun, 201
4
Jul, 20
14
Aug, 201
4
Sep, 201
4
Oct, 201
4
Nov, 201
4
Dec, 2014
Jan, 201
5
Feb, 201
5Mar, 201
5
Apr, 2015
May, 2015
Jun, 201
5
Jul, 20
15
Aug, 201
5
Sep, 201
5
BBRY (‐6%) MOBL (‐69% since IPO) Nasdaq Composite (+15%)
0
5,000
10,000
15,000
20,000
25,000
30,000
$0.00$2.00$4.00$6.00$8.00$10.00$12.00$14.00$16.00$18.00
Jan, 201
4
Feb, 201
4Mar, 201
4
Apr, 20
14
May, 201
4
Jun, 201
4
Jul, 20
14
Aug, 201
4
Sep, 201
4
Oct, 201
4
Nov, 201
4
Dec, 201
4
Jan, 201
5
Feb, 201
5Mar, 201
5
Apr, 20
15
May, 201
5
Jun, 201
5
Jul, 20
15
Aug, 201
5
Sep, 201
5
BB (+17%) TSX Composite (+1%)