bismuth-containing multiferroics; synthesis, structure and...
TRANSCRIPT

Bismuth-containing multiferroics; Synthesis,
structure and magnetic properties
Master of Science Thesis in the Masters Degree Programme Materials and Nanotechnology
Shengzhen Cai
Department of Chemical and Biological Engineering
Division of Energy and Materials
CHALMERS UNIVERSITY OF TECHNOLOGY
Gothenburg, Sweden, 2013

1
Abstract
Materials that combine multiple ferroic properties, such as ferromagnetism, ferroelectricity and ferroelasticity,
are defined as multiferroics. Attempt to reduce the electrical leakage, enhance the magnetoelectric property as
well as stabilize the formed multiferroics BiFeO3 was made by adding various dopants or forming solid
solution with other compounds.
Conventional solid state method was adopted to synthesize the xBiFeO3-(1-x)SrTiO3 (0.1≤x≤0.7).X-ray
diffraction data indicated a stabilized cubic structure up to x=0.6, above which a structural phase transition
towards a rhombohedral R3c emerged. As more BiFeO3 incorporated, the magnetic property of
xBiFeO3-(1-x)SrTiO3 shows a conversion from paramagnetism to antiferromagnetism with trace amount of
ferromagnetism.
In addition to the xBiFeO3-(1-x)SrTiO3, coprecipitation route was chosen to prepare Bi1-xLaxFeO3 (0≤x≤0.2)
and Bi1-xTbxFeO3 (0≤x≤0.2). Thermal analysis was performed on the powdered Bi1-xLaxFeO3 by means of DSC.
In comparison with the Curie temperature, the Neel temperature is less sensitive to the compositional change.
Meanwhile, the structures of Bi1-xLaxFeO3 (0≤x≤0.2) and Bi1-xTbxFeO3 (0≤x≤0.2) were characterized by XRD.
Depending on the concentration of substituted elements and the ionic size difference among Tb3+
, La3+
and
Bi3+
, the PbZrO3-type Pbam structure is only stable in the phase transformation of the lanthanum substituted
bismuth ferrite.
2
Table of Contents
Abstract ................................................................................................................................................................. 1
1. Introduction ....................................................................................................................................................... 3
1.1 Aim of this project .................................................................................................................................. 3
1.2 Ferroic properties and multiferroics ........................................................................................................ 3
1.3 Tilted octahedra in perovskite ................................................................................................................. 6
1.4 BiFeO3 .................................................................................................................................................... 8
2. Techniques used in the project ........................................................................................................................ 12
2.1 PXRD .................................................................................................................................................... 12
2.2 Thermal Analysis .................................................................................................................................. 14
2.3 Magnetization measurement ................................................................................................................. 14
2.4 Calcination and sintering ...................................................................................................................... 14
2.5 synthesis routes for nanoscale BiFeO3 .................................................................................................. 15
3. Experimental results on BiFeO3 and related compounds ................................................................................ 16
3.1 xBiFeO3-(1-x) SrTiO3 ........................................................................................................................... 16
3.2 Isovalently substituted multiferroic BiFeO3.......................................................................................... 21
3.2.1 Bi1-xLax FeO3 .............................................................................................................................. 21
3.2.2 Bi1-xTbxFeO3 .............................................................................................................................. 32
Conclusion .......................................................................................................................................................... 34
Scopes of future work ......................................................................................................................................... 35
Acknowledgments .............................................................................................................................................. 36
Reference ............................................................................................................................................................ 37

3
1. Introduction
1.1 Aim of this project
Motivated by the previous investigations of multiferroic material bismuth ferrite, it stimulates further efforts to
synthesize binary perovskite solution xBiFeO3-(1-x)SrTiO3 as well as the isovalently substituted BiFeO3, i.e.
Bi1-xLaxFeO3(0≤x≤0.2) and Bi1-xTbxFeO3(0≤x≤0.2) in order to track their phase transformations at different
compositions and develop different synthesis methods that can curb the formation of impurity phases.
The purpose of this research study was to strengthen understanding about solid state chemistry and to
familiarized with different synthesis methods and various characterization techniques, e.g. calorimetric,
gravimetric and diffraction techniques.
1.2 Ferroic properties and multiferroics
Ferro- is a prefix which means iron in Latin, it is primitively used to describe materials exhibiting strong
magnetic properties as iron does. Apart from iron, other elements like cobalt, nickel and rare earth elements
also exhibit magnetic behavior called ferromagnetism, which enables materials made from the
above-mentioned elements to form permanent magnets.
Ferromagnetic materials were reported to have a long-range ordering phenomenon at the atomic level. Many
small domains can be found in a magnetic material with plenty of unpaired electrons inside. Microscopically,
those unpaired electrons are not randomly aligned, they interact with others to make the alignment in the same
direction within the same domain. However, these domains are randomly aligned so that on the whole, they
cancel out to make zero magnetism.
When an external magnetic field is applied, those domains with the magnetic field grow at the expense of their
neighboring domains, causing materials to be magnetized. This phenomenon is characterized by a hysteresis
loop of magnetization M as a function of external magnetic field H, as illustrated in Figure 1.1 (a). It is
obvious that the magnetization is saturated at high magnetic field and a remnant magnetization can still exist in
the absence of the field. In addition, the direction of magnetization could be reversed provided that the external
4
magnetic field is switched oppositely with quite strong field intensity.
However, the ferromagnetic material can lose its ferromagnetic properties under thermal agitation, the
temperature that characterizes this phenomenon is known as the “Curie temperature (Tc)”, above which
spontaneous ferromagnetism becomes paramagnetism which owns a small, positive susceptibility to magnetic
fields and can’t keep this magnetic properties after removal of the external field.
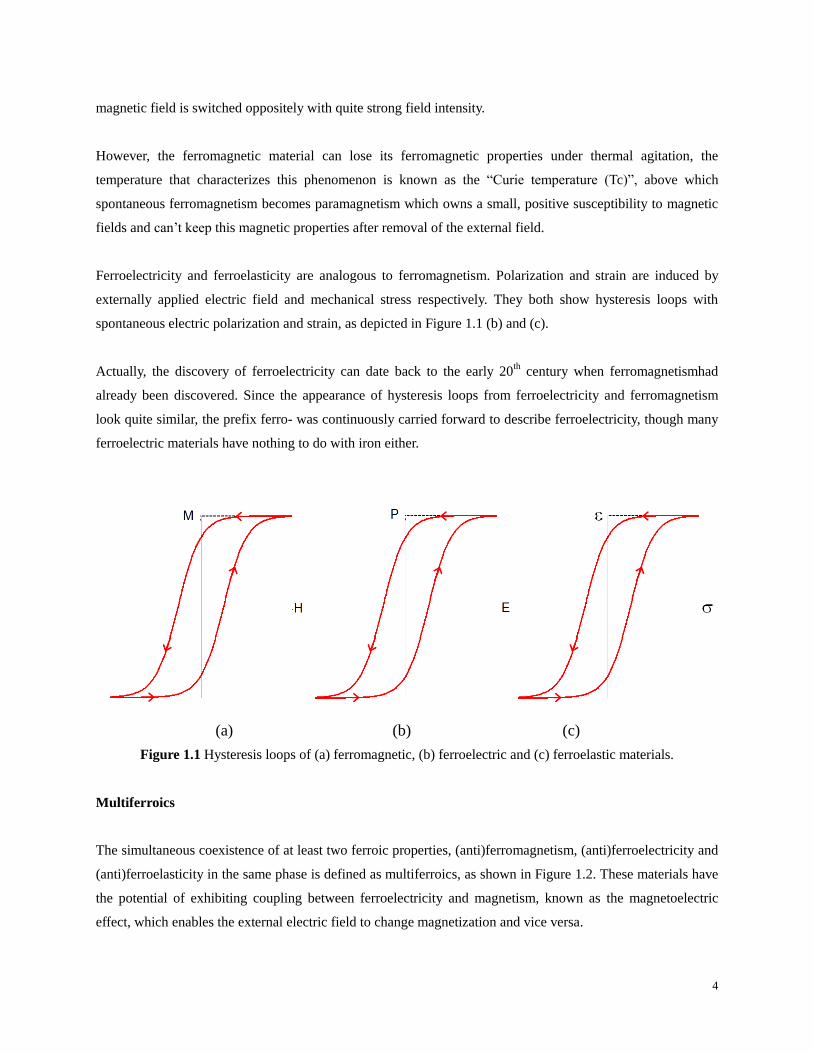
Ferroelectricity and ferroelasticity are analogous to ferromagnetism. Polarization and strain are induced by
externally applied electric field and mechanical stress respectively. They both show hysteresis loops with
spontaneous electric polarization and strain, as depicted in Figure 1.1 (b) and (c).
Actually, the discovery of ferroelectricity can date back to the early 20th century when ferromagnetismhad
already been discovered. Since the appearance of hysteresis loops from ferroelectricity and ferromagnetism
look quite similar, the prefix ferro- was continuously carried forward to describe ferroelectricity, though many
ferroelectric materials have nothing to do with iron either.
(a) (b) (c)
Figure 1.1 Hysteresis loops of (a) ferromagnetic, (b) ferroelectric and (c) ferroelastic materials.
Multiferroics
The simultaneous coexistence of at least two ferroic properties, (anti)ferromagnetism, (anti)ferroelectricity and
(anti)ferroelasticity in the same phase is defined as multiferroics, as shown in Figure 1.2. These materials have
the potential of exhibiting coupling between ferroelectricity and magnetism, known as the magnetoelectric
effect, which enables the external electric field to change magnetization and vice versa.

5
Figure 1.2 Schematic illustration of multiferroic defined from the overlap region of ferroelectric and
magnetic.5
However, looking back in history, the combination and correlation of magnetism and electricity were well
interpreted by Maxwell equations in the 19th
century, but magnetic and electric ordering in solids were always
treated separately at that time. This is because the magnetic properties were understood to be attributed to the
spin of electrons while the electric properties resulted from the electric charges of ions and electrons.
This situation changed after the hypothesis was proved to be untrue. The preliminary proposal of the
magnetoelectric effect was made in 1894 by Curie indicating that an asymmetric molecular body can be
polarized by a magnetic field. Later in 1960, Dzyaloshinskii1 predicted the magnetoelectric effect in
antiferromagnetic Cr2O3 and in the meantime, Astrov2 also observed this coupling by measuring the electric
field-induced magnetization. The magnetic field induced-electric polarization was also studied by Folen et al.3
in 1961.
Nowadays, the coexistence of ferroelectricity and magnetism attracts a great deal of attention. The potential
application of multiferroics is quite extensive and promising, ranging from giant electric transformers to a
small computer memory devices or even tiny sensors.4
Unfortunately, most of the multiferroics are not
naturally-occurring materials and fewer materials possess magnetoelectric properties. Majority of multiferroic
materials have low magnetic ordering and ferroelectric transition temperature. This can be partly improved by
introducing dopants (such as rare-earth elements) into the original material. Moreover, since the microscopic
origin of magnetism can be described as the presence of localized electrons, mainly in the partially filled d or f
shell of transition metals or rare-earth ions having a corresponding localized spin. By contrast, ferroelectric
materials require transition metal ion with an empty d shell, and the displacement of such transition metal ion
towards an apical atom (normally oxygen) creates electric diploes that are stabilized by the strong covalent
6
bonds between O 2p and empty d orbitals. The mutual exclusion of ferroelectricity and magnetism give rise to
a problem called "d0 versus d
n ". In order for the coexistence of magnetism and ferroelectricity to occur, both
the elements and structures need to be considered. In the perovskite type structure (ABO3) multiferroics, the A
site element is selected to take the responsibility for the ferroelectricity while the element at the B site accounts
for the magnetism. For instance in the perovskite BiMnO3, the 6s2 lone pair of Bi
3+ tends to hybridize with O
2p orbital, which improves the ferroelectricity by driving the Bi3+
towards the oxygen ions, while the Mn
cation has non-zero d-electrons.
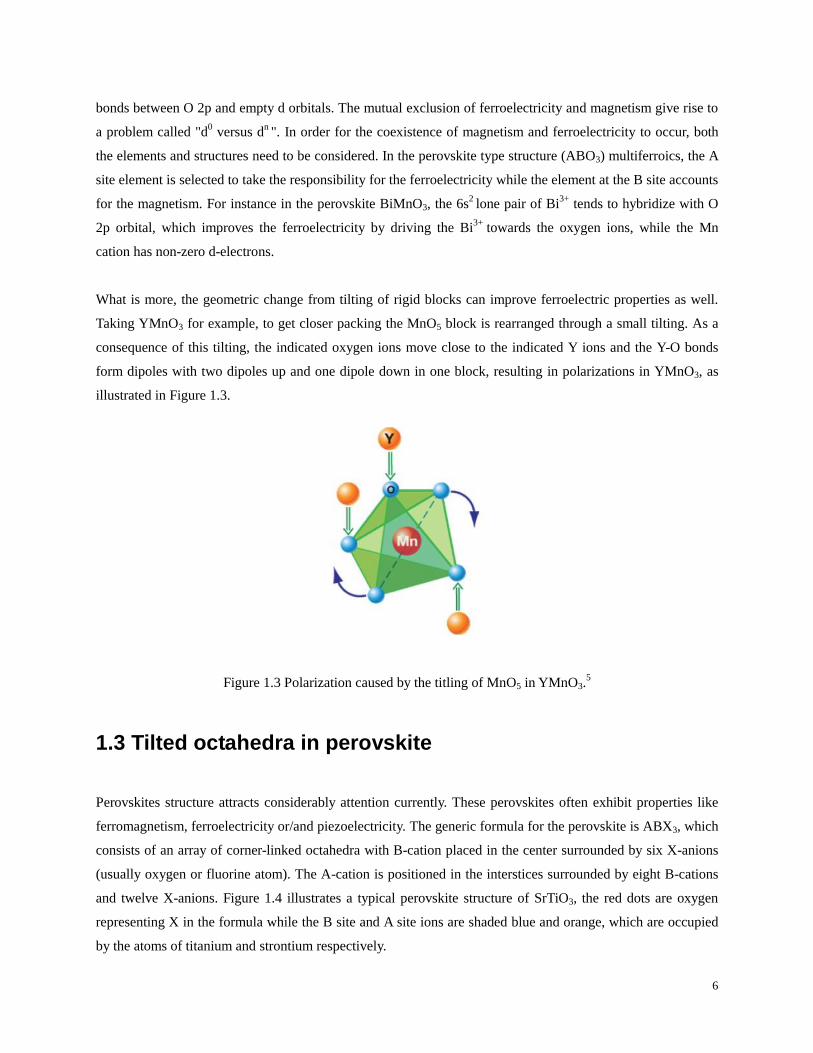
What is more, the geometric change from tilting of rigid blocks can improve ferroelectric properties as well.
Taking YMnO3 for example, to get closer packing the MnO5 block is rearranged through a small tilting. As a
consequence of this tilting, the indicated oxygen ions move close to the indicated Y ions and the Y-O bonds
form dipoles with two dipoles up and one dipole down in one block, resulting in polarizations in YMnO3, as
illustrated in Figure 1.3.
Figure 1.3 Polarization caused by the titling of MnO5 in YMnO3.5
1.3 Tilted octahedra in perovskite
Perovskites structure attracts considerably attention currently. These perovskites often exhibit properties like
ferromagnetism, ferroelectricity or/and piezoelectricity. The generic formula for the perovskite is ABX3, which
consists of an array of corner-linked octahedra with B-cation placed in the center surrounded by six X-anions
(usually oxygen or fluorine atom). The A-cation is positioned in the interstices surrounded by eight B-cations
and twelve X-anions. Figure 1.4 illustrates a typical perovskite structure of SrTiO3, the red dots are oxygen
representing X in the formula while the B site and A site ions are shaded blue and orange, which are occupied
by the atoms of titanium and strontium respectively.

7
Figure 1.4 Stereo illustration of B-cell octahedral framework of perovskite SrTiO3.
In fact, perovskite can be viewed from different perspectives. The stereo picture presented above is a B-cell
setting with B-site at the origin and A-site in the center of eight octahedra. However, A-cell setting is also exist
and preferred in some cases, where perovskite is originated from A-site and making B-site positioned at the
center of the cell (see Figure 1.5).
Figure 1.5 Perovskite structure of A-cell setting with B-site positioned at the center of the unit cell..
For materials with perovskite structures, it can be an ideal structure without any tiltings and distortions, like
SrTiO3 depicted in Figure 1.4 at room temperature. However, under certain conditions, structures with ion
displacement or/and octahedral tilting might take place, which could change their original symmetry and unit
cell parameters.
The octahedra can be tilted in various ways, which influences their neighbours and changes the whole crystal
symmetry. In order to fully understand the changes of structures, a logical interpretation has been proposed by
A.M.Glazer in 19726. He divided the overall tilts according to the three axes ( [100], [010] and [001]) and three
letters were chosen to indicate the magnitudes of tilting along the three axes. Superscripts + or – were adopted
to show whether the successive octahedral tilting is in the same direction (+) or in opposite direction (-) or

8
even without moving (0). Unequal tilts are denoted by different letters while equal tilts are characterized by the
same letter, 0 means no tilts at all along that axis. For instance, a0b
+c
- indicates unequal tilts occur along the
axes of [010] and [001] but no tilts along the axis [100]. The octahedral pair along [010] axis tilt towards the
same direction while they are tilted in the opposite way along the axis [001]. Stereo photographs of octahedra
before and after tilting are shown in Figure 1.6.
Figure 1.6 Stereo-photographs of octahedra a0 a
0 a
0 without tilting (left) and after tilting a
0b
+c
- (right).
1.4 BiFeO3
Bismuth ferrite (BiFeO3) is one of the few multiferroics that has Curie and Neel temperatures above room
temperature. Magnetoelectric coupling is realized at room temperature and such coupling is strongly enhanced
by proper dopings.7
BiFeO3 is a typical multiferroic material that has been extensively investigated nowadays. The initial research
on BiFeO3 was carried out by Smolenskii in 1960.8 But at that time, they were not able to make single-phase
polycrystalline BiFeO3 and the BiFeO3 produced was not stable for practical application. In 1967, Achenbach
successfully prepared single-phase BiFeO3 by removing the undesirable phases using HNO3.9 X-ray diffraction
technique was also adopted to investigate the monodomain single-phase by Kubel and Schmid in 1990.10
Later
in 2003, Ramesh and his colleagues produced thin film BiFeO3 which exhibited remnant polarization 15 times
stronger than that of the bulk BiFeO3.11
It has also been reported that the low symmetry monoclinic or
tetragonal thin film BiFeO3 might be the origins of strong polarization.12, 13
Until recently, increasing efforts
have also been devoted to the research focusing on the preparation and characterization of BiFeO3 in forms of
9
film, bulk and nanostructure.14, 15
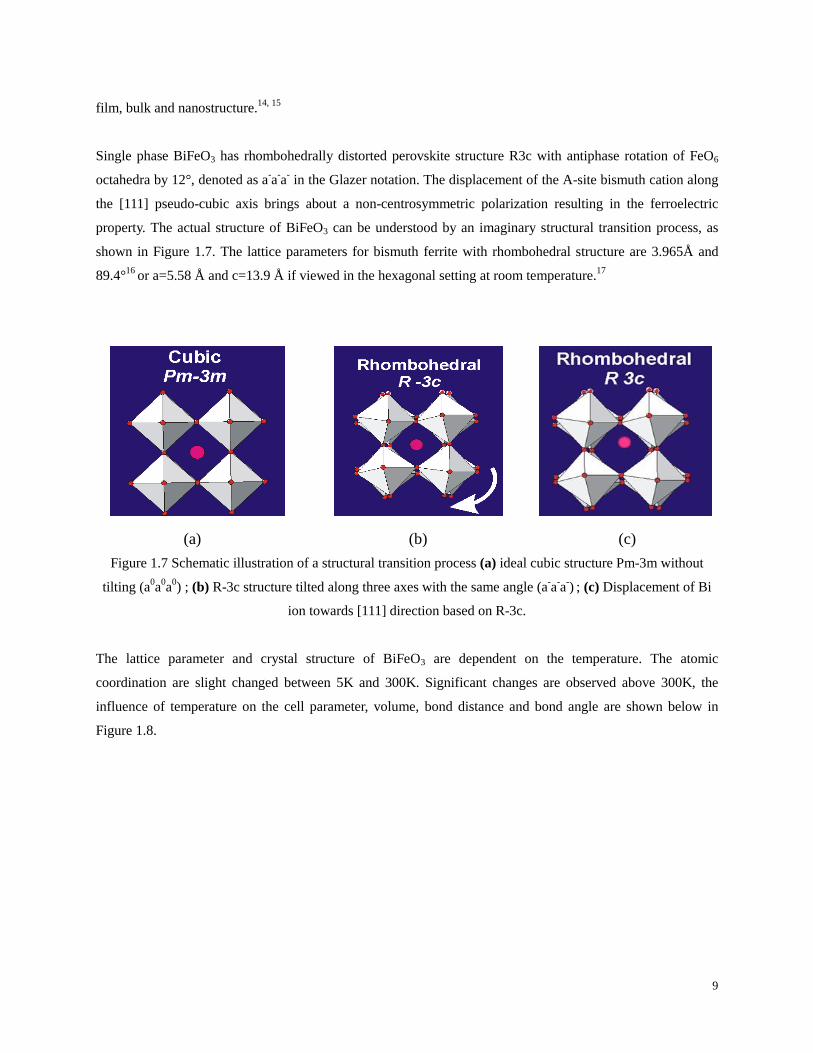
Single phase BiFeO3 has rhombohedrally distorted perovskite structure R3c with antiphase rotation of FeO6
octahedra by 12°, denoted as a-a
-a
- in the Glazer notation. The displacement of the A-site bismuth cation along
the [111] pseudo-cubic axis brings about a non-centrosymmetric polarization resulting in the ferroelectric
property. The actual structure of BiFeO3 can be understood by an imaginary structural transition process, as
shown in Figure 1.7. The lattice parameters for bismuth ferrite with rhombohedral structure are 3.965Å and
89.4°16
or a=5.58 Å and c=13.9 Å if viewed in the hexagonal setting at room temperature.17
(a) (b) (c)
Figure 1.7 Schematic illustration of a structural transition process (a) ideal cubic structure Pm-3m without
tilting (a0a
0a
0) ; (b) R-3c structure tilted along three axes with the same angle (a
-a
-a
-)
; (c) Displacement of Bi
ion towards [111] direction based on R-3c.
The lattice parameter and crystal structure of BiFeO3 are dependent on the temperature. The atomic
coordination are slight changed between 5K and 300K. Significant changes are observed above 300K, the
influence of temperature on the cell parameter, volume, bond distance and bond angle are shown below in
Figure 1.8.

10
Figure 1.8 Plots of temperature (0-1000K) as functions of (a) lattice parameter a, c and volume of BiFeO3 (b)
short and long distance of Bi-Fe bond (c) Fe-O-Fe and O-Fe-O angles.18
It was well documented that, except for the long Bi-Fe bond distance, the lattice parameter a, c, the volume of
unit cell, the short bond distance of Bi-Fe as well as the bond angles gradually increase with increase in
temperature. As a consequence of these variations, magnetism and polarization are reported to be gradually
reduced, and structural phase transitions are also induced from the rhombohedrally distorted R3c perovskite
structure to an orthorhombic Pnma structure at 1098K and eventually to a cubic structure above 1204K.19
However, single phase BiFeO3 is difficult to synthesize. Due to the metastable nature of bismuth ferrite in air20
as well as the volatility of bismuth oxide, their stoichiometry can be changed resulting in impurities of Bi2O3,
Bi25FeO39 and Bi2FeO9 during the sintering process. The phase diagram of Fe2O3 and Bi2O3 is presented below
in Figure 1.9 20
, unequal amount of Fe2O3 and Bi2O3 is seen to bring about impurity phases Bi25FeO39
(bismuth-rich) and Bi2FeO9 (bismuth-deficient).

11
Figure 1.9 Phase diagram of Fe2O3 and Bi2O3 showing bismuth ferrite with undesired impurities.
12
2. Techniques used in the project
2.1 PXRD
X-rays are a type of electromagnetic radiation. The wavelength of x-rays is approximately 1 Å which has the
same size equivalent to that of an atom. Powder X-ray diffraction (PXRD) is a non-destructive analytical
technique mainly used for the phase identification and structural characterization of crystalline materials.
Powder X-ray diffraction combined with Rietveld analysis, provides detailed information regarding unit cell
dimensions, bond-lengths, bond-angles and the site ordering of crystallites.
The relationship between the wavelengths of the X-rays λ, the incidence angle and spacing between two
crystal lattice planes (hkl) d, is shown in the Bragg's Law expressed as:
s i n2 h k ld
(1)
After characterization by Powder X-ray diffraction, a number of peaks are seen in the diffraction patterns.
These patterns are identified by comparing their positions and relative intensities with the known structures in
the database (such as database developed by the International Center for Diffraction Data). Sometimes extra
peaks might appear due to the impurity or structural transformation after thermal treatment. In fact, the
intensities, widths and positions of peaks in the patterns reflect information about structure, quantity, texture
etc. of crystallites. Almost all the factors are linked to certain parameters that can be refined by computer
programs.
Rietveld Refinement
Rietveld Refinement is a method used to determine detailed information of crystalline materials. In order to get
authentic information about crystalline materials, the least square value of the difference between theoretical
and experimental peak intensities are supposed to be minimized based on releasing and refining appropriate
parameters, as shown below in equation (2),
13
where is the least square, I represents intensities of calculated and experimental peaks.
Rieveld Refinement directly matches the intensities of all the peaks throughout the test range with the
intensities of peaks from the model structures, and it is less sensitive to both model and experimental errors.
However, to get more accurate information about crystalline materials, a wide range 2 of experimental
pattern and good models in database are needed. In addition, the experience of operating the Rietveld programs
is quite necessary along with a good chemical knowledge in terms of expected bond distances.
Many computer programs can be selected to conduct the refinement work, such as GSAS, Maud, Fullprof, etc.
The most popular one is the GSAS-Expgui which has also been chosen for the Rieveld Refinement in this
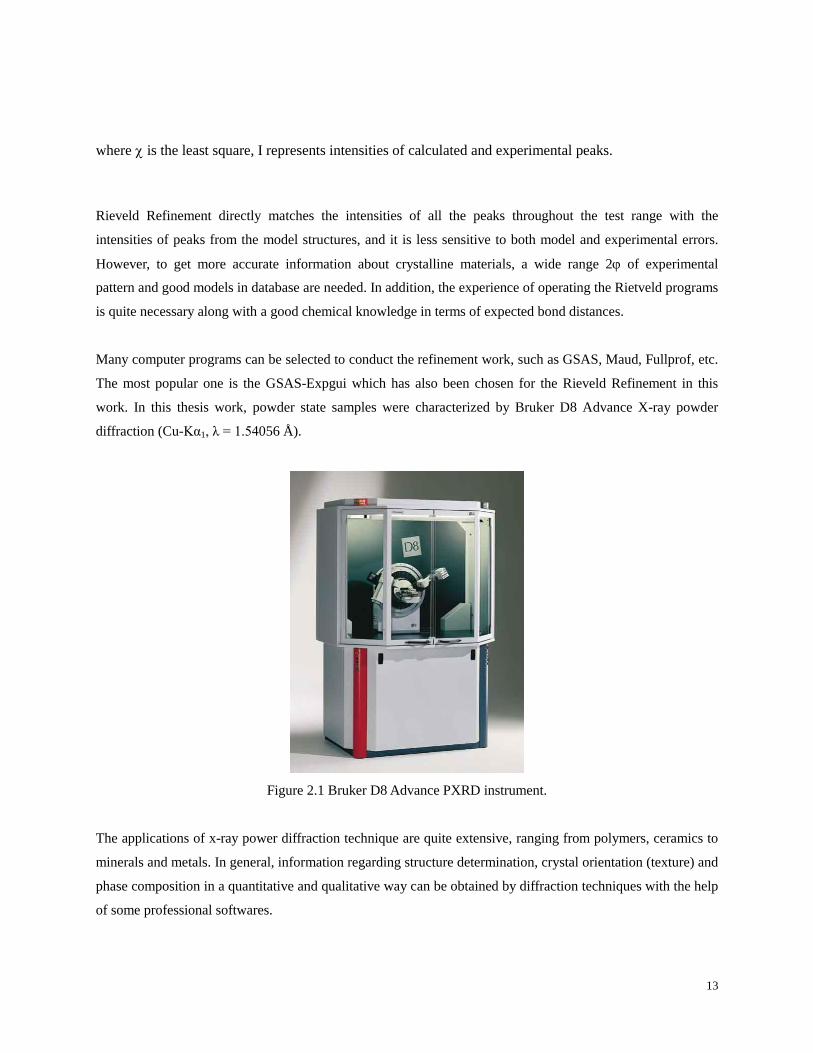
work. In this thesis work, powder state samples were characterized by Bruker D8 Advance X-ray powder
diffraction (Cu-Kα1, λ = 1.54056 Å).
Figure 2.1 Bruker D8 Advance PXRD instrument.
The applications of x-ray power diffraction technique are quite extensive, ranging from polymers, ceramics to
minerals and metals. In general, information regarding structure determination, crystal orientation (texture) and
phase composition in a quantitative and qualitative way can be obtained by diffraction techniques with the help
of some professional softwares.

14
2.2 Thermal Analysis
Detail information regarding mass changes and caloric effects of a specimen during heating and cooling
process can be measured simultaneously by means of TG-DSC Netzsch STA 409 PC Luxx analyser. A plot of
mass change and heat flow as a function of temperature can be obtained in one graph upon heating and
cooling.
There is a highly sensitive balance with two identical crucibles placed on both sides, one of which serves as a
reference that should keep always empty and clean. Before performing the thermal analysis, the instrument is
supposed to be calibrated by making two empty crucibles balanced first. After filling one of the crucibles with
the test sample, a gradual heating process is introduced inside the chamber with gas flow at certain speed.
Before getting an reliable experimental result, a baseline correction is required by subtracting the empty
crucible run from the original sample run.
The purpose of using this thermal analysis is to specify the water of hydration in the reagents of nitrates for the
solution synthesis and to determine the antiferromagnetic ordering temperature TN and ferroelectric
temperature Tc.
2.3 Magnetization measurement
Magnetization measurements were conducted at Uppsala University on a Quantum Design SQUID MPMS XL
magnetometer. Thanks to Roland Mathieu, the magnetic measurements were performed on the system of
xBiFeO3-(1-x) SrTiO3 with x=0.1, 0.2, 0.3, 0.4, 0.5, 0.6 and 0.7, where magnetization M was measured as a
function of applied field H at only 5 K.
2.4 Calcination and sintering
The conventional solid state synthesis route, also known as the ceramic method, refers to a procedure of
heating two or more non-volatile solid state materials that can react with one another forming a new
compound.
Typically, the high temperature treatment (500°C-2000°C) is required during the process, which provides the
energy condition that enables the ions to leave their original sites and diffuse to different sites. The solid state
reaction is quite slow but the reaction can speed up considerably if the temperature is increased. However, due
15
to the decomposition or melting of materials, extremely high temperature is not favored. In principal, the
optimal temperature is defined by a rule of thumb that two-thirds of the melting temperature of the compound
always gives best reaction time.
The solid state reactions are always performed in either box furnace or tube furnace, high resistances of metal
heating elements inside the furnaces create heat by conversion of electrical energy. In general the tube furnace
can withstand higher temperatures (<2300°C) than that of box furnaces. If the reactants are volatile and
vulnerable to the oxygen in air, experiments are supposed to be performed in a sealed tube with or without
certain gas flowing over the reactant during heating and cooling processes.
The solid state synthesis route consists of two steps of thermal treatments, calcination and sintering, which take
place below the melting temperatures of the materials. The function of calcination is to remove undesired
substances by decomposition and volatilization and to homogenize the material and to alleviate material
shrinkage for the subsequent sintering process. Sintering is a technique based on atomic diffusion at higher
temperature. Thermal expansion caused by the diffusion of atoms diminishes the area between two grains in
contact. Atoms in solids are compressed on the surface of their neighboring grains by diffusion of atoms across
the boundaries of grains, which increase the density of ceramics.
2.5 synthesis routes for nanoscale BiFeO3
Many techniques have been utilized to prepare BiFeO3 nanostructures. The thin films BiFeO3 always exhibit
stronger remnant polarization than bulk BiFeO3, which was reported to be attributed to the strain enhancement
and to the existence of the impurity phase of Fe2O3 in the thin film of BiFeO3.21
Thin BiFeO3 films can be fabricated by techniques like PLD (Pulsed Laser Depostion). A target of BiFeO3 in
condensed pellet form is first placed in a vacuum chamber and then struck by a focused pulsed laser beam in
vacum. The samples evaporates under laser striking and the thin film of BiFeO3 is subsequently deposited on a
substrate/wafer made from Si,22
SrTiO323
or DyScO324
. Wet chemical methods are always chosen to fabricate
BiFeO3 nanoparticles. Appropriate techniques are selected depending on the criteria emphasized, such as
particle size and distribution, temperaturen, etc.. Sol-gel method is one of the popular synthesis techniques
which can synthesize metal oxide by steps of hydrolysis and condensation of precursors (usually metal
alkoxides or metal oxides). The gel obtained is in a solid phase after steps of aging, drying and densification
steps. The size of the fabricated nanoparticles is between 15-150 nm depending on the process of hydrolysis
and drying. The sol-gel method of obtaining uniform porous powders can be mass produced and applied to the
industry.25

16
3. Experimental results on BiFeO3 and related
compounds
3.1 xBiFeO3-(1-x) SrTiO3
BiFeO3 (rhomobohedral R3c, a-a
-a
- in Glazer notation) is one of the few multiferroics exhibiting
ferroelectricity and antiferromagneticity simultaneously. Extremely weak ferromagnetism is also detected in
the bismuth ferrite due to its unique spin-canting structure. This spin-canted antiferromagnetism is a result of
the deflection of antiparallel magnetic moments from the antiferromagnetic plane, which gives rise to a weak
net magnetism.26
SrTiO3 is a typical stable paraelectric perovskite at room temperature which is centrosymmetric (cubic Pm-3m
with a0a
0a
0 in the Glazer notation). By introducing SrTiO3 to the BiFeO3 system, the drawback of low electrical
resistivity and instability of BiFeO3 can be avoided,27, 28
providing desired stabilization and high electric
resistivity suitable for dielectric (ferroelectric) measurements and industry application.
Experimental
Powdered polycrystalline sample of xBiFeO3-(1-x)SrTiO3 (x=0.1-0.7) were fabricated by solid state reaction
method. The starting materials were bismuth oxide Bi2O3 (Sigma-Aldrich, 99.99%), iron oxide Fe2O3 (Alfa
Aesar, 99.998%), strontium carbonate SrCO3(Aldrich, >99.9%) and titanium dioxide TiO2 (Aldrich, >99%).
Appropriate molar ratio of the above powders were mixed and ground in an agate mortar for about 30 minutes,
a small amount of ethanol served as a milling aid sprayed on the mixed power. The mixed powders were
transferred to the alumina crucibles, placed in an oven and calcined at 700°C for 12 hours with heating rate of
5°C/min. Then, the calcined powders were milled again and pressed into pellets with a diameter of 10mm.
Subsequently, the powders were sintered at 800°C or 900°C for 20 hours, followed by a repeated procedure of
milling, pelletizing and sintering at temperatures ranging from 900°C to 1150°C. The cycle was repeated once
again for the compositions of x=0.6, 0.7 at 965°C and 0.1 at 1200°C. Table 3.1 reveals the temperatures and
durations during the thermal treatments.
Solid solution Thermal treatment
xBiFeO3-(1-x) SrTiO3 Calcination (12h) Sintering 1(20h) Sintering 2(20h) Sintering 3(12h)

17
x=0.1 700°C 900°C 1150°C 1200°C
x=0.2 700°C 900°C 1100°C -
x=0.3 700°C 900°C 1100°C -
x=0.4 700°C 900°C 1000°C -
x=0.5 700°C 800°C 1000°C -
x=0.6 700°C 800°C 900°C 965°C
x=0.7 700°C 800°C 900°C 965°C
Table 3.1 Calcinations and sintering temperatures for solid solution of xBiFeO3-(1-x) SrTiO3.
X-Ray diffraction result
Figure 3.1 Powder x-ray diffractograms for xBiFeO3-(1-x) SrTiO3 (x=0, 0.1, 0.2, 0.3, 0.4, 0.5, 0.6 and 0.7).
The solid solution series of xBiFeO3-(1-x)SrTiO3 was characterized by the powder x-ray diffraction technique.
Cubic perovskite structure with almost no impurity phase was observed up to 0.6, as illustrated in Figure 3.1.
However, it is worth noting that peaks at 252°, 67° and 72° are split when x reaches 0.7. It can be explained
as an occurrence of a structural phase transition to the rhombohedral structure of BiFeO3. It is expected that an
inclination to the rhombohedrally distorted R3c structure would be obtained if the content of bismuth ferrite in
the system was raised further.

18
Since the structures of solid solutions xBiFeO3-(1-x) SrTiO3 (x=0.1-0.6) are cubic Pm-3m, lattice parameter
within this range was calculated by program Celref, as shown in Figure 3.2.
Figure 3.2 Fitted lattice parameter for the solid solution of xBiFeO3-(1-x) SrTiO3
The lattice parameter is proportional to the composition of bismuth ferrite in the solid solution. Although the
sum of ionic radii of Bi3+
(1.17 Å, 8-coordinate) and Fe3+
(0.645 Å, 6-coordinate, high spin) are less than the
sum of ionic radii of Sr2+
(1.18 Å, 6-coordinate) and Ti4+
(0.605 Å, 6-coordinate), the two outer 6s electrons
(lone pairs) in Bi3+
are quite active that makes the lone pairs ordered in one direction to hybridize with oxygen
2p orbital, resulting in a bigger ionic radii of Bi3+
than the value obtained from the database. The ionic radii of
Bi3+
plays a dominant role in the overall cell parameter of the binary solution, the cell parameter is increased
by substitution of BiFeO3 for the SrTiO3.
Magnetic properties
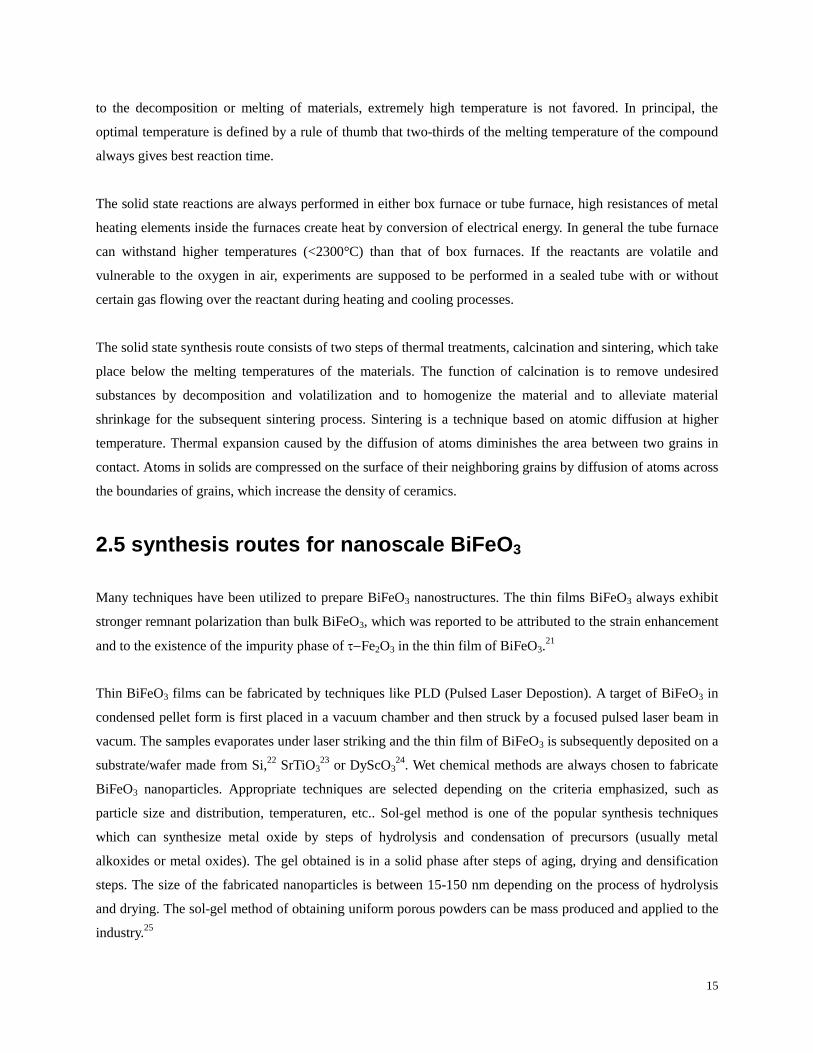
Figure 3.3 shows the M-H ( external magnetic field versus magnetization) curves of binary solid solution of
xBiFeO3-(1-x) SrTiO3 (x=0.1-0.7) measured at 5K.

19
-6 -4 -2 0 2 4 6
-600
-400
-200
0
200
400
600
(STO)0.9-(BFO)0.1
T = 5 K
H (Tesla)
M (
em
u/m
ol)
-6 -4 -2 0 2 4 6
-900
-600
-300
0
300
600
900
(STO)0.8-(BFO)0.2
T = 5 K
M (
em
u/m
ol)
H (Tesla)
-6 -4 -2 0 2 4 6
-900
-600
-300
0
300
600
900
T = 5 K
(STO)0.7-(BFO)0.3
M (
em
u/m
ol)
H (Tesla)
-6 -4 -2 0 2 4 6
-600
-400
-200
0
200
400
600
T = 5 K
(STO)0.6-(BFO)0.4
M (
em
u/m
ol)
H (Tesla)
20
-6 -4 -2 0 2 4 6
-400
-200
0
200
400
(STO)0.5-(BFO)0.5
M (
em
u/m
ol)
H (Tesla)
T = 5 K
-6 -4 -2 0 2 4 6
-400
-300
-200
-100
0
100
200
300
400
(STO)0.4-(BFO)0.6
M (
em
u/m
ol)
H (Tesla)
T = 5 K
-6 -4 -2 0 2 4 6
-300
-200
-100
0
100
200
300
(STO)0.3-(BFO)0.7
T = 5 K
M (
em
u/m
ol)
H (Tesla)
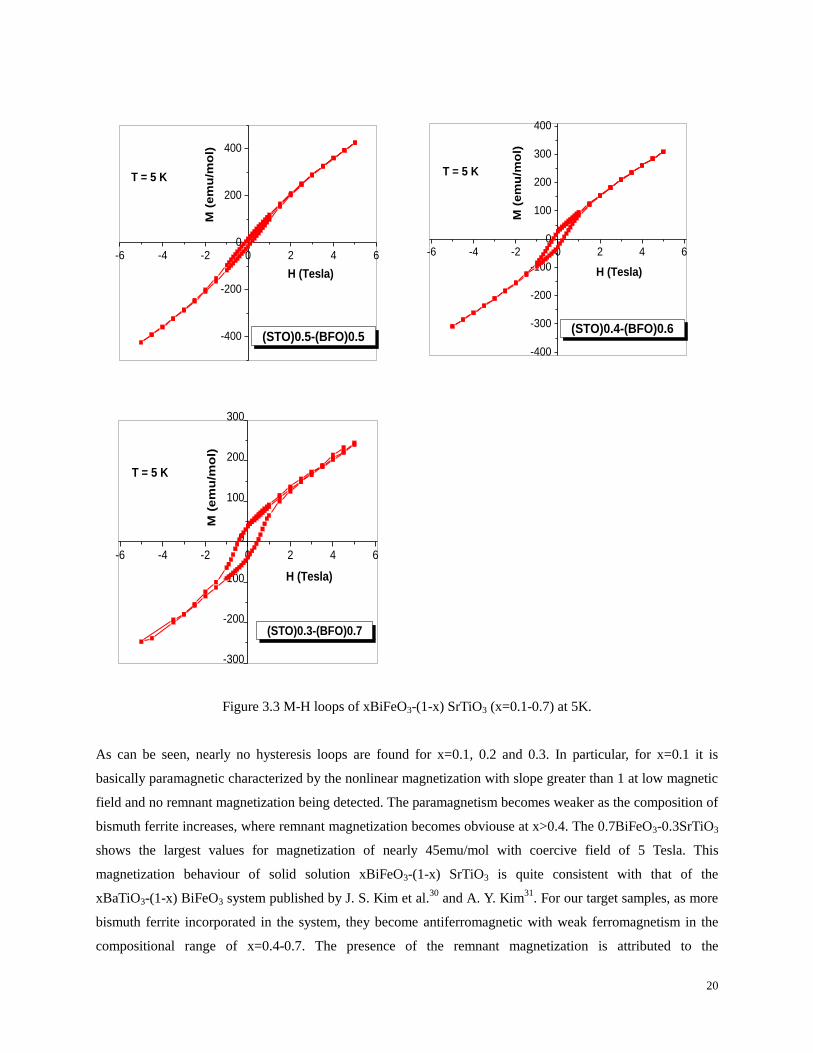
Figure 3.3 M-H loops of xBiFeO3-(1-x) SrTiO3 (x=0.1-0.7) at 5K.
As can be seen, nearly no hysteresis loops are found for x=0.1, 0.2 and 0.3. In particular, for x=0.1 it is
basically paramagnetic characterized by the nonlinear magnetization with slope greater than 1 at low magnetic
field and no remnant magnetization being detected. The paramagnetism becomes weaker as the composition of
bismuth ferrite increases, where remnant magnetization becomes obviouse at x>0.4. The 0.7BiFeO3-0.3SrTiO3
shows the largest values for magnetization of nearly 45emu/mol with coercive field of 5 Tesla. This
magnetization behaviour of solid solution xBiFeO3-(1-x) SrTiO3 is quite consistent with that of the
xBaTiO3-(1-x) BiFeO3 system published by J. S. Kim et al.30
and A. Y. Kim31
. For our target samples, as more
bismuth ferrite incorporated in the system, they become antiferromagnetic with weak ferromagnetism in the
compositional range of x=0.4-0.7. The presence of the remnant magnetization is attributed to the

21
uncompensated antiferromagnetic spin in the solid solution. At x=0.7, it is characterized by the rhombohedral
structure which has the largest ferromagnetic component.
3.2 Isovalently substituted multiferroic BiFeO3
3.2.1 Bi1-xLax FeO3
In an attempt to acquire stronger magnetoelectrical coupling and to alleviate the impurities produced during the
synthesis, isovalent substitution on the A-site bismuth is considered, and traces of rare-earth element
lanthanum is chosen to replace A-site bismuth.
Since the bismuth ferrite possesses antiferromagnetic order along [001]h direction, this canted
antiferromagnetic sublattices have weak magnetization. In the meanwhile, a sinusoidal spin structure along
[110]h direction cancels out this macroscopic magnetization, which leads to a strong restriction on the
magnetoelectric effect. Rare-earth substituted bismuth ferrite can enhance the magnetism of BiFeO3 by
suppressing the spin-cycloid structure and improve the ferroelectricity by increasing the compositional
stability.32, 33 34, 35
Different substituted elements have different ionic sizes and concentrations, which changes the original
symmetry of BiFeO3. For example, the A-site bismuth is replaced by a trace amount of lanthanum, by
coincidence, the ionic sizes of La3+
(116pm, 8-coordinate) and Bi3+
(117pm, 8-coordinate) are quite adjacent,
this substitution can dilute the concentration of Bi3+
in the system and influence the ferroelectric effect caused
by the lone pair electrons.
Experimental
Conventional solid state synthesis route to prepare nanoparticles is a time-consuming and energy-consuming
work that requires high temperature over a long period of time. Chemical reaction happens at that temperature
by breaking chemical bonds first, followed by the immigration of ions within the solid. Undesired impurities
might be obtained if powders are not well mille or unexpected volatilization. Because of the volatility of the
bismuth ions and instability of bismuth ferrite at high temperature, the formation of impurity phases like
Bi25FeO39 and Bi2FeO9 together with ferrous ion compounds and oxygen vacancies are possible, which could
affect the measurement of dielectric or ferroelectric properties.

22
To overcome this problem, many synthesis routes have been investigated, like hydrothermal, sol-gel,
combustion, microemulsion and coprecipitation routes. In this thesis work, coprecipitation route was chosen to
synthesize bismuth ferrite, and polycrystalline powders with high purity and crystallinity were obtained.
However, the particle size distribution was quite broad due to the difficulty of controlling the fast precipitation
speed. Recently, modification to the coprecipitation route has been reported by keeping the alkalinity of
solution constant though adding nitrate and ammonia solution.36
For Bi1-xLaxFeO3 (x=0, 0.1, 0.15, 0.175, 0.2), stoichiometric amounts of Bi(NO3)3·4.86H2O,
Fe(NO3)3·8.28H2O and La(NO3)3·5.26H2O were weighed beforehand (the hydration of water in the nitrates
sample were initially calculated from TGA experiments, as shown in Figure 3.4). Then 6.5ml 69 % of
concentrated nitric acid and 43.5 ml deionized water were mixed in a small beaker. Subsequently, nitrates of
iron, bismuth and lanthanum were added into the beaker with magnetic stirring at 80°C on a hot plate. A
homogeneous precursor solution was obtained after continuous stirring for 30 minutes, and the solution was
transferred into an acid burette. In parallel, another beaker with the mixture of 30ml of 25% ammonia and
300ml deionized water was prepared. Subsequently, the precursor solution was gradually dripped into the
ammonia solution under strong magnetic stirring. In the meantime, a pH meter was used to measure the pH of
the ammonia solution. The pH was adjusted to be close to 9 by compensating with extra ammonia solution if
necessary. Once the whole acid solution in the acid burette was consumed, the precipitate was filtered and
washed with ethanol twice. Dark powders were obtained after the thermal treatment in the oven at 180°C for
overnight. Finally, powders were ground and sintered at different temperatures (500°C-800 °C) for 2 hours.
Powder x-ray diffraction technique was applied to characterize the specimens after each thermal treatment.
Figure 3.4 Determination of the amount of hydration in the nitrate compounds by TGA.
X-Ray diffraction result
23
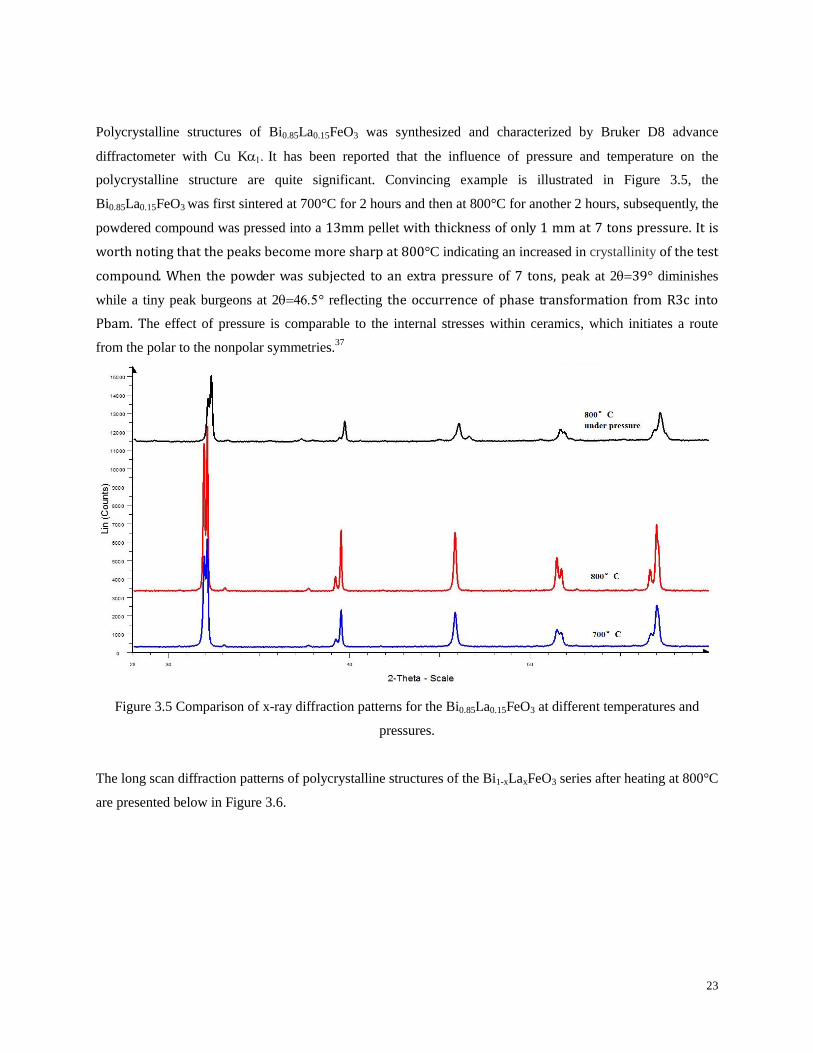
Polycrystalline structures of Bi0.85La0.15FeO3 was synthesized and characterized by Bruker D8 advance
diffractometer with Cu KIt has been reported that the influence of pressure and temperature on the
polycrystalline structure are quite significant. Convincing example is illustrated in Figure 3.5, the
Bi0.85La0.15FeO3 was first sintered at 700°C for 2 hours and then at 800°C for another 2 hours, subsequently, the
powdered compound was pressed into a 13mm pellet with thickness of only 1 mm at 7 tons pressure. It is
worth noting that the peaks become more sharp at 800°C indicating an increased in crystallinity of the test
compound. When the powder was subjected to an extra pressure of 7 tons, peak at 239° diminishes
while a tiny peak burgeons at 2° reflecting the occurrence of phase transformation from R3c into
Pbam. The effect of pressure is comparable to the internal stresses within ceramics, which initiates a route
from the polar to the nonpolar symmetries.37
Figure 3.5 Comparison of x-ray diffraction patterns for the Bi0.85La0.15FeO3 at different temperatures and
pressures.
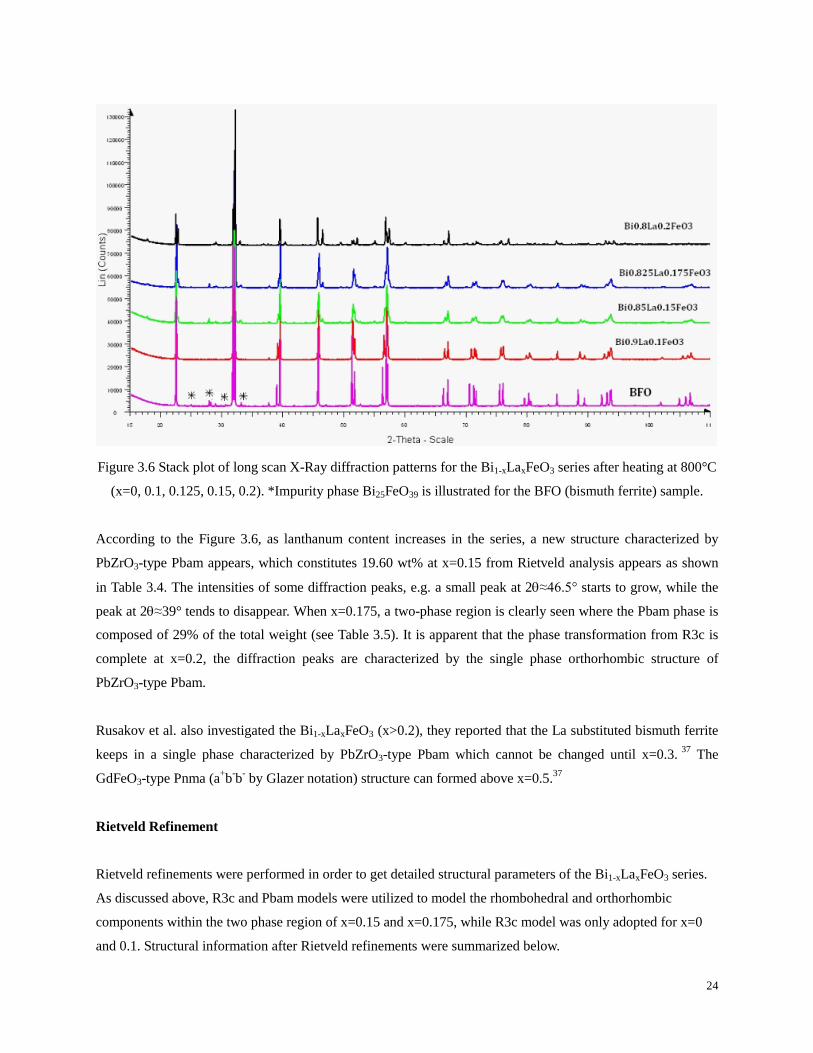
The long scan diffraction patterns of polycrystalline structures of the Bi1-xLaxFeO3 series after heating at 800°C
are presented below in Figure 3.6.
24
Figure 3.6 Stack plot of long scan X-Ray diffraction patterns for the Bi1-xLaxFeO3 series after heating at 800°C
(x=0, 0.1, 0.125, 0.15, 0.2). *Impurity phase Bi25FeO39 is illustrated for the BFO (bismuth ferrite) sample.
According to the Figure 3.6, as lanthanum content increases in the series, a new structure characterized by
PbZrO3-type Pbam appears, which constitutes 19.60 wt% at x=0.15 from Rietveld analysis appears as shown
in Table 3.4. The intensities of some diffraction peaks, e.g. a small peak at 2≈46.5° starts to grow, while the
peak at 2≈39° tends to disappear. When x=0.175, a two-phase region is clearly seen where the Pbam phase is
composed of 29% of the total weight (see Table 3.5). It is apparent that the phase transformation from R3c is
complete at x=0.2, the diffraction peaks are characterized by the single phase orthorhombic structure of
PbZrO3-type Pbam.
Rusakov et al. also investigated the Bi1-xLaxFeO3 (x>0.2), they reported that the La substituted bismuth ferrite
keeps in a single phase characterized by PbZrO3-type Pbam which cannot be changed until x=0.3. 37
The
GdFeO3-type Pnma (a+b
-b
- by Glazer notation) structure can formed above x=0.5.
37
Rietveld Refinement
Rietveld refinements were performed in order to get detailed structural parameters of the Bi1-xLaxFeO3 series.
As discussed above, R3c and Pbam models were utilized to model the rhombohedral and orthorhombic
components within the two phase region of x=0.15 and x=0.175, while R3c model was only adopted for x=0
and 0.1. Structural information after Rietveld refinements were summarized below.

25
Figure 3.7 Rietveld analysis of the powder diffraction data from BiFeO3. Crosses represent observed data
points, the red line is the calculated diffraction data while the blue line indicates the difference between the
observed and calculated intensities. Tick marks show the peak positions of R3c (pink color), impurity phase
Bi2FeO9 (cyan color) and Bi25FeO39 (black color) structures.
Crystal Structure parameters of the BiFeO3
Rhombohedral structure with R3c space group, wt. Frac.:91.66%
Atomic position
Bi(0, 0, 0.041584); Fe(0, 0, 0.263104); O(0.433205, 0.017745, 0)
Crystal axes (Å) and crystal axial angle (°)
a=5.577352; b=5.577352; c=13.867785
Volume(Å3)
373.529
R value of Rietveld refinements
Rwp= 8.14%; Rp=4.67%; =19.61
Table 3.2 Refined structural parameters for BiFeO3 determined by Rietveld analysis.

26
Figure 3.8 Rietveld analysis of the powder diffraction data from Bi0.9La0.1FeO3. Tick marks show the peak
position of R3c structure Bi0.9La0.1FeO3.
Crystal Structure parameters of the Bi0.9La0.1FeO3
Rhombohedral structure with R3c space group
Atomic position
Bi(0, 0, 0); La(0, 0, 0); Fe(0, 0, 0.223967); O(0.435454, -0.015260, 0.959105)
Crystal axes (Å) and crystal axial angle (°)
a=5.576058; b=5.576058; c=13.807185
Volume(Å3)
371.784
R value of Rietveld refinements
Rwp= 5.97%; Rp=3.91%; =10.17
Table 3.3 Refined structural parameters for Bi0.9La0.1FeO3 determined by Rietveld analysis.
27
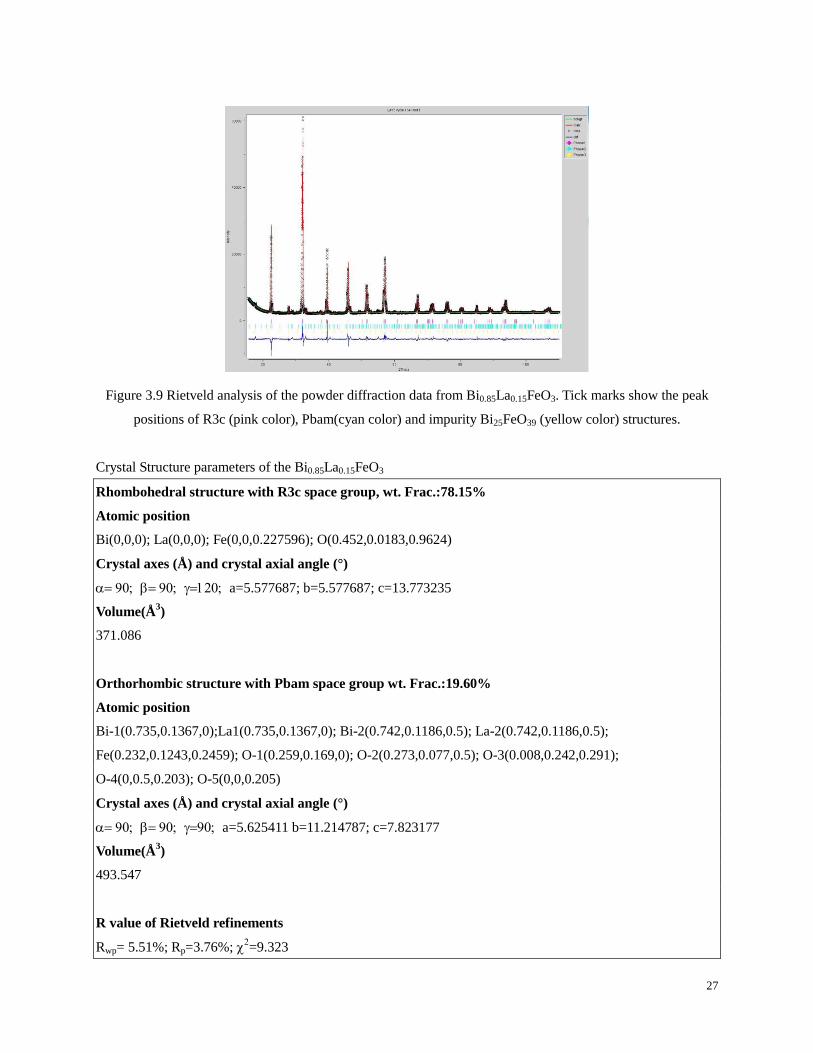
Figure 3.9 Rietveld analysis of the powder diffraction data from Bi0.85La0.15FeO3. Tick marks show the peak
positions of R3c (pink color), Pbam(cyan color) and impurity Bi25FeO39 (yellow color) structures.
Crystal Structure parameters of the Bi0.85La0.15FeO3
Rhombohedral structure with R3c space group, wt. Frac.:78.15%
Atomic position
Bi(0,0,0); La(0,0,0); Fe(0,0,0.227596); O(0.452,0.0183,0.9624)
Crystal axes (Å) and crystal axial angle (°)
a=5.577687; b=5.577687; c=13.773235
Volume(Å3)
371.086
Orthorhombic structure with Pbam space group wt. Frac.:19.60%
Atomic position
Bi-1(0.735,0.1367,0);La1(0.735,0.1367,0); Bi-2(0.742,0.1186,0.5); La-2(0.742,0.1186,0.5);
Fe(0.232,0.1243,0.2459); O-1(0.259,0.169,0); O-2(0.273,0.077,0.5); O-3(0.008,0.242,0.291);
O-4(0,0.5,0.203); O-5(0,0,0.205)
Crystal axes (Å) and crystal axial angle (°)
a=5.625411 b=11.214787; c=7.823177
Volume(Å3)
493.547
R value of Rietveld refinements
Rwp= 5.51%; Rp=3.76%; =9.323
28
* impurity phase Bi25FeO39
Table 3.4 Refined structural parameters for Bi0.85La0.15FeO3 determined by Rietveld analysis.
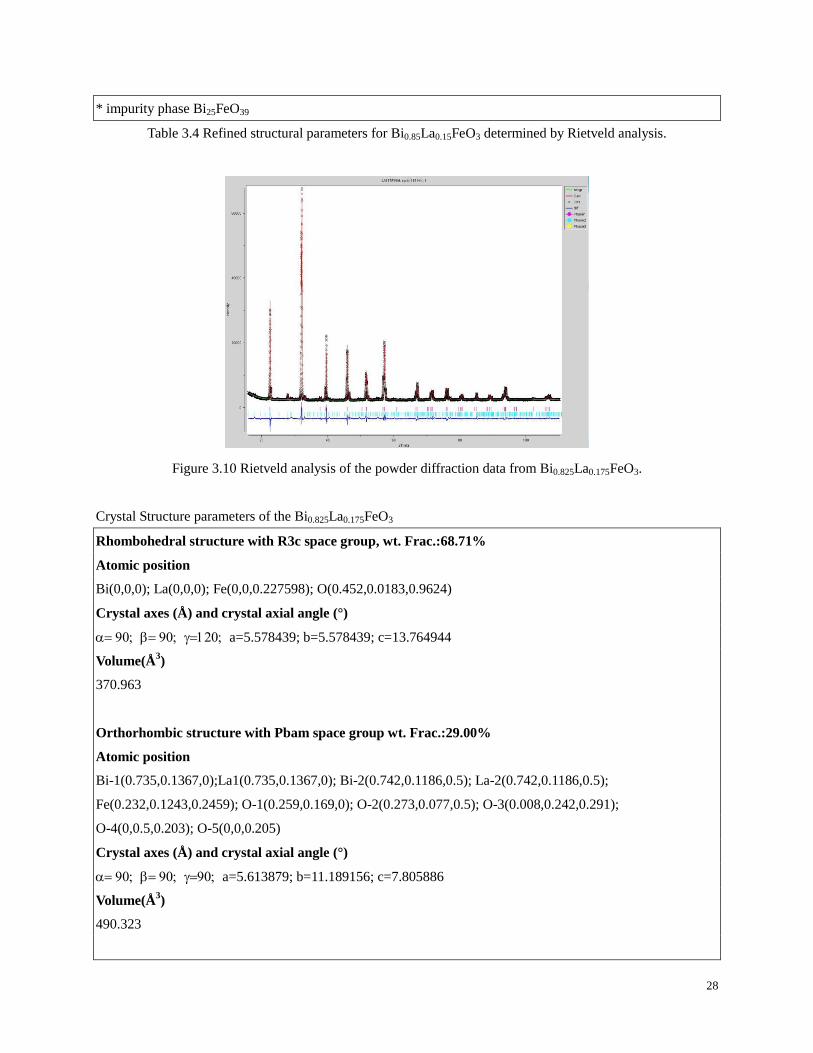
Figure 3.10 Rietveld analysis of the powder diffraction data from Bi0.825La0.175FeO3.
Crystal Structure parameters of the Bi0.825La0.175FeO3
Rhombohedral structure with R3c space group, wt. Frac.:68.71%
Atomic position
Bi(0,0,0); La(0,0,0); Fe(0,0,0.227598); O(0.452,0.0183,0.9624)
Crystal axes (Å) and crystal axial angle (°)
a=5.578439; b=5.578439; c=13.764944
Volume(Å3)
370.963
Orthorhombic structure with Pbam space group wt. Frac.:29.00%
Atomic position
Bi-1(0.735,0.1367,0);La1(0.735,0.1367,0); Bi-2(0.742,0.1186,0.5); La-2(0.742,0.1186,0.5);
Fe(0.232,0.1243,0.2459); O-1(0.259,0.169,0); O-2(0.273,0.077,0.5); O-3(0.008,0.242,0.291);
O-4(0,0.5,0.203); O-5(0,0,0.205)
Crystal axes (Å) and crystal axial angle (°)
a=5.613879; b=11.189156; c=7.805886
Volume(Å3)
490.323

29
R value of Rietveld refinements
Rwp= 4.59%; Rp=3.31%; =6.466
* Impurity phase Bi25FeO39
Table 3.5 Refined structural parameters for Bi0.825La0.175FeO3 determined by Rietveld analysis
Rietveld analysis of diffraction patterns are used to identify the derivation of all the diffraction peaks and to
distinguish different structures from peaks as well as measure different structural compositions quantitatively.
Refinement work on the Bi1-xLaxFeO3 (x=0.1, 0.15, 0.175) series reveals a superposition of two structures, R3c
and Pbam, coexist in the material for the composition of x=0.15 and 0.175. According to the tables above, for
the diffraction pattern of x=0.15, approximately 78.15% of the contribution was made by a rhomobohedral R3c
structure while another 19.60% is made up of antipolar orthorhombic structure of PbZrO3-type Pbam. With the
content of lanthanum increases in the series, the compound Bi0.825La0.175FeO3 is composed of 68.71% R3c and
29.00% Pbam, which indicates an increase in the amount of orthorhombic structure. In addition, it is worth
mentioning that slight traces of Bi25FeO39 impurity is always accompanied by the formation of BiFeO3-related
compound. However, for the Bi0.9La0.1FeO3, it is identified as having only one phase characterized by a
rhomobohedrally distorted R3c structure.
To conclude, by replacing bismuth with traces of lanthanum, the stereochemically active lone pair Bi, which
accounts for the rohombohedral polar structure, is gradually diluted and diminished. The lanthanum substituted
bismuth ferrite implies a composition-driven transition in a sequence of R3c to Pbam.
The conclusion is in accordance with previous structural investigation of Bi1-xLnxFeO3 (Ln=La, Nd, Sm, Gd)
series,39, 40
which reveals that the PbZrO3-type orthorhombic structure is stabilized within a concentration
range between rhomobohedrally distorted R3c and nonpolar orthorhombic Pnma.
Thermal analysis
To determine the antiferromagnetic (TNeel) and ferroelectric (TCurie) ordering temperature of Bi1-xLaxFeO3 (0≤
x≤ 0.2) , differential thermal analysis have been performed on this compound series.
Differential scanning calorimetric measurements of Bi1-xLaxFeO3 (x=0.1, 0.15, 0.175 and 0.2) series were
performed at temperature between 150°C and 850°C under argon flow. Sample was placed in a small Platinum
crucible and underwent a heating and a cooling process at rate of 10K/min. The data obtained are displayed
below in Figure 3.11 and 3.12.
According to the two DSC graphs, the peaks from exothermic process appears approximate 20°C lower than
30
those peaks located in endothermic process, which means that more peaks can be seen in the cooling process.
Thus, in this thesis, the peaks presented in the exothermic process were analyzed.
The curves in the figures below can be primarily classified into three categories depending on different amount
of lanthanum in the compound. x=0.15 and 0.175 is the first group which have three distinct peaks that
correspond to the Neel temperature point, phase transformation from mixed phase region of R3c and Pbam to
Pnma, and transition from Pnma to cubic. However, for the second group x=0 and x=0.1, the structure at low
temperature region is only characterized by the single phase R3c, therefore, the two peaks from this group refer
to the Neel temperature and ferroelectric transition from antipolar R3c to nonpolar Pnma. On the contrary, for
x=0.2 there is no R3c structure but only Pbam structure exhibited at low temperature, the two peaks, from left
to right, serves as the Neel point and transformation from Pbam to Pnma (without Curie point) respectively.
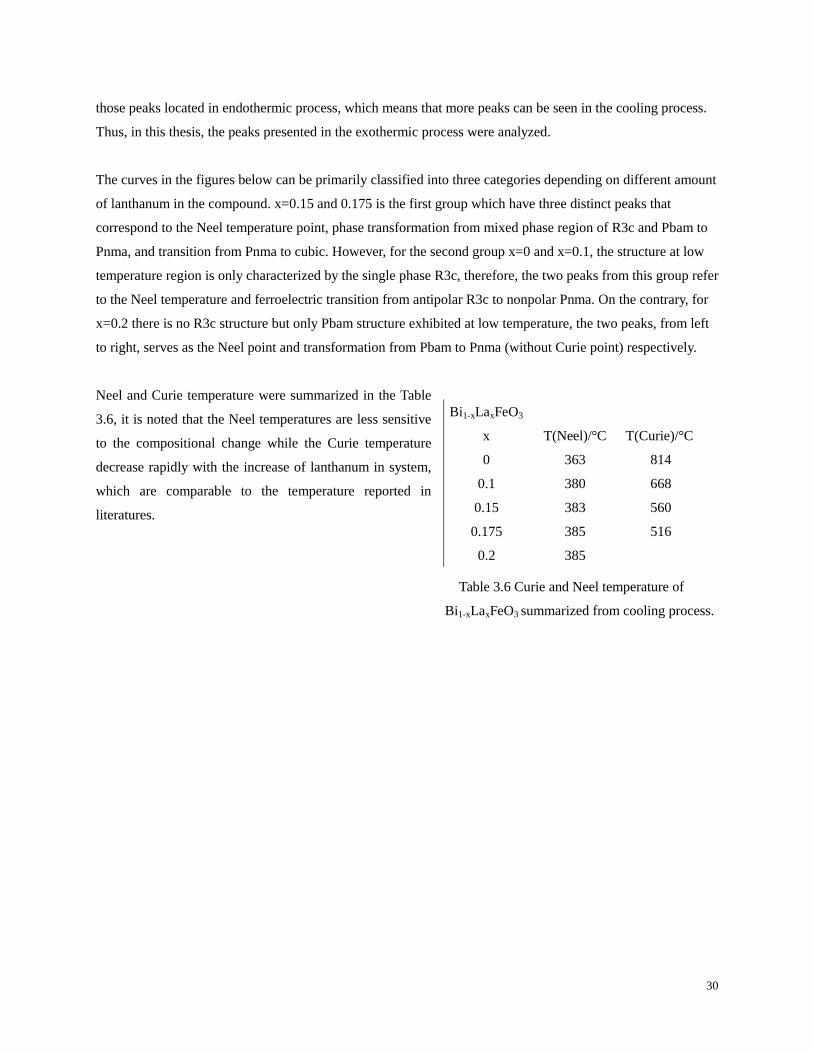
Neel and Curie temperature were summarized in the Table
3.6, it is noted that the Neel temperatures are less sensitive
to the compositional change while the Curie temperature
decrease rapidly with the increase of lanthanum in system,
which are comparable to the temperature reported in
literatures.
Table 3.6 Curie and Neel temperature of
Bi1-xLaxFeO3 summarized from cooling process.
Bi1-xLaxFeO3
T(Neel)/°C T(Curie)/°C x
0 363 814
0.1 380 668
0.15 383 560
0.175 385 516
0.2 385

31
Figure 3.11 DSC plot of Bi1-xLaxFeO3 (0≤ x≤ 0.2) during the heating process.
Figure 3.12 DSC plot of Bi1-xLaxFeO3 (0≤ x≤ 0.2) during the cooling process.

32
3.2.2 Bi1-xTbxFeO3
Experimental
The coprecipitation route was chosen to synthesize Tb doped bismuth ferrite Bi1-xTbxFeO3 (x=0.05, 0.1, 0.125,
0.15, 0.175 and 0.2). Apart from using terbium nitrate rather than lanthanum nitrate, the experiment procedure
is exactly the same as making La doped bismuth ferrite.
X-Ray diffraction result
Powder state polycrystalline Bi1-xTbxFeO3 series (x=0.05, 0.1, 0.125, 0.15, 0.175 and 0.2) were examined by
the same x-ray diffraction technique used for determination of La bismuth ferrite (=1.54056Å, 28-60° 2,
0.021° step size, 28minutes). With respect to the Tb doped BiFeO3, more patterns with different Tb contents
than that of the La are shown below in Figure 3.13 after final heating at 800 °C.
Figure 3.13 Stack plot of long scan X-Ray diffraction patterns showing the effect of increasing Bi1-xTbxFeO3
series (0.05≤ x≤ 0.2).

33
By looking at the Figure 3.13, rhombohedrally distorted perovskite structure R3c is still retained at x=0.05,
with existence of small amount of Bi25FeO39 impurity. As the content of terbium increases, a two-phase region
is obtained in the interval of x=0.1-0.15 with both rhombohedral R3c and orthorhombic Pnma. However, from
x=0.175 and 0.2, it is obvious that the phase transition is terminated with single phase orthorhombic Pnma
demonstrated.
In comparison with lanthanum, the PbZrO3-type Pbam structure is unstable that can not be seen in the phase
transformation of the terbium substituted bismuth ferrite, whereas the R3c ->Pbam ->Pnma sequence of the
substitution-induced transition is only observed for the Bi1-xLaxFeO3. Such difference derives from their ionic
sizes, since the ionic radius of La3+
(116pm, 8-coordinate) is comparable to the that of the original Bi
3+ (117pm,
8-coordinate) while the radius for Tb3+
is rather small (104pm, 8-coordinate). The large difference in ionic radii
impedes the formation of antipolar orthorhombic structure which is less stable in that condition.
In addition, apart from the chemical substitution-induced phase transition, the sintering temperature as well as
pressure also influence or change polycrystalline structures.41
I.O. Troyanchuk et al. reported a
pressure-induced phase transformation from R3c to Pbam of the solid-state synthesized Bi0.82La0.18FeO3
powder at a much higher pressure.42
Because of the large difference between the ionic radii between original
and substituted elements, the changed interatomic distance by chemical substitution is comparable to the
external pressure applied to the polycrystalline powders which acts as the internal stresses inside materials.43, 44
In recent years, except for the isovalent substitution on the A-site, there has been a growing interest focusing
on the isovalent substitution on the B-site in perovskite compounds, which might lead to other structural
changes and stronger magnetoelectrical couplings. Neutron diffraction shows a phase transition towards space
group Imma (a0b
-b
-) started at x=0.15 for the investigation of B-site substituted Bi0.9Sm0.1Fe1-xMnxO3 system.
This transition accords with the loss of an antiphase tilts R3c (a-a
-a
-) and the Imma (a
0b
-b
-) serves as
intermediate between original R3c and GdFeO3-type Pnma (a+b
-b
-), which we observed here for
Bi0.8Tb0.2FeO3 .45

34
Conclusion
To conclude, the diffraction results of binary solid solution xBiFeO3-(1-x)SrTiO3 demonstrate a transformation
from the nonpolar cubic structure to the antipolar rhombohedral structure on the edge of x=0.7. In the
meantime, magnetic measurement reveals the paramagnetism in xBiFeO3-(1-x)SrTiO3 ceramics at low x
progressively transforms into antiferromagnetism with relatively weak ferromagnetism due to the influence of
the uncompensated antiferromagnetic spin in the ceramics.
Study on the Bi1-xLaxFeO3 (0≤x≤0.2) and Bi1-xTbxFeO3 (0≤x≤0.2) demonstrate phase transitions in the
sequence of R3c ->Pbam ->Pnma and R3c ->Pnma for the La substituted and for the Tb substituted bismuth
ferrite respectively. The difference sequences are attributed to their ionic sizes difference with the original
bismuth ionic, which hampers the formation of stable Pbam structure in the Bi1-xTbxFeO3.
Thermal analysis was performed on the Bi1-xLaxFeO3 (0≤x≤0.2) system. The peak corresponding to the Neel
temperature is seen for every composition, peaks representing phase transition from R3c to Pnma and from
Pbam to Pnma are displayed at x≤0.1 and x=0.2 respectively. However, for the x=0.15 and 0.175, the peak
from R3c or Pbam to Pnma are overlapped and merged into one peak. Besides, Rietveld refinement was also
carried out on the Bi1-xLaxFeO3 (0≤x≤0.2) system. The weight fraction of rhombohedrally distorted structure
R3c decreases with increase of the lanthanum content in the Bi1-xLaxFeO3 system.

35
Scopes of future work
Future work is still necessary, further investigation is suggested to be done based on,
1. Measurement of the nanoparticle size and distribution of synthesized ceramics by electric microscopic, and
exploration of the relationship between the particle size and synthesis method.
2. Investigation on the B-site substituted bismuth ferrite, or substitution on both A site and B site are suggested
to be investigated.
3. Comparison between various routes to make nanosized inorganic particles, search for the appropriate
synthesis routes that can give desired compound with less impurity but enhanced electric and magnetic
properties.

36
Acknowledgments
First of all, I would like to pay gratitude to my examiner, Professor Sten Eriksson, who believe me and offered
me a chance of working at oxide group. I am also honored to have Christopher Knee as my supervisor, who
was constantly keeping track of my work and giving me enormous valuable advice. I can honestly say that I
would never have been able to accomplish my thesis work without the support from him.
I would also like to thank Stefan Norberg, Francis Kinyanjui and Habibur Rahman, who offered me instruction
and guidance with great patience. And I really appreciate other people in the oxide group, their care and help
always let me feel warm and happy.

37
Reference
1. I. E. Dzyaloshinskii, Sov. Phys. JETP 10, 628 (1960).
2. D. N. Astrov, Sov. Phys. JETP 11, 708 (1960).
3. V. J. Folen et al., Phys. Rev. Lett. 6, 607(1961)
4. Hans Schmid, Ferroelectrics 162, 317-338 (1994).
5. Daniel Khomskii Physics 2, 20 (2009).
6. A.M.Glazer, Acta Cryst. B28, 3384 (1972)
7. J. A. Bartkowska, International Journal of Thermophysics 32, 739 (2011).
8. Smolensky GA, Isupov VA, Agronovskaya AI, Sov Phys Solid State 1, 150 (1959).
9. Achenbach GD, James WJ, Gerson R, Am J. Ceram Soc. 50, 437 (1967).
10. Kubel F, Schmid H. Acta Crystallogr B 46, 698 (1990).
11. Spaldin, K. M. Rabe, M. Wuttig and R. Ramesh, Science 299, 1719 (2003).
12. A. K. Zvezdin, and D. Viehland, Appl. Phys. Lett. 84, 5261 �(2004)
13. C. Ederer and N. A. Spaldin, Phys. Rev. B 71, 224103 (2005).
14. Ederer C, Spaldin NA. Phys Rev. B 71, 224103 (2005).
15. Mei Z. G, Shang S, Wang Y, Liu Z-K. Apply Phys. Lett. 98, 131904 (2011).
16. G. Catalan and J.F. Scott, Advanced Materials, 21, 2463 (2009).
17. A. G. Gavriliuk et al., Phase transition with suppression of magnetism in BiFeO3 at high pressure.
Condensed Matter 4, Volume 82, 224 (2005).
18. a) Palemicz A. et al., Act Cryst. B 63: 537 (2007).
b) Palemicz A. et al., Acta Phys. Pol. A 117, 296 (2010).
19. Scott JF. J Magn Magn. Mater. 321, 1689 (2009).
20. Catalan G, Scott JF. Adv Mater21, 2463 (2009).
21. Lebeugle JD, Colson D, Forget A, Viret M. Appl Phys. Lett. 91, 022907 (2007)
22. Wang J et al., Appl Phys. Lett. 85, 2574 (2004).
23. Eerenstein W et al., Science 307, 1203 (2005).
24. Chu YH et al., Appl Phys. Lett. 90, 252906 (2007)
25. Park TJ et al. Nano Lett.7, 766 (2007).
26. Sosnowska, T. Peterlin-Neumaier And E. Steichele J. Phys. C, Solid State Phys. 15, 4835 (1982).
27. J. R. Cheng, N, Li, and L. E. Cross, J. Appl. Phys. 94, 5153 (2003).
28. A. V. Zalesskii, A. K. Zvezdin, A. A. Frolov, and A. A. Bush, JETP Lett. 71, 465 (2000).
29 R.C Shannon Acta Cryst. A32, 751 (1976).
38
30. J. S. Kim, C. I. Cheon, C. H. Lee and P. W. Jang, J. Appl. Phys. 96, 468 (2004).
31. A Young Kim et al., Jonrnal of the Korean Ceramic society 4, 307 (2011).
32. B.Ruette, et al., Phys. Rev. B 69, 064114 (2004).
33. C. Ederer and N. A. Spaldn, Phys. Rev. B 71, 060401(R) (2005).
34. Palkar VR, Kundaliya DC, Malik SK. J. Appl. Phys. 93, 4337 (2003).
35. Palkar VR, Pinto R. Pramana, J. Phys. 58, 1003 (2002).
36. Ke H et al., J. Alloys Compd. 509, 2192 (2011).
37. G. Gogotsi, V. Galenko, B. Ozerskii, and N. Orlovskaya, Refract. Ind. Ceram. 42, 341 (2001).
38. D.A.Rusakovet al., Chem.Mater. 23, 285 (2011).
39. S. Karimi, I. M. Reaney, I. Levin, and I. Sterianou, Appl. Phys. Lett. 94, 112903 (2009)
40. S. Karimi, I. M. Reaney, Y. Han, J. Pokorny and I. Sterianous, J. Mater. Sci. 44, 5102 (2009).
41. D. C. Arnold, K. S. Knight, F. D. Morrison, P. Lightfoot, Phys. Rev. Lett. 102, 027602 (2009).
42. I. O. Troyanchuk et al., Phys. Rev. B 83, 054109 (2011).
43. G. Catalan et al., Phys. Rev. B 79, 212415 (2009).
44. G. Gogotsi, V. Galenko, B. Ozerskii, and N. Orlovskaya, Refract. Ind. Ceram. 42, 341 (2001).
45. S. Saxin and C. S. Knee, Dalton Trans. 40, 3462 (2011).