bis 2011 investigating accuracy predicted a level grades
DESCRIPTION
Produced by the UK governmental department for Business, Innovation and Skills.TRANSCRIPT

RESEARCH PAPER NUMBER 37
Investigating the Accuracy of Predicted A Level Grades as part of 2009 UCAS Admission Process
JUNE 2011

Investigating the Accuracy of Predicted A Level Grades as part of the UCAS Admissions Process
Authors: Nick Everett and Joanna Papageorgiou, UCAS
The views expressed in this report are the authors’ and do not necessarily reflect those of the Department for Business, Innovation and Skills.
Department for Business, Innovation and Skills
1 Victoria Street
London, SW1H 0ET
www.BIS.gov.uk
BIS Research paper number 37
June 2011
2

Investigating the Accuracy of Predicted A Level Grades as part of the UCAS Admissions Process
Contents
Contents .......................................................................................................................................... 3
Executive Summary........................................................................................................................ 6
Key findings................................................................................................................................... 6
1.1 ................................................................................................................. 6 Overall accuracy
1.2 ........................................................................ 7 Factors influencing accuracy of predictions
1.2.1 ........................................................................................................................ 7 Gender
1.2.2 ....................................................................................... 8 Socio-economic background
1.2.3 ....................................................................................................................... 8 Ethnicity
1.2.4 .................................................................................................................. 8 Centre-type
1.2.5 ...................................................................................................................... 8 Disability
1.2.6 .............................................................................................................................. 8 Age
1.2.7 ......................................................................................................................... 8 Region
1.2.8 ........................................................................................................................ 9 Country
1.2.9 ...................................................................................................... 9 Number of choices
2. ........................................................................................................................... 10 Introduction
3. .......................................................................................................................... 11 Methodology
3.1 ............................................................................................................................. 11 Sample
3.2 ............................................................................................................................ 11 Analysis
4. ................................................................................................................................. 12 Findings
4.1 ............................................................................... 12 Overall accuracy of predicted grades
4.2 ............................................................................................... 14 Over- and under-prediction
4.2.1 ................................................................................................................. 15 Conclusion
5. ............................................................................ 16 Predictions by applicant characteristics
3

Investigating the Accuracy of Predicted A Level Grades as part of the UCAS Admissions Process
5.1 .............................................................................................................................. 16 Gender
5.1.1 ................................................................................................................. 17 Conclusion
5.2 ............................................................................................ 17 Socio-economic background
5.2.1 ....................................................................................... 20 Over- and under-prediction
5.2.2 ................................................................................................................. 21 Conclusion
5.3 ............................................................................................................................ 22 Ethnicity
5.3.1 ................................................................................................................. 25 Conclusion
5.4 ........................................................................................................ 25 Centre-type attended
5.4.1 ................................................................................................................. 29 Conclusion
5.5 ........................................................................................................................... 29 Disability
5.5.1 ................................................................................................................. 32 Conclusion
5.6 ................................................................................................................................... 33 Age
5.6.1 ................................................................................................................. 35 Conclusion
5.7 ...................................................................................................... 35 Region (England only)
5.7.1 ................................................................................................................. 38 Conclusion
5.8 ............................................................................................. 38 Country (within the UK only)
5.8.1 ................................................................................................................. 40 Conclusion
5.9 ....................................................... 40 Number of choices made in the UCAS main scheme
5.9.1 ................................................................................................................. 42 Conclusion
6. ........................................................... 43 Under- and over-prediction (explored by ethnicity)
7. .............................................................................................................. 47 Profile of applicants
8. ............................................................................................................................. 51 Conclusion
References..................................................................................................................................... 52
Appendices.................................................................................................................................... 53
4

Investigating the Accuracy of Predicted A Level Grades as part of the UCAS Admissions Process
Appendix 1 – Comparison of the sample to all A level applicants and the overall UCAS applicant population (UK-domiciled)........................................................................................................... 53
Appendix 2 – Predicted to achieved vs. achieved to predicted grades....................................... 56
5
Investigating the Accuracy of Predicted A Level Grades as part of the UCAS Admissions Process
Executive Summary This report presents an examination of the accuracy of the A level grades predicted for applicants to start HE in 2009. This updates DfES commissioned analysis published by UCAS in 2005 which examined A level predictions awarded in 2004 (Estimating the reliability of predicted grades, UCAS, 2005). 2009 represented the last year of A levels awarded before the introduction of the A* grade. Future studies will examine the reliability of predictions under the new grading structure.
Key findings
1.1 Overall accuracy
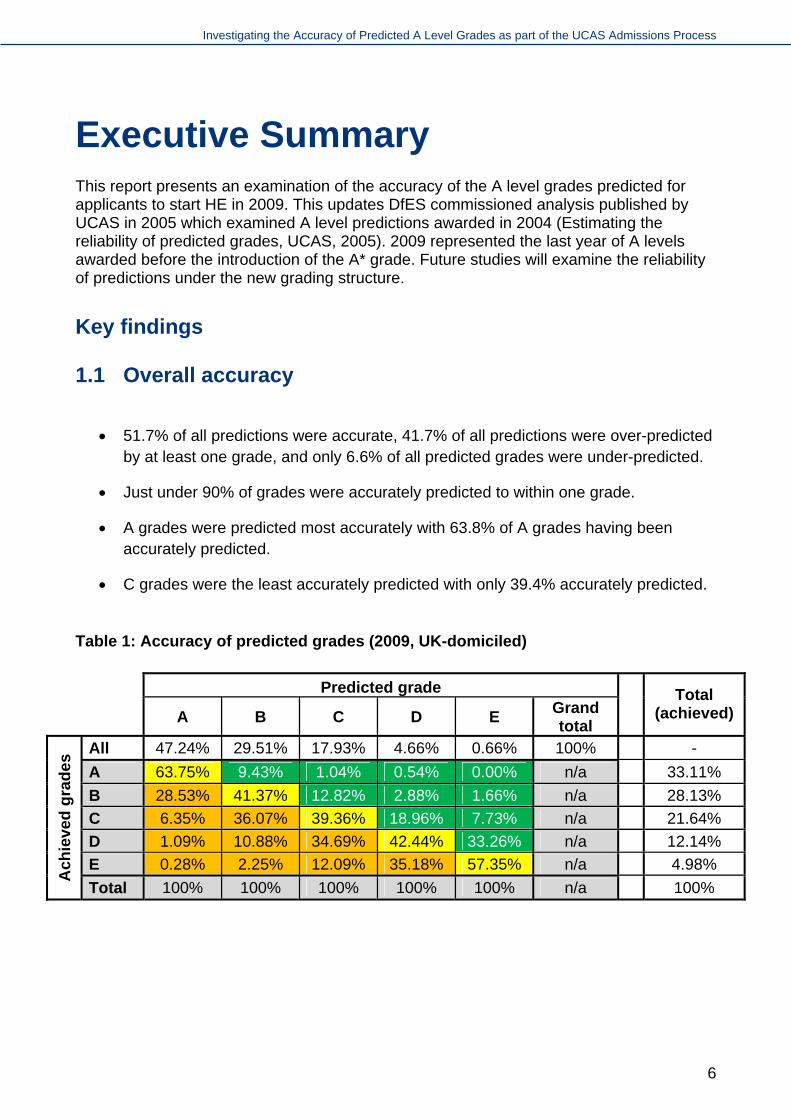
51.7% of all predictions were accurate, 41.7% of all predictions were over-predicted by at least one grade, and only 6.6% of all predicted grades were under-predicted.
Just under 90% of grades were accurately predicted to within one grade.
A grades were predicted most accurately with 63.8% of A grades having been accurately predicted.
C grades were the least accurately predicted with only 39.4% accurately predicted.
Table 1: Accuracy of predicted grades (2009, UK-domiciled)
Predicted grade
A B C D E Grand total
Total (achieved)
All 47.24% 29.51% 17.93% 4.66% 0.66% 100% -
A 63.75% 9.43% 1.04% 0.54% 0.00% n/a 33.11%
B 28.53% 41.37% 12.82% 2.88% 1.66% n/a 28.13%
C 6.35% 36.07% 39.36% 18.96% 7.73% n/a 21.64%
D 1.09% 10.88% 34.69% 42.44% 33.26% n/a 12.14%
E 0.28% 2.25% 12.09% 35.18% 57.35% n/a 4.98%
Ach
ieve
d g
rad
es
Total 100% 100% 100% 100% 100% n/a 100%
6

Investigating the Accuracy of Predicted A Level Grades as part of the UCAS Admissions Process
Table 2: Degree of over- and under-prediction of A level grades (2009, UK-domiciled)
Degree of over- and under-prediction
Number of predictions
Percentage of predictions
Four grades over 286 0.13% Three grades over 2,596 1.18% Two grades over 18,415 8.38% One grade over 70,273 31.98% Exact 113,691 51.74% One grade under 13,587 6.18% Two grades under 817 0.37% Three grades under 79 0.04% Four grades under 0 0.00%
219,744 100.00% Total
Figure 1: Degree of over- and under-prediction of A level grades (2009, UK-domiciled)
1.2 Factors influencing accuracy of predictions
1.2.1 Gender
Analysis of the dataset showed the following:
o Female applicants were more likely to achieve their predicted grades than male applicants (although a slight exception was seen in grades A and E).
o Male applicants were more likely to have their grades over-predicted than female applicants.
7
Investigating the Accuracy of Predicted A Level Grades as part of the UCAS Admissions Process
o Females were more likely to be accurately predicted than males. o Male applicants were more likely to have their grades under-predicted than
female applicants.
1.2.2 Socio-economic background
Predictions for those in the Higher managerial group had the highest overall (58.3%), A (69.5%), B (43.6%), and D (43.6%) grade prediction accuracy.
The Routine group had the lowest overall (42.8%) and A (53.4%) grade prediction accuracy; both of these figures were around 16% lower than the same figures for the Higher managerial group.
1.2.3 Ethnicity
Excluding those in the Unknown ethnic group, White applicants had the highest grade prediction accuracy (53.0%) and the lowest over-prediction rate (40.4%)
Black applicants had the lowest percentage accuracy with only 39.1% of grades accurately predicted. This group also had the highest over- and under-prediction rates (53.8% and 7.1% respectively).
1.2.4 Centre-type
Further/Higher education centre-types had the lowest overall percentage of accurately predicted grades (40.2%).
Independent schools achieved the highest percentage of accurate grade predictions (64.7%) partly because 70% of all predictions made by this centre-type were for A grades.
Independent schools achieved a 73.4% accuracy rate on A grade predictions, whereas this figure for FE/HE centre-types stood at 49.3%. Independent schools achieved the highest accuracy of prediction across grades A to D (other than grade C which was around the same accuracy as FE/HE centre-types.)
1.2.5 Disability
There was no clear picture of any influence of disability on accuracy of prediction.
1.2.6 Age
The greatest level of prediction accuracy was seen among younger applicants (19-year-olds or younger).
As an applicant’s age increases, so did the likelihood of being over-predicted.
1.2.7 Region
The highest prediction accuracy was seen in the South West where 54.8% of all predictions were accurate. This percentage was closely followed by the South East where 54.79% of predictions were accurate. The South West also had the highest percentage of accurately predicted A grades (66.7%).
8

Investigating the Accuracy of Predicted A Level Grades as part of the UCAS Admissions Process
The East Midlands had highest rate of under-predictions (7.4%). The West Midlands had the highest rate of over-predictions (45.2%) and the lowest
percentage of A grade attainment.
1.2.8 Country
Wales had the highest percentage of accurately predicted A level grades (51.9%) Scotland had the highest percentage of over-predicted grades (44.7%). England had the highest percentage of under-predicted grades (6.7%).
1.2.9 Number of choices
Applicants making four choices had the highest percentage of accurate predictions, though this may be because applicants applying to study Medicine, Dentistry, and Veterinary studies (generally requiring a high number of A grades) are limited to making four choices.
Applicants making two choices had the lowest percentage of accuracy of predictions.
9

Investigating the Accuracy of Predicted A Level Grades as part of the UCAS Admissions Process
2. Introduction This report presents an examination of the accuracy of the A level grades predicted for applicants who planned to enter into HE in 2009. The main aims of this work were to:
explore the accuracy of predicted grades identify and understand the factors which may affect the accuracy of predicted
grades provide a landscape detailing the varying degrees of prediction accuracy across
several demographic characteristics in order to facilitate benchmarking of accuracy figures following the introduction of the new A* grade in 2010.
This report updates DfES commissioned analysis published by UCAS in 2005 which examined A level awards in 2004 (Estimating the Reliability of predicted grades, UCAS, 2005).
2009 represented the last year of A levels awarded before the introduction of the A* grade. Future studies will examine the reliability of predictions under the new grade structure.
10

Investigating the Accuracy of Predicted A Level Grades as part of the UCAS Admissions Process
3. Methodology In 2009, UCAS changed the way it collected and stored predicted grade information for each applicant. This made it possible to analyse the data in ways which were not possible with previous years’ information. The data sample for this research was of A level predictions for HE applicants for the year 2009. The units of analysis were the grades of each subject and not the applicants. Only UK-domiciled applicants were included in the sample. Cases were selected only where a predicted and an achieved grade existed. Any failed or unclassified grades were not included in the sample.
Not all A level subjects taken had a predicted grade. Some predictions may have been incorrectly entered or, if applicants applied independently, they may not have had a referee to enter the prediction at all.
3.1 Sample
The sample of applicants was compared with the population of applicants (UK-domiciled) as well as the population of applicants who had taken one or more A levels. Detailed tables comparing these three sets can be found in Appendix 1. In summary, the predicted grade data sample was reasonably representative of the overall A level population, though not of all UCAS UK-domiciled applicants. Therefore, it was an adequate sample for the purposes of this analysis.
3.2 Analysis
The analysis contained within this report focuses upon cross-tabulations of predicted and achieved grade, filtered by the following demographic characteristics:
gender; socio-economic background; ethnicity; centre-type; disability; age; region; country; and number of choices made.
Analysis of each of these variables contains the following:
1. Calculation of overall grade prediction accuracy alongside rates of under- and over-prediction.
2. Cross-tabulation of achieved grades by predicted grades (A to E).
All analysis was based on the accuracy of grades by subject and not by applicant. One applicant may have taken more than one subject.
11

Investigating the Accuracy of Predicted A Level Grades as part of the UCAS Admissions Process
4. Findings
4.1 Overall accuracy of predicted grades
For 2009 entry a random sample was taken of 219,744 achieved grades, taken by 97,268 applicants, matched to predicted grades. This number does not relate to individual applicants but individual A levels on a subject-by-subject basis. This sample represented approximately 30% of the total number of A levels passed by UK-domiciled students in 2009 who applied for HE admission in the same year.
Since the number of achieved A (and B, C, D, and E) grades differed from the number of predicted A (and B, C, D, and E) grades, it was possible to calculate the percentage representing accuracy as either a fraction of the total number of achieved grades, or a fraction of the total number of predicted grades. Results obtained from calculating these percentages differed greatly between the two methods, with accuracy calculated as a percentage of totals of achieved grade being far higher in grades A and B, and far lower in grades C to E, than if calculated from totals of predicted grades. Throughout this report, percentages of accuracy are calculated using totals of grade predictions, however, the alternative calculation method is explained within Appendix 2.
Nearly half (47.24%) the results in our sample were A grade predictions, whereas the actual figure representing A grade achievement stood at 33.11% (see Table 3).
Table 3: Accuracy of predicted A level grades (percentage of predicted grades that were achieved) (2009, UK domiciled)
Predicted grade
A B C D E Grand total
Total (achieved)
All 47.24% 29.51% 17.93% 4.66% 0.66% 100% -
A 63.75% 9.43% 1.04% 0.54% 0.00% n/a 33.11%
B 28.53% 41.37% 12.82% 2.88% 1.66% n/a 28.13%
C 6.35% 36.07% 39.36% 18.96% 7.73% n/a 21.64%
D 1.09% 10.88% 34.69% 42.44% 33.26% n/a 12.14%
E 0.28% 2.25% 12.09% 35.18% 57.35% n/a 4.98%
Ach
ieve
d g
rad
es
Total 100% 100% 100% 100% 100% n/a 100% Key: 1
= Over-predicted
= Accurately predicted
= Under-predicted
1 This colour‐coding is used in all relevant tables and figures throughout this report, and so should be noted for ease of reference
12

Investigating the Accuracy of Predicted A Level Grades as part of the UCAS Admissions Process
As can be seen in the ‘Total (achieved)’ column in Table 3, 33.11% of results were A grades (14.13% fewer than had been predicted) (see Table 4). 63.75% of all predicted A grades were achieved, making this the most accurately predicted grade (see Figure 2).
Figure 2: Accuracy of predicted grades (2009, UK-domiciled)
Grade C was the least accurately predicted at only 39.4% with 34.7% of C grade predictions ultimately achieving a D grade.
Table 4: Percentages of predicted vs. achieved GCE A level grades (2009, UK-domiciled)
Predicted or achieved Number Difference
33.11% of all A level results were A grades 72,759
103,803
There were 31,044 more A grade predictions than there were achieved A grades (+14.13%) 47.24% of all A level predictions were A
grades
28.13% of all A level results were B grades 61,809
64,856
There were 3,047 more B grade predictions than there were achieved B grades (+1.38%) 29.51% of all A level predictions were B
grades
21.64% of all A level results were C grades 47,574
39,405
There were 8,169 fewer C grade predictions than there were achieved C grades (‐3.71%) 17.93% of all A level predictions were C
grades
12.14% of all A level results were D grades 26,687
10,231
There were 16,456 fewer D grade predictions than there were achieved D grades (‐7.48%) 4.66% of all A level predictions were D
grades
4.98% of all A level results were E grades 10,942
0.66% of all A level predictions were E grades 1,149
There were 9,793 fewer E grade predictions than there were achieved E grades (‐4.32%)
13
Investigating the Accuracy of Predicted A Level Grades as part of the UCAS Admissions Process
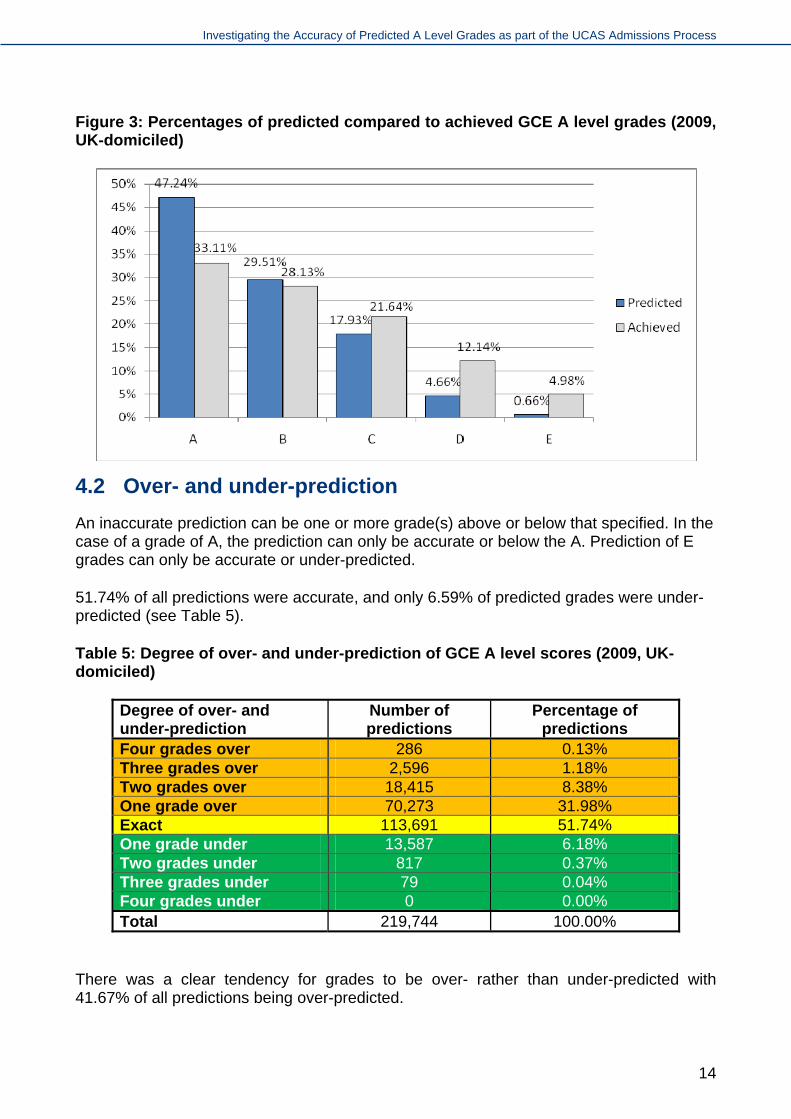
Figure 3: Percentages of predicted compared to achieved GCE A level grades (2009, UK-domiciled)
4.2 Over- and under-prediction
An inaccurate prediction can be one or more grade(s) above or below that specified. In the case of a grade of A, the prediction can only be accurate or below the A. Prediction of E grades can only be accurate or under-predicted.
51.74% of all predictions were accurate, and only 6.59% of predicted grades were under-predicted (see Table 5).
Table 5: Degree of over- and under-prediction of GCE A level scores (2009, UK-domiciled)
Degree of over- and under-prediction
Number of predictions
Percentage of predictions
Four grades over 286 0.13% Three grades over 2,596 1.18% Two grades over 18,415 8.38% One grade over 70,273 31.98% Exact 113,691 51.74% One grade under 13,587 6.18% Two grades under 817 0.37% Three grades under 79 0.04% Four grades under 0 0.00%
219,744 100.00% Total
There was a clear tendency for grades to be over- rather than under-predicted with 41.67% of all predictions being over-predicted.
14
Investigating the Accuracy of Predicted A Level Grades as part of the UCAS Admissions Process
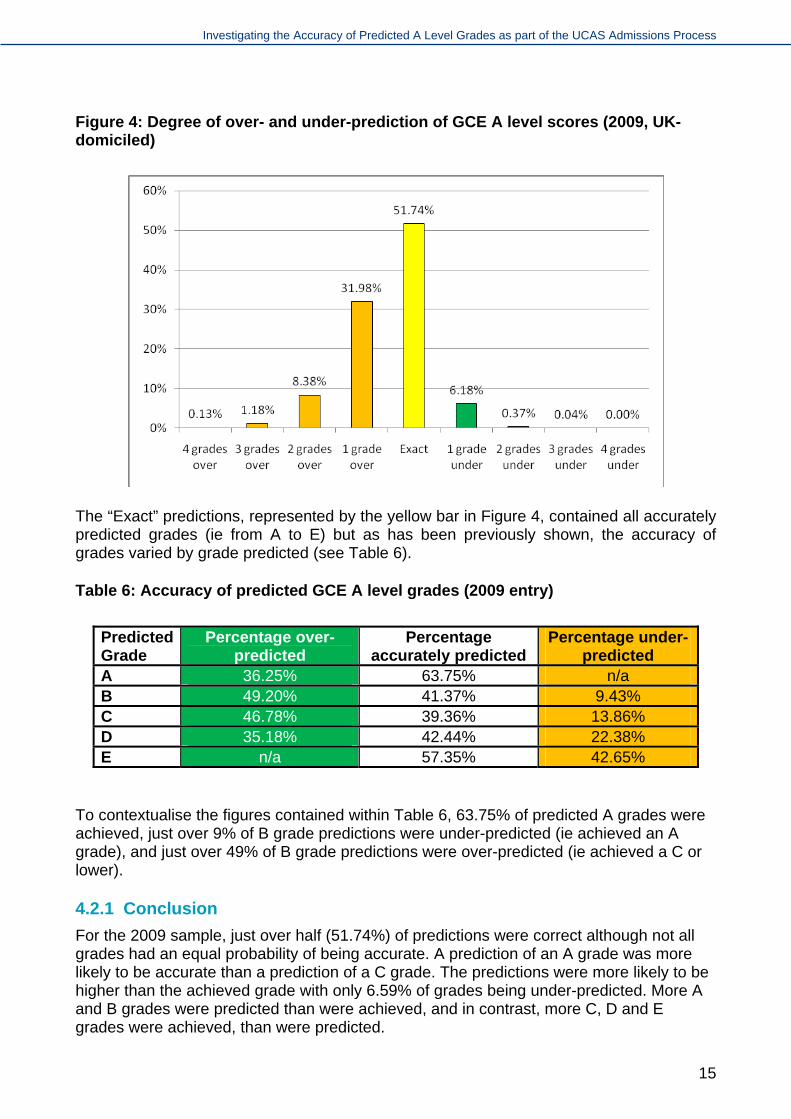
Figure 4: Degree of over- and under-prediction of GCE A level scores (2009, UK-domiciled)
The “Exact” predictions, represented by the yellow bar in Figure 4, contained all accurately predicted grades (ie from A to E) but as has been previously shown, the accuracy of grades varied by grade predicted (see Table 6).
Table 6: Accuracy of predicted GCE A level grades (2009 entry)
Predicted Grade
Percentage over-predicted
Percentage accurately predicted
Percentage under-predicted
A 36.25% 63.75% n/a B 49.20% 41.37% 9.43% C 46.78% 39.36% 13.86% D 35.18% 42.44% 22.38% E n/a 57.35% 42.65%
To contextualise the figures contained within Table 6, 63.75% of predicted A grades were achieved, just over 9% of B grade predictions were under-predicted (ie achieved an A grade), and just over 49% of B grade predictions were over-predicted (ie achieved a C or lower).
4.2.1 Conclusion
For the 2009 sample, just over half (51.74%) of predictions were correct although not all grades had an equal probability of being accurate. A prediction of an A grade was more likely to be accurate than a prediction of a C grade. The predictions were more likely to be higher than the achieved grade with only 6.59% of grades being under-predicted. More A and B grades were predicted than were achieved, and in contrast, more C, D and E grades were achieved, than were predicted.
15
Investigating the Accuracy of Predicted A Level Grades as part of the UCAS Admissions Process
5. Predictions by applicant characteristics
5.1 Gender
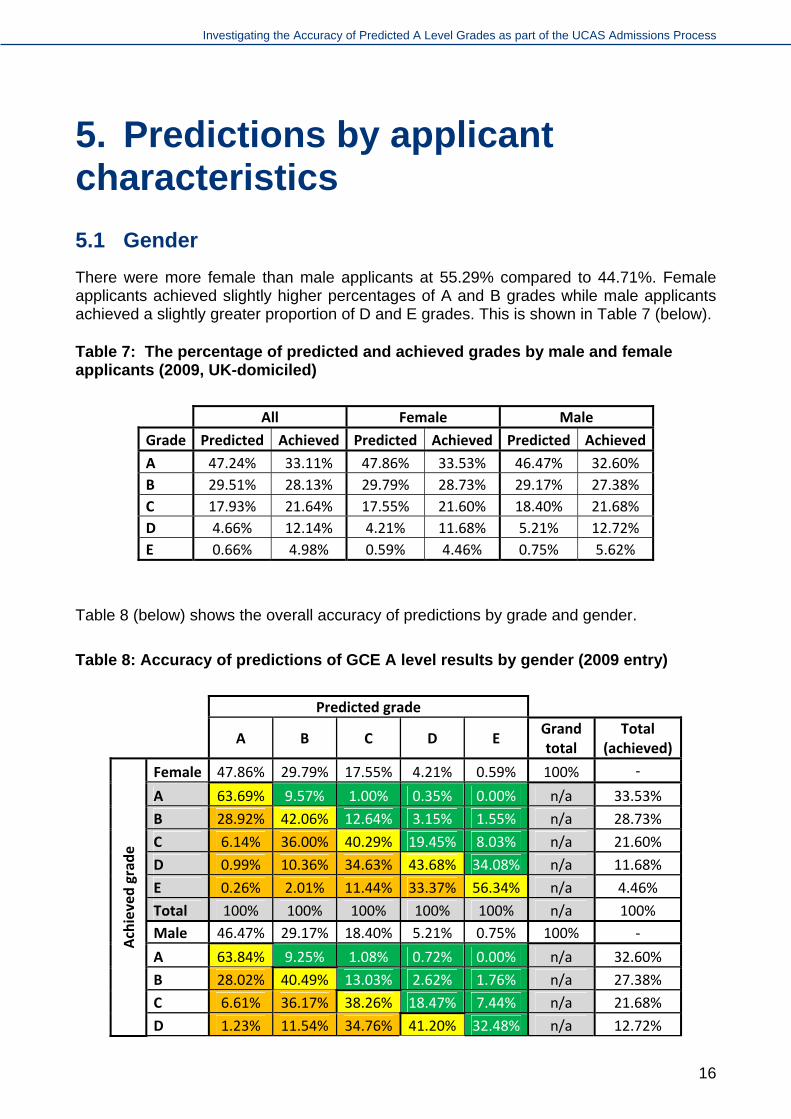
There were more female than male applicants at 55.29% compared to 44.71%. Female applicants achieved slightly higher percentages of A and B grades while male applicants achieved a slightly greater proportion of D and E grades. This is shown in Table 7 (below).
Table 7: The percentage of predicted and achieved grades by male and female applicants (2009, UK-domiciled)
All Female Male
Grade Predicted Achieved Predicted Achieved Predicted Achieved
A 47.24% 33.11% 47.86% 33.53% 46.47% 32.60%
B 29.51% 28.13% 29.79% 28.73% 29.17% 27.38%
C 17.93% 21.64% 17.55% 21.60% 18.40% 21.68%
D 4.66% 12.14% 4.21% 11.68% 5.21% 12.72%
E 0.66% 4.98% 0.59% 4.46% 0.75% 5.62%
Table 8 (below) shows the overall accuracy of predictions by grade and gender.
Table 8: Accuracy of predictions of GCE A level results by gender (2009 entry)
Predicted grade
A B C D E
Grand total
Total (achieved)
Female 47.86% 29.79% 17.55% 4.21% 0.59% 100% ‐
A 63.69% 9.57% 1.00% 0.35% 0.00% n/a 33.53%
B 28.92% 42.06% 12.64% 3.15% 1.55% n/a 28.73%
C 6.14% 36.00% 40.29% 19.45% 8.03% n/a 21.60%
D 0.99% 10.36% 34.63% 43.68% 34.08% n/a 11.68%
E 0.26% 2.01% 11.44% 33.37% 56.34% n/a 4.46%
Total 100% 100% 100% 100% 100% n/a 100%
Male 46.47% 29.17% 18.40% 5.21% 0.75% 100% ‐
A 63.84% 9.25% 1.08% 0.72% 0.00% n/a 32.60%
Achieved grade
B 28.02% 40.49% 13.03% 2.62% 1.76% n/a 27.38%
C 6.61% 36.17% 38.26% 18.47% 7.44% n/a 21.68%
D 1.23% 11.54% 34.76% 41.20% 32.48% n/a 12.72%
16
Investigating the Accuracy of Predicted A Level Grades as part of the UCAS Admissions Process
Predicted grade
A B C D E
Grand total
Total (achieved)
E 0.30% 2.55% 12.87% 36.98% 58.32% n/a 5.62%
Total 100% 100% 100% 100% 100% n/a 100%
All 47.24% 29.51% 17.93% 4.66% 0.66% 100% ‐
A 63.75% 9.43% 1.04% 0.54% 0.00% n/a 33.11%
B 28.53% 41.37% 12.82% 2.88% 1.66% n/a 28.13%
C 6.35% 36.07% 39.36% 18.96% 7.73% n/a 21.64%
D 1.09% 10.88% 34.69% 42.44% 33.26% n/a 12.14%
E 0.28% 2.25% 12.09% 35.18% 57.35% n/a 4.98%
Total 100% 100% 100% 100% 100% n/a 100%
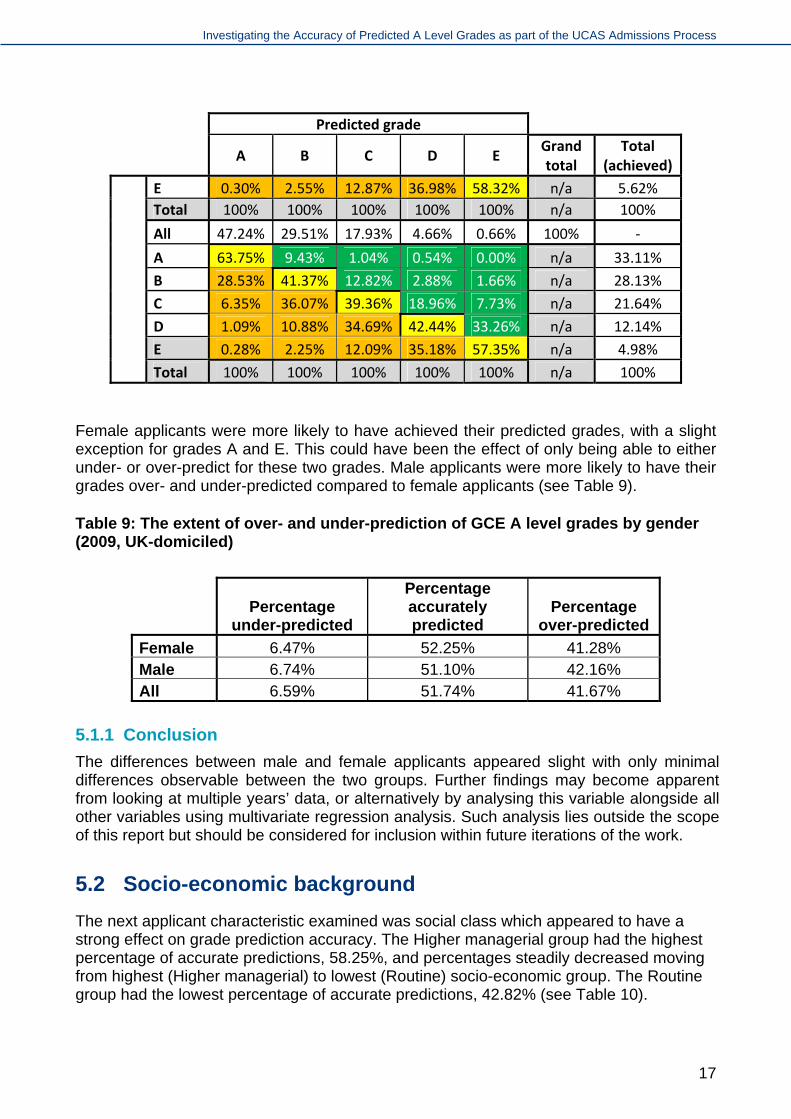
Female applicants were more likely to have achieved their predicted grades, with a slight exception for grades A and E. This could have been the effect of only being able to either under- or over-predict for these two grades. Male applicants were more likely to have their grades over- and under-predicted compared to female applicants (see Table 9).
Table 9: The extent of over- and under-prediction of GCE A level grades by gender (2009, UK-domiciled)
Percentage under-predicted
Percentage accurately predicted
Percentage over-predicted
6.47% 52.25% 41.28% Female 6.74% 51.10% 42.16% Male 6.59% 51.74% 41.67% All
5.1.1 Conclusion
The differences between male and female applicants appeared slight with only minimal differences observable between the two groups. Further findings may become apparent from looking at multiple years’ data, or alternatively by analysing this variable alongside all other variables using multivariate regression analysis. Such analysis lies outside the scope of this report but should be considered for inclusion within future iterations of the work.
5.2 Socio-economic background
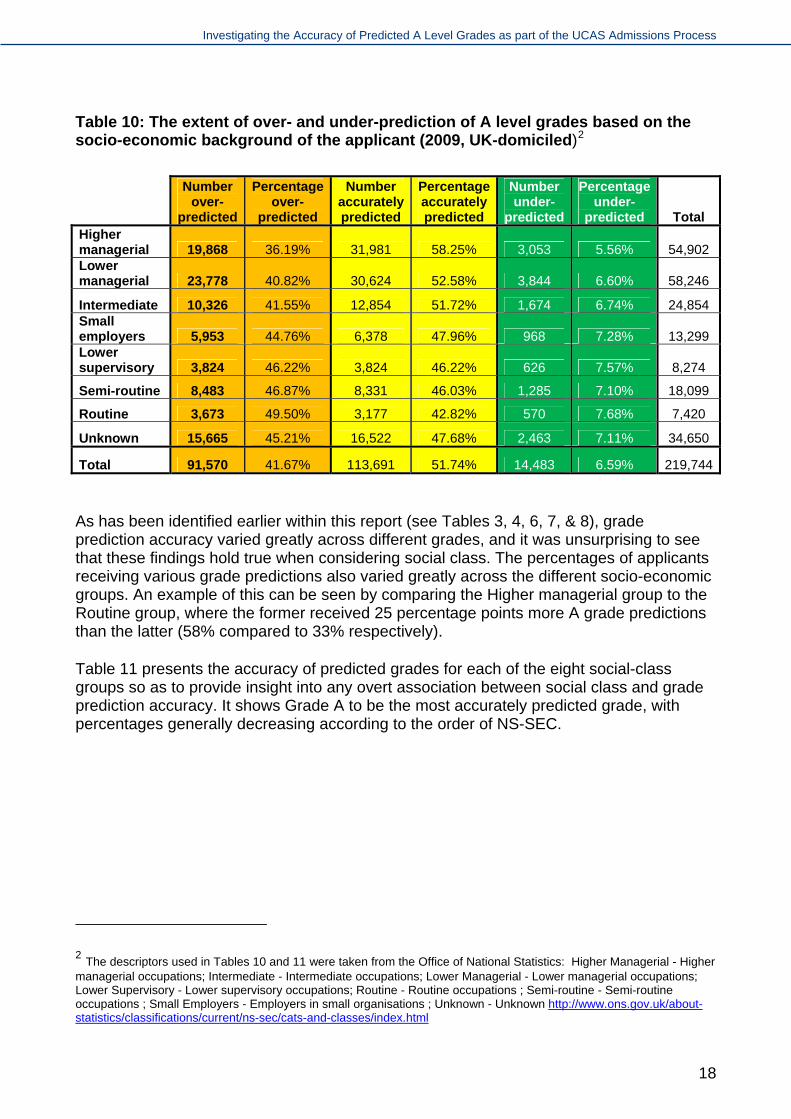
The next applicant characteristic examined was social class which appeared to have a strong effect on grade prediction accuracy. The Higher managerial group had the highest percentage of accurate predictions, 58.25%, and percentages steadily decreased moving from highest (Higher managerial) to lowest (Routine) socio-economic group. The Routine group had the lowest percentage of accurate predictions, 42.82% (see Table 10).
17
Investigating the Accuracy of Predicted A Level Grades as part of the UCAS Admissions Process
Table 10: The extent of over- and under-prediction of A level grades based on the socio-economic background of the applicant (2009, UK-domiciled)2
Number over-
predicted
Percentage over-
predicted
Number accurately predicted
Percentage accurately predicted
Number under-
predicted
Percentage under-
predicted Total Higher managerial 19,868 36.19% 31,981 58.25% 3,053 5.56% 54,902 Lower managerial 23,778 40.82% 30,624 52.58% 3,844 6.60% 58,246
10,326 41.55% 12,854 51.72% 1,674 6.74% 24,854 Intermediate Small employers 5,953 44.76% 6,378 47.96% 968 7.28% 13,299 Lower supervisory 3,824 46.22% 3,824 46.22% 626 7.57% 8,274
8,483 46.87% 8,331 46.03% 1,285 7.10% 18,099 Semi-routine
3,673 49.50% 3,177 42.82% 570 7.68% 7,420 Routine
15,665 45.21% 16,522 47.68% 2,463 7.11% 34,650 Unknown
91,570 41.67% 113,691 51.74% 14,483 6.59% 219,744Total
As has been identified earlier within this report (see Tables 3, 4, 6, 7, & 8), grade prediction accuracy varied greatly across different grades, and it was unsurprising to see that these findings hold true when considering social class. The percentages of applicants receiving various grade predictions also varied greatly across the different socio-economic groups. An example of this can be seen by comparing the Higher managerial group to the Routine group, where the former received 25 percentage points more A grade predictions than the latter (58% compared to 33% respectively).
Table 11 presents the accuracy of predicted grades for each of the eight social-class groups so as to provide insight into any overt association between social class and grade prediction accuracy. It shows Grade A to be the most accurately predicted grade, with percentages generally decreasing according to the order of NS-SEC.
2 The descriptors used in Tables 10 and 11 were taken from the Office of National Statistics: Higher Managerial - Higher managerial occupations; Intermediate - Intermediate occupations; Lower Managerial - Lower managerial occupations; Lower Supervisory - Lower supervisory occupations; Routine - Routine occupations ; Semi-routine - Semi-routine occupations ; Small Employers - Employers in small organisations ; Unknown - Unknown http://www.ons.gov.uk/about-statistics/classifications/current/ns-sec/cats-and-classes/index.html
18

Investigating the Accuracy of Predicted A Level Grades as part of the UCAS Admissions Process
Table 11: Accuracy of predicted grades by NS-SEC (2009, UK domiciled applicants, percentage of grades at A Level)
Predicted grade
A B C D E Grand Total
Higher managerial 58.00% 25.90% 12.70% 2.90% 0.40% 100.00%
A 69.50% 10.80% 1.20% 1.00% 0.00% n/a
B 24.70% 43.60% 13.70% 2.70% 2.20% n/a
C 4.90% 34.50% 40.50% 18.90% 7.80% n/a
D 0.80% 9.40% 33.90% 43.60% 34.10% n/a
E 0.20% 1.70% 10.60% 33.80% 56.00% n/a
Lower managerial 48.50% 29.60% 17.00% 4.30% 0.60% 100.00%
A 63.70% 10.00% 1.10% 0.80% 0.00% n/a
B 28.90% 42.70% 13.00% 3.40% 1.10% n/a
C 6.10% 35.00% 40.20% 18.70% 6.60% n/a
D 1.00% 10.30% 34.00% 43.10% 33.50% n/a
E 0.30% 2.00% 11.70% 34.00% 58.70% n/a
Intermediate 46.20% 30.30% 18.40% 4.50% 0.60% 100.00%
A 63.20% 9.70% 1.00% 0.70% 0.00% n/a
B 28.50% 42.00% 12.90% 3.00% 2.10% n/a
C 6.90% 36.00% 41.30% 18.90% 9.00% n/a
D 1.10% 10.30% 33.50% 41.30% 30.60% n/a
E 0.30% 2.00% 11.30% 36.10% 58.30% n/a
Small employers 40.70% 31.90% 20.80% 5.60% 0.90% 100.00%
Achieved grade by NS‐SEC
A 59.20% 8.30% 0.90% 0.40% 0.00% n/a
B 30.90% 39.90% 13.20% 3.80% 0.80% n/a
C 8.00% 37.50% 39.50% 19.10% 9.80% n/a
D 1.60% 11.80% 34.10% 42.20% 32.00% n/a
E 0.30% 2.50% 12.30% 34.50% 57.40% n/a
Lower supervisory 36.90% 32.60% 23.00% 6.80% 0.70% 100.00%
A 56.70% 8.30% 1.20% 0.00% 0.00% n/a
B 33.70% 41.30% 12.20% 3.00% 1.70% n/a
C 7.80% 36.60% 37.60% 17.90% 11.70% n/a
D 1.50% 11.60% 37.10% 42.00% 35.00% n/a
E 0.40% 2.30% 11.90% 37.00% 51.70% n/a
Semi‐routine 38.50% 31.60% 22.70% 6.40% 0.90% 100.00%
ed
grad
e
bNS
A 57.40% 7.40% 0.80% 0.20% 0.00% n/a
19

Investigating the Accuracy of Predicted A Level Grades as part of the UCAS Admissions Process
Predicted grade
A B C D E Grand Total
B 32.40% 39.20% 12.40% 2.30% 2.50% n/a
C 8.10% 37.70% 36.90% 20.60% 6.20% n/a
D 1.60% 12.60% 35.80% 41.30% 28.40% n/a
E 0.50% 3.10% 14.20% 35.70% 63.00% n/a
Routine 33.00% 33.20% 25.70% 7.20% 1.00% 100.00%
A 53.40% 7.80% 0.80% 0.20% 0.00% n/a
B 35.80% 35.80% 11.40% 2.30% 0.00% n/a
C 8.50% 40.30% 37.50% 19.50% 4.20% n/a
D 1.70% 13.50% 36.90% 43.40% 36.10% n/a
E 0.60% 2.70% 13.40% 34.60% 59.70% n/a
Unknown 41.40% 31.00% 21.00% 5.70% 0.90% 100.00%
A 59.70% 8.70% 1.00% 0.30% 0.00% n/a
B 31.10% 39.00% 12.30% 2.50% 1.90% n/a
C 7.60% 37.40% 38.10% 18.50% 8.40% n/a
D 1.30% 12.00% 35.60% 42.00% 35.70% n/a
E 0.30% 2.90% 13.00% 36.80% 53.90% n/a
The Higher managerial group had the highest percentage of accurate predictions of grade A at 69.5% while the Routine group had the lowest percentage at 53.4%. Grade C was the least accurately predicted for all social classes, apart from the Routine group which saw B grade prediction to be the most inaccurate (35.8%).
5.2.1 Over- and under-prediction
By the very nature of the grading system, it is not possible to under-predict an A grade or over-predict an E. As mentioned in earlier sections, when a student is predicted the highest achievable grade (i.e. A), they are only able to either achieve or fail to achieve it, and so an A grade prediction can only be either accurate or over-predicted. Bearing this in mind, it is logical to predict that social class groups holding the high proportions of achieved A grades would have low proportions of under-prediction; and the social class group holding high proportions of E grades would have low proportions of over-prediction. These predictions were realised in Figure 5.
20
Investigating the Accuracy of Predicted A Level Grades as part of the UCAS Admissions Process
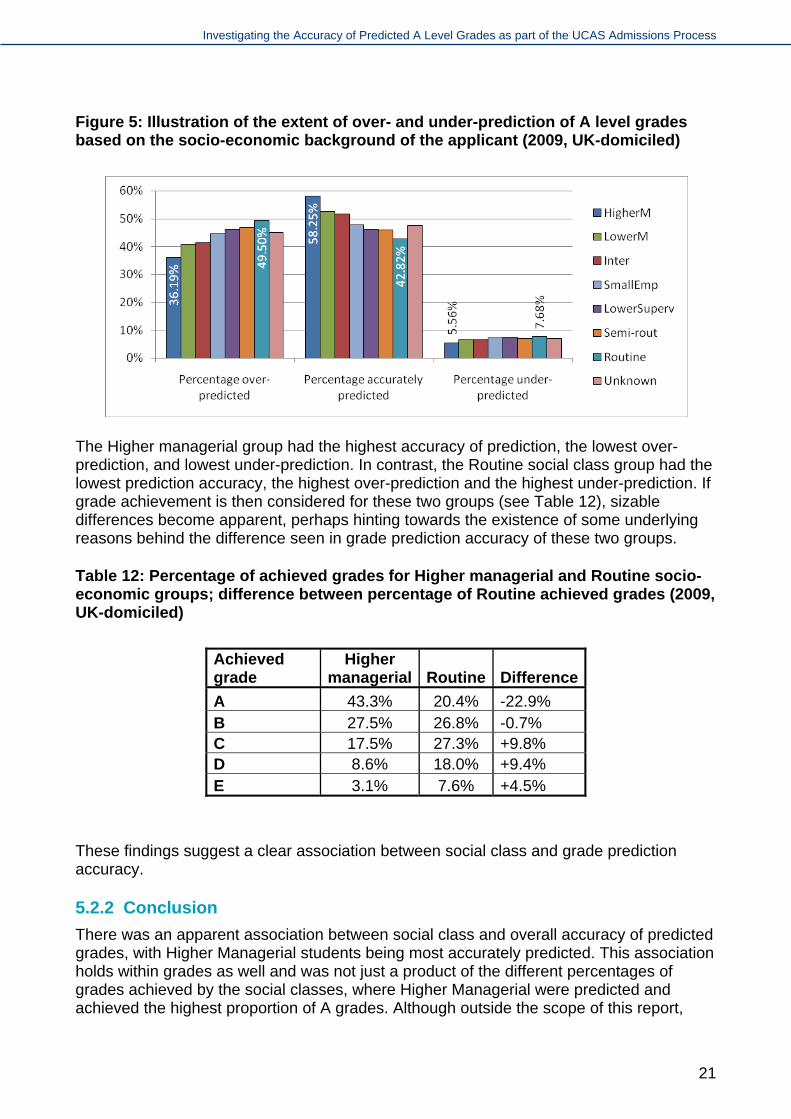
Figure 5: Illustration of the extent of over- and under-prediction of A level grades based on the socio-economic background of the applicant (2009, UK-domiciled)
The Higher managerial group had the highest accuracy of prediction, the lowest over-prediction, and lowest under-prediction. In contrast, the Routine social class group had the lowest prediction accuracy, the highest over-prediction and the highest under-prediction. If grade achievement is then considered for these two groups (see Table 12), sizable differences become apparent, perhaps hinting towards the existence of some underlying reasons behind the difference seen in grade prediction accuracy of these two groups.
Table 12: Percentage of achieved grades for Higher managerial and Routine socio-economic groups; difference between percentage of Routine achieved grades (2009, UK-domiciled)
Achieved grade
Higher managerial Routine Difference
43.3% 20.4% -22.9% A 27.5% 26.8% -0.7% B 17.5% 27.3% +9.8% C 8.6% 18.0% +9.4% D 3.1% 7.6% +4.5% E
These findings suggest a clear association between social class and grade prediction accuracy.
5.2.2 Conclusion
There was an apparent association between social class and overall accuracy of predicted grades, with Higher Managerial students being most accurately predicted. This association holds within grades as well and was not just a product of the different percentages of grades achieved by the social classes, where Higher Managerial were predicted and achieved the highest proportion of A grades. Although outside the scope of this report,
21

Investigating the Accuracy of Predicted A Level Grades as part of the UCAS Admissions Process
further research involving multivariate analysis techniques would be required in order to determine the significance of the effect social class has on grade prediction accuracy.
5.3 Ethnicity
This section examines the relationship between ethnicity and overall accuracy, over- and under-prediction of grades. A cross-tabulation of ethnicity and predicted and achieved grades is presented in Table 13 which highlights clear differences in prediction accuracy for different ethnic groups.
Table 13: Accuracy of predicted grades by ethnicity (2009, UK domiciled)
Predicted grade
A B C D E Grand total
Asian Bangladeshi 32.89% 33.05% 24.80% 7.29% 1.97% 100%
A 44.82% 7.57% 0.86% 0.00% 0.00% n/a
B 37.38% 33.98% 10.94% 4.38% 2.70% n/a
C 12.46% 39.13% 33.91% 22.63% 8.11% n/a
D 4.37% 14.81% 36.48% 41.61% 35.14% n/a
E 0.97% 4.51% 17.81% 31.39% 54.05% n/a
Asian Chinese 62.82% 21.27% 12.14% 3.3% 0.5% 100%
A 68.26% 10.66% 1.37% 0.00% 0.00% n/a
B 24.84% 42.16% 15.11% 1.02% 0.00% n/a
C 5.25% 31.82% 37.09% 27.55% 20.00% n/a
D 1.43% 12.23% 34.07% 37.76% 26.67% n/a
E 0.21% 3.13% 12.36% 33.67% 53.33% n/a
Asian Indian 51.77% 27.06% 15.77% 4.6% 0.8% 100%
A 59.89% 8.79% 0.96% 0.00% 0.00% n/a
B 29.12% 35.62% 14.27% 3.47% 0.97% n/a
C 8.46% 37.32% 36.61% 21.18% 8.74% n/a
D 2.01% 14.58% 34.34% 39.06% 37.86% n/a
E 0.51% 3.70% 13.82% 36.28% 52.43% n/a Achieved grade by ethnicity
Asian Other 53.81% 26.20% 15.13% 4.3% 0.6% 100%
A 61.53% 9.83% 0.98% 0.00% 0.00% n/a
B 26.42% 31.76% 12.60% 5.78% 0.00% n/a
C 8.51% 35.44% 33.39% 19.08% 4.35% n/a
D 2.90% 18.15% 33.72% 32.37% 43.48% n/a
E 0.64% 4.82% 19.31% 42.77% 52.17% n/a
Asian Pakistani 39.64% 29.65% 21.93% 7.61% 1.17% 100%
A 48.18% 7.87% 1.09% 0.23% 0.00% n/a
B 36.12% 32.50% 11.10% 3.15% 0.00% n/a
C 11.59% 38.11% 34.32% 18.69% 7.35% n/a
22

Investigating the Accuracy of Predicted A Level Grades as part of the UCAS Admissions Process
Predicted grade
A B C D E Grand total
D 3.11% 16.60% 37.76% 39.41% 33.82% n/a
E 0.99% 4.92% 15.72% 38.51% 58.82% n/a
Black African 33.96% 33.96% 24.43% 6.54% 1.11% 100%
A 46.38% 6.61% 1.03% 0.27% 0.00% n/a
B 37.70% 33.90% 11.10% 3.8% 1.61% n/a
C 12.80% 37.76% 37.28% 17.6% 6.45% n/a
D 2.22% 17.24% 35.88% 39.8% 35.48% n/a
E 0.90% 4.49% 14.71% 38.5% 56.45% n/a
Black Caribbean 29.00% 34.98% 27.95% 7.03% 1.05% 100%
A 45.03% 5.85% 0.19% 0.75% 0.00% n/a
B 40.33% 33.13% 10.51% 1.49% 0.00% n/a
C 11.93% 42.13% 33.77% 20.90% 20.00% n/a
D 2.27% 15.14% 40.90% 43.28% 15.00% n/a
E 0.54% 3.75% 14.63% 33.58% 65.0% n/a
Black Other 33.03% 33.94% 22.94% 8.56% 1.53% 100%
A 45.37% 6.31% 0.00% 0.00% 0.00% n/a
B 37.96% 36.94% 12.00% 3.57% 0.00% n/a
C 14.81% 40.54% 30.67% 14.29% 20.00% n/a
D 1.85% 10.81% 41.33% 42.86% 40.00% n/a
E 0.00% 5.41% 16.00% 39.29% 40.00% n/a
Mixed Other 52.23% 29.19% 15.27% 2.95% 0.35% 100%
A 63.09% 8.23% 0.98% 0.00% 0.00% n/a
Achieved grade by ethnicity
B 28.95% 40.48% 12.79% 6.78% 0.00% n/a
C 6.23% 32.93% 40.00% 8.47% 0.00% n/a
D 1.53% 16.64% 33.11% 45.76% 42.86% n/a
E 0.19% 1.72% 13.11% 38.98% 57.14% n/a
Mixed White and Asian 59.10% 24.96% 12.58% 2.76% 0.61% 100%
A 69.95% 11.46% 1.87% 1.22% 0.00% n/a
B 24.02% 42.18% 14.17% 3.66% 0.00% n/a
C 4.84% 35.04% 39.57% 24.39% 11.11% n/a
D 0.97% 9.16% 32.89% 36.59% 16.67% n/a
E 0.23% 2.16% 11.50% 34.15% 72.22% n/a
Mixed White and Black African 46.72% 31.97% 16.93% 3.65% 0.73% 100%
A 59.69% 12.33% 1.72% 0.00% 0.00% n/a
B 31.88% 42.92% 15.52% 8.00% 0.00% n/a
Achieved grade by
ethnicity
C 6.88% 30.14% 31.90% 24.00% 0.00% n/a
23

Investigating the Accuracy of Predicted A Level Grades as part of the UCAS Admissions Process
Predicted grade
A B C D E Grand total
D 0.94% 11.42% 37.93% 44.00% 20.00% n/a
E 0.63% 3.20% 12.93% 24.00% 80.00% n/a
Mixed White and Black Caribbean 38.89% 31.17% 24.04% 4.93% 0.97% 100%
A 53.83% 9.15% 1.08% 1.32% 0.00% n/a
B 35.33% 35.14% 11.59% 0.00% 6.67% n/a
C 8.67% 42.00% 42.86% 15.79% 6.67% n/a
D 1.67% 11.23% 31.54% 44.74% 20.00% n/a
E 0.50% 2.49% 12.94% 38.16% 66.67% n/a
Other 48.66% 29.45% 16.66% 4.73% 0.50% 100%
A 56.78% 10.05% 1.64% 0.00% 0.00% n/a
B 31.52% 35.24% 13.93% 4.81% 0.00% n/a
C 8.70% 34.16% 31.69% 13.46% 9.09% n/a
D 2.15% 14.99% 36.07% 38.46% 36.36% n/a
E 0.84% 5.56% 16.67% 43.27% 54.55% n/a 3 Unknown 62.78% 22.46% 11.32% 3.15% 0.29% 100%
A 70.07% 10.65% 1.03% 0.00% 0.00% n/a
B 23.70% 37.40% 13.92% 1.85% 0.00% n/a
C 4.93% 41.30% 37.63% 16.67% 0.00% n/a
D 1.02% 9.35% 35.05% 44.44% 20.00% n/a
E 0.28% 1.30% 12.37% 37.04% 80.00% n/a
White 47.20% 29.79% 17.87% 4.54% 0.61% 100%
A 65.12% 9.64% 1.04% 0.63% 0.00% n/a
B 28.09% 42.86% 12.88% 2.69% 1.90% n/a
C 5.76% 35.80% 40.25% 18.81% 7.39% n/a
D 0.83% 9.86% 34.46% 43.30% 33.27% n/a
E 0.20% 1.83% 11.36% 34.56% 57.44% n/a
Excluding the Unknown group, the highest percentage of A grade predictions was for the Asian Chinese group (62.82% were A grade predictions), and this group also observed very high percentages of A grade attainment. The lowest percentage of A grade predictions was seen within the Black Caribbean group (29.00% were A grade predictions).
The highest percentage of accurate predictions was seen among White and Mixed applicants at 53.01% and 52.96% respectively (see Table 14). The least accurate
3 The Unknown group represents applicants who chose not to reveal their ethnicity when applying through UCAS.
24

Investigating the Accuracy of Predicted A Level Grades as part of the UCAS Admissions Process
predictions were for Black applicants where only 39.13% of all grade predictions were accurate.
Table 14: The extent of over- and under-prediction of A level grades based on ethnicity of the applicant (2009 entry, UK-domiciled)
Number over‐
predicted
Percentage over‐
predicted
Number accurately predicted
Percentage accurately predicted
Number under‐
predicted
Percentage under‐
predicted Total
70,038 40.37% 91,981 53.01% 11,491 6.62% 173,510White
12,704 46.50% 12,849 47.03% 1,770 6.48% 27,323Asian
4,195 53.77% 3,053 39.13% 554 7.10% 7,802 Black
2,945 40.91% 3,812 52.96% 441 6.13% 7,198 Mixed
1,054 47.97% 997 45.38% 146 6.65% 2,197 Other
634 36.99% 999 58.28% 81 4.73% 1,714 Unknown
91,570 41.67% 113,691 51.74% 14,483 6.59% 219,744Total
5.3.1 Conclusion
There appeared to be an association between ethnicity and overall accuracy, with large amounts of variation of over-, accurate, and under-prediction seen across the various different groups. Although outside the remit of this report, further analysis using multivariate techniques should be carried-out in order to ascertain the significance of the effect ethnicity appeared to have on grade prediction accuracy.
5.4 Centre-type attended
This section analyses accuracy by centre-type. Table 15 shows that there were different levels of accuracy for different centre-types. The highest prediction accuracy was achieved by Independent schools where overall accuracy was 64.73%. The lowest accuracy percentage was seen from Further and Higher education (FE/HE) centre-types where only 40.24% of all predictions were accurate.
25

Investigating the Accuracy of Predicted A Level Grades as part of the UCAS Admissions Process
Table 15: The extent of over- and under-prediction of A level grades based on centre-type of the applicant (2009, UK-domiciled)
Number over‐
predicted
Percentage over‐
predicted
Number accurately predicted
Percentage accurately predicted
Number under‐
predicted
Percentage under‐
predicted Total
48,206 44.98% 51,251 47.82% 7,718 7.20% 107,175 State
18,071 44.40% 19,562 48.06% 3,067 7.54% 40,700 Sixth form
11,507 30.71% 24,258 64.73% 1,709 4.56% 37,474 Independent
10,247 36.87% 15,962 57.43% 1,583 5.70% 27,792 Grammar
3,509 53.56% 2,636 40.24% 406 6.20% 6,551 Further/Higher education
30 57.69% 22 42.31% 0 0.00% 52 Other
91,570 41.67% 113,691 51.74% 14,483 6.59% 219,744 Total
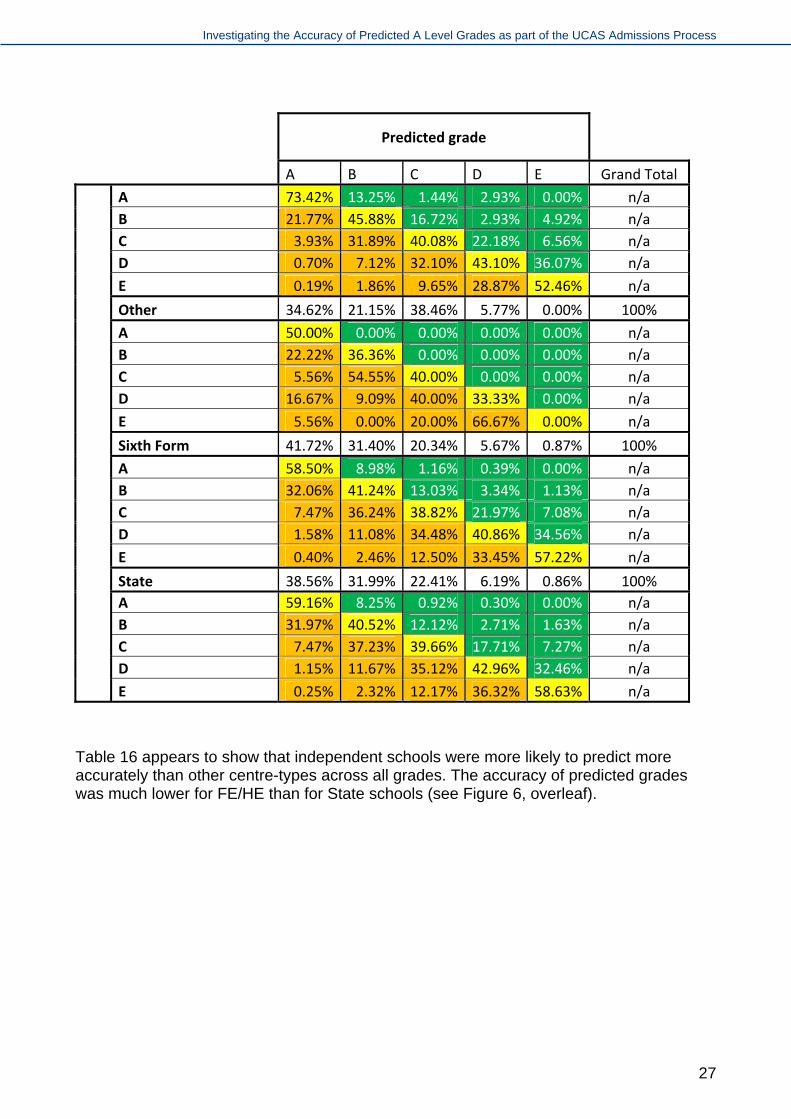
Different centre-types had different proportions of predicted grades which was likely to have had an influence on the overall accuracy of predictions. Table 16 explores the relationship between grades, centre-type and accuracy of prediction.
Table 16: The percentage of predictions by grade; percentage of predicted grades by achieved grades and by centre-type (2009, UK-domiciled)
Predicted grade
A B C D E Grand Total
Further/Higher Education 39.67% 35.32% 20.38% 4.00% 0.63% 100%
A 49.29% 7.48% 0.97% 0.00% 0.00% n/a
B 35.74% 33.10% 11.24% 1.91% 2.44% n/a
C 11.39% 39.67% 34.31% 15.65% 17.07% n/a
D 2.85% 15.82% 37.60% 43.51% 39.02% n/a
E 0.73% 3.93% 15.88% 38.93% 41.46% n/a
Grammar 59.88% 26.66% 11.23% 1.98% 0.26% 100%
A 67.57% 12.11% 1.31% 2.18% 0.00% n/a
B 25.91% 43.18% 15.03% 3.45% 1.37% n/a
C 5.46% 33.81% 40.03% 20.36% 12.33% n/a
D 0.79% 9.44% 32.82% 41.82% 31.51% n/a Achieved grade by centre‐type
E 0.27% 1.46% 10.80% 32.18% 54.79% n/a
Independent 70.03% 21.51% 7.02% 1.28% 0.16% 100%
26
Investigating the Accuracy of Predicted A Level Grades as part of the UCAS Admissions Process
Predicted grade
A B C D E Grand Total
A 73.42% 13.25% 1.44% 2.93% 0.00% n/a
B 21.77% 45.88% 16.72% 2.93% 4.92% n/a
C 3.93% 31.89% 40.08% 22.18% 6.56% n/a
D 0.70% 7.12% 32.10% 43.10% 36.07% n/a
E 0.19% 1.86% 9.65% 28.87% 52.46% n/a
Other 34.62% 21.15% 38.46% 5.77% 0.00% 100%
A 50.00% 0.00% 0.00% 0.00% 0.00% n/a
B 22.22% 36.36% 0.00% 0.00% 0.00% n/a
C 5.56% 54.55% 40.00% 0.00% 0.00% n/a
D 16.67% 9.09% 40.00% 33.33% 0.00% n/a
E 5.56% 0.00% 20.00% 66.67% 0.00% n/a
Sixth Form 41.72% 31.40% 20.34% 5.67% 0.87% 100%
A 58.50% 8.98% 1.16% 0.39% 0.00% n/a
B 32.06% 41.24% 13.03% 3.34% 1.13% n/a
C 7.47% 36.24% 38.82% 21.97% 7.08% n/a
D 1.58% 11.08% 34.48% 40.86% 34.56% n/a
E 0.40% 2.46% 12.50% 33.45% 57.22% n/a
State 38.56% 31.99% 22.41% 6.19% 0.86% 100%
A 59.16% 8.25% 0.92% 0.30% 0.00% n/a
B 31.97% 40.52% 12.12% 2.71% 1.63% n/a
C 7.47% 37.23% 39.66% 17.71% 7.27% n/a
D 1.15% 11.67% 35.12% 42.96% 32.46% n/a
E 0.25% 2.32% 12.17% 36.32% 58.63% n/a
Table 16 appears to show that independent schools were more likely to predict more accurately than other centre-types across all grades. The accuracy of predicted grades was much lower for FE/HE than for State schools (see Figure 6, overleaf).
27

Investigating the Accuracy of Predicted A Level Grades as part of the UCAS Admissions Process
Figure 6: Percentage of predicted grades achieved for FE/HE and State school types (2009 UK domiciled)
Figure 6 identifies D grades to be the only instance where the FE/HE school type had a higher percentage of accurate predictions than State schools. The biggest differences between grade prediction accuracy of these two centre-types were seen for grades A and E, where State schools achieved 9.87% and 17.17% (respectively) higher accuracy rates.
Table 16 shows that 39.67% of FE/HE grade predictions were for A grades, and only 0.63% were E grade predictions. A grade predictions from State schools were slightly lower at 38.56%, and E grade predictions marginally higher at 0.86%. FE/HE school types over-predicted, compared to state schools, for all grades where it was possible to do so (see Figure 7).
Figure 7: Percentage of grades over-predicted for FE/HE and State school types (2009 UK domiciled)
28

Investigating the Accuracy of Predicted A Level Grades as part of the UCAS Admissions Process
50.71% of A grade for FE/HE subjects were over-predicted compared to 40.84% for State schools. The difference in percentage points for A grade predictions was the largest of all the differences.
5.4.1 Conclusion
The most accurate predictions were made by Independent school types, followed by Grammar schools. This is partly due to the high proportion of A grades which are awarded in both types of institution. However, both Independent and Grammar school-types generally predict most accurately across grades A to D.
For Independent schools 70.03% of all predictions were for A grades and 73.42% of those were accurate;
For Grammar schools 59.88% of predictions were A grades, and of these, 67.57% were accurate.
The accuracy of C grade predictions remained consistent across most school types (accuracy rates were between 38.82% and 40.08%); the only exception being FE/HE school types which had an accuracy of 34.31%.
The large amounts of variation seen in the grade prediction accuracy across the various centre-types indicate that initial analysis has identified this variable to have a strong influence in determining the accuracy of predicted grades. Multivariate analysis would be required in order to understand whether centre-type is in fact the root cause for the disparity observed within Table 16, or if the variations seen within this report were the result of underlying factors.
5.5 Disability
The majority of applicants through UCAS do not declare a disability. Only 4.5% of applicants in the sample stated that they had any sort of disability, this figure rising to 5.8% when considering the total 2009 UK-domiciled applicant population (see Table 17).
Table 17: Percentage of applicants in sample and in 2009 application cycle by disability (2009, UK-domiciled)
Sample % 2009
No disability 95.5% 94.2%
Learning difficulty 2.7% 3.1%
Blind/ partial sight 0.1% 0.2%
Deaf /partial hearing 0.2% 0.3%
Wheelchair / mobility 0.1% 0.2%
Mental health 0.1% 0.3%
Unseen disability 0.5% 0.7%
Multiple disabilities 0.1% 0.2%
Other disability 0.6% 0.7%
Autistic disorder 0.2% 0.2%
29
Investigating the Accuracy of Predicted A Level Grades as part of the UCAS Admissions Process
Sample % 2009
Long standing illness 0.0% 0.0%
Total 100% 100%
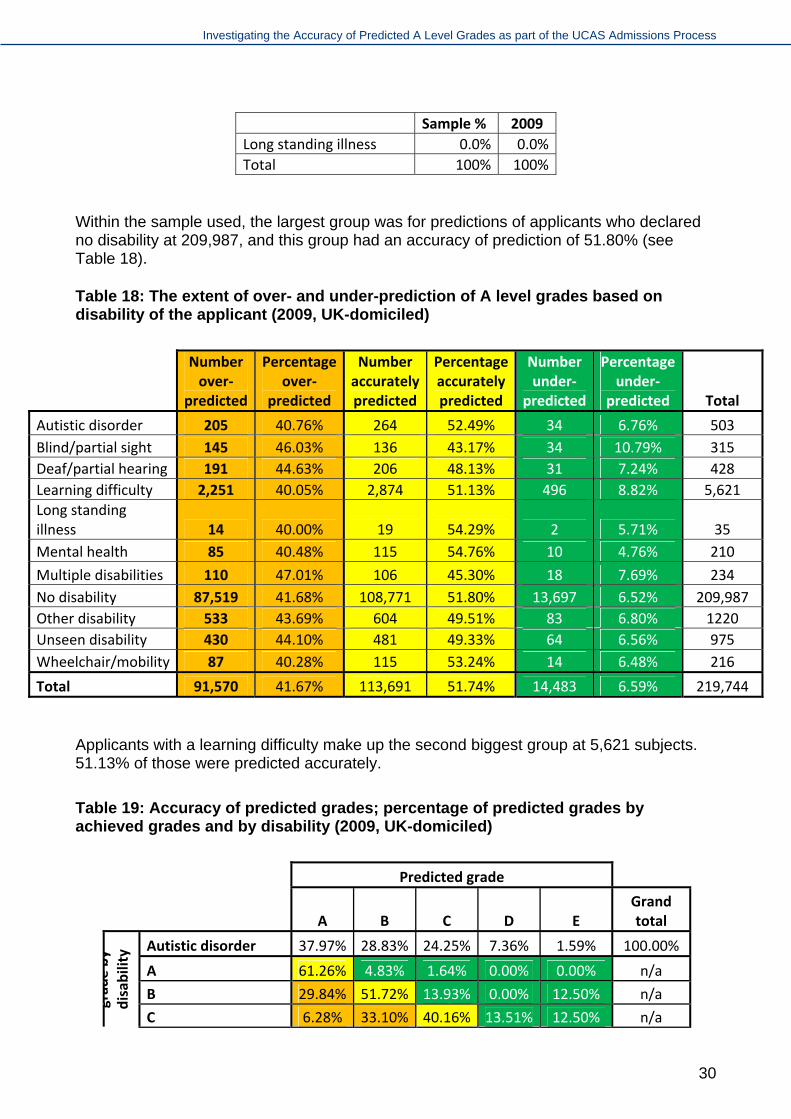
Within the sample used, the largest group was for predictions of applicants who declared no disability at 209,987, and this group had an accuracy of prediction of 51.80% (see Table 18).
Table 18: The extent of over- and under-prediction of A level grades based on disability of the applicant (2009, UK-domiciled)
Number over‐
predicted
Percentage over‐
predicted
Number accurately predicted
Percentage accurately predicted
Number under‐
predicted
Percentage under‐
predicted Total
205 40.76% 264 52.49% 34 6.76% 503 Autistic disorder
145 46.03% 136 43.17% 34 10.79% 315 Blind/partial sight
191 44.63% 206 48.13% 31 7.24% 428 Deaf/partial hearing
2,251 40.05% 2,874 51.13% 496 8.82% 5,621 Learning difficulty
14 40.00% 19 54.29% 2 5.71% 35 Long standing illness
85 40.48% 115 54.76% 10 4.76% 210 Mental health
110 47.01% 106 45.30% 18 7.69% 234 Multiple disabilities
87,519 41.68% 108,771 51.80% 13,697 6.52% 209,987 No disability
533 43.69% 604 49.51% 83 6.80% 1220 Other disability
430 44.10% 481 49.33% 64 6.56% 975 Unseen disability
87 40.28% 115 53.24% 14 6.48% 216 Wheelchair/mobility
91,570 41.67% 113,691 51.74% 14,483 6.59% 219,744 Total
Applicants with a learning difficulty make up the second biggest group at 5,621 subjects. 51.13% of those were predicted accurately.
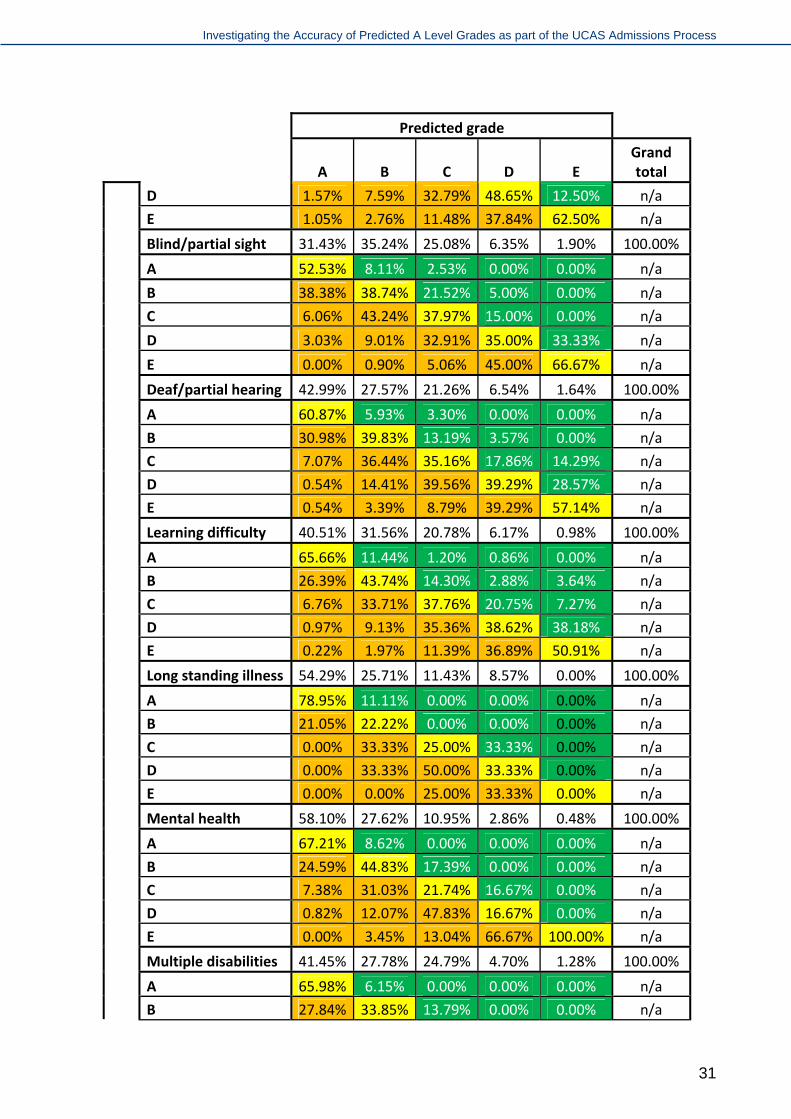
Table 19: Accuracy of predicted grades; percentage of predicted grades by achieved grades and by disability (2009, UK-domiciled)
Predicted grade
A B C D E Grand total
Autistic disorder 37.97% 28.83% 24.25% 7.36% 1.59% 100.00%
A 61.26% 4.83% 1.64% 0.00% 0.00% n/a
B 29.84% 51.72% 13.93% 0.00% 12.50% n/a
grad
e by
disab
ility
C 6.28% 33.10% 40.16% 13.51% 12.50% n/a
30
Investigating the Accuracy of Predicted A Level Grades as part of the UCAS Admissions Process
Predicted grade
A B C D E Grand total
D 1.57% 7.59% 32.79% 48.65% 12.50% n/a
E 1.05% 2.76% 11.48% 37.84% 62.50% n/a
Blind/partial sight 31.43% 35.24% 25.08% 6.35% 1.90% 100.00%
A 52.53% 8.11% 2.53% 0.00% 0.00% n/a
B 38.38% 38.74% 21.52% 5.00% 0.00% n/a
C 6.06% 43.24% 37.97% 15.00% 0.00% n/a
D 3.03% 9.01% 32.91% 35.00% 33.33% n/a
E 0.00% 0.90% 5.06% 45.00% 66.67% n/a
Deaf/partial hearing 42.99% 27.57% 21.26% 6.54% 1.64% 100.00%
A 60.87% 5.93% 3.30% 0.00% 0.00% n/a
B 30.98% 39.83% 13.19% 3.57% 0.00% n/a
C 7.07% 36.44% 35.16% 17.86% 14.29% n/a
D 0.54% 14.41% 39.56% 39.29% 28.57% n/a
E 0.54% 3.39% 8.79% 39.29% 57.14% n/a
Learning difficulty 40.51% 31.56% 20.78% 6.17% 0.98% 100.00%
A 65.66% 11.44% 1.20% 0.86% 0.00% n/a
B 26.39% 43.74% 14.30% 2.88% 3.64% n/a
C 6.76% 33.71% 37.76% 20.75% 7.27% n/a
D 0.97% 9.13% 35.36% 38.62% 38.18% n/a
E 0.22% 1.97% 11.39% 36.89% 50.91% n/a
Long standing illness 54.29% 25.71% 11.43% 8.57% 0.00% 100.00%
A 78.95% 11.11% 0.00% 0.00% 0.00% n/a
B 21.05% 22.22% 0.00% 0.00% 0.00% n/a
C 0.00% 33.33% 25.00% 33.33% 0.00% n/a
D 0.00% 33.33% 50.00% 33.33% 0.00% n/a
E 0.00% 0.00% 25.00% 33.33% 0.00% n/a
Mental health 58.10% 27.62% 10.95% 2.86% 0.48% 100.00%
A 67.21% 8.62% 0.00% 0.00% 0.00% n/a
B 24.59% 44.83% 17.39% 0.00% 0.00% n/a
C 7.38% 31.03% 21.74% 16.67% 0.00% n/a
D 0.82% 12.07% 47.83% 16.67% 0.00% n/a
E 0.00% 3.45% 13.04% 66.67% 100.00% n/a
Multiple disabilities 41.45% 27.78% 24.79% 4.70% 1.28% 100.00%
A 65.98% 6.15% 0.00% 0.00% 0.00% n/a
B 27.84% 33.85% 13.79% 0.00% 0.00% n/a
31

Investigating the Accuracy of Predicted A Level Grades as part of the UCAS Admissions Process
Predicted grade
A B C D E Grand total
C 6.19% 44.62% 29.31% 36.36% 0.00% n/a
D 0.00% 7.69% 41.38% 18.18% 66.67% n/a
E 0.00% 7.69% 15.52% 45.45% 33.33% n/a
No disability 47.53% 29.45% 17.79% 4.59% 0.64% 100.00%
A 63.75% 9.38% 1.03% 0.53% 0.00% n/a
B 28.56% 41.27% 12.79% 2.89% 1.55% n/a
C 6.33% 36.14% 39.45% 19.01% 7.69% n/a
D 1.09% 10.95% 34.62% 42.69% 33.14% n/a
E 0.27% 2.26% 12.10% 34.89% 57.62% n/a
Other disability 41.64% 28.28% 21.97% 7.21% 0.90% 100.00%
A 63.19% 8.70% 0.75% 1.14% 0.00% n/a
B 29.72% 42.03% 10.45% 4.55% 0.00% n/a
C 5.51% 40.00% 38.06% 13.64% 18.18% n/a
D 1.18% 7.83% 34.33% 35.23% 36.36% n/a
E 0.39% 1.45% 16.42% 45.45% 45.45% n/a
Unseen disability 39.38% 35.38% 19.69% 5.13% 0.41% 100.00%
A 57.81% 12.17% 0.52% 0.00% 0.00% n/a
B 28.91% 45.51% 7.29% 2.00% 0.00% n/a
C 10.68% 28.99% 40.63% 10.00% 0.00% n/a
D 2.08% 12.17% 40.63% 42.00% 25.00% n/a
E 0.52% 1.16% 10.94% 46.00% 75.00% n/a
Wheelchair/mobility 49.07% 23.61% 21.76% 4.63% 0.93% 100.00%
A 66.04% 15.69% 0.00% 0.00% 0.00% n/a
B 27.36% 37.25% 8.51% 0.00% 0.00% n/a
C 4.72% 37.25% 42.55% 10.00% 0.00% n/a
D 0.94% 7.84% 31.91% 50.00% 50.00% n/a
E 0.94% 1.96% 17.02% 40.00% 50.00% n/a
Accuracy was generally greater for A grade predictions than for all other grades. In many instances the cell numbers were very small for listed disabilities, for example, only 0.41% (representing four instances) of predictions for applicants with an unseen disability were predicted an E grade meaning that prediction accuracy results contained within Table 19 are likely to be skewed.
5.5.1 Conclusion
It is clearly very important to determine whether there exist any biases surrounding grade prediction accuracy of applicants with disabilities. However, the small numbers of
32

Investigating the Accuracy of Predicted A Level Grades as part of the UCAS Admissions Process
applicants who declare a disability when applying to university make quantitative analysis difficult and prone to contain unrepresentative data and results. This is a demographic characteristic that should certainly be included within future research so as to determine its significance with regard to A level grade prediction accuracy. Should such research suggest disability to have an effect on grade prediction then further consideration should be given to developing a methodology that more accurately collects and reports on applicant disability data.
5.6 Age
The biggest group of grade predictions within the sample was for 18-year-olds comprising of 178,896 entries, and 97.9% of all predictions were for applicants aged 18 and 19. The highest overall prediction accuracy was seen among applicants under the age of 18 (70.19%) and this group also saw only 27.08% over-predictions (see Table 20).
Table 20: The extent of over- and under-prediction of A level grades based on age of the applicant (2009, UK-domiciled)
Number over‐
predicted
Percentage over‐
predicted
Number accurately predicted
Percentage accurately predicted
Number under‐
predicted
Percentage under‐
predicted Total
169 27.08% 438 70.19% 17 2.72% 624 Under 18
69,845 39.04% 96,761 54.09% 12,290 6.87% 178,89618
18,686 51.97% 15,262 42.45% 2,007 5.58% 35,955 19
2,301 67.96% 942 27.82% 143 4.22% 3,386 20
485 64.07% 247 32.63% 25 3.30% 757 21‐24
49 68.06% 22 30.56% 1 1.39% 72 25‐29
26 61.90% 16 38.10% 0 0.00% 42 30‐39
9 75.00% 3 25.00% 0 0.00% 12 40+
91,570 41.67% 113,691 51.74% 14,483 6.59% 219,744Total
The percentage of accurate predictions decreased with age as over prediction increased. Under-prediction, however, was at the highest percentage for 18-year-old applicants and decreased as age increased.
The level of accuracy within each group varied depending on the grade predicted. For A grades, the prediction accuracy was higher for under 18, 18- and 19-year-olds than it was for all other grades (see Table 21).
33

Investigating the Accuracy of Predicted A Level Grades as part of the UCAS Admissions Process
Table 21: Accuracy of predicted grades; percentage of predicted grades by achieved grades and by age (2009, UK-domiciled)
Predicted grade
A B C D E Grand total
Under 18 77.40% 15.87% 5.61% 1.12% 0.00% 100%
A 78.26% 10.10% 2.86% 28.57% 0.00% n/a
B 17.39% 43.43% 11.43% 0.00% 0.00% n/a
C 3.93% 37.37% 37.14% 0.00% 0.00% n/a
D 0.41% 7.07% 40.00% 57.14% 0.00% n/a
E 0.00% 2.02% 8.57% 14.29% 0.00% n/a
18 years 47.84% 29.18% 17.78% 4.56% 0.64% 100%
A 66.71% 10.06% 1.07% 0.55% 0.00% n/a
B 26.87% 43.30% 13.47% 3.03% 1.65% n/a
C 5.46% 35.09% 40.61% 20.00% 7.75% n/a
D 0.79% 9.72% 33.66% 42.78% 33.25% n/a
E 0.17% 1.83% 11.19% 33.64% 57.35% n/a
44.14% 31.18% 18.90% 5.06% 0.71% 100% 19 years
A 51.20% 7.04% 0.94% 0.38% 0.00% n/a
B 35.93% 34.40% 10.52% 2.42% 1.95% n/a
C 10.07% 40.37% 34.87% 15.44% 7.42% n/a
D 2.24% 14.76% 38.40% 41.76% 32.42% n/a
E 0.55% 3.43% 15.26% 40.00% 58.20% n/a
20 years 42.53% 31.51% 19.17% 5.82% 0.97% 100%
A 29.24% 4.69% 0.77% 0.51% 0.00% n/a Achieved grade by age
B 46.74% 23.90% 6.63% 2.03% 0.00% n/a
C 16.04% 39.83% 27.27% 12.18% 12.12% n/a
D 5.42% 23.15% 44.53% 36.55% 36.36% n/a
E 2.57% 8.43% 20.80% 48.73% 51.52% n/a
21‐24 years
45.18% 32.36% 15.59% 5.55% 1.32% 100%
A 39.18% 4.90% 0.85% 0.00% 0.00% n/a
B 36.84% 25.71% 4.24% 0.00% 0.00% n/a
C 16.37% 33.06% 27.12% 4.76% 0.00% n/a
D 4.68% 26.53% 41.53% 30.95% 50.00% n/a
E 2.92% 9.80% 26.27% 64.29% 50.00% n/a
25‐29 years 68.06% 25.00% 6.94% 0.00% 0.00% 100%
A 32.65% 5.56% 0.00% 0.00% 0.00% n/a
34

Investigating the Accuracy of Predicted A Level Grades as part of the UCAS Admissions Process
Predicted grade
A B C D E Grand total
B 26.53% 16.67% 0.00% 0.00% 0.00% n/a
C 22.45% 27.78% 40.00% 0.00% 0.00% n/a
D 8.16% 33.33% 40.00% 0.00% 0.00% n/a
E 10.20% 16.67% 20.00% 0.00% 0.00% n/a
30‐39 years 76.19% 19.05% 2.38% 0.00% 2.38% 100%
A 40.63% 0.00% 0.00% 0.00% 0.00% n/a
B 43.75% 25.00% 0.00% 0.00% 0.00% n/a
C 9.38% 37.50% 0.00% 0.00% 0.00% n/a
D 6.25% 25.00% 100.00% 0.00% 0.00% n/a
E 0.00% 12.50% 0.00% 0.00% 100.00% n/a
40+ years 50.00% 33.33% 16.67% 0.00% 0.00% 100%
A 33.33% 0.00% 0.00% 0.00% 0.00% n/a
B 50.00% 0.00% 0.00% 0.00% 0.00% n/a
C 0.00% 25.00% 50.00% 0.00% 0.00% n/a
D 16.67% 50.00% 50.00% 0.00% 0.00% n/a
E 0.00% 25.00% 0.00% 0.00% 0.00% n/a
5.6.1 Conclusion
There were relatively few predictions for older age groups, and these groups also had low percentages of accurate predictions.
As shown in the data tables, applicants aged 19 and under had significantly higher grade prediction accuracy than those aged 20 and above, however these findings were not particularly surprising since the process of carrying out A levels and obtaining predicted grades is one predominantly experienced by 18- and 19-year-olds. In fact, only 1.9% of grade predictions within the sample related to applicants aged 20 or older.
Using multivariate regression analysis, further research could be undertaken to determine the significance that age has on prediction accuracy, although, due to the fact that the vast majority of A level applicants are under the age of 20, very careful consideration would have to be given to the interpretation of any findings from such analyses.
5.7 Region (England only)
This section briefly considers the accuracy of prediction by region. The London and the South-East had the largest number of subjects in their region at 38,067 and 40,606, respectively (see Table 22).
35
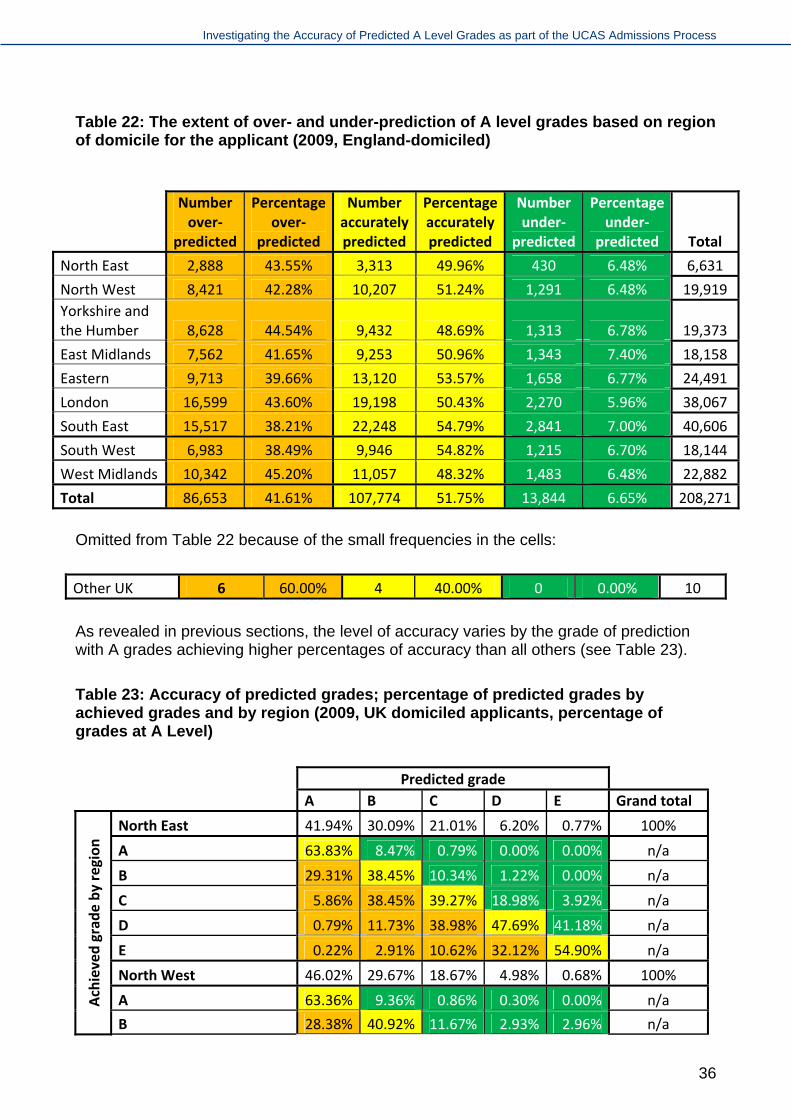
Investigating the Accuracy of Predicted A Level Grades as part of the UCAS Admissions Process
Table 22: The extent of over- and under-prediction of A level grades based on region of domicile for the applicant (2009, England-domiciled)
Number over‐
predicted
Percentage over‐
predicted
Number accurately predicted
Percentage accurately predicted
Number under‐
predicted
Percentage under‐
predicted Total
2,888 43.55% 3,313 49.96% 430 6.48% 6,631 North East
8,421 42.28% 10,207 51.24% 1,291 6.48% 19,919 North West
8,628 44.54% 9,432 48.69% 1,313 6.78% 19,373 Yorkshire and the Humber
7,562 41.65% 9,253 50.96% 1,343 7.40% 18,158 East Midlands
9,713 39.66% 13,120 53.57% 1,658 6.77% 24,491 Eastern
16,599 43.60% 19,198 50.43% 2,270 5.96% 38,067 London
15,517 38.21% 22,248 54.79% 2,841 7.00% 40,606 South East
6,983 38.49% 9,946 54.82% 1,215 6.70% 18,144 South West
10,342 45.20% 11,057 48.32% 1,483 6.48% 22,882 West Midlands
86,653 41.61% 107,774 51.75% 13,844 6.65% 208,271Total
Omitted from Table 22 because of the small frequencies in the cells:
6 60.00% 4 40.00% 0 0.00% 10 Other UK
As revealed in previous sections, the level of accuracy varies by the grade of prediction with A grades achieving higher percentages of accuracy than all others (see Table 23).
Table 23: Accuracy of predicted grades; percentage of predicted grades by achieved grades and by region (2009, UK domiciled applicants, percentage of grades at A Level)
Predicted grade
A B C D E Grand total
North East 41.94% 30.09% 21.01% 6.20% 0.77% 100%
A 63.83% 8.47% 0.79% 0.00% 0.00% n/a
B 29.31% 38.45% 10.34% 1.22% 0.00% n/a
C 5.86% 38.45% 39.27% 18.98% 3.92% n/a
D 0.79% 11.73% 38.98% 47.69% 41.18% n/a
E 0.22% 2.91% 10.62% 32.12% 54.90% n/a
North West 46.02% 29.67% 18.67% 4.98% 0.68% 100%
A 63.36% 9.36% 0.86% 0.30% 0.00% n/a Achieved grade by region
B 28.38% 40.92% 11.67% 2.93% 2.96% n/a
36

Investigating the Accuracy of Predicted A Level Grades as part of the UCAS Admissions Process
Predicted grade
A B C D E Grand total
C 6.80% 36.94% 39.78% 18.37% 5.93% n/a
D 1.18% 10.63% 34.78% 42.89% 34.07% n/a
E 0.28% 2.15% 12.91% 35.52% 57.04% n/a
Yorkshire and the Humber 41.46% 29.58% 22.02% 6.03% 0.91% 100%
A 60.28% 8.53% 1.08% 0.34% 0.00% n/a
B 31.05% 39.73% 11.63% 2.65% 1.14% n/a
C 6.75% 37.48% 39.46% 16.34% 2.27% n/a
D 1.53% 11.66% 34.65% 43.63% 28.41% n/a
E 0.39% 2.60% 13.18% 37.04% 68.18% n/a
East Midlands 42.88% 29.24% 20.49% 6.32% 1.06% 100%
A 63.30% 8.57% 1.02% 0.78% 0.00% n/a
B 29.84% 42.89% 12.93% 2.35% 0.52% n/a
C 5.86% 36.54% 38.59% 21.43% 8.29% n/a
D 0.76% 10.32% 35.93% 43.99% 36.27% n/a
E 0.24% 1.68% 11.53% 31.45% 54.92% n/a
Eastern 46.72% 29.90% 17.92% 4.86% 0.60% 100%
A 66.01% 9.64% 1.07% 1.18% 0.00% n/a
B 27.84% 43.85% 13.08% 3.78% 0.68% n/a
C 5.26% 35.60% 40.44% 17.82% 8.16% n/a
D 0.75% 9.34% 34.22% 41.51% 31.97% n/a
E 0.14% 1.57% 11.19% 35.71% 59.18% n/a
Greater London 51.22% 29.14% 15.78% 3.40% 0.46% 100%
A 62.31% 9.27% 1.17% 0.46% 0.00% n/a
B 28.11% 37.68% 13.55% 2.86% 1.70% n/a
C 7.45% 36.26% 37.51% 18.17% 10.80% n/a
D 1.68% 13.35% 33.98% 40.22% 32.95% n/a
E 0.45% 3.44% 13.79% 38.28% 54.55% n/a
South East 50.57% 28.94% 15.85% 4.05% 0.59% 100%
A 66.68% 11.17% 1.34% 0.43% 0.00% n/a
B 27.08% 43.91% 14.29% 3.77% 2.09% n/a
C 5.36% 34.21% 39.95% 21.52% 8.37% n/a
D 0.70% 9.14% 33.53% 41.70% 31.38% n/a
E 0.18% 1.57% 10.89% 32.58% 58.16% n/a
South West 50.22% 28.71% 16.44% 4.06% 0.57% 100%
Achieved grade by region
A 65.67% 10.41% 0.91% 0.54% 0.00% n/a
37

Investigating the Accuracy of Predicted A Level Grades as part of the UCAS Admissions Process
Predicted grade
A B C D E Grand total
B 27.88% 44.56% 14.18% 2.99% 1.94% n/a
C 5.76% 34.92% 42.81% 20.08% 15.53% n/a
D 0.56% 8.66% 32.69% 42.06% 30.10% n/a
E 0.13% 1.46% 9.42% 34.33% 52.43% n/a
West Midlands 42.70% 30.90% 20.15% 5.49% 0.76% 100%
A 60.50% 8.22% 0.87% 0.48% 0.00% n/a
B 29.83% 39.41% 11.65% 1.83% 2.87% n/a
C 7.82% 36.66% 37.48% 16.96% 8.05% n/a
D 1.49% 13.14% 36.76% 43.07% 36.78% n/a
E 0.36% 2.57% 13.25% 37.66% 52.30% n/a
Predictions for B and C grades tended to have the lowest percentages of accuracy. All regions saw A grades to be the most commonly predicted grade, however the same cannot be said for prediction accuracy, where Yorkshire and the Humber had its highest prediction accuracy for E grades (68.18%).
The South East had the highest A grade prediction accuracy (66.68%), the South West had the highest prediction accuracy for B and C grade predictions (44.56% and 42.81% respectively), and the North East had the highest D grade prediction accuracy (47.69%).
Greater London had the highest percentage of A grade predictions (51.22%), whereas the South East achieved the highest A grade attainment rate (37.18%).
5.7.1 Conclusion
Applicants from the North East, Yorkshire and the Humber, and the West Midlands received the lowest rates of prediction accuracy. Interestingly these three regions also obtained the lowest proportion of A and B grade attainment. Applicants from Eastern, South East, and South West regions achieved the highest overall prediction accuracy, these three regions achieving very high rates of A and B grade attainment. Grade prediction accuracy, therefore, appears to be overtly driven by rates of attainment in the top two A level grades.
Whilst variation of prediction accuracy does appear distinct across various regions of England, statistical modelling enabling multivariate analysis would be required in order to ensure that these variations are not in fact the result of other more influential underlying factors.
5.8 Country (within the UK only)
Having considered grade prediction performance for English regions in section 5.7, Tables 24 and 25 detail grade prediction accuracy by UK country. England had the highest
38

Investigating the Accuracy of Predicted A Level Grades as part of the UCAS Admissions Process
percentage of applicants and the biggest group of subjects at 208,281 accounting for nearly 95% of the sample (see Table 24).
Table 24: The extent of over- and under-prediction of A level grades based on country of domicile for the applicant (2009, UK-domiciled)
Number over‐
predicted
Percentage over‐
predicted
Number accurately predicted
Percentage accurately predicted
Number under‐
predicted
Percentage under‐
predicted Total
86,659 41.61% 107,778 51.75% 13,844 6.65% 208,281 England
685 44.48% 781 50.71% 74 4.81% 1,540 Northern Ireland
272 44.74% 297 48.85% 39 6.41% 608 Scotland
3,954 42.45% 4,835 51.91% 526 5.65% 9,315 Wales
91,570 41.67% 113,691 51.74% 14,483 6.59% 219,744 Total
Grade prediction accuracy for all countries remained relatively consistent with around half of predictions being achieved accurately and between about 41% and 45% over-predicted. In a pattern consistent throughout all groups, few grades were under-predicted, and A grade predictions achieved the highest accuracy of all grade predictions (see Table 25).
Table 25: Accuracy of predicted grades; percentage of predicted grades by achieved grades and by country (2009, UK domiciled applicants, percentage of grades at A Level)
Predicted grade
A B C D E Grand total
England 47.11% 29.48% 18.02% 4.72% 0.67% 100%
A 63.84% 9.50% 1.06% 0.54% 0.00% n/a
B 28.45% 41.37% 12.85% 2.86% 1.65% n/a
C 6.35% 36.00% 39.31% 18.89% 7.96% n/a
D 1.09% 10.91% 34.70% 42.55% 33.12% n/a
E 0.28% 2.22% 12.08% 35.16% 57.28% n/a
Northern Ireland 59.48% 27.79% 10.91% 1.75% 0.06% 100%
A 61.24% 9.35% 2.38% 0.00% 0.00% n/a
B 27.62% 33.88% 13.69% 7.41% 0.00% n/a
C 7.64% 34.35% 37.50% 18.52% 0.00% n/a
D 2.40% 16.59% 30.95% 40.74% 0.00% n/a
Achieved grade by country (UK)
E 1.09% 5.84% 15.48% 33.33% 100.00% n/a
Scotland 56.58% 26.48% 12.99% 3.78% 0.16% 100%
39

Investigating the Accuracy of Predicted A Level Grades as part of the UCAS Admissions Process
Predicted grade
A B C D E Grand total
A 60.17% 13.66% 1.27% 4.35% 0.00% n/a
B 30.23% 33.54% 12.66% 0.00% 0.00% n/a
C 7.56% 39.13% 35.44% 21.74% 0.00% n/a
D 2.03% 10.56% 40.51% 30.43% 0.00% n/a
E 0.00% 3.11% 10.13% 43.48% 100.00% n/a
Wales 47.39% 30.84% 17.55% 3.66% 0.56% 100%
A 62.66% 7.59% 0.49% 0.29% 0.00% n/a
B 30.22% 42.95% 11.87% 3.52% 1.92% n/a
C 6.05% 37.70% 40.86% 20.82% 1.92% n/a
D 0.93% 9.43% 34.50% 40.18% 38.46% n/a
E 0.14% 2.33% 12.29% 35.19% 57.69% n/a
Because of the very small numbers used in the analysis of grade predictions from Northern Ireland, Scotland, and Wales, caution should be taken when considering the results detailed within Table 25. For example, both Scotland and Northern Ireland appeared to have achieved 100% accuracy for their E grade predictions, however both of these high scores were caused by singular instances of E grade prediction and achievement, and so cannot be considered representative.
5.8.1 Conclusion
Consideration should be given to improving the data sample so as to avoid (wherever possible) low numbers skewing results, and further findings may become apparent should future research into this area include multivariate regression analysis so as to enable significance-testing of variables.
5.9 Number of choices made in the UCAS main scheme
Applicants can make up to five choices through the main scheme, however these choices are limited to four if applying to study Medicine, Dentistry and/or Veterinary Studies. Since the requirements for any applicant wishing to apply to study one of these courses are generally A grades, and since (within the sample used) applicants who made four choices clearly had the highest overall prediction accuracy (56.27%), it is likely that there is a strong association between the number of choices made, predicted A grades, and subject (see Table 26).
40

Investigating the Accuracy of Predicted A Level Grades as part of the UCAS Admissions Process
Table 26: The extent of over- and under-prediction of A level grades based on the number of choices made in UCAS main scheme for the applicant (2009 entry)
Number over‐
predicted
Percentage over‐
predicted
Number accurately predicted
Percentage accurately predicted
Number under‐
predicted
Percentage under‐
predicted Total
1,106 41.58% 1,381 51.92% 173 6.50% 2,660 One Choice
1,175 48.20% 1,055 43.27% 208 8.53% 2,438 Two Choices
2,642 47.28% 2,498 44.70% 448 8.02% 5,588 Three Choices
6,731 38.07% 9,948 56.27% 1,000 5.66% 17,679 Four Choices
79,916 41.76% 98,809 51.63% 12,654 6.61% 191,379Five Choices
91,570 41.67% 113,691 51.74% 14,483 6.59% 219,744Total
The lowest percentage of accurate predictions was seen among applicants who made two choices, and this group also saw the highest over- and under-prediction rates.
Table 27 (overleaf) shows that the level of accuracy varied by grade, with the highest accuracy of prediction for grade A. The most accurate A grade predictions were for subjects taken by applicants who made only one choice in the main scheme. Applicants making four choices had the second highest percentage of accurate predictions on grade A (71.2%), and the highest percentage of predicted A grades (50%)
Table 27: Accuracy of predicted grades; percentage of predicted grades by achieved grades and by number of choices made in UCAS main scheme (2009, UK-domiciled)
Predicted grade
A B C D E Grand total
1 choice 38.27% 24.55% 25.45% 10.04% 1.69% 100%
A 72.69% 6.13% 1.03% 0.00% 0.00% n/a
B 21.71% 38.28% 9.90% 1.12% 2.22% n/a
C 4.62% 40.74% 37.22% 13.86% 4.44% n/a
D 0.49% 11.64% 38.26% 42.32% 35.56% n/a
E 0.49% 3.22% 13.59% 42.70% 57.78% n/a
2 choices 27.44% 32.28% 28.59% 10.05% 1.64% 100%
A 57.85% 9.15% 1.00% 0.00% 0.00% n/a
B 30.19% 37.48% 10.47% 2.45% 0.00% n/a
C 10.91% 40.53% 35.01% 15.51% 5.00% n/a
Achieved grade by number of choices
D 1.05% 10.80% 39.89% 41.22% 25.00% n/a
41

Investigating the Accuracy of Predicted A Level Grades as part of the UCAS Admissions Process
Predicted grade
A B C D E Grand total
E 0.00% 2.03% 13.63% 40.82% 70.00% n/a
3 choices 27.51% 31.98% 29.26% 9.57% 1.68% 100%
A 55.17% 6.77% 0.61% 0.00% 0.00% n/a
B 33.77% 40.29% 10.21% 3.18% 2.13% n/a
C 8.91% 39.51% 39.27% 17.01% 7.45% n/a
D 1.82% 11.08% 37.25% 44.11% 35.11% n/a
E 0.33% 2.35% 12.66% 35.70% 55.32% n/a
4 choices 50.05% 24.53% 18.94% 5.67% 0.81% 100%
A 71.16% 7.61% 0.78% 0.40% 0.00% n/a
B 23.04% 40.81% 11.05% 2.69% 2.08% n/a
C 4.77% 37.88% 40.17% 19.06% 6.94% n/a
D 0.72% 11.18% 36.74% 44.41% 27.08% n/a
E 0.31% 2.51% 11.26% 33.43% 63.89% n/a
5 choices 47.93% 29.94% 17.27% 4.28% 0.59% 100%
A 63.13% 9.69% 1.09% 0.62% 0.00% n/a
B 29.03% 41.53% 13.23% 2.96% 1.60% n/a
C 6.45% 35.71% 39.42% 19.35% 8.08% n/a
D 1.13% 10.84% 34.17% 42.13% 34.10% n/a
E 0.27% 2.22% 12.09% 34.94% 56.22% n/a
5.9.1 Conclusion
Although quite substantial variation was seen dependent upon the number of choices made, it is difficult to read much into the figures presented within Tables 26 and 27 without also considering other related variables. As previously mentioned in this section, applicants can make up to five choices through the main scheme with a limit of up to four choices if applying to Medicine, Dentistry and Veterinary Studies courses. It would, therefore, appear that subject choice had a more direct effect on prediction accuracy than the number of choices variable. The number of choices an applicant makes is also driven by other factors, for example the number of dependents of the applicant and the availability of local HE provision.
Because this variable seems to be so heavily influenced by other factors, it is recommended that significance testing be carried out and alternative variables (such as subject) given greater consideration within future iterations of this research.
42

Investigating the Accuracy of Predicted A Level Grades as part of the UCAS Admissions Process
6. Under- and over-prediction (explored by ethnicity) This section explores under and over prediction in more detail for ethnicity. Similar depth analyses could be undertaken for other factors.
The highest grades, A and B, were more likely to be over-predicted and the lowest grades, D and E, tended to be under-predicted. Since the likelihood of the grade being either over- or under-predicted was dependent on the individual grade, examining additional applicant characteristics in order to determine accuracy with greater confidence could be an essential component of the admissions process. Evaluating available information from further sources such as contextual data and general applicant characteristics becomes more important as a process of differentiating between the accuracy of predicted grades.
Entry requirements to courses ensure that applicants hold (or are predicted) certain grades before an HEI will make an offer. It is plausible that, in a competitive time of trying to meet these requirements, applicants to HE will be more likely to receive over-predictions. The distribution of predicted grades among different types of applicant may help to explain some of the figures which could have been a consequence of the quantity and types of grades received. This section examines predicted grades by ethnicity as an example to illustrate the differences observed.
The distribution of grades by ethnic groups varied with Black African and Black Caribbean applicants having the lowest percentages of achieved A grades at 15.2% and 17.1% of subjects (see Figure 8).
Figure 8: Percentage of achieved grades by ethnicity
As already noted, there was an association between achievement in terms of grades and the rate of over-prediction of grades. The highest percentage of accurate predicted grades
43

Investigating the Accuracy of Predicted A Level Grades as part of the UCAS Admissions Process
was for grades by Mixed White and Asian, and Asian Chinese applicants at 69.95% and 68.26% respectively.
More A grades were predicted than achieved and this was consistent across all ethnic groups (see Figure 9).
Figure 9: The percentage of A grades predicted and achieved by ethnicity (2009, UK-domiciled)
The pattern for B grades was less clear with the majority having been over-predicted although some groups achieved higher grades than expected (Figure 10 overleaf). For some groups the difference lay in a drop from a prediction of A while for others it may have been an increase from a prediction of C. There was a prediction of 21.3% of subjects taken by Asian Chinese applicants to achieve a B grade while in fact 26.4% of subjects achieved that grade (see Figure 11 overleaf).
44

Investigating the Accuracy of Predicted A Level Grades as part of the UCAS Admissions Process
Figure 10: The percentage of achieved and predicted B grades
Figure 11: The percentage of achieved and predicted C grades
Figure 12 (overleaf) shows that for all ethnic groups, more D grades are achieved than predicted.
45

Investigating the Accuracy of Predicted A Level Grades as part of the UCAS Admissions Process
Figure 12: The percentage of achieved and predicted grade Ds
Figure 13 shows that very few grade Es were predicted with the highest percentage being 2% of Asian Bangladeshi and 1.5% of Black Other subjects. Entry requirements are very unlikely to contain E grades, perhaps explaining why the predictions are so low. The suggestion from this data is that applicants who achieve E grades do so unexpectedly.
Figure 13: The percentage of achieved and predicted E grades
46

Investigating the Accuracy of Predicted A Level Grades as part of the UCAS Admissions Process
7. Profile of applicants The analysis thus far has found that many of the demographic factors appear to have influenced grade prediction accuracy: this can often be the case when dealing with a large dataset. This section examines the particular subset of the population which would appear to be the most likely to be accurately predicted rather than over-predicted, in order to explore if any of that group were in fact over-predicted. The group examined was:
female applicants in 2009 who were classed as higher Managerial, 18 years of age, UK-domiciled and who applied to pre-clinical medicine. Additional information has been provided for Grammar and Independent school applicants by ethnicity.
Table 28: The number of grades predicted from A to D by the grade achieved (2009, UK-domiciled)
Grade achieved
A B C D E Total
Grade A 1,564 326 46 7 1 1,944
predicted B 22 57 37 9 4 129
C 0 3 4 1 0 8
D 0 0 0 1 0 1
Total 1,586 386 87 18 5 2,082
Table 29: The percentage of grades predicted from A to D by the grade achieved (2009, UK-domiciled)
Grade achieved
A B C D E Total
Grade A 80.5% 16.8% 2.4% 0.4% 0.1% 100%
predicted B 17.1% 44.2% 28.7% 7.0% 3.1% 100%
C 0.0% 37.5% 50.0% 12.5% 0.0% 100%
D 0.0% 0.0% 0.0% 100.0% 0.0% 100%
Total 76.2% 18.5% 4.2% 0.9% 0.2% 100%
1,944 grades were predicted as A at A level
1,564 of those predicted A grades were achieved (80.5%), so nearly 20% were over-predicted.
47

Investigating the Accuracy of Predicted A Level Grades as part of the UCAS Admissions Process
Table 30: Grammar School applicants that were classed as higher managerial, 18-years-old, who applied to pre-clinical medicine (2009, UK-domiciled)
Grade achieved
A B C D Total
A grade predicted 399 61 11 3 474
Asian Bangladeshi 0 0 0 0 0
Asian Chinese 20 2 0 0 22
Asian Indian 60 5 4 1 70
Asian Other 16 5 0 0 21
Asian Pakistani 29 9 0 1 39
Black African 15 4 1 0 20
Black Caribbean 0 0 0 0 0
Mixed Other 12 0 0 0 12
Mixed White and Asian 11 2 0 0 13
Mixed White and Black African 0 0 0 0 0
Mixed White and Black Caribbean 4 0 0 0 4
Other 15 2 0 0 17
Unknown 7 0 0 0 7
White 210 32 6 1 249
Total 393 61 11 3 474
Table 31: The percentage of grammar school applicants who were classed as higher managerial, 18 years of age, who applied to pre-clinical medicine (2009, UK-domiciled)
A B C D Total
A grade predicted 84.2% 12.9% 2.3% 0.6% 100%
Asian Chinese 90.9% 9.1% 0.0% 0.0% 100%
Asian Indian 85.7% 7.1% 5.7% 1.4% 100%
Asian Other 76.2% 23.8% 0.0% 0.0% 100%
Asian Pakistani 74.4% 23.1% 0.0% 2.6% 100%
Black African 75.0% 20.0% 5.0% 0.0% 100%
Mixed White and Asian 84.6% 15.4% 0.0% 0.0% 100%
Other 88.2% 11.8% 0.0% 0.0% 100%
White 84.3% 12.9% 2.4% 0.4% 100%
Asian Bangladeshi 0.0% 0.0% 0.0% 0.0% ‐
Mixed Other 0.0% 0.0% 0.0% 0.0% ‐
Black Caribbean 0.0% 0.0% 0.0% 0.0% ‐
Unknown 0.0% 0.0% 0.0% 0.0% ‐
Mixed White and Black African 0.0% 0.0% 0.0% 0.0% ‐
Mixed White and Black Caribbean 0.0% 0.0% 0.0% 0.0% ‐
Total 84.2% 12.9% 2.3% 0.6% 100%
48
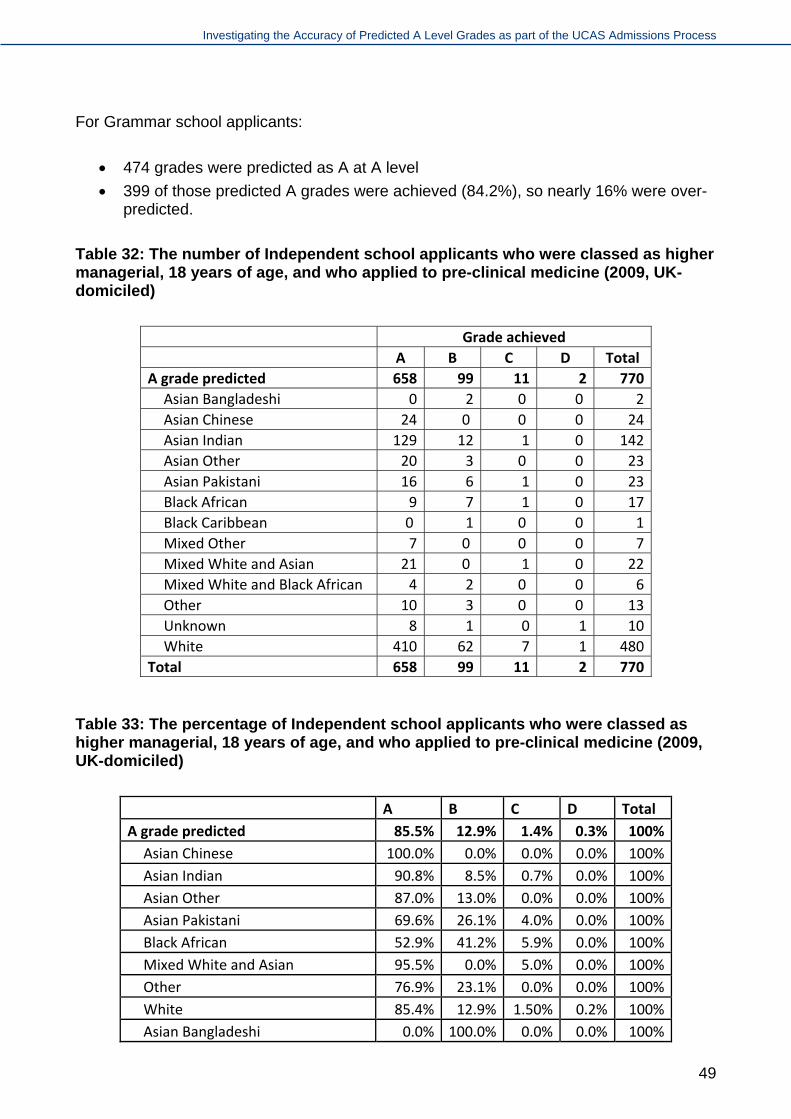
Investigating the Accuracy of Predicted A Level Grades as part of the UCAS Admissions Process
For Grammar school applicants:
474 grades were predicted as A at A level
399 of those predicted A grades were achieved (84.2%), so nearly 16% were over-predicted.
Table 32: The number of Independent school applicants who were classed as higher managerial, 18 years of age, and who applied to pre-clinical medicine (2009, UK-domiciled)
Grade achieved
A B C D Total
A grade predicted 658 99 11 2 770
Asian Bangladeshi 0 2 0 0 2
Asian Chinese 24 0 0 0 24
Asian Indian 129 12 1 0 142
Asian Other 20 3 0 0 23
Asian Pakistani 16 6 1 0 23
Black African 9 7 1 0 17
Black Caribbean 0 1 0 0 1
Mixed Other 7 0 0 0 7
Mixed White and Asian 21 0 1 0 22
Mixed White and Black African 4 2 0 0 6
Other 10 3 0 0 13
Unknown 8 1 0 1 10
White 410 62 7 1 480
Total 658 99 11 2 770
Table 33: The percentage of Independent school applicants who were classed as higher managerial, 18 years of age, and who applied to pre-clinical medicine (2009, UK-domiciled)
A B C D Total
A grade predicted 85.5% 12.9% 1.4% 0.3% 100%
Asian Chinese 100.0% 0.0% 0.0% 0.0% 100%
Asian Indian 90.8% 8.5% 0.7% 0.0% 100%
Asian Other 87.0% 13.0% 0.0% 0.0% 100%
Asian Pakistani 69.6% 26.1% 4.0% 0.0% 100%
Black African 52.9% 41.2% 5.9% 0.0% 100%
Mixed White and Asian 95.5% 0.0% 5.0% 0.0% 100%
Other 76.9% 23.1% 0.0% 0.0% 100%
White 85.4% 12.9% 1.50% 0.2% 100%
Asian Bangladeshi 0.0% 100.0% 0.0% 0.0% 100%
49

Investigating the Accuracy of Predicted A Level Grades as part of the UCAS Admissions Process
A B C D Total
Mixed Other 0.0% 0.0% 0.0% 0.0% ‐
Black Caribbean 0.0% 0.0% 0.0% 0.0% ‐
Unknown 80.0% 10.0% 0.0% 10.0% 100%
Mixed White and Black African 67.0% 33.0% 0.0% 0.0% 100%
Mixed White and Black Caribbean 0.0% 0.0% 0.0% 0.0% ‐
Total 85.5% 12.9% 1.4% 0.3% 100%
There were 770 A grade predictions for the Independent school and 658 predicted A grades were achieved (85.5%). As anticipated, the predicted grades were achieved to a high percentage.
For Independent school applicants:
770 grades were predicted as A at A level 658 of those predicted A grades were achieved (85.5%), so under 15% were over-
predicted.
50

Investigating the Accuracy of Predicted A Level Grades as part of the UCAS Admissions Process
8. Conclusion This work has reported the current (2009 admission cycle) status GCE A level grade prediction accuracy in the UK. An overall accuracy rate of 51.7% has been identified; it has been established that there is a clear tendency to over- rather than under-predict grades, and it has been noted that prediction accuracy varies greatly depending on the grade in question.
A grades were consistently the most accurately predicted across all demographic factors although it was when considering applicants’ age where the greatest variation was observed. This characteristic saw accuracy percentages ranging from 78.3% (predictions for applicants aged under 18) to 29.2% (predictions for applicants aged 20). C grades were the least accurately predicted grade with, on average, only 39.4% of predictions being correct.
When considering various demographic characteristics there appear to be strong indications that certain factors such as socio-economic background, centre-type and ethnicity have a direct impact on grade prediction accuracy. For example, when considering social class, a steady decrease in prediction accuracy was observed when moving from high to low socio-economic groups; similar findings were apparent when analysing predictions by centre-type. However, it is noted that higher socio-economic groups tend to achieve a higher proportion of A grades which are most accurately predicted.
Therefore, one consistent message arising from all aspects of the analysis has been that, in order to ascertain whether or not certain variables are indeed the root cause of variations within grade prediction accuracy, a statistical model will have to be designed. This will allow testing of the effects all relevant variables have on each other, and subsequently significance testing of each individual variable. Until such a model has been created it is only possible to speculate as to the effect certain demographic characteristics have on grade prediction accuracy.
51

Investigating the Accuracy of Predicted A Level Grades as part of the UCAS Admissions Process
References Archer, L. and Leathwood, C., 2003. Identities, Inequalities and Higher Education
Archer, L. and Yamashita, H., 2003. Knowing Their Limits? Identities, Inequalities and Inner City School Leavers Post-16 Aspirations
Archer, L., Hutchings, M. and Ross, A., 2002. Higher Education and Social Class: issues of exclusion and inclusion
Ball, S. J., Reay, D. & David, M., 2002. Ethnic choosing: minority ethnic students, social class and higher education choice,
Gorard, S., Rees, G. and Fevre, R., 1999. Patterns of participation in lifelong learning: do families make a difference?
Gorard, S., Smith, E., May, H., Thomas, L., Adnett, N. and Slack, K., 2006. Review of widening participation research: addressing the barriers to participation in higher education
52

Investigating the Accuracy of Predicted A Level Grades as part of the UCAS Admissions Process
Appendices
Appendix 1 – Comparison of the sample to all A level applicants and the overall UCAS applicant population (UK-domiciled)
The sample of applicants was compared to the population of applicants (UK-domiciled) as well as the population of applicants who held at least one A level.
The following tables show the differences and representative nature between the three groups of applicants: the sample used in this report, all UK-domiciled applicants in 2009, all UK-domiciled applicants who had taken at least one A Level in 2009. The applicant characteristics compared are: ethnicity (Table 1); age (Table 2); gender (Table 3); school type (Table 4); region of domicile (Table 5); and number of choices made in UCAS main scheme (Table 6).
Table 1: Number and percentage of all UK domiciled applicants, sample of applicants, and all applicants who took one or more A Levels, by ethnicity (2009)
Sample Population A level applicants
Frequency % Frequency % Frequency % Asian Bangladeshi 848 0.9% 5,249 1.0% 3,003 1.1%Asian Chinese 1,208 1.2% 4,246 0.8% 2,771 1.0%Asian Indian 5,167 5.3% 18,183 3.3% 11,990 4.4%Asian Other 1,638 1.7% 8,332 1.5% 4,115 1.5%Asian Pakistani 2,438 2.5% 14,575 2.7% 7,331 2.7%Black African 2,471 2.5% 27,543 5.1% 6,797 2.5%Black Caribbean 865 0.9% 9,144 1.7% 2,728 1.0%Black Other 160 0.2% 1,803 0.3% 446 0.2%Mixed Other 862 0.9% 5,128 0.9% 2,530 0.9%Mixed White and Asian 1,256 1.3% 5,278 1.0% 3,176 1.2%Mixed White and Black African 283 0.3% 2,172 0.4% 891 0.3%Mixed White and Black Caribbean 699 0.7% 4,940 0.9% 2,169 0.8%Other 931 1.0% 5,592 1.0% 2,456 0.9%Unknown 724 0.7% 18,530 3.4% 2,071 0.8%White 77,718 79.9% 413,570 76.0% 218,091 80.6%Total 97,268 100.0% 544,285 100.0% 270,565 100.0%
Table 2: Number and percentage of the sample of applicants, all UK domiciled applicants, and all applicants who took one or more A levels, by age (2009)
Sample Population A level applicants
Frequency % Frequency % Frequency %
0 0 383 0.1% 7 0.0%16 and under
244 0.3% 9,012 1.7% 589 0.2%17
18 80,039 82.3% 231,083 42.5% 183,686 67.9%
53

Investigating the Accuracy of Predicted A Level Grades as part of the UCAS Admissions Process
Sample Population A level applicants
15,166 15.6% 110,971 20.4% 71,300 26.4%19
1,391 1.4% 44,363 8.2% 11,352 4.2%20
232 0.2% 26,040 4.8% 1,916 0.7%21
196 0.2% 122,433 22.5% 1,715 0.6%Over 21
97,268 100.0% 544,285 100.0% 270,565 100.0%Total
Table 3: Number and percentage of the sample of applicants, all UK domiciled applicants, and all applicants who took one or more A levels, by gender (2009)
Sample Population A level applicants
Frequency % Frequency % Frequency %
53,776 55.3% 307,486 56.49 149,741 55.34Female
43,492 44.7% 236,799 43.51 120,824 44.66Male
97,268 100.0% 544,285 100.0% 270,565 100Total
Table 4: Number and percentage of the sample of applicants, all UK domiciled applicants, and all applicants who took one or more A levels by school type (2009)
Sample Population A level applicants
Frequency % Frequency % Frequency %
3,060 3.1% 107,015 19.7% 21,121 7.8%Further/Higher education
11,225 11.5% 33,602 6.2% 29,560 10.9%Grammar
16,174 16.6% 43,848 8.1% 34,600 12.8%Independent
28 0.0% 654 0.1% 147 0.1%Other
17,853 18.4% 91,582 16.8% 54,579 20.2%Sixth form
48,928 50.3% 267,545 49.2% 130,558 48.3%State
0 0.0% 39 0.0% 0 0.0%Unknown
97,268 100.0% 544,285 100.0% 270,565 100.0%Total
Table 5: Number and percentage of the sample of applicants, all UK domiciled applicants, and all applicants who took one or more A levels by region of domicile (2009)
Sample Population A Level applicants
Frequency % Frequency % Frequency %
3,259 3.4% 19,891 3.7% 10,140 3.7%North East
8,626 8.9% 51,789 9.5% 26,001 9.6%North West
8,669 8.9% 42,476 7.8% 21,701 8.0%Yorkshire and the Humber
7,991 8.2% 35,088 6.4% 19,677 7.3%East Midlands
Eastern 10,813 11.1% 46,222 8.5% 26,561 9.8%
54

Investigating the Accuracy of Predicted A Level Grades as part of the UCAS Admissions Process
Sample Population A Level applicants
16,409 16.9% 88,721 16.3% 42,088 15.6%Greater London
18,073 18.6% 71,964 13.2% 43,089 15.9%South East
8,318 8.6% 43,710 8.0% 23,646 8.7%South West
4,275 4.4% 24,947 4.6% 13,207 4.9%Wales
281 0.3% 40,053 7.4% 1,019 0.4%Scotland
603 0.6% 17,864 3.3% 12,348 4.6%Northern Ireland
8 0.0% 262 0.0% 105 0.0%Other UK
9,943 10.2% 61,298 11.3% 30,983 11.5%West Midlands
97,268 100.0% 544,285 100.0% 270,565 100.0%Total
Table 6: Number and percentage of the sample of applicants, all UK domiciled applicants, and all applicants who took one or more A levels, by number of choices made in the UCAS main scheme (2009)
Sample Population A level applicants
Frequency % Frequency % Frequency %
0 0.0% 38,449 7.1% 658 0.2%No choices
1,322 1.4% 70,036 12.9% 9,898 3.7%One choice
1,242 1.3% 27,624 5.1% 6,568 2.4%Two choices
2,811 2.9% 37,931 7.0% 13,295 4.9%Three choices
7,975 8.2% 50,487 9.3% 24,045 8.9%Four choices
83,918 86.3% 319,758 58.7% 216,101 79.9%Five choices
97,268 100.0% 544,285 100.0% 270,565 100.0%Total
The tables show that the predicted grade data sample is representative of the A level population but the latter is not necessarily reflective of all UCAS UK-domiciled applicants.
55

Investigating the Accuracy of Predicted A Level Grades as part of the UCAS Admissions Process
Appendix 2 – Predicted to achieved vs. achieved to predicted grades
It was possible to consider predicted grade data in two ways: look at predicted grades and map these against the ultimately achieved grade; or alternatively look at achieved grades and compare back to see whether these achievements had been predicted. Throughout the report, the first (ie predicted to achieved) outlook has been adopted, however, these two different perspectives produce very different results, and so findings from the achieved to predicted analysis have been included here.
Table 1: Accuracy of prediction of achieved grades (2009, UK-domiciled)
Percentage under‐predicted
Percentage accurately predicted
Percentage over‐predicted
Grade achieved in subject
9.04% 90.96% n/a A
8.69% 43.41% 47.91% B
4.32% 32.62% 63.07% C
1.81% 16.27% 81.92% D
n/a 7.59% 92.41% E
Table 1 states that 90.96% of achieved A grades had been accurately predicted, whereas only 7.59% of subjects which were awarded E grades had been predicted E grades.4
Table 2 considers the accuracy of predictions based on grade achievements by gender (for example, of those females who achieved an A grade, 90.93% were predicted an A grade).5
Table 2: Percentage of achieved GCE A level grades by predicted grades, by gender (2009, UK-domiciled)
Achieved grade
A B C D E
Grand total
Total (predicted)
Female 33.53% 28.73% 21.60% 11.68% 4.46% 100% ‐
A 90.93% 48.18% 13.61% 4.05% 2.75% n/a 47.86%
B 8.50% 43.61% 49.64% 26.43% 13.44% n/a 29.79%
C 0.53% 7.72% 32.74% 52.06% 44.96% n/a 17.55%
D 0.04% 0.46% 3.79% 15.75% 31.47% n/a 4.21%
Predicted grade
E 0.00% 0.03% 0.22% 1.71% 7.38% n/a 0.59%
4 This table can be directly compared with “Table 6: Accuracy of predicted GCE A level grades (2009 entry)” located in section 4 of
the main report. 5 This table can be directly compared with Table 8: Accuracy of predictions of GCE A level results by gender (2009 entry) located in
section 5 of the main report.
56

Investigating the Accuracy of Predicted A Level Grades as part of the UCAS Admissions Process
57
Achieved grade
A B C D E
Grand total
Total (predicted)
Total 100% 100% 100% 100% 100% n/a 100%
Male 32.60% 27.38% 21.68% 12.72% 5.62% 100% ‐
A 90.99% 47.56% 14.17% 4.49% 2.48% n/a 46.47%
B 8.28% 43.15% 48.66% 26.46% 13.25% n/a 29.17%
C 0.61% 8.75% 32.47% 50.28% 42.18% n/a 18.40%
D 0.12% 0.50% 4.44% 16.86% 34.29% n/a 5.21%
E 0.00% 0.05% 0.26% 1.92% 7.80% n/a 0.75%
Total 100% 100% 100% 100% 100% n/a 100%
All 33.11% 28.13% 21.64% 12.14% 4.98% 100% ‐
A 90.96% 47.91% 13.86% 4.26% 2.61% n/a 47.24%
B 8.40% 43.41% 49.20% 26.44% 13.34% n/a 29.51%
C 0.56% 8.17% 32.62% 51.22% 43.56% n/a 17.93%
D 0.08% 0.48% 4.08% 16.27% 32.89% n/a 4.66%
E 0.00% 0.04% 0.24% 1.81% 7.59% n/a 0.66%
Total 100% 100% 100% 100% 100% n/a 100%
It can be seen that 90.96% of all achieved A grades had been correctly predicted. Male applicants had slightly higher A grade prediction accuracy of 90.99%, while females saw slightly lower accuracy at 90.93%. For all the rest of the grades, female applicants were slightly more likely to have been predicted the grades they achieved with decreasing percentages of 43.61%, 32.74%, 15.75% and 7.38% for B, C, D and E grades respectively.
These decreasing trends were similar for both male and female applicants. However, male applicants were slightly more likely to have been under-predicted with 8.75% predicted Cs and achieving Bs, compared to 7.72% of female applicants predicted Cs and achieving Bs.
Although this method of analysis showed very high accuracy rates for A grade predictions, the usefulness of the analysis itself is questionable. The alternative approach to analysis of the data (ie starting with predictions, and then looking forward to see whether or not those predictions were correct) was considered to be more reflective of the application process itself, and so was subsequently chosen as the main method of analysis.

© Crown copyright 2011
You may re-use this information (not including logos) free of charge in any format or medium, under the terms of the Open Government Licence. Visit http://www.nationalarchives.gov.uk/doc/open-government-licence/ or write to the Information Policy Team, The National Archives, Kew, London TW9 4DU, or e-mail: [email protected].
This publication is also available on our website at http://www.bis.gov.uk
Any enquiries regarding this publication should be sent to:
Department for Business, Innovation and Skills 1 Victoria Street London SW1H 0ET Tel: 020 7215 5000 If you require this publication in an alternative format, email [email protected], or call 020 7215 5000. URN 11/1043