bird sensitivity mapping for wind energy developments and ... · sensitivity mapping for wind...
TRANSCRIPT
Bird Sensitivity Mapping for Wind Energy
Developments and Associated Infrastructure
in the Republic of Ireland
Guidance Document
February
2015
Mc Guinness, S., Muldoon, C., Tierney, N., Cummins, S., Murray, A., Egan, S., &
Crowe, O.

Bird Sensitivity Mapping to Wind Energy Development - Guidance Document
ii
Recommended citation:
Mc Guinness, S., Muldoon, C., Tierney, N., Cummins, S., Murray, A., Egan, S. & Crowe, O. (2015). Bird
Sensitivity Mapping for Wind Energy Developments and Associated Infrastructure in the
Republic of Ireland. BirdWatch Ireland, Kilcoole, Wicklow.
© The Irish Wildbird Conservancy, trading as BirdWatch Ireland: Unit 20, Block D, Bullford Business
Campus, Kilcoole, Co. Wicklow, Ireland
Bird Sensitivity Mapping to Wind Energy Development - Guidance Document
iii
Acknowledgements
This guidance document underpins the Bird Sensitivity Mapping Tool for Wind Energy Development
which is now available as an online resource. The benefits of developing a bird sensitivity mapping
tool to support strategic planning for wind energy developments was flagged as a key cross-cutting
priority in BirdWatch Ireland’s Group Species Actions Plans. Subsequent efforts by BirdWatch
Ireland, who took the leading role in the development of the tool, and support from stakeholders
and funding agencies, have guaranteed its success.
This project would not have been possible without the financial support provided by various funders.
In alphabetical order, these are; Bórd Gáis, Bórd na Móna, the Department of Environment
Community and Local Government, the Department of the Arts Heritage and the Gaeltacht, Eirgrid,
the Environmental Protection Agency, ESB Networks, the Heritage Council, the Irish Environmental
Network, the NTR Foundation, the Royal Society for the Protection of Birds and the Sustainable
Energy Authority of Ireland.
We gratefully acknowledge the provision of data from BirdWatch Ireland, the National Parks and
Wildlife Service, the British Trust for Ornithology, the Greenland White-fronted Goose Study Group,
the Irish Rare Breeding Birds Panel, the Irish Raptor Study Group and the Irish Grey Partridge
Conservation Trust.
This project has benefitted greatly from in-house expertise and support and we would like to thank
BirdWatch Ireland staff (past and present) for their involvement.
We extend our sincerest gratitude to those external advisors from within the BirdLife Partnership
(RSPB UK, BirdLife Europe) and from other environmental, government and industry organisations.
These advisors have contributed through varying stages of this project, from providing expert
opinion on species characteristics and risk factors, attending workshops on the development of the
mapping methodology and/ or commenting on later stages of the guidance document. The
production of the guidance document for this project is testament to the ability of stakeholders and
individuals within the energy, planning and conservation sectors to engage successfully and work
together on a project which supports the core objectives of each stakeholder.
Finally, we dedicate this project to Caoimhe Muldoon, our colleague and friend, who was
instrumental in the delivery of this project. The impact of her passing is keenly felt by all those who
knew and worked with her.
BirdWatch Ireland, 2015
Bird Sensitivity Mapping to Wind Energy Development - Guidance Document
iv
Executive Summary
Background
Climate change threatens the species and habitats we value in Ireland and the services these
provide. Wind energy, as part of a sustainable energy mix in Ireland, can help to reduce our
greenhouse gas emissions and so reduce our climate impact. However, we also have obligations
under European Law to ensure that the expansion of this relatively new energy (including actual
turbines and associated infrastructure) does not impact on our protected habitats and species. Legal
action has already been taken against Ireland for failing to adequately protect wild birds and the
habitats they rely on, which led to the production of the Group Species Actions Plans by BirdWatch
Ireland in 2011. A key recommendation of these reports was a necessity for better land-use
planning using spatial tools. This recommendation, in line with similar initiatives worldwide, has
resulted in the development and roll out of the Bird Sensitivity Mapping for Wind Energy
Development project.
Methodology
This project aimed to give a measured spatial indication of where protected birds are likely to be
sensitive to wind energy developments. By assessing the characteristics of a selected number of
most-sensitive bird species, a simple mapping tool has been developed as a pre-planning tool for
industry, government and conservation practitioners. This mapping layer and all associated
guidance can be found at the following link:
http://www.birdwatchireland.ie/OurWork/PolicyAdvocacyanoverview/BirdSensitivityMapping/tabi
d/1312/Default.aspx
The potential impact of wind energy developments on protected bird populations is not simply
limited to collision with turbines, as some might assume. Many studies have shown that loss of
habitat, disturbance of birds and obstructing movements (i.e. barrier effects) can have just as great
an impact on bird conservation. However, these latter effects are much harder to measure and so
expert opinion on a number of risk factors was required. For this, an expert group was compiled to
Important:
- This mapping tool does not create no–go areas for energy infrastructure.
- This tool does not include all vulnerable species due to data and other issues.
- The tool does not replace SEA, AA or EIA requirements nor the need to tailor survey and
research to specific sites, projects or plans.
- This tool is for use early in screening, planning or assessment processes only.
- This tool should not inform new or existing nature conservation designations.
- The Bird Sensitivity to Wind Energy project is based on the collation of existing distributional
data. No new distributional data were gathered through this process.

Bird Sensitivity Mapping to Wind Energy Development - Guidance Document
v
give opinion built up over years of experience. For the 22 most sensitive species, expert opinion was
combined with available data on ‘risk’ to give a “species sensitive score” for these species. Then,
using trusted distribution data for each species, a combined picture of bird sensitivity to wind
energy could be developed for mainland Republic of Ireland. This map, at a 1-km2 resolution for
mainland Republic of Ireland, uses a graduated colour scheme based on species sensitivity and
species richness (see above). This has been integrated onto an online map viewer hosted by the
National Biodiversity Data Centre website and will soon also be available on the Heritage Viewer
and MyPlan.ie. This is accompanied by introductory information on individual species’ ecology and
characteristics which increase their sensitivity to wind energy, and a full Guidance Document
outlining the project justification, details on the mapping process and detailed species-level
literature reviews.
Mobilisation
This project has been presented to 90% of Local Authority planning and Heritage departments,
yielding extremely positive feedback on its conception, design and use. The tool and its associated
guidance material are publicly accessible on the BirdWatch Ireland website and are integrated onto
the majority of Local Authority planning maps.
Stakeholder engagement
At every stage of the project’s development there has been a strong emphasis on stakeholder
engagement. A total of 25 participants from the energy sector and government departments and
agencies have contributed to the development of appropriate guidance, format and in targeting
user groups. Additionally, the opinions of 15 scientific experts on species attributes and
vulnerabilities were obtained, while the roll out of the mapping tool and guidance has involved local
authority, NPWS and consultant professionals. From early scoping, case study trials and final map
composition to the mobilisation of the tool with end-users, the support of the energy sector and
these end-users has been an important objective.
Future Work
Possible next steps for this work are numerous and diverse. For example, with the massive potential
for offshore renewable energy in Irish waters and an increasingly integrated European energy grid,
any potential impact on seabirds from offshore and marine renewable energy installations (OMREIs)
requires accurate mapping to ensure better planning. Additionally, as new or more information on
vulnerable bird species becomes available there will be a need to update and improve the mapping
tool and guidance. Further, economic development in Ireland could benefit from more directed
sensitivity maps (e.g. roads). All of these next steps will rely on good data and adequate funding.
Bird Sensitivity Mapping to Wind Energy Development - Guidance Document
vi
Table of Contents
1 Introduction .................................................................................................................................... 1
1.1 Climate change and biodiversity ............................................................................................. 1
1.2 Policy and legislative framework ............................................................................................ 2
1.3 Wind energy and potential effects on birds ........................................................................... 2
1.4 Scope and objective ................................................................................................................ 4
1.5 Study area ............................................................................................................................... 5
2 Sensitivity Mapping Internationally ................................................................................................ 6
2.1 Introduction ............................................................................................................................ 6
2.2 Limitations of sensitivity mapping .......................................................................................... 7
3 Methodology ................................................................................................................................... 9
3.1 Species selection ..................................................................................................................... 9
3.1.1 Introduction .................................................................................................................... 9
3.1.2 Assigning a conservation score for species ..................................................................... 9
3.1.3 First sift of species using internal expertise .................................................................. 10
3.1.4 Second sift of bird species – the final species list ......................................................... 11
3.1.5 Final sift of species - External consultation ................................................................... 11
3.1.6 Zones of sensitivity ........................................................................................................ 12
3.1.7 Lack of data ................................................................................................................... 13
3.2 Mapping methodology .......................................................................................................... 14
3.2.1 Introduction .................................................................................................................. 14
3.2.2 Data collation ................................................................................................................ 14
Detailed mapping process ............................................................................................................. 15
Visualisation .................................................................................................................................. 16
3.2.3 General interpretation .................................................................................................. 17
3.2.4 Map viewer ................................................................................................................... 17
3.3 Stakeholder engagement ...................................................................................................... 19
4 References .................................................................................................................................... 22
Appendix 1 – Species Guidance ............................................................................................................ 25
Appendix 2 – Factors used in the Species Sensitivity Model .............................................................. 115
Appendix 3 – Random Offset of Zones of Sensitivity .......................................................................... 120
Bird Sensitivity Mapping to Wind Energy Development - Guidance Document
1
1 Introduction
1.1 Climate change and biodiversity
Climate change and biodiversity loss are the greatest threats facing the planet. Without immediate
action to reduce greenhouse gas emissions there will be devastating consequences for humans, in
addition to risking the extinction of thousands of species (Thomas et al. 2004). BirdWatch Ireland,
Ireland’s largest environmental NGO, is supportive of developing a low carbon economy and is an
advocate for energy policies that secure sustainable energy sources and achieve better energy
efficiency. Developing renewable energy technologies, such as wind power, is an important part of
the response required to stabilise greenhouse gas emissions. BirdWatch Ireland supports Ireland’s
targets of achieving a 40% contribution from renewable energy to gross electricity consumption by
2020 (DCENR 2012). In order to achieve sustainability, both renewable energy and nature
conservation objectives need to be achieved and not seen in the light of Green vs Green
(Biodiversity vs Climate).
The status of many of Ireland’s protected habitats is poor (NPWS 2013; EPA, 2012) and due to a
variety of factors many birds of conservation concern in Ireland are showing further declines in
range and population (Colhoun & Cummins 2013). According to the EPA, there remains a
“significant challenge for Ireland in striving to meet its obligations under the EU Habitats Directive
and the EU policy objective of halting the loss of biodiversity” (EPA 2012). Furthermore, Ireland also
has a poor record in relation to environmental protection (as highlighted by the European Court of
Justice by ECJ c.418-04 and other cases), particularly for ensuring that ecological impacts and
biodiversity policy obligations are fully addressed across all sectors.
In short, Ireland’s Renewable Energy sector, in line with all sectors of Irish industry and society, must
continue to focus on ecological sustainability. While environmental safeguards are in place under
Irish and EU law that are intended to avoid, minimise or mitigate impacts on biodiversity and on the
capacity of ecosystems to help mitigate and adapt to changing climate, we have a duty to ensure
that sustainability remains at the heart of further national development. Science-based projects,
such as "Bird Sensitivity Mapping" developed with Stakeholder input, will help to support the
objectives of our National Renewable Energy Action Plan (NREAP) and strengthen evidence-based
‘sustainable’ energy ambitions for Ireland.
BirdWatch Ireland is in favour of the development of wind energy, as part of the renewable energy
mix, and as a means of achieving our renewable energy targets without adversely impacting on our
obligations to the Birds and Habitats Directives. Wind energy as a technology, however, is not new
to Ireland, with the first commercial wind farm being established in Co. Mayo in 1992. Wind
developments in Ireland have been subject to the conditions of the Habitats Directive (put in place
that same year) and the resultant legislative framework regulating the appropriate siting of wind
energy infrastructure. As of 2014 (figures provided by Eirgrid and ESB Networks), there are currently
182 wind farms operating throughout Ireland, providing 2190MW of potential generation through a
total of over 1,300 turbines. Statutorily, the National Parks and Wildlife Service are required to
actively participate in the planning and siting of these installations. Consideration of environmental
impacts is thus part of this process, including mitigation of impacts where required and feasible.
Bird Sensitivity Mapping to Wind Energy Development - Guidance Document
2
Additionally, though not required by law, regular monitoring of ecological impacts is often
performed by wind farm operators post-construction, including some bird surveys.
1.2 Policy and legislative framework
Ireland has commitments to protect its avifauna and their habitats through the Birds and Habitats
Directives, 2009/147/EC, EEC 92/43 (1992). This protection afforded wild birds in Ireland goes
beyond the Natura 2000 network (which includes Special protection Areas (SPAs) and Special Areas
of Conservation (SACs)). European Case law has also clarified obligations to protect Annex I
migratory, wetland and other Annex I bird species and to protect habitat requirements of birds
outside of designated sites. The Birds Directive makes special provision for wetlands and wetland
birds while the Habitats Directive makes particular reference to corridors for the movement and
dispersal of species in the wider countryside, including ’stepping stones’ of habitats to support the
Natura 2000 network of SACs and SPAs. A 2007 ruling of the European Court of Justice against
Ireland (ECJ c.418-04) stated that Ireland has failed to ‘...fully transpose and apply the requirements
of the second sentence of Article 4(4)’ of the Birds Directive which states that ‘....Outside these
protection areas (SPAs), Member States shall also strive to avoid pollution or deterioration of
habitats’. Bird Sensitivity Mapping will help to address this need for strategic development of wind
energy in Ireland and the associated infrastructure, assisting Ireland in meeting its renewable energy
targets by 2020. Careful location of renewable energy developments, including wind farms and
associated overhead power lines, is fundamental to minimising effects on nature conservation.
The current Bird Sensitivity Mapping project has consolidated existing spatial data for selected
vulnerable species and used information about the species’ ecological needs and attributes in order
to score their sensitivity to potential developments - in this case to renewable energy infrastructure
for wind. This has not previously been carried out for Irish birds and will contribute significantly to
the decision-making process around environmental sensitivities, under the acknowledgement that
planning wind energy development in a strategic manner is the most effective means of minimising
impacts on wildlife. Importantly, the project does not create ‘no go’ areas but rather flags early in
the decision making process where additional sensitivities may lie in the context of renewable
(wind) energy infrastructure and provides species-specific information of potential risk.
1.3 Wind energy and potential impacts on birds
The relationship between wind energy developments and birds is variable and complex and depends
on a number of factors including: the extent and type of development and associated topography,
the type of habitat and individual bird species present, and their distribution and abundance in the
area (Barrios & Rodríguez 2004; Drewitt & Langston 2006). Most threats can be minimized or
reduced by avoiding sites with sensitive habitats and key populations of vulnerable and endangered
species and increasing our understanding of the effects of wind energy on birds (Langston 2013). The
main impacts of wind energy developments on birds are generally via four main categories; collision
(Barrios & Rodríguez 2004; Drewitt & Langston 2006; Douglas et al. 2011; Pearce-Higgins et al.
2009), disturbance displacement (Madders & Whitfield 2006; Pearce-Higgins et al. 2009), habitat
loss or damage and barrier effects. Each of these potential effects may interact (Drewitt & Langston
2006), causing an increase in the impact or a decrease in potential exposure (e.g. a reduction in
abundance caused by habitat loss may reduce collision risk).
Bird Sensitivity Mapping to Wind Energy Development - Guidance Document
3
Madders & Whitfield (2006) observed that it is the sensitivity of individuals to wind farm-induced
disturbance that determines the primary impact of a wind farm on an individual bird: if disturbance
occurs, the bird may be affected by displacement, habitat loss or barrier effects. While disturbance
displacement, habitat loss and barrier effects are considered nonlethal impacts on birds, these
effects are likely to work at a population level as opposed to an individual level. Birds may be
displaced from a wind farm into areas of less suitable foraging or breeding areas, which may
negatively affect survival and reproductive output (Langston & Pullan, 2003; Madders & Whitfield,
2006). This effectively functions as habitat loss, as a bird is excluded from formerly suitable habitat
and is also likely to result in barrier effects, which increase energetic demands on birds. The level of
impact on birds as a result of habitat loss depends on the type of habitat itself and the availability of
suitable habitat to accommodate displaced birds (Langston & Pullan 2003). Additionally, birds can be
disturbed and displaced from wind energy infrastructure throughout the lifespan of wind energy
infrastructure due to human activity and machine noise during construction, the operation of
turbine rotors and maintenance and repair work (Langston 2013; Langston & Pullan 2003).
In an investigation of the avoidance of wind farms by birds, 7 out of 12 studied species occurred at
lower abundances around turbines compared to control areas (Pearce-Higgins et al. 2009). Buzzard
Buteo buteo, Hen Harrier (Circus cyaneus), Golden Plover (Pluvialis apricaria), Snipe (Gallinago
gallinago), Curlew (Numenius arquata) and Wheatear (Oenanthe oenanthe) were most affected,
showing decreases in breeding densities of 15-53%. For a review of the several studies which have
investigated potential displacement effects on raptors at wind farms, see Madders & Whitfield
(2006). While there is some indication that wind turbines may form barriers to bird movements, this
issue has received little attention (Hötker et al. 2006). It is expected that energetic requirements will
be increased if birds avoid wind farms, either on migration or while performing regular local flights,
by flying around wind energy infrastructure. Wind farm size and the ability of a bird to compensate
for the increased energy expenditure will determine its level of impact (Langston & Pullan 2003).
Collision risk can be reduced by siting wind energy developments away from flight corridors between
roosting and foraging areas and from migratory bottlenecks (Dirksen et al. 1998; Hötker et al. 2006).
High profile cases of wind farms which were poorly sited without proper consideration for ecological
sustainability are indicative of the benefits of pre-planning scoping. The Tarifa Wind Farm in Spain,
for example, is responsible for significant levels of collision mortality for migrating raptors, to such
an extent that population level effects have been reported for some species (Barrios & Rodríguez,
2004). Similarly, assessments of the Altamont Pass wind farm in California found significant collision
mortality of Golden Eagles (Aquila chrysaetos) and other raptors (Smallwood & Thelander 2008).
Occurrence of White-tailed Eagle (Haliaeetus albicilla) and Willow Ptarmigan (Lagopus lagopus)
collisions at the Smola Wind farm in Norway was investigated by Bevanger et al. (2010). This study
reported 39 dead or injured White-tailed Eagles between August 2005 and December 2010, noting
that certain turbines were responsible for a disproportionate level of mortality. The majority of
White-tailed Eagle collisions at the Smola Wind Farm occurred in the spring, mainly involved adult
birds (as opposed to sub-adults or juveniles). Of the 84 dead Willow Ptarmigan found between
August 2005 and December 2010 at the Smola Wind Farm, all mortalities were attributed to
collisions. The majority of these birds were killed between March and June, suggesting that collision
risk may be higher during the breeding season. The authors note a high scavenger bias for Willow
Bird Sensitivity Mapping to Wind Energy Development - Guidance Document
4
Ptarmigan, which suggests that the total number of mortalities is likely higher than that observed.
An alternative study investigating the level of wind farm avoidance by birds (Pearce-Higgins et al.
2009) found no evidence that raptors altered flight height around turbines. There is, however, a lack
of conclusive data on collision risk, with many studies based on carcass recovery and no corrections
applied for those that are overlooked or removed by scavengers (Langston & Pullan 2003). However,
the use of “detection dogs” to search for victims of collision has significantly increased recovery rate
compared to human searches alone (Bevanger et al. 2010; Paula et al. 2011).
Assessments of avian mortality by the United States Forestry Service found wind turbine collision to
contribute 0.003% of the total, significantly behind mortality as result of cats, vehicles, buildings and
pesticides (Erickson et al. 2005). However, this did not account for collision with associated
infrastructure (including power lines) or larger, less-clear population level effects. In general, it has
been noted by several prominent international bird protection organisations that most impacts by
wind energy developments on bird populations can be mitigated through sensitive site selection. By
describing areas of potential impact on at-risk species, this project will more effectively advise siting
decisions.
1.4 Scope and objective
Caveat:
1. This mapping tool and associated guidance document acts as an overview reference tool only and
should not be used as a definitive guide to the presence or absence of a species in an area.
2. This tool should not be used as a replacement to an official avian survey for any planning related
assessments, such as an Environmental Impact Assessment (EIA), Strategic Environmental
Assessment (SEA) or Appropriate Assessment (AA).
3. This mapping tool functions at a broad level, giving an indication of the potential importance of a
region for vulnerable birds. It is also intended to aid scoping for future site-specific surveys by
functioning as a screening tool, helping a developer to plan any required surveys well in advance.
4. The current tool is only specific to wind energy developments and birds.
5. No new data on species distributions have been collected for this tool, but rather existing data
have been collation on species ranges and are drawn from diverse sources, representing the best
available information at the time.
The aim of this project has been to produce a consolidated Bird Sensitivity Map for Ireland to aid
strategic planning and to support the roll out of land-based renewable wind energy infrastructure
and help address environmental objectives. Indeed, these strategic planning tools are
recommended in European Commission guidance published in 2010 (European Commission [EC]
2010). Similar initiatives have been carried out across Europe and globally, with a view to informing
strategic planning as well as the decision-making and assessment processes. The current mapping
tool has been tailored to the suite of species of relevance in Ireland, where the available
information for these species is verified and satisfactory to use.

Bird Sensitivity Mapping to Wind Energy Development - Guidance Document
5
There are many factors which render a species vulnerable to development and, although some may
be generic (such as those due to construction and ongoing disturbance) others are specific to wind
energy developments. For some species, a high proportion of their population will occur within
designated sites and therefore they are afforded some level of protection. Other species are,
however, more widely dispersed, meaning designated sites alone are not sufficient to protect all
species of conservation concern (ECJ c.418-04). The use of sensitivity mapping can not only flag
potentially sensitive areas but also enables those involved in the planning process to identify key
species for consideration early in a wind energy development. Developing and deploying renewable
energy technologies is fundamental to mitigating climate change, though strategically planning
renewable energy developments ‒ using tools such as that presented here ‒ is the most effective
means of minimising their impacts on wildlife. Caveats of this work are to be noted.
1.5 Study area
This study area covers the terrestrial area of the Republic of Ireland, including offshore islands where
data is available.
Bird Sensitivity Mapping to Wind Energy Development - Guidance Document
6
2 Sensitivity Mapping Internationally
2.1 Introduction
The first study to combine the concept of spatial analysis and a wind energy developments
sensitivity index for birds was Garthe & Hüppop (2004) in the North Sea. This index was based on
nine factors: flight manoeuvrability; flight altitude; percentage of time flying; nocturnal flight
activity; sensitivity towards disturbance by ship and helicopter traffic; flexibility in habitat use;
biogeographical population size; adult survival rate; and European threat and conservation status.
This resulted in a map identifying areas of ‘concern’ or ‘major concern’. Following this, the first
terrestrial sensitivity map was produced in Scotland (Bright et al. 2006) and was based on both the
SPA network and the distributions 16 species of conservation concern (Annex I or judged to be
particularly sensitive to wind farms). A sensitivity map for England followed the same format but
with 12 species of conservation concern (Bright et al. 2009). Importantly, the English map also relies
on written guidance to accompany the map. Both UK maps apply buffers of sensitivity to
distributional bird data and give areas of high, medium and low/unknown sensitivity.
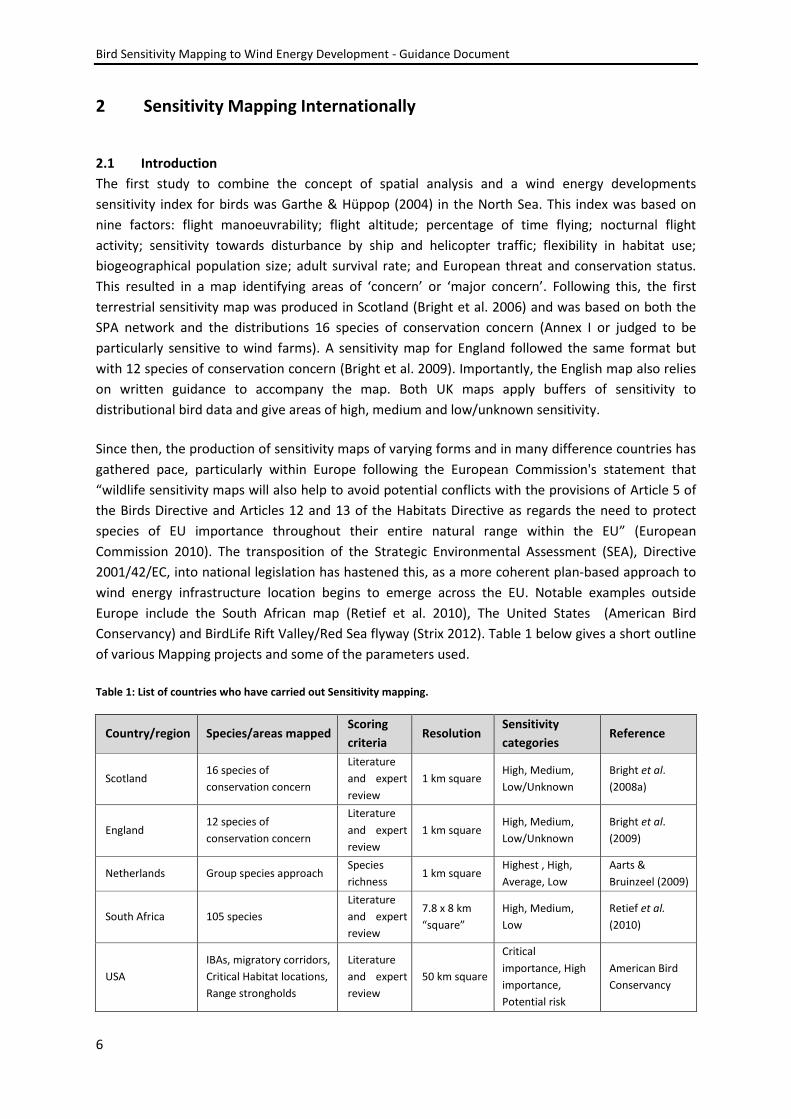
Since then, the production of sensitivity maps of varying forms and in many difference countries has
gathered pace, particularly within Europe following the European Commission's statement that
“wildlife sensitivity maps will also help to avoid potential conflicts with the provisions of Article 5 of
the Birds Directive and Articles 12 and 13 of the Habitats Directive as regards the need to protect
species of EU importance throughout their entire natural range within the EU” (European
Commission 2010). The transposition of the Strategic Environmental Assessment (SEA), Directive
2001/42/EC, into national legislation has hastened this, as a more coherent plan-based approach to
wind energy infrastructure location begins to emerge across the EU. Notable examples outside
Europe include the South African map (Retief et al. 2010), The United States (American Bird
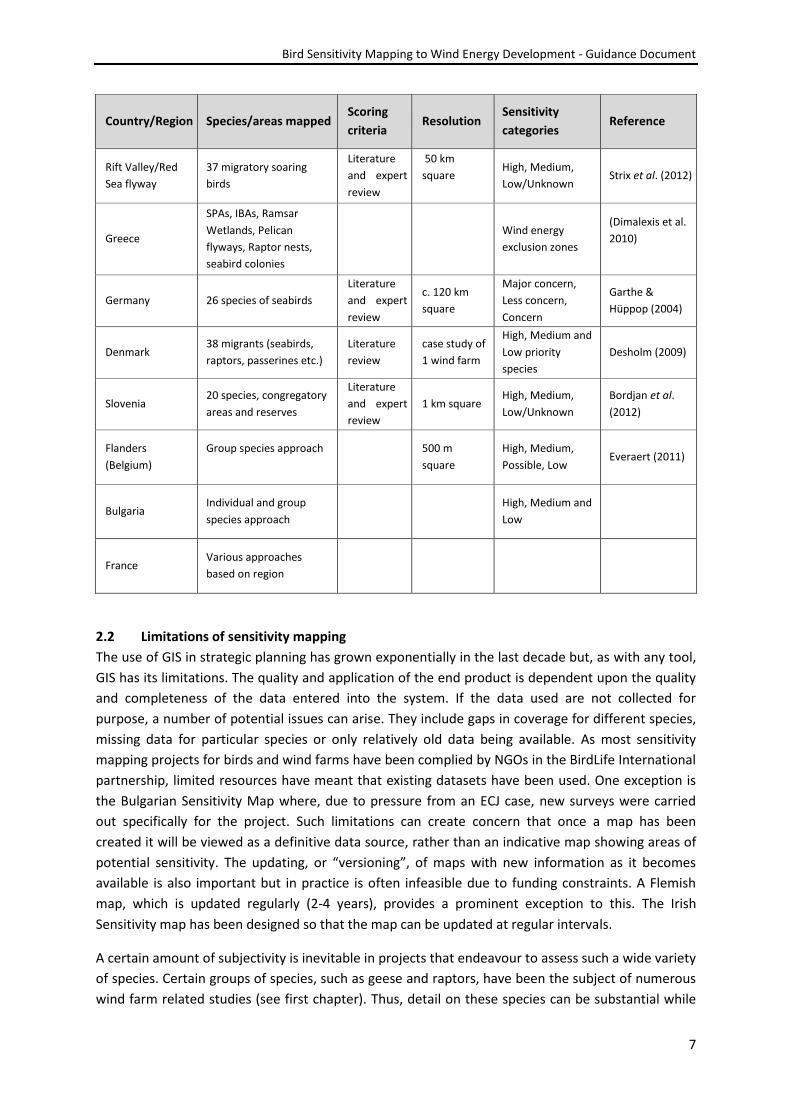
Conservancy) and BirdLife Rift Valley/Red Sea flyway (Strix 2012). Table 1 below gives a short outline
of various Mapping projects and some of the parameters used.
Table 1: List of countries who have carried out Sensitivity mapping.
Country/region Species/areas mapped Scoring
criteria Resolution
Sensitivity
categories Reference
Scotland 16 species of
conservation concern
Literature
and expert
review
1 km square High, Medium,
Low/Unknown
Bright et al.
(2008a)
England 12 species of
conservation concern
Literature
and expert
review
1 km square High, Medium,
Low/Unknown
Bright et al.
(2009)
Netherlands Group species approach Species
richness 1 km square
Highest , High,
Average, Low
Aarts &
Bruinzeel (2009)
South Africa 105 species
Literature
and expert
review
7.8 x 8 km
“square”
High, Medium,
Low
Retief et al.
(2010)
USA
IBAs, migratory corridors,
Critical Habitat locations,
Range strongholds
Literature
and expert
review
50 km square
Critical
importance, High
importance,
Potential risk
American Bird
Conservancy
Bird Sensitivity Mapping to Wind Energy Development - Guidance Document
7
Country/Region Species/areas mapped Scoring
criteria Resolution
Sensitivity
categories Reference
Rift Valley/Red
Sea flyway
37 migratory soaring
birds
Literature
and expert
review
50 km
square
High, Medium,
Low/Unknown Strix et al. (2012)
Greece
SPAs, IBAs, Ramsar
Wetlands, Pelican
flyways, Raptor nests,
seabird colonies
Wind energy
exclusion zones
(Dimalexis et al.
2010)
Germany 26 species of seabirds
Literature
and expert
review
c. 120 km
square
Major concern,
Less concern,
Concern
Garthe &
Hüppop (2004)
Denmark 38 migrants (seabirds,
raptors, passerines etc.)
Literature
review
case study of
1 wind farm
High, Medium and
Low priority
species
Desholm (2009)
Slovenia 20 species, congregatory
areas and reserves
Literature
and expert
review
1 km square High, Medium,
Low/Unknown
Bordjan et al.
(2012)
Flanders
(Belgium)
Group species approach
500 m
square
High, Medium,
Possible, Low Everaert (2011)
Bulgaria Individual and group
species approach
High, Medium and
Low
France Various approaches
based on region
2.2 Limitations of sensitivity mapping
The use of GIS in strategic planning has grown exponentially in the last decade but, as with any tool,
GIS has its limitations. The quality and application of the end product is dependent upon the quality
and completeness of the data entered into the system. If the data used are not collected for
purpose, a number of potential issues can arise. They include gaps in coverage for different species,
missing data for particular species or only relatively old data being available. As most sensitivity
mapping projects for birds and wind farms have been complied by NGOs in the BirdLife International
partnership, limited resources have meant that existing datasets have been used. One exception is
the Bulgarian Sensitivity Map where, due to pressure from an ECJ case, new surveys were carried
out specifically for the project. Such limitations can create concern that once a map has been
created it will be viewed as a definitive data source, rather than an indicative map showing areas of
potential sensitivity. The updating, or “versioning”, of maps with new information as it becomes
available is also important but in practice is often infeasible due to funding constraints. A Flemish
map, which is updated regularly (2-4 years), provides a prominent exception to this. The Irish
Sensitivity map has been designed so that the map can be updated at regular intervals.
A certain amount of subjectivity is inevitable in projects that endeavour to assess such a wide variety
of species. Certain groups of species, such as geese and raptors, have been the subject of numerous
wind farm related studies (see first chapter). Thus, detail on these species can be substantial while
Bird Sensitivity Mapping to Wind Energy Development - Guidance Document
8
information on other potentially vulnerable species may be lacking. Also, the information available
under particular headings or vulnerabilities varies across species. Projects now try to account for this
in more robust ways, using wide scale consultation (e.g. Garthe & Hüppop 2004) or presenting
extensive raw data (e.g. Rift Valley/Red Sea flyway example). In addition to the bulk collection of
data, novel means of monitoring are increasingly utilised. These include radar tracking of bird
migratory routes and flight heights (Desholm 2006; Hüppop et al. 2006), night vision and thermal
imaging (Everaert & Stienen 2007; Krijgsveld et al. 2009) and GPS tagging and tracking of flock
location and movements (Nygård et al. 2010). The cost of such measures, however, regularly limits
their adoption.
There can be concerns over sensitivity mapping exercises from both sides; industry may be
concerned that such projects will designate ‘no-go’ areas which cannot be contested. While this is
very rarely the case, it should be carefully highlighted that the map is intended for guidance
purposes only. Conversely, members of the conservation community may be concerned that rating
an area as ‘low / unknown’ sensitivity may present a ‘green light’ to development, even though the
mapping tool is not a comprehensive assessment of species presence and the discontinuity or age of
some data means that maps produced cannot be used at this site-specific level. Again this latter
point should be highlighted wherever the map is hosted.
In addition to considering the above limitations, the current study has addressed several
shortcomings of previous sensitivity mapping projects in the follow key areas. First, this project has
included a strong element of stakeholder and expert engagement, both internal expertise from
within BirdWatch Ireland and external engagement. Second, this project has utilised a greater
number of potentially-threatened species than most other assessments internationally, owing to the
wide availability of good quality data. Finally, by the process of randomly offsetting breeding
locations of highly sensitive raptor species, their inclusion on this project was facilitated. This
renders the sensitivity map more representative of actual bird species assemblages without
compromising conservation efforts.
Bird Sensitivity Mapping to Wind Energy Development - Guidance Document
9
3 Methodology
3.1 Species selection
3.1.1 Introduction
The Species Sensitivity Model used in this project was initially designed and trialled as part of a
Sustainable Energy Authority of Ireland (SEAI)-funded project carried out in 2012 (Tierney et al.
2012) and required that the following three components be assessed for each species before their
scores were input into the model (see Appendix 2).
Conservation status
Vulnerability to collision
Habitat preference
Through the model, these factors allow the determination of a Species Sensitivity Score (SSS) and
the subsequent ranking of species according to this. A more detailed account of this process, and
how this was modified and applied to the current study, is outlined below.
3.1.2 Assigning a conservation score for species
A list of 199 birds occurring in Ireland was compiled from the Birds of Conservation Concern in
Ireland (BoCCI) list (Lynas et al. 2007; Colhoun & Cummins 2013). Following this, a Conservation
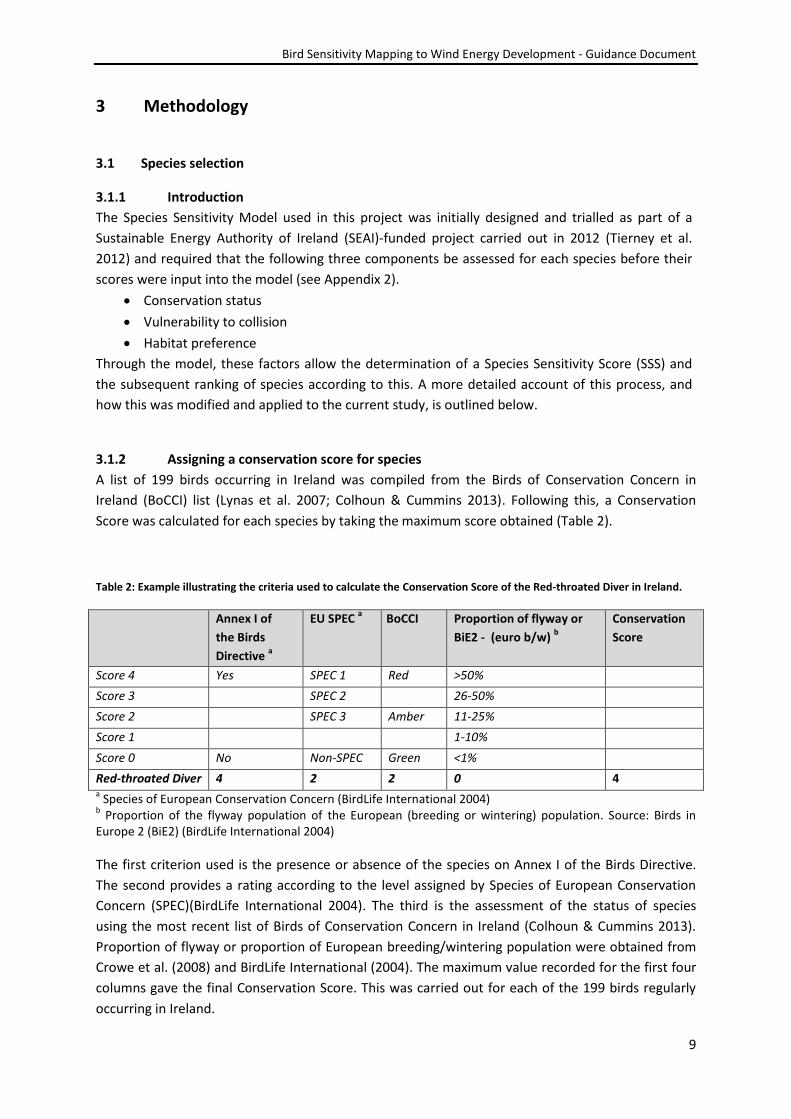
Score was calculated for each species by taking the maximum score obtained (Table 2).
Table 2: Example illustrating the criteria used to calculate the Conservation Score of the Red-throated Diver in Ireland.
Annex I of
the Birds
Directive a
EU SPEC a BoCCI Proportion of flyway or
BiE2 - (euro b/w) b
Conservation
Score
Score 4 Yes SPEC 1 Red >50%
Score 3 SPEC 2 26-50%
Score 2 SPEC 3 Amber 11-25%
Score 1 1-10%
Score 0 No Non-SPEC Green <1%
Red-throated Diver 4 2 2 0 4 a Species of European Conservation Concern (BirdLife International 2004)
b Proportion of the flyway population of the European (breeding or wintering) population. Source: Birds in
Europe 2 (BiE2) (BirdLife International 2004)
The first criterion used is the presence or absence of the species on Annex I of the Birds Directive.
The second provides a rating according to the level assigned by Species of European Conservation
Concern (SPEC)(BirdLife International 2004). The third is the assessment of the status of species
using the most recent list of Birds of Conservation Concern in Ireland (Colhoun & Cummins 2013).
Proportion of flyway or proportion of European breeding/wintering population were obtained from
Crowe et al. (2008) and BirdLife International (2004). The maximum value recorded for the first four
columns gave the final Conservation Score. This was carried out for each of the 199 birds regularly
occurring in Ireland.
Bird Sensitivity Mapping to Wind Energy Development - Guidance Document
10
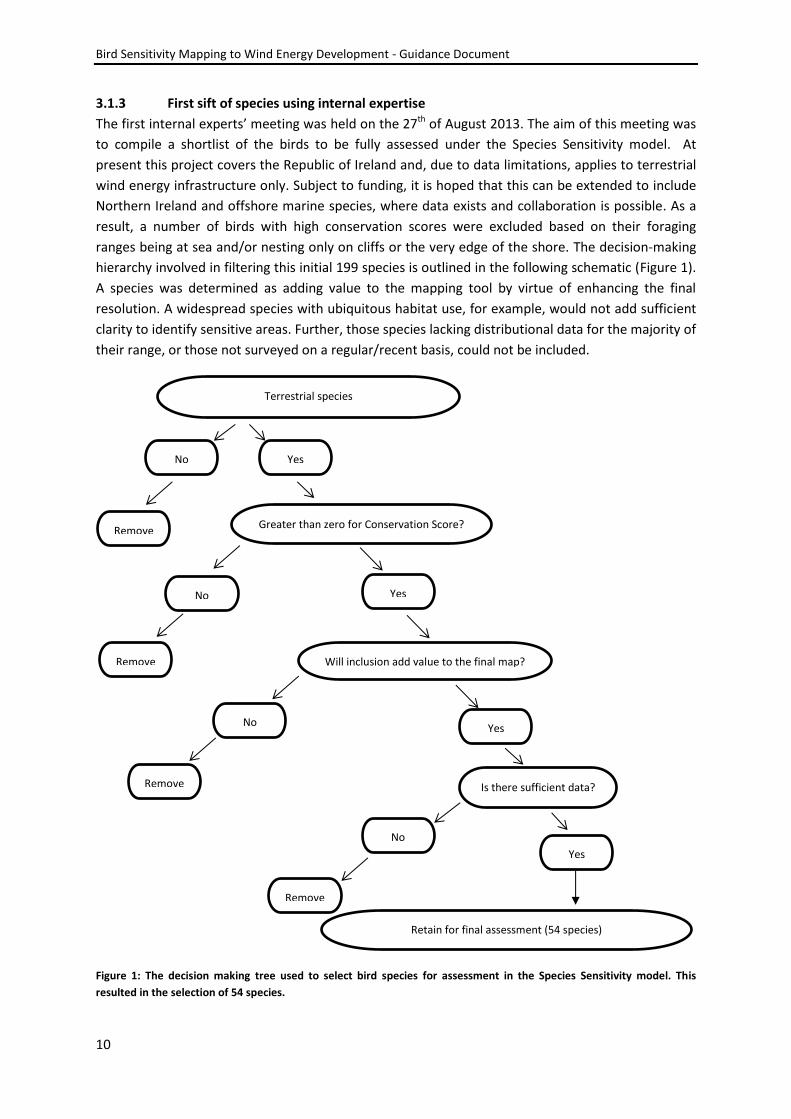
3.1.3 First sift of species using internal expertise
The first internal experts’ meeting was held on the 27th of August 2013. The aim of this meeting was
to compile a shortlist of the birds to be fully assessed under the Species Sensitivity model. At
present this project covers the Republic of Ireland and, due to data limitations, applies to terrestrial
wind energy infrastructure only. Subject to funding, it is hoped that this can be extended to include
Northern Ireland and offshore marine species, where data exists and collaboration is possible. As a
result, a number of birds with high conservation scores were excluded based on their foraging
ranges being at sea and/or nesting only on cliffs or the very edge of the shore. The decision-making
hierarchy involved in filtering this initial 199 species is outlined in the following schematic (Figure 1).
A species was determined as adding value to the mapping tool by virtue of enhancing the final
resolution. A widespread species with ubiquitous habitat use, for example, would not add sufficient
clarity to identify sensitive areas. Further, those species lacking distributional data for the majority of
their range, or those not surveyed on a regular/recent basis, could not be included.
Figure 1: The decision making tree used to select bird species for assessment in the Species Sensitivity model. This
resulted in the selection of 54 species.
Is there sufficient data?
Will inclusion add value to the final map?
Remove
Retain for final assessment (54 species)
No Yes
Yes
Yes No
Remove
No
Remove
Terrestrial species
Greater than zero for Conservation Score?
Yes
Remove
No
Bird Sensitivity Mapping to Wind Energy Development - Guidance Document
11
3.1.4 Second sift of bird species – the final species list
A final Species Sensitivity Score (SSS) was determined by putting each of the 54 species through the
Species Sensitivity Model. A total of 13 factors considered to make a species vulnerable to wind
energy infrastructure were chosen to be included in the Species Sensitivity Model. The vulnerability
factors are divided into two groups according to whether they broadly related to flight behaviour or
habitat requirements. These factors included the risk of birds colliding with turbines; being displaced
by wind energy infrastructure; being affected by wind energy infrastructure forming barriers to
movement or migration; or being affected by habitat loss as a result of wind energy developments
(Appendix 2). Each factor was scored on a 5-point scale from 0 to 4, with higher scores increasing the
eventual vulnerability score. These were initially assessed by the relevant BirdWatch Ireland species
expert and then reviewed by all BirdWatch Ireland conservation staff.
Subsequently, external species-level scientific expertise was then sought in order to fine-tune the
more subjective factors in the Species Sensitivity Score, validate the species chosen and to gather
additional information.
3.1.5 Final sift of species - External consultation
The initial preliminary list of species was obtained by consulting the Internal Species Expert Group1
and published evidence. While published data is available for a number of factors, others had to be
scored more subjectively as a result of the paucity of a proven published evidence-base. For those
factors, we sought external expertise (see Table 3).
Table 3: Flight behaviour or habitat requirement factors – those in Italics were sent for external consultation.
Flight risk factors Habitat risk factors
Adult survival rate Range in Ireland
Flight manoeuvrability Site fidelity
Soaring/flying at turbine height Availability of preferred habitat
Predatory/Aerial forager Habitat preference
Ranging behaviour Sensitivity to disturbance/displacement
Flocking
Aerial display
The rationale behind this external consultation phase was to facilitate a wider input from a variety
of experts into the scoring process and also to receive information on studies in the grey literature
or those as yet unpublished. A similar exercise was employed in relation to North Sea wind energy
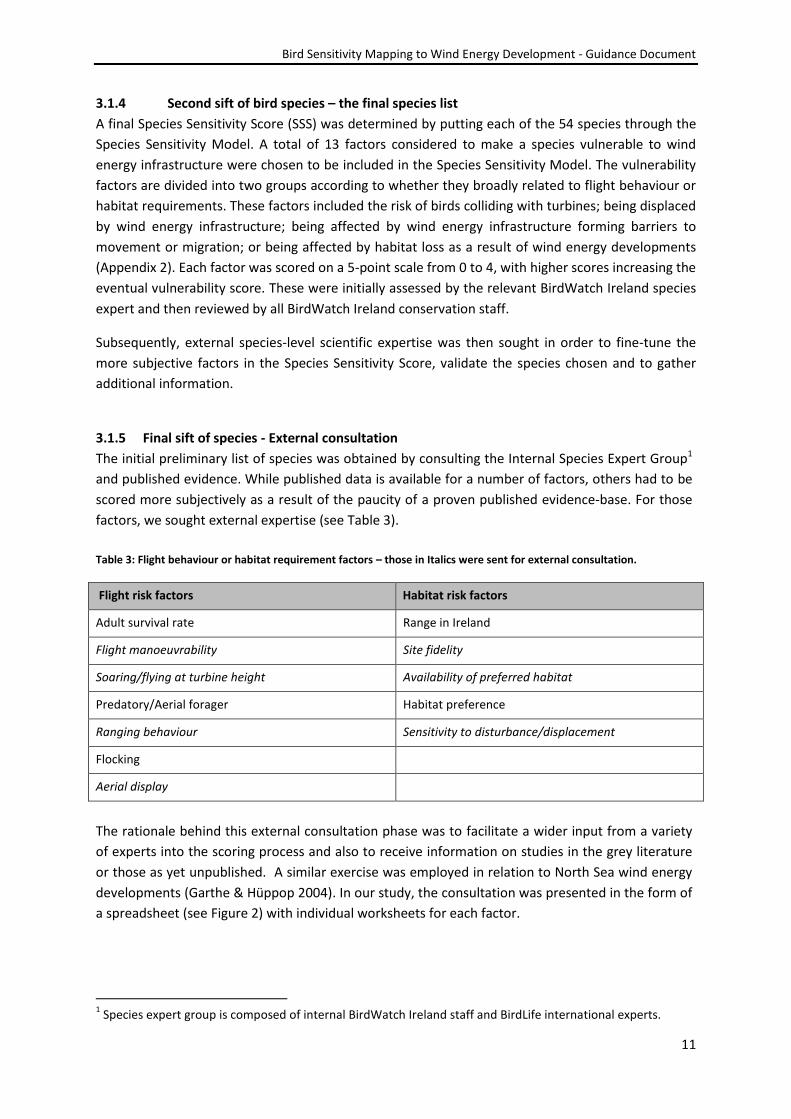
developments (Garthe & Hüppop 2004). In our study, the consultation was presented in the form of
a spreadsheet (see Figure 2) with individual worksheets for each factor.
1 Species expert group is composed of internal BirdWatch Ireland staff and BirdLife international experts.
Bird Sensitivity Mapping to Wind Energy Development - Guidance Document
12
Figure 2: Spreadsheet for external consultation in relation to risk factors.
For each of the seven less objective habitat and flight factors identified, those consulted were asked
to consider if they agreed with the current ranking of each species or if they wished to use the drop
down menu to reassign the species to another category they considered to be more appropriate.
Attempting to compare species from so many different functional groups using a numerical score
would have been impractical. Instead, utilising high to low groupings allowed those consulted to
visually appraise the list and, from this, judge whether in their professional opinion a species should
be reassigned to a higher or lower group.
The results from this consultation were then reviewed and re-assessed by the internal experts and
the final Species Sensitivity Score was calculated using the following formula.
Species Sensitivity Score (SSS) = Conservation Score x (Average of Flight Vulnerability Scores +
Average of Habitat Vulnerability Scores)
3.1.6 Zones of sensitivity
Another component of the external consultation has been aiding the decision making process on the
size of zones of sensitivity to be applied to species records. The criteria for estimating a zone of
sensitivity is based on a review of the behavioural, ecological and distributional data available for
each species. Factors considered included (where available) collision risk, disturbance and core
activity. When sufficient revised distributional data becomes available (particularly in relation to
Ireland) to allow pragmatic revisions, the map should be updated. For each species, a proposed zone
of sensitivity was proposed by BirdWatch Ireland’s Internal Species Sensitivity Group based on the
best available data known to the group. As with the factors for the Species Sensitivity Model (see
Section 3.1.4) those consulted could agree with the proposed zone of sensitivity or alternatively
Bird Sensitivity Mapping to Wind Energy Development - Guidance Document
13
propose an increase or decrease, along with any supporting grey or published literature. Individual
zones of sensitivity for each species are shown in Table 4.
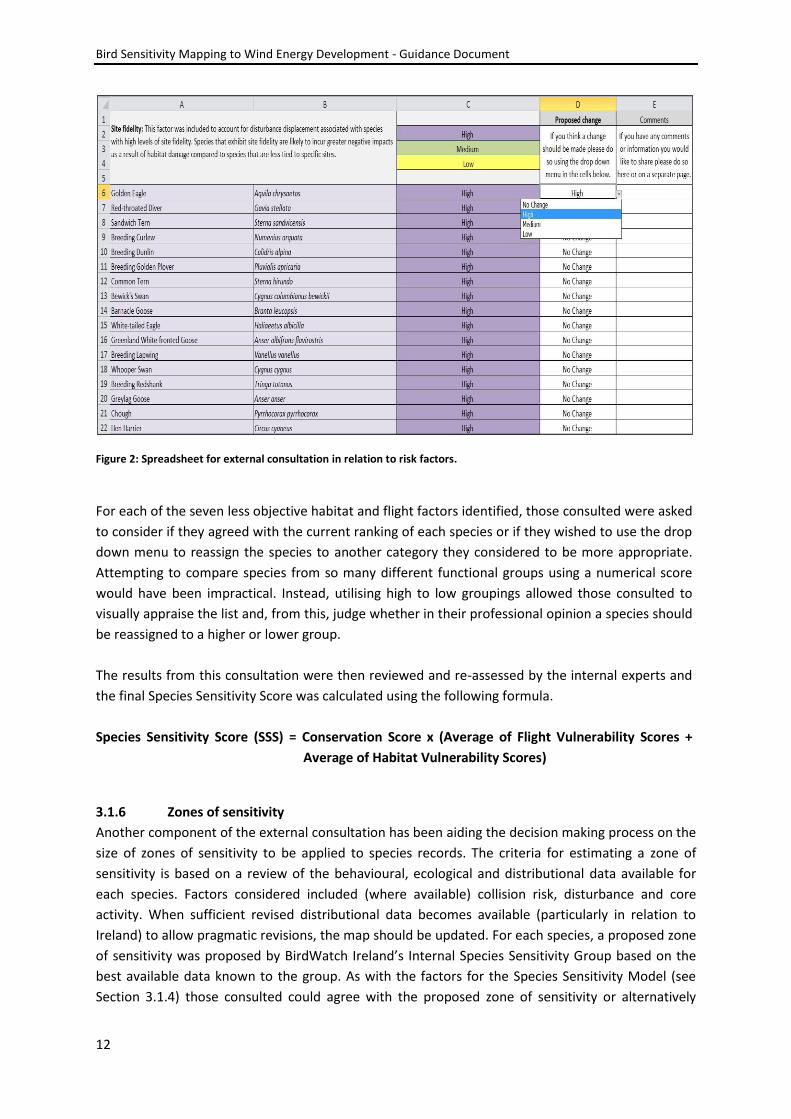
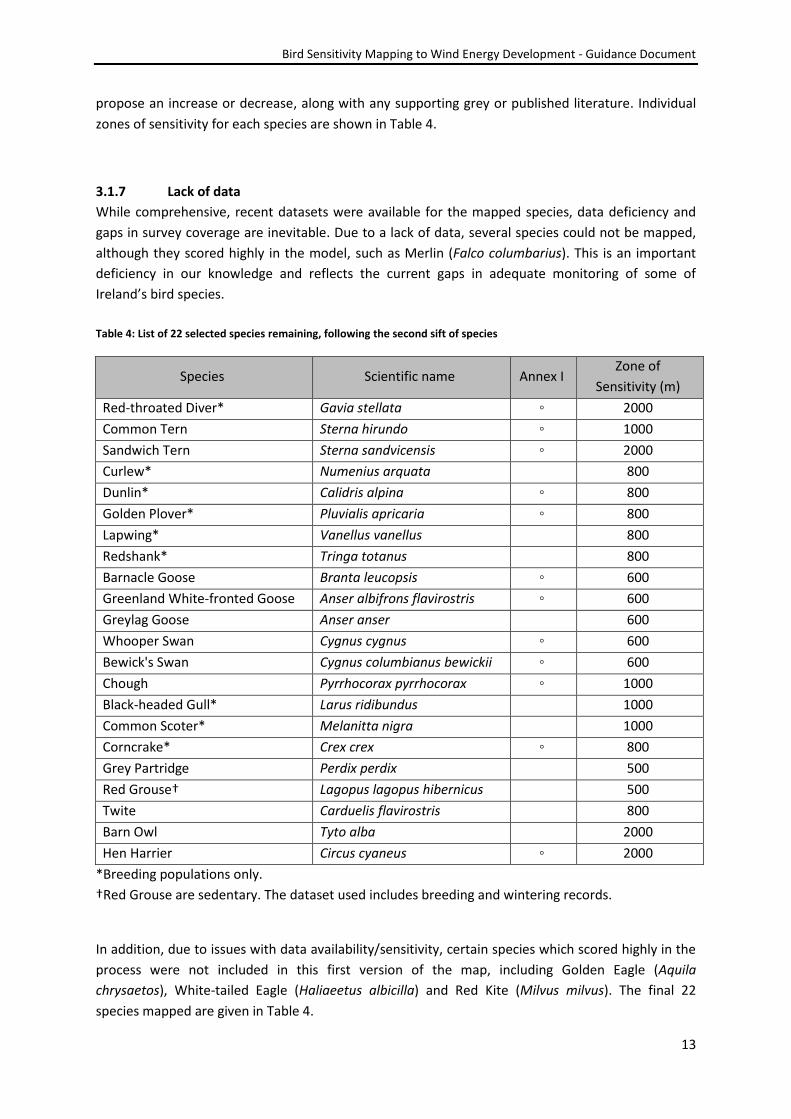
3.1.7 Lack of data
While comprehensive, recent datasets were available for the mapped species, data deficiency and
gaps in survey coverage are inevitable. Due to a lack of data, several species could not be mapped,
although they scored highly in the model, such as Merlin (Falco columbarius). This is an important
deficiency in our knowledge and reflects the current gaps in adequate monitoring of some of
Ireland’s bird species.
Table 4: List of 22 selected species remaining, following the second sift of species
Species Scientific name Annex I Zone of
Sensitivity (m)
Red-throated Diver* Gavia stellata ◦ 2000
Common Tern Sterna hirundo ◦ 1000
Sandwich Tern Sterna sandvicensis ◦ 2000
Curlew* Numenius arquata 800
Dunlin* Calidris alpina ◦ 800
Golden Plover* Pluvialis apricaria ◦ 800
Lapwing* Vanellus vanellus 800
Redshank* Tringa totanus 800
Barnacle Goose Branta leucopsis ◦ 600
Greenland White-fronted Goose Anser albifrons flavirostris ◦ 600
Greylag Goose Anser anser 600
Whooper Swan Cygnus cygnus ◦ 600
Bewick's Swan Cygnus columbianus bewickii ◦ 600
Chough Pyrrhocorax pyrrhocorax ◦ 1000
Black-headed Gull* Larus ridibundus 1000
Common Scoter* Melanitta nigra 1000
Corncrake* Crex crex ◦ 800
Grey Partridge Perdix perdix 500
Red Grouse† Lagopus lagopus hibernicus 500
Twite Carduelis flavirostris 800
Barn Owl Tyto alba 2000
Hen Harrier Circus cyaneus ◦ 2000
*Breeding populations only.
†Red Grouse are sedentary. The dataset used includes breeding and wintering records.
In addition, due to issues with data availability/sensitivity, certain species which scored highly in the
process were not included in this first version of the map, including Golden Eagle (Aquila
chrysaetos), White-tailed Eagle (Haliaeetus albicilla) and Red Kite (Milvus milvus). The final 22
species mapped are given in Table 4.
Bird Sensitivity Mapping to Wind Energy Development - Guidance Document
14
3.2 Mapping methodology
3.2.1 Introduction
To reiterate, this mapping tool should not be used as a definitive guide to the presence or absence
of a species within a particular 1-km square or in place of avian surveys as part of planning-related
assessments, such as an Environmental Impact Assessment (EIA), Strategic Environmental
Assessment (SEA) or Appropriate Assessment (AA). Rather, this mapping tool functions at a broader
level, giving an indication of likely importance of a site for vulnerable birds. As a screening tool, it is
aimed at assisting developers of wind energy installations in the advanced planning of required
statutory surveys (e.g. summer surveys, winter surveys, knowing in advance if sensitive species are
in an area, etc.). Importantly, the current tool is specific to wind energy developments and the
potential risks posed to birds, through visually representing the locations of selected bird species
and their respective sensitivity to wind energy developments. Subsequent to the each species’
assessment under a variety of headings by internal and external experts (outlined in previous
sections), a final Sensitivity Score was assigned to each. The following section details the method of
spatially expressing this sensitivity to wind energy development.
3.2.2 Data collation
Distributional data for these species were obtained from the most recent, complete and verified
sources, where available and where usage rights were granted. Given the sensitivity of some species
(in particular the breeding locations of raptors vulnerable to human persecution), some data were
not made available. Data that could be obtained were filtered to only include those locations
pertaining to mainland Republic of Ireland (RoI). Depending on the nature of data obtained, this
related to point locations of nesting sites/ territorial birds, locations of recurrent feeding grounds or
nesting colonies, or inclusion of entire I-WeBS (Irish Wetland Bird Survey) sub-sites regularly
supporting the birds in question. The wider Special Protection Areas (SPAs) are not included in the
current Irish map. The current map is solely based on distributional data of the selected species
which are considered to have particular vulnerability to wind energy development. If required for
comparison purposes, shape files delineating SPA boundaries can be downloaded from the National
Parks and Wildlife website (www.NPWS.ie). Following aggregation of each species’ sensitivity score
for each 1-km2 of the country, a map was created of mainland Ireland, using varying colour to depict
levels of potential sensitivity to wind energy development. A more detailed description of this
process can be found in Boxes 1 and 2, below.
Bird Sensitivity Mapping to Wind Energy Development - Guidance Document
15
Box 1:
Detailed mapping process
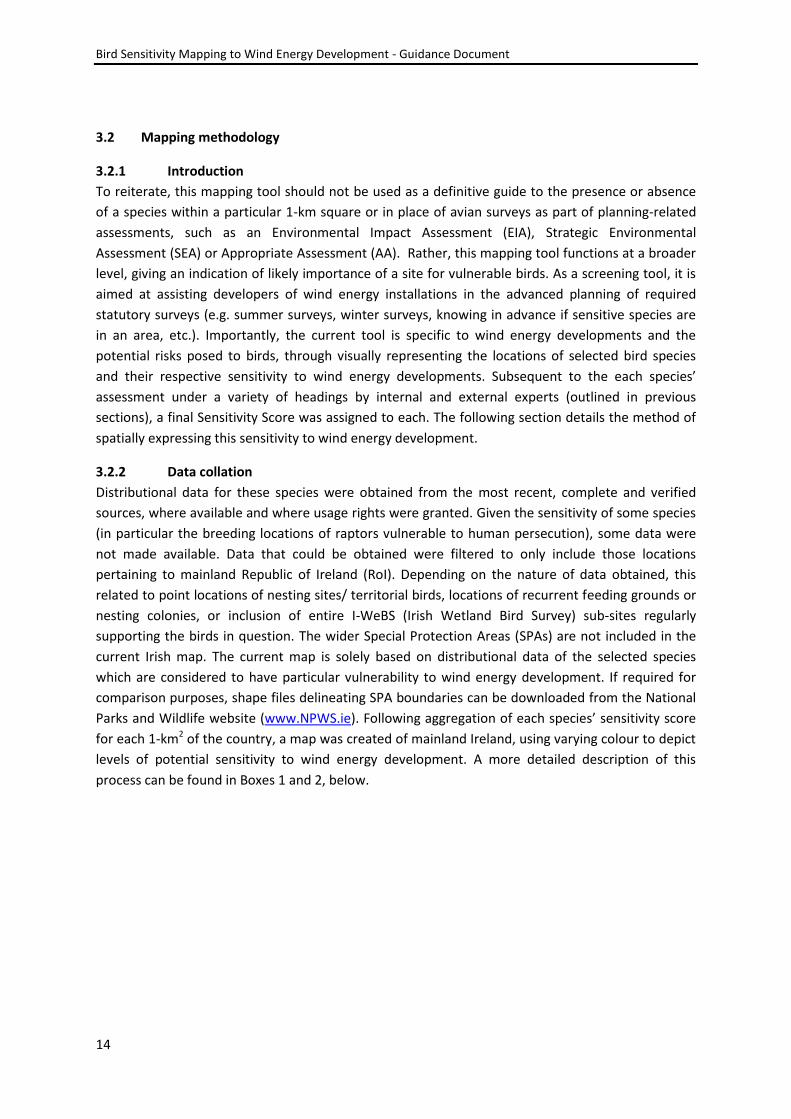
The spatial layer underpinning the mapping tool of this project was created using ArcMap® 10.0 (Esri Inc., Redlands, California). Once data were collated, each database of locational information was visualised in the mapping software, transforming co-ordinate systems were necessary into Irish National Grid. These spatial representations of a species’ distribution were then verified and cleaned of obvious outliers through consultation with species experts. Following this, a zone of sensitivity to wind energy development was applied around each species’ distribution using the buffer tool of ArcMap. The precise breeding locations of species sensitive to human persecution (Hen Harrier and Barn Owl) were obscured using a system of randomly offset extended zones of sensitivity (See Appendix 4 for detailed procedure).
Subsequently, polygons from a national 1-km2 grid which overlapped with species distributional layers with applied zones of sensitivity were selected for each species and exported as shapefiles. This operation standardised each species’ distribution to a 1-km2 grid for mainland RoI. For each of these species, an additional field of information was added containing the Species Sensitivity Index for that species (providing a weighting based on individual species potential vulnerability). Importantly, this procedure allowed all species distributions (and individual Species Sensitivity Indices) to be aggregated across each of the 73,369 1-km2 of mainland RoI, giving a composite layer displaying the species sensitive to wind energy developments within that 1-km2. Also, aggregating the Species Sensitivity Indices for those occurring in each square gave a combined Species Sensitivity Score for each 1-km2.
Figure 3: Application of zones of sensitivity to wind energy development for two of the 22 species. Black dots represent Curlew (Numenius arquatus) breeding locations, surrounded by red zones of sensitivity. Purple areas represent I-WeBS sub-sites containing Greenland White-fronted Goose (Anser albifrons flavirostris), surrounded by lilac zones of sensitivity. Each 1-km
2 containing these species is then highlighted in yellow.
Bird Sensitivity Mapping to Wind Energy Development - Guidance Document
16
Box 2:
Visualisation
Representation of data within maps is a powerful and potentially misleading process. As such, the meaning and efficacy of our data visualisation was carefully considered. In terms of colouration, shades thought to represent positivity or negativity (e.g. “traffic light” colours) were avoided. In addition, accessibility issues such as colour-blindness and print-friendly colours were considered in the final shade decision, seen in the finalised map (Figure 8) of this report. To allow improved use of this map as a scoping tool, four simple labels were chosen to represent the more complex value-based distribution divisions; “Low”, “Medium”, “High” and “Highest”. Additionally, three-stage systems (e.g. low, medium, high) were avoided as this was thought to imply a traffic light system, which also underrepresents the complexity of our data. Care was also taken to avoid suggesting that those areas without adequate data contained no sensitive birds.
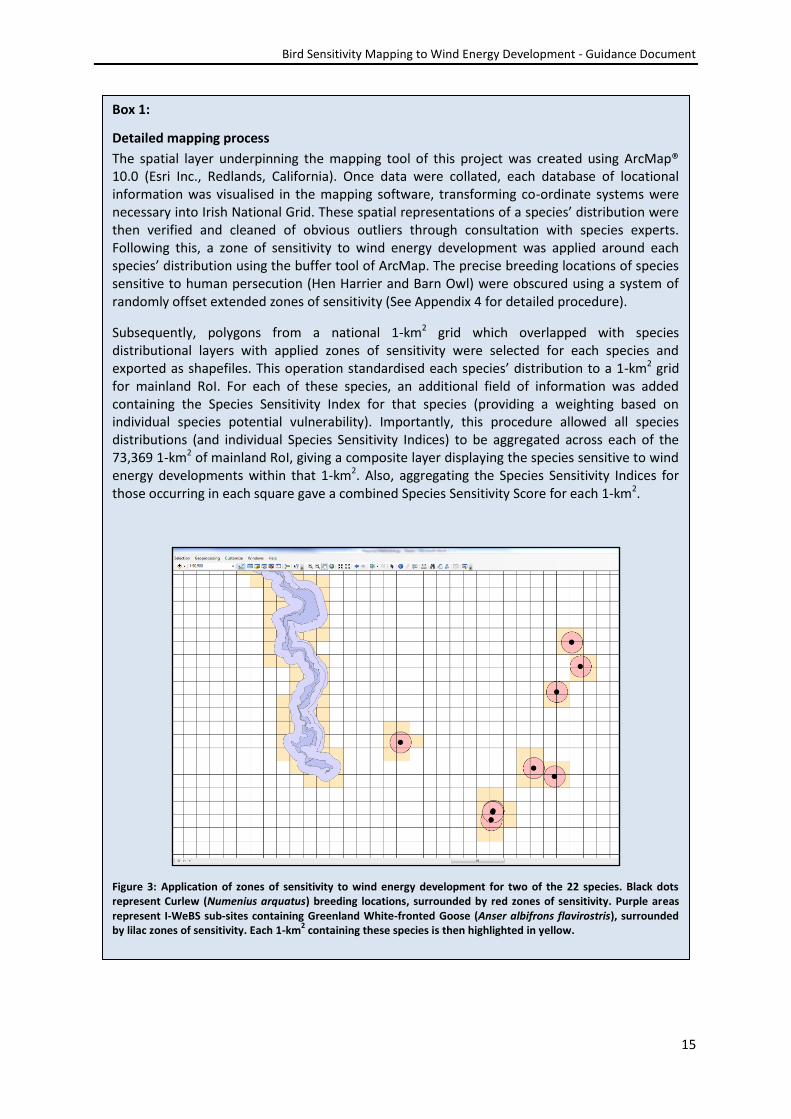
Figure 4: Distribution of data across 73,369 1-km2 polygons on mainland Republic of Ireland, shown as grey
columns. Variations of the sampled distribution for visualisation are shown as; a) standard deviations, b) equal divisions and c) natural breaks greater than 14.8.
Division of these data’s value distribution was also carefully considered (see Figure 4 above). Using standard deviations from the mean of this distribution returned an extremely high representation of the “Highest” category of sensitivity, thus devaluing the overall usefulness of the tool through exaggeration of threat. Conversely, using equal divisions of this distribution resulted in underrepresentation of the highest category. Thus, a compromise of natural breaks (jenks) was used, subsequent to the exclusion of zero values (i.e. taking only values greater than the minimum possible value of 14.8).
Bird Sensitivity Mapping to Wind Energy Development - Guidance Document
17
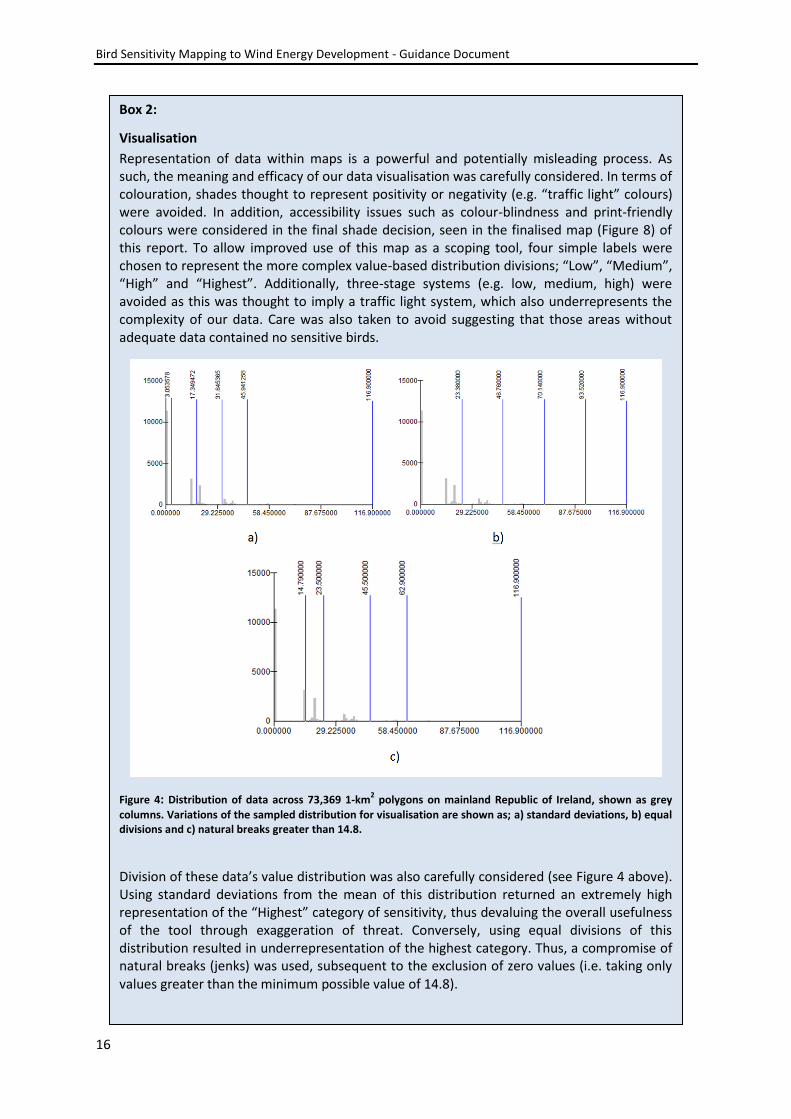
3.2.3 General interpretation
This map and associated spatial layer presents a depiction of avian sensitivity to wind energy
infrastructure at 1-km2 resolution. The colour within each 1 km square, as represented in a simple
four stage system (Figure 5), is intended as a guide to the potential sensitivity of at-risk bird
populations (breeding, wintering or resident) to wind energy development in this area. This is based
on an aggregate scoring for each square, dependent upon the species likely to be present and their
respective sensitivities to wind energy development based on several key factors discussed in
Section 3.1 of this report. It must be noted, however that species presence in a given square is not
definitive, but rather indicates that a record has been taken of its presence in the near vicinity and
that this 1 km square falls within a predefined zone of sensitivity. Additionally, a species’ complete
absence from unrecorded polygons cannot be assumed. Rather, this indicates that certified records
originating from validated sources were not available at the time of map creation. It is intended
(subject to funding), to update this map at regular intervals, providing up to date information
incorporating any new survey data on bird distributions as they become available. Furthermore, as
new literature is published on how birds are affected by wind energy developments, each species’
vulnerability scores may be adjusted accordingly. Similarly, a change in the conservation status of a
species would result in a corresponding change in the species’ vulnerability score. Fundamentally,
this map does not identify no-go areas of development, but quantifies the potential effect of wind
energy development on avian populations.
Figure 5: Classification of Sensitivity Score distribution across mainland Republic of Ireland
3.2.4 Map viewer
To complement the information provided by the nationwide map and its underlying spatial data, a
user-friendly map viewer has been produced. Though not allowing for the more complicated data
overlay found in proprietary mapping software (ArcGIS, MapInfo, etc.), this tool allows rapid viewing
of the Species Sensitivity layer without the expense and expertise often associated with these
packages. In addition, as this is hosted by the National Biodiversity Data Centre (NBDC), it is possible
to overlay this layer with distributions of other taxa and topographical features.
Bird Sensitivity Mapping to Wind Energy Development - Guidance Document
18
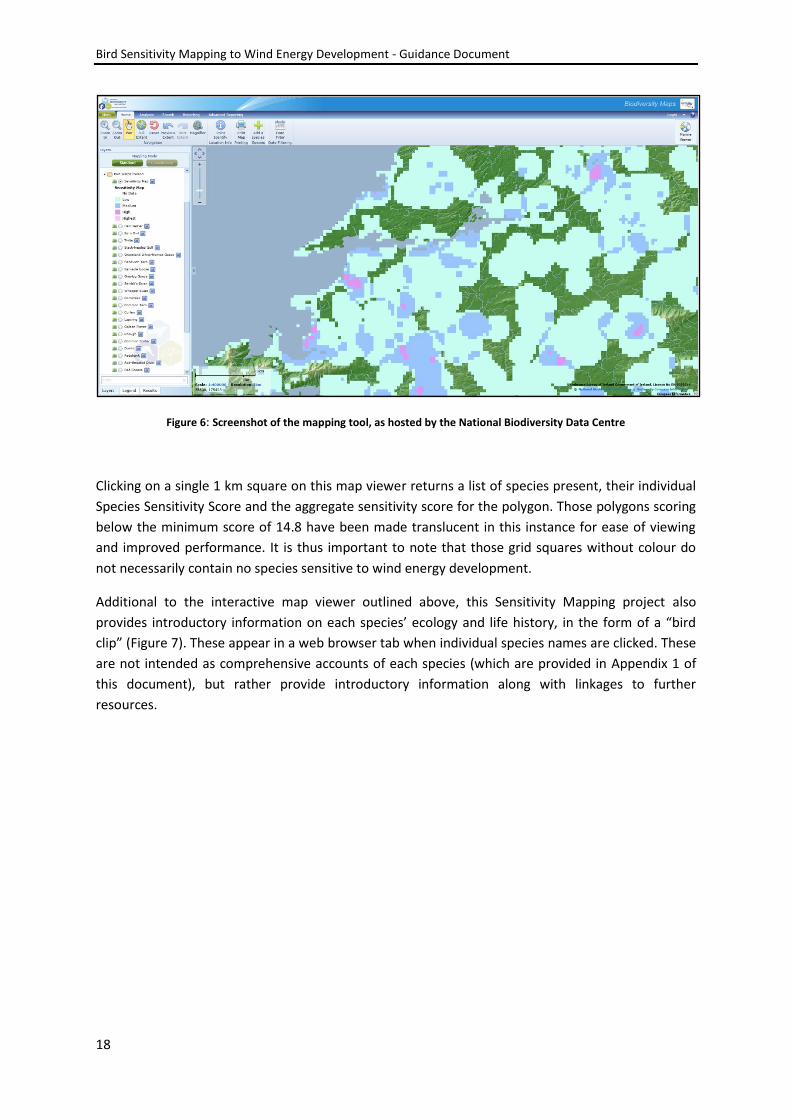
Figure 6: Screenshot of the mapping tool, as hosted by the National Biodiversity Data Centre
Clicking on a single 1 km square on this map viewer returns a list of species present, their individual
Species Sensitivity Score and the aggregate sensitivity score for the polygon. Those polygons scoring
below the minimum score of 14.8 have been made translucent in this instance for ease of viewing
and improved performance. It is thus important to note that those grid squares without colour do
not necessarily contain no species sensitive to wind energy development.
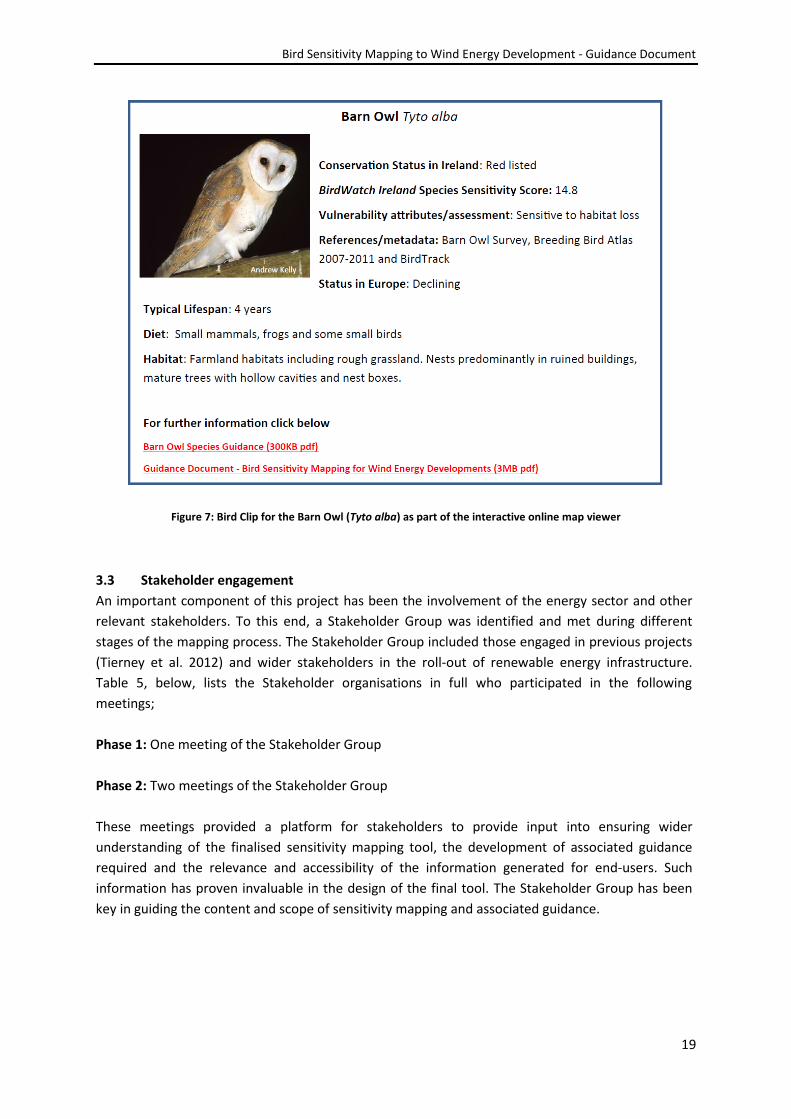
Additional to the interactive map viewer outlined above, this Sensitivity Mapping project also
provides introductory information on each species’ ecology and life history, in the form of a “bird
clip” (Figure 7). These appear in a web browser tab when individual species names are clicked. These
are not intended as comprehensive accounts of each species (which are provided in Appendix 1 of
this document), but rather provide introductory information along with linkages to further
resources.
Bird Sensitivity Mapping to Wind Energy Development - Guidance Document
19
Figure 7: Bird Clip for the Barn Owl (Tyto alba) as part of the interactive online map viewer
3.3 Stakeholder engagement
An important component of this project has been the involvement of the energy sector and other
relevant stakeholders. To this end, a Stakeholder Group was identified and met during different
stages of the mapping process. The Stakeholder Group included those engaged in previous projects
(Tierney et al. 2012) and wider stakeholders in the roll-out of renewable energy infrastructure.
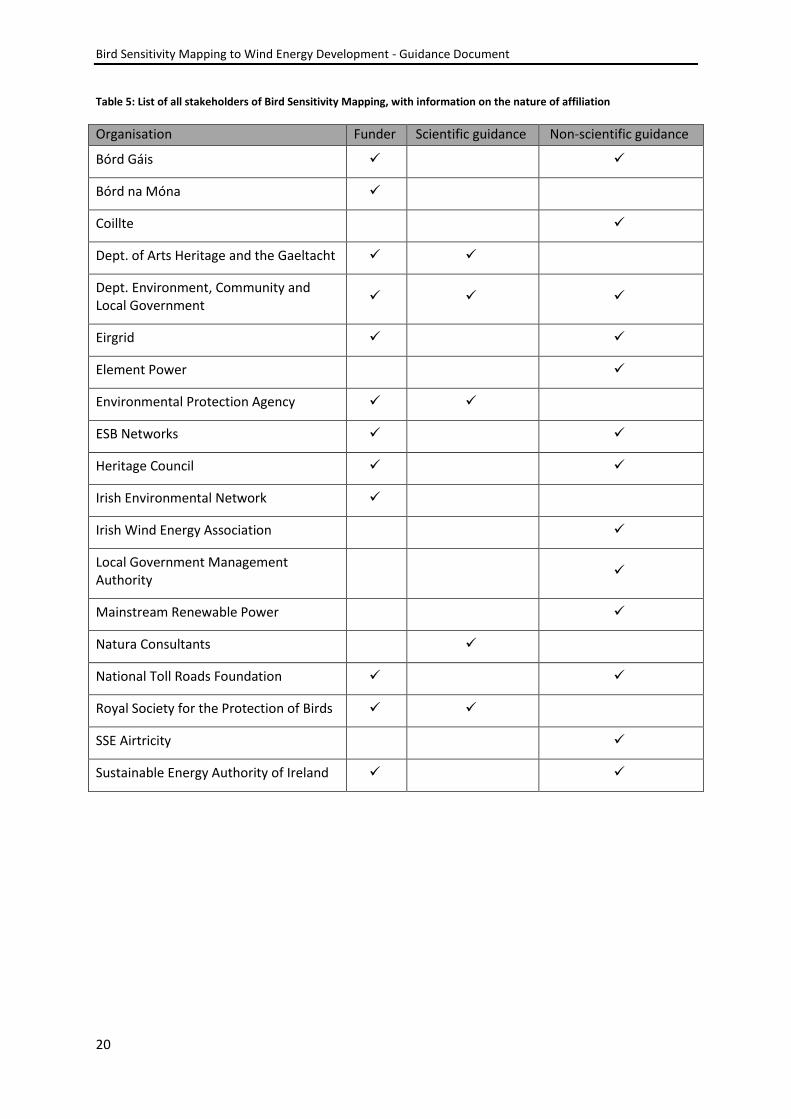
Table 5, below, lists the Stakeholder organisations in full who participated in the following
meetings;
Phase 1: One meeting of the Stakeholder Group
Phase 2: Two meetings of the Stakeholder Group
These meetings provided a platform for stakeholders to provide input into ensuring wider
understanding of the finalised sensitivity mapping tool, the development of associated guidance
required and the relevance and accessibility of the information generated for end-users. Such
information has proven invaluable in the design of the final tool. The Stakeholder Group has been
key in guiding the content and scope of sensitivity mapping and associated guidance.
Bird Sensitivity Mapping to Wind Energy Development - Guidance Document
20
Table 5: List of all stakeholders of Bird Sensitivity Mapping, with information on the nature of affiliation
Organisation Funder Scientific guidance Non-scientific guidance
Bórd Gáis
Bórd na Móna
Coillte
Dept. of Arts Heritage and the Gaeltacht
Dept. Environment, Community and Local Government
Eirgrid
Element Power
Environmental Protection Agency
ESB Networks
Heritage Council
Irish Environmental Network
Irish Wind Energy Association
Local Government Management Authority
Mainstream Renewable Power
Natura Consultants
National Toll Roads Foundation
Royal Society for the Protection of Birds
SSE Airtricity
Sustainable Energy Authority of Ireland
Bird Sensitivity Mapping to Wind Energy Development - Guidance Document
21
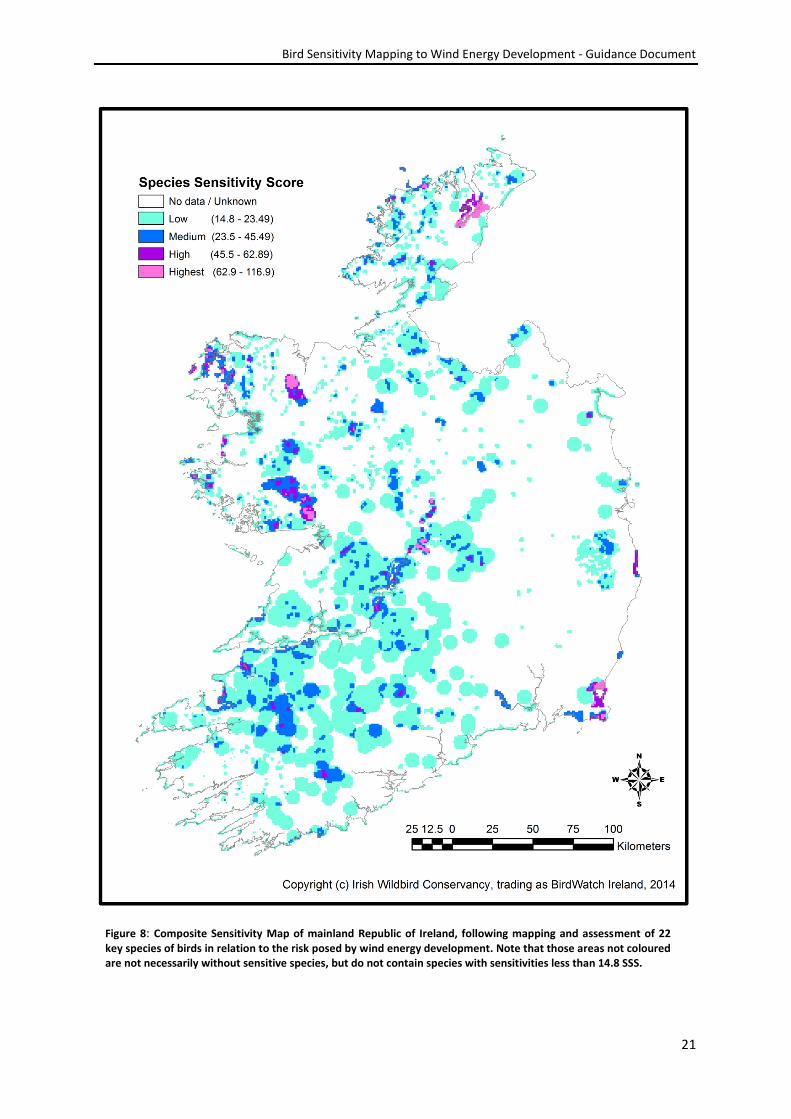
Figure 8: Composite Sensitivity Map of mainland Republic of Ireland, following mapping and assessment of 22 key species of birds in relation to the risk posed by wind energy development. Note that those areas not coloured are not necessarily without sensitive species, but do not contain species with sensitivities less than 14.8 SSS.
Bird Sensitivity Mapping to Wind Energy Development - Guidance Document
22
4 References
American Bird Conservancy, 2012. American Bird Conservancy Wind Development Bird Risk Map. http://www.abcbirds.org/newsandreports/releases/120503.html
Barrios, L. & Rodríguez, A., 2004. Behavioural and environmental correlates of soaring-bird mortality at on-shore wind turbines. Journal of Applied Ecology, 41(1), pp.72–81.
Bevanger, K. et al., 2010. Pre- and post-construction studies of conflicts between birds and wind turbines in coastal Norway (BirdWind). Report on findings 2007-2010. - NINA Report 620. Norwegian Institute for Nature Research, Trondheim, Norway.
BirdLife International, 2004. Birds in the European Union: a status assessment. Wageningen, The Netherlands.
Bright, J.A. et al., 2006. Bird Sensitivity Map to provide locational guidance for onshore wind farms in Scotland. RSPB Research Report No 20, Royal Society for the Protection Birds, Bedfordshire, UK.
Bright, J.A. et al., 2009. Mapped and written guidance in relation to birds and onshore wind energy development in England. RSPB Research Report No 35, Royal Society for the Protection Birds, Bedfordshire, UK.
Colhoun, K. & Cummins, S., 2013. Birds of Conservation Concern in Ireland 2014 – 2019. Irish Birds, 9(4), pp.523–544.
Crowe, O. et al., 2008. Estimates and trends of waterbird numbers wintering in Ireland , 1994 / 95 to 2003 / 04. Bird Study, 55, pp. 66-77.
DCENR, 2012. Strategy for Renewable Energy: 2012 - 2020. Department of Communications, Energy and Natural Resources, Dublin, Ireland.
Desholm, M., 2006. Wind farm related mortality among avian migrants - a remote sensing study and model analysis. PhD Thesis, National Environmental Research Institute, Denmark.
Dimalexis, A. et al., 2010. Identification and mapping of sensitive bird areas to wind farm development in Greece. Hellenic Ornithological Society, Athens, Greece.
Dirksen, S., Spaans, A. & Van Der Winden, J., 1998. Studies on Nocturnal Flight Paths and Altitudes of Waterbirds in Relation to Wind Turbines: A review of current research in the Netherlands. Proceedings of The National Avian - Wind Power Planning Meeting III, San Diego, California
Douglas, D.J.T., Bellamy, P.E. & Pearce‐Higgins, J.W., 2011. Changes in the abundance and distribution of upland breeding birds at an operational wind farm. Bird Study, 58(1), pp.37–43.
Drewitt, A.L. & Langston, R.H.W., 2006. Assessing the impacts of wind farms on birds. IBIS, 148, pp.29–42.
Environmental Protection Agency, 2012. Ireland’s Environment: An Assessment. Environmental Protection Agency, Wexford, Ireland.
Bird Sensitivity Mapping to Wind Energy Development - Guidance Document
23
Erickson, W.P., Johnson, G.D. & Jr, D.P.Y., 2005. A Summary and Comparison of Bird Mortality from Anthropogenic Causes with an Emphasis on Collisions 1 Fatality Rates. USDA Forest Service Gen. Tech. Rep., PSW-GTR-19, pp.1029–1042.
European Commission, 2010. Wind energy developments and Natura 2000: EU guidance on wind energy development in accordance with the EU nature legislation. Publication Office of the European Union, Luxembourg.
Everaert, J. & Stienen, E.W.M., 2007. Impact of wind turbines on birds in Zeebrugge (Belgium). Biodiversity and Conservation, 16(12), pp.3345–3359.
Garthe, S. & Hüppop, O., 2004. Scaling possible adverse effects of marine wind farms on seabirds: developing and applying a vulnerability index. Journal of Applied Ecology, 41(4), pp.724–734.
Hötker, H., Thomsen, K.-M. & Jeromin, H., 2006. Impacts on biodiversity of exploitation of renewable energy sources: the example of birds and bats - facts, gaps in knowledge, demands for further research, and ornithological guidelines for the development of renewable energy exploitation. Bergenhusen, Germany.
Hüppop, O. et al., 2006. Bird migration studies and potential collision risk with offshore wind turbines. Ibis, 148, pp.90–109.
Krijgsveld, K.L. et al., 2009. Collision Risk of Birds with Modern Large Wind Turbines. Ardea, 97(3), pp.357–366.
Langston, R.H.W., 2013. Birds and wind projects across the pond: A UK perspective. Wildlife Society Bulletin, 37(1), pp.5–18.
Langston, R.H.W. & Pullan, J., 2003. Windfarms and Birds : An analysis of the effects of windfarms on birds , and guidance on environmental assessment criteria and site selection issues, RSPB/BirdLife.
Lynas, P., Newton, S. & Robinson, J., 2007. The status of birds in Ireland: an analysis of conservation concern 2008-2013. Irish Birds, 8, pp.149 –166.
National Parks and Wildlife Service, 2013. The Status of EU Protected Habitats and Species in Ireland: Conservation Status in Ireland of Habitats and Species listed in the European Council Directive on the Conservation of Habitats, Flora and Fauna 92/43/EEC. National Parks and Wildlife Service, Department of the Arts Heritage & the Gaeltacht, Dublin, Ireland.
Nygård, T. et al., 2010. A study of White-tailed Eagle Haliaeetus albicilla movements and mortality at a wind farm in Norway. Proceedings of BOU Conference: Climate Change and Birds, pp.1–4.
Paula, J. et al., 2011. Dogs as a tool to improve bird-strike mortality estimates at wind farms. Journal for Nature Conservation, 19, pp.202–208.
Pearce-Higgins, J.W. et al., 2012. Greater impacts of wind farms on bird populations during construction than subsequent operation: results of a multi-site and multi-species analysis. Journal of Applied Ecology, 49, pp. 386–394.
Bird Sensitivity Mapping to Wind Energy Development - Guidance Document
24
Pearce-Higgins, J.W. et al., 2009. The distribution of breeding birds around upland wind farms. Journal of Applied Ecology, pp.1323–1331.
Raine, A.F. (2006). The breeding ecology of Twite Carduelis flavirostris and the effects of upland agricultural intensification. PhD Thesis, University of East Anglia.
Retief, E.F. et al., 2010. Avian Wind Farm Sensitivity Map for South Africa: Criteria and Procedures Used. BirdLife South Africa and The Endangered Wildlife Trust, South Africa
Smallwood, K.S. & Thelander, C.G., 2008. Bird mortality in the Altamont Pass. Journal of Wildlife Management, 72, pp.215–223.
Strix, 2012. Developing and testing the methodology for assessing and mapping the sensitivity of migratory birds to wind energy development. Final report,
Thomas, C.D. et al., 2004. Extinction risk from climate change. Nature, 427(6970), pp.145–8.
Tierney, N. et al., 2012. Bird Sensitivity Map for Ireland : a tool to aid planning and conservation in relation to Wind Energy, Report prepared for BirdWatch Ireland, Wicklow, Ireland.
Whitfield, D.P. & Madders, M., 2006. Flight Height in the Hen Harrier Circus Cyaneus and its Incorporation in Wind Turbine Collision Risk Modelling. Natural Research Information Note 2. Banchory, Aberdeenshire, UK.
Bird Sensitivity Mapping to Wind Energy Development - Guidance Document
25
Appendix 1 – Species Guidance
1 Eurasian Curlew (Numenius arquata) - Breeding
1.1 Characteristics
The Curlew is the largest wader found in Ireland and can be easily identified through its very
distinctive long curved bill, bulky body, long legs and long neck. This species is fairly uniform greyish
brown, with bold dark streaking all over. Female Curlews are larger than males with a longer bill,
though this is not always obvious in the field. The only likely confusion in identifying this species is
with the smaller Whimbrel (Numenius phaeopus), which occurs in spring and autumn in similar
habitat.
1.2 Range in Ireland
This species has a very wide breeding distribution, from north-western Europe, across central Russia
to east of Lake Baikal, though most of this (>75%) is within northern Europe (BirdLife International
2004). Historically in Ireland, this species was a widespread breeder, having been recorded breeding
in every county in the early 1970s (Sharrock 1976) Since then, this species has undergone the
greatest decline of any of the breeding waders, with a 78% decline in the number of occupied 10km
squares in Ireland (Balmer et al. 2013). Its breeding distribution is now confined to central and
western counties from Kerry to Donegal (Balmer et al. 2013), where it breeds on a variety of
wetlands, marginal grasslands and bogs (BirdWatch Ireland and NPWS, unpublished data). From
late summer onwards, the breeding population disperses mostly to the coast for the winter, where
it is joined by large numbers of migrants, mostly from western and north Western Europe.
Dispersal to the breeding grounds takes place from March onwards.
1.3 Conservation status
The Curlew is Red-listed in Ireland due to its small and declining breeding population (Colhoun &
Cummins 2013). Additionally, the European population of this species has been evaluated as
declining, due to a moderate decline in overall population (>10%), despite isolated increases in
some parts of its European range (BirdLife International 2004). Consequently, the IUCN have
recently included Curlew on the Red List of globally threatened species in the Near Threatened
category, owing to a moderate decline globally over a short time period (BirdLife International
2012). Finally, though traditionally hunted on the European mainland, due to its declining range and
population a five year moratorium on this was imposed in France in 2008 (BirdLife International
2014), though this has since been lifted. In Ireland, it was removed from the hunting list in 2013
due to concern over declines in the breeding population.
1.4 Population trend
Conservative estimates of global populations for this species have estimated declines of between
26-34% (BirdLife International 2012). Within its Irish population, significant declines have been
observed in the last 40 years, such as an almost 80% reduction in breeding range (Balmer et al.
2013) and a 3.1% annual decline in this species’ wintering population between 1994/95 & 2003/04
(Crowe et al. 2008). Some localised breeding populations have experienced sharper declines than
this, such as the Mayo/Donegal grouping which is estimated to have fallen by 93% in the same
Bird Sensitivity Mapping to Wind Energy Development - Guidance Document
26
period (Denninston 2012). Though slight increases in some British wintering populations of this
species were recorded in the 1980s and 1990s, this has reverted to steady decline since (Austin et
al. 2014).
1.5 Breeding ecology
Curlew is a ground nesting species, with breeding habitats including rough pastures, meadows and
bogs, with wet areas and an open aspect being common important features. Nests are usually
constructed in a shallow depression or more generally in a grassy or rushy tussock, which gives
partial cover. A single clutch is laid annually (though replacement clutches are often laid if nest
failure occurs during or shortly after egg laying) between April and May, containing 4 eggs which are
incubated for 27-29 days (Joys & Crick 2004). In one Swedish study from the early 1990s, higher
hatching success was observed for those nests located on grassland or fallow fields, as opposed to
more exposed tillage farmland (Berg 1992). In the only study which has been conducted in Ireland
(Grant et al. 1999), nest success was not related to vegetation height around the nest. Nest failure
rates in two types of habitat (upland marginal grassland and lowland wet grassland) were higher
than observed in other studies. Predation accounted for most nest failures and chick mortality and
the differences in the observed productivity levels and those required to maintain a stable
population were sufficient to account for the recorded declines (Grant et al. 1999). Adult survival is
high in this species (up to 90%), as measured through a longitudinal study in Wales (Taylor & Dodd
2013). However, this study found that population declines are unlikely to be a result of changes in
adult mortality but are more likely a result of poor breeding productivity.
1.6 Habitat requirements
Aside from breeding habitat selection outlined above, this species winters in a wide range of
wetland habitats (both coastal and inland) including damp fields. Often, pastures near existing
coastal and wetland feeding habitat provides supplementary foraging ground (Navedo et al. 2013).
Selection of feeding grounds may differ between genders of Curlew, which some have suggested is a
result of gender-specific energy requirements and the differing bill length resulting in divergent
feeding strategies (Townshend 1981). The diet of the Curlew is centred on invertebrates, particularly
for example, polychaetes (Nereis spp.), crabs and molluscs on the wintering grounds and beetles,
cranefly larvae and earth worms on the breeding grounds. This species feeds by touch and sight on
subsurface invertebrates (Pearce-Higgins & Yalden 2003), particularly polychaete worms such as
Nereis diversicolour (Townshend 1981). They are usually well dispersed across a wetland while
feeding.
1.7 Site fidelity
Adult Curlews are strongly philopatric, returning to the same nesting site in 86% of cases. This was
found to be statistically related to the breeding success of a chosen area (Berg 1994). This is despite
the use of a wide variety of wetland habitats for feeding and winter roosting. Therefore, fidelity to
breeding sites across multiple years may be linked to disturbance of other suitable sites, such as nest
predation by avian predators and human activity.
1.8 Sensitivity to development of wind energy
According to an EU-wide assessment of wind energy threats to bird populations, European
populations of Curlew are threatened by wind energy through barrier effects and disturbance
displacement (European Commission 2011). Some assessments of these effects did not find strong
Bird Sensitivity Mapping to Wind Energy Development - Guidance Document
27
disturbance displacement by wind farm installations, with some birds residing within 100m of
turbines, while mortality due to collisions was unrecorded at these sites (Everaert & Stienen 2007),
although has been recorded elsewhere (Hötker et al. 2006). In general, collision rates of Curlew with
wind infrastructure are low in comparison to other birds (Percival 2003). Conversely, a meta-analysis
of the overall effect of wind energy on bird populations revealed that breeding waders
(Charadriiformes) were impacted more than other groups of birds (Stewart et al. 2007).
Furthermore, modelling the potential impacts of wind energy developments on upland breeding
birds posited that a reduction in breeding density of up to 42% within 500 m of wind energy sites
could be expected (Pearce-Higgins et al. 2009). This study also demonstrated significant levels of
flight avoidance by Curlews within 800 m of turbines. Contrary to this, monitoring at 15 upland wind
farms showed no significant decline in populations of ten breeding species, including Curlew, during
the conventional operation of turbines (Pearce-Higgins et al. 2012). Most disturbance effects in this
case were recorded during the construction phase of these projects, after which Curlew populations
did not recover in the vicinity of wind energy infrastructure.
1.9 Zone of Sensitivity
Although Curlews have been known to use habitat up to 100 m from the base of wind turbines
(Everaert & Stienen 2007), their steady decrease in population and range and low hatching success
(in several studies across Europe hatching success is well below that required to maintain stable
populations, in one instance accounting for population declines of up to 50% (Grant et al. 1999))
means that any additional pressures through displacement or barrier effects may have a
disproportionate effect on this species’ conservation. In addition, Irish breeding populations of
waders are at greater threat generally through habitat loss and disturbance. Given that strong
avoidance of turbines has been observed within 800 m of wind infrastructure (Pearce-Higgins et al.
2009), and the risk of collision remains, the zone of sensitivity for this species has been set at 800 m
around point locations of known Curlew breeding sites.
1.10 Data sources
Data for this assessment was obtained from the Irish Wetland Bird Survey (Boland & Crowe 2012;
Crowe et al. 2008), the Upland Bird Survey (Cummins et al. 2004; Cummins et al. 2003) and several
dedicated Curlew surveys, including HELP (Halting Environmental Loss Project) (BirdWatch Ireland,
unpublished data).
Austin, G.E. et al., 2014. Waterbirds in the UK 2011/12. The Wetland Bird Survey, Thetford, United Kingdom.
Balmer, D. et al., 2013. Bird Atlas 2007-11, the breeding and wintering birds of Britian and Ireland,
Berg, Å., 1994. Maintenance of populations and causes of population changes of curlews Numenius arquata breeding on farmland. Biological Conservation, 67(3), pp.233–238.
Berg, Å.K.E., 1992. Factors affecting nest-site choice and reproductive success of Curlews Numenius arquata on farmland. Ibis, 134(1), pp.44–51.
BirdLife International, 2004. Birds in the European Union: a status assessment, Wageningen, The Netherlands.
BirdLife International, 2012. Numenius arquata. The IUCN Red List of Threatened Species. Version 2014.2. Available at: www.iucnredlist.org [Accessed September 2, 2014].
Bird Sensitivity Mapping to Wind Energy Development - Guidance Document
28
BirdLife International, 2014. Species factsheet: Numenius arquata. Available at: http://www.birdlife.org [Accessed September 3, 2014].
Boland, H. & Crowe, O., 2012. Irish Wetland Bird Survey: Waterbird Status and Distribution 2001/02 - 2008/09, Kilcoole, Wicklow.
Colhoun, K. & Cummins, S., 2013. Birds of Conservation Concern in Ireland 2014 – 2019. Irish Birds, 9(4), pp.523–544.
Crowe, O. et al., 2008. Estimates and trends of waterbird numbers wintering in Ireland , 1994 / 95 to 2003 / 04. , pp.66–77.
Cummins, S., Corbishley, H. & Newton, S., 2003. Upland Bird Survey Report 2003, Sligo, Leitrim, Cavan & north Mayo. BirdWatch Ireland Conservation Report No. 03/3, Kilcoole, Wicklow.
Cummins, S., Swann, M. & Newton, S., 2004. Upland Bird Survey Report 2004, County Mayo & Connemara (west Galway). BirdWatch Ireland Conservation Report No. 04/7, Kilcoole, Wicklow.
Denninston, H., 2012. Exploring the relationship between declines in breeding Curlew Numenius arquata and habitat change in Ireland. University College Cork.
European Commission, 2011. Wind energy developments and Natura 2000, Luxembourg.
Everaert, J. & Stienen, E.W.M., 2007. Impact of wind turbines on birds in Zeebrugge (Belgium). Biodiversity and Conservation, 16(12), pp.3345–3359.
Grant, M.C. et al., 1999. Breeding success and causes of breeding failure of curlew Numenius arquata in Northern Ireland. Journal of Applied Ecology, 36(1), pp.59–74.
Hötker, H., Thomsen, K.-M. & Jeromin, H., 2006. Impacts on biodiversity of exploitation of renewable energy sources: the example of birds and bats - facts, gaps in knowledge, demands for further research, and ornithological guidelines for the development of renewable energy exploitation, Bergenhusen, Germany.
Joys, A.C. & Crick, H.Q.P., 2004. Breeding periods for selected bird species in England, Thetford, United Kingdom.
Navedo, J.G. et al., 2013. Agroecosystems and conservation of migratory waterbirds: importance of coastal pastures and factors influencing their use by wintering shorebirds. Biodiversity and Conservation, 22(9), pp.1895–1907.
Pearce-Higgins, J.W. et al., 2012. Greater impacts of wind farms on bird populations during construction than subsequent operation: results of a multi-site and multi-species analysis. Journal of Applied Ecology, 49(2), pp.386–394.
Pearce-Higgins, J.W. et al., 2009. The distribution of breeding birds around upland wind farms. Journal of Applied Ecology, pp.1323–1331.
Pearce-Higgins, J.W. & Yalden, D.W., 2003. Variation in the use of pasture by breeding European Golden Plovers Pluvialis apricaria in relation to prey availability. Ibis, 145(3), pp.365–381.
Percival, S.M., 2003. BIRDS AND WIND FARMS IN IRELAND : A REVIEW OF POTENTIAL ISSUES AND IMPACT ASSESSMENT. , (December).
Sharrock, J.T.R., 1976. The Atlas of Breeding Birds in Britain and Ireland, Berkhamsted, Hertfordshire, UK: Poyser.
Stewart, G.B., Pullin, A.S. & Coles, C.F., 2007. Poor evidence-base for assessment of wind farm impacts on birds. Environmental Conservation, 34(1), pp.1–11.
Taylor, R.C. & Dodd, S.G., 2013. Negative impacts of hunting and suction-dredging on otherwise high and stable survival rates in Curlew Numenius arquata. Bird Study, 60(2), pp.221–228.

Bird Sensitivity Mapping to Wind Energy Development - Guidance Document
29
Townshend, D.J., 1981. The Importance of Field Feeding to the Survival of Wintering Male and Female Curlews Numenius Arquata on the Tees Estuary. In N. V Jones & W. J. Wolff, eds. Feeding and Survival Srategies of Estuarine Organisms SE - 20. Marine Science. Springer US, pp. 261–273.
Bird Sensitivity Mapping to Wind Energy Development - Guidance Document
30
2 Dunlin (Calidris alpina) - Breeding
2.1 Characteristics
Often occurring in very large flocks outside the breeding season, Dunlin are a small migratory wader
with black legs and a longish bill which down-curves slightly. In summer, this species displays rich
chestnut above which is streaked on the breast, white below and a striking black patch on the belly.
The more usually encountered winter plumage bird shows a rather non-descript, uniform, plain
brownish-grey on all upperparts and white underparts. Juveniles in autumn have warm brown tones
on the upperparts and considerable streaking on the breast and underparts. There are many other
variations and combinations, depending on the bird's state of moult.
2.2 Range in Ireland
This species has an extremely broad global distribution, and is found in nearly all Arctic tundra
regions, though this is broken into various subspecies across its range (Stroud et al., 2001). Further
south, their breeding distribution extends to more temperate regions where they are found in a
variety of upland and wetland habitats (Stroud et al., 2001). In Europe this is limited to higher
latitudes with suitable boreal habitat, such as parts of Ireland, Scotland, Scandinavia, the Baltic and
Russia, though this accounts for less than half of its global breeding range (BirdLife International
2004). In Ireland, this species breeds in an increasingly limited number of sites and is now largely
restricted to a few machair sites on the west coast of Mayo and some upland sites in the north and
west (Gamero et al. 2008). These include Roonagh Lough, Fahy Lough and the Inishkea Islands.
Further inland, breeding has also been recorded at Slieve Fyagh. This species accounts for 7.3% of
the total breeding wader distribution in Ireland (Gamero et al. 2008). Some groups of this species
are sedentary while others may migrate to northwest Africa/southwest Europe. Birds originating
from Scandinavia to Siberia join Irish residents in the winter, as well as passage migrants from
Greenland. Consequently, in winter this species is a common bird along most Irish coasts (Boland &
Crowe 2012).
2.3 Conservation status
Dunlin were upgraded from Amber-listed to Red-listed in Ireland due to their very small breeding
range and population (Colhoun & Cummins 2013; Lynas et al. 2007), which is regarded as being
increasingly vulnerable to disturbance. As a result of large historical population declines in its Baltic
and Scandinavian range, this species’ European population is considered to be Depleted (BirdLife
International 2004). Further, the schinzii subspecies of this distribution (Wenink et al. 1996), the
subspecies confirmed as breeding in Ireland, is also listed under Annex I of the EC Council Directive
on the Conservation of Wild Birds (2009/147/EC). Internationally, this species is predicted to
undergo significant declines in suitable range (and consequently populations) in the next 50-80 years
as a result of climate change-driven tundra contraction (Zockler & Lysenko 2000). Dunlins are rated
as Least Concern by the IUCN due to an extremely large range and a decline which does not yet
qualify as Vulnerable, being less than 30% over the past 10 years (BirdLife International 2012).
2.4 Population trend
This species European breeding population has been estimated at over 300,000 pairs, which was
likely stable from 1970 – 1990. The European wintering population declined sharply in this period,
however. The species was also stable in North West Europe between 1990 and 2000, but has
Bird Sensitivity Mapping to Wind Energy Development - Guidance Document
31
declined around the Baltic and Russia over the same period. Estimates of the Irish national breeding
population now stand at only 150 breeding pairs (Lauder & Donaghy 2008), which represents a
distinct population of the subspecies C. a. schinzii (Wenink et al. 1996; Gamero et al. 2008; Suddaby
& Newton 2006). In addition to the breeding population of Dunlins, the Irish population of non-
breeding birds is estimated to have contracted by 5.9% annually between 1994/95 and 2003/04
(Crowe et al. 2008). The survival rate of adult Dunlin has been estimated as 0.53-0.74, while juvenile
survival may be as low as 0.33 (Sandercock 2003; Saether 1989), meaning that recovery of this
population under improved conditions is likely to be slow.
2.5 Breeding ecology
Dunlins construct nests on shallow scrapes at ground level, hidden amongst vegetation or
occasionally within a raised tussock, as solitary pairs or in small aggregations (Snow & Perrins 1998).
Four eggs are usually laid per clutch from late April until late June, which are incubated for 21-22
days by both sexes. Chicks fledge after a further 19-21 days (Snow & Perrins 1998). It was found that
the breeding success and chick survival of Dunlin populations on Scotland’s Western Isles are
affected by predation by small mammals (Jackson 2001), which may be the case with Irish
populations. Hatching success of other breeding waders in both Ireland and the UK has been found
to be affected by Carrion Crow (Corvus corone), Common Gull (Larus canus), American Mink
(Mustela vison) and Fox (Vulpes vulpes) depredation (Parr 1993; Suddaby et al. 2010). Recent
predator exclusion treatments on breeding wader nesting sites in Ireland have provisionally resulted
in greater breeding success (S. Finney and A. Donaghy, unpublished data), following successful
treatments in the UK (Malpas et al. 2013). It is possible that nest predation affects Irish Dunlins
specifically, but very few data are available for Ireland at present.
2.6 Habitat requirements
Across their range Dunlins use a variety of estuarine mud flats, shingle beaches, wet grasslands and
salt marshes as favoured breeding habitat, both for feeding and nesting, though they may also use
adjacent coastal pasture during spring tides or if disturbed. Of these habitats in the Dunlin’s
remaining distribution within Ireland, the machair of north-western counties is of particular
importance (Nairn & Sheppard 1985). Whilst nesting in these areas, the Dunlin’s diet is dominated
by polychaete worms (particularly Nereis spp.), bivalves (particularly Macoma spp.), gastropods
(particularly Hydrobia spp.) and oligochaete worms obtained from nearby wetlands (Worrall 1984;
Mouritsen 1994), availability of which has been found to vary seasonally and across sites.
Additionally, this diet was shown to vary between diurnal and nocturnal feeding and between
migratory visitors and breeding individuals (Mouritsen 1994).
2.7 Site fidelity
Dunlins are philopatric, returning to the same breeding ground annually, if not across multiple
generations (Soikkeli 1970). Recent research on the key Dunlin breeding site of Inishkea North
indicates that 52% of breeding adults returned (based on 26% of the population being individually
colour-ringed), with return rates for males estimated at 73% and 33% for females (Gamero et al.
2008). Given the Dunlin’s already limited distribution, conservation of any remaining suitable habitat
within its current range is of high priority.
Bird Sensitivity Mapping to Wind Energy Development - Guidance Document
32
2.8 Sensitivity to development of wind energy
In general, breeding waders were identified by an EU assessment of wind energy impacts as being
particularly susceptible to disturbance displacement and barriers to movement (European
Commission 2011). That said, a recent assessment of the effects of disturbance on breeding waders
which favour short vegetation found little impact on populations of Dunlin and other waders during
the operation of wind farms (Pearce-Higgins et al. 2012). However, a significantly greater effect was
observed during construction of wind farms than subsequent operation. An additional study on
English populations of breeding waders and disturbance found that Dunlin populations were not
impacted upon by disturbance, whereas Golden Plover in the same habitat experienced a decline
(Yalden & Yalden 1989). In this case study, the emitting of an alarm call by Golden Plover, when
approached by a human intruder, occurred at much greater distances (187 m), whereas Dunlin
called at an average of only 35 m. A study in Scotland found similar results, with Dunlin only taking
flight when approached to within 20m (Thompson & Thompson 1985). It was thus suggested that
Dunlin are more tolerant of disturbance and may be allowing other species (such as Golden Plover)
to provide early warning of intrusion (Thompson & Thompson 1985). Additionally, Dunlins do not
nest in exposed areas, but rather conceal nesting sites within tussocks, potentially explaining this
variation in disturbance. In terms of collision risk, during the early breading season males
consistently perform display flights which may increase risk. Furthermore, Dunlin flight in general
has been recorded at intermediate altitudes, leading to increased exposure to turbine blades
(Langston & Pullan 2003).
2.9 Zone of Sensitivity
The nearest non-breeding foraging Dunlin to operational wind turbines at Zeebrugge was measured
at 150 m (Everaert & Stienen 2007). Of note is that groups of 50 or more individuals were only seen
at 250 m from turbines, suggesting that less dense populations require a narrower buffer distance.
Further, disturbance displacement effects through human recreation were found to be minimal in
other studies (Yalden & Yalden 1989). Contrary to this, collision risk for this species is deemed to be
high, due to its flight ecology and tendency to travel several kilometres from nesting sites to feed
(Soikkeli 1970). In addition, Irish breeding populations of waders are at greater threat generally
through habitat loss and disturbance. Thus, the zone of sensitivity for this species has been assigned
a radius of 800 m around known breeding sites. Though this exceeds smaller recommended
distances, the assigned zone allows for ranging around point locations and allows for increased
disturbance.
2.10 Data sources
Data for this species assessment was obtained from the Irish Wetland Bird Survey (Boland & Crowe
2012) and from the Resurvey of breeding wader populations of machair and associated wet
grasslands in north-west Ireland, as commissioned by the National Parks and Wildlife Service
(Suddaby et al. 2010).
BirdLife International, 2004. Birds in the European Union: a status assessment, Wageningen, The Netherlands.
BirdLife International, 2012. Calidris alpina. The IUCN Red List of Threatened Species. Version 2014.2. Available at: www.iucnredlist.org [Accessed August 29, 2014].
Bird Sensitivity Mapping to Wind Energy Development - Guidance Document
33
Boland, H. & Crowe, O., 2012. Irish Wetland Bird Survey: Waterbird Status and Distribution 2001/02 - 2008/09, Kilcoole, Wicklow.
Colhoun, K. & Cummins, S., 2013. Birds of Conservation Concern in Ireland 2014 – 2019. Irish Birds, 9(4), pp.523–544.
Crowe, O. et al., 2008. Estimates and trends of waterbird numbers wintering in Ireland , 1994 / 95 to 2003 / 04. , pp.66–77.
European Commission, 2011. Wind energy developments and Natura 2000, Luxembourg.
Everaert, J. & Stienen, E.W.M., 2007. Impact of wind turbines on birds in Zeebrugge (Belgium). Biodiversity and Conservation, 16(12), pp.3345–3359. Available at: http://link.springer.com/10.1007/s10531-006-9082-1 [Accessed April 7, 2014].
Gamero, A., McNaghten, L. & Suddaby, D., 2008. Research of breeding Dunlin ecology associated with machair and upland NATURA 2000 sites in N.W. Mayo,
Jackson, D.B., 2001. Experimental removal of introduced hedgehogs improves wader nest success in the Western Isles, Scotland. Journal of Applied Ecology, 38(4), pp.802–812. Available at: http://dx.doi.org/10.1046/j.1365-2664.2001.00632.x.
Langston, R.H.W. & Pullan, J., 2003. Windfarms and Birds : An analysis of the effects of windfarms on birds , and guidance on environmental assessment criteria and site selection issues,
Lauder, C. & Donaghy, A., 2008. Breeding Waders in Ireland 2008: A Review and Recommendations for Future Actions. A report to the National Parks and Wildlife Service, Kilcoole, Wicklow.
Lynas, P., Newton, S. & Robinson, J., 2007. The status of birds in Ireland: an analysis of conservation concern 2008-2013. Irish Birds, 8, pp.149 –166.
Malpas, L.R. et al., 2013. The use of predator-exclusion fencing as a management tool improves the breeding success of waders on lowland wet grassland. Journal for Nature Conservation, 21(1), pp.37–47. Available at: http://www.sciencedirect.com/science/article/pii/S1617138112000994.
Mouritsen, K.N., 1994. Day and Night Feeding in Dunlins Calidris alpina: Choice of Habitat, Foraging Technique and Prey. Journal of Avian Biology, 25(1), pp.55–62.
Nairn, R.G.W. & Sheppard, J.R., 1985. Breeding waders of sand dune machair in north-west Ireland. Irish Birds, 3, pp.53–70.
Parr, R., 1993. Nest predation and numbers of Golden Plovers Pluvialis apricaria and other moorland waders. Bird Study, 40(3), pp.223–231. Available at: http://www.tandfonline.com/doi/abs/10.1080/00063659309477187 [Accessed August 27, 2014].
Pearce-Higgins, J.W. et al., 2012. Greater impacts of wind farms on bird populations during construction than subsequent operation: results of a multi-site and multi-species analysis. Journal of Applied Ecology, 49(2), pp.386–394. Available at: http://doi.wiley.com/10.1111/j.1365-2664.2012.02110.x [Accessed March 21, 2014].
Saether, B.E., 1989. Survival Rates in relation to body weight in European birds. Ornis Scandinavica, 20(1), pp.13–21. Available at: http://www.jstor.org/stable/3676702.
Sandercock, K., 2003. • Bulletin April. Wader Study Group Bulletin, 100, pp.163–174.
Snow, D.W. & Perrins, C.M., 1998. The Birds of the Western Palearctic Vol. 1: Non-passerines, Oxford, UK: Oxford University Press.
Bird Sensitivity Mapping to Wind Energy Development - Guidance Document
34
Soikkeli, M., 1970. Dispersal of Dunlin Calidris alpina in relation to sites of birth and breeding. Ornis Fennica, 47, pp.1–9.
Suddaby, D., Nelson, T. & Veldman, J., 2010. Resurvey of breeding wader populations of machair and associated wet grasslands in north-west Ireland. Irish Wildlife Manuals, No. 44, Dublin, Ireland.
Suddaby, D. & Newton, S., 2006. Breeding parameters of selected wader species at Machair sites and adjacent areas associated with the Mullet/Blacksod Bay & Offshore Islands complex, N.W. Mayo, 2006,
Thompson, D.B.A. & Thompson, M.L.P., 1985. Early warning and mixed species association: the “Plover”s Page’ revisited. Ibis, 127(4), pp.559–562. Available at: http://dx.doi.org/10.1111/j.1474-919X.1985.tb04851.x.
Wenink, P.W. et al., 1996. Global Mitochondrial DNA Phylogeography of Holarctic Breeding Dunlins (Calidris alpina). Evolution, 50(1), pp.318–330.
Worrall, D.H., 1984. Diet of the Dunlin Calidris alpina in the Severn Estuary. Bird Study, 31(3), pp.203–212. Available at: http://www.tandfonline.com/doi/abs/10.1080/00063658409476842 [Accessed August 29, 2014].
Yalden, D.. & Yalden, P.E., 1989. The sensitivity of breeding Golden Plovers Pluvialis apricaria to human intruders. Bird Study, 36, pp.49–55.
Zockler, C. & Lysenko, I., 2000. Water Birds on the Edge: First Circumpolar Assessment of Climate Change Impact on Arctic Breeding Water Birds, Cambridge, United Kingdom.
Bird Sensitivity Mapping to Wind Energy Development - Guidance Document
35
3 Lapwing (Vanellus vanellus) - Breeding
3.1 Characteristics
The Lapwing is a distinct black-and-white, pigeon-sized wader, with pinkish legs, wide rounded
wings and floppy beats in flight. A wispy crest extending upwards from back of this species’ head
and a green/purple iridescence can be seen on the plumage at close range.
3.2 Range in Ireland
Internationally, this species has a wide breeding range, from Europe through Russia and central
Asia, though Europe holds up to 50% of its global breeding population (BirdLife International 2004).
In Ireland, however, this species breeds in an increasingly limited number of sites. Strongholds
include the Shannon Callows, Lough Boora parklands and suitable sites (predominantly based
around machair grassland) on the coast of Mayo, Sligo and Donegal. It is also found at low densities
on a range of other habitats in the wider countryside, including cutaway bogs and arable farmland,
where it breeds in solitary pairs or loose colonies. However, this breeding range has declined by
53% in 40 years, according to recent 10 km2 occupancy changes (Balmer et al. 2013). In winter,
Lapwings are widely distributed across a multitude of habitats in Ireland, including most major
wetlands, pasture and rough land adjacent to bogs where large flocks are regularly recorded.
Important locations within this wintering distribution include the Shannon and Fergus Estuary in
County Clare, the Shannon Callows in County Offaly and the Wexford Harbour and Slobs in County
Wexford which all regularly support >10,000 birds. Other important sites include Strangford Lough
in County Down and the Cull and Killag in County Wexford (>8,000 birds).
3.3 Conservation status
Breeding Lapwings are Red-listed in Ireland due to long-term declines in this breeding population
(Colhoun & Cummins 2013) while the European population, previously regarded as Secure, is now
listed as Vulnerable (BirdLife International 2004) owing to a more than 30% decline in overall
breeding numbers. Despite these large declines, the global population of this species remains high
and is regarded as being of Least Concern by the IUCN (BirdLife International 2012).
3.4 Population trend
The European population of Lapwings is in continual declines across much of its range, including
substantial declines in Russia, the United Kingdom and the Netherlands (BirdLife International
2004). The Irish Lapwing population consists of resident birds, summer visitors from the Continent
(France and Iberia) and winter visitors (from western and central Europe), with some overlap
between all three groups. Greatest numbers occur in Ireland between September & April. The Irish
breeding population of this species is now estimated at circa. 2000 pairs (Lauder & Donaghy 2008).
Though still regarded as one of the most populous breeding wader species in Ireland, populations of
this species have experienced substantial declines in recent years. For example, a recent study of
machair waders revealed a reduction of 35% overall, and 69% in mainland breeding populations
(Suddaby et al. 2010). Consequently, island populations off the west coast (some of which are now
stable or increasing) and the Shannon Callows are becoming important strongholds for this and
other species of breeding wader, as mainland machair-based populations may soon reach
unsustainably low levels at current rates of decline (Suddaby et al. 2010). An assessment of UK
populations revealed declines of up to 36% between 2001-2011 (Austin et al. 2014), though declines
Bird Sensitivity Mapping to Wind Energy Development - Guidance Document
36
in Northern Ireland of 89% between 1985-7 and 2013 were recorded by Colhoun et al. (2013) and
are likely to be more reflective of declines in the population in the Republic of Ireland.
3.5 Breeding ecology
Lapwings breed on open grasslands, and appear to prefer nesting in fields that are relatively well
grazed and/or flooded in winter, the nest consisting of a shallow scrape in this short grass (Snow &
Perrins 1998). This species lays a clutch of 4 eggs between March and late May (Joys & Crick 2004)
which are incubated for a period of 25-34 days. Juvenile survival is, however quite low, at 0.59 in
first year. Indeed, many populations have been found to have productivity levels which are less than
the estimated minimum replacement level of Lapwing of 0.8 successful hatchlings per pair (Peach et
al. 1994; Grant et al. 1999). In many of these studies, high nest loss and chick mortality are the
primary causal factors of Lapwing population decline (Sharpe et al. 2008), with nest and chick
predation being the main reason for loss. Alternately, egg predation by Hooded Crows (Corvus
cornix), Common Gulls (Larus canus) and Foxes (Vulpes vulpes) has been suggested as a limiting
factor of breeding success (Suddaby et al. 2010). Adult survival is high, at between 0.7 and 0.8
(Catchpole et al. 1999; Peach et al. 1994) and is not thought to be driving population decline.
3.6 Habitat requirements
Breeding Lapwings prefer well grazed coastal grasslands and marshes for nesting and feeding in the
Britain (Ausden et al. 2003), though in Ireland this species is more generally found around machair
grasslands, inland cutaway bogs and arable farmland. Additional preference for grasslands flooded in
early spring has also been observed, particularly those containing drainage channels or “rills”
(Milsom et al. 2002) or those possessing more patchy vegetation (Whittingham et al. 2001). Within
this habitat this species feeds on a variety of soil and surface-living invertebrates, particularly small
arthropods and earthworms, in some instances feeding on aquatic invertebrates of shallow pools
(Ausden et al. 2003). Lapwings may also feed at night, possibly as some of the larger earthworm
species are present near the soil surface at night, and thus are more easily accessible. They use
traditional feeding areas, are opportunistic, and will readily exploit temporary food sources, such as
ploughed fields and on the edge of floodwaters. Additionally, the diet of Lapwings is thought to
differ between fledglings and adults, owing to differing energy demands (Pearce-Higgins & Yalden
2004). Some assessments have advised modifying agricultural and other management practices to
improve Lapwing breeding and habitat use, including prescribed grazing and/or flooding (Ausden et
al. 2003; Milsom et al. 2002), modified rush cutting (Robson & Allcorn 2006) and alternative
ploughing practices (Squires & Allcorn 2006). Additionally, exclusion of potential mammalian
predators by erecting fencing has been shown to improve the breeding success of this and other
species of breeding wader (Jackson 2001; Ausden et al. 2009; Ausden et al. 2011; Malpas et al.
2013).
3.7 Site fidelity
Given the ability of this species to occupy a variety of wetlands and its preference for well-grazed
grassland, suitable Lapwing habitat seems readily available. Natal philopatry (returning to breed in
the sites where a bird hatched), however, is high in this species. Consequently, any disturbance to
existing breeding sites (particularly that which impacts upon breeding success) is likely to have a
disproportionate effect on populations of this species.
Bird Sensitivity Mapping to Wind Energy Development - Guidance Document
37
3.8 Sensitivity to development of wind energy
Several studies of wind energy infrastructure and its impact on bird populations have found no
discernible impact on populations of breeding Lapwings, either through collision, disturbance
displacement or avoidance (Winkelman 1992; Ketzenberg et al. 2002; Pearce-Higgins et al. 2009).
Indeed, Langston et al. (2003) found that Lapwing nesting occurred slightly closer to turbines than
predicted through spatial modelling, possibly as a result of the creation of preferred areas of shorter
vegetation. Furthermore, for this species, no difference was found between the impacts of wind
energy infrastructure during construction versus during conventional operation (Pearce-Higgins et al.
2012). Disturbance of Lapwing breeding populations has been recorded in several studies, up to a
distance of 350 m, though the majority of instances were at much closer proximity, resulting in a
mean of 108 m (Hötker et al. 2006), while Pearce-Higgins et al. (2009) found no significant
relationship between distance to wind farms and changes on occurrence. Conversely, significant
impacts of wind energy installations on non-breeding populations of Lapwings have been identified
through a meta-analysis of existing literature (Hötker et al. 2006). Indeed, of several species studied
in relation to wind energy impacts, turbine height was most strongly correlated with minimum
distance disturbance of non-breeding Lapwings (Hötker et al. 2006). Thus, though breeding Lapwings
may not be directly impacted by wind energy infrastructure, changes in land use around these sites ‒
including reduced grazing leading to longer and more uniform vegetation ‒ may affect the breeding
success of this species (a factor likely to exacerbate this species’ current decline).
3.9 Zone of Sensitivity
Irish breeding populations of waders are at greater threat generally through habitat loss and
disturbance, especially given the limited distribution of breeding Lapwings. Contrary to Dunlin nests
which are concealed within tussocks, Lapwings nest in the open, will readily leave the nest when
disturbed and are prone to abandon nests. Thus a wider zone of sensitivity has been assigned for
this species of 800 m around known breeding sites. This is especially in light of the decreasing
distribution of Lapwings.
3.10 Data sources
Data for this assessment were obtained from the Irish Wetland Bird Survey (Boland & Crowe 2012)
and the Resurvey of Breeding Wader Populations of Machair and Associated Wet Grasslands in
North-west Ireland, as commissioned by the National Parks and Wildlife Service (Suddaby et al.
2010).
Ausden, M. et al., 2003. Diet of breeding Lapwing Vanellus vanellus and Redshank Tringa totanus on coastal grazing marsh and implications for habitat management: Capsule Management of coastal grazing marshes for these breeding wading birds should prescribe maintaining shallow poo. Bird Study, 50(3), pp.285–293.
Ausden, M. et al., 2009. Predation of breeding waders on lowland wet grassland – is it a problem? British Wildlife, 21(1).
Ausden, M., Hirons, G. & Kennerley, R., 2011. Using anti-predator fences to increase wader productivity. Conservation Land Management, 9(3).
Austin, G.E. et al., 2014. Waterbirds in the UK 2011/12. The Wetland Bird Survey, Thetford, United Kingdom.
Bird Sensitivity Mapping to Wind Energy Development - Guidance Document
38
Balmer, D. et al., 2013. Bird Atlas 2007-11, the breeding and wintering birds of Britian and Ireland,
BirdLife International, 2004. Birds in the European Union: a status assessment, Wageningen, The Netherlands.
BirdLife International, 2012. Vanellus vanellus. The IUCN Red List of Threatened Species. Version 2014.2. Available at: www.iucnredlist.org [Accessed September 8, 2014].
Boland, H. & Crowe, O., 2012. Irish Wetland Bird Survey: Waterbird Status and Distribution 2001/02 - 2008/09, Kilcoole, Wicklow.
Catchpole, E. a. et al., 1999. Modelling the survival of British Lapwings Vanellus vanellus using ring-recovery data and weather covariates. Bird Study, 46(sup001), pp.S5–S13.
Colhoun, K. & Cummins, S., 2013. Birds of Conservation Concern in Ireland 2014 – 2019. Irish Birds, 9(4), pp.523–544.
Grant, M.C. et al., 1999. Breeding success and causes of breeding failure of curlew Numenius arquata in Northern Ireland. Journal of Applied Ecology, 36(1), pp.59–74.
Hötker, H., Thomsen, K.-M. & Jeromin, H., 2006. Impacts on biodiversity of exploitation of renewable energy sources: the example of birds and bats - facts, gaps in knowledge, demands for further research, and ornithological guidelines for the development of renewable energy exploitation, Bergenhusen, Germany.
Jackson, D.B., 2001. Experimental removal of introduced hedgehogs improves wader nest success in the Western Isles, Scotland. Journal of Applied Ecology, 38(4), pp.802–812.
Joys, A.C. & Crick, H.Q.P., 2004. Breeding periods for selected bird species in England, Thetford, United Kingdom.
Ketzenberg, C. et al., 2002. Einfluss von Windkraftanlagen auf brütende Wiesenvögel. Natur und Landschaft, 77, pp.144–153.
Lauder, C. & Donaghy, A., 2008. Breeding Waders in Ireland 2008: A Review and Recommendations for Future Actions. A report to the National Parks and Wildlife Service, Kilcoole, Wicklow.
Malpas, L.R. et al., 2013. The use of predator-exclusion fencing as a management tool improves the breeding success of waders on lowland wet grassland. Journal for Nature Conservation, 21(1), pp.37–47.
Milsom, T.P. et al., 2002. Management of coastal grazing marshes for breeding waders: the importance of surface topography and wetness. Biological Conservation, 103(2), pp.199–207.
Peach, W.J., Thompson, P.S. & Coulson, J.C., 1994. Annual and Long-Term Variation in the Survival Rates of British Lapwings Vanellus vanellus. Journal of Animal Ecology, 63(1), pp.60–70.
Pearce-Higgins, J.W. et al., 2012. Greater impacts of wind farms on bird populations during construction than subsequent operation: results of a multi-site and multi-species analysis. Journal of Applied Ecology, 49(2), pp.386–394.
Pearce-Higgins, J.W. et al., 2009. The distribution of breeding birds around upland wind farms. Journal of Applied Ecology, pp.1323–1331.
Pearce-Higgins, J.W. & Yalden, D.W., 2004. Habitat selection, diet, arthropod availability and growth of a moorland wader: the ecology of European Golden Plover Pluvialis apricaria chicks. Ibis, 146(2), pp.335–346.
Robson, B. & Allcorn, R.I., 2006. Rush cutting to create nesting patches for lapwings Vanellus vanellus and other waders , Lower Lough Erne RSPB reserve ,. Conservation Evidence, pp.81–83.
Bird Sensitivity Mapping to Wind Energy Development - Guidance Document
39
Sharpe, F., Clark, J. & Leech, D., 2008. Does variation in demographic parameters account for regional variation in Northern Lapwing Vanellus vanellus population declines across Great Britain?: Capsule Variations in regional nest survival rates, natal philopatry, first-year and adult survival ca. Bird Study, 55(3), pp.247–256.
Snow, D.W. & Perrins, C.M., 1998. The Birds of the Western Palearctic Vol. 1: Non-passerines, Oxford, UK: Oxford University Press.
Squires, R. & Allcorn, R.I., 2006. The effect of chisel ploughing to create nesting habitat for breeding lapwings Vanellus vanellus at Ynys-Hir RSPB reserve , Powys , Wales. Conservation Evidence, pp.77–78.
Suddaby, D., Nelson, T. & Veldman, J., 2010. Resurvey of breeding wader populations of machair and associated wet grasslands in north-west Ireland. Irish Wildlife Manuals, No. 44, Dublin, Ireland.
Whittingham, M.J., Percival, S.M. & Brown, A.F., 2001. Habitat selection by golden plover Pluvialis apricaria chicks. Basic and Applied Ecology, 2(2), pp.177–191.
Winkelman, J.E., 1992. The Impact of the SEP Wind Park near Oosterbierum (Fr.), the Netherlands, on Birds, Vol. 1: Collision Victims [in Dutch]. RIN-report 92/2, Arnhem, Netherlands.
Bird Sensitivity Mapping to Wind Energy Development - Guidance Document
40
4 Golden Plover (Pluvialis apricaria) - Breeding
4.1 Characteristics
The Golden Plover is a medium-sized stout breeding wader, with narrow, pointed wings and
mottled golden brown upperparts which, in winter, look grey at close range. Males in summer have
more black below than females, which extends from the throat towards each eye and ventrally
under the neck, chest and belly. In winter, males and females are similar in appearance, with no
black underparts.
4.2 Range in Ireland
This species is a partially migratory summer visitor from France and Iberia, though some
occasionally remain year-round in Ireland, moving to the coast or suitable inland areas in winter. At
this time, between October & February, the Irish population is significantly inflated by the arrival of
migrants from Iceland. The breeding (summer) distribution in Ireland is limited to the uplands of
western and north-western counties in Ireland (Cummins et al. 2003; Cummins et al. 2004). Though
this breeding distribution is sparse, notable localities include the isolated uplands of Donegal,
western Mayo and south-western Galway. More recent resurveying of formerly occupied coastal
machair sites of Sligo have resulted in these being lost from this species’ breeding distribution since
surveys of 1996 (Suddaby et al. 2010; Madden et al. 1998). At several of these sites, no evidence of
breeding success was observed. More recent surveys of the Connemara Bog Complex SPA are
currently underway, as part of National Parks and Wildlife Service monitoring efforts.
4.3 Conservation status
The Golden Plover is Red-listed in Ireland, as it has been for some time (Lynas et al. 2007; Colhoun
& Cummins 2013), due to large declines in its breeding population and breeding range and more
recent declines in wintering populations. The European population is considered Secure. Though
declines were recorded in several populations in Western Europe, this was compensated for by
increases in its Finnish population and stability elsewhere (BirdLife International 2004). This is
further regarded as being of Least Concern internationally by the IUCN (BirdLife International
2012). Given its significant regional declines, this species is also listed under Annex I of the EC
Council Directive on the Conservation of Wild Birds (2009/147/EC). It is thought that the southern
extremities of its European breeding range (including populations in Ireland and the UK) have been
in decline since the 19th Century (Tucker & Heath 1994).
4.4 Population trend
Currently, estimates of the Irish population of Golden Plover stand at circa. 120 pairs (Colhoun and
Cummins 2013). In Ireland, this species has experienced a 40% population reduction in the last 20
years, while declines of up to 73% have been recorded in the breeding population between 1988/91
and 2008 (Lauder & Donaghy 2008). Similar declines in Britain have been attributed to afforestation
and agricultural intensification (Boobyer 1992) which is likely a common driver of loss in Ireland
also. A recent resurvey of 32 suitable machair sites within the Golden Plover’s known range
revealed a complete absence of breeding pairs, including a disappearance from formerly occupied
Sligo machair (Suddaby et al. 2010), although Machair is not this species primary breeding habitat.
This report warns that this current downward trend risks local extinction of this species as a
breeding population. This same report did, however, find Golden Plover to be the most numerous
Bird Sensitivity Mapping to Wind Energy Development - Guidance Document
41
species at other sites, though these large aggregations were thought to be passage migrants. Adult
survival is low in comparison to other species at 0.73 (Sandercock 2003), meaning that any recovery
of this species with improved habitat protection or restoration will be slow.
4.5 Breeding ecology
Golden Plovers nests consist of a shallow scrape on bare ground, usually in areas of low vegetation.
This species is not a colonial nester though pairs may nest within 100m of each other. Nesting
densities are conventionally much lower than this, however. A single clutch of 3-4 eggs is usually laid
from April – May and is incubated for 28 – 31 days (Snow & Perrins 1998). Hatching success of these
eggs was in other studies affected by predation by Carrion Crows (Corvus corone), Common Gull
(Larus canus), American Mink (Mustela vison) and Foxes (Vulpes vulpes) (Parr 1993), while the
breeding of Irish waders in general are thought be impacted by similar predation effects (Suddaby et
al. 2010) . Adult foraging while nesting is widely dispersed, between 6 - 8 km during daylight and 2 -
3 km nocturnally (Pearce-Higgins & Yalden 2003).
4.6 Habitat requirements
During the breeding season, this species requires areas of heather (Calluna vulgaris) moors, blanket
bogs & acidic grasslands for nesting, favouring those areas with shorter vegetation (Snow & Perrins
1998). Their selection and use of habitat seems strongly correlated with prey abundance and
availability, and not necessarily with lower levels of disturbance experienced at these sites (Pearce-
Higgins & Yalden 2003). Arable fields were predominantly used as feeding ground during breeding,
with a strong preference shown for shorter grassland areas of this range. Nesting birds will forage
several kilometres around these sites on a variety of invertebrates, principally beetles &
earthworms, but also on plant material such as berries, seeds & grasses (Pearce-Higgins & Yalden
2003). A study on Golden Plover chick habitat selection found that they neither select for exclusively
heather- or grass-dominated habitats, but favour areas of mixed cover consisting of heather and
grass or mire dominated by bog-cotton (Eriophorum vaginatum) (Whittingham et al. 2001). Again,
availability of suitable prey was found to be the main determinant. Additionally it was concluded
that vegetation structure, including concealment from predators, may influence habitat use. Though
areas of calcareous grassland contained higher densities of suitable invertebrates, their exposed
nature reduced this habitats utilization (Whittingham et al. 2001).
4.7 Site fidelity
Given the Golden Plover’s already limited distribution, remaining suitable habitat within its current
range is of high priority. Though little research has been done on this aspect of the Golden Plover’s
ecology, limitations associated with habitat availability likely result in high site fidelity. The high
specificity of breeding and feeding site selection of both adults and young (Snow & Perrins 1998;
Whittingham et al. 2001) suggests that restriction to within these areas will remain so in the future.
Though site selection of this species is narrow, disturbance within these sites as a result of wind
energy developments was found to be very low in a recent assessment (Douglas et al. 2011), in
contrast to the behavioural disturbance caused by walking tourists observed across a longitudinal
study of a British Golden Plover population (Finney et al. 2005).
4.8 Sensitivity to development of wind energy
In general, breeding waders were identified by an EU assessment of wind energy impacts as being
particularly susceptible to disturbance displacement and barriers to movement (European
Bird Sensitivity Mapping to Wind Energy Development - Guidance Document
42
Commission 2011). Collision risk for waders is generally deemed to be low, due to a relatively low
cursory flight path, coupled with high flight manoeuvrability. A review of pan-European collision
assessments revealed much lower Golden Plover collision records than other species, though this
was not controlled for survey effort or corpse recovery rates (Hötker et al. 2006). An assessment of
disturbance to Golden Plover nesting sites by walking tourists revealed substantially reduced habitat
use with 200 m of unimproved paths and to within 50 m of improved paths which contained tourists
more effectively. Generally, reduced use of suitable habitat surrounding operating turbines, to
within 200 m of the turbine base, has been recorded (Pearce-Higgins et al. 2009). Additionally, a
review of 29 other studies suggests Golden Plover will approach wind turbines to an average
distance of 175 m in non-breeding season (Hötker et al. 2006), with turbine height positively
correlated with displacement distance. Further, modelling of wind energy developments and
potential Golden Plover habitat found a negative relationship between wind farms and predicted
populations of this species (Pearce-Higgins et al. 2008). However, a recent paper by Douglas et al.
(2011) revealed that the installation of wind farms had no observable effect on populations or
distributions of breeding Golden Plover up to three years after the completion and operation of
turbines. Conversely, disturbance effects observed by Hötker et al. (Hötker et al. 2006) were found
in 72% of Golden Plover sites, though these data pertained to non-breeding birds only. This is
supported by a longitudinal study of British Golden Plover in the Pennines which revealed that,
though birds were disturbed often, reproductive performance did not fall (Finney et al. 2005).
Furthermore, post-construction monitoring at 15 upland wind farms showed no significant decline in
populations (Pearce-Higgins et al. 2012). Most disturbance effects were measured during the
construction phase of these projects. Thus, current research indicates that care be taken in the
planning of turbine height and with due diligence during construction of wind farms, especially when
positioned on habitat known to support breeding Golden Plovers.
4.9 Zone of Sensitivity
Avoidance of wind turbines and associated infrastructure by breeding Golden Plovers has been
observed at distances of at least 200 m (Pearce-Higgins et al. 2008; Finney et al. 2005), with strong
correlation between turbine height and disturbance displacement (Hötker et al. 2006). Previous
sensitivity mapping assessments have used no zone of sensitivity around Golden Plover habitat,
instead demarcating Special Protected Areas (SPAs), within which this species occurs, as an
indication of potential distribution. Additional to displacement, collision and barriers effects while
migrating for forage up to 10km from nesting sites (Pearce-Higgins & Yalden 2003), as well as
consideration of expert opinion, have resulted in the zone of sensitivity for this species being
assigned a radius of 800 m around known breeding sites. Though this exceeds smaller recommended
distances, the assigned radius allows for ranging around point locations and accounts for increased
disturbance. In addition, Irish breeding populations of waders are at greater threat generally through
habitat loss and disturbance.
4.10 Data sources
Data for this assessment was obtained from the Upland Bird Survey (Cummins et al. 2004; Cummins
et al. 2003), the Resurvey of breeding wader populations of machair and associated wet grasslands
in north-west Ireland, as commissioned by the National Parks and Wildlife Service (Suddaby et al.
2010)and the Irish Wetland Bird Survey (Boland & Crowe 2012).
Bird Sensitivity Mapping to Wind Energy Development - Guidance Document
43
BirdLife International, 2004. Birds in the European Union: a status assessment, Wageningen, The Netherlands.
BirdLife International, 2012. Pluvialis apricaria. The IUCN Red List of Threatened Species. Version 2014.2. Available at: www.iucnredlist.org.
Boland, H. & Crowe, O., 2012. Irish Wetland Bird Survey: Waterbird Status and Distribution 2001/02 - 2008/09, Kilcoole, Wicklow.
Boobyer, G., 1992. Population trends of the Golden Plover Pluvialis apricaria in Britain, Peterborough, United Kingdom.
Colhoun, K. & Cummins, S., 2013. Birds of Conservation Concern in Ireland 2014 – 2019. Irish Birds, 9(4), pp.523–544.
Cummins, S., Corbishley, H. & Newton, S., 2003. Upland Bird Survey Report 2003, Sligo, Leitrim, Cavan & north Mayo. BirdWatch Ireland Conservation Report No. 03/3, Kilcoole, Wicklow.
Cummins, S., Swann, M. & Newton, S., 2004. Upland Bird Survey Report 2004, County Mayo & Connemara (west Galway). BirdWatch Ireland Conservation Report No. 04/7, Kilcoole, Wicklow.
Douglas, D.J.T., Bellamy, P.E. & Pearce‐Higgins, J.W., 2011. Changes in the abundance and distribution of upland breeding birds at an operational wind farm. Bird Study, 58(1), pp.37–43.
European Commission, 2011. Wind energy developments and Natura 2000, Luxembourg.
Finney, S.., Pearce-Higgins, J.. & Yalden, D.., 2005. The effect of recreational disturbance on an upland breeding bird, the golden plover Pluvialis apricaria. Biological Conservation, 121(1), pp.53–63.
Hötker, H., Thomsen, K.-M. & Jeromin, H., 2006. Impacts on biodiversity of exploitation of renewable energy sources: the example of birds and bats - facts, gaps in knowledge, demands for further research, and ornithological guidelines for the development of renewable energy exploitation, Bergenhusen, Germany.
Lauder, C. & Donaghy, A., 2008. Breeding Waders in Ireland 2008: A Review and Recommendations for Future Actions. A report to the National Parks and Wildlife Service, Kilcoole, Wicklow.
Lynas, P., Newton, S.. & Robinson, J.., 2007. The status of birds in Ireland: an analysis of conservation concern 2008-2013. Irish Birds, 8, pp.149 – 167.
Madden, B. et al., 1998. Breeding waders of machair systems in Ireland in 1996. Irish Birds, 6, pp.177–190.
Parr, R., 1993. Nest predation and numbers of Golden Plovers Pluvialis apricaria and other moorland waders. Bird Study, 40(3), pp.223–231.
Pearce-Higgins, J.W. et al., 2008. Assessing the cumulative impacts of wind farms on peatland birds : a case study of golden plover Pluvialis apricaria in Scotland. Mires and Peat, 4, pp.1–13.
Pearce-Higgins, J.W. et al., 2012. Greater impacts of wind farms on bird populations during construction than subsequent operation: results of a multi-site and multi-species analysis. Journal of Applied Ecology, 49(2), pp.386–394.
Pearce-Higgins, J.W. et al., 2009. The distribution of breeding birds around upland wind farms. Journal of Applied Ecology, pp.1323–1331.
Pearce-Higgins, J.W. & Yalden, D.W., 2003. Variation in the use of pasture by breeding European Golden Plovers Pluvialis apricaria in relation to prey availability. Ibis, 145(3), pp.365–381.
Sandercock, K., 2003. • Bulletin April. Wader Study Group Bulletin, 100, pp.163–174.

Bird Sensitivity Mapping to Wind Energy Development - Guidance Document
44
Snow, D.W. & Perrins, C.M., 1998. The Birds of the Western Palearctic Vol. 1: Non-passerines, Oxford, UK: Oxford University Press.
Suddaby, D., Nelson, T. & Veldman, J., 2010. Resurvey of breeding wader populations of machair and associated wet grasslands in north-west Ireland. Irish Wildlife Manuals, No. 44, Dublin, Ireland.
Tucker, G.M. & Heath, M., 1994. Birds in Europe: their conservation status, Cambridge, United Kingdom: BirdLife International.
Whittingham, M.J., Percival, S.M. & Brown, A.F., 2001. Habitat selection by golden plover Pluvialis apricaria chicks. Basic and Applied Ecology, 2(2), pp.177–191.
Bird Sensitivity Mapping to Wind Energy Development - Guidance Document
45
5 Redshank (Tringa totanus) - Breeding
5.1 Characteristics
The Redshank is a conspicuous wader which, as the name suggests, possesses bright red legs.
Generally mouse brown in colour combined with dark streaking, this bird has a long bill for its size
which is straight with a reddish base, while its legs are relatively long. This species is a common
wader of wetlands throughout the country, though mainly occurs in coastal estuaries in winter
where it can be present in quite large numbers.
5.2 Range in Ireland
The Redshank has an extremely large global range, of which Europe constitute over 50% (BirdLife
International 2004). In Ireland, this species is a resident breeder, with numbers bolstered in winter
by visitors from Iceland and passage migrants (birds on passage from Scandinavia/the Baltic
breeding areas to West African wintering areas). Its breeding range extends across suitable habitat
of the midlands (especially the Shannon Callows) and northern half of the country. This species also
breeds in selected coastal areas, notably in areas of coastal machair, especially that of islands off the
west coast (Suddaby et al. 2010). Key historical areas of this machair in Co. Sligo have, however,
been lost from its distribution of late. Overall the range of this species in Ireland has halved in the
past 40 years (Balmer et al. 2013) and it is now only known to breed in significant numbers in
isolated areas of coastal Mayo and Donegal and the Shannon Callows (Boland & Crowe 2012;
Suddaby et al. 2010).
5.3 Conservation status
Though a common bird on Irish coasts during the winter, the Redshank is currently Red-listed in
Ireland, due to its small and declining breeding population (Colhoun & Cummins 2013). Similarly,
the European population of this species has been evaluated as Declining, due to a moderate
continuing decline, despite the stability of several key populations in Russia and Scandinavia
(BirdLife International 2004). Given its expansive international distribution, the Redshank has also
been assessed as Least Concern by the IUCN (BirdLife International 2013).
5.4 Population trend
Aggregate EU populations of Redshank are thought to have decline by over 10% in the period 1990-
2000. The UK population of this species has exhibited a 2% decrease over the past 25 years (1985/86
– 2010/11) and, more concerning, a 24% decrease in the most recent 10 years of survey (2000/11 –
2010/11) (Austin et al. 2014). This represents the lowest number in over 25 years of survey.
Currently, Irish estimates of breeding populations of Redshank reflect these EU and UK declines,
lying at 500 pairs (Lauder & Donaghy 2008) and making this species the second least numerous
breeding wader in Ireland, after the Dunlin. Though there have been localised increases in breeding
populations in Ireland (such as those of Inishkea North which have increased by 36% since 1996
(Suddaby et al. 2010)), this breeding population is estimated to have declined by 88% since 1993
(Lauder & Donaghy 2008). The highest numbers of this species occur during early autumn, when
there is an overlap of breeding populations, wintering populations and passage migrants. Indeed,
there has been a 2.3% annual increase in non-breeding population between 1994/95 & 2003/04
(Crowe et al. 2008). The annual adult survival of Redshanks is circa. 74% (Insley et al. 1997).
Bird Sensitivity Mapping to Wind Energy Development - Guidance Document
46
5.5 Breeding ecology
The Redshank is a ground-nesting wader, predominantly nesting in grassy tussocks of grass marshes,
river valleys, coastal marshes and heathland, where they lie concealed within tussocks until
incubation is complete (Nairn et al. 2004). Machair is also considered an increasingly important
breeding habitat for this species in Ireland (Suddaby et al. 2010). Adults will often keep guard at
nesting sites, standing on fence posts or high rocks (Nairn et al. 2004). A single clutch is laid annually
between mid-April and early June, consisting of usually 4 eggs which are incubated for around 24
days (Joys & Crick 2004). Juvenile survival following fledging has been measured at 43% (Insley et al.
1997). Recent declines in the breeding success of Redshanks in Scotland have, in some areas, been
attributed to hedgehog depredation on eggs (Jackson 2001). Depredation on eggs by mammals in
Ireland may similarly be limiting population recovery. Consequently, exclusion of potential
mammalian predators by erecting fencing has been shown to improve the breeding success of this
and other species of breeding wader (Jackson 2001; Ausden et al. 2009; Ausden et al. 2011).
Further, trampling by grazing livestock has also been implicated in Redshank breeding declines
elsewhere (Norris et al. 1997).
5.6 Habitat requirements
The breeding population of this species is usually found on coastal marshes, inland wet grasslands,
grassy marshes and swampy heathland (Snow & Perrins 1998). Additionally, in Ireland machair
grassland is now considered important breeding habitat for this species (Suddaby et al. 2010). It is
though that the absence of Redshank from otherwise suitable bog habitat in Ireland is due to a
scarcity of forage (Nairn et al. 2004). While breeding, the diet of this species consists of spiders,
insects and annelid worms (Snow & Perrins 1998). Redshanks detect prey visually and feed mostly
during the day in preferred breeding habitat, while the selection of feeding sites has been found to
vary with age. In overwintering populations, younger birds are often excluded from preferred
habitat, potentially affecting exposure to predators (Cresswell 1994). The intensity of grazing on
suitable coastal pastures and areas containing suitable vegetation (such as sea couch grass Elytrigia
atherica) may also affect breeding densities. It is thought that higher grazing leads to more
heterogeneous vegetation which supports denser breeding (Norris et al. 1997), though a greater
risk of trampling could then be introduced.
5.7 Site fidelity
Redshanks exhibit strong natal philopatry (tendency to return to breeding site at which an individual
was born) and reduced natal dispersal (movement from place of birth to site of first breeding)
(Thompson & Hale 1989). Additionally, the fidelity to breeding sites was also shown to be closely
correlated with years of breeding experience (Thompson & Hale 1989). The number of years spent
breeding in the same location was also strongly related to breeding success at these sites.
Consequently, it may be taken that areas of breeding range expansion are more flexible in terms of
potential disturbance, though if successful breeding is staged at these sites, perturbations to
breeding through disturbance have an increasing impact of breeding population value with time. In
other words, more established breeding sites in Ireland may have significantly more to lose than
more recent sites.
5.8 Sensitivity to development of wind energy
In general, breeding waders were identified by an EU assessment of wind energy impacts as being
particularly susceptible to disturbance displacement and barriers to movement (European
Bird Sensitivity Mapping to Wind Energy Development - Guidance Document
47
Commission 2011). Given the high site fidelity of Redshanks (Thompson & Hale 1989) disturbance to
breeding sites is likely to affect breeding success. Furthermore, the continually decreasing
availability of suitable habitat for this species (Suddaby et al. 2010; Lauder & Donaghy 2008),
particularly machair, makes any impacts on remaining habitat concerning. Specific to infrastructure
associated with wind energy, negative effects on the density of breeding Redshanks were observed
within 200 m of operational turbines, even though changes in agricultural land-use post-construction
may have rendered areas around the base of turbines more favourable for Redshank (Langston &
Pullan 2003). Conversely, a study on similar disturbance effects around Dutch wind farms
(Winkelman 1992) found no effect on Redshank populations. It was thought that this species is so
long-lived and faithful to breeding sites that disturbance effects are lower. Similarly, though in other
studies a strong response of this species to recreational disturbance was recorded at 1km (Yalden &
Yalden 1989), this did not have an effect on breeding densities until much closer to wind energy
infrastructure and may be compensated for by the aforementioned changes in land use. A meta-
analysis of wind energy studies revealed that the minimum distance this species was recorded in
relation to turbines was a mean of 183 m (Hötker et al. 2006). It was further found that Redshanks
were less affected by smaller wind turbines than by taller installations. In this study, there was a
strong correlation found between increased wind turbine height and observed minimum distance to
these (Hötker et al. 2006). For Redshanks, collisions with operational turbines were not numerous,
especially in relation to other at-risk species such as Terns and Gulls (Hötker et al. 2006; Everaert
2002; Percival 2003). In some cases, this was estimated at 0.7 collisions per turbine annually, a figure
much lower than other exposed species (Percival 2003).
5.9 Zone of Sensitivity
Following consultation with breeding wader species experts and referral to existing research, the
zone of sensitivity for this species has been assigned a radius of 800 m surrounding point locations of
known breeding sites. This allows for the low levels of natal and breeding dispersal of Redshanks
(Thompson & Hale 1989) within its extremely limited range in Ireland, despite the greater tolerance
of this species to disturbance in comparison to other breeding waders (Pearce-Higgins et al. 2009). In
addition, Irish breeding populations of waders are at greater threat generally through habitat loss
and disturbance.
5.10 Data sources
Data for this assessment were obtained from the Irish Wetland Bird Survey (Boland & Crowe 2012),
the Resurvey of breeding wader populations of machair and associated wet grasslands in north-west
Ireland, as commissioned by the National Parks and Wildlife Service (Suddaby et al. 2010) and the
All-Ireland Breeding Wader Survey (unpublished data, 2013).
Ausden, M. et al., 2009. Predation of breeding waders on lowland wet grassland – is it a problem? British Wildlife, 21(1).
Ausden, M., Hirons, G. & Kennerley, R., 2011. Using anti-predator fences to increase wader productivity. Conservation Land Management, 9(3).
Austin, G.E. et al., 2014. Waterbirds in the UK 2011/12. The Wetland Bird Survey, Thetford, United Kingdom.
Balmer, D. et al., 2013. Bird Atlas 2007-11, the breeding and wintering birds of Britian and Ireland,
Bird Sensitivity Mapping to Wind Energy Development - Guidance Document
48
BirdLife International, 2004. Birds in the European Union: a status assessment, Wageningen, The Netherlands.
BirdLife International, 2013. Tringa totanus. The IUCN Red List of Threatened Species. Version 2014.2. Available at: www.iucnredlist.org [Accessed September 4, 2014].
Boland, H. & Crowe, O., 2012. Irish Wetland Bird Survey: Waterbird Status and Distribution 2001/02 - 2008/09, Kilcoole, Wicklow.
Colhoun, K. & Cummins, S., 2013. Birds of Conservation Concern in Ireland 2014 – 2019. Irish Birds, 9(4), pp.523–544.
Cresswell, W., 1994. Age-Dependent Choice of Redshank (Tringa totanus) Feeding Location: Profitability or Risk? Journal of Animal Ecology, 63(3), pp.589–600.
Crowe, O. et al., 2008. Estimates and trends of waterbird numbers wintering in Ireland , 1994 / 95 to 2003 / 04. , pp.66–77.
European Commission, 2011. Wind energy developments and Natura 2000, Luxembourg.
Everaert, J., 2002. Windturbines en vogels in Vlaanderen : voorlopige onderzoeksresultaten en aanbevelingen. Natuur Oriolus, 69(4), pp.145–155.
Hötker, H., Thomsen, K.-M. & Jeromin, H., 2006. Impacts on biodiversity of exploitation of renewable energy sources: the example of birds and bats - facts, gaps in knowledge, demands for further research, and ornithological guidelines for the development of renewable energy exploitation, Bergenhusen, Germany.
Insley, H. et al., 1997. Survival rates of Redshank Tringa totanus wintering on the Moray Firth. Bird Study, 44(3), pp.277–289.
Jackson, D.B., 2001. Experimental removal of introduced hedgehogs improves wader nest success in the Western Isles, Scotland. Journal of Applied Ecology, 38(4), pp.802–812.
Joys, A.C. & Crick, H.Q.P., 2004. Breeding periods for selected bird species in England, Thetford, United Kingdom.
Langston, R.H.W. & Pullan, J., 2003. Windfarms and Birds : An analysis of the effects of windfarms on birds , and guidance on environmental assessment criteria and site selection issues,
Lauder, C. & Donaghy, A., 2008. Breeding Waders in Ireland 2008: A Review and Recommendations for Future Actions. A report to the National Parks and Wildlife Service, Kilcoole, Wicklow.
Nairn, R.G.W., Madden, B. & Partridge, J.K., 2004. Redshank Tringa totanus breeding on bogs in Ireland. Irish Birds, 7(3).
Norris, K. et al., 1997. The density of redshank Tringa totanus breeding on the salt-marshes of the Wash in relation to habitat and its grazing management. Journal of Applied Ecology, 34(4), pp.999–1013.
Pearce-Higgins, J.W. et al., 2009. The distribution of breeding birds around upland wind farms. Journal of Applied Ecology, pp.1323–1331.
Percival, S.M., 2003. BIRDS AND WIND FARMS IN IRELAND : A REVIEW OF POTENTIAL ISSUES AND IMPACT ASSESSMENT. , (December).
Snow, D.W. & Perrins, C.M., 1998. The Birds of the Western Palearctic Vol. 1: Non-passerines, Oxford, UK: Oxford University Press.
Suddaby, D., Nelson, T. & Veldman, J., 2010. Resurvey of breeding wader populations of machair and associated wet grasslands in north-west Ireland. Irish Wildlife Manuals, No. 44, Dublin, Ireland.

Bird Sensitivity Mapping to Wind Energy Development - Guidance Document
49
Thompson, P.S. & Hale, W.G., 1989. Breeding site fidelity and natal philopatry in the Redshank Tringa totanus. Ibis, 131(2), pp.214–224.
Winkelman, J.E., 1992. The Impact of the SEP Wind Park near Oosterbierum (Fr.), the Netherlands, on Birds, Vol. 1: Collision Victims [in Dutch]. RIN-report 92/2, Arnhem, Netherlands.
Yalden, D.. & Yalden, P.E., 1989. The sensitivity of breeding Golden Plovers Pluvialis apricaria to human intruders. Bird Study, 36, pp.49–55.
Bird Sensitivity Mapping to Wind Energy Development - Guidance Document
50
6 Hen Harrier (Circus cyaneus)
6.1 Characteristics
The Hen Harrier is a medium sized raptor with long wings and tail. It possesses a hooked bill suitable
for eating meat, like all raptors, and usually flies close to the ground with its wings held in a shallow
‘V’ above its back. Males are generally smaller than females while male and female adult plumage
varies considerably. Adult males are blue-grey above and on the head and breast and white below.
Additionally, males have broad black wing tips to both upper and lower wings and show white
upper-wing coverts like female birds. Female birds are largely brown with fine markings and have
white upper-wing coverts. The female tail is barred with dark bands and the body is streaked brown
on a whitish background, especially on the breast. Juvenile birds resemble females but have darker
secondary flight feathers, a rusty colour to the breast and less barring. This species is most similar to
the Marsh Harrier (Circus aeruginosus).
6.2 Range in Ireland
The Hen Harrier has an extremely large range globally, stretching across the majority of the
Palearctic from eastern Siberia to Ireland and south as far as North Africa and South East Asia
(BirdLife International 2014). In Ireland, however, this species is a scarce summer visitor to uplands
and bogs in western Ireland, as well as a scarce winter visitor to lowlands throughout Ireland. The
predominance of this species distribution is found in Munster (notably the counties of Cork, Limerick
and Kerry), southwest Leinster and the border counties, while more scarce winter roosts are mainly
located in coastal regions of the south and east (Irwin et al. 2011).
6.3 Conservation status
The Hen Harrier is currently Amber-listed in Ireland due to a decline in the breeding population and
continued persecution (Colhoun & Cummins 2013). Similarly, the UK population has been Red-listed
(Hayhow et al. 2014). The European population of this species has been evaluated as Depleted due
to a large historical decline and relatively low current population (less than 59,000 pairs). Though
this decline has slowed in recent years, its population remains significantly lower than pre-decline
assessments (BirdLife International 2004). This species is also listed under Annex I of the EC Council
Directive on the Conservation of Wild Birds (2009/147/EC), with several Special Protection Areas
(SPAs) designated for directed Hen Harrier protection. Internationally, the Hen Harrier is considered
to be of Least Concern, owing to its extremely wide distribution despite recent taxonomic splits
(BirdLife International 2014).
6.4 Population trend
Though the population of this species has stabilised in most of its European distribution since 2000
(BirdLife International 2004), it was once almost extinct in the wild in Britain and Ireland as a result
of persecution (Watson 1977). This was followed by a large decline across it European distribution
between 1970 and 1990 (BirdLife International 2004). There are currently an estimated 128 – 172
pairs in the Republic of Ireland (Ruddock et al. 2011) with a further 59 in Northern Ireland (Hayhow
et al. 2013). Although, this figure represents an increase from a maximum of 129 pairs in 1998-2000
(Norris et al. 2002), substantial differences in surveying effort are thought to confound these
estimates as more recent subsampling across surveys has revealed declines in some regions,
particularly within several SPAs (J. Lusby pers. comm., 17th Apr. 2015). The UK and Isle of Man
Bird Sensitivity Mapping to Wind Energy Development - Guidance Document
51
population of this species is estimated to have experienced an 18% decrease since 2004, with
notable decreases in Scotland and the Isle of Man, likely as a result of habitat change and
persecution (Hayhow et al. 2013). Changes to preferred uplands through afforestation and
agricultural intensification (and particularly the availability of habitat and food) likely continue to
threaten populations of this species (Irwin et al. 2011). It is thought that the carrying capacity of this
species’ breeding range is the most prominent limitation to current population levels (Norris et al.
2002).
6.5 Breeding ecology
Breeding Hen Harriers are confined to moorland and young forestry plantations, where they nest on
the ground. In the spring, Hen Harrier pairs lay 1 - 6 eggs (Irwin et al. 2011). These are incubated for
34 days and fledge after an additional 37-42 days post-hatching, most of which has occurred by
August (Irwin et al. 2011). Following this, individuals predominantly disperse to milder lowland and
coastal areas for the winter, although some remain in upland breeding areas (Irwin et al. 2011). Pairs
remain monogamous for the duration of breeding, apart from rare recordings of polygynous pairs
(Scott 2010; Picozzi 1984). Adult survival is high in this species, at 0.81 annually. However, a
longitudinal breeding biology report revealed that fledging success of Irish Hen Harriers, at 2.4 chicks
per successful breeding attempt, was lower than that of UK populations (Irwin et al. 2011). Though
low, this is still regarded as being higher than the minimum effective replacement rate for this
species.
6.6 Habitat requirements
Hen Harriers mainly hunt over moorland during the breeding season where they take ground nesting
birds and mammals, which are caught by surprise using cover such as woodland edges and bushes.
In particular, unmanaged grassland has been identified as important habitat for Hen Harrier feeding
(Amar & Redpath 2005; Wilson et al. 2009). In general, Irish observations suggest that areas
containing higher proportions of improved grassland are avoided (Wilson et al. 2009). Despite this
and the assumed preference for open or younger-growth forestry, more recent assessments
suggests that Hen Harrier feeding and breeding has been adapted to utilise older-growth forestry
where necessary (Wilson et al. 2009). Time spent feeding differed between male and female birds
and was significantly determined by vegetation height and proportion of managed grassland within a
territory (Amar & Redpath 2005). It was thought that intensive sheep grazing, associated losses of
heather (Calluna vulgaris) with increases in improved pasture and reductions on sward height have
resulted in a contraction in suitable Hen Harrier feeding habitat.
6.7 Site fidelity
Though Hen Harriers may exhibit strong site fidelity, it is thought that persecution and continually
changing forestry patterns may be reducing habitat predictability across breeding seasons and
forcing more dispersed annual breeding. Whitfield and Fielding (2009) ‒ in a study of Welsh Hen
Harrier dispersal ‒ found natal philopatry (the tendency to breed in a bird’s place of birth) to be low,
with average natal dispersal of 18.4 km for females and 12.1 km for males. The direction of this
dispersal seemed universally towards areas of more suitable habitat. However, dispersal between
breeding seasons exhibited much lower distances, with females dispersing significantly less than
males and often breeding at the same site in consecutive years (Whitfield & Fielding 2009). Other
observations have found that failed breeding attempts drive more distant breeding dispersal in
subsequent years (Picozzi 1984).

Bird Sensitivity Mapping to Wind Energy Development - Guidance Document
52
6.8 Sensitivity to development of wind energy
In general, highly sensitive raptors (such as Hen Harriers) are regarded as being threatened by wind
energy development through disturbance displacement and collision (Langston & Pullan 2003).
However, limited research exists on the direct effects of wind energy infrastructure on populations
of this species, particularly in an Irish context. In terms of collision, the common flight height of Hen
Harriers while feeding has been measured at a mean of 10-20 m above the ground, largely ruling out
the possibility of collision with active turbines. One study revealed that between 60 – 80% of a Hen
Harrier’s flight was less than 2 m (Whitfield & Madders 2006). This species may be at greater risk,
however, during display flights and inexperienced fledgling flight (Madders 2004). A recent
assessment of the effects of a wind farm on an existing population of breeding Hen Harriers
reported regular flights at close proximity to turbine bases, some of which were at rotor height
(Madden & Porter 2007). This same report revealed that, although reductions in flight activity
around turbines were observed during the construction phase, the activity of bird populations
quickly returned to pre-construction levels. Aside from collision risk, turbine avoidance by Hen
Harriers observed at one wind farm installation extended to within 250 m of turbines (Pearce-
Higgins et al. 2009). Though this study found a halving of flight activity within 500 m of a wind energy
array, it found no significant modification in flight height near turbines, although this study also
predicted a 52% reduction in breeding population within 500 m of a wind energy array. Madden and
Porter thus posit that Hen Harriers will continue to use wind farm sites post-construction, at least in
the short-term (Madden & Porter 2007). Further, a recent assessment of Scottish bird populations
and their sensitivity to wind energy development found that over 10% of estimated Hen Harrier
range already overlaps with existing wind energy installations (Bright et al. 2008). Having said this, in
an Irish context, concern has been expressed surrounding the wide ranging behaviour of Hen
Harriers, potentially resulting in overlap of more than one wind farm (Percival 2003).
6.9 Zone of Sensitivity
Within Scottish SPAs, Male harriers travel up to 9km from nesting sites, though home-range size was
estimated as 8km2 compared to female home-range of 4.5km2. Despite this, most hunting by males
and females was carried out within 2 and 1km from nests, respectively (Arroyo et al. 2014). From
engagement with Irish Hen Harrier experts, observations have shown breeding home ranges up to a
radius of 12-15km (O’Donoghue, unpublished satellite tracking data). Across various studies (Clarke
et al. 1997; Watson 1977) these Irish ranges are not assumed to be either constant or circular in
nature. Therefore, imposing very large circular zones of sensitivity around wintering roosts or
breeding locations may devalue such protection measures, especially given that most activity is
believed to occur within a central “core” area. Previous sensitivity mapping projects in relation to
bird populations have imposed a buffer of 2 km around known Hen Harrier breeding sites (Bright et
al. 2009). Further, a safe working distance from nesting Hen Harriers has been delineated at 500 –
1000 m by the Forestry Commission of Scotland (Forestry Commission Scotland 2006).
Consequently, a conservative zone of sensitivity of 2km has been delineated around the summer
breeding point locations of this species. However, given the sensitive nature of these roost locations,
these have been obscured through the random offsetting of an expanded zone of sensitivity,
following the protocol outlined in Appendix 3 of this document.
Bird Sensitivity Mapping to Wind Energy Development - Guidance Document
53
6.10 Data sources
Data for this assessment has been obtained from the results of extensive national Hen Harrier
surveys conducted every 4-5 years in conjunction with the National Parks and Wildlife Service, the
most recent of which was conducted in 2010 (Ruddock et al. 2011).
Amar, A. & Redpath, S.M., 2005. Habitat use by Hen Harriers Circus cyaneus on Orkney: implications of land-use change for this. pp.37–47.
Arroyo, B. et al., 2014. Ranging behaviour of Hen Harriers breeding in Special Protection Areas in Scotland. Bird Study, 61(1), pp.48–55.
BirdLife International, 2004. Birds in the European Union: a status assessment, Wageningen, The Netherlands.
BirdLife International, 2014. Species Factsheet: Circus cyaneus. Available at: http://www.birdlife.org [Accessed October 20, 2014].
Bright, J. et al., 2008. Map of bird sensitivities to wind farms in Scotland: A tool to aid planning and conservation. Biological Conservation, 141(9), pp.2342–2356.
Bright, J.A. et al., 2009. Mapped and written guidance in relation to birds and onshore wind energy development in England,
Clarke, R., Combridge, M. & Combridge, P., 1997. A comparison of the feeding ecology of wintering Hen Harriers Circus cyaneus centred on two heathland areas in England. Ibis, 139(1), pp.4–18.
Colhoun, K. & Cummins, S., 2013. Birds of Conservation Concern in Ireland 2014 – 2019. Irish Birds, 9(4), pp.523–544.
Forestry Commission Scotland, 2006. Forest operations and birds in Scottish forests - the law and good practice, Edinburgh, Scotland.
Hayhow, D.B. et al., 2014. The state of the UK’s birds 2014, Sandy, Bedfordshire.
Hayhow, D.B. et al., 2013. The status of the Hen Harrier, Circus cyaneus , in the UK and Isle of Man in 2010. Bird Study, 60(4), pp.446–458.
Irwin, S. et al., 2011. The breeding biology of Hen Harriers Circus Cyaneus in Ireland over a five year period. Irish Birds, 9(2), pp.165 – 172.
Langston, R.H.W. & Pullan, J., 2003. Windfarms and Birds : An analysis of the effects of windfarms on birds , and guidance on environmental assessment criteria and site selection issues, RSPB/BirdLife.
Madden, N. & Porter, B., 2007. Do wind turbines displace Hen Harriers Circus cyaneus from foraging habitat? Preliminary results of a case study at the Derrybrien Wind Farm, County Galway. Irish Birds, 8(2), pp.231–236.
Madders, 2004. The ecology of Hen Harriers in Scotland in relation to windfarms,
Norris, J., McMahon, D. & Oliver, G.A., 2002. A national survey of breeding Hen Harriers Circus cyaneus in Ireland 1998-2000. Irish Birds, 7(1), pp.1–12.
Pearce-Higgins, J.W. et al., 2009. The distribution of breeding birds around upland wind farms. Journal of Applied Ecology, pp.1323–1331.
Percival, S.M., 2003. Birds and Wind Farms in Ireland: A Review of Potential Issues and Impact Assessment. , (December).
Bird Sensitivity Mapping to Wind Energy Development - Guidance Document
54
Picozzi, N., 1984. Biology of polygynous Hen Harriers Circus cyaneus in biology Breeding. , 15(1), pp.1–10.
Ruddock, M. et al., 2011. Republic of Ireland Hen Harrier Survey, 2010, Dublin, Ireland.
Scott, D., 2010. Two females and one male, but only a single ground nest: an unusual case of polygyny by Hen Harriers Circus cyaneus in County Down. Irish Birds, 9(1), pp.119–121.
Watson, D., 1977. Harrier, Berkhamsted, Hertfordshire, UK: T and A.D. Poyser.
Whitfield, D.P. & Fielding, A.H., 2009. Hen harrier population studies in Wales. CCW Contract Science Report No: 879, Bangor, Wales.
Whitfield, D.P. & Madders, M., 2006. Flight Height in the Hen Harrier Circus Cyaneus and its Incorporation in Wind Turbine Collision Risk Modelling. Natural Research Information Note 2, Banchory, Aberdeenshire.
Wilson, M.W. et al., 2009. The importance of pre-thicket conifer plantations for nesting Hen Harriers Circus cyaneus in Ireland. Ibis, 151(2), pp.332–343.
Bird Sensitivity Mapping to Wind Energy Development - Guidance Document
55
7 Barn Owl (Tyto alba)
7.1 Characteristics
The Barn Owl (Tyto alba) is a characteristic farmland bird and is one of three species of owl found in
Ireland. The Long-eared Owl (Asio otus) is the other resident species with the Short-eared Owl (Asio
flammeus) a migrant winter visitor and occasional breeder (O’Connell et al. 2006). The Barn Owl is
predominantly nocturnal in Ireland. Their plumage is a ghostly white, with no markings on the
underwing and dark eyes. They have a mixture of buff and grey on the conspicuously-shaped face,
back and upper wings.
7.2 Range in Ireland
There are concerns for the conservation status of Barn Owls in Ireland due to extensive declines in
their breeding range and numbers observed over recent decades. Although The Breeding Birds Atlas
(2007-2011) coincided with increased monitoring efforts, a decline of 52% since the original
Breeding Birds Atlas of Britain and Ireland (1968 – 1972) suggests that actual losses over this 40 year
period may be more substantial (Balmer et al. 2013; Sharrock 1976). The specific factors which
impact the status and trends of Barn Owls in Ireland, and which have brought about these
widespread declines, are not fully understood. The population in Ireland is unlikely to be limited by
the availability of suitable nest sites to the same extent as has been previously recorded in Britain
and in other parts of its range (Lusby & O’Clery 2012; O’Clery et al. 2012; Petty et al. 1994; Taylor
1994). The intensification of agriculture, particularly the reduction of prey rich foraging habitat, and
the increased use of second generation anticoagulant rodenticides are known to impact Barn Owl
populations elsewhere in their range and have been widely implicated as the most influential drivers
of this species’ decline in Ireland. Several European studies have also linked the increase in major
road networks to Barn Owl population declines. The Irish Barn Owl population is still widespread,
however, with the south-west being its main stronghold.
7.3 Conservation status
The Barn Owl is protected under the Wildlife Act, 1976-2000, as amended (Republic of Ireland). They
are a Red-listed Species in BoCCI (Bird of Conservation Concern in Ireland) (Colhoun & Cummins
2013) due to a decline of over 50% in their population during the past 25 years. Further, they are
listed as a Species of European Conservation Concern (SPEC3) having an unfavourable conservation
status in Europe. As such, the European population is currently evaluated as Declining (BirdLife
International 2004). Internationally, however, this species is listed as Least Concern by the IUCN,
owing to its extremely wide range (BirdLife International 2012).
7.4 Population trend
Within its European range, the Barn Owl has experienced a moderate decline in numbers between
1970 and 1990 (BirdLife International 2004). Since then there has been a recorded stabilisation in
most of its European distribution (between 1990 and 2000), though declines in several key
strongholds have maintained its declining status (BirdLife International 2004). In the UK, a moderate
improvement in breeding numbers has been recorded of late, displaying an increase from 3,480 in
1997 (Toms et al. 2001) to an estimated 6,000 in 2009 (Shawyer 2009). In Ireland, a partial Barn Owl
survey conducted between 1995 and 1997 by National Parks and Wildlife Service and BirdWatch
Ireland, which was updated between 2008 and 2013, highlights a short term decline of 66.6% in
Bird Sensitivity Mapping to Wind Energy Development - Guidance Document
56
active sites. Density specific survey work has produced a population estimate of between 400 – 500
pairs for the Republic of Ireland (BirdWatch Ireland, unpublished data). This low number is a result of
continued population decline for over a century, which has accelerated since the 1950s (O’Connell et
al. 2006). Drivers of this reduction are likely the aforementioned intensification of farming practices,
expanding road networks and the increased use of rodenticides in rural settings (Glue 1967; Newton
et al. 1990; O’Clery et al. 2012).
7.5 Breeding ecology
Barn Owls require a dry and secluded area for nesting (Shawyer 1998). Mature trees with hollow
cavities and purpose built nest boxes are used, however comprehensive monitoring has shown that
buildings, particularly ruined structures, are the dominant site type for the Irish Barn Owl population
(Lusby et al. 2009). In 2009, a total of 119 active nest and roost sites were assessed, of which 95%
were man-made structures. Ruined mansions, castles and ruined farmhouses were the most
abundant sites, with a wide diversity of other structures including mills, churches, priories, abbeys
and even occupied dwellings also recorded (Lusby et al. 2009; Lusby et al. 2010). An assessment of
specific nesting locations within a sample of 61 sites showed that chimneys were widely used, with
wall cavities and roof spaces also serving as common nesting locations (Lusby et al. 2009). On
average 4 – 6 relatively small and completely white eggs are laid in late April or early May, but
clutches of up to eight have been recorded at nests in Ireland. Incubation lasts 30 – 31 days, during
which time the female remains at the nest, with only brief excursions outside the nest site. Young
reach their maximum weight during their sixth week, and will start to make short and clumsy flights
from the nest at approximately 55 days. Once the owlet reaches 65 days it usually leaves the nest
site permanently, but may remain close by for some time. Breeding success is heavily dependent on
availability of prey and weather conditions. Breeding success rates recorded by the Raptor
Conservation Project have varied significantly between years, ranging from 91.5% to 33.6% of sites
successfully fledging young, though other studies have found juvenile survival to be lower (Saether
1989; Altwegg et al. 2003). Breeding success in general is thought to heavily depend on the
availability of suitable prey and fluctuations in environmental conditions (Altwegg et al. 2003).
7.6 Habitat requirements
In Ireland, Barn Owls are predominantly found in open farmland habitat at altitudes below 150 m.
The availability of prey rich foraging habitat is a primary factor which influences distribution and
breeding success, with rough grassland, grassy margins of field boundaries and woodland edge being
important (Shawyer 1998). The diet of this species spans a wide suite of small mammals, birds, frogs
and occasionally large beetles (O’Connell et al. 2006). Studies of Barn Owl pellets in two regions of
Ireland have found Bank Vole (Myodes glareolus), Field/Wood Mouse (Apodemus sylvaticus) and
Pygmy Shrew (Sorex minutus) to constitute the majority of its diet, with Common Rat (Rattus
norvegicus) and other small mammals additionally taken (Ronayne & Sleeman 2013; O’Connell et al.
2006). Though not a primary constituent of this species diet in Britain, the Bank Vole is thought to be
more important in Ireland due to the limited diversity of other small mammals and the continued
expansion of Bank Vole numbers from their introduction in the early 20th century (Lusby et al. 2008).
More recently, the Greater White-toothed Shrew has been recorded as an important prey item
within its expanding range (Tosh et al. 2008; McDevitt et al. 2014). Additionally, the effect of
rodenticides may be causing an aversion to preying upon commensal (domestic) rodents (Ronayne &
Sleeman 2013). Recent Irish observations have also found some depredation on bats, particularly on
the margins of flooded rivers (Sleeman & Kelleher 2008).
Bird Sensitivity Mapping to Wind Energy Development - Guidance Document
57
7.7 Site fidelity
Barn Owls are largely sedentary and generally faithful to specific sites. Detailed monitoring work has
revealed that traditional roost sites occupied by a single bird in any given year may also be
subsequently used as breeding sites in other years (Lusby et al. 2009; Lusby et al. 2010; Lusby et al.
2012). As such, any perturbation to nesting sites or suitable feeding habitat around these sites is
likely to have a disproportionately large effect on populations of this species.
7.8 Sensitivity to development of wind energy
In general, owls have been identified as being at particular risk of collision as a result of wind energy
development (Langston & Pullan 2003). Specifically, their large size and nocturnal or crepuscular
hunting behaviour puts them at greater risk of collision than other species (EURAPMON 2008).
However, hunting flight height is generally low, in the region of 2m. Partially as a consequence of
this, collision with vehicles on busy roads at night is an increasing threat to this species. In addition,
removal of suitable hunting habitat or secondary disturbances to prey species may also adversely
affect this species survival.
7.9 Zone of Sensitivity
Radio telemetry of adult Barn Owls (n = 13) during the breeding season between 2007 and 2009
revealed that the majority of foraging activity was generally confined to within a 5 km radius of
nesting sites. However, home range size in the non-breeding season for Barn Owls in Ireland is not
known. Other sensitivity mapping projects have identified an exclusion distance of at least 500 m
from owl nesting sites (Bordjan 2012). Further, a 100-250m zone of limited activity has been
recommended by the Forestry Commission of Scotland. Thus, the zone of sensitivity for this species
has been assigned as a radius of 2 km around the limited number of static known breeding sites.
Additionally, given the sensitive nature of roost locations, these have been obscured through the
random offsetting of an expanded zone of sensitivity, following the protocol outlined in Appendix 3
of this document.
7.10 Data sources
Data for this species assessment has been obtained through the Raptor Conservation Project of
BirdWatch Ireland.
Altwegg, R. et al., 2003. Variation and Covariation in Survival, Dispersal, and Population Size in Barn Owls Tyto alba. Journal of Animal Ecology, 72(3), pp.391–399.
Balmer, D. et al., 2013. Bird Atlas 2007-11, the breeding and wintering birds of Britian and Ireland,
BirdLife International, 2004. Birds in the European Union: a status assessment, Wageningen, The Netherlands.
BirdLife International, 2012. Tyto alba. The IUCN Red List of Threatened Species. Version 2014.2. Available at: www.iucnredlist.org [Accessed October 23, 2014].
Bordjan, D., 2012. K arta občutljivih območij za ptice za umeščanja vetrnih elektrarn v S loveniji.
Colhoun, K. & Cummins, S., 2013. Birds of Conservation Concern in Ireland 2014 – 2019. Irish Birds, 9(4), pp.523–544.
EURAPMON, 2008. Raptors: A field guide for surveys and monitoring,
Glue, D.E., 1967. Prey taken by the Barn Owl in England and Wales. Bird Study, 14(3), pp.169–183.
Bird Sensitivity Mapping to Wind Energy Development - Guidance Document
58
Langston, R.H.W. & Pullan, J., 2003. Windfarms and Birds : An analysis of the effects of windfarms on birds , and guidance on environmental assessment criteria and site selection issues, RSPB/BirdLife.
Lusby, J., Cregg, P. & O’Clery, M., 2012. The West Offaly Raptor Conservation Project; Final Report to Offaly Local Development Company.,
Lusby, J. & O’Clery, M., 2012. The ecology and conservation of the Barn Owl Tyto alba in County Kerry; Final Project report prepared for Kerry County Council.,
Lusby, J., Watson, D. & Copland, A., 2009. Barn Owl Research Project; 2009 Report. Unpublished Report by BirdWatch Ireland., Kilcoole, Wicklow.
Lusby, J., Watson, D. & Copland, A., 2010. The ecology and conservation of the Barn Owl Tyto alba in County Cork; The Cork Barn Owl Research Project. Report prepared for Cork County Council.,
Lusby, J., Watson, D. & O’Halloran, J., 2008. The ecology of the Barn Owl Tyto alba in Ireland, with special reference to two introduced small mammal species; the Bank Vole Myodes glareolus and the Greater White-toothed Shrew Crocidura rusula. Irish Birds, 8(3).
McDevitt, A.D. et al., 2014. Invading and Expanding: Range Dynamics and Ecological Consequences of the Greater White-Toothed Shrew (Crocidura russula) Invasion in Ireland. PLoS ONE, 9(6), p.e100403.
Newton, I., Wyllie, I. & Freestone, P., 1990. Rodenticides in British Barn Owls. Environmental Pollution, 68(1–2), pp.101–117.
O’Clery, M.O., McDonald, B. & Lusby, J., 2012. Duhallow Raptor Conservation Project, 2012,
O’Connell, P., Cogan, R. & Dunne, J., 2006. The diet of the Barn Owl Tyto alba at two sites in County Galway. Irish Birds, 8(1), pp.91–96.
Petty, S.J., Shaw, G. & Anderson, D.I.K., 1994. Value of nest boxes for population studies and conservation of owls in coniferous forests of Britain. Journal of Raptor Research, 28, pp.134–142.
Ronayne, S.T. & Sleeman, D.P., 2013. Analysis of Barn Owl Tyto alba pellets, with notes on the sexing of Pygmy Shrew Sorex minutus prey in Co. Cork. Irish Birds, 9(4), pp.635–636.
Saether, B.E., 1989. Survival Rates in relation to body weight in European birds. Ornis Scandinavica, 20(1), pp.13–21.
Sharrock, J.T.R., 1976. The Atlas of Breeding Birds in Britain and Ireland, Berkhamsted, Hertfordshire, UK: Poyser.
Shawyer, C.R., 1998. Barn Owl, Chelmsford, UK: Arlequin Press.
Shawyer, C.R., 2009. Barn Owl Conservation Network Symposium, Lambourn, UK.
Sleeman, D.P. & Kelleher, K.M., 2008. Barn Owl Tyto alba depredating Daubenton’s Bats Myotis daubentonii. Irish Birds, 8(3).
Taylor, I.R., 1994. Barn Owls: Predator–prey relationships and conservation, Cambridge, United Kingdom: Cambridge University Press.
Toms, M.P., Crick, H.Q.P. & Shawyer, C.R., 2001. The status of breeding Barn Owls Tyto alba in the United Kingdom 1995–97. Bird Study, 48(1), pp.23–37.
Tosh, D. et al., 2008. First record of Greater White-toothed Shrew Crocidura russula in Ireland. Mammal Review, 38, pp.321–326.
Bird Sensitivity Mapping to Wind Energy Development - Guidance Document
59
8 Common Tern (Sterna hirundo)
8.1 Characteristics
The Common Tern is a slender seabird with narrow, pointed wings, long forked tail and long, pointed
bill. This species is grey above and white below with a black cap to head. Adults have an orange-red
bill, usually with a small dark tip. It is very similar to the Arctic Tern (Sterna paradisaea) (with which
it breeds) and is best told apart by subtleties in its plumage and morphology. For example, the
Common Tern has longer legs and whiter underparts, while the Arctic Tern has a dark, blood red bill.
Further, Common Terns have shorter tail steamers, not extending beyond the wing tips. The flight of
this species is light and buoyant, hovering briefly over the water surface before plunge diving in. This
species is usually seen over the sea or over large inland lakes.
8.2 Range in Ireland
A migratory seabird, this species has a circumpolar distribution, breeding in temperate and subarctic
regions of Europe, North America and Asia. In Ireland it is present from March to October, wintering
thereafter in West and Southern Africa. Irish breeding colonies of this species are limited to the
islands of a few inland and coastal lakes and several important offshore islands. The most important
mainland breeding colonies are located at Lady’s Island Lake Co. Wexford, Loughs Mask, Conn and
Carra Co. Mayo, Lough Corrib Co. Galway, Lough Egish Co. Monaghan and Lough Derg in the
midlands. More than other species of tern present in Ireland, the Common Tern has a greater
propensity to nest inland (Mitchell et al. 2004). Having said this, the majority of its colonies, and the
bulk of the population, are located on coastal islands (Hannon et al. 1997).
8.3 Conservation status
The Common Tern is included on the Amber-list of Birds of Conservation Concern in Ireland due to
its localised breeding population (Colhoun & Cummins 2013). The European population of this
species has been evaluated as Secure as, despite fluctuations in some national populations, the
overall European population remains stable (BirdLife International 2004). This species is also listed
under Annex I of the EC Council Directive on the Conservation of Wild Birds (2009/147/EC) and, on a
global scale, the IUCN have listed this species as being of Least Concern (BirdLife International 2012).
8.4 Population trend
Ten years ago, the breeding population of Common Terns in Ireland was estimated at 2485 pairs
(Mitchell et al. 2004) but presently three colonies (Rockabill, Dublin Port and Lady’s Island lake
support in excess of 3000 pairs (BirdWatch Ireland and National Parks and Wildlife Service data).
Though the population has increased over the past 30 years, increasing threats through breeding
disturbance and depredation have adversely affected this species. For example, though this species
experienced a 21% reduction in the number of colonies from 1984 – 1995 (Hannon et al. 1997), the
number of pairs in this period marginally increased, suggesting a concentration of more birds at
fewer sites. With continued growth at the three abovementioned colonies, this factor has important
conservation implications.
8.5 Breeding ecology
Common Terns nest on the ground either in solitary pairs or, more usually, colonially from April to
October. Nests consist of a shallow depression on open ground near a vertical object to provide
shelter and a landmark for chicks (BirdLife International 2014). These are usually found on shingle
Bird Sensitivity Mapping to Wind Energy Development - Guidance Document
60
spits, low rocky islets and sand dunes, though nesting on flat rock surfaces (including artificial
concrete surfaces) has also been noted (Snow & Perrins 1998; BirdWatch Ireland 2011; Becker &
Ludwigs 2004). At inland sites, this species is also known to nest on islets of freshwater lakes. This
species lays a single brood annually, in clutches of 2-3 eggs which are incubated for 21-22 days.
Juvenile survival past the first year is very low (estimated at 0.47 (Becker & Ludwigs 2004)),
potentially owing to high predation by larger gulls with which they often establish colonies. Some
studies on Common Tern breeding suggest that pairs which hatch chicks earlier in the season
achieve greater fledgling success, likely as a result of increased kleptoparasitism (stealing of forage
food) by the other species at later stages in the breeding season (Arnold et al. 2004). Owing to
substantial conservation measures on coastal breeding colonies on the east coast – including the
provision of artificial nesting sites, reduction of predation pressures and installation of seasonal
fencing – numbers of terns within these colonies have grown markedly (BirdWatch Ireland 2011;
Merne 2004). These sites include Rockabill Island, Dublin Port, Kilcoole, Dalkey Island, Baltray and
Lady’s Island Lake.
8.6 Habitat requirements
This species requires relatively undisturbed areas of sand, shingle and rock. This is predominantly on
coastal islands, close to rich marine feeding grounds though. However, in comparison to other
species of tern found in Ireland, a significant part of the Common Tern’s occupied habitat is located
around islands on inland freshwater bodies (Hannon et al. 1997) where this species may feed on
freshwater fish, though this proportion still only accounts for about 2-3% of its present population
(S. Newton, pers. comm.). On mainland Europe (and increasingly with Irish populations) man made
infrastructure supports a growing proportion of breeders, particularly around riparian sites (Becker
& Ludwigs 2004). The diet of Common Terns is chiefly small fish and occasionally includes planktonic
crustaceans and insects, though chicks are exclusively fed on fish (Becker & Ludwigs 2004). In marine
habitats, these fish include Herring (Clupea harengus), Sprat (C. sprattus), sandeels (Ammodytes
marinus and A. tobianus) and Sticklebacks (Gasterosteus aculeatus). Freshwater species include
Roach (Rutilus rutilus), Bleak (Alburnus alburnus), Perch (Perca fluviatilis and P. flavescens), Ruffe
(Gymnocephalus cernua), Trout (Salmo trutta), Minnows (Phoxinus spp.) and Smelt (Osmerus
eperlanus).
8.7 Site fidelity
Common Terns exhibit strong site fidelity and return to the same nesting sites year after year
following migration. Further, with the use and increasingly recognised effectiveness of artificial
nesting structures and disturbance mitigation, the fidelity of this species to its current breeding
locations is likely to remain high.
8.8 Sensitivity to development of wind energy
Common Terns have previously been identified by a pan-European assessment of wind energy
potential as having “Evidence or indication of risk of impact” with wind turbines (European
Commission 2011). Further, it is felt that the proportion of their life strategy spent flying duly
increases their exposure to collision with turbines (Garthe & Hüppop 2004). A recent assessment of
wind energy installations in Belgium showed that 27% of Common Tern flight in the vicinity of
breeding colonies was at the rotor height of these turbines (16-50m), giving them a 1/911 chance of
collision (Everaert & Stienen 2007). This probability is substantially higher than other tern species
observed at the same site. Further, most fatalities occurred at turbines perpendicular to the flight
Bird Sensitivity Mapping to Wind Energy Development - Guidance Document
61
path of feeding terns. In this example, Common Terns were the most affected species, resulting in
the highest mortality in each of the 5 years for which records exist. This figure was estimated as
being 4.4% of the entire breeding colony. The number of collisions with these turbines was directly
related to the estimated colony size each year assessed (Everaert & Stienen 2007). Similar studies at
an Irish coastal wind farm site, near Lady’s Island Co. Wexford, however, found very limited collision
mortality as a result of wind farm operation, equating to two discovered Common Tern carcasses
over a three year period (Daly 2004; Daly 2005; Adamson 2003). When carcass removal by
scavengers was controlled for, no adverse effect was reported on bird colonies. Having said this,
given the acute sensitivity of this species’ breeding colonies to disturbance and habitat loss,
construction of wind infrastructure is likely to exert significant pressure on Irish breeding sites.
Additionally, power lines associated with wind energy developments have been shown to modify
breeding and feeding patterns of Common Terns, though mortality due to power lines was low
(Henderson et al. 1996).
8.9 Zone of Sensitivity
Given the requirement of this species to travel from breeding sites to the sea for feeding (e.g. at
Lady’s Island Lake) and the high likelihood of collision in flight as documented in other case studies
(Everaert & Stienen 2007), a zone of sensitivity of 1000 m has been imposed around the mainland
lakes identified as breeding sites for this species. Those breeding colonies located on the shores of
inlands lakes may travel shorter distances while feeding but are conversely required to traverse large
terrestrial areas when migrating. Though most individuals forage 5-10 km from breeding colonies,
and occasionally feed up to 15 km from coastal nesting areas, most of this distance is travelled over
water bodies.
8.10 Data sources
Data for this species’ distribution were obtained from the All-Ireland Tern Survey (1995), the
Seabird 2000 survey which was undertaken between 1998 & 2002 (Common Tern records collected
from ’99-’01) and the most recent Bird Atlas for the UK and Ireland (Balmer et al. 2013). In addition,
the colonies at Rockabill and Lady’s Island Lake are monitored annually.
Adamson, J., 2003. Ornithological Monitoring at Carnsore Point Windfarm And Environs 2003: A report to Hibernian Wind Power,
Arnold, J.M., Hatch, J.J. & Nisbet, I.C.T., 2004. Seasonal declines in reproductive success of the common tern Sterna hirundo: timing or parental quality? Journal of Avian Biology, 35(1), pp.33–45.
Balmer, D. et al., 2013. Bird Atlas 2007-11, the breeding and wintering birds of Britian and Ireland,
Becker, P.H. & Ludwigs, J.-D., 2004. Sterna hirundo Common Tern. BWP Update, 6(1), pp.91–137.
BirdLife International, 2004. Birds in the European Union: a status assessment, Wageningen, The Netherlands.
BirdLife International, 2014. Species factsheet: Sterna hirundo. Available at: http://www.birdlife.org [Accessed August 22, 2014].
BirdLife International, 2012. Sterna hirundo. The IUCN Red List of Threatened Species. Version 2014.2. Available at: www.iucnredlist.org [Accessed August 21, 2014].
Bird Sensitivity Mapping to Wind Energy Development - Guidance Document
62
BirdWatch Ireland, 2011. Action Plan for Shore and Lagoon Birds in Ireland 2011-2020, Kilcoole, Wicklow.
Colhoun, K. & Cummins, S., 2013. Birds of Conservation Concern in Ireland 2014 – 2019. Irish Birds, 9(4), pp.523–544.
Daly, D., 2004. Ornithological Monitoring at Carnsore Point Windfarm and Environs 2004: A report to Hibernian Wind Power,
Daly, D., 2005. Ornithological Monitoring at Carnsore Point Windfarm and Environs 2005: A report to Hibernian Wind Power,
European Commission, 2011. Wind energy developments and Natura 2000, Luxembourg.
Everaert, J. & Stienen, E.W.M., 2007. Impact of wind turbines on birds in Zeebrugge (Belgium). Biodiversity and Conservation, 16(12), pp.3345–3359.
Garthe, S. & Hüppop, O., 2004. Scaling possible adverse effects of marine wind farms on seabirds: developing and applying a vulnerability index. Journal of Applied Ecology, 41(4), pp.724–734.
Hannon, C., Berrow, S.D. & Newton, S.F., 1997. The status and distribution of breeding Sandwich Sterna sandvicencis, Roseate S. dougalii, Common S. hirundo, Arctic S. paradisaea and Little Terns S. albifrons in Ireland in 1995. Irish Birds, 6(1), pp.1–22.
Henderson, I.G., Langston, R.H.W. & Clark, N.A., 1996. The response of common terns Sterna hirundo to power lines: An assessment of risk in relation to breeding commitment, age and wind speed. Biological Conservation, 77(2–3), pp.185–192.
Merne, O.J., 2004. Common Sterna hirundo and Arctic Terns S. paradisaea breeding in Dublin Port, County Dublin, 1995-2003. Irish Birds, 7(3).
Mitchell, P.I. et al., 2004. Seabird Populations of Britain and Ireland: results of the Seabird 2000 census (1998-2002), London.
Snow, D.W. & Perrins, C.M., 1998. The Birds of the Western Palearctic Vol. 1: Non-passerines, Oxford, UK: Oxford University Press.
Bird Sensitivity Mapping to Wind Energy Development - Guidance Document
63
9 Sandwich Tern (Sterna sandvicensis)
9.1 Characteristics
The Sandwich Tern is a relatively slender, migratory, white, gull-like seabird with narrow, pointed
wings and short forked tail. It has a black cap on its head and short black legs. Its bill is long, pointed
and black with a yellow tip which at closer quarters confirms identification. When in flight, usually
over the sea, it shows grey wedges on its wing tips. Flying in a light and buoyant manner, it will
hover briefly over the sea before plunge diving in. It is the largest of the terns in Ireland, similar in
size to a Black-headed Gull and can be distinguished from other terns by its size and raucous, far
carrying call. Its diet consists mainly of surface dwelling fish, taken from shallow dive.
9.2 Range in Ireland
Sandwich Terns have a widespread distribution across the North Atlantic and breed along the
Atlantic coastlines of Europe, the USA and the Caribbean, and coastlines of the Mediterranean, Black
and Caspian Seas. They normally spend winters further south along the West African and Arabian
coasts. In Ireland, this species is a migrant breeder from March to September, though there are
occasional winter records. Summer breeding occurs at a few main sites, notably a large breeding
colony of over a thousand pairs at Lady’s Island Lake, near Rosslare in Co. Wexford. Additional
breeding colonies are present at Carrowmore Lake, Co. Mayo, Salt Lake near Clifton, Co. Galway and
Inch and Mulroy Bays in Co. Donegal. A limited number of birds also breed in Galway Bay and
Strangford Lough. The Irish breeding range of this species has declined since assessments in 1984
and 1995, particularly in western counties (Hannon et al. 1997; Whilde 1985; Mitchell et al. 2004).
9.3 Conservation status
The Sandwich Tern is protected under the Wildlife Act, 1976-200, as amended (Republic of Ireland)
and is Amber-listed in Ireland due to its localised breeding population (concentrated at 10 or fewer
colonies) and a moderate decline in numbers (Colhoun & Cummins 2013). The European population
has been assessed as Depleted, due to a moderate historical decline without substantial recovery
(BirdLife International 2004). It is also listed under Annex I of the EC Council Directive on the
Conservation of Wild Birds (2009/147/EC). The IUCN has assessed this species as Least Concern,
owing to the broad distribution of the three subspecies of Sandwich Tern globally (BirdLife
International 2012).
9.4 Population trend
The estimated current population of Sandwich Terns in the Republic of Ireland stands at 2,727
breeding pairs (S. Newton pers. comm., Article 12 Reporting), though numbers within the five main
colonies can fluctuate dramatically between years. The current number represents an increase from
the last complete national estimate in 1995 of 1,844 (Hannon et al. 1997). This increase may have
partially arisen in the Irish Sea from the desertion on a British colony and their re-settlement at the
Lady’s Island colony in Co. Wexford. Though persecution in their African wintering grounds is
extensive (Mitchell et al. 2004; Bourne & Smith 1974), it is not that thought this is currently affecting
populations of Irish breeders.
9.5 Breeding ecology
Sandwich Tern are ground-nesters , and nests comprise a shallow scrape on raised non-vegetated
sand, gravel or shingle and are usually congregated in dense breeding colonies (BirdWatch Ireland
Bird Sensitivity Mapping to Wind Energy Development - Guidance Document
64
2011). This species lays a single clutch per nesting season, consisting of 1-2 eggs which are incubated
for 21-29 days. Consequently, breeding Sandwich Terns are particularly sensitive to human
disturbance and depredation of adults, young and eggs (BirdLife International 2012). Owing to
substantial conservation measures on coastal breeding colonies on the east coast – including the
provision of artificial nesting sites, reduction of predation pressures and installation of seasonal
fencing – numbers within these colonies have grown markedly (BirdWatch Ireland 2011). These
include Rockabill Island, Dublin Port, Kilcoole, Dalkey Island, Baltray and Lady’s Island Lake.
9.6 Habitat requirements
Survey reports indicate that breeding sites are exclusively based around freshwater inland islands,
coastal saltwater islands and coastal brackish islands (Hannon et al. 1997) on shingle spits and sand
dunes. Nesting sites are close to clear, shallow water with sandy substrates rich in surface level fish
(Snow & Perrins 1998). Nests are usually positioned in the open away from upright vegetation. The
diet of Sandwich Terns is predominantly surface-occurring small marine fish 9-15cm long, as well as
shrimp and occasionally squid (BirdLife International 2012).
9.7 Site fidelity
Sandwich Terns generally return to the same nesting site each year and exhibit strong site fidelity.
However, disturbance, predators and flooding can precipitate a colony switch. The limited
availability of suitably undisturbed habitat is critical to the maintenance of the species Irish
population.
9.8 Sensitivity to development of wind energy
Sandwich Terns are known to fly overland to certain inland breeding colonies on the island of Ireland
(notably Lady’s Island Lake, Carrowmore Lake and Lower Lough Erne), potentially posing a collision
risk. In one case, daily travel from breeding sites at Lough Erne equates to a round trip of over 60 km
(Robson 2014). Indeed, the flight behaviour of Sandwich Terns has been noted as exposing it to risk
of collision with wind energy developments in other reports, despite its admittedly high flight
manoeuvrability (Garthe & Hüppop 2004). An assessment of the impact of a wind turbine array on
tern colonies on the coast of Belgium revealed a high level of collision mortality, in particular with
respect to Sandwich and Common (Sterna hirundo) Terns (Everaert & Stienen 2007). The impact
observed in this case was a 0.6-0.7% reduction in the total Sandwich Tern breeding population,
equating to between 19.1 and 20.9 bird fatalities per year per wind turbine, from 2004-2005. It was
observed that 13% of Sandwich Tern flight in the vicinity of breeding colonies was at the rotor height
of these turbines (16-50m), while most fatalities occurred at turbines perpendicular to the flight
path of feeding terns. The number of collisions with these turbines was directly related to the
estimated colony size each year assessed (Everaert & Stienen 2007). Given the acute sensitivity of
this species’ breeding colonies to disturbance and habitat loss and their strong tendency to abandon
nests or entire colonies (Bourne & Smith 1974), construction of wind infrastructure is likely to exert
significant pressure on these sites. Conversely, Sandwich Terns have been known to nest as close as
50 m from the base of turbines in other studies, suggesting that once in place the disturbance effect
is minimal (Everaert & Stienen 2007).
9.9 Zone of Sensitivity
Given the tendency of this species to travel over substantial areas of land from breeding sites to the
sea for feeding (Robson 2014) (especially in comparison to Common Terns) and the high likelihood of
Bird Sensitivity Mapping to Wind Energy Development - Guidance Document
65
collision in flight as documented in other case studies (Everaert & Stienen 2007) a wider zone of
sensitivity has been applied to this species than other terns. This is despite the tendency for
Sandwich Terns to readily nest within 50 m of wind turbines. Thus the zone of sensitivity for this
species has been assigned as a radius of 2000 m around polygons of this species’ known nesting sites
to include both breeding sites and the majority of feeding corridors.
9.10 Data sources
Data for this species’ distribution were obtained from the All-Ireland Tern Survey (1995) and the
Seabird 2000 survey (Mitchell et al. 2004), which was undertaken between 1998 & 2002 (Sandwich
Tern records collected from ’99-’01). In addition, the largest Sandwich Tern colonies in Ireland at
Lady’s Island and Inch Lakes are monitored annually.
BirdLife International, 2004. Birds in the European Union: a status assessment, Wageningen, The Netherlands.
BirdLife International, 2012. Thalasseus sandvicensis. The IUCN Red List of Threatened Species. Version 2014.2. Available at: http://www.iucnredlist.org/ [Accessed August 21, 2014].
BirdWatch Ireland, 2011. Action Plan for Shore and Lagoon Birds in Ireland 2011-2020, Kilcoole, Wicklow.
Bourne, W.R.P. & Smith, A.J.M., 1974. Threats to Scottish sandwich terns. Biological Conservation, 6(3), pp.222–224.
Colhoun, K. & Cummins, S., 2013. Birds of Conservation Concern in Ireland 2014 – 2019. Irish Birds, 9(4), pp.523–544.
Everaert, J. & Stienen, E.W.M., 2007. Impact of wind turbines on birds in Zeebrugge (Belgium). Biodiversity and Conservation, 16(12), pp.3345–3359.
Garthe, S. & Hüppop, O., 2004. Scaling possible adverse effects of marine wind farms on seabirds: developing and applying a vulnerability index. Journal of Applied Ecology, 41(4), pp.724–734.
Hannon, C., Berrow, S.D. & Newton, S.F., 1997. The status and distribution of breeding Sandwich Sterna sandvicencis, Roseate S. dougalii, Common S. hirundo, Arctic S. paradisaea and Little Terns S. albifrons in Ireland in 1995. Irish Birds, 6(1), pp.1–22.
Mitchell, P.I. et al., 2004. Seabird Populations of Britain and Ireland: results of the Seabird 2000 census (1998-2002), London.
Robson, B., 2014. Lower Lough Erne Islands RSPB Nature Reserve Breeding Seabird Report 2013. In K. Leonard & S. Wolsey, eds. Northern Ireland Seabird Report 2013. Thetford, United Kingdom: British Trust for Ornithology, pp. 28–31.
Snow, D.W. & Perrins, C.M., 1998. The Birds of the Western Palearctic Vol. 1: Non-passerines, Oxford, UK: Oxford University Press.
Whilde, A., 1985. The 1984 All Ireland Tern Survey. Irish Birds, 3, pp.1–32.
Bird Sensitivity Mapping to Wind Energy Development - Guidance Document
66
10 Black-headed Gull (Larus ridibundus)
10.1 Characteristics
The Black-headed Gull is a small gull, slightly smaller than a Common Gull (Larus canus). Adults are
pale grey above with white below and are easily told apart from other common gull species by the
thick white leading edge to the upper surface of the outer wing, which can be seen at some distance.
Pointed wings, and a short tail and head in proportion to the body, along with a long neck, give a
distinctive profile compared to other gulls. Adults have red legs and in summer plumage a dark
brown hood on the head. In the winter, the hood is absent and is replaced by a dark spot behind the
eye.
10.2 Range in Ireland
The Black-headed Gull is a widespread Palaearctic species, ranging from Western Europe to Japan. In
Ireland, this species can be found along all coasts, with significant numbers arriving from mainland
Europe in winter. Though once a common bird, it now exists at much lower numbers across much of
its Irish range and has experienced closely recorded declines in the recent past (Boland & Crowe
2012). This species now breeds sparsely across the midlands, though more prominent breeding sites
in the Republic can be found at large lakes in the west in counties Galway and Mayo. Coastal sites in
counties Wexford and Donegal are also important for this species breeding population.
10.3 Conservation status
Though significant populations exist elsewhere in the Palaearctic, Black-headed Gulls have been
placed on the Red-list of Birds of Conservation Concern in Ireland since 2007, owing to a rapidly
declining and localised breeding population (Lynas et al. 2007; Colhoun & Cummins 2013). The
European population of this species is regarded as Secure, despite declines in several countries
(BirdLife International 2004). The aggregate global population of this species has been assessed as
Least Concern (BirdLife International 2012).
10.4 Population trend
Winter populations of this species are augmented by wintering birds from northern and eastern
Europe (Wernham et al. 2002). Though once a common and widespread species with a considerable
resident population, numbers breeding inland have declined dramatically. This is probably due to
predation by the American Mink which, as an able swimmer, can access previously inaccessible
nesting areas. Though declines are difficult to estimate given the irregularity of surveys and their
wide distribution, some studies estimate that the species has experienced a 50% decline in overall
mean and annual peak numbers (Boland & Crowe 2012). Other studies have identified a particular
decline in coastal breeding numbers (Mitchell et al. 2004). Of note, populations in the Dublin Bay
area declined by almost 60% in just under a decade, from 1995 - 2004 (Merne et al. 2009).
10.5 Breeding ecology
Black-headed Gulls predominantly nest colonially, between April and July, often with other species
of gulls and terns (Snow & Perrins 1998), preferring inland breeding sites over coastal locations.
These include temporarily flooded, well-vegetated wetlands such as lake margins, river banks,
lagoons, estuaries and tussocky marshes. This species is also known to use manmade structures and
habitats as a nesting ground, such as gravel pits, sewage ponds and canals. Nests are ground-level
and consist of rough vegetation on a shallow scrape on vegetation mats, reeds, grass and
Bird Sensitivity Mapping to Wind Energy Development - Guidance Document
67
occasionally sand or gravel (BirdLife International 2014). Pairs will usually lay clutches of 2-3 eggs,
which are incubated for 23-26 days. Though juvenile survival for this species is low at 0.447 (Balmer
& Peach 1997), adult survival is extremely high at over 90% (Prévot-Julliard et al. 1998). Therefore,
survival within the first two years for this species seems key to population stability.
10.6 Habitat requirements
Black-headed Gulls use a wide variety of wetlands, either on the coast or inland. These areas include
the banks of slow-flowing rivers, lake edges, mudflats, tidal inshore waters, estuaries and lagoons,
though may also be found in anthropogenic habitats such as parks, agricultural land, sewage ponds
and landfills (Snow & Perrins 1998). In coastal areas this may further include inlets with sandy or
muddy beaches, though rocky or exposed shores are avoided. Within these preferred habitats, this
species is an opportunist, using a variety of food sources. During the breeding season, when natural
food is abundant, aquatic and terrestrial invertebrates are preferred, small rodents and grain. During
the winter when natural forage is scarce, Black-headed Gulls rely strongly on sources originating
from humans, including refuse tips, fish discards and urban waste (BirdLife International 2014).
10.7 Site fidelity
Though the Black-headed Gull shows a seemingly low level of site fidelity given the wide suite of
habitats occupied compared to other species and its opportunistic feeding behaviour, this species
displays a strong preference for nesting near erect vegetation within its preferred habitat (BirdLife
International 2014). In addition, decreases in population numbers as a result of ecosystem threats
(including mink depredation) suggest that the species’ willingness to change breeding habitat to
avoid such stresses is lower than expected.
10.8 Sensitivity to development of wind energy
Adult annual survival of this species is high compared to other species at 90% (Prévot-Julliard et al.
1998), thus exposing individuals to the potential effects of collision mortality across numerous years
(Garthe & Hüppop 2004). Contrary to this, Winkelman (1992) found no disturbance of Black-headed
Gull feeding and roosting by the presence of operational wind farms. In fact, previous studies have
found increases in populations of this species around wind energy installations (Winkelman 1989),
possibly through ecological release of resources due to reduced competition. Further, the flight
height of Black-headed Gulls below 15 m has been shown to reduce their susceptibility to collision
with operating wind turbine rotors (Still et al. 1996). Despite this, measurements at Zeebrugge in
Belgium (Everaert et al. 2002) found that Herring, Lesser Black-backed and Black-headed Gulls all
exhibited significantly higher mortality by collision than other species present. This report also
showed a significant reduction in flights of Black-headed Gulls between the rotor heights of turbines
present (36-85 m). Furthermore, the risk of collision was found to be significantly higher at night
than during the day (Everaert 2002).
10.9 Zone of Sensitivity
The high mortality of the Black-headed Gull as a result of wind turbine collision (Everaert 2002),
combined with the steep observed drop in the species’ population within Ireland (Boland & Crowe
2012; Mitchell et al. 2004), justifies a zone of sensitivity being imposed around its current
distribution. This is defined by several important breeding colonies at coastal and inland lakes of the
Republic of Ireland, with frequent feeding flights across and around potential locations for wind
Bird Sensitivity Mapping to Wind Energy Development - Guidance Document
68
turbines. Given observed flying heights and associated higher risk of collision than other species, a
zone of sensitivity of 1km was imposed for this species.
10.10 Data sources
Data for this assessment were obtained from the most recent Irish Wetland Bird Survey (Boland &
Crowe 2012) and Seabird 2000 (Mitchell et al. 2004), which was undertaken between 1998 & 2002
(Black-headed Gull records collected from ‘99 – ‘02).
Balmer, D.E. & Peach, W.J., 1997. Review of Natural Avian Mortality Rates: BT0 Research Report No. 175, Thetford, UK.
BirdLife International, 2004. Birds in the European Union: a status assessment, Wageningen, The Netherlands.
BirdLife International, 2012. Larus ridibundus: The IUCN Red List of Threatended Species. Version 2014.2. Available at: www.iucnredlist.org [Accessed August 25, 2014].
BirdLife International, 2014. Species Factsheet: Larus ridibundus. Available at: http://www.birdlife.org [Accessed August 25, 2014].
Boland, H. & Crowe, O., 2012. Irish Wetland Bird Survey: Waterbird Status and Distribution 2001/02 - 2008/09, Kilcoole, Wicklow.
Colhoun, K. & Cummins, S., 2013. Birds of Conservation Concern in Ireland 2014 – 2019. Irish Birds, 9(4), pp.523–544.
Everaert, J., 2002. Windturbines en vogels in Vlaanderen : voorlopige onderzoeksresultaten en aanbevelingen. Natuur Oriolus, 69(4), pp.145–155.
Garthe, S. & Hüppop, O., 2004. Scaling possible adverse effects of marine wind farms on seabirds: developing and applying a vulnerability index. Journal of Applied Ecology, 41(4), pp.724–734.
Lynas, P., Newton, S.. & Robinson, J.., 2007. The status of birds in Ireland: an analysis of conservation concern 2008-2013. Irish Birds, 8, pp.149 – 167.
Merne, O.J. et al., 2009. Abundance of non-breeding gulls in Dublin Bay, 2006-2007. Irish Birds, 8(4), pp.549–562.
Mitchell, P.I. et al., 2004. Seabird Populations of Britain and Ireland: results of the Seabird 2000 census (1998-2002), London.
Prévot-Julliard, A.-C., Lebreton, J.-D. & Pradel, R., 1998. Re-Evaluation of Adult Survival of Black-Headed Gulls (Larus ridibundus) in Presence of Recapture Heterogeneity. The Auk, 115(1), pp.85–95.
Snow, D.W. & Perrins, C.M., 1998. The Birds of the Western Palearctic Vol. 1: Non-passerines, Oxford, UK: Oxford University Press.
Still, D., Little, B. & Lawrence, S., 1996. The Effect of Wind Turbines on the Bird Population at Blyth Harbour, Northumberland. ETSU W/13/00394/REP, London, United Kingdom.
Wernham, C.V. et al. eds., 2002. The Migration Atlas: movements of the birds of Britain and Ireland, London: T & A.D. Poyser.
Winkelman, J.E., 1989. Birds at a Wind Park near Urk: Bird Collision Victims and Disturbance of Wintering Ducks, Geese and Swans [in Dutch]. RIN-Rapport 89/15, Arnhem, Netherlands.

Bird Sensitivity Mapping to Wind Energy Development - Guidance Document
69
Winkelman, J.E., 1992. The Impact of the SEP Wind Park near Oosterbierum (Fr.), the Netherlands, on Birds, Vol. 1: Collision Victims [in Dutch]. RIN-report 92/2, Arnhem, Netherlands.
Bird Sensitivity Mapping to Wind Energy Development - Guidance Document
70
11 Greylag Goose (Anser anser)
11.1 Characteristics
This species is a large bulky greyish brown goose, with pinkish-orange bill and dull pink legs. Its
plumage is uniformly plain grey/brown, though some have a thin white rim at the base of the bill or
dark marks on the belly. It is most similar to the Greenland White-fronted Goose (Anser albifrons
flavirostris), though lacks the white colouration above the bill.
11.2 Range in Ireland
The Greylag Goose is well distributed globally, from Iceland across the entirety of the Palearctic as
far as China, and is split into roughly 8 distinct populations (BirdLife International 2014). That which
breeds in Iceland spends its winter in Ireland and northern Britain between late October and late
March/early April, occurring mostly at coastal sites (Boland & Crowe 2012). In addition to these
winter migrants, there is now also a growing population of non-migratory resident breeding birds
which are present year round, likely originating from a captive release in the 20th century (Boland &
Crowe 2008). In general, this species (and especially the winter migrants) are highly gregarious. The
Icelandic migrants occur at seven main flocks in the Republic of Ireland, where they are mostly seen
in large numbers (up to 3,000, but usually in low hundreds). Of these, internationally important
populations occur at the Lough Swilly/Foyle complex, which is thought to also support some
Icelandic passage migrants that later winter in Scotland, and 8 nationally important sites in the east
and southeast of the country (Boland & Crowe 2008). The resident population is more widespread,
occurring in smaller numbers (usually less than 10) at sites throughout the country. The most recent
count stands at 82 locations (Boland & Crowe 2012).
11.3 Conservation status
Though not an uncommon bird across the country, the migratory population of Greylag Geese
originating from Iceland is currently Amber-listed in Ireland as the majority of this population
winters at less than ten sites (Colhoun & Cummins 2013). The European population of this species is
considered to be Secure, owing to its wide distribution and a large increase in numbers across
Europe (BirdLife International 2004), while globally this species is of Least Concern (BirdLife
International 2012).
11.4 Population trend
The population of Greylag Geese in Europe has risen substantially between 1990 and 2000 (BirdLife
International 2004). In Ireland, however, there has been a 4.3% mean annual decline in the
migratory population of this species since 1994, though there has been a 110% increase in resident
birds across the same period (Boland & Crowe 2012). The decline in winter migrants is constituted
by a short term (2003/4 – 2008/9) decline of 2.8% and a longer term decline of almost 33% from
1994/5 – 2008/9, suggesting that this decline may be slowing. At the last comprehensive all-Ireland
count, 4,761 wintering birds were identified as being of Icelandic origin, while the remaining 1,555
were believed to be resident breeding birds (Boland & Crowe 2008).
11.5 Breeding ecology
The migratory population occurring in Ireland breeds in Iceland by streams, salt marshes, floodplains
and reeds close to feeding sites, with the nest site often close to water and hidden in reeds or other
waterside vegetation. This species nests in separate pairs, but may be colonial in some populations
Bird Sensitivity Mapping to Wind Energy Development - Guidance Document
71
(BirdLife International 2014). A single clutch is laid annually, consisting of 5-7 eggs which are
incubated for 27-28 days. Juvenile survival in this species has been estimated at 0.56. The resident
population in Ireland is found to breed in a variety of inland and coastal wetlands, including river
floodplains, on the margins of reservoirs, lakes, rivers and mudflats, reed beds and an increasing
proportion on agricultural grassland (Boland & Crowe 2012).
11.6 Habitat requirements
While wintering in Ireland Greylag Geese of Icelandic origin require lowland grassland in open
country, reservoirs, lakes, coastal lagoons and estuaries (Snow & Perrins 1998). Greylag Geese used
to concentrate more on estuaries, where they fed on the roots of rushes and sedges. However, the
proportion of these birds utilising agricultural land has risen sharply in recent times. A study in
Scotland, for example, found Greylag Geese to now feed almost exclusively on agricultural land
(Keller, 1991). Travel from winter roost sites to feeding grounds can be up to 5km, leading Bright et
al. (2009) to advise inclusion of feeding sites at these distances within environmental impact
assessments.
11.7 Site fidelity
The annual return of wintering Greylag Geese to seven main wintering flock locations in the Republic
of Ireland shows this species’ strong site fidelity. Given the decreasing numbers of wintering
Icelandic migrants at these sites, the national- and international-importance of these sites is
growing. Resident populations are less sedentary across years, however, choosing a variety of
suitable breeding and wintering sites, with reports of exchange of individuals between sites in
Ireland, and between British and Irish feral populations (Boland & Crowe 2012).
11.8 Sensitivity to development of wind energy
In general this species has been identified as being at particular risk of disturbance displacement and
collision as a result of wind energy development (Langston & Pullan 2003). Limited research has
been conducted on the specific effects of wind energy infrastructure on Greylag Geese. In a recent
review of research relating to bird collisions with European wind farms (Hötker et al. 2006) only one
record of Greylag mortality was recorded. Conversely, two studies in this review documented barrier
effects in relation to migration. Given that wintering populations of this species may travel several
kilometres between roosts and feeding grounds (Bright et al. 2009), avoidance during migration or
feeding may be imposing greater impacts on this species than collision mortality. Ground-based
disturbances associated with wind installations may also affect feeding and roosting behaviour. For
example, substantial avoidance of roads by Greylag Geese has been recorded in Scotland (Keller,
1996) where flocks were found at a mean distance of 400 m to roads but not within 100 m.
Habituation to the continued use of these roads was posited in this case, suggesting that
construction disturbance may be greater than conventional operation of wind energy facilities, as
found in other studies (Pearce-Higgins et al. 2012). An assessment of Barnacle Geese populations in
other studies found displacement of wintering birds up to 600 m from wind farms and no birds
within 350 m from the base of turbines (Kowallik & Borbach-Jaene 2001). Similarly, substantially
lower numbers of White-fronted Geese (Anser albifrons) were found within 600 m of wind turbines
elsewhere (Kruckenberg & Jaene 1999).
Bird Sensitivity Mapping to Wind Energy Development - Guidance Document
72
11.9 Zone of Sensitivity
Given that Greylag Geese were found to be particularly sensitive to ground-based disturbance and
are exposed to collision with wind turbines, the zone of sensitivity for this species has been set at
600 m, demarcated around the Special Protected Areas (SPAs) within which the major flocks of
Icelandic wintering Greylag Geese are found. This is further based on observations of other species
of goose which were found not to use territory 350-600 m from turbines (Kowallik & Borbach-Jaene
2001; Percival 2003).
11.10 Data sources
Data for this assessment has been obtained from the Irish Wetland Bird Survey (Boland & Crowe
2012) and a dedicated 2007/8 survey of Iceland-breeding and resident Greylag Geese in Ireland, as
commissioned by the National Parks and Wildlife Service and the Environment Agency of Northern
Ireland (Boland & Crowe 2008).
BirdLife International, 2012. Anser anser. The IUCN Red List of Threatened Species. Version 2014.2. Available at: www.iucnredlist.org [Accessed September 24, 2014].
BirdLife International, 2004. Birds in the European Union: a status assessment, Wageningen, The Netherlands.
BirdLife International, 2014. Species factsheet: Anser anser. Available at: http://www.birdlife.org [Accessed September 23, 2014].
Boland, H. & Crowe, O., 2008. An assessment of the distribution range of Greylag ( Icelandic-breeding & feral populations ) in Ireland, Kilcoole, Wicklow.
Boland, H. & Crowe, O., 2012. Irish Wetland Bird Survey: Waterbird Status and Distribution 2001/02 - 2008/09, Kilcoole, Wicklow.
Bright, J.A. et al., 2009. Mapped and written guidance in relation to birds and onshore wind energy development in England,
Colhoun, K. & Cummins, S., 2013. Birds of Conservation Concern in Ireland 2014 – 2019. Irish Birds, 9(4), pp.523–544.
Hötker, H., Thomsen, K.-M. & Jeromin, H., 2006. Impacts on biodiversity of exploitation of renewable energy sources: the example of birds and bats - facts, gaps in knowledge, demands for further research, and ornithological guidelines for the development of renewable energy exploitation, Bergenhusen, Germany.
Kowallik, C. & Borbach-Jaene, J., 2001. Impact of wind turbines on field utilization by geese in coastal areas in NW Germany. Vogelkdl. Ber. Niedersachs, 33, pp.97–102.
Kruckenberg, H. & Jaene, J., 1999. Zumm einfluss eines Windpark auf die Verteilung weidender Blassganse im Rheiderland (Landkreis Leer, Neidersachsen). Natur und Landschaft, 74, pp.420–427.
Langston, R.H.W. & Pullan, J., 2003. Windfarms and Birds : An analysis of the effects of windfarms on birds , and guidance on environmental assessment criteria and site selection issues, RSPB/BirdLife.
Pearce-Higgins, J.W. et al., 2012. Greater impacts of wind farms on bird populations during construction than subsequent operation: results of a multi-site and multi-species analysis. Journal of Applied Ecology, 49(2), pp.386–394.

Bird Sensitivity Mapping to Wind Energy Development - Guidance Document
73
Percival, S.M., 2003. Birds and Wind Farms in Ireland: A Review of Potential Issues and Impact Assessment. Ecology Consulting, Durham UK.
Snow, D.W. & Perrins, C.M., 1998. The Birds of the Western Palearctic Vol. 1: Non-passerines, Oxford, UK: Oxford University Press.
Bird Sensitivity Mapping to Wind Energy Development - Guidance Document
74
12 Barnacle Goose (Branta leucopsis)
12.1 Characteristics
The Barnacle Goose is one of six species of geese which overwinter in Ireland. It is a small compact
goose, with small rounded head and short black bill. It has a black neck and breast and mostly-white
head. The grey upperparts are barred and the underparts pale. It can be identified in flight by a
strong contrast between the black breast and the whitish belly.
12.2 Range in Ireland
The Barnacle Goose is a wide-ranging European species, ranging from its breeding grounds in the far
north (including Greenland, Iceland, Svalbard, Scandinavia and Arctic Russia) to its wintering grounds
in north-west Europe (BirdLife International 2014). In Ireland, this species is a winter visitor from
Greenland, occurring here between October and April. While here, this species feeds mostly on
remote islands and the coast in the northwest and west, in areas relatively free from disturbance.
Five internationally-important wintering sites exist in Ireland, including the Inishkea Islands,
Termoncarragh Lake and Annagh Marsh in County Mayo, Drumcliff Bay Estuary in Sligo and
Trawbreaga Bay in County Donegal. Many of these sites regularly support over 2,000 birds, while
Rathlin O’Birne in County Donegal supports a relatively large flock of about 500 birds. Additional to
these sites, almost 30 sites of national importance have also been identified throughout the country
from the most recent survey (Crowe et al. 2014).
12.3 Conservation status
The Barnacle Goose is currently Amber-listed in Ireland (Colhoun & Cummins 2013) as the majority
of its substantial and internationally important wintering population can be found at less than ten
sites. The European population is considered to be Secure, owing to a recent gradual increase in its
wintering range and overall population growth (BirdLife International 2004), while internationally
this species is considered to be of Least Concern (BirdLife International 2012). It is also listed under
Annex I of the EC Council Directive on the Conservation of Wild Birds (2009/147/EC).
12.4 Population trend
The breeding population of Barnacle Geese was historically small (limited to <54,000 pairs), but this
has experienced a significant increase across its breeding range between 1990 and 2000 (BirdLife
International 2014). The wintering Barnacle Goose population in Ireland has similarly experienced an
average annual increase of 2.7% since 1993 (Boland & Crowe 2012) with a record high of 12,232
birds recorded in a 2008 aerial and ground count (Walsh & Crowe 2008). The most recent I-WeBS
count (Crowe et al. 2014) puts this total at 17,500 birds, a 43% increase on this previous figure. The
combined wintering population of England, Wales and Scotland now stands at 70,051, representing
an increase of 25% over the past 5 years (Walsh & Crowe 2008).
12.5 Breeding ecology
This species does not breed in Ireland, though in its Greenland breeding ground it lays a single clutch
annually, consisting of 4-5 eggs which are incubated for 24-25 days. Nests usually consist of a mound
of vegetation on rocky ground (Snow & Perrins 1998).
Bird Sensitivity Mapping to Wind Energy Development - Guidance Document
75
12.6 Habitat requirements
While wintering in Ireland, Barnacle Geese inhabit coastal wetlands and pastures with low levels of
disturbance, where they congregate in large numbers. This species is herbivorous and primarily
grazes during the winter on grasses, sedges, moss, small shrubs, aquatic plants and clover (BirdLife
International 2014), though recent assessments of Barnacle Goose feeding ecology indicated active
preference for areas of thick grass over areas of thin grass or moss (Soininen et al. 2010). Further,
reseeding and artificial fertilisation of pastures annually has shown to increase the numbers of
Barnacle Geese supported by these areas (Percival 1993). This reflects the heightened preference of
other goose species, such as Greylag Geese (Anser anser), for improved pasture (Keller 1991).
12.7 Site fidelity
The annual return of wintering Barnacle Geese to a selection of main wintering flock locations in the
Republic of Ireland, despite the high availability of improved pasture in coastal regions,
demonstrates their high level of site fidelity. In addition, their requirement for sites of limited
disturbance means that future site selection is likely to be further restricted. Having said this, limited
movement between sites has been suggested while overwintering in Ireland (Boland & Crowe 2012).
12.8 Sensitivity to development of wind energy
In general, Barnacle Geese are regarded as being threatened by wind energy development through
disturbance displacement and collision (Langston & Pullan 2003). Identified amongst surveys of this
species was the lack of consistency across counts, suggesting a high level of mobility between sites
during the winter (Boland & Crowe 2012). This has implications for the development of wind energy
infrastructure on surrounding unoccupied land, if transit flights are frequent. Notably, some
observations have recorded disturbances to flock formations as a result of wind turbines (Koop
1997). In terms of direct collision risk, a pan-European assessment of bird impacts with wind
turbines showed that this species experienced a greater number of reported collisions than all other
geese species assessed (Hötker et al. 2006). With regard to displacement, a study of the same
population of Barnacle Geese in both wintering and summer breeding grounds found that avoidance
of wind energy infrastructure (exceeding 350 m, with reduced numbers up to 600 m) was likely
related to the availability of suitable alternative feeding grounds in the vicinity of turbines (Percival
2003; Kowallik & Borbach-Jaene 2001). Given that the Barnacle Goose has an extremely localised
wintering population in Ireland, as is the case with this species’ entire European distribution (BirdLife
International 2014), disturbance to this species’ internationally important wintering sites in Ireland
through wind energy development is likely to have a disproportionately large impact. Additionally,
the high demographic elasticity (i.e. the proportional change in population through reduction in
adult survival) observed in Barnacle Goose populations (Desholm 2009) may expose this population
to further reductions through wind energy development impacts.
12.9 Zone of Sensitivity
Little research has been conducted on the disturbance distances of this species. Reduced numbers of
this species have, however, been observed up to 600 m from wind turbines (Kowallik & Borbach-
Jaene 2001). Additionally, a review of various assessments by Langston and Pullan (2003) indicated
that distances of up to 600 m should be used in any exclusion. Consequently, the zone of sensitivity
for this species has been set at 600 m, demarcated around the Special Protected Areas (SPAs) within
which the major flocks of wintering Barnacle Geese occur.
Bird Sensitivity Mapping to Wind Energy Development - Guidance Document
76
12.10 Data sources
Data for this assessment has been obtained from the Irish Wetland Bird Survey (Boland & Crowe
2012) and extensive aerial and ground censuses carried out every 4-5 years in conjunction with the
National Parks and Wildlife Service, the most recent of which was conducted in 2013 (Crowe et al.
2014).
BirdLife International, 2004. Birds in the European Union: a status assessment, Wageningen, The Netherlands.
BirdLife International, 2012. Branta leucopsis. The IUCN Red List of Threatened Species. Version 2014.2. Available at: www.iucnredlist.org [Accessed October 1, 2014].
BirdLife International, 2014. Species Factsheet: Branta leucopsis. Available at: http://www.birdlife.org [Accessed October 1, 2014].
Boland, H. & Crowe, O., 2012. Irish Wetland Bird Survey: Waterbird Status and Distribution 2001/02 - 2008/09, Kilcoole, Wicklow.
Colhoun, K. & Cummins, S., 2013. Birds of Conservation Concern in Ireland 2014 – 2019. Irish Birds, 9(4), pp.523–544.
Crowe, O. et al., 2014. Barnacle Geese Branta leucopsis in Ireland: a report on the 2013 census and long-term trends. Irish Birds, 10(1).
Desholm, M., 2009. Avian sensitivity to mortality: prioritising migratory bird species for assessment at proposed wind farms. Journal of environmental management, 90(8), pp.2672–9.
Hötker, H., Thomsen, K.-M. & Jeromin, H., 2006. Impacts on biodiversity of exploitation of renewable energy sources: the example of birds and bats - facts, gaps in knowledge, demands for further research, and ornithological guidelines for the development of renewable energy exploitation, Bergenhusen, Germany.
Keller, V.E., 1991. The effect of disturbance from roads on the distribution of feeding sites of geese (Anser brachyrhynchus, A. anser), wintering in north-east Scotland. Ardea, 79(2), pp.229–231.
Koop, B., 1997. Bird migration and wind energy planning: examples of possible effects from the Plon district. Naturschutz und Landschaftspanung, 29, pp.202–207.
Kowallik, C. & Borbach-Jaene, J., 2001. Impact of wind turbines on field utilization by geese in coastal areas in NW Germany. Vogelkdl. Ber. Niedersachs, 33, pp.97–102.
Langston, R.H.W. & Pullan, J., 2003. Windfarms and Birds : An analysis of the effects of windfarms on birds , and guidance on environmental assessment criteria and site selection issues, RSPB/BirdLife.
Percival, S.M., 2003. Birds and Wind Farms in Ireland: A Review of Potential Issues and Impact Assessment. , (December).
Percival, S.M., 1993. The effects of reseeding, fertilizer application and disturbance on the use of grasslands by barnacle geese, and the implications for refuge management. , 30, pp.437–443.
Snow, D.W. & Perrins, C.M., 1998. The Birds of the Western Palearctic Vol. 1: Non-passerines, Oxford, UK: Oxford University Press.
Soininen, E.M., Hübner, C.E. & Jónsdóttir, I.S., 2010. Food selection by barnacle geese (Branta leucopsis) in an Arctic pre-breeding area. Polar Research, 29(3), pp.404–412.
Walsh, A.J. & Crowe, O., 2008. Barnacle Geese Branta leucopsis in Ireland, Spring 2008. Irish Birds, 8(3), pp.430–432.
Bird Sensitivity Mapping to Wind Energy Development - Guidance Document
77
13 Greenland White-fronted Goose (Anser albifrons flavirostris)
13.1 Characteristics
The Greenland White-fronted Goose is a medium-sized grey-brown goose, with orange legs and an
orange-yellow bill. Adults have a prominent blaze around the base of the bill and black barring on
the belly. This species is similar to the larger Greylag Goose (Anser anser), though is distinguished
from this by a white patch above the bill.
13.2 Range in Ireland
The Greater White-fronted Goose (Anser albifrons) has an extremely large range globally, extending
throughout the Arctic while breeding and in various regions at lower latitudes during the winter,
from China to Western Europe and coastal North America (BirdLife International 2014). The Irish and
British migratory population originates from Greenland and is regarded as a subspecies (A. a.
flavirostris). In Ireland, this subspecies is a scarce winter visitor to a limited number of sites, between
October and April. Whilst here, this species is highly gregarious and mainly gathers in three
internationally important sites (at the Wexford Slobs, Lough Swilly and the Little Brosna Callows).
Additionally, this species occurs at 3 sites, Lough Iron, Dunfanaghy New Lake and Cahore marshes, in
nationally important numbers.
13.3 Conservation status
A large proportion (63%) of the global population of Greenland White-fronted Geese was
counted in Ireland in spring 2014 (Fox et al. 2014). This subspecies is currently Amber-listed in
Ireland as the majority of the internationally important population winters at less than ten sites
(Colhoun & Cummins 2013).
13.4 Population trend
The population has experienced a marked decline, from an estimated 35,600 individuals in 1999 to
20,797 in spring 2014 (Fox et al. 2014). In Ireland, this equates to an average annual decline of 2.4%
(Boland & Crowe 2012), though the substantial population found at the Wexford Slobs has
undergone a much lower annual decline (0.9%). It is thought that this decline is a result of continued
perilously poor productivity in its Greenland breeding grounds, as a result of environmental factors
(Fox et al. 2006; Boyd & Fox 2008) and inter-specific competition (Kristiansen & Jarrett 2002).
13.5 Breeding ecology
This subspecies’ breeding range is confined to western Greenland, where it nests in lowland
tundra, often by lakes and rivers. While here, a single clutch is laid annually, although only a small
proportion of birds may actually breed. This clutch consists of 5-6 eggs which are incubated for 27-
28 days. Nests ‒ usually consisting of a mound of vegetation on sand or clay ‒ are widely scattered,
though loose colonies may be formed (Snow & Perrins 1998).
13.6 Habitat requirements
In its wintering range, Greenland White-fronted Geese require undisturbed foraging and roosting
areas, and sites with multiple foraging areas to allow for local movements in response to disturbance
(Stroud et al. 2012). Roost sites occur adjacent to salt marshes, on mud flats and on some inland
freshwater lakes (BirdLife International 2014). It traditionally forages over peat bogs, dune grassland,
and occasionally salt marshes though it is now increasingly found feeding on intensively managed
Bird Sensitivity Mapping to Wind Energy Development - Guidance Document
78
grasslands (Mayes et al. 2009; Fox et al. 2006). This species grazes on a range of plant material,
taking roots, tubers, shoots and leaves. In particular, grasses, clover, split grain, winter wheat and
potatoes are preferred forage. More detailed investigations of White-fronted Goose feeding found
that habitat preference is strongly linked to the availability of this preferred vegetation, in addition
to environmental factors such as frost and snow cover (Owen 1971) and local drainage regimes
(Mayes et al. 2009).
13.7 Site fidelity
The fact that this species returns to the same set of nationally and internationally important
wintering sites annually, indicates strong site fidelity. Given the low reproductive output (Fox et al.
2006), the decline in numbers reaching the limited number of Irish wintering sites is likely to
continue, increasing the importance of remaining sites. A longitudinal study of an isolated flock in
Ireland revealed strong affinity to a wetland area during a decline towards, and subsequent to, the
site becoming unsuitable for wintering individuals (Mayes et al. 2009).
13.8 Sensitivity to development of wind energy
In general, Greenland White-fronted Geese are regarded as being threatened by wind energy
development through disturbance displacement and collision (Langston & Pullan 2003; Stroud et al.
2012). In some studies, disturbance displacement of this species has been observed up to 600 m,
with significantly lower feeding closer to turbines (Kruckenberg & Jaene 1999). Avoidance of roads
has also been noted for this species (Mooij 1982), suggesting that infrastructure associated with
turbines may also negatively impact this species. Similarly, although collision and disturbance effects
are poorly recorded for this species, a recent assessment of goose feeding found that significantly
fewer birds were observed grazing within 40-80 m of low level power lines, though this effect was
not observed with higher voltage lines mounted at greater heights (Ballasus & Sassinka 1997). A
review of more generalised collision risk with turbines was inconclusive, though examples of flocks
flying within large turbine rotor heights have been recorded, particularly in coastal regions (Langston
& Pullan 2003). As a result, in a recent species action plan (Stroud et al. 2012) collision with turbines
and power lines has been highlighted as a significant threat to the conservation of Greenland White-
fronted Geese.
13.9 Zone of Sensitivity
Little research has been conducted on the disturbance distances of this species. However, reduced
numbers of this species have been observed feeding up to 600 m from wind turbines (Kruckenberg &
Jaene 1999). Additionally, a review of various assessments by Langston and Pullan (2003) indicated
that distances of up to 600 m should be used in any exclusion for geese. The zone of sensitivity for
this species has thus been set at 600 m, demarcated around the Special Protected Areas (SPAs)
within which the major flocks of wintering Greenland White-fronted Geese are found.
13.10 Data sources
Data for this assessment has been obtained from the Irish Wetland Bird Survey (Boland & Crowe
2012) and from a dedicated annual survey coordinated by the National Parks and Wildlife Service
and the Greenland White-fronted Goose Study, the most recent of which was conducted in 2014
(Fox et al. 2014).
Bird Sensitivity Mapping to Wind Energy Development - Guidance Document
79
Ballasus, H. & Sassinka, R., 1997. Auswirkungen von Hochspannungstrassen auf die Fl ~ ichennutzung Einleitung. Journal fur Ornithologie, 138, pp.215–228.
BirdLife International, 2014. Species factsheet: Anser albifrons. Available at: http://www.birdlife.org [Accessed October 15, 2014].
Boland, H. & Crowe, O., 2012. Irish Wetland Bird Survey: Waterbird Status and Distribution 2001/02 - 2008/09, Kilcoole, Wicklow.
Boyd, H. & Fox, A.D., 2008. Effects of climate change on the breeding success of White-fronted Geese Ander albifrons flavirostris in West Greenland. Wildfowl, 58, pp.55–70.
Colhoun, K. & Cummins, S., 2013. Birds of Conservation Concern in Ireland 2014 – 2019. Irish Birds, 9(4), pp.523–544.
Fox, A.D. et al., 2006. Recent changes in abundance of the Greenland White-fronted Goose. British Birds, 99, pp.242–261.
Fox, T. et al., 2014. Report of the 2013/2014 International Census of Greenland White-Fronted Geese, Ronde, Denmark.
Kristiansen, J.N. & Jarrett, N.S., 2002. Inter-specific competition between Greenland White-fronted Geese Anser albifrons flavirostris and Canada Geese Branta canadensis interior moulting in West Greenland: Mechanisms and consequences. Ardea, 1, pp.1–13.
Kruckenberg, H. & Jaene, J., 1999. Zumm einfluss eines Windpark auf die Verteilung weidender Blassganse im Rheiderland (Landkreis Leer, Neidersachsen). Natur und Landschaft, 74, pp.420–427.
Langston, R.H.W. & Pullan, J., 2003. Windfarms and Birds : An analysis of the effects of windfarms on birds , and guidance on environmental assessment criteria and site selection issues, RSPB/BirdLife.
Mayes, E., Partridge, K. & Shannon, J., 2009. Greenland White-fronted Geese Anser albifrons flavirostris : the brief recorded history of the Caledon flock. Irish Birds, 8(4), pp.497–506.
Mooij, J.H., 1982. Die Auswirkungen von Strassen auf die Avifauna einer offenen Landschaft am Unteren Niederrhein (Nordrhein-Westfalen), untersucht am Verhalten von Wildgansen. Charadrius, 18, pp.73–92.
Owen, M., 1971. The selection of feeding site by White-fronted Geese in winter. Journal of Applied Ecology, 8(3).
Snow, D.W. & Perrins, C.M., 1998. The Birds of the Western Palearctic Vol. 1: Non-passerines, Oxford, UK: Oxford University Press.
Stroud, D.A. et al., 2012. International Single Species Action Plan for the Conservation of the Greenland White-fronted Goose (Anser albifrons flavirostris). AEWA Technical Series No. 45, Bonn, Germany.
Bird Sensitivity Mapping to Wind Energy Development - Guidance Document
80
14 Whooper Swan (Cygnus cygnus)
14.1 Characteristics
The Whooper Swan is a very large and conspicuous bird. Adults are uniformly white and have a
yellow and black bill, showing more yellow than black, with the yellow generally projecting below
the nostril towards the bill-tip. Whooper Swans are larger than the Bewick’s Swan (Cygnus
columbianus) – the other yellow-billed swan that occurs in Ireland - with a longer neck and longer
bill-profile. Whoopers can be distinguished from Ireland’s resident Mute Swans (Cygnus olor) as
they lack the knob and orange colour of the latter, and the necks of the yellow-billed swans tend to
be held more erect than the graceful S-bend formed by the Mute Swan.
14.2 Range in Ireland
Whooper Swans have an extensive international distribution, ranging from Iceland across the
majority of the Palearctic to eastern Russia. In Ireland, these birds are winter visitors to wetlands
throughout the country from October, peaking in November, December and January before
departing by April (Boland & Crowe 2012). Of the five distinct populations of Whooper Swans
globally, it is exclusively the Icelandic-breeding population that winters in Ireland (Robinson et al.
2004). Whilst in Ireland, this species is relatively widespread, occurring in as many as 270 sites,
especially north and west of a line between Limerick and Dublin. Important sites within this
distribution are Loughs Erne, Foyle, Swilly, Oughter and Iron, Wexford Harbour and Slobs and the
Callows of the Shannon, Brosna, Suck and Blackwater rivers (Boland et al. 2010). Most recent
surveys have suggested a general shift in this species’ winter distribution to the southeast (Hall et al.
2012).
14.3 Conservation status
Whooper Swans are currently Amber-listed in Ireland due to the hosting of more than 20% of the
European wintering population, the majority of which winter at ten or less sites (Colhoun &
Cummins 2013). Furthermore, this species relies on a very small breeding population internationally.
Consequently, this species is listed under Annex I of the EC Council Directive on the Conservation of
Wild Birds (2009/147/EC). BirdLife International has, however, assessed the European population of
this species as Secure owing to its extensive range and large numbers which have experienced a
recent increase (BirdLife International 2004). Similarly, this species has been listed as Least Concern
by (BirdLife International 2012).
14.4 Population trend
Despite some declines in Balkan populations of Whooper Swans, aggregate European populations of
this species are increasing (BirdLife International 2004). Within Ireland, numbers of this species have
increased at a mean rate of 2.6% annually since 2001 (Boland & Crowe 2012), from 14,079 in 2005
(Worden et al. 2009) to 14,981 in 2010 (Boland et al. 2010), and the island of Ireland now supports
more than 50% of the flyway population of the Icelandic breeding population (Boland & Crowe 2012;
Hall et al. 2012). Of this most recent count, 10,452 birds were counted in the Republic of Ireland
(Hall et al. 2012). Despite some flux in the importance of specific overwintering sites, there has been
no significant change in the number of internationally-important sites on the island of Ireland (n =
14) (Boland et al. 2010). Of the numerous sites at which this species occurs in Ireland, 16 are now of
Bird Sensitivity Mapping to Wind Energy Development - Guidance Document
81
national importance (Boland & Crowe 2012). Previous surveys did note, however, that these
increasing numbers (8%) are found in a decreasing number (-9%) of sites (Worden et al. 2009).
14.5 Breeding ecology
The Whooper Swan breeds in open shallow water, by coastal inlets, estuaries and rivers of Iceland
and north-eastern Europe. The population occurring in Ireland breeds exclusively in Iceland (Boland
& Crowe 2012). This species lays a single clutch each year of 4-5 eggs, which are incubated for 31-42
days (Brazil 2003). Though estimates of juvenile mortality are unavailable, adult survival in this
species is estimated at 0.801 (Brazil 2003).
14.6 Habitat requirements
This species winters at lakes, rivers, marshes, lagoons and sheltered inlets across Ireland and is
increasingly found in lowland open farmland, grassland and stubble. A recent survey indicated that
the use of improved dry pasture by this species has increased markedly since previous surveys (2005
and 2000), while occupation of lakes and rivers has dropped in the same period (Boland et al. 2010).
Indeed, the majority of observations in recent surveys have positioned Whooper Swans in pasture
and arable agricultural land (Worden et al. 2009; Boland et al. 2010). The diet of Whooper Swans
was formerly restricted to aquatic vegetation within 1m of the surface, but this species is
increasingly recorded grazing on grass in pasture and spilt grain, as well as roots, shoots, leaves,
rhizomes and tubers of tillage land (Boland et al. 2010).
14.7 Site fidelity
Given the growing threat to migratory birds internationally and the increasing population of this
species in Ireland, the importance of nationally- and internationally-important sites is generally
growing (Worden et al. 2009). However, the recent adaptation to farmland of varying types indicates
that this species has a reasonably broad habitat preference (Boland et al. 2010). In addition, the
recently observed flux of sites indicates that this species may not remain loyal to specific areas of
suitable habitat (Boland & Crowe 2012; Boland et al. 2010).
14.8 Sensitivity to development of wind energy
In general, this species has been identified as being at particular risk of disturbance displacement
and collision as a result of wind energy development (Langston & Pullan 2003). In particular,
exclusion from habitat around wind turbines has been identified (Larsen & Clausen 2002), in some
cases up to 300 m from wind energy installations (Percival 2003). Observations of swan non-
breeding activity from 8 European studies have given a mean minimum distance of 150 m from the
base of wind turbines (Hötker et al. 2006), while other studies have shown a reduction of 1-2.5% in
available habitat through disturbance displacement (Larsen & Clausen 1998). Whooper Swans have
the highest recorded migratory flight height of any species of bird, at up to 8km above sea level
(Elkins 1983). However, while moving between roosting and feeding sites, most flocks travel at
between 5 and 30 m, putting this species at a much higher risk of collision with medium and large
turbines, especially when the size and reduced manoeuvrability of this species is considered (Larsen
& Clausen 2002). Though Whooper Swans can avoid turbines and have been known to habituate to
these (especially resident birds) their risk of collision is much greater than that of other species. In
addition to collisions with turbines themselves, swans have a high observed collision rate with
overhead power lines, which may be associated with these installations (Langston & Pullan 2003).
Despite this, observed collision rates for Whooper Swans have remained low around the wind
Bird Sensitivity Mapping to Wind Energy Development - Guidance Document
82
energy installations of Europe (Hötker et al. 2006). It is therefore claimed that Whooper Swans are
most susceptible to collision with medium sized turbines (10 – 50 m blade height) in the low light
conditions of mornings and evenings during winter (Larsen & Clausen 2002). There may also be
seasonal variation in this exposure, as flight times have been shown to vary across over-wintering
periods (Larsen & Clausen 2002).
14.9 Zone of Sensitivity
Given the high risk of collision with wind turbines in comparison to other species and the observed
disturbance to occupied habitat up to 300 m (Percival 2003), Whooper Swans have been assigned a
zone of sensitivity of radius 600 m around occupied I-WeBS subsites. A more conservative approach
has been taken in this instance given the international importance of the Irish distribution of this
species.
14.10 Data sources
Data for this assessment was obtained from the Irish Wetland Bird Survey (I-WeBS) (Boland & Crowe
2012), and the International Swan Census of January 2010 (Boland et al. 2010; Hall et al. 2012). I-
WeBS is co-ordinated by BirdWatch Ireland and funded by the National Parks and Wildlife Service of
the Department of the Arts, Heritage and the Gaeltacht. The International Migratory Swan Census is
organised every five years and is carefully co-ordinated over one weekend in January in Ireland by
the I-WeBS Office and the Irish Whooper Swan Study Group, in Britain by the Wildfowl and Wetlands
Trust (WWT) and in Iceland by the Icelandic Institute of Natural History, with overall co-ordination by
WWT and the Wetlands International/ IUCN SSC Swan Specialist Group.
BirdLife International, 2004. Birds in the European Union: a status assessment, Wageningen, The Netherlands.
BirdLife International, 2012. Cygnus cygnus. The IUCN Red List of Threatened Species. Version 2014.2. Available at: www.iucnredlist.org [Accessed September 16, 2014].
Boland, H. et al., 2010. Whooper Cygnus cygnus and Bewick’s C. columbianus bewickii Swans in Ireland: results of the International Swan Census, January 2010. Irish Birds, 9(1), pp.1–10.
Boland, H. & Crowe, O., 2012. Irish Wetland Bird Survey: Waterbird Status and Distribution 2001/02 - 2008/09, Kilcoole, Wicklow.
Brazil, M., 2003. The Whooper Swan, London, United Kingdom: Poyser.
Colhoun, K. & Cummins, S., 2013. Birds of Conservation Concern in Ireland 2014 – 2019. Irish Birds, 9(4), pp.523–544.
Elkins, N., 1983. Weather and Bird Behaviour, Staffordshire, United Kingdom: Poyser.
Hall, C. et al., 2012. Population size and breeding success of Icelandic Whooper Swans Cygnus cygnus : results of the 2010 international census. , 62, pp.73–96.
Hötker, H., Thomsen, K.-M. & Jeromin, H., 2006. Impacts on biodiversity of exploitation of renewable energy sources: the example of birds and bats - facts, gaps in knowledge, demands for further research, and ornithological guidelines for the development of renewable energy exploitation, Bergenhusen, Germany.
Langston, R.H.W. & Pullan, J., 2003. Windfarms and Birds : An analysis of the effects of windfarms on birds , and guidance on environmental assessment criteria and site selection issues, RSPB/BirdLife.

Bird Sensitivity Mapping to Wind Energy Development - Guidance Document
83
Larsen, J.K. & Clausen, P., 1998. Effekten paa sangsvane ved etablering af en vindmoellepark ved Overgaard gods. [Effect of wind turbine array establishment at the Overgaard manor on whooper swan] DMU report nr. 235, Roskilde, Denmark. Available at: www.dmu.dk.
Larsen, J.K. & Clausen, P., 2002. Potential Wind Park Impacts on Whooper Swans in Winter: The Risk of Collision. Waterbirds: The International Journal of Waterbird Biology, 25, pp.327–330.
Percival, S.M., 2003. Birds and Wind Farms in Ireland: A Review of Potential Issues and Impact Assessment. , (December).
Worden, J. et al., 2009. Population size and breeding success of the Icelandic Whooper Swan Cygnus cygnus: results of the January 2005 international census. Wildfowl, 59, pp.17–40.
Bird Sensitivity Mapping to Wind Energy Development - Guidance Document
84
15 Bewick’s Swan (Cygnus columbianus bewickii)
15.1 Characteristics
The Bewick’s Swan (a subspecies of the Tundra Swan, found in the western Palearctic distribution of
this species) is the smallest of the three swan species occurring in Ireland. They have a white body
with yellow and black bill (yellow at the base, with the yellow not reaching the nostril or extending
along the sides towards the bill tip, as in the Whooper Swan (Cygnus olor). The neck of the Bewick’s
Swan is also shorter than that of a Whooper Swan.
15.2 Range in Ireland
The Tundra Swan has a wide global distribution, spanning most Arctic latitudes while breeding and
extending south to China, Western Europe and coastal North America while wintering. The Bewick’s
subspecies has two distinct populations, one of which winters in north-western Europe following
breeding in Arctic Russia (BirdLife International 2014). This includes an increasingly limited
distribution in Ireland, from November to March at a diminishing number of wetlands in Counties
Wexford and Roscommon (Boland & Crowe 2012). Ireland is the westernmost wintering site of this
Western Europe flyway rendering the Irish distribution at greater risk of contractions or
modifications to the species’ overall distribution.
15.3 Conservation status
The Bewick’s Swan is Red-listed in Ireland (Colhoun & Cummins 2013) due to a severe decline in the
numbers wintering in Ireland along with a decrease in the number of sites at which they occur. The
European wintering population of this species has declined in several countries ‒ including marked
declines in Ireland, the Netherlands and Albania ‒ and is consequently regarded as Vulnerable
(BirdLife International 2004). It is also listed under Annex I of the EC Council Directive on the
Conservation of Wild Birds (2009/147/EC). Internationally, however, the Tundra Swan is not
considered threatened owing to its extremely wide range and a global population of over 300,000
individuals (Wetlands International 2006).
15.4 Population trend
Although international numbers may be experiencing a slow decline (BirdLife International 2014), in
Ireland the Bewick’s Swan is regarded as experiencing one of the most dramatic declines of any
wintering species (Austin et al. 2014). Specifically, this species has undergone an 83.2% short-term
decline (2003/04 – 2008/09) and a 92.9% decline since 1994/95 (Boland & Crowe 2012). This has
resulted in a mere 80 individuals, recorded in Ireland in the most recent international migratory
swan census in 2010 (Boland et al. 2010). In addition, a very small proportion of these birds are
believed to be first-winter birds, suggesting that little recruitment to this migratory population is
occurring. Although reduced habitat suitability in Ireland may be a contributing factor to this decline,
the main driver of this decline is thought to be a reduced tendency of birds to migrate as far west as
Ireland. In general, there is continuing speculation that migratory species, such as Bewick’s Swans,
are opting to winter closer to breeding grounds (Worden et al. 2009; Bright et al. 2009), potentially
driven by climate change, intensified agricultural practices or supplemental feeding along migratory
routes. This reduction of Bewick’s Swan numbers is mirrored to a lesser extent by a European
decline of 30% since 1990 (BirdLife International 2004). Furthermore, the 10 year trend (2001 –
2011) in the UK stands at -17%, while measurement over the past 25 years shows a 41% decline in
Bird Sensitivity Mapping to Wind Energy Development - Guidance Document
85
numbers (Austin et al. 2014). Given Ireland’s position at an extremity of migration, Irish populations
may simply be experiencing greater proportional loss than central European populations.
15.5 Breeding ecology
The population of Bewick’s Swan that winters in Ireland breeds in Arctic northern Russia. Amongst a
variety of open tundra habitats, they lay a single clutch annually of 3-5 eggs, which are incubated for
30 days (Snow & Perrins 1998). Juvenile survival in this species is estimated at 0.66, while that of
adults is circa. 0.822 (Rees 2006).
15.6 Habitat requirements
The majority of the European population winters in low-lying wet pasture, lakes, ponds and stubble
of Germany, the Netherlands and Britain. While wintering distribution in Ireland is limited, Bewick’s
Swans utilise a suite of brackish and freshwater marshes in the southeast of the country where the
majority of birds are recorded. Here they can be found foraging in water or on flooded pasture, their
diet being mainly composed of plant material including tubers, shoots and leaves. Terrestrial grazing
in its European wintering habitat is a relatively recent phenomenon (Colhoun & Day 2002), to the
point where 74% of wintering Bewick’s Swans in Britain and Ireland are now found on pasture or
arable land (Rees et al. 1997).
15.7 Site fidelity
Given the extremely limited winter distribution of this species in Ireland which has not changed
across several survey years, site fidelity is high for this species. Having said this, the general decline
in Irish numbers is likely a result of an eastward contraction of this population to favour the use of
wintering sites closer to their breeding grounds in Russia. Thus, any changes in the suitability of
remaining wintering sites in Ireland through impacts associated with wind energy infrastructure may
result in the loss of this species from Ireland.
15.8 Sensitivity to development of wind energy
In general, this species has been identified as being at particular risk of disturbance displacement
and collision as a result of wind energy development (Langston & Pullan 2003). The low population
of this species and its very restricted distribution within Ireland means that any disturbance due to
habitat modification will have a disproportionately large effect on its survival. In terms of collision
risk, the height at which Bewick’s (Tundra) Swans migrate has been found to coincide closely with
wind turbines on flat lowlands, with over 50% of bird flight occurring within blade height (Howe et
al. 2002). Conversely, hilltop sites were found not to have the same impact, with large waterfowl
(including Bewick’s Swans) tending to use surrounding valleys for passage (Mossop 1997). The
number of sites in both of these North American case studies was limited, however. A recent study
which modelled the susceptibility of migrating Bewick’s Swans to collision with wind turbines in
Europe found that increases in rotation speed and bird flight speed are likely to substantially
increase the mortality rate due to collision (Chamberlain et al. 2006), owing to this species’ large size
and reduced flight manoeuvrability. Actual accounts of such collisions across the EU are limited,
however (Hötker et al. 2006). In addition to collisions with turbines themselves (Langston & Pullan
2003), swans have a high observed collision rate with overhead power lines associated with these
installations (Rose & Baillie 1989; Butler 1999). In relation to offshore wind farms, Bewick’s (Tundra)
Swans were regarded as being extremely sensitive to wind farm development, owing to their low
Bird Sensitivity Mapping to Wind Energy Development - Guidance Document
86
relative abundance and high demographic elasticity (i.e. the proportional change in population
through reduction in adult survival) (Desholm 2009).
15.9 Zone of Sensitivity
Given the high risk of collision with wind turbines in comparison to other species and the observed
disturbance to occupied habitat up to 300 m (Percival 2003), Bewick’s Swans have been assigned a
zone of sensitivity of radius 600 m around the limited number of occupied I-WeBS subsites in which
they occur. A more conservative approach has been taken in this instance given the international
importance of the Irish distribution of this species and its precarious and declining nature.
15.10 Data sources
Data for this assessment was obtained from the Irish Wetland Bird Survey (I-WeBS) (Boland & Crowe
2012), and the International Swan Census of January 2010 (Boland et al. 2010; Hall et al. 2012). I-
WeBS is co-ordinated by BirdWatch Ireland and funded by the National Parks and Wildlife Service of
the Department of the Arts, Heritage and the Gaeltacht. The International Migratory Swan Census is
organised every five years and is carefully co-ordinated over one weekend in January in Ireland by
the I-WeBS Office and the Irish Whooper Swan Study Group, in Britain by the Wildfowl and Wetlands
Trust (WWT) and in Iceland by the Icelandic Institute of Natural History, with overall co-ordination by
WWT and the Wetlands International/ IUCN SSC Swan Specialist Group.
Austin, G.E. et al., 2014. Waterbirds in the UK 2011/12. The Wetland Bird Survey, Thetford, United Kingdom.
BirdLife International, 2004. Birds in the European Union: a status assessment, Wageningen, The Netherlands.
BirdLife International, 2014. Species Factsheet: Cygnus columbianus. Available at: http://www.birdlife.org [Accessed September 19, 2014].
Boland, H. et al., 2010. Whooper Cygnus cygnus and Bewick’s C. columbianus bewickii Swans in Ireland: results of the International Swan Census, January 2010. Irish Birds, 9(1), pp.1–10.
Boland, H. & Crowe, O., 2012. Irish Wetland Bird Survey: Waterbird Status and Distribution 2001/02 - 2008/09, Kilcoole, Wicklow.
Bright, J.A. et al., 2009. Mapped and written guidance in relation to birds and onshore wind energy development in England,
Butler, D.S., 1999. Rate of Bewick’s and Whooper Swan Collisions with Power lines: A review of a marking programme by The National Grid Company plc. University of Bristol.
Chamberlain, D.A.N.E. et al., 2006. The effect of avoidance rates on bird mortality predictions made by wind turbine collision risk models. Ibis, 148, pp.198–202.
Colhoun, K. & Cummins, S., 2013. Birds of Conservation Concern in Ireland 2014 – 2019. Irish Birds, 9(4), pp.523–544.
Colhoun, K. & Day, K.R., 2002. Effects of Grazing on Grasslands by Wintering Whooper Swans. Waterbirds: The International Journal of Waterbird Biology, 25, pp.168–176. Available at: http://www.jstor.org/stable/1522350.
Desholm, M., 2009. Avian sensitivity to mortality: prioritising migratory bird species for assessment at proposed wind farms. Journal of environmental management, 90(8), pp.2672–9.
Bird Sensitivity Mapping to Wind Energy Development - Guidance Document
87
Hötker, H., Thomsen, K.-M. & Jeromin, H., 2006. Impacts on biodiversity of exploitation of renewable energy sources: the example of birds and bats - facts, gaps in knowledge, demands for further research, and ornithological guidelines for the development of renewable energy exploitation, Bergenhusen, Germany.
Howe, R.W., Evans, W. & Wolf, A.T., 2002. Effects of Wind Turbines on Birds and Bats in Northeastern Wisconsin, Green Bay, Wisconsin, USA.
Langston, R.H.W. & Pullan, J., 2003. Windfarms and Birds : An analysis of the effects of windfarms on birds , and guidance on environmental assessment criteria and site selection issues, RSPB/BirdLife.
Mossop, D.H., 1997. Five Years of Monitoring Bird Strike Potential at a Mountain-Top Wind Turbine, Yukon Territory: Annual Canadian Wind Energy Conference & Exhibition., Whitehorse, Yukon, Alaska.
Rees, E., 2006. Bewick’s Swan, London, United Kingdom: Poyser.
Rees, E.C., Kirby, J.S. & Gilburn, A., 1997. Site selection by swans wintering in Britain and Ireland; the importance of habitat and geographic location. Ibis, 139(2), pp.337–352.
Rose, P. & Baillie, S., 1989. The effects of collisions with overhead lines on British birds: an analysis of ringing recoveries. Unpublished BTO report to the Central Electricity Generating Board, Thetford, United Kingdom.
Snow, D.W. & Perrins, C.M., 1998. The Birds of the Western Palearctic Vol. 1: Non-passerines, Oxford, UK: Oxford University Press.
Wetlands International, 2006. Waterbird Population Estimates - Fourth Edition, Wageningen, The Netherlands.
Worden, J. et al., 2009. Population size and breeding success of the Icelandic Whooper Swan Cygnus cygnus: results of the January 2005 international census. Wildfowl, 59, pp.17–40.
Bird Sensitivity Mapping to Wind Energy Development - Guidance Document
88
16 Grey Partridge (Perdix perdix)
16.1 Characteristics
The Grey Partridge is a compact, predominantly ground-dwelling bird with rounded body and wings,
small bill, short rusty-red tail, a small rounded head and sturdy legs. Adults have brownish finely
marked upperwings and a grey, very finely marked body with bold dark brown bars on the flanks.
The 'face' and throat of the bird is orangey-brown, the belly and under tail is white; males have a
brown belly patch and the females have a small patch or none at all. Juveniles are unlike adult birds
and are more like Pheasant (Phasianus colchicus) or Quail (Coturnix coturnix) chicks. Grey Partridges
remain in cover and are rarely seen except in flight, which they will only do for a short distance and
only a few metres above the ground.
16.2 Range in Ireland
The Grey Partridge is a widespread species and its expansive European distribution accounts for less
than half of its global range (BirdLife International 2004). It is thought that this species expanded to
Western Europe along with human agriculture, particularly the cultivation of cereals, from its origins
in eastern steppe habitat. Though originally possessing a wide distribution in Ireland (expect for
Connaught and Donegal) self-sustaining wild populations are now only found in two locations; one in
Fingal, north Co. Dublin and the other at Boora Bog in Co. Offaly. Although other smaller populations
exist elsewhere, these records are from recent captive breeding release programmes and are not
self-sustaining populations. The more secure 25km2 site at Boora has been slowly expanding radially,
owing to an intensive conservation project, including habitat management, predator control and
captive breeding.
16.3 Conservation status
This species is currently Red-listed due to its small and localised breeding population and a
significant historical decline (Colhoun & Cummins 2013). Though widespread, the European
population is considered to be Vulnerable, due to significant declines in several key populations,
including in France and Poland (BirdLife International 2004). Two localised European subspecies of
Grey Partridge, in Italy (P. p. italic) and Spain (P. p. hispaniensis), are listed under Annex I of the EC
Council Directive on the Conservation of Wild Birds (2009/147/EC).
16.4 Population trend
Grey Partridge populations have experienced significant population declines from the mid. 20th
century. Though these declines have slowed in some of its wider range globally, reductions in
numbers are continuing (BirdLife International 2004). The remaining Irish population of Irish Grey
Partridges was thought to have reached as low as 20 breeding pairs in Co. Offaly, though a recovery
is now underway as a result of concerted conservation efforts, bringing numbers to an estimated
180-200 pairs. Though this species was historically found across the majority of Ireland, the sharp
population decline is attributed to a decline in breeding success. Across the Grey Partridge’s
European distribution, this decrease in breeding success (especially in the early stages of this
species’ decline) has been attributed to three main drivers relating to changes in agricultural
practices: 1) an increase in pesticide use, 2) general intensification and mechanisation of practices
and 3) the reduced presence of grazing pastures (Kuijper et al. 2009). Predation by raptors such as
Hen Harriers (Circus cyaneus) has also been identified as a driver of decline and in some cases was
Bird Sensitivity Mapping to Wind Energy Development - Guidance Document
89
found to account for up to 70% of adult bird mortality (Bro et al. 2001). It is thought that predation
and continued hunting pressure are potential drivers of more recent slower declines in numbers. In
general, however, nest depredation is thought to limit Grey Partridge populations more than raptor
depredation (Watson et al. 2007). In one study, experimental removal of key ground predators such
as Foxes (Vulpes vulpes), Carrion Crows (Corvus corone) and Magpies (Pica pica) resulted in a 3.5-fold
increase in autumn populations (Tapper et al. 1996). Conversely, a study assessing areas containing
prey and predator species in addition to shooting pressures identified shooting as the stronger
limitation to population growth (Watson et al. 2007). Of non-shot carcasses found in this study, 40%
were attributed to raptors while the remaining 60% were attributed to fox depredation.
16.5 Breeding ecology
Grey Partridge nest on the ground. In an Irish context, wild breeding attempts mainly occur in young
forestry plantations and prepared habitat strips (O’Gorman et al. 1999). Ordinarily, a single clutch of
13-16 eggs is laid once annually, beginning in late April, and is incubated for 23-25 days. Fledging
occurs after a further 14-16 days. Despite the high potential fecundity in this species, juvenile
survival is extremely low, at 0.22 (Saether 1989). In general, chick survival has been found to
increase with availability of arthropod prey (Green 1984), which may possibly be linked to increased
June and July temperatures and higher invertebrate productivity. A meta-analysis of several
European studies relating to Grey Partridge chick survival has confirmed an overall decrease over the
past century, revealing a phase shift from pre-1950s survival rates (~50%) to contemporary survival
levels (~35%). It is thought that this was driven by a steep increase in pesticide use, thus reducing
arthropod prey availability (Kuijper et al. 2009). Furthermore, predation pressure was found to
operate a key control on production levels in Grey Partridge populations (Tapper et al. 1996),
potentially explaining the low adult survival rate of 0.55 (Balmer & Peach 1997) and likely
exacerbates existing reductions resulting from habitat degradation (Watson et al. 2007).
16.6 Habitat requirements
This species is associated with agricultural land, principally cereal growing areas, with tall or dense
cover in close proximity. Originating from eastern steppe grasslands, in Ireland this species can be
found in a very restricted area of cutaway bogs, coniferous plantations and reinstated strips of
suitable habitat (O’Gorman et al. 1999). A study of Italian Grey Partridge populations found habitat
use within its distribution to be concentrated on the edges of preferred habitat, particularly
hedgerows and rough edges of croplands (Meriggi et al. 1991), while an English study found 97% of
broods to be associated with cereal crops (Green 1984) . The diet of this species is mainly plant
material ‒ including the green leaves of grasses, cereals and clover, grain and weed seeds ‒ although
individuals will take a variety of arthropods, especially when feeding young (Green 1984). Indeed the
availability of arthropod prey has been found to heavily influence breeding success.
16.7 Site fidelity
The Grey Partridge is an extremely sedentary species across years and each season wintering birds
are found within or very close to their breeding areas. Some birds may not move more than one
kilometre from where they hatched, with observed reductions in breeding success for those
individuals which disperse further (Green 1984). Indeed, this study found that most (70%) of Grey
Partridges will remain within a single field adjacent to the roosting/nesting hedgerow.
Bird Sensitivity Mapping to Wind Energy Development - Guidance Document
90
16.8 Sensitivity to development of wind energy
A recent pan-European assessment of wind energy impacts on bird populations has identified some
habituation of this species to wind energy infrastructure (Hötker et al. 2006). Given this species
extremely low dispersal, any disturbance to existing suitable habitat is likely to have a
disproportionately large effect on populations of this species. Any modifications of this habitat which
affect breeding success (such as reductions on arthropod prey availability) will predominantly impact
the continued recovery of this species (Kuijper et al. 2009). Installation of wind energy infrastructure
within this species’ range must not, therefore, impact availability of invertebrate prey or markedly
change vegetation composition. There is no evidence of any collision impact risk for this species.
16.9 Zone of Sensitivity
Given the very limited dispersal of this species, within a measured diameter of 400m (Green 1984) ,
a zone of sensitivity of radius 500m has been imposed around those fields containing Grey Partridge
in the two remaining islands of its Irish distribution. Additionally, the precarious nature of this
species’ remaining distribution has necessitated this expansion to include areas into which this
species is likely to expand.
16.10 Data sources
Data for this assessment has been obtained through an annual comprehensive survey of self-
sustaining Grey Partridge populations, coordinated by the National Parks and Wildlife Service
(NPWS) and the Irish Grey Partridge Conservation Trust (IGPCT) (unpublished data).
Balmer, D.E. & Peach, W.J., 1997. Review of Natural Avian Mortality Rates: BT0 Research Report No. 175, Thetford, UK.
BirdLife International, 2004. Birds in the European Union: a status assessment, Wageningen, The Netherlands.
Bro, E. et al., 2001. Diagnosing the environmental causes of the decline in Grey Partridge Perdix perdix survival in France. Ibis, 143(1), pp.120–132.
Colhoun, K. & Cummins, S., 2013. Birds of Conservation Concern in Ireland 2014 – 2019. Irish Birds, 9(4), pp.523–544.
Green, R.E., 1984. The Feeding Ecology and Survival of Partridge Chicks (Alectoris rufa and Perdix perdix) on Arable Farmland in East Anglia. Journal of Applied Ecology, 21(3), pp.817–830.
Hötker, H., Thomsen, K.-M. & Jeromin, H., 2006. Impacts on biodiversity of exploitation of renewable energy sources: the example of birds and bats - facts, gaps in knowledge, demands for further research, and ornithological guidelines for the development of renewable energy exploitation, Bergenhusen, Germany.
Kuijper, D., Oosterveld, E. & Wymenga, E., 2009. Decline and potential recovery of the European grey partridge (Perdix perdix) population—a review. European Journal of Wildlife Research, 55(5), pp.455–463.
Meriggi, A., Montagna, D. & Zacchetti, D., 1991. Habitat use by partridges ( perdix perdix and alectoris rufa) in an area of northern apennines, Italy. Bolletino di zoologia, 58(1), pp.85–89.
O’Gorman, E.C., Kavanagh, B.P. & Rochford, J., 1999. Home range and habitat use of the endangered grey partridge (perdix perdix) in the Irish midlands. In S. Farago, ed. Perdix VIII, International symposium on partridges, quails and pheasants. pp. 211–228.

Bird Sensitivity Mapping to Wind Energy Development - Guidance Document
91
Saether, B.E., 1989. Survival Rates in relation to body weight in European birds. Ornis Scandinavica, 20(1), pp.13–21.
Tapper, S.C., Potts, G.R. & Brockless, M.H., 1996. The Effect of an Experimental Reduction in Predation Pressure on the Breeding Success and Population Density of Grey Partridges Perdix perdix. Journal of Applied Ecology, 33(5), pp.965–978.
Watson, M. et al., 2007. The Relative Effects of Raptor Predation and Shooting on Overwinter Mortality of Grey Partridges in the United Kingdom. Journal of Applied Ecology, 44(5), pp.972–982.
Bird Sensitivity Mapping to Wind Energy Development - Guidance Document
92
17 Red Grouse (Lagopus lagopus hibernicus)
17.1 Characteristics
The Red Grouse is a medium-sized game bird. Males have a distinctive red comb above each eye
and generally a darker chestnut coloured plumage than females, which are lighter in colour and lack
an obvious comb. Well camouflaged amongst heathery habitats, this largely ground-dwelling species
can be hard to detect unless flushed or when males are displaying (i.e. crowing) in spring. Red
Grouse (Lagopus lagopus scoticus) are a sub-species of Willow Grouse/Ptarmigan (Lagopus lagopus)
which have a circumpolar distribution and are largely found on tundra, bogs and heaths. Recent
research indicates that the Irish Red Grouse (L. l. hibernicus) is a genetically distinct subspecies, from
its nearest neighbour L.l. scoticus (McMahon et al. 2012).
17.2 Range in Ireland
Internationally, Willow Grouse are a widespread species across much of northern Europe, which
accounts for less than half of its global range spanning across the majority of Arctic and sub-Arctic
terrestrial regions (BirdLife International 2004). In Ireland, Red Grouse are largely restricted to areas
of blanket bog and heath along western and north-western counties in particular, with strongholds
also occurring in the Slieve Blooms, Co. Laois and in the east (Wicklow and Dublin Mountains) and
southeast (Knockmealdown and Comeragh Mountains). Few now remain on the raised bogs of
Midland counties, which is no longer suitable grouse habitat due to the extent of mechanised turf
cutting in this region (Cummins et al. 2010). Average densities of 1.1 birds/km2 in spring are typical
in Ireland, although numbers can be several times that in strongholds, such as the Wicklow
Mountains (Cummins et al. 2010).
17.3 Conservation status
The Red Grouse is protected under the Wildlife Act, 1976-2000, as amended (Republic of Ireland)
and it currently resides on the Irish Red List of Birds of Conservation Concern (Colhoun & Cummins
2013). It is listed under Annex II of the EC Council Directive on the Conservation of Wild Birds
(2009/147/EC).
17.4 Population trend
As our only native species of grouse, the Red Grouse has suffered from a serious decline in range
(50%) in the past 40 years, with an estimated population of 2,100 breeding pairs remaining
(Cummins et al. 2010). A study in Northern Ireland in 2004 highlighted a similar dramatic decline,
with a national population estimate of just 202 breeding pairs (Allen et al. 2004; Allen et al. 2005).
A large amount of data was collected for the national Red Grouse Survey 2006-08 in the Republic of
Ireland, whereby 491 1km squares across 188 10km squares were specifically surveyed for Red
Grouse. In total, 229 1km squares in a total of 107 10km squares were occupied (Cummins et al.
2010). Specific survey methodologies were used during this national survey, which included using
tape-playback methodologies (Cummins et al. 2010). In terms of long term trends, the population in
Ireland has thought to have been in decline since the 1970s (BirdLife International 2004), with land-
use changes and habitat loss considered the biggest driver of these declines (Cummins et al. 2010).
17.5 Breeding ecology
Males establish territories in late autumn/winter (months before the breeding season) with
territorial males calling at dawn and dusk, albeit less so in daytime particularly in the case of low
Bird Sensitivity Mapping to Wind Energy Development - Guidance Document
93
density populations (Watson & Jenkins 1963). Males generally pair with one female in low density
populations (Watson & Moss 2008), with pairs defending territories until after the eggs hatch.
Generally single-brooded, the average number of chicks hatched successfully in Ireland is 2.9.
Although these chicks are fully feathered when hatched, they still require brooding until they are 7-
10 days old and reach full maturity at 12 weeks (Watson & O’Hare 1979). Despite no recent data on
productivity for Irish populations, it is known that most males pair with a single female, but can pair
with two females while some remain unmated, particularly in low density populations (Lance 1976).
In other studies, breeding female numbers have been found to be largely determined by the
numbers of territorial males (Moss et al. 1996; Mougeot et al. 2003; Matthiopoulos et al. 2003).
17.6 Habitat requirements
The Red Grouse is associated with specific habitat types, namely heaths, blanket bogs and raised
bogs (Cramp & Simmons 1980). Its diet is almost exclusively Ling Heather (Calluna vulgaris) (Watson
& Jenkins 1963; Lance 1976; Finnerty et al. 2007) and therefore its distribution is restricted to
peatland habitats supporting heather, particularly heather aged between 2-8 years (Savory 1978).
The Red Grouse also requires heather for shelter and for nesting (Watson & Jenkins 1963).
Historically, this species was among the most characteristic birds of Ireland’s bogs, given its unique
association with these habitats and heather where it spends its entire life cycle (Watson & O’Hare
1979). Thus, populations in Ireland are intrinsically linked with habitat availability and habitat
quality. Nowadays, most of the Red Grouse population remaining is limited to areas of blanket bog
or heath (Cummins et al. 2010). Nowadays and in the past, a number of suitable areas for Red
Grouse in Ireland have had heather management and predator control in place to improve local
conditions for Red Grouse, in order to boost local populations (All Ireland Species Action Plan for Red
Grouse 2013). In the spring, Cotton Grass (Eriophorum sp.) shoots are an important food source for
adults, being higher in essential nutrients like protein and phosphorous than heather (Watson &
Moss 2008). The prevalence of insects on blanket bogs in the summer is also an important food
supply for young grouse chicks (Savory 1977). Red Grouse regularly swallow grit (preferring quartz
granules where available) to aid digestion.
17.7 Site fidelity
Philopatry is evident in Red Grouse populations, with young males breeding near where they hatch
while hens move further from natal areas to avoid inbreeding (Watson & Moss 2008). This
sedentary nature can make populations more vulnerable to rapid habitat changes and population
may not be able to adapt quickly enough to such changes.
17.8 Sensitivity to development of wind energy
The largely sedentary nature of Red Grouse (Wernham et al. 2002), rarely dispersing more than 4km
from natal territories (Warren & Baines 2007), means that populations of this species are particularly
susceptible to habitat losses and fragmentation and changes in habitat quality (Lance 1976). Given
that national renewable energy targets are set at 20% by 2020 (Directive 2009/28/EC), the
expansion of new and existing wind farms on unprotected peatlands is likely to increase (Renou-
Wilson et al. 2011). Mitigation of potential impacts on Red Grouse, such as the creation of Habitat
Enhancement Areas adjacent to wind farms should thus be considered (All Ireland Species Action
Plan for Red Grouse 2013). The occurrence of Red Grouse near wind energy access routes in a
Scottish case study was found to be higher than in the surrounding moor (Pearce-Higgins et al.
2009). Additionally, populations of Red Grouse were found to recover within one year after
Bird Sensitivity Mapping to Wind Energy Development - Guidance Document
94
disturbance caused by construction of wind farms (Pearce-Higgins et al. 2012), although densities of
Red Grouse in Scotland, where this study was carried out, are generally much higher than in Ireland.
This same study found that Red Grouse numbers were more strongly impacted by larger wind farm
developments. In terms of direct collision, Willow Ptarmigan (a close relative of Red Grouse)
collisions at the Smola Wind Farm in Norway were investigated by Bevanger et al. (2010). Of 84
carcasses found between August 2005 and December 2010, 74 mortalities were attributed to
collisions (likely with masts as opposed to turbines). The majority of these birds were killed between
March and June, suggesting that collision risk may be higher during the breeding season. The
authors also noted a high scavenger bias for Willow Ptarmigan, suggesting that the total number of
mortalities is likely to be higher.
17.9 Zone of Sensitivity
Given the very limited dispersal of this species and its mainly ground-based life history, a zone of
sensitivity of radius 500m has been imposed around observations recorded during the most recent
Red Grouse Survey. Additionally, the high value of uplands in Ireland for potential wind energy
development puts this species at greater threat in general.
17.10 Data sources
Data for this assessment has been obtained through the combination of a comprehensive survey of
this species across 2006 – 2008 (Cummins et al. 2010) and additional casual observations from
observers spanning 2000 – 2011.
Allen, D., Mellon, C. & Mawhinney, K., 2004. The Status of Red Grouse in Northern Ireland 2004., Belfast.
Allen, D., Mellon, C. & Mawhinney, K., 2005. The Status of Red Grouse Lagopus lagopus in Northern Ireland 2004. Irish Birds, 7, pp.449 – 460.
Bevanger, K. et al., 2010. Pre- and post-construction studies of conflicts between birds and wind turbines in coastal Norway (BirdWind). Report on findings 2007-2010. - NINA Report 620.,
BirdLife International, 2004. Birds in the European Union: a status assessment, Wageningen, The Netherlands.
Colhoun, K. & Cummins, S., 2013. Birds of Conservation Concern in Ireland 2014 – 2019. Irish Birds, 9(4), pp.523–544.
Cummins, S. et al., 2010. The status of Red Grouse in Ireland and the effects of land use, habitat and habitat quality on their distribution. Results of the national Red Grouse Survey 2006 - 2008,
Finnerty, E.., Dunne, J. & McMahon, B.., 2007. Evaluation of Red Grouse Lagopus lagopus scoticus habitat in the Connemara National Park. Irish Birds, 8, pp.207 – 214.
Lance, A.., 1976. The Red Grouse Project at Glenamoy: A preliminary report on the work from 1971-1976., Dublin.
Matthiopoulos, J. et al., 2003. Territorial behaviour and population dynamics in red grouse Lagopus lagopus scoticus. II. Population models. Journal of Animal Ecology, 72, pp.1083–1096.
McMahon, B.J. et al., 2012. Genetic variation among endangered Irish red grouse (Lagopus lagopus hibernicus) populations: implications for conservation and management. Conservation Genetics, 13(3), pp.639–647.
Bird Sensitivity Mapping to Wind Energy Development - Guidance Document
95
Moss, R., Watson, A. & Parr, R., 1996. Experimental Prevention of a Population Cycle in Red Grouse. Ecology, 77, pp.1512–1530.
Mougeot, F. et al., 2003. The effect of aggressiveness on the population dynamics of a territorial bird. Nature, 421, pp.737–739.
Pearce-Higgins, J.W. et al., 2012. Greater impacts of wind farms on bird populations during construction than subsequent operation: results of a multi-site and multi-species analysis. Journal of Applied Ecology, 49(2), pp.386–394.
Pearce-Higgins, J.W. et al., 2009. The distribution of breeding birds around upland wind farms. Journal of Applied Ecology, pp.1323–1331.
Renou-Wilson, F. et al., 2011. Bogland: Sustainable Management of Peatlands in Ireland. Strive Report Series, No. 75.,
Savory, C.., 1977. The food of red grouse chicks Lagopus L. scoticus. Ibis, (119), pp.1–9.
Savory, C.J., 1978. Food consumption of red grouse in relation to the age and productivity of heather. Journal of Animal Ecology, 47, pp.269–282.
Warren, P. & Baines, D., 2007. Dispersal distances of juvenile radiotagged Red Grouse Lagopus lagopus scoticus on moors in northern England. Ibis, 149, pp.758–762.
Watson, A. & Moss, R., 2008. Grouse The Natural History of British and Irish Species New Natura., Collins.
Watson, A. & O’Hare, P.., 1979. Bird and mammal numbers on untreated and experimentally treated Irish bog [Mayo, Ireland]. Oikos, 33, pp.97–105.
Watson, P. & Jenkins, D., 1963. Notes on the behaviour of the Red Grouse. British Birds, 57, pp.137–169.
Wernham, C.V. et al. eds., 2002. The Migration Atlas: movements of the birds of Britain and Ireland, London: T & A.D. Poyser.
Bird Sensitivity Mapping to Wind Energy Development - Guidance Document
96
18 Corncrake (Crex crex)
18.1 Characteristics
Corncrakes (Crex crex) are members of the Rallidae family, which are small to medium sized
secretive bird, nesting and feeding in a variety of aquatic, marshy and dry grassland habitats (Cramp
& Simmons 1980). They breed annually in Ireland and are migratory, wintering in sub Saharan
Africa. Their plumage is mostly brown, with barred flanks and they have short broad wings which
are a striking chestnut colour.
18.2 Range in Ireland
The current breeding range of the Corncrake extends eastwards from Ireland through northern and
central Europe, across to western Siberia, with regular breeding recorded in just under 50 countries.
The current global population is estimated at between 1.8 and 3.2 million, with 1-1.5 million of these
in European Russia (BirdLife International 2004). Widespread throughout Ireland at the beginning of
the last century, by the late 1970s the population was mostly confined to northern and western
counties. Currently, this species is found only in Donegal, Galway, Mayo and Sligo, with just a couple
of pairs on the Shannon Callows. They are mostly found in grassland habitats near to the coast and
on offshore islands.
18.3 Conservation status
Currently this species is Red-listed in Ireland due to significant declines in range and population
(Colhoun & Cummins 2013). Additionally, though it is listed on the IUCN Red List of Threatened
Species in the Least Concern category, following upward revisions of the global population estimates
(BirdLife International 2012), Corncrakes are listed under Annex I of the EC Council Directive on the
Conservation of Wild Birds (2009/147/EC) due to declines in range and population throughout
Europe.
18.4 Population trend
In the late 1960s, the Breeding Atlas estimated the population in Ireland to be around 4000 pairs
(Sharrock 1976), but a systematic survey in 1978 recorded just under 1,500 birds (O’Meara 1979),
over half of which were in northern and western counties. In the last 40 years, there has been a 90%
decline in range and the current population is probably between 150 and 200 pairs (NPWS,
unpublished data). In Europe, populations of this species have fluctuated in recent times and have
broadly remained stable between 1990 and 2000 (BirdLife International 2004). Increases in intensive
silage cutting, which is usually done earlier in the Corncrakes breeding season (Newton 2004).
18.5 Breeding ecology
Corncrakes arrive on their breeding grounds from mid-April onwards, with males establishing
territories. Between late May and early July, they sing continuously from midnight onwards, for
several hours from the same location within their territory, with a diagnostic crek-crek call to attract
a female. Once egg laying is complete, they usually move to a new location. The nest is well
concealed on the ground in tall vegetation, with the females alone incubating the eggs and caring for
the brood until they are about 10 days old, when they become independent. Two broods of between
Bird Sensitivity Mapping to Wind Energy Development - Guidance Document
97
5 and 10 chicks are usually laid six weeks apart, with the first in early to mid-June. The juveniles are
flightless until about 5 weeks old (Cramp & Simmons 1980). Return migration begins in August with
the males and continues to September, with females and second brood juveniles leaving last
(Donaghy et al. 2011). Chick survival is high in the absence of mowing, but adult survival is generally
low at just under 30% (Green 2004).
18.6 Habitat requirements
Corncrakes are the most terrestrial of all the rails, being found in dry or damp vegetation. The
essential characteristic of preferred vegetation is that it is tall enough throughout the breeding cycle
to conceal the birds (>20cm in height from mid-April onwards) and that it retains an open structure
as the season progresses (Tyler 1996; Green 1996). This allows birds to move quickly and easily
through the habitat without being seen; vegetation which becomes too dense as the season
progresses tends to be avoided (Tyler 1996). The provision of patches of tall cover such as nettles
and iris or cow parsley, which are >20cm in height, in April is a key measure to provide suitable
habitat, as is the delaying of mowing or grazing in meadows until after the peak of hatching of
second broods in early August. The provision of some patches of late cover, such as unmown
headlands in meadows to provide cover for second brood chicks until their departure in September
is also essential (Donaghy et al. 2011).
18.7 Site fidelity
Data indicate that most individuals of this species return to within 1-2 km of their natal site, meaning
that site fidelity is high. Movements of between 10 and 50 km have been recorded, however (Green
1996). As Corncrake distribution is very restricted and suitable habitat continues to decline,
remaining occupied sites are of high priority.
18.8 Sensitivity to development of wind energy
This species has been identified as being at particular risk from wind energy developments through
habitat displacement and collision risk (European Commission 2011). Further, previous studies have
suggested that noise generated by wind turbines at night may be disturbing acoustic
communication, on which this species heavily relies for territorial reinforcement (Hötker et al. 2006).
In terms of collision risk, research is lacking on quantification of this effect, though migration
altitudes are likely similar to that of active wind turbine rotors, while some collisions with power
lines and fences has been recorded in the past (Green 1997). However, disturbance of suitable
habitat through construction of wind developments threatens this species the greatest, as observed
with other predominantly ground-dwelling species (Pearce-Higgins et al. 2012).
18.9 Zone of Sensitivity
Given the highly sensitive nature of remaining suitable habitat for breeding Corncrakes in
comparison to other areas of its distribution, a conservative approach has been adopted when
applying a zone of sensitivity around this species’ remaining Irish extent. Other studies have used a
buffer of 850 m (Bright et al. 2008) around known breeding sites, expanding an observed daily range
of 600 m in recent studies (Hudson et al. 1990) and allowing for the low levels of natal and breeding
dispersal of Corncrakes between seasons. For this study, a zone of sensitivity of radius 800 m has
been imposed around the most recent point location observations of this species.
Bird Sensitivity Mapping to Wind Energy Development - Guidance Document
98
18.10 Data sources
Data for this species assessment have been obtained from the most recent survey of Corncrakes in
Ireland (2013) as commissioned by the National Parks and Wildlife Service of the Department of the
Arts, Heritage and the Gaeltacht (NPWS, unpublished data).
BirdLife International, 2004. Birds in the European Union: a status assessment, Wageningen, The Netherlands.
BirdLife International, 2012. Crex crex. The IUCN Red List of Threatened Species. Version 2014.2. Available at: www.iucnredlist.org [Accessed November 11, 2014].
Bright, J. et al., 2008. Map of bird sensitivities to wind farms in Scotland: A tool to aid planning and conservation. Biological Conservation, 141(9), pp.2342–2356.
Colhoun, K. & Cummins, S., 2013. Birds of Conservation Concern in Ireland 2014 – 2019. Irish Birds, 9(4), pp.523–544.
Cramp, S. & Simmons, K.E.., 1980. The Birds of the Western Palearctic, Vol. II., Oxford, UK.
Donaghy, A., Green, R.E. & O’Halloran, J., 2011. Timing of autumn migration of young Corncrakes Crex crex. Ibis, 153(2), pp.425–428.
European Commission, 2011. Wind energy developments and Natura 2000, Luxembourg.
Green, R.E., 2004. A new method of estimating the adult survival rate of the Corncrake Crex crex and comparison with estimates from ring-recovery and ring-recapture data. Ibis, 3, pp.501–508.
Green, R.E., 1996. Factors Affecting the Population Density of the Corncrake Crex crex in Britain and Ireland. Journal of Applied Ecology, 33, pp.237–248.
Hötker, H., Thomsen, K.-M. & Jeromin, H., 2006. Impacts on biodiversity of exploitation of renewable energy sources: the example of birds and bats - facts, gaps in knowledge, demands for further research, and ornithological guidelines for the development of renewable energy exploitation, Bergenhusen, Germany.
Hudson, A. V., Stowe, T.J. & Aspinall, S.J., 1990. & Aspinall, S. J. Status and distribution of corncrakes in Britain in 1988. British Birds, 83, pp.173–187.
Newton, I., 2004. The recent declines of farmland bird populations in Britain: an appraisal of causal factors and conservation actions. Ibis, 146(4), pp.579–600.
O’Meara, M., 1979. Distribution and numbers of Corncrakes in Ireland 1978. Irish Birds, 1, pp.382–405.
Pearce-Higgins, J.W. et al., 2012. Greater impacts of wind farms on bird populations during construction than subsequent operation: results of a multi-site and multi-species analysis. Journal of Applied Ecology, 49(2), pp.386–394.
Sharrock, J.T.R., 1976. The Atlas of Breeding Birds in Britain and Ireland, Berkhamsted, Hertfordshire, UK: Poyser.
Tyler, G.A., 1996. The ecology of the Corncrake Crex crex, with special reference to the effect of mowing on breeding production. National University of Ireland, Cork.
Bird Sensitivity Mapping to Wind Energy Development - Guidance Document
99
19 Chough (Pyrrhocorax pyrrhocorax)
19.1 Characteristics
Marginally larger than the familiar Jackdaw, the Chough resembles a typical all-black crow. At close
range, however, its unique long, down-curved red bill and bright red legs distinguish this species
from more familiar corvids. Choughs also have more prominently “fingered” flight-feathers than
other crows, resulting in an easily-discernible flight silhouette. Choughs will frequently swoop and
soar in updrafts around cliffs and are renowned as highly manoeuvrable flyers.
19.2 Range in Ireland
In general, this species ordinarily occurs at thin densities and is closely associated with low intensity
pastoral agriculture, due to the availability of invertebrate prey (Robertson et al. 1995; Johnstone et
al. 2011). From latest censuses in Ireland, this species is currently found on rocky Atlantic and Celtic
Sea coasts in the west, south and southeast, with highest numbers on the extremities of Cork and
Kerry peninsulas (Gray et al. 2003; Trewby, Carroll, Mckeever, et al. 2010; Trewby, Carroll, Farrell, et
al. 2010; Trewby, Carroll, Mugan, et al. 2010; Carroll et al. 2010). More recent unpublished data on
nesting sites in 2010 has confirmed the extent of this range (M. Trewby, pers. comm. 14th July 2014).
Only 5% of this range is inland. Though this species has suffered declines in range and population
across Europe (BirdLife International 2004), its range on the island of Ireland has only declined in
Northern Ireland since regular surveys began in the 1970s.
19.3 Conservation status
This species is on the Amber-list of the Birds of Conservation Concern in Ireland (Colhoun &
Cummins 2013), having been downgraded in 2007 (Lynas et al. 2007) from its former Red-listing. The
European population has been evaluated as Declining in Europe, due to an ongoing moderate
decline across its European range as a whole, particularly in Spain and Turkey (BirdLife International
2004). It is also listed under Annex I of the EC Council Directive on the Conservation of Wild Birds
(2009/147/EC). Unlike other north-western European populations, including Britain, which have
experienced significant declines over previous centuries (Johnstone et al. 2011), Irish populations
have remained stable across several recent surveys (Gray et al. 2003).
19.4 Population trend
Though the European distribution of this species has experienced significant decline in recent years
(BirdLife International 2004) including sharp declines in Spain and Turkey, the Irish population has
experienced a slight decline. A 2002/3 survey estimated a decline of 8% in numbers since 1992,
mainly in its Wexford, Waterford and Galway populations, though populations in Kerry, Cork and
Donegal remained stable (Gray et al. 2003). More detailed recent assessments of these regional
populations have revealed modest declines of 3% in the Co. Clare population since the 2002 survey,
despite higher productivity in this population than others regionally (Carroll et al. 2010). This is in
contrast to a 46% recorded decline in populations of Sligo and Leitrim, notably in the Sligo/Leitrim
Upland SPA (Trewby, Carroll, Farrell, et al. 2010). Conversely, populations within north Co. Kerry
were found to be thriving during the same period, owing to the availability of suitable coastal
agricultural habitat, though this was recognised as being marginalised (Trewby, Carroll, Mckeever, et
al. 2010). Along the south coast (Cork and Waterford), higher intensity farming is thought to result in
reduced breeding success, despite significant and stable populations which are well distributed
Bird Sensitivity Mapping to Wind Energy Development - Guidance Document
100
(Trewby, Carroll, Mugan, et al. 2010). Generally, though threatened with declines in the past
(notably on the east coast and in Northern Ireland), populations of this species are now recognised
as reasonably stable, having been downgraded from the BoCCI Red List to the Amber List in 2007
(Lynas et al. 2007) where it currently resides (Colhoun & Cummins 2013).
19.5 Breeding ecology
Choughs conventionally breed as pairs for life, although a third individual may occasionally be
present. In Ireland, the incidence of these “trios” has been observed mostly in the Donegal
population (Trewby, Carroll, Mugan, et al. 2010). Choughs usually nest in caves or crevices along
coasts and, less frequently, in old buildings, and in some cases pairs may have more than one nesting
site within their territory. Seclusion of these sites is key, to avoid predation on eggs and nestlings by
other birds and terrestrial predators such as cats, rats and mink. The dispersal from breeding sites is
mainly local to favoured coastal areas, or to mountainous slopes containing additional foraging
resources after fledging. Breeding success is between 1 - 4 fledglings per pair annually. Some studies
have cited weather conditions at time of breeding as significantly affecting breeding success (Reid et
al. 2003). Within the Irish population, lowered breeding success in the species’ southern distribution
was observed, potentially owing to higher intensity agriculture leading to lower availability of
foraging sites (Trewby, Carroll, Mugan, et al. 2010). Family groups are formed following fledging,
multiples of which sometimes aggregate into nursery flocks.
19.6 Habitat requirements
Choughs require isolated coastal areas for breeding, surrounded by enough suitable, short-sward,
foraging territory. This includes a relatively wide variety of habitats, from cultivated land and highly
fertilised pasture to semi-natural habitats such as heath and coastal dune systems (Carroll et al.
2010; Robertson et al. 1995). In these areas, Choughs feed mostly on insects and their larvae, worms
and other subterranean invertebrates, using their curved bills to probe the soil. They will also eat
berries, spilled grain post-harvest and invertebrates associated with animal dung. Choughs hunt by
sight, meaning short vegetation is fundamental to their foraging success. As a result, changes in
farming practices resulting in loss of grazed pasture has reduced suitable habitat across most of the
species’ range (Kerbiriou et al. 2006).
19.7 Site fidelity
Choughs will remain in the same nesting site throughout their reproductive life, likely around 10
years though in some instances lasting up to 20. Indeed, some nests have remained active across
multiple generations (Trewby, Carroll, Mugan, et al. 2010). A study on the habitat use of individual
pairs also suggested that fidelity to areas may vary between breeding pairs (Robertson et al. 1995).
19.8 Sensitivity to development of wind energy
This species is vulnerable to disturbance during feeding. For example, population viability on a
French island was found to be compromised by relativity minor human induced disturbance
(Kerbiriou et al. 2009). In this example, the location of paths for tourists was recommended to be
kept at least 150m away from feeding areas. In addition, given this species’ relatively narrow range
along coastlines, its high site fidelity and the decreasing availability of suitable feeding ground, this
species is also vulnerable to habitat loss.
Bird Sensitivity Mapping to Wind Energy Development - Guidance Document
101
19.9 Zone of Sensitivity
As the available data for this species record point locations for nesting sites, nesting sites are
maintained across breeding seasons and Choughs predominantly feed within a 300 m radius of
their nesting area (Kerbiriou et al. 2006) though with significant seasonal movement to varying
habitat types (Trewby, Carroll, Mckeever, et al. 2010), a zone of sensitivity of 1000 m from known
nesting sites has been used.
19.10 Data sources
All-Ireland Chough censuses have been conducted every 10 years since 1982 and the last census
was conducted over two years, spanning 2002 and 2003. Data for this species were predominantly
obtained from this most recent survey (Gray et al. 2003) and from nesting site data collected as
part of Phase II of Chough Survey Ireland, commissioned by the National Parks and Wildlife Service
(Trewby, Carroll, Mugan, et al. 2010; Carroll et al. 2010; Trewby, Carroll, Mckeever, et al. 2010;
Trewby, Carroll, Farrell, et al. 2010).
BirdLife International, 2004. Birds in the European Union: a status assessment, Wageningen, The Netherlands.
Carroll, D. et al., 2010. The seasonal distribution and foraging behaviour of Red ‐ billed Choughs Pyrrhocorax pyrrhocorax in County Clare , February 2009 to January 2010, Unpublished BirdWatch Ireland Report to National Parks & Wildlife Service. Kilcoole, Wicklow.
Colhoun, K. & Cummins, S., 2013. Birds of Conservation Concern in Ireland 2014 – 2019. Irish Birds, 9(4), pp.523–544.
Gray, N. et al., 2003. The status and distribution of Choughs Pyrrhocorax pyrrhocorax in the Republic of ireland 2002/3. Irish Birds, 7(2), pp.147–156.
Johnstone, I. et al., 2011. The return of the Red-billed Chough to Cornwall : the first ten years and prospects for the future. British Birds, 104(August), pp.416–431.
Kerbiriou, C. et al., 2006. Linking territory quality and reproductive success in the Red-billed Chough Pyrrhocorax pyrrochorax: implications for conservation management of an endangered population. Ibis, 148(2), pp.352–364.
Kerbiriou, C. et al., 2009. Tourism in protected areas can threaten wild populations: from individual response to population viability of the chough Pyrrhocorax pyrrhocorax. Journal of Applied Ecology, 46(3), pp.657–665.
Lynas, P., Newton, S.. & Robinson, J.., 2007. The status of birds in Ireland: an analysis of conservation concern 2008-2013. Irish Birds, 8, pp.149 – 167.
Reid, J.. et al., 2003. Environmental variability , life-history covariation and cohort effects in the red-billed chough Pyrrhocorax pyrrhocorax. , 72, pp.36–46.
Robertson, A.A. et al., 1995. Habitat Selection and Foraging Behaviour of Breeding Choughs Pyrrhocorax pyrrhocorax L. in County Donegal. , 95(1), pp.69–74.
Trewby, M., Carroll, D., Mugan, N., et al., 2010. The seasonal distribution and foraging behaviour of Red ‐ billed Choughs Pyrrhocorax pyrrhocorax in Counties Waterford and Cork , February 2008 to January 2009. Unpublished BirdWatch Ireland Report to National Parks & Wildlife Service, Kilcoole, Wicklow.

Bird Sensitivity Mapping to Wind Energy Development - Guidance Document
102
Trewby, M., Carroll, D., Mckeever, R.G., et al., 2010. The seasonal distribution and foraging behaviour of Red ‐ billed Choughs Pyrrhocorax pyrrhocorax in north County Kerry September 2008 to September 2009. Unpublished BirdWatch Ireland Report to National Parks & Wildlife Service, Kilcoole, Wicklow.
Trewby, M., Carroll, D., Farrell, F., et al., 2010. The seasonal distribution and foraging ecology of Red-billed Choughs Pyrrhocorax pyrrhocorax in Counties Sligo and Leitrim February 2009 to January 2010. Unpublished BirdWatch Ireland Report to National Parks & Wildlife Service, Kilcoole, Wicklow.
Bird Sensitivity Mapping to Wind Energy Development - Guidance Document
103
20 Twite (Carduelis flavirostris)
20.1 Characteristics
The Twite is a small seed-eating finch, similar to the much more common Linnet (Carduelis
cannabina) though notably Twites have a smaller, more conical bill. Adult summer male Twites have
extensive black streaking on the back and breast, with a rather plain brown head and grey bill. Most
distinctive is the pink patch on the rump. Adult winter male, adult females and juveniles are largely
indistinguishable from each other, having a yellow bill, pale brown wash to the underparts and less
extensive black streaking than summer males.
20.2 Range in Ireland
Twites have a wide though discontinuous range globally, occurring from eastern Turkey to Western
China, yet also in small enclaves in northwest Europe. Indeed, the Twite represents the only Tibetan
bird found in Europe (Orford 1973). The subspecies Cardeulis flavirostris pipilans is found on
coastlines and mountains of north-western Europe (McLoughlin et al. 2010), though in Ireland their
distribution is much less widespread. Here, they are found almost exclusively on the Mullet
Peninsula and northern coast of Co. Mayo and in the region of Sheskinmore National Nature
Reserve, Co. Donegal, with a possible minor breeding population in Co. Galway and northwest
Donegal (McLoughlin & Cotton 2008). As well as an additional wintering population in coastal Kerry,
some individuals from the West Highlands and Western Isles of Scotland are known to over-winter in
Ireland (McLoughlin et al. 2010). The Irish populations occur almost exclusively within 5 km of sea,
on heather-dominated slopes. Of the more established distributions within Ireland, wintering
populations have been recorded to reside less than 28km from breeding areas. A recent study on the
Mullet Peninsula found the total wintering range of two individuals to be 150ha, with a summer
range of just 75ha (McLoughlin et al. 2010).
20.3 Conservation status
Historically, Twites were recorded as occurring in all coastal counties (Thompson 1849). Present in
only two main breeding enclaves, however, this species has for some time been Red-listed in Ireland
due to its declining breeding population and extremely limited distribution (Colhoun & Cummins
2013; Lynas et al. 2007). The European population is currently regarded as Secure by BirdLife
International (BirdLife International 2004) and its wide-ranging global population is regarded as
stable.
20.4 Population trend
Most recent population estimates for the Irish breeding population of Twites are limited to 54-110
breeding pairs, found almost exclusively in the northwest of the Republic (McLoughlin et al. 2010).
Winter populations are estimated between 650 and 1,100 individuals, though the highly mobile
nature of Twites in winter makes this number difficult to estimate. Additionally, the majority of the
winter population in Ireland is thought to be of Scottish origin (McLoughlin et al. 2010). Further
research is required to confirm the proportions of this movement. Generally, declines in the
breeding population of this species have been attributed to changes in agricultural practices (such as
increases in the number of silage and hay cuts) and overgrazing of heather hillsides (McLoughlin
2011).
Bird Sensitivity Mapping to Wind Energy Development - Guidance Document
104
20.5 Breeding ecology
Twites are now a very rare breeding species, confined to the coastal bogs of Counties Mayo and
Donegal. This species is a ground-nesting bird, choosing available heather (Calluna vulgaris) and
bracken (Pteridium aquilinum) on coastal hillsides to build a nest less than 50cm above the ground
(McLoughlin 2011). Groups of monogamous pairs nest together in loose colonies and do not defend
territories, usually having two broods of 5-6 eggs each breeding season (Wilkinson & Wilson 2010;
McLoughlin 2011). Flocks in this species’ Irish distribution are usually recorded at between 8 and 70
individuals in size (McLoughlin et al. 2010), which disperse very little between breeding and
wintering sites, as with all finches. Repeat nesting within one breeding season often occurs in Twite
populations (Wilkinson & Wilson 2010), though this has not been recorded in Irish populations.
20.6 Habitat requirements
Populations of Twites in Ireland are now solely found on low-intensity coastal grasslands rich in
seeding plants to provide forage in spring, summer and autumn (McLoughlin & Cotton 2008). In
winter, preferred habitat includes coastal marshes and tilled fields. This is in contrast to Scottish
populations, which are found in a much wider variety of habitats including road verges, gardens and
meadows (Wilkinson & Wilson 2010). Recent spatial tracking studies found that feeding in this
species’ extremely restricted Irish range is largely based around cattle feeders on grazing land during
the winter (McLoughlin et al. 2010), whereas during the breeding seasons they were found to feed
more broadly on the seeds of dandelion and sorrel, associated generally with late-cut or low-grazed
grasslands, as in Scottish and Norwegian studies (Wilkinson & Wilson 2010; Marler & Mundinger
1975). Though in other populations in the UK Twites have additionally been known to feed on some
small invertebrates (Wilkinson & Wilson 2010), individuals studied in Ireland were found to feed
solely on available wild seeds (McLoughlin 2011).
20.7 Site fidelity
Observed Twites in Ireland exhibited strong site fidelity, through very niche breeding site conditions
while also spending much of the winter within 7km of their breeding area (McLoughlin et al. 2010).
When feeding, Twites concentrate on a very limited number of feeding sites, resulting in patchy
range use within their observed distributions (McLoughlin et al. 2010).
20.8 Sensitivity to development of wind energy
Owing to its limited range, this species is very vulnerable to land-use change potentially associated
with wind energy developments, which may reduce the availability of some seed-bearing plants or
remove appropriate nesting habitat. Indeed, it has previously been noted that use of marginalised
upland habitats suited for wind energy developments may impact upon Twite breeding occupation
(McLoughlin 2011). Conversely, consideration of this fact and implementation of site-specific
conservation actions in advance of developments will likely accrue substantial conservation benefits
(McLoughlin 2011). In the UK, disturbance events such as wildfires already greatly reduce Twite
distribution, demonstrating the susceptibility of this species to habitat loss (Riddington 2011).
Secondary changes in utilisation of surrounding farmland as a result of localised wind energy
development may further reduce areas of suitable habitat for Twites. For example, the switch from
hay to silage or “haylage”, has reduced the availability of seeding plants in pasture and has been
linked with declines in other fauna utilising similar habitats (Fitzpatrick et al. 2007), such as Twites.
Similarly abandonment of farmland may have similar effects.
Bird Sensitivity Mapping to Wind Energy Development - Guidance Document
105
20.9 Zone of Sensitivity
Though radio-tracking studies of Twites in the Pennines have shown a dispersal of up to 3.5 km
around breeding sites (Raine 2006), minimum distance travelled in Ireland from nest to feeding site
was 1km, with maximum of 1.49km (McLoughlin et al. 2010). Similarly, older studies from Germany
found significant dispersal during winter of up to 50km to feed. However, this was again not
observed in Irish populations, with average breeding-to-wintering movement being less than 7km
(McLoughlin et al. 2010). Consequently, the zone of sensitivity for this species has been assigned a
radius of 800 m around the breeding sites identified through the most recent Twite survey
(McLoughlin & Cotton 2008).
20.10 Data sources
Most recent distribution data for this species was obtained with permission from McLoughlin and
Cotton (2008), including data from personal records as part of a PhD thesis on Twite breeding and
ecology (McLoughlin 2009) and from the National Parks and Wildlife Service Twite Survey of 2005 –
2008.
BirdLife International, 2004. Birds in the European Union: a status assessment, Wageningen, The Netherlands.
Colhoun, K. & Cummins, S., 2013. Birds of Conservation Concern in Ireland 2014 – 2019. Irish Birds, 9(4), pp.523–544.
Fitzpatrick, U. et al., 2007. Rarity and decline in bumblebees- A test of causes and correlates in the Irish fauna. Biological Conservation, 132(4), pp.185–194.
Lynas, P., Newton, S. & Robinson, J., 2007. The status of birds in Ireland: an analysis of conservation concern 2008-2013. Irish Birds, 8, pp.149 –166.
Marler, P. & Mundinger, P.C., 1975. Vocalisations, social organisation and breeding biology of the twite Acanthus flavirostris. Ibis, 117(1), pp.1–17.
McLoughlin, D., 2011. Management prescriptions for twite in Ireland, Dublin.
McLoughlin, D., 2009. The ecology of Twite Cardeulis flavirostris in Ireland. PhD Thesis. Institute of Technology, Sligo.
McLoughlin, D. et al., 2010. The movement patterns of two populations of Twites Carduelis flavirostris in Ireland. Ringing & Migration, 25(1), pp.15–21.
McLoughlin, D. & Cotton, D., 2008. The status of Twite Carduelis flavirostris in Ireland 2008. Irish Birds, 8(3), pp.323–330.
Orford, N., 1973. Breeding Distribution of the Twite in Central Britain. Bird Study, 20(2), pp.121–126.
Raine, A.F. (2006), 2006. The breeding ecology of Twite Carduelis flavirostris and the effects of upland agricultural intensification. University of East Anglia.

Bird Sensitivity Mapping to Wind Energy Development - Guidance Document
106
Riddington, R., 2011. No Title. British Birds. Available at: http://britishbirds.co.uk/article/moorland-fires-threaten-last-strongholds-of-nesting-twite/.
Thompson, W., 1849. The Natural History of Ireland. Vol. 1 Birds, London: Reeve, Benham and Reeve.
Wilkinson, N.I. & Wilson, J.D., 2010. Breeding ecology of Twite Carduelis flavirostris in a crofting landscape. Bird Study, 57(2), pp.142–155.
Bird Sensitivity Mapping to Wind Energy Development - Guidance Document
107
21 Red-throated Diver (Gavia stellata)
21.1 Characteristics
Red-throated Divers are the smallest of the divers, or “loons”, found in Ireland. The distinctive red
neck plumage develops in the build up to the breeding season (spring) and fades over the autumn.
During the winter the neck plumage becomes more than half-white, distinguishing Red-throated
Divers from Black-throated Divers. Other characteristics of this species are its grey-brown plumage
and up- tilted bill, which this species usually holds pointing slightly upwards when on the water and
in flight. Compared to other species of divers the Red-throated Diver has a flat chest, thin neck, light
bill, small head and a pale appearance. Usually this species swims low on the water but may float
higher at times. They often jump up to dive and can stay underwater for several minutes.
21.2 Range in Ireland
The Red-throated Diver is a migratory aquatic bird found in the northern hemisphere, with a
breeding range extending from the high Arctic to slightly below 60°N. Though breeding populations
occur in Russia, Scandinavia, Iceland, Greenland and Scotland, the northwest of Ireland represents
the southern-most extent of its breeding range in the western Palearctic (Cromie 2002). This species
is present in Donegal, in a very limited number of inland lakes. Most recent survey work estimates
that this species is present at only 7 breeding lakes (McLoughlin & Beaubier 2009), with at most 6
breeding sites being active at these lakes. The breeding success of this species has been in continual
decline since the first comprehensive survey of this species in 1997 (Cromie 2002). Aside from
breeding populations, this species is well-distributed in most coastal areas during the winter in
shallow sandy bays, with numbers of wintering birds peaking in January and February.
21.3 Conservation status
The Red-throated Diver is Amber-listed in Ireland due to its very small breeding range and breeding
population (Colhoun & Cummins 2013). Its European population is classified as Depleted as, though
the species is widespread in northern Europe, it is still recovering from historical declines (BirdLife
International 2004). Furthermore, this species is also listed under Annex I of the EC Council Directive
on the Conservation of Wild Birds (2009/147/EC).
21.4 Population trend
Current estimates of Red-throated Diver populations lie at between 4 and 6 breeding pairs in its Irish
distribution (McLoughlin & Beaubier 2009; Wheeldon 2012), a marginal increase from the 3-4 pairs
estimated in 2002 (Cromie 2002). Of a total of 6 confirmed breeding attempts observed in the most
recent survey, 4 birds successfully fledged (McLoughlin & Beaubier 2009). Though this remains
average in comparison to other Diver populations, this recruitment rate may not be sufficient to
sustain this population in light of other pressures threatening its survival. Furthermore, though it has
been speculated that this continued downward trend in population is part of a larger cyclical
fluctuation (Cromie 2002), the poor breeding success observed in several studies and the onset of
climate change related shifts in populations of northern latitude populations does not bode well for
the Irish breeding population. This is in stark contrast with the UK breeding population which has
risen by 34% since its first national survey in 1994 (Dillon et al. 2009).
21.5 Breeding ecology
In Ireland, Red-throated Divers breed on small freshwater loughs in Donegal. Pairs return to
breeding territories during March and April, laying clutches of 1-2 eggs in May or June (Cromie
Bird Sensitivity Mapping to Wind Energy Development - Guidance Document
108
2002). Nests typically consist of aquatic vegetation and are constructed close to or on the water’s
edge, with the same sites often re-used in successive years. There is little food in the loughs used for
breeding and adults have to travel to more productive waters, at the coast or larger lowland lakes,
to forage. Eggs and chicks are susceptible to predators such as non-native American Mink (Mustela
vison) and breeding pairs are easily disturbed by human activity. Breeding success of the Red-
throated Diver is low, averaging 0.67 successful fledglings per pair. This figure is, however, average
compared to previous studies in Ireland and is similar to other breeding populations internationally
(McLoughlin & Beaubier 2009). More recent surveys of this species breeding ecology suggest a
further decline in breeding incidence (Wheeldon 2012). This species is known to lay second,
replacement, clutches in a single season, though reduced survival in this second clutch has been
observed (Schamel & Tracy 1985). No second clutches have yet been observed in Irish breeding
populations.
21.6 Habitat requirements
The choice of suitable habitat for breeding sites in Co. Donegal is unclear and does not seem
correlated with altitude, isolation or lake size (Cromie 2002). More detailed assessment suggests
that site selection is based predominantly on its position in relation to suitable feeding lakes and its
proximity to the sea. Breeding loughs must also have suitable nesting sites, such as vegetated
peninsulas, islets or floating vegetation rafts. Given the cumbersome nature of this bird on land, a
gentle unimpeded slope into the water is vital. Additionally, a clear flight path to and from the lough
is key (Cromie 2002; McLoughlin & Beaubier 2009). The diet of this species consists of small fish such
as sprats, sandeels, codling and flatfish. Other food items include fish spawn, frogs, shrimps,
molluscs, water insects and annelids. Dietary diversity is greatly reduced while breeding in inland
lakes.
21.7 Site fidelity
The regular return of this species to breeding sites across multiple seasons demonstrates its strong
fidelity to sites. Additionally, the apparent reduced suitability of several lakes through increasing
levels of anthropogenic and predatory pressures has further limited the selection of breeding
locations available.
21.8 Sensitivity to development of wind energy
In general this species’ breeding success is heavily impacted by human disturbance (McLoughlin &
Beaubier 2009; Cromie 2002). This would certainly apply to activities around potential wind farm
developments. Given that some assessments of threats to this species advise a complete revision of
human practices in and around the inland loughs occupied by breeding Red-throated Divers,
including hillwalking, turf-cutting and water sports, wind energy developments would require very
careful consideration in areas supporting this species. A recent assessment suggests that lowered
lake water levels may contribute to nesting site abandonment (Wheeldon 2012). Consequently, any
activities affecting the hydrology of surrounding bogs, including road cutting or drain blockage,
should be carefully considered. Additionally, uninterrupted flight path to the sea has been identified
as a crucial breeding site selection criterion of these birds (Cromie 2002). As such, impendence of
flight paths by turbine installations may reduce the appeal of an already-limited number of breeding
lakes. The sensitivity of this species to disturbance by wind farms has been assessed elsewhere.
Indeed, the Red-throated Diver is listed amongst a group of species identified as being particularly
sensitive to wind energy developments (European Commission 2011). It was discovered that, of
Bird Sensitivity Mapping to Wind Energy Development - Guidance Document
109
several species displaced by offshore wind farms, Red-throated Divers had not returned to feeding
grounds 6 years after installation, while other marine species had readily done so.
21.9 Zone of Sensitivity
When foraging, Red throated Divers, will travel some distances overland, either to the sea or nearby
lakes. Without detailed knowledge of these flight lines it would be impractical to buffer all such
areas as this would result in large tracts of land being highlighted. Previous work in Scotland
assigned a buffer of 1000 m around known breeding sites of Red-throated Diver (Bright et al. 2008)
when buffering for sensitivity to wind developments. In addition, guidance for forestry operations in
Scotland has assigned a distance of 300-900 m from Red-throated Diver nesting sites (Forestry
Commission Scotland 2006). However, the Irish breeding population is in a far more precarious
position, with a low number of isolated breeding sites in Donegal at increasing threat from human
disturbance. As a result, a more precautionary approach has been taken, using the 2000m distance
at which no effect of disturbance were observed at a study of the Burger Hill Wind farm in Orkney
(Meek et al. 1993). This is also in agreement with the expert advice received during the consultation
process which recommended increasing this to 2000m around the entirety of occupied lakes.
21.10 Data sources
From 1997 – 2004 this species was surveyed extensively, providing a modern baseline for this
species’ distribution and breeding population levels (Cromie 2002). These data were augmented and
verified through annual monitoring, contracted by NPWS (e.g. McLoughlin & Beaubier 2009;
Wheeldon 2012).
BirdLife International, 2004. Birds in the European Union: a status assessment, Wageningen, The Netherlands.
Bright, J. et al., 2008. Map of bird sensitivities to wind farms in Scotland: A tool to aid planning and conservation. Biological Conservation, 141(9), pp.2342–2356.
Colhoun, K. & Cummins, S., 2013. Birds of Conservation Concern in Ireland 2014 – 2019. Irish Birds, 9(4), pp.523–544.
Cromie, J., 2002. Breeding status of Red-throated Diver Gavia stellata in Ireland. Irish Birds, 7(1), pp.13–20.
Dillon, I. a. et al., 2009. Status of Red‐throated Divers Gavia stellata in Britain in 2006. Bird Study, 56(2), pp.147–157.
European Commission, 2011. Wind energy developments and Natura 2000, Luxembourg.
Forestry Commission Scotland, 2006. Forest operations and birds in Scottish forests - the law and good practice, Edinburgh, Scotland.
McLoughlin, D. & Beaubier, J.E., 2009. Breeding status of red-throated diver in County Donegal, 2009: Report on contracted field work.
Meek, E.R. et al., 1993. The effects of aero-generators on moorland bird populations in the Orkney Islands, Scotland. Bird Study, 40(2).
Schamel, D. & Tracy, D.M., 1985. Replacement Clutches in the Red-Throated Loon. Journal of Field Ornithology, 56(3), pp.282–283.

Bird Sensitivity Mapping to Wind Energy Development - Guidance Document
110
Wheeldon, R., 2012. Report of the breeding status of Red-throated Divers in Donegal , 2012. Unpublished report by EcoAudit.
Bird Sensitivity Mapping to Wind Energy Development - Guidance Document
111
22 Common Scoter (Melanitta nigra) - Breeding
22.1 Characteristics
The Common Scoter (Melanitta nigra) is a compact diving duck. The males of this species are jet
black with bright yellow-orange colouration around the base of the black bill, while the female is
overall, a browner bird with pale cheeks. In general this species is similar to the much rarer Velvet
Scoter (Melanitta fusca) though lacks the diagnostic white wing patch of the latter when seen in
flight.
22.2 Range in Ireland
Internationally, the Common Scoter has an expansive breeding range, stretching from Iceland and
Ireland, across northern Europe to central Siberia (BirdLife International 2014). In Ireland, the
Common Scoter occurs both as a breeding summer resident and in much larger numbers as a
wintering visitor from the continent. The wintering visitors can be seen in large numbers around the
coast from October to April and are almost entirely marine, congregating in large flocks on shallow
seas. The breeding population of this species is, however, much less common and in the Republic of
Ireland is now restricted to four lakes in the west; Loughs Arrow, Conn, Corrib and Ree (Hunt et al.
2013). Though the population at Lough Erne in Northern Ireland was the first to be recorded
breeding in Ireland in 1905, this population has since become extinct (Gittings 1995).
22.3 Conservation status
Given its rare and declining nature, the breeding population of this species in Ireland is currently
Red-listed (Colhoun & Cummins 2013). Similarly, its UK breeding population has been placed on their
own Red-list, owing to a steep decline in recent decades (Hayhow et al. 2014). Despite this, its
expansive breeding population in Scandinavia and Russia has resulted in its European population
being assessed as Secure (BirdLife International 2004).
22.4 Population trend
Though breeding numbers of this species in Europe are large (>100,000 pairs) (BirdLife International
2004), numbers in Ireland and Britain have been consistently falling for several decades (Gittings
1995; Hunt et al. 2013). Since its first recorded breeding on the island of Ireland at the beginning of
the 20th century in Lower Lough Erne, numbers increased steadily up to a maximum of about 150
pairs during the late 1960s (Hutchinson 1989). However, since then numbers of breeding Common
Scoter have been declining since the 1970s (Underhill et al. 1998). In 1995 a total of 96 breeding
pairs were estimated (Gittings 1995), though the most recent survey in 2012 placed this figure at no
more than 39 pairs distributed in a diminishing number of lakes in the west of Ireland (Hunt et al.
2012). Similarly, the nearby UK population currently stands at an estimated 52 breeding pairs,
following a 63% decline over the past 25 years (Hayhow et al. 2014). Contrary to this, the wintering
populations of this species remains widespread in Ireland and is found in large aggregations in
Wexford Bay, Castlemaine Harbour and Rossbehy in County Kerry, Brandon Bay in County Kerry,
Donegal Bay and the Nanny Estuary and Shore off County Meath.
22.5 Breeding ecology
Common Scoter will nest on a simple scrape on the ground amongst vegetation (Snow & Perrins
1998). A single clutch of 6-8 eggs is laid, which is incubated for about 30 days, while fledging of
successful ducklings occurs after a further 45-50 days (BirdLife International 2014). Hatching success
Bird Sensitivity Mapping to Wind Energy Development - Guidance Document
112
of the recently surveyed Irish breeding population was highly variable, giving an all-Ireland hatching
success rate of 28%, though this mean was lowered by disproportionately low success at this
species’ largest breeding population on Lough Corrib (Hunt et al. 2013). Eutrophication of suitable
water bodies is thought to have reduced the species’ food supply which has resulted in poor
productivity and juvenile survival (Gittings 1995; Hunt et al. 2013). American Mink (Mustela vison)
depredation has also had a considerable impact during the breeding season (especially incubating
females) (Underhill et al. 1998; Hunt et al. 2013), as has competition with the introduced Roach
(Rutilus rutilus) for suitable prey. Additionally, adult survival is low at 0.78 (Fox et al. 2003), though
this is higher than some species of similarly-sized ducks. Accurate estimates of survival at breeding
grounds alone are lacking, however (Hunt et al. 2013).
22.6 Habitat requirements
Breeding Common Scoters commonly nest on boggy heathland near freshwater water bodies,
including small lakes, streams and slow-moving rivers in the northern part of its European range
(Snow & Perrins 1998). Preference is shown for habitats which include suitable cover vegetation
such as birch, willow and herbaceous vegetation. Wooded islands on large lakes seem particularly
suitable in its Irish distribution (Gittings 1995). While breeding, the diet of the Common Scoter is
varied and includes water plants, insect larvae and freshwater crustaceans (BirdLife International
2014). During the winter, the habitat requirements and diet of this species are markedly different,
when they are almost entirely marine and feed predominantly on benthic bivalve molluscs.
22.7 Site fidelity
Though little dedicated study has been conducted on this species’ site fidelity, the annual return of
breeding individuals to a restricted number of inland freshwater bodies in Ireland suggests a high
level of site fidelity. Given the decreasing breeding numbers of this species and the continued
pressures on habitat suitability, the annual return to a select (and evidently diminishing) number of
sites is likely to persist. A study by Fox et al. (2003) on an isolated Icelandic population of Common
Scoter found extremely high breeding site fidelity. In Ireland, further research using GPS tracking has
been proposed to assess this aspect of the Common Scoter’s breeding ecology (Hunt et al. 2013).
22.8 Sensitivity to development of wind energy
In general, breeding populations of Common Scoter are thought to be threatened by wind energy
development through a wide suite of mechanisms, including disturbance displacement, barrier
effects to movement, collision risk and direct habitat loss (Langston & Pullan 2003). In the UK this
species has been identified as being under particular threat through renewable energy exploitation
(Hayhow et al. 2014). Though little research has been conducted to quantify this effect on land,
several studies have highlighted the potential threat to wintering populations in marine
environments through the development of offshore wind farms (Fox et al. 2003; Desholm 2006).
Similarly, a pan-European assessment by Garthe and Hüppop (2004) rated the Common Scoter as
the species most threatened by offshore wind installations. Indeed, a meta-analysis of several
studies relating to Common Scoter displacement revealed an overall negative effect on marine
populations (Stewart et al. 2007). Radar tracking of Common Scoter flocks also found active
avoidance of wind farms up to distances of 1km, with greater avoidance observed of installations
closer to the shore and those wind farms approached perpendicular to the rows of turbines (Tulp et
al. 1999).
Bird Sensitivity Mapping to Wind Energy Development - Guidance Document
113
22.9 Zone of Sensitivity
Though research on the disturbance effects imposed on this species’ breeding populations is lacking,
positive disturbance was observed within 1-2km of offshore aggregations, mainly as a result of
shipping (Kaiser et al. 2006). Similarly, a zone of sensitivity of 1km was used in a recent Scottish
sensitivity mapping study (Bright et al. 2008), though this was largely based on offshore disturbance
distances associated with wind farms. With regard to terrestrial breeding populations,
recommendations for forestry workers in Scotland have delineated a distance of 300-800m as a safe
distance from known nesting sites (Forestry Commission Scotland 2006). Given the extremely
precarious nature of this species in Ireland, a conservative approach has been taken, resulting in the
imposition of a 2km zone of sensitivity around the lakes known to support breeding populations of
this species.
22.10 Data sources
Data for this species’ assessment was obtained from the Irish Wetland Bird Survey (I-WeBS) and the
most recent survey of Common Scoter breeding sites in 2012, as commissioned by the National
Parks and Wildlife Service (Hunt et al. 2013).
BirdLife International, 2004. Birds in the European Union: a status assessment, Wageningen, The Netherlands.
BirdLife International, 2014. Species factsheet: Melanitta nigra. Available at: http://www.birdlife.org [Accessed November 3, 2014].
Bright, J. et al., 2008. Map of bird sensitivities to wind farms in Scotland: A tool to aid planning and conservation. Biological Conservation, 141(9), pp.2342–2356.
Colhoun, K. & Cummins, S., 2013. Birds of Conservation Concern in Ireland 2014 – 2019. Irish Birds, 9(4), pp.523–544.
Desholm, M., 2006. Wind farm related mortality among avian migrants - a remote sensing study and model analysis.
Forestry Commission Scotland, 2006. Forest operations and birds in Scottish forests - the law and good practice, Edinburgh, Scotland.
Fox, A.D., Petersen, Æ. & Frederiksen, M., 2003. Annual survival and site-fidelity of breeding female Common Scoter Melanitta nigra at Mývatn, Iceland, 1925–58. Ibis, 145(2), pp.E94–E96.
Garthe, S. & Hüppop, O., 2004. Scaling possible adverse effects of marine wind farms on seabirds: developing and applying a vulnerability index. Journal of Applied Ecology, 41(4), pp.724–734.
Gittings, T., 1995. The Status of the Common Scoter Melanitta nigra in Ireland. Report on the 1995 All-Ireland Common Scoter Survey. Unpublished report by the Irish Wildbird Conservancy, Newcastle, Wicklow.
Hayhow, D.B. et al., 2014. The state of the UK’s birds 2014, Sandy, Bedfordshire.
Hunt, J. et al., 2012. Common Scoter Melanitta nigra in Ireland: results from pre-breeding and brood surveys in 2012. Irish Birds, 9(3), pp.341–348.
Hunt, J. et al., 2013. The breeding status of Common Scoter Melanitta nigra in Ireland, 2012, Irish Wildlife Manuals: National Parks and Wildlife Service, Department of the Arts, Heritage and the Gaeltacht, Ireland.
Bird Sensitivity Mapping to Wind Energy Development - Guidance Document
114
Hutchinson, C.D., 1989. Birds in Ireland, Calton, UK: T and A.D. Poyser.
Kaiser, M.J. et al., 2006. Distribution and behaviour of Common Scoter Melanitta nigra relative to prey resources and environmental parameters. BOU Wind Fire & Water conference proceedings.
Langston, R.H.W. & Pullan, J., 2003. Windfarms and Birds : An analysis of the effects of windfarms on birds , and guidance on environmental assessment criteria and site selection issues, RSPB/BirdLife.
Snow, D.W. & Perrins, C.M., 1998. The Birds of the Western Palearctic Vol. 1: Non-passerines, Oxford, UK: Oxford University Press.
Stewart, G.B., Pullin, A.S. & Coles, C.F., 2007. Poor evidence-base for assessment of windfarm impacts on birds. Environmental Conservation, 34(1), pp.1–11.
Tulp, I. et al., 1999. Nocturnal flight activity of sea ducks near the wind farm Tunø Knob in the Kattegat. IBN-DLO Report No. 99.30, Wageningen, The Netherlands.
Underhill, M.C. et al., 1998. Status and distribution of breeding Common Scoters Melanitta nigra nigra in Britain and Ireland in 1995. Bird Study, 45, pp.146–156.
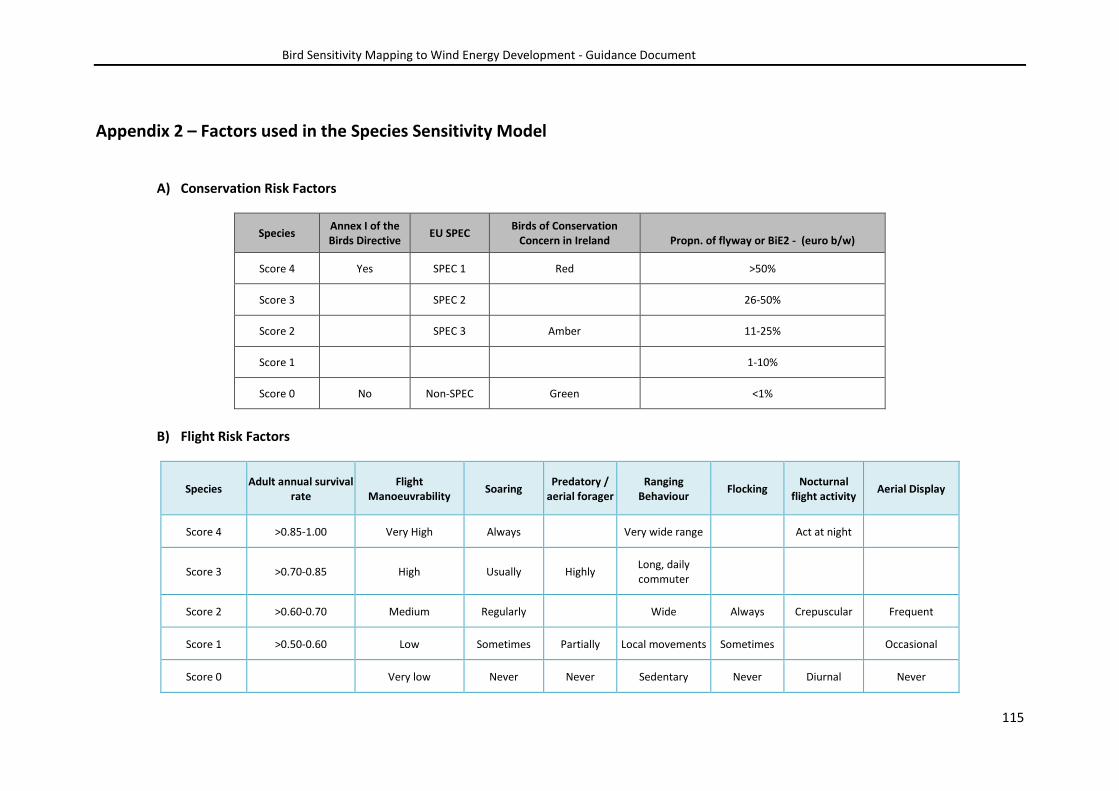
Bird Sensitivity Mapping to Wind Energy Development - Guidance Document
115
Appendix 2 – Factors used in the Species Sensitivity Model
A) Conservation Risk Factors
Species Annex I of the Birds Directive
EU SPEC Birds of Conservation
Concern in Ireland
Propn. of flyway or BiE2 - (euro b/w)
Score 4 Yes SPEC 1 Red >50%
Score 3
SPEC 2
26-50%
Score 2
SPEC 3 Amber 11-25%
Score 1
1-10%
Score 0 No Non-SPEC Green <1%
B) Flight Risk Factors
Species Adult annual survival
rate Flight
Manoeuvrability Soaring
Predatory / aerial forager
Ranging Behaviour
Flocking Nocturnal
flight activity Aerial Display
Score 4 >0.85-1.00 Very High Always
Very wide range
Act at night
Score 3 >0.70-0.85 High Usually Highly Long, daily commuter
Score 2 >0.60-0.70 Medium Regularly
Wide Always Crepuscular Frequent
Score 1 >0.50-0.60 Low Sometimes Partially Local movements Sometimes
Occasional
Score 0
Very low Never Never Sedentary Never Diurnal Never
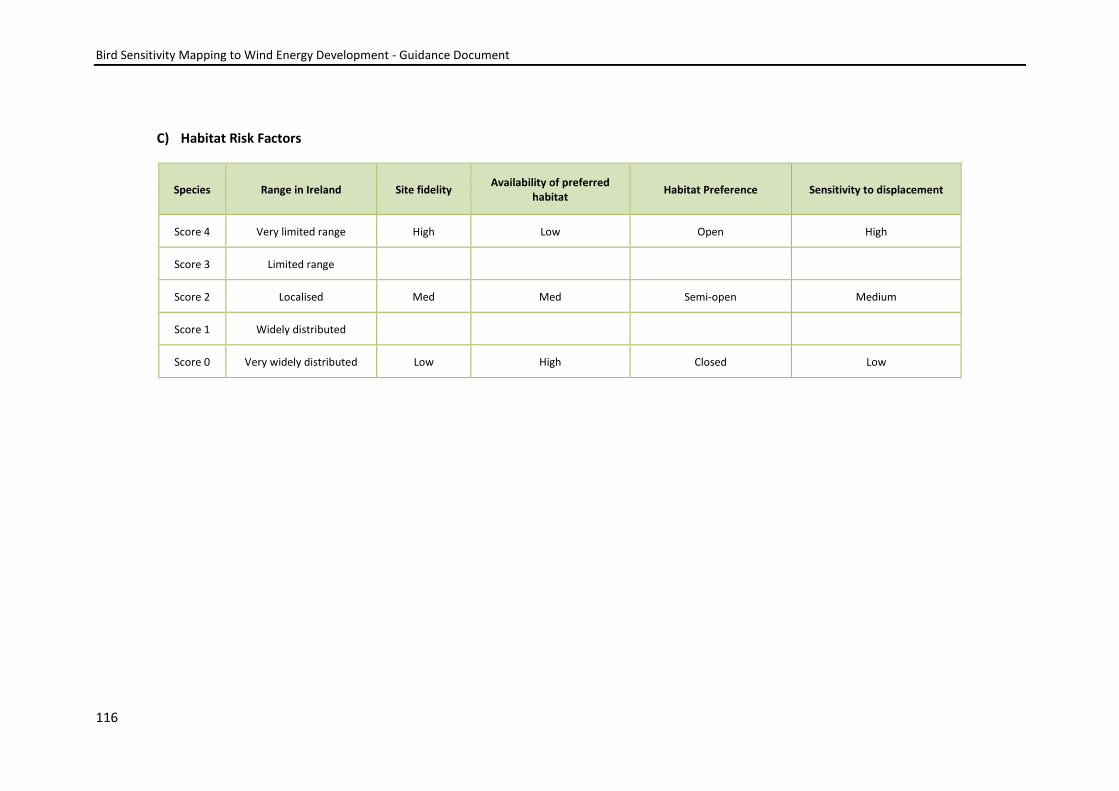
Bird Sensitivity Mapping to Wind Energy Development - Guidance Document
116
C) Habitat Risk Factors
Species Range in Ireland Site fidelity Availability of preferred
habitat Habitat Preference Sensitivity to displacement
Score 4 Very limited range High Low Open High
Score 3 Limited range
Score 2 Localised Med Med Semi-open Medium
Score 1 Widely distributed
Score 0 Very widely distributed Low High Closed Low
Bird Sensitivity Mapping to Wind Energy Development - Guidance Document
117
Glossary
Adult annual survival: The proportion of a species’ adult population, expressed as a percentage or
proportion of total adult population, which survives from one year to the next. In many species,
especially those which are longer-lived, this metric is a good indicator of changes in population
growth rate. Higher annual survival rate is believed to expose the same individuals to several years
of potential conflict at a particular site, increasing the likelihood of population impacts.
Aerial display: Many birds use complex flight as a means of courtship, territorial reinforcement or
sociality. By increasing time spent airborne and reducing awareness of obstacles, increased aerial
display is thought to result in a higher risk of collision with wind energy infrastructure. However, as
these behaviours are likely to be seasonal in nature, or only performed at certain times of the year,
the maximum possible score for this factor has been lowered.
Annex 1 of the Birds Directive: Inclusion of this species on the latest version of Directive
2009/147/EC of the European Parliament and of the Council of 30th November 2009 on the
Conservation of Wild Birds (a.k.a. the Bird’s Directive), under the category of Annex I. Those species
listed “should be the subject of special conservation measures concerning their habitat in order to
ensure their survival and reproduction in their area of distribution”.
Availability of preferred habitat: A measure of the amount of habitat possessing suitable ecological
requirements (food, security, shelter, mates) to support a species within a defined region. Wider
availability of preferred habitat within a species range theoretically allows this area to support more
individuals of the species. Thus, greater habitat availability for a particular bird would lower its
potential sensitivity to habitat removal, potentially stemming from wind energy developments.
Birds of Conservation Concern in Ireland: Factor determined by the most recent listing of this
species on the Birds of Conservation Concern in Ireland2, or BOCCI list. All commonly-occurring
species are given a status of Red (high conservation concern), Amber (medium conservation
concern) or Green (all other species), depending on a combination of threat categories.
EU SPEC: The listing of a species on the most recent BirdLife International Species of European
Conservation Concern3, ranging from SPEC 1 (global conservation concern) to Non-SPEC (not
considered to be of European conservation concern and assessed as 'secure').
2 Colhoun K. & Cummins, S. 2013 Birds of Conservation Concern in Ireland 2014-19. Irish Birds 9:523-544 3 BirdLife International (2004) Birds in Europe: population estimates, trends and conservation status. Cambridge, UK: BirdLife International. (BirdLife Conservation Series No. 12).
Bird Sensitivity Mapping to Wind Energy Development - Guidance Document
118
Flight manoeuvrability: The speed and ability of an individual bird to change direction and speed
whilst in flight. This factor is important in predicting a species’ ability to avoid obstacles in flight with
higher manoeuvrability resulting in less potential for collision.
Flocking: The tendency of groups of birds of the same species to move as a collective from one
location to another. Travelling in larger aggregations raises the potential for collision with wind
energy infrastructure by reducing the ability of an individual bird to avoid obstacles, especially if
focused on neighbouring individuals in the flock for navigation. As this factor is heavily dependent
upon the altitude at which a particular species flocks, it has been down-weighted in sensitivity
scoring.
Habitat Preference: Wind energy developments are generally located in areas free of obstacles
which may create turbulence for wind turbines or reduce overall airspeed. This factor was included
to assign greater sensitivity to those bird species that frequent these open areas, such as uplands.
The influence of wind energy developments on woodland bird species is likely to be minimal,
assuming wooded areas remain intact.
Nocturnal activity: Movement during the hours of darkness increases the chances of collision with
wind energy infrastructure through reduced visibility. This scale ranges from fully nocturnal birds
(such as owls), through those species mainly utilising the hours of dawn or dusk (crepuscular) to fully
diurnal birds active exclusively during daylight.
Predatory / aerial forager: Several species of bird occurring in Ireland (notably Hen Harrier and Barn
Owl in the present model) while airborne (i.e. in flight) predate smaller birds, small mammals or
amphibians. This behaviour, causing the bird to exhibit high-speed complex aerial movements, which
can be within the swept area of wind turbines, may expose the individual to a heightened risk of
collision. Conversely, focussed attention on ground-dwelling prey may further reduce awareness of
wind energy infrastructure. Many wind turbines are positioned in open, turbulence-free locations
ordinarily utilised as aerial hunting grounds.
Proportion of flyway or BiE2: The proportion of a species’ regional population regularly supported
by mainland Republic of Ireland. Depending on the species and subgrouping used in this study, this
may include overwintering and/or breeding and/or transit populations. Figures for this metric have
been obtained through dedicated national or international studies, or through data provided by the
latest Birds in Europe population assessments3.

Bird Sensitivity Mapping to Wind Energy Development - Guidance Document
119
Range in Ireland: The geographical extent of a species’ distribution within mainland Republic of
Ireland. A population of a species occupying a wider area is less likely to be under threat and is thus
less sensitive to impacts imposed by the development of wind energy infrastructure. Species with a
very limited range in Ireland were given the highest rating in this score category.
Ranging behaviour: The daily tendency of a species to move from one location to another within its
range or territory. This movement can be driven by foraging, breeding or territorial reinforcement
needs. More wide ranging species are thought to be more exposed to potential collision through
such heightened aerial activity.
Sensitivity to displacement: Human disturbance is widely considered to be a serious conservation
problem, especially to species of conservation concern2. It has been suggested, in fact, that
disturbance displacement affects birds to a greater extent than collisions. Many species sensitive to
disturbance will leave the area in an effort to find other suitable areas.
Site fidelity: The propensity of a species to only use a particular site. Those species with a high level
of site fidelity (for example those species returning to a particular site each year) will not readily
move from a site when disturbed. Thus a more negative effect is expected on those species with
high site faithfulness as a consequence of any habitat change or loss.
Soaring: The flight behaviour of some species of bird which utilises upward currents of air (usually on
updrafts of rising warmer air) to reduce energy expenditure in flight. Geographical features causing
this upwelling, such as coastal or mountainous regions are often used as wind energy sites. The dual
use of these regions by soaring birds and wind energy installations presents conflict. The tendency of
a species to adopt this behaviour is likely to increase its risk of collision with wind energy
infrastructure.
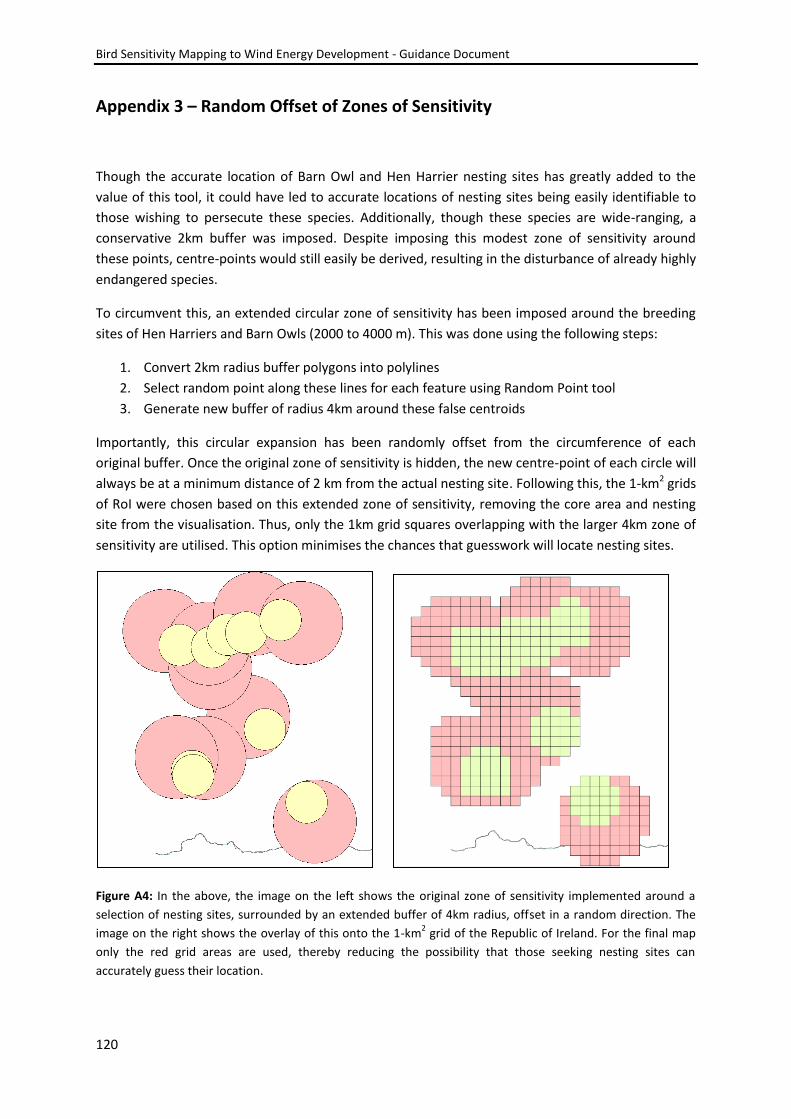
Bird Sensitivity Mapping to Wind Energy Development - Guidance Document
120
Appendix 3 – Random Offset of Zones of Sensitivity
Though the accurate location of Barn Owl and Hen Harrier nesting sites has greatly added to the
value of this tool, it could have led to accurate locations of nesting sites being easily identifiable to
those wishing to persecute these species. Additionally, though these species are wide-ranging, a
conservative 2km buffer was imposed. Despite imposing this modest zone of sensitivity around
these points, centre-points would still easily be derived, resulting in the disturbance of already highly
endangered species.
To circumvent this, an extended circular zone of sensitivity has been imposed around the breeding
sites of Hen Harriers and Barn Owls (2000 to 4000 m). This was done using the following steps:
1. Convert 2km radius buffer polygons into polylines
2. Select random point along these lines for each feature using Random Point tool
3. Generate new buffer of radius 4km around these false centroids
Importantly, this circular expansion has been randomly offset from the circumference of each
original buffer. Once the original zone of sensitivity is hidden, the new centre-point of each circle will
always be at a minimum distance of 2 km from the actual nesting site. Following this, the 1-km2 grids
of RoI were chosen based on this extended zone of sensitivity, removing the core area and nesting
site from the visualisation. Thus, only the 1km grid squares overlapping with the larger 4km zone of
sensitivity are utilised. This option minimises the chances that guesswork will locate nesting sites.
Figure A4: In the above, the image on the left shows the original zone of sensitivity implemented around a
selection of nesting sites, surrounded by an extended buffer of 4km radius, offset in a random direction. The
image on the right shows the overlay of this onto the 1-km2 grid of the Republic of Ireland. For the final map
only the red grid areas are used, thereby reducing the possibility that those seeking nesting sites can
accurately guess their location.